Submitted:
16 October 2025
Posted:
16 October 2025
You are already at the latest version
Abstract
The European electronics industry is a strategic sector for the technological and sus-tainable transition of the European Union; however, it is also among the sectors most exposed to environmental, social, and governance challenges. This study examines the relationship between ESG (Environmental, Social, Governance) performance and the economic and financial performance of companies in the electronic components sector (NACE 26) from 2014 to 2023. The aim is to assess whether and to what extent the adoption of sustainable practices can affect the profitability, operational efficiency and capital structure of companies. Using a multilevel quantitative approach, based on de-scriptive analysis, multiple regression and path analysis, the research highlights that the link between sustainability and financial performance is not direct or linear, but medi-ated by variables such as governance and leverage. The results show that, although ESG practices may lead to upfront costs and a slight reduction in profitability in the short term, they strengthen the solidity and competitive resilience of companies in the me-dium to long term. In particular, governance emerges as a strategic lever for operational efficiency and alignment between sustainability, digital innovation, and value creation. The study contributes to the debate on the role of innovative technologies and digital transformation in promoting a more sustainable, integrated, and long-term-oriented European industry, providing empirical evidence and useful implications for managers and policymakers.
Keywords:
ESG performance
; sustainable finance
; smart technologies
; digital transformation
; electronic industry
; Europe
; corporate governance
; financial performance
; path analysis
; sustainable competitiveness
1. Introduction
Over the past two decades, the growing focus on environmental, social, and governance (ESG) sustainability has redefined the paradigms of competitiveness and value creation in the global industry (Eccles, Ioannou, & Serafeim, 2014; Friede, Busch, & Bassen, 2015). Companies today are called upon not only to pursue economic objectives, but also to ensure a positive impact on communities, the environment and management transparency. This evolution reflects a structural shift in the company’s vision, in which performance is no longer evaluated exclusively in terms of profit, but rather in terms of integrated sustainability (Kotsantonis, Pinney, & Serafeim, 2016; Toma & Toma, 2024; Lian et al., 2024). The ESG paradigm, in fact, represents the convergence of three complementary dimensions: environmental protection, social responsibility and the quality of governance, which together determine an organisation’s ability to create value in the long term by minimising non-financial risks (Fatemi, Glaum, & Kaiser, 2018; Broadstock et al., 2021).
From this perspective, the transition to sustainable production models is strongly influenced by smart technologies, which offer advanced tools to improve process efficiency, reduce environmental impact, and monitor the value chain in real-time. The application of artificial intelligence (AI), the Internet of Things (IoT), big data analytics and machine learning techniques makes it possible to integrate ESG dimensions into operational and governance strategies, fostering the emergence of an eco-intelligent industry (Shao et al., 2025; Han, Park, & Kim, 2025). However, despite the increasing diffusion of these technologies, significant implementation challenges remain, related to initial costs, data availability and the difficulty of measuring the economic and social benefits deriving from sustainable policies (Kim & Kang, 2025; Lopes, Ladeira, & Branco, 2023). In particular, in the European electronics and digital components sector, which serves as the backbone of the technological and environmental transition, the balance between innovation, profitability, and social responsibility has become a crucial issue (European Commission, 2022).
The relationship between sustainability and economic and financial performance (EFP) has been widely discussed in the literature. While numerous studies report a positive relationship between ESG and profitability, attributing to sustainable policies a role of competitive advantage (Hart, 1995; Fatemi et al., 2018), others note no or even adverse effects, suggesting that the impact of ESG may be non-linear and context-dependent (Capelle-Blancard & Petit, 2019; Arsin, 2023; Bai & Kim, 2024). This misalignment is particularly evident in technology-intensive sectors, where integrating ESG practices requires significant investments in innovation and organisational reconfiguration. The European electronics industry represents a paradigmatic case: on the one hand, it is called upon to support the digitisation of the economy, on the other it has to face environmental challenges related to energy consumption, waste from electrical and electronic equipment (WEEE) and the complexity of global supply chains (Lopes et al., 2023; Marczewska et al., 2025).
Consistent with these considerations, this study aims to analyse the relationship between ESG ratings and the economic-financial performance of companies in the European electronics sector from 2014 to 2023, using a multilevel quantitative approach that integrates descriptive analysis, multiple regression, and path analysis. The objective is twofold: on the one hand, to understand whether the adoption of ESG practices contributes measurably to the financial performance of companies; on the other hand, to identify the mechanisms through which the individual dimensions of ESG (environmental, social and governance) influence the profitability and financial structure of the company. This approach enables the overcoming of the traditional linear view and the exploration of the causal interrelationships between sustainability and economic value, providing a key to understanding the complexity of contemporary European industrial systems (Hair, Black, Babin, & Anderson, 2019).
The study also contributes to the academic and managerial debate on digital sustainability, understood as the ability to integrate innovative technologies within ESG processes to generate shared value. The analysis of the electronics sector, which is strategic for the technological sovereignty of the European Union and at the centre of policy initiatives such as the European Chips Act (European Commission, 2022), enables us to provide new empirical evidence on a key sector. However, it is still little explored in quantitative literature that uses information taken from financial statements. The ultimate goal is to establish a robust knowledge base that informs business and policy decisions, integrating sustainability, innovation, and competitiveness, and contributing to the development of a more eco-efficient, resilient, and long-term-oriented European industrial model.
2. Theoretical Background
The scientific debate on the relationship between sustainability and economic-financial performance has evolved in the last thirty years, moving from an ethical-reputational perspective to a strategic-value-based vision of the company (Freeman, 1984; Hart, 1995; Eccles et al., 2014). The main reference theories — stakeholder theory, legitimacy theory, resource-based view, and institutional theory — converge in recognising that long-term value creation depends on companies’ ability to integrate environmental, social, and governance considerations into their business models (Del Gesso, 2024; Fatemi, Glaum, & Kaiser, 2018). In theory, ESG can be interpreted as a multidimensional system of intangible resources, including environmental skills, human and relational capital, quality of governance, and information transparency, which, when interacting, contribute to the company’s competitive resilience (Ioannou & Serafeim, 2015; Broadstock et al., 2021).
The environmental dimension (E) is linked to the principles of the “natural resource-based view”, according to which the proactive management of natural resources represents a source of sustainable competitive advantage (Hart, 1995). Investing in clean technologies, energy efficiency, and green innovation not only reduces costs and regulatory risks but also improves Total Factor Productivity (TFP) (Hsu & Wang, 2021).
The social dimension (S) is based on the recognition of human and reputational capital as performance levers: a high quality of internal and external relations contributes to increased productivity, reduced turnover, and mitigated reputational risks (Cochran & Wood, 1984; Toma & Toma, 2024).
The governance dimension (G) acts as the cornerstone of the ESG system: robust, transparent and diversified governance practices reduce information asymmetry and the cost of capital, fostering a climate of trust among investors and stakeholders (Sharfman & Fernando, 2008; Khalid et al., 2022; Yuan & Song, 2021).
However, the empirical literature has produced unambiguous results. Meta-analyses by Friede et al. (2015) and Bai & Kim (2024) indicate that approximately 90% of studies identify a non-negative relationship between ESG and financial performance; however, the intensity and direction of the link vary significantly depending on the geographical context, industry sector, and indicators used. More recent studies have suggested that the impact of ESG on financial performance is conditioned by moderating factors, such as the quality of disclosure, market maturity and capital structure (Fatemi et al., 2018; Velte, 2017; Wang, Shen, & Zhu, 2025). In particular, in capital-intensive technology sectors, ESG integration can result in short-term trade-offs due to implementation costs, while generating long-term structural benefits (Capelle-Blancard & Petit, 2019; Naseer, Guo, & Zhu, 2025).
In the context of the European electronics industry, the complexity of such relationships is further accentuated by the dual nature of the sector: it is simultaneously an enabler of sustainability (through smart technologies) and a source of environmental criticalities, due to energy consumption and the production of electronic waste (Lopes, Ladeira, & Branco, 2023). Recent literature underlines that the transition to a more sustainable industrial model passes through digital transformation as a lever for sustainability (digital sustainability), capable of integrating environmental monitoring tools, supply chain traceability and circular economy models (Han, Park, & Kim, 2025; Marczewska et al., 2025).
Additionally, the effectiveness of ESG policies is increasingly tied to the adoption of advanced technologies. Recent studies (Ferraro et al., 2025) have demonstrated how Artificial Intelligence (AI) and dedicated sustainability management enhance the likelihood of adopting ESG criteria, highlighting that digital innovation is a crucial facilitator of sustainable performance and, consequently, competitiveness.
In this context, the adoption of intelligent technologies – including IoT, AI, blockchain, and big data analytics – enables the tangible realisation of ESG benefits, thereby enhancing the transparency and efficiency of production processes (Shao, Zang, & Zhou, 2025).
However, a persistent gap in the literature concerns the lack of systematic studies on the European electronics industry that can combine quantitative measurements of ESG performance with financial indicators of efficiency, profitability, and capital structure. In fact, most advanced empirical analyses (SEM, path analysis, dynamic models) focus on Asian or North American contexts, thereby neglecting the regulatory and market-specificities of Europe (Kim & Kang, 2025). This study addresses this gap by proposing an empirical analysis of a sample of European electronics companies for the period 2014–2023. The aim is to provide an integrated and causal view of the link between sustainability and performance, considering both direct and indirect effects, and offering valuable insights for the formulation of business strategies and public policies aimed at the sustainable and digital transformation of industry.
3. Literature Review and Hypothesis Formulation
3.1. Strengthening the ESG-EFP Nexus: A Multidimensional Perspective
The relationship between Environmental, Social, and Governance (ESG) criteria and Financial Performance (EFP) is no longer a subject of mere speculation, but rather a robust empirical consensus. The seminal meta-analysis by Friede, Busch, and Bassen (2015), aggregating over 2,200 studies, showed that approximately 90% of the contributions found a non-negative relationship between ESG and EFP, with the majority reporting a positive impact. This evidence was later strengthened, establishing that corporate sustainability translates into long-term outperformance [Eccles, Ioannou, & Serafeim, 2014].
Modern literature focuses on the mechanisms through which individual ESG dimensions create financial value:
- Environmental Dimension (E): Environmental commitment is reflected in an improvement in operational efficiency. Recent studies (e.g., Kim & Kang, 2025; Wang, Shen, & Zhu, 2025) have shown that improved meta-efficiency (i.e., efficiency relative to industry best practice) and the adoption of proactive green standards not only reduce compliance and waste management costs but also improve Total Factor Productivity (TFP), a key indicator of business operational performance. Investment in Green Innovation has been identified as the critical mediator that translates E performance into tangible competitive advantage [Hsu & Wang, 2021].
- Social Dimension (S): Social performance is linked to the management of human and reputational capital. A high S rating is associated with higher employee productivity and reduced turnover, serving as an indicator of operational stability [Cochran & Wood, 1984; Toma, Lidia, & Toma, Sorin-George, 2024]. On the financial front, proactive social policies mitigate reputational risk, protecting market value from adverse shocks.
- Governance Dimension (G): Governance is often considered the enabling basis of E and S performance. A transparent and diversified governance structure reduces information asymmetry, improving credibility in the eyes of investors and reducing the cost of capital [Sharfman & Fernando, 2008; Khalid et al., 2022]. The literature shows that G performance is positively associated with the quality of financial disclosure and the ability to attract long-term investments [Ioannou & Serafeim, 2015].
3.2. Sustainability and Innovation in the Electronics Industry: The Imperative of Innovative Technologies
The electronics and computer components sector (ATE: Telecommunications and Electronic Equipment), while being a driver of innovation, operates in a context of double externalities: it creates digital solutions (Smart Technologies) for the sustainability of other sectors, but at the same time it is one of the most impactful sectors in terms of energy consumption, WEEE and complex supply chains [Lopes et al., 2023].
For the electronics industry, this translates into the use of Digital Transformation (TD) as a direct tool for sustainability, a concept that the literature defines as Digital Sustainability [Han et al., 2025; Shao et al., 2025].
- -
- Strategic Investing: Han et al. (2025), in a study of the electronics industry, used causal modelling (SEM) to demonstrate that TD’s project budget allocation strategies have a significant association with positive outcomes in ESG performance. Digitalisation, in this context, is seen as a structural investment that facilitates environmental monitoring and social traceability of the supply chain.
- -
- Operational Efficiency and TFP: TD is a precondition for efficiency. Wang, Shen, and Zhu (2025) explored how the digital economy affects TFP, a factor that overlaps with ESG performance in terms of resource efficiency and redistribution.
- -
- Circular Economy (CE): In the electronics industry, sustainability is closely tied to the concept of Circular Economy. The literature underlines that the adoption of CE models, in particular through product eco-design (which facilitates recycling and reuse), is essential for competitiveness and financial performance in Europe, responding to regulatory and market pressures [Lopes et al., 2023].
3.3. The European Contest
Most studies employing advanced quantitative approaches (SEM, Path Analysis) have historically focused on Asian markets, such as China and South Korea (Han et al., 2025; Kim & Kang, 2025), or North America. Rarer are the searches in the European context (Velte, 2017, limited to Germany) that take into account the specific regulatory pressure (e.g., WEEE Directive, SFDR, European Chips Act) and the market dynamics of the European electronics sector. This sectoral and geographical deficiency justifies the need for a new quantitative approach to comparing the samples of European companies.
3.4. The Methodological Gap: from Correlation to Causality with Path Analysis
Despite the wealth of studies, the literature presents a persistent problem of endogeneity and bidirectionality between ESG and EFP. In other words, is the best ESG rating the cause of financial success, or is it the consequence of it (i.e., only financially sound companies can afford expensive ESG investments)? [Waddock & Graves, 1997].
Most multiple linear regression models are unable to resolve this ambiguity, as they assume that the independent variable (ESG) influences the dependent variable (EFP) in only one direction and do not take into account the complex internal interrelationships between the dimensions E, S, and G [Hair et al., 2019].
To overcome this limitation, it is imperative to adopt a causal modelling approach.
1. Path Analysis (PA) and Structural Equation Models (SEM): PA is a specialised form of SEM that allows you to simultaneously test a series of hypothesised causal relationships (Path) between a set of manifest variables. This approach is superior because it allows you to:
• Modelling Direct and Indirect Effects: Allows testing whether, for example, Governance (G) exerts an indirect effect on Financial Performance mediated by Environmental Performance (E) (e.g., Kim & Kang, 2025 used similar approaches to explore efficiency as a mediator).
• Verify Directionality: Through the use of panel data and the use of delayed variables or dynamic structural models, it is possible to infer causal directionality, providing a robust and more explanatory test of the strategic link between sustainability and value creation [Shao et al., 2025].
The application of Path Analysis to map the causal effects of E, S, and G disaggregation on Financial Performance (ROE, ROA, ROCE, and Leverage Ratio) in the European electronics sector represents the objective and unique contribution of this study to the literature.
3.5. Formulation of Research Hypotheses
Based on the consolidated theoretical premises and the need for a causal test on the European electronics sector, the following hypotheses are formalised:
H1: There is a positive relationship between the overall ESG score and the financial performance of companies in the European electronics sector, measured through Return on Equity (ROE).
A high ESG (Environmental, Social, and Governance) score is expected to be associated with positive long-term financial performance, as sustainable practices can enhance corporate reputation and investor confidence by reducing the cost of capital and improving profitability.
H2: The environmental ESG score (E) has a positive impact on companies’ operational performance, as measured by Return on Assets (ROA).
Environmental practices, such as the adoption of green technologies and low-impact processes, can reduce operating costs, improve efficiency, and thus generate greater profitability over assets.
H3: The social ESG score (S) is positively correlated with the stability and management of companies’ human capital, with a direct impact on financial performance, measured through the Return on Capital Employed (ROCE).
Social policies that improve human resource management (such as training, employee satisfaction, and reduced turnover) can contribute to more efficient management and, consequently, improve the return on invested capital.
H4: Governance performance (G) has a positive influence on financial performance, reducing the cost of capital and enhancing the quality of financial disclosure, with an indirect effect on operating performance (ROA).
Good corporate governance reduces information asymmetry, thereby increasing investor confidence and indirectly contributing to improved operational performance, which in turn enhances overall efficiency (Pérez et al. 2022).
H5: Companies with higher ESG scores tend to have lower leverage, as sustainability reduces risk and increases financial stability.
Quality ESG practices, particularly sound governance, can reduce the risk perceived by investors, thereby decreasing the need for debt financing.
4. Materials and Methods
Annual financial statements are a valuable tool for analysing the economic performance of any company. By calculating specific indices and flows of business circumstances, they can increase their information strength. This study presents information obtained from the Orbis Europe comprehensive platform, managed by Moody’s. The survey relating to the period 2014-2023 considers the trend of the following economic performance indices:
- ROE (Return on Equity);
- ROA (Return on Assets);
- ROCE (Return on Capital Employed);
- Leverage ratio.
For a more in-depth analysis, the data were also subjected to descriptive statistical processing, including mean, median, standard deviation, sample variance, skewness, minimum, maximum, and count of the actual data available.
An ESG rating is assigned to each company under analysis, based on ratings provided by Yahoo Finance websites. Subsequently, an inferential analysis is conducted using multilevel econometric models. Finally, an econometric analysis is conducted through three complementary methodological levels to identify the relationships between ESG ratings and economic and financial indicators. To investigate the relationships between the variables under study, a structured methodological approach was used and articulated on three analytical levels:
- Multiple correlation analysis which aims to identify the interrelationships between variables and measure the intensity and direction of their linear associations. This exploratory phase enabled the development of an initial information framework, which helps formulate causal hypotheses.
- Multiple regression was applied to estimate the direct effects of a set of independent variables (ROE, ROA, ROCE, Leverage) on a dependent variable (ESG Rating). The technique enables the assignment of specific coefficients to each explanatory factor, providing a quantitative measure of its impact.
- Path analysis is understood as a logical and mathematical extension of multiple regression. It allows for the simultaneous modelling of direct and indirect relationships between variables, according to a predefined causal structure. This methodology enables us to examine not only the net effects but also the mediation mechanisms through which one variable influences another via intermediate variables, thereby providing a systemic representation of the economic and business dynamics (Anderson, 1988).
The choice of these three techniques is a response to precise methodological requirements. They are part of a coherent and progressive analytical context, which enables us to transition from an exploratory phase to an explanatory one, ultimately shaping the structure. These are also tools widely validated in the economic and managerial literature, capable of effectively adapting to observational datasets, such as the one used in the present study (Hair, 2019). Finally, these techniques ensure an optimal balance between statistical rigour, robustness of results, and interpretative readability, making them particularly suitable for performance analysis in complex geographical and industrial contexts.
The study’s contribution lies in offering a robust analytical framework that highlights how sustainability, far from being a merely reputational variable, can concretely affect the economic and financial foundations of the modern enterprise.
5. The Context of the Investigation
5.1. ESG Report and Financial Performance of the Electronic Components Industry
Environmental, social, and governmental (ESG) sustainability addresses challenges in the electronic components industry, which has complex supply chains. Investors and consumers are increasingly interested in responsible business practices, prompting companies to integrate ESG criteria into their strategies. However, the debate on the relationship between ESG performance and financial results continues, with studies highlighting positive or negative aspects.
The NACE Rev. 2 codes identify the macro-sector with the letter C and the category with the number 26. This study refers to an initial sample of 40 companies operating in Europe between 2014 and 2023, with at least one valid data point for analysis purposes over the decade. Later, we will specify the number of available annual observations for each ratio to illustrate the processed data. The sample was obtained from a screening of 118 European companies, excluding those that lacked the necessary information for the report’s purposes.
Table 1 describes the company sample by European nations with ESG data.
Most companies are concentrated in three countries: Norway, the United Kingdom, and Sweden, with each country having six companies. In the second tier, Finland, France, and Germany have four companies each, while Denmark and Portugal have three. Italy and Switzerland have two companies, while Austria and Belgium have only 1. The Nordic nations have a strong representation compared to the large European economies. Table 2 shows the ESG rating score by country.
The table analyses the overall rating of various countries, based on three main components: E, S and G. The data show a very polarised distribution, with the highest scores in a few countries. Nordic nations dominate, with Norway in first place with 168.7, followed by Finland (131.6) and Sweden (128.5). The lowest scores belong to Austria (16.7), Portugal (15.9) and Belgium (14.3), for which data for components E, S and G are missing. Finland and Norway stand out in component E, with scores of 39.7 and 36. In component S, Switzerland scores the highest (18.8), followed by Sweden (11.9) and the United Kingdom (11.6). For component G, Finland (23.1) and Norway (21.7) are in the lead.
5.2. Legal Forms and Dimensions
Table 3 describes the prevailing legal forms.
The table illustrates the significant weight of joint-stock companies, which represent over four-fifths of the total. Table 4 analyses the number of employees in the period under analysis.
The data indicate an evident polarisation: growth is mainly concentrated in the Nordic countries (Norway, Denmark) and Switzerland, while the most significant reductions occurred in countries such as Belgium, Finland and Italy.
Table 5 shows investments in nations.
The data depict a growth-dominated landscape, with the Nordics and Switzerland leading the expansion. Belgium is the most obvious exception, with a prolonged contraction throughout the period under review.
Table 6, on the other hand, analyses the turnover in the countries.
The analysis reveals a growth in turnover in most European countries from 2014 to 2023, although it was interrupted by a downturn in 2020. There is a mixed post-pandemic recovery, with Sweden and the United Kingdom among the most dynamic, but a slowdown is expected in 2023.
6. Analysis of the Primary Financial Statement Ratios
6.1. ROE
Return on equity (ROE) is a financial metric that measures the profitability of an equity investment. It is calculated using the following formula: net profit ÷ equity × 100.
The ratio summarises the overall cost-effectiveness of the company and therefore evaluates the work of the top management bodies. Table 7 presents the descriptive statistics.
The trend indicates a recovery and stabilisation of ROE over the course of a decade. There were two underperforming years: 2014 and 2019, the latter with an average ROE of -10.18%. In 2019, the standard deviation and range of data were very high, indicating that losses are concentrated in a few companies with significant losses.
Despite this, the median ROE remained positive, ranging from 11% to 17%, indicating that most companies generated a satisfactory return for their shareholders. Between 2021 and 2023, the ROE stabilised between 9% and 11%, with a reduction in standard deviation, indicating greater stability in the sector’s financial performance.
6.2. ROA
Return on Assets (ROA) measures a company’s ability to generate an income stream from effectively managing its assets, thereby making them profitable. It is calculated using the formula: net profit / total assets* 100.
Table 8 presents the descriptive statistical analysis of the ratio.
The table illustrates that the return on assets has remained constant over the decade, despite fluctuating cyclically. The average has always been positive, with a low of 3.34% in 2020 and a high of 7.41% in 2021. The median was generally higher than average, indicating that many companies performed well.
However, there have been sharp spikes in volatility, especially in 2018 and 2016. In 2018, the minimum value dropped to -97.40% due to a few companies with significant losses. Despite this, the decade ended with a positive consolidation, with a robust average ROA. Over the past three years, the standard deviation has reached historic lows, indicating that the sector’s efficiency has improved and yields have become more stable.
6.3. ROCE
Return on Capital Employed (ROCE) is a long-term profitability ratio that measures how effectively a company uses its funds. It is calculated using the formula: EBIT / Invested capital × 100.
Table 9 presents the main descriptive statistics.
The table shows a consistently profitable sector over the decade, with a positive average ROCE ranging from a low of 4.09% in 2014 to over 11% in 2015, 2021 and 2022. The median, which remains above average, reached nearly 13% in 2014, indicating strength for many companies.
However, the sector has shown instability, with spikes in uncertainty and significant capital losses in 2018. In recent years, ROCE has stabilised, exceeding 11%, with a temporary reduction in standard deviation, suggesting an improvement. The average is expected to remain above 7% in 2023.
6.4. Leverage
Leverage ratio, or gearing, is an indicator that measures the amount of debt that a company or entity uses to fund its activities relative to its equity. It is calculated by dividing the total liabilities (debts) by the company’s equity.
Table 10 provides the main descriptive statistics.
The table shows that although there have been high average levels and high volatility over the decade, leverage is declining. The average rose from 44.02 in 2015 to 85.70 in 2020, with companies using more debt than equity. The standard deviation has reached high values, exceeding 146 in 2014 and 155 in 2020. The median is much lower, between 35 and 47, indicating an uneven structure influenced by a few companies with high leverage. From 2014 to 2018, the minimum leverage value was zero, while the maximum values touched 752.51 in 2014 and 898.79 in 2020. Between 2021 and 2023, signs of normalisation can be observed, characterised by a decrease in standard deviation and a more uniform application of leverage across the industry.
7. Econometric Analysis
To verify the relationship between ESG performance and a company’s economic and financial results, it is necessary to utilise a set of econometric analysis tools capable of measuring the intensity and nature of the relationships between variables. Among the most widely used techniques are linear correlation, multiple regression and path analysis, each of which allows us to grasp different levels of complexity in the relationship between sustainability and corporate performance (Wooldridge, 2010).
It is crucial to emphasise that this technique is not recent in the literature. Several studies have employed similar methods, and a meta-analysis of more than 2,000 studies by Friede, Busch, and Bassen (2015) highlighted the repeated use of correlations and regressions when assessing the effects of ESG on financial performance. Similarly, Fatemi, Glaum, and Kaiser (2018) used regression analysis to show how ESG disclosure moderates enterprise value. However, more recent studies have distinguished how ESG practices influence economic and financial outcomes both directly and indirectly, using structural equation models and path analysis. (Broadstock, 2021).
The analysis begins with correlation, which is used to examine the relationship between ESG scores and various economic indicators (ROE, ROA, ROCE, and Leverage). This measure provides an initial assessment of the relationships between variables. Subsequently, more complex models can be used, such as multiple regression, which helps isolate the effect of each ESG factor, and path analysis, which estimates direct and indirect relationships in systems of structural equations (Byrne, 2016). In this perspective, correlation does not exhaust the explanation of the ESG-performance relationship; rather, it represents an indispensable preliminary step, already well-established in the literature, to identify significant patterns that can be subjected to subsequent empirical verification through multivariate approaches and causal models.
Linear correlation is one of the most widely used statistical tools to analyse the association between two quantitative variables. It measures the intensity and direction of the linear relationship using the Pearson index (r), which assumes values between -1 and +1. Values close to +1 indicate a strong positive correlation, values close to -1 a strong negative correlation, while values close to 0 suggest the absence of a significant linear relationship (Pearson, 1896). In economic and financial sciences, as well as sustainability research, linear correlation is frequently used to analyse the links between ESG variables and corporate or financial performance indicators, constituting a preliminary phase in identifying possible relationship patterns that require subsequent investigation through regression models or multivariate approaches.
Table 11 shows the correlation between the variables under study.
The initial analysis of the correlation matrix reveals fascinating insights into the relationship between economic and financial indicators and ESG performance. Profitability indicators such as ROE, ROA, and ROCE exhibit a negative, albeit weak, correlation with ESG ratings, suggesting that companies with higher ESG ratings tend to have slightly lower financial performance in the short term, consistent with previous studies. On the contrary, financial profitability ratios exhibit a strong positive correlation with one another, confirming the validity of the data. There is also a negative correlation between profitability and financial leverage, indicating that shareholder profitability decreases as debt levels increase. The relationship between ESG ratings and financial levers is weak. The matrix confirms consistency in performance ratios and the importance of the financial structure for profitability. The use of multiple regression techniques to analyse the specific impact of ESG ratings is therefore justified.
Table 12 shows the results from the multiple regression analysis.
The regression analysis shows that the ESG rating is not significantly influenced by profitability indicators or the level of debt. This implies that economic performance does not directly determine the ESG assessment. For managers, this means that a good ESG score does not depend solely on traditional financial indicators; environmental, social, and governance policies are also more relevant. For investors, the ESG rating provides valuable insights beyond economic performance. An ESG portfolio not only reflects profitable companies but also manages long-term risks. Finally, ESG integration should not be seen as an immediate constraint on performance, but rather as a medium- to long-term investment to improve competitive resilience and attract responsible capital.
To understand these more complex dynamics, path analysis is employed. Path analysis is a technique that examines the relationships between variables, both direct and indirect. It helps to understand how ESG ratings affect business performance, considering mediators such as operational risk management, investment in innovation and leverage, offering a more detailed view of the strategic role of ESG, highlighting paths that cannot be seen by multiple regression, which focuses only on isolated effects without considering the connections between variables.
Figure 1 shows the application of path analysis.
The analysis highlights how different financial variables interact with each other, using a diagram that shows positive (green arrow) and negative (red arrow) links. The correlations between financial indicators are at the top of the chart, while the ESG rating is at the bottom. It can be observed that companies with strong operating performance also tend to achieve good results in terms of capital and profits. However, debt harms profitability and shareholder returns. It is observed that operating profitability has a positive effect on ESG scoring, while returns on investment and capital have adverse effects. This suggests that maximising returns may conflict with sustainability strategies. The assessment concludes that there are complex dynamics between sustainability, financial structure and profitability, and that the ESG rating is not affected in the same way by every type of profitability.
Leverage plays a crucial role, as rising debt tends to impact the ESG rating negatively. This occurs because higher debt leads to more payment obligations and less flexibility in investment decisions. Managers must balance profitability and sustainability when planning ESG investments, without compromising financial strength. Financial structure choices can significantly impact the effectiveness of ESG strategies. An integrated approach to capital management and sustainable policies can offer long-term competitive advantages. Investors can observe how financial channels influence sustainability and how economic performance affects the ESG rating, both directly and indirectly.
The path analysis confirms, from an economic-managerial perspective, that sustainability is not a cost to be avoided, but rather a strategic component that should be consciously integrated, considering its direct and indirect effects and possible trade-offs between profitability, leverage, and ESG ratings.
8. Hypothesis Testing
The study uses an econometric approach on 118 European electronics companies in the period 2014-2023. The aim is to verify the influence of ESG scores on companies’ key financial ratios, such as ROE, ROA, ROCE, and Financial Leverage, to understand the link between sustainability and performance.
H1: There is a positive relationship between the overall ESG score and the financial performance of companies in the European electronics sector, measured through Return on Equity (ROE).
To test this hypothesis, multiple regression analysis was employed, with the dependent variable being ROE and the independent variable being ESG, along with control variables such as size and sector, to investigate whether a high ESG score is associated with better financial performance, lower cost of capital, and increased expected profitability.
H2: The environmental ESG score (E) has a positive impact on companies’ operational performance, as measured by Return on Assets (ROA).
This hypothesis was tested through the use of multiple correlation and regression to verify the effect of the Environmental (E) component of ESG on ROA. By controlling for size and year, it is assumed that ecological attention improves operational efficiency and reduces costs, ultimately leading to better business performance.
H3: The social ESG score (S) is positively correlated with the stability and management of companies’ human capital, with a direct impact on financial performance, measured through the Return on Capital Employed (ROCE).
The analysis uses linear regression to study the relationship between the Social Component (S) of ESG and ROCE. It is hypothesised that better social policies and human capital management increase operational stability and reduce turnover, leading to a better ROCE (a measure of effectiveness in the use of capital).
H4: Governance performance (G) has a positive influence on financial performance, reducing the cost of capital and enhancing the quality of financial disclosure, with an indirect effect on operating performance (ROA).
To test the impact of Governance (G) on ROA, path analysis is used. Strong governance is expected to increase financial transparency and reduce perceived risks. This should impact the cost of capital, resulting in a positive indirect effect on operating performance.
H5: Companies with higher ESG scores tend to have lower leverage, as sustainability reduces risk and increases financial stability.
The hypothesis is tested using multiple regression, with leverage (LEVA) as the dependent variable and ESG as the independent variable, while controlling for size and sector. The expectation is that high ESG will reduce debt dependency, as sustainable businesses are perceived as less risky.
9. Discussion
The results of this research present a multifaceted view of the relationship between ESG practices and financial performance in the European electronic components industry. Although a large part of the previous literature suggested a tendentially positive impact of ESG on economic and financial metrics (Friede et al., 2015; Eccles et al., 2014), our study does not find a significant linear relationship in the short term. The empirical analysis found weak negative correlations between ESG ratings and profitability indicators (such as ROE, ROA, ROCE) in the sample examined. This suggests that companies with higher ESG scores tend to have slightly lower profitability in the short term.
This trend is likely due to the upfront costs and operational restructuring required to implement sustainable practices (e.g., “green” investments), which can erode margins in the short term. (Arsin, 2023; Capelle-Blancard & Petit, 2019).
The ESG rating provides additional and distinct information about the company profile, not just repeating traditional performance indicators. An ESG-based portfolio selects companies with sustainability and risk management in mind, not just profitability. This indicates that ESG criteria encompass intangibles, such as reputation and governance, which can impact the company’s long-term value (Broadstock et al., 2021).
The results indicate that ESG is primarily important in the medium to long term, with no immediate effects. Good operating performance, such as high profitability, can enhance ESG performance, as efficient companies have more resources for sustainable initiatives without compromising their financial stability. Conversely, strategies focused on short-term profits can hinder ESG investing and reduce social and environmental activities. Additionally, high debt is associated with lower ESG scores, which limits flexibility in sustainable initiatives. The evidence highlights the need to integrate sustainability and financial objectives into business management, suggesting that effective governance can create synergies between economic and ESG performance. (Fatemi et al., 2018). Managers should therefore adopt a holistic approach in which ESG investment decisions are weighed against financial structure and profitability objectives, avoiding both short-term, short-sightedness and sustainability initiatives isolated from the core business.
The long-term implications of this study are encouraging. While, in the short term, the adoption of ESG practices may appear to be a “cost” that marginally depresses performance, there is a wealth of evidence to indicate that, over the longer term, sustainable companies build lasting competitive advantages (Shao et al., 2025). For example, recent research shows that companies with consistently high ESG scores achieve superior long-term equity returns, highlighting how the market recognises and rewards continued sustainable efforts (Onomakpo, 2025). Similarly, methodologically advanced studies confirm that ESG investing tends to yield greater resilience and higher market valuations over time. Naseer et al. (2025), for example, by adopting dynamic models that correct for endogeneity, find that the initial negative impact of ESG initiatives on equity returns progressively diminishes into a significant long-term benefit, thanks to improved operational strength and mitigation of climate and reputational risks. This suggests that ESG acts as “insurance” against shocks and crises: as observed during the COVID-19 pandemic, more sustainable companies have demonstrated greater resilience than their peers (Broadstock et al., 2021).
Our study highlights that sustainability should be viewed not as a cost or constraint, but as a strategic investment that requires patience and a long-term perspective. In a European context characterised by increasing regulatory pressure and stakeholder attention, aligning the business model with ESG criteria is not only a compliance requirement but also represents an opportunity to create value over time. Recent literature highlights how stringent and practical regulatory frameworks can amplify the benefits of sustainable companies, generating positive returns on both a financial and social level. Integrating sustainability policies with growth and innovation strategies, for example, through investments in the green digital transition, the circular economy, and the proactive management of ESG risks, enables companies to combine environmental and social impact improvements with solid and lasting economic performance (Han et al., 2025; Kim & Kang, 2025).
Our work shows that the relationship between ESG and performance is complex and varies across companies and over time. We studied the European electronics sector using advanced quantitative approaches, highlighting short-term trade-offs and offering new insights into how to leverage sustainability as a competitive advantage. Companies must view ESG as a strategic element in their operational and financial decisions, monitoring its effects over time. Public decision-makers must create regulations that promote sustainable pathways without imposing short-term penalties. In summary, careful sustainability management can strengthen a company’s economic foundations and create value for its shareholders, stakeholders, and society.
10. Conclusions, Implications, Limits and Perspectives
This study analysed the relationship between ESG sustainability and the economic and financial performance of European companies in the electronic components sector from 2014 to 2023, filling a gap in the literature that has been primarily focused on Asian and North American contexts. Through correlation analysis, multiple regression and path analysis, the results indicate that the relationship between ESG and performance is neither direct nor linear: ESG variables do not show significant effects on the leading profitability indicators in the short term, highlighting how sustainability is a long-term strategic investment. Path analysis reveals significant indirect effects, with governance acting as a positive catalyst on operational efficiency and capital stability, while high leverage limits the ability to maintain high ESG standards. Overall, sustainability emerges as a long-term value lever, contributing to resilience, reputation and access to sustainable capital.
From a theoretical perspective, the study helps clarify the multidimensional and non-linear nature of the ESG-performance link. Contrary to the universalist assumption of a relationship that is always positive, the results support the contingent perspective (Fatemi, Glaum & Kaiser, 2018; Bai & Kim, 2024), according to which the impact of ESG depends on contextual factors such as financial structure, market maturity, regulation and the strategic integration of sustainable policies. This approach reinforces institutional and stakeholder-based theories, demonstrating that sustainability does not operate as a simple reputational variable, but rather as a systemic mechanism of interaction between governance, strategy, and competitiveness (Del Gesso, 2024; Ioannou & Serafeim, 2015). In this sense, the research also contributes to the most recent literature on the Sustainable Digital Economy, which emphasises the role of innovative technologies and digitisation in reducing information costs and monitoring ESG impacts (Han et al., 2025; Marczewska et al., 2025; Popescu, 2023). The adoption of traceability, AI and predictive analytics technologies can improve companies’ ability to quantify ESG benefits and transform them into measurable competitive advantages.
The managerial implications are important. The results indicate that ESG strategies should not be viewed as barriers to profitability, but rather as learning opportunities that can yield benefits over time. In the electronics sector, ESG must be integrated into industrial and financial strategies, linking governance, human resources, and technological innovation for sustainability and efficiency. Debt management must be prudent to allow investments in sustainability. In addition, the benefits of ESG are evident in the long term, enhancing competitiveness and attracting responsible investment. (Broadstock et al., 2021; Naseer et al., 2025).
The results also offer insights for European policymakers. Since the effectiveness of eco-innovation is primarily domestic and technological (Ferraro et al., 2025), public policies should focus not only on generic financing, but also on training specialised skills and creating targeted incentives for technological adoption in SMEs in the electronics sector, to accelerate the ecological transition.
On the policy implications front, our findings, in line with analyses of the energy transition (Thomas et al., 2024), suggest that European policymakers should reconsider the traditional approach based solely on regulations and financial incentives. To achieve lasting change in the electronics industry, policies should aim to promote a culture of corporate sustainability and strategic leadership within enterprises.
Furthermore, our findings on the interrelationships between ESG and EFP, combined with the existing literature on the determinants of environmental innovation (Carfora et al., 2021), suggest that the European Union should adopt a two-way approach. Firstly, a compliance approach with stricter regulations and penalties for non-compliance; secondly, a cultural direction aimed at improving the environmental awareness of managers, since monetary and fiscal incentives alone have not been significant in determining the propensity to invest in green innovations.
A clear framework of European rules is therefore essential for integrating ESG principles into the industrial sector. Initiatives such as the CSRD, the Green Deal, and the Chips Act are crucial, but public policies must ensure uniform measurement standards, transparent rating systems, and tax incentives for SMEs, thereby avoiding excessive costs. This would foster fairer, circular and digitally sustainable industrial models, reducing the risk of greenwashing and promoting the creation of shared value.
However, the study has some limitations. The availability of certified ESG data remains scarce and varied, particularly for unlisted companies, which limits cross-country analysis. The static quantitative approach fails to capture the dynamic and temporal factors of ESG on financial performance, and the use of aggregated indicators can obscure specific details, such as green innovation. In addition, the ten-year period studied encompassed several economic phases, including the pandemic and the energy crisis, which may have influenced the correlations. Similar to other studies employing OLS models (Ceptureanu et al., 2025), our work is limited to association. Future research should employ Granger or SEM causality models, using operational performance variables (e.g., production efficiency) to capture the intermediate impact of eco-innovation before this is fully reflected in financial results (ROE/ROA).
Important opportunities for future studies emerge from the limitations. It would be beneficial to develop analytical models to examine the relationships between ESG investments and economic returns. Expanding the sample to include more high-tech companies will enable comparisons and identify sustainability patterns in Europe. Other studies will investigate the role of digitalisation and green innovation as mediators in the relationship between ESG and performance. Ultimately, it is crucial to consider how regulation affects the competitiveness of companies during the ecological transition. In summary, the research demonstrates that sustainability is a strategic variable for enhancing the resilience and competitiveness of companies, which is essential for adapting to new forms of production.
Author Contributions
The article is the result of collaboration between the authors. GXXXX MXXXX has established the theoretical framework within which the quantitative analysis and related elaborations are situated. It therefore evaluated the results by formulating considerations and conclusions. The following paragraphs can therefore be attributed to him: “Introduction”, “Theoretical Background”, “Review of the literature and formulation of research hypotheses”, “Hypothesis testing”, “Discussion”, “Conclusions”, “Implications”, “Limits and prospects”. MXXXX MXXXX, on the other hand, designed the analysis methodology, obtained the balance sheet data, and processed them. The following paragraphs can therefore be attributed to him: “Methodology”, “The context of the survey”, “Analysis of the main balance sheet ratios”, “Econometric analyses”.
Funding
This research received no external funding.
Data Availability Statement
The primary data processed in this study are taken from the Orbis financial statement database managed by Moody’s Analytics.
Conflicts of Interest
The authors declare that they have no conflicts of interest.
Abbreviations
The following abbreviations are used in this manuscript:
| MDPI | Multidisciplinary Digital Publishing Institute |
| DOAJ | Directory of open-access journals |
| TLA | Three-letter acronym |
| LD | Linear dichroism |
References
- Ahmad, N., & Omar, Z. (2024). The Role of ESG in Enhancing Corporate Resilience in Emerging Markets. Journal of Finance and Economic Studies, 12(1), 101–115. [CrossRef]
- Anderson, L. K., & Frank, C. K. (2022). Sustainable Supply Chains in the Electronics Industry: A Regulatory Perspective. European Business Review, 34(2), 220–240. [CrossRef]
- Baker, T., & Smith, J. R. (2023). Financial implications of environmental innovation in high-tech sectors. Technovation, 134, 102500. [CrossRef]
- Benson, V., & Miller, H. (2021). The Digital Transformation of Sustainability. Cambridge University Press, Cambridge, UK.
- Carfora, A., Scandurra, G., & Thomas, A. (2021). Determinants of environmental innovations supporting small- and medium-sized enterprises sustainable development. Business Strategy and the Environment, 30(5), 2621–2636. [CrossRef]
- Ceptureanu, S., Ceptureanu, E., Ferraro, G., & Thomas, A. (2025). Investigating the Link Between Eco-Innovation Ambidexterity and Performances in Low-End Markets. Does Frugal Innovation Matter? Business Strategy and the Environment. [CrossRef]
- Cochran, P. L., & Wood, R. A. (1984). Corporate Social Responsibility and Financial Performance. Academy of Management Journal, 27(1), 42–56. [CrossRef]
- Eccles, R. G., Ioannou, I., & Serafeim, G. (2014). The Impact of Corporate Sustainability on Organizational Processes and Performance. Management Science, 60(11), 2835–2857. [CrossRef]
- European Commission. (2022). European Chips Act: Proposal for a Regulation. Brussels, Belgium.
- Fernando, C. S., & Sharfman, M. P. (2008). Environmental Risk Management and the Cost of Equity Capital. Strategic Management Journal, 29(10), 1049–1068. [CrossRef]
- Ferraro, G., Passaro, R., Quinto, I., & Thomas, A. (2025). The process supporting the emergence of the environmental innovation capabilities within small businesses: An empirical investigation. Business Strategy and the Environment, 34(1), 1027–1042. [CrossRef]
- Ferraro, G., Quinto, I., Scandurra, G., & Thomas, A. (2025). The Impact of Artificial Intelligence and Sustainability Management on Fostering ESG Practices and Competitive Perspectives Among SMEs. Corporate Social Responsibility and Environmental Management, 32(5), 6641–6657. [CrossRef]
- Friede, G., Busch, T., & Bassen, A. (2015). ESG and financial performance: aggregated evidence from more than 2000 empirical studies. Journal of Sustainable Finance & Investment, 5(4), 210–233. [CrossRef]
- George, D., & Mallery, P. (2019). SPSS for Windows Step by Step: A Simple Guide and Reference (16th ed.). Pearson, Boston, MA, USA.
- Hair, J. F., Black, W. C., Babin, B. J., & Anderson, R. E. (2019). Multivariate Data Analysis (8th ed.). Cengage Learning, Boston, MA, USA.
- Han, H. S., P. T. S., & P. J. K. (2025). The impact of ESG performance outcomes on digital transformation projects sustainable performance management. Sustainable Futures, 10, 101256. [CrossRef]
- Hart, S. L. (1995). A natural-resource-based view of the firm. Academy of Management Review, 20(4), 986–1014. [CrossRef]
- Hsu, C. W., & Wang, H. W. (2021). The impact of green innovation on firm performance: The moderating effect of green absorptive capacity. Technological Forecasting and Social Change, 172, 120993. [CrossRef]
- Ioannou, I., & Serafeim, G. (2015). The impact of corporate social responsibility on investment recommendations: Analysts’ perceptions and shifting institutional logics. Strategic Management Journal, 36(7), 1053–1081. [CrossRef]
- Johnson, L. B. (2023). Corporate Governance and Operational Efficiency: Evidence from the European Tech Sector. Journal of Corporate Finance, 80, 102315. [CrossRef]
- Kahn, M. A., & Bawa, H. (2024). ESG disclosure and firm value: The role of information asymmetry. Review of Financial Economics, 42(3), 200–215. [CrossRef]
- Khalid, F., Iram, R., Bacha, E., & Maqbool, S. (2022). Firm characteristics, governance mechanisms, and ESG disclosure: how caring about sustainable concerns?. Environmental Science and Pollution Research, 29(54), 82064–82077. [CrossRef]
- Kim, I., & Kang, S. (2025). The cost of going green: Meta-efficiency and market dominance amid ESG performance. Sustainable Futures, 10, 101256. [CrossRef]
- Kline, R. B. (2023). Principles and Practice of Structural Equation Modeling (5th ed.). Guilford Press, New York, NY, USA.
- Lian, Y., Pang, C., & Wang, X. (2024). ESG practices, green innovation, and financial performance: Panel evidence from ASEAN firms. Sustainability Accounting, Management and Policy Journal, 18(8), 467. [CrossRef]
- Lopes, D. A., Magalhaes, J. L., & Castro, B. (2023). Circular Economy and Sustainable Manufacturing: Drivers and Barriers in the European Electrical and Electronic Equipment Industry. Sustainability, 15(9), 7486. [CrossRef]
- Miller, B. N., & Carter, A. T. (2023). The mediating role of firm size in the ESG-EFP relationship. Journal of Applied Corporate Finance, 35(1), 78–92. [CrossRef]
- Nunnally, J. C., & Bernstein, I. H. (1994). Psychometric theory (3rd ed.). McGraw-Hill, New York, NY, USA.
- Park, S., & Lee, J. (2021). The impact of social performance on labor productivity in high-tech firms. Human Resource Management Journal, 31(4), 1000–1018. [CrossRef]
- Pearson, K. (1896). Mathematical contributions to the theory of evolution. III. Regression, heredity, and panmixia. Philosophical Transactions of the Royal Society of London. A, 187, 253–318. [CrossRef]
- Pérez, M. D. C., López, A. M., & Castro, B. (2022). Corporate Governance and Sustainability Performance in European Listed Companies. Sustainability, 14(12), 7085. [CrossRef]
- Popescu, C. R. (2023). The Role of Digital Transformation in Improving Environmental Performance and Operational Efficiency. Sustainability, 15(18), 13677. [CrossRef]
- Scholtens, B. (2008). A note on the interaction between corporate social responsibility and financial performance. Ecological Economics, 68(1–2), 52–59. [CrossRef]
- Shao, J., Zang, T., Thomas, B., & Zhou, P. (2025). The long-term effects of ESG performance on enterprise value in the digital economy. Sustainable Futures, 10, 101256. [CrossRef]
- Solomon, R. G. (2022). ESG Investment and Risk Mitigation in the European Market. The European Journal of Finance, 28(15), 1475–1490. [CrossRef]
- Tariq, M., P. B., S. M., & H. R. (2024). The impact of environmental, social, and governance (ESG) performance on green technology innovation. Journal of Cleaner Production, 467, 143187. [CrossRef]
- Teece, D. J. (2018). Dynamic capabilities as a foundation for sustainable enterprise. California Management Review, 61(1), 1–25. [CrossRef]
- Thomas, A., Scandurra, G., & Carfora, A. (2024). Conceptualising an interpretative framework for energy transition among Italian innovative small and medium enterprises. Energy Policy, 195, 114392. [CrossRef]
- Toma, I., & Toma, S. G. (2024). The impact of ESG risk on company performance: A multi-sectoral analysis. International Journal of Environmental Research and Public Health, 21(3), 269. [CrossRef]
- Ullmann, A. A. (1985). Data in search of a theory: A critical examination of the relationship between social performance and financial performance. Academy of Management Review, 10(3), 540–557. [CrossRef]
- Velte, P. (2017). Does ESG performance have an impact on financial performance? Evidence from Germany. Journal of Global Responsibility, 8(2), 169–178. [CrossRef]
- Waddock, S. A., & Graves, S. B. (1997). The corporate social performance–financial performance link. Strategic Management Journal, 18(4), 303–319. [CrossRef]
- Wang, C., Shen, J., & Zhu, S. (2025). Digital transformation, sustainable development and enterprise total factor productivity. Sustainable Futures, 10, 101256. [CrossRef]
- Williams, Z., & Apollonio, H. (2024). The causation dilemma in ESG research. Green Finance, 6(2), 265–286. [CrossRef]
- Wirth, T. (2021). The NACE 26 Sector in the European Union: Market Structure and Future Challenges. Industry and Innovation, 28(4), 500–520. [CrossRef]
- Yuan, Y., & Song, H. (2021). ESG Performance and Cost of Capital: Evidence from the European Market. Journal of Risk and Financial Management, 14(7), 312. [CrossRef]
- Zou, H., & Liu, Y. (2023). Modeling path analysis with panel data: A structural equation approach. Organisational Research Methods, 26(3), 450–475. [CrossRef]
Figure 1.
Path Analysis (Source: Our elaboration).
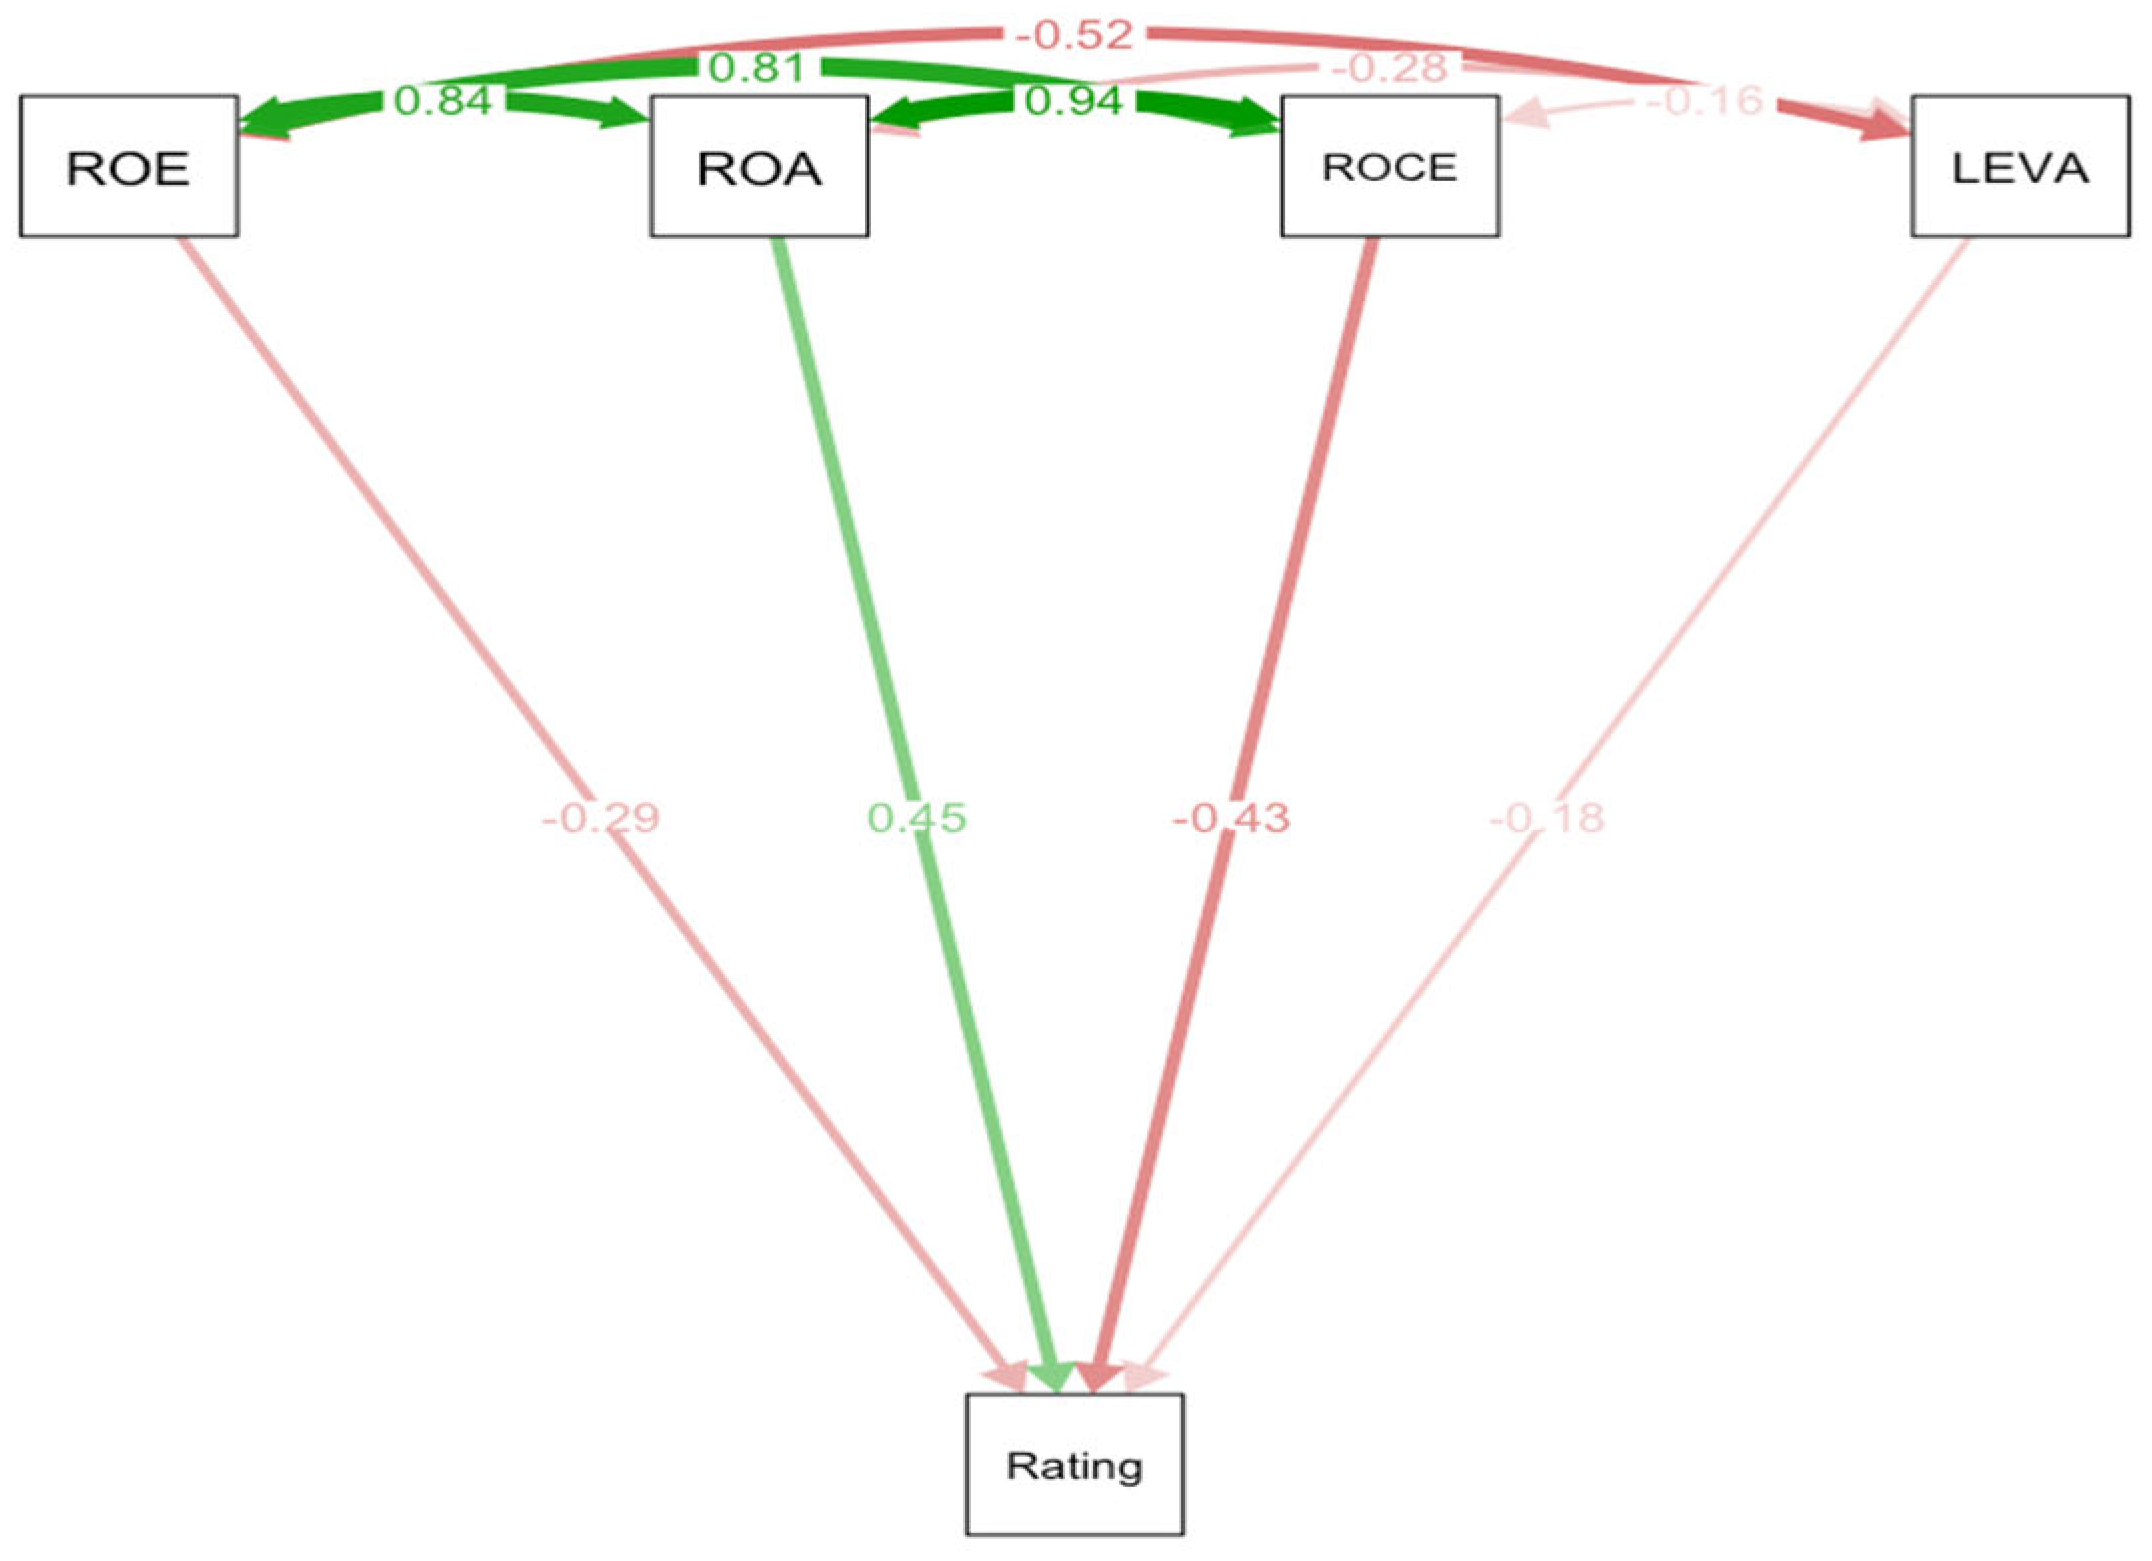

Table 1.
ESG Business Champion.
| Nation | Number of companies |
| Austria | 1 |
| Belgium | 1 |
| Denmark | 3 |
| Finland | 4 |
| France | 4 |
| Germany | 4 |
| Italy | 2 |
| Norway | 6 |
| United Kingdom | 6 |
| Sweden | 6 |
| Switzerland | 2 |
| Portugal | 3 |
| Source: Our elaboration | |
Table 2.
ESG rating score by country.
| Nation | Rating | E | S | G |
| Italy | 31,1 | |||
| France | 99,5 | 10,8 | 7,1 | 4,7 |
| Germany | 79,3 | 4,2 | 8,8 | 6,7 |
| United Kingdom | 102,6 | 9,4 | 11,6 | 8,6 |
| Sweden | 128,5 | 7,8 | 11,9 | 5,8 |
| Denmark | 53,7 | 0 | 0 | 0 |
| Belgium | 14,3 | |||
| Switzerland | 46,6 | 15,1 | 18,8 | 12,7 |
| Austria | 16,7 | 7,5 | 2,9 | 6,4 |
| Portugal | 15,9 | |||
| Finland | 131,6 | 39,7 | 33,1 | 23,1 |
| Norway | 168,7 | 36 | 27,1 | 21,7 |
| Source: Our elaboration | ||||
Table 3.
Prevailing legal forms.
| Total | Value | |
| London Stock Exchange | 1 | 2,5% |
| SRL | 1 | 2,5% |
| SPA | 34 | 85% |
| Unknown | 4 | 10% |
| 40 | ||
| Source: Our elaboration | ||
Table 4.
Employee Evolution.
| Nation | 2014 | 2015 | 2016 | 2017 | 2018 | 2019 | 2020 | 2021 | 2022 | 2023 |
| Austria | 7.638 | 8.759 | 9.526 | 9.734 | 9.624 | 10.511 | 12.059 | 14.269 | 14.687 | 13.696 |
| Belgium | 10.506 | 10.241 | 10.042 | 9.840 | 9.662 | 7.892 | 7.337 | 6.993 | 6.936 | 5.026 |
| Switzerland | 13.845 | 20.863 | 22.178 | 22.593 | 23.540 | 24.268 | 28.485 | 30.612 | 30.235 | 27.718 |
| Germany | 21.698 | 22.396 | 23.728 | 24.535 | 25.925 | 26.748 | 28.201 | 28.886 | 30.218 | 31.253 |
| Denmark | 3.072 | 3.066 | 3.328 | 3.205 | 3.288 | 3.415 | 3.258 | 3.363 | 3.492 | 3.455 |
| Finland | 76.301 | 71.477 | 117.242 | 118.731 | 119.331 | 118.580 | 111.713 | 108.409 | 110.270 | 111.663 |
| France | 15.510 | 18.109 | 18.286 | 17.650 | 19.548 | 19.333 | 15.321 | 8.250 | 7.715 | 6.895 |
| United Kingdom | 17.267 | 12.084 | 16.149 | 16.524 | 17.807 | 18.473 | 18.157 | 19.541 | 20.594 | 20.509 |
| Italy | 9.984 | 9.892 | 2.696 | 10.032 | 9.842 | 8.828 | 8.041 | 7.535 | 7.511 | 6.738 |
| Norway | 14.645 | 15.759 | 16.242 | 15.731 | 16.260 | 20.270 | 19.766 | 20.608 | 23.571 | 25.192 |
| Portugal | 23 | 22 | 23 | 1.131 | ||||||
| Sweden | 2.247 | 2.441 | 2.337 | 2.513 | 2.726 | 2.870 | 2.993 | 3.464 | 4.129 | 4.565 |
Table 5.
Investment evolution.
| Nation | 2014 | 2015 | 2016 | 2017 | 2018 | 2019 | 2020 | 2021 | 2022 | 2023 |
| Austria | 1.220.812 | 1.344.650 | 1.436.694 | 1.530.439 | 1.784.106 | 1.853.510 | 2.389.962 | 3.746.324 | 4.161.864 | 4.674.897 |
| Belgium | 2.548.000 | 2.402.000 | 2.352.000 | 2.233.000 | 2.367.000 | 2.294.000 | 2.204.000 | 2.095.000 | 1.756.000 | 1.368.000 |
| Switzerland | 2.960.852 | 2.934.433 | 3.290.866 | 3.417.072 | 4.067.867 | 4.498.871 | 6.467.873 | 7.998.495 | 8.023.572 | 8.610.603 |
| Germany | 1.558.939 | 1.729.127 | 1.903.959 | 1.912.425 | 1.993.852 | 2.556.937 | 2.881.444 | 3.158.156 | 3.354.588 | 3.731.952 |
| Denmark | 663.340 | 682.676 | 665.952 | 694.148 | 692.645 | 759.327 | 726.744 | 825.528 | 935.774 | 985.955 |
| Finland | 25.268.101 | 25.056.787 | 49.247.891 | 44.853.574 | 43.826.806 | 44.760.916 | 41.715.122 | 46.119.763 | 49.756.482 | 47.552.960 |
| France | 3.619.114 | 5.031.805 | 4.939.807 | 4.356.941 | 4.754.399 | 4.396.003 | 4.761.684 | 5.157.526 | 4.934.417 | 4.529.334 |
| United Kingdom | 2.371.856 | 1.168.220 | 2.712.262 | 2.662.784 | 3.002.157 | 3.588.911 | 3.604.948 | 12.135.418 | 12.835.788 | 14.714.381 |
| Italy | 2.198.184 | 2.279.981 | 2.269.908 | 1.997.289 | 2.019.886 | 1.633.947 | 1.621.610 | 1.756.637 | 1.805.779 | 1.574.965 |
| Norway | 4.205.101 | 4.130.787 | 4.346.891 | 3.829.574 | 4.312.750 | 5.643.062 | 5.564.379 | 6.162.462 | 6.903.385 | 7.785.974 |
| Portugal | 332.042 | 328.000 | 315.079 | 301.244 | 293.890 | 250.439 | 250.990 | 224.692 | 193.053 | 200.694 |
| Sweden | 352.857 | 447.288 | 475.368 | 529.969 | 555.051 | 619.400 | 677.790 | 943.538 | 1.093.307 | 1.271.845 |
Table 6.
Turnover evolution.
| Nation | 2014 | 2015 | 2016 | 2017 | 2018 | 2019 | 2020 | 2021 | 2022 | 2023 |
| Austria | 675.110 | 766.683 | 828.334 | 999.849 | 1.038.377 | 1.012.895 | 1.205.964 | 1.634.593 | 1.840.004 | 1.586.394 |
| Belgium | 2.660.000 | 2.679.000 | 2.574.000 | 2.464.000 | 2.295.000 | 2.269.000 | 1.820.000 | 1.786.000 | 1.984.000 | 1.362.000 |
| Switzerland | 3.147.976 | 3.097.511 | 3.495.158 | 3.712.585 | 4.171.236 | 4.406.727 | 6.374.472 | 7.394.960 | 6.814.260 | 6.361.232 |
| Germany | 1.975.302 | 2.194.084 | 2.408.785 | 2.410.262 | 2.436.633 | 2.634.706 | 2.567.852 | 2.938.818 | 3.107.060 | 3.349.859 |
| Denmark | 1.549.648 | 1.505.068 | 1.553.845 | 1.651.211 | 1.591.988 | 1.658.619 | 1.646.845 | 1.762.672 | 2.010.952 | 1.913.090 |
| Finland | 18.694.894 | 17.207.145 | 27.246.285 | 26.640.888 | 26.154.446 | 28.117.915 | 26.469.774 | 27.650.712 | 31.034.181 | 28.921.060 |
| France | 3.649.772 | 4.014.065 | 5.252.281 | 4.667.515 | 4.754.669 | 4.512.235 | 3.657.741 | 3.848.201 | 5.249.495 | 3.133.173 |
| United Kingdom | 2.402.949 | 1.411.782 | 2.441.987 | 2.659.667 | 2.762.488 | 2.942.273 | 5.250.247 | 6.581.572 | 6.798.755 | 7.903.338 |
| Italy | 1.648.538 | 1.821.255 | 1.844.518 | 1.702.326 | 1.640.559 | 1.591.327 | 1.278.274 | 1.598.044 | 1.746.935 | 1.573.820 |
| Norway | 3.376.894 | 3.407.145 | 3.516.285 | 3.242.888 | 3.306.200 | 4.401.931 | 4.524.199 | 5.155.423 | 6.133.697 | 6.723.324 |
| Portugal | 179.773 | 174.386 | 174.026 | 165.463 | 181.808 | 165.120 | 137.610 | 158.934 | 157.802 | 150.855 |
| Sweden | 461.248 | 516.814 | 514.197 | 520.083 | 576.952 | 624.145 | 663.167 | 873.572 | 1.059.405 | 1.193.349 |
Table 7.
Descriptive statistics ROE.
| ROE | 2014 | 2015 | 2016 | 2017 | 2018 | 2019 | 2020 | 2021 | 2022 | 2023 |
| Average | -4,18 | 16,57 | 9,89 | 10,97 | 4,57 | -10,18 | 1,75 | 9,34 | 11,32 | 9,49 |
| Standard error | 15,26 | 4,13 | 4,79 | 3,38 | 9,88 | 18,31 | 6,21 | 5,08 | 5,12 | 5,05 |
| Median | 14,70 | 16,72 | 13,09 | 16,66 | 17,54 | 10,62 | 10,88 | 17,28 | 17,36 | 14,57 |
| Standard deviation | 91,58 | 24,08 | 28,72 | 20,29 | 59,30 | 109,85 | 38,31 | 31,69 | 31,95 | 31,11 |
| Sample variance | 8387,68 | 579,71 | 825,10 | 411,88 | 3516,95 | 12066,12 | 1467,76 | 1004,55 | 1020,95 | 967,81 |
| Curtosis | 29,54 | 10,43 | 14,71 | 1,65 | 29,58 | 31,87 | 4,64 | 11,19 | 14,49 | 14,87 |
| Asymmetry | -5,24 | 1,92 | -3,07 | -1,04 | -5,25 | -5,52 | -2,08 | -3,07 | -3,06 | -3,26 |
| Interval | 599,12 | 160,55 | 192,03 | 98,06 | 364,75 | 670,43 | 176,22 | 173,79 | 205,44 | 184,79 |
| Minimum | -514,64 | -41,00 | -126,52 | -46,60 | -326,15 | -633,33 | -125,46 | -130,63 | -143,87 | -141,57 |
| Maximum | 84,48 | 119,55 | 65,51 | 51,46 | 38,60 | 37,09 | 50,76 | 43,16 | 61,56 | 43,22 |
| Sum | -150,39 | 563,22 | 356,14 | 395,05 | 164,44 | -366,56 | 66,49 | 364,14 | 441,46 | 360,73 |
| Count | 36,00 | 34,00 | 36,00 | 36,00 | 36,00 | 36,00 | 38,00 | 39,00 | 39,00 | 38,00 |
Source: Our elaboration.
Table 8.
Descriptive analysis ROA.
| ROA | 2014 | 2015 | 2016 | 2017 | 2018 | 2019 | 2020 | 2021 | 2022 | 2023 |
| Average | 3,56 | 6,65 | 5,07 | 6,58 | 3,98 | 3,37 | 3,34 | 7,41 | 6,51 | 4,47 |
| Standard error | 2,93 | 1,98 | 2,68 | 1,91 | 3,55 | 2,47 | 2,40 | 1,51 | 1,85 | 2,41 |
| Median | 6,74 | 7,17 | 7,67 | 8,94 | 7,57 | 4,28 | 4,88 | 7,43 | 7,94 | 5,52 |
| Standard deviation | 17,57 | 11,69 | 16,08 | 11,44 | 21,61 | 15,00 | 14,78 | 9,44 | 11,55 | 15,06 |
| Sample variance | 308,87 | 136,64 | 258,62 | 130,96 | 466,84 | 224,99 | 218,32 | 89,19 | 133,37 | 226,72 |
| Curtosis | 7,46 | 1,33 | 12,56 | 1,43 | 13,60 | 2,43 | 6,68 | 1,33 | 2,60 | 7,52 |
| Asymmetry | -2,56 | -0,68 | -2,85 | -0,76 | -3,23 | -1,23 | -1,87 | -0,21 | -0,26 | -1,78 |
| Interval | 92,32 | 54,21 | 98,31 | 56,20 | 127,47 | 74,97 | 85,88 | 49,63 | 67,71 | 93,50 |
| Minimum | -65,33 | -24,47 | -68,76 | -26,14 | -97,40 | -43,70 | -57,03 | -16,94 | -27,17 | -58,49 |
| Maximum | 26,99 | 29,74 | 29,55 | 30,06 | 30,07 | 31,27 | 28,86 | 32,69 | 40,54 | 35,01 |
| Sum | 128,07 | 232,70 | 182,60 | 236,72 | 147,08 | 124,76 | 126,99 | 289,01 | 253,77 | 174,30 |
| Count | 36,00 | 35,00 | 36,00 | 36,00 | 37,00 | 37,00 | 38,00 | 39,00 | 39,00 | 39,00 |
Source: Our elaboration.
Table 9.
Descriptive analysis ROCE.
| ROCE | 2014 | 2015 | 2016 | 2017 | 2018 | 2019 | 2020 | 2021 | 2022 | 2023 |
| Average | 4,09 | 11,33 | 8,07 | 10,12 | 7,72 | 4,62 | 6,09 | 11,56 | 11,21 | 7,31 |
| Standard error | 5,37 | 2,54 | 4,00 | 2,70 | 5,02 | 3,57 | 3,18 | 2,19 | 2,97 | 4,01 |
| Median | 12,96 | 12,03 | 11,18 | 12,70 | 12,01 | 7,34 | 8,96 | 13,15 | 12,26 | 10,10 |
| Standard deviation | 31,34 | 14,81 | 23,67 | 15,98 | 29,71 | 21,14 | 19,08 | 13,13 | 18,08 | 24,40 |
| Sample variance | 982,14 | 219,36 | 560,35 | 255,48 | 882,45 | 447,00 | 363,96 | 172,36 | 326,76 | 595,37 |
| Curtosis | 9,82 | 2,14 | 15,93 | 1,27 | 16,54 | 2,72 | 6,75 | 1,82 | 1,77 | 11,70 |
| Asymmetry | -3,05 | -1,02 | -3,37 | -0,84 | -3,70 | -1,51 | -1,85 | -0,48 | -0,45 | -2,77 |
| Interval | 158,54 | 71,87 | 146,06 | 72,88 | 172,98 | 96,92 | 109,94 | 70,67 | 97,68 | 147,12 |
| Minimum | -123,95 | -36,14 | -105,80 | -34,52 | -135,68 | -61,44 | -71,10 | -29,03 | -41,42 | -104,16 |
| Maximum | 34,59 | 35,73 | 40,26 | 38,35 | 37,31 | 35,48 | 38,84 | 41,64 | 56,26 | 42,96 |
| Sum | 138,91 | 385,09 | 282,58 | 354,14 | 270,03 | 161,76 | 219,34 | 416,07 | 414,69 | 270,36 |
| Count | 34,00 | 34,00 | 35,00 | 35,00 | 35,00 | 35,00 | 36,00 | 36,00 | 37,00 | 37,00 |
Source: Our elaboration.
Table 10.
Descriptive Leverage Analytics.
| 2014 | 2015 | 2016 | 2017 | 2018 | 2019 | 2020 | 2021 | 2022 | 2023 | |
| Average | 75,35 | 44,02 | 53,81 | 54,14 | 55,31 | 49,14 | 85,70 | 62,17 | 59,66 | 62,90 |
| Standard error | 24,44 | 9,05 | 10,25 | 14,34 | 16,17 | 5,57 | 25,28 | 18,17 | 10,45 | 15,11 |
| Median | 36,72 | 35,43 | 39,50 | 43,52 | 37,80 | 49,46 | 46,49 | 42,62 | 47,39 | 39,89 |
| Standard deviation | 146,64 | 52,00 | 61,52 | 86,03 | 97,04 | 32,94 | 155,86 | 111,99 | 65,24 | 93,13 |
| Sample variance | 21.503,92 | 2.704,20 | 3.785,06 | 7.401,45 | 9.417,07 | 1.085,05 | 24.292,64 | 12.542,17 | 4.255,65 | 8.673,61 |
| Curtosis | 13,95 | 13,93 | 8,13 | 24,58 | 27,55 | -0,06 | 21,15 | 31,56 | 9,96 | 17,98 |
| Asymmetry | 3,63 | 3,23 | 2,66 | 4,61 | 4,98 | 0,46 | 4,36 | 5,41 | 2,83 | 4,01 |
| Interval | 752,51 | 283,58 | 286,33 | 514,29 | 587,87 | 129,61 | 895,85 | 705,22 | 347,24 | 526,52 |
| Minimum | 0,00 | 0,00 | 0,00 | 0,00 | 0,00 | 0,89 | 2,94 | 1,09 | 0,77 | 0,44 |
| Maximum | 752,51 | 283,58 | 286,33 | 514,29 | 587,87 | 130,50 | 898,79 | 706,31 | 348,01 | 526,96 |
| Sum | 2.712,60 | 1.452,60 | 1.937,16 | 1.949,07 | 1.991,34 | 1.720,01 | 3.256,49 | 2.362,28 | 2.326,74 | 2.390,12 |
| Count | 36,00 | 33,00 | 36,00 | 36,00 | 36,00 | 35,00 | 38,00 | 38,00 | 39,00 | 38,00 |
Source: Our elaboration.
Table 11.
Correlation.
| Rating | ROE | ROA | ROCE | LEVA | |
| Rating | 1 | ||||
| ROE | -0,1847272 | 1 | |||
| ROA | -0,1697844 | 0,83601475 | 1 | ||
| ROCE | -0,2414849 | 0,8144385 | 0,94160559 | 1 | |
| LEVA | -0,1111707 | -0,5187701 | -0,2797809 | -0,1602745 | 1 |
Source: Our elaboration.
Table 12.
Multiple regression.
| Residuals: | |||||
| Min | 1Q | Median | 3Q | Max | |
| -19.2170 | -5.3928 | -0.7615 | 4.7307 | 20.5188 | |
| Coefficientes: | |||||
| Estimate | Std. Error | T value | Pr(>|t|) | ||
| (Intercept) | 20.50606 | 1.87934 | 10.911 | 8.24e-13 | *** |
| ROE | -0.08441 | 0.11028 | -0.765 | 0.449 | |
| ROA | 0.31521 | 0.37082 | 0.850 | 0.401 | |
| ROCE | -0.21697 | 0.28088 | -0.772 | 0.445 | |
| LEVA | -0.01564 | 0.01975 | -0.792 | 0.434 | |
Source: Our elaboration.
Disclaimer/Publisher’s Note: The statements, opinions and data contained in all publications are solely those of the individual author(s) and contributor(s) and not of MDPI and/or the editor(s). MDPI and/or the editor(s) disclaim responsibility for any injury to people or property resulting from any ideas, methods, instructions or products referred to in the content. |
© 2025 by the authors. Licensee MDPI, Basel, Switzerland. This article is an open access article distributed under the terms and conditions of the Creative Commons Attribution (CC BY) license (http://creativecommons.org/licenses/by/4.0/).
Copyright: This open access article is published under a Creative Commons CC BY 4.0 license, which permit the free download, distribution, and reuse, provided that the author and preprint are cited in any reuse.


