Submitted:
15 October 2025
Posted:
16 October 2025
You are already at the latest version
Abstract
Extruded polypropylene (PP) films were exposed to cold air plasma treatment. Plasma treatment of PP films resulted in essential changes in their bulk properties. Maximal elongation, ultimate tensile strength (UTS), and toughness of the films were increased. The toughness of the films was increased from U_T0=(3323±400) MPa to U_(T_PT)=(4434±400) MPa. This increase is due to the growth of both the maximal elongation and the UTS of the plasma-treated samples. We relate improvement of mechanical properties of PP to the morphological transformations revealed in the plasma-treated PP films. Plasma treatment of PP samples was also followed by the modification of their surface properties. Plasma treatment resulted in hydrophilization of PP films followed by hydrophobic recovery. Bulk and surface properties of the plasma-treated PP films evolve with time. The following hierarchy of the temporal scales related to the studied relaxation processes is established: τ_HR>τ_ε=τ_T=τ_UTS>τ_E, where τ_HR,τ_ε,τ_T,τ_UTS and τ_E are the time scales of the change in: apparent contact angle (hydrophobic recovery), elongation, toughness, ultimate tensile strength, and Young modulus, respectively. The longest of the relaxation times is related to the surface processes, i.e., hydrophobic recovery. The stress-strain curves of the virgin and plasma-treated PP are well described with the twin-slope linear dependencies. The post-plasma-treatment recovery of the tangent modulus is reported.
Keywords:
polypropylene
; plasma treatment
; bulk properties
; toughness
; surface properties
; relaxation
; inverse Rehbinder effect
1. Introduction
Polypropylene (abbreviated PP) is among the most widely used thermoplastic polymers due to its low cost, low density, good mechanical properties, biocompatibility, and excellent chemical resistance [1,2,3,4,5]. These characteristics have made PP indispensable in packaging, textiles, automotive components, and biomedical devices. However, like many polyolefins, PP is chemically inert and possesses a low surface energy, typically in the range of 29–31 [6]. This inherent hydrophobicity results in poor wettability and weak adhesion to coatings, inks, dyes, or adhesives, limiting its applicability in processes where strong interfacial bonding is required [7,8,9].
Surface modification is a widely adopted strategy to overcome these limitations without compromising the desirable bulk properties of PP [10,11,12,13,14,15,16,17,18]. Among the available techniques – such as flame treatment [15], corona discharge [15], UV and ozone irradiation [16], and chemical etching [17] – cold plasma treatment has attracted increasing attention due to its environmental compatibility, tunability, and ability to modify only the outermost molecular layers of the material [10,11,12,13]. Unlike thermal plasmas, cold plasmas operate at near-ambient temperatures, which allows treatment of thermally sensitive polymers without distortion or degradation of their bulk structure.
Cold plasma treatment introduces a variety of reactive species, including ions, electrons, metastables, radicals, and UV photons, which interact with the polymer surface through a combination of physical and chemical processes [19,20,21,22,23,24,25,26,27,28,29,30]. These interactions may lead to surface cleaning, crosslinking, chain scission, and, most importantly, the incorporation of polar functional groups such as hydroxyl, carbonyl, or carboxyl moieties [30,31,32,33,34,35,36,37,38,39,40]. As a result, the surface energy of PP can be significantly increased, enhancing its wettability, printability, and adhesion properties [41,42]. The degree and nature of surface modification depend strongly on plasma parameters such as gas composition, power, pressure, treatment time, and electrode configuration [41,42].
In recent decades, numerous studies have demonstrated that cold plasma treatment is an effective, solvent-free, and rapid method for tailoring PP surfaces for specific applications, ranging from improved adhesion in composites to enhanced biocompatibility for medical devices [9,10,11,12,13,14,15,16,26,36,41,42]. Nevertheless, the precise relationship between plasma conditions, surface chemistry, and long-term stability of the induced modifications remains an active area of research. In particular, the phenomenon of hydrophobic recovery – partial reversion of treated PP surfaces toward their original low-energy state over time – poses challenges for practical implementation [43,44,45,46,47,48].
The present work aims to investigate the effects of cold plasma treatment on polypropylene under controlled conditions, focusing on changes in the bulk properties of PP films under plasma treatment. To date, only a few attempts have been made to alter the bulk properties of polymer materials using cold plasmas. While they have shown promising results, the plasma-polymer interactions and bulk material properties were not thoroughly investigated in this context. Understanding the interplay between plasma parameters and resulting surface and bulk properties of polymers is essential for designing effective, durable surface modification strategies for polypropylene in industrial applications. We demonstrate that the cold plasma treatment results in significant changes in the bulk properties of polymer films.
The paper is organized as follows: Materials and Methods section describes in detail the experimental procedures. In the Results section, we report changes in the surface and bulk properties of PP films due to their treatment by cold air plasma discharge. We also report the temporal changes in these properties following the plasma treatment. The time evolution of the bulk and surface properties of plasma-treated PP films is satisfactorily described by exponential fitting. This fitting enables the introduction of the characteristic time scales, inherent to recovery of the bulk and surface properties of the plasma-treated PP films. The Discussion section summarizes the experimental findings and their interpretations and puts them in the context of modern materials science. Trends for future investigations are outlined. The Conclusion section summarizes the reported findings and their interpretation.
2. Materials and Methods
Extruded polypropylene (PP) film samples with dimensions of 150×20 mm and thickness were cut using a scalpel blade and washed sequentially with acetone, water, ethanol, and finally water. The washed samples were dried for 24 hours at the ambient conditions.
Plasma treatment was carried out in the closed radiofrequency (RF) plasma installation PDC-32G manufactured by MTI Co., USA. Power of air plasma was 11 W, plasma frequency was approximately 13 MHz, pressure in the plasma chamber was on average 1 Torr (133 Pa), and the plasma electron temperature was approximately 104 K. Time of exposure was fixed at 30 seconds. Larger time spans of plasma treatment resulted in the deformation of the sample. After the plasma treatment, the samples were exposed to the environment: the average temperature was .
Air was supplied by Yakov Salam and Banav Ltd. (Israel). The air contained 78% , 21% , and 1% impurities , and ).
In the used cold air plasma, the electrons were at a much higher temperature than the neutral gas species, typically around 104 K, although the plasma gas as a whole is at near-ambient temperature. The plasma electron density is typically ≈ 1010 cm-3.
To identify the effect of cold plasma on mechanical and wetting properties and its relaxation, a series of experiments was carried out. The first set of samples was tested without plasma exposure. The remaining samples after plasma treatment were tested for 48 hours at intervals.
The mechanical measurements were performed on a Tensile Testing Machine UTM-65A, manufactured by MRC Lab (MRC Ltd., Holon Israel), supplied by M.R.C. (Rachmanov & Bookstein, Ltd., Israel with a maximum load of 100 N (Figure 1).
The tensile test speeds were 50 mm/min and 10 mm/min. For each time span of plasma treatment, 13–16 measurements were taken. After that, the basic mechanical properties were established, including Young modulus (E), ultimate tensile strength (UTS), toughness, and yield stress.
Plasma effect on the surface energy was verified by measuring the apparent contact angle. The experiment was performed on a Ramé-Hart Advanced Goniometer Model 500-F1. For each sample approximately 18 measurements were performed along the length of the sample.
The FTIR spectrum of PP was measured using a Mid-IR FTIR spectrometer (JASCO FT/IR-4600) at ambient conditions and is supplied in Appendix A.
3. Results
3.1. Stress-Strain Curves Registered for the Virgin and Plasma-Treated PP Films
The raw results of mechanical tests are shown in Figure 2, depicting the stress-strain dependencies for virgin and plasma-treated PP samples.
Now examine the impact of the cold plasma treatment on the maximal elongation of the samples , as depicted in Figure 3.
The maximal elongation is markedly increased from for the untreated samples to for the plasma-treated samples. The temporal dependence demonstrates the following behavior: it increases immediately after the plasma treatment of the sample, drops to a minimum, and then recovers to the initial post-treatment value after of the recovery. The characteristic time scale of the elongation change is estimated as
The Young modulus of the samples also changed markedly with the post-treatment dwell time denoted t (time measured after the plasma treatment of the PP sample). The dependence of the Young modulus on the post-treatment dwell time, , is depicted in Figure 4. The initial Young modulus dropped from to as measured immediately after the plasma treatment.
We used the following approximation formula for Young modulus (Eq. 1):
where (Young modulus) and t were taken from experiment data. The fitting parameters () were found using nonlinear regression. The best-fit parameters are .
Squared root-mean-square correlation coefficient (Squared Pearson correlation coefficient) for the exponential fitting of the experimental data with Eq. 1 is
We conclude that exponential fitting satisfactorily describes the change in the Young modulus of the cold plasma treatment of PP samples. The time span is reasonably understood as the characteristic time of the temporal change in the Young modulus of the samples. Comparing the experimental data presented in Figure 3 and Figure 4, we conclude that the interrelation takes place. In other words, the characteristic time span of the change in the maximal elongation of the sample is much larger than that of the Young modulus. This observation hints at the hierarchy of the relaxation processes occurring in the cold-air-plasma-treated PP films.
It can be noticed that yield stress temporal evolution behaves similarly to the Young modulus. The characteristic time of the change in the yield stress, , is close to that of the Young modulus recovery (see Appendix B); . Therefore, we assumed the same functional form for the fitting formula (Eq. 2) with the same value :
where and are fitting parameters, and (t) represent experimental yield stress data (Figure 5). The best-fit parameters are Squared Pearson correlation coefficient is . It is noteworthy that in our case yield stress is very close to the proportional limit. The yield stress of the virgin samples is the yield stress immediately after the plasma treatment is .
We recognize that . Thus, the temporal recovery of the yield stress is not complete. Now we examine the stress-strain curve depicted in Figure 2. The curve depicted in Figure 2 is well-represented by a bilinear (two-slope) mechanical model. The elastic region (first slope) is described by Eq. 3:
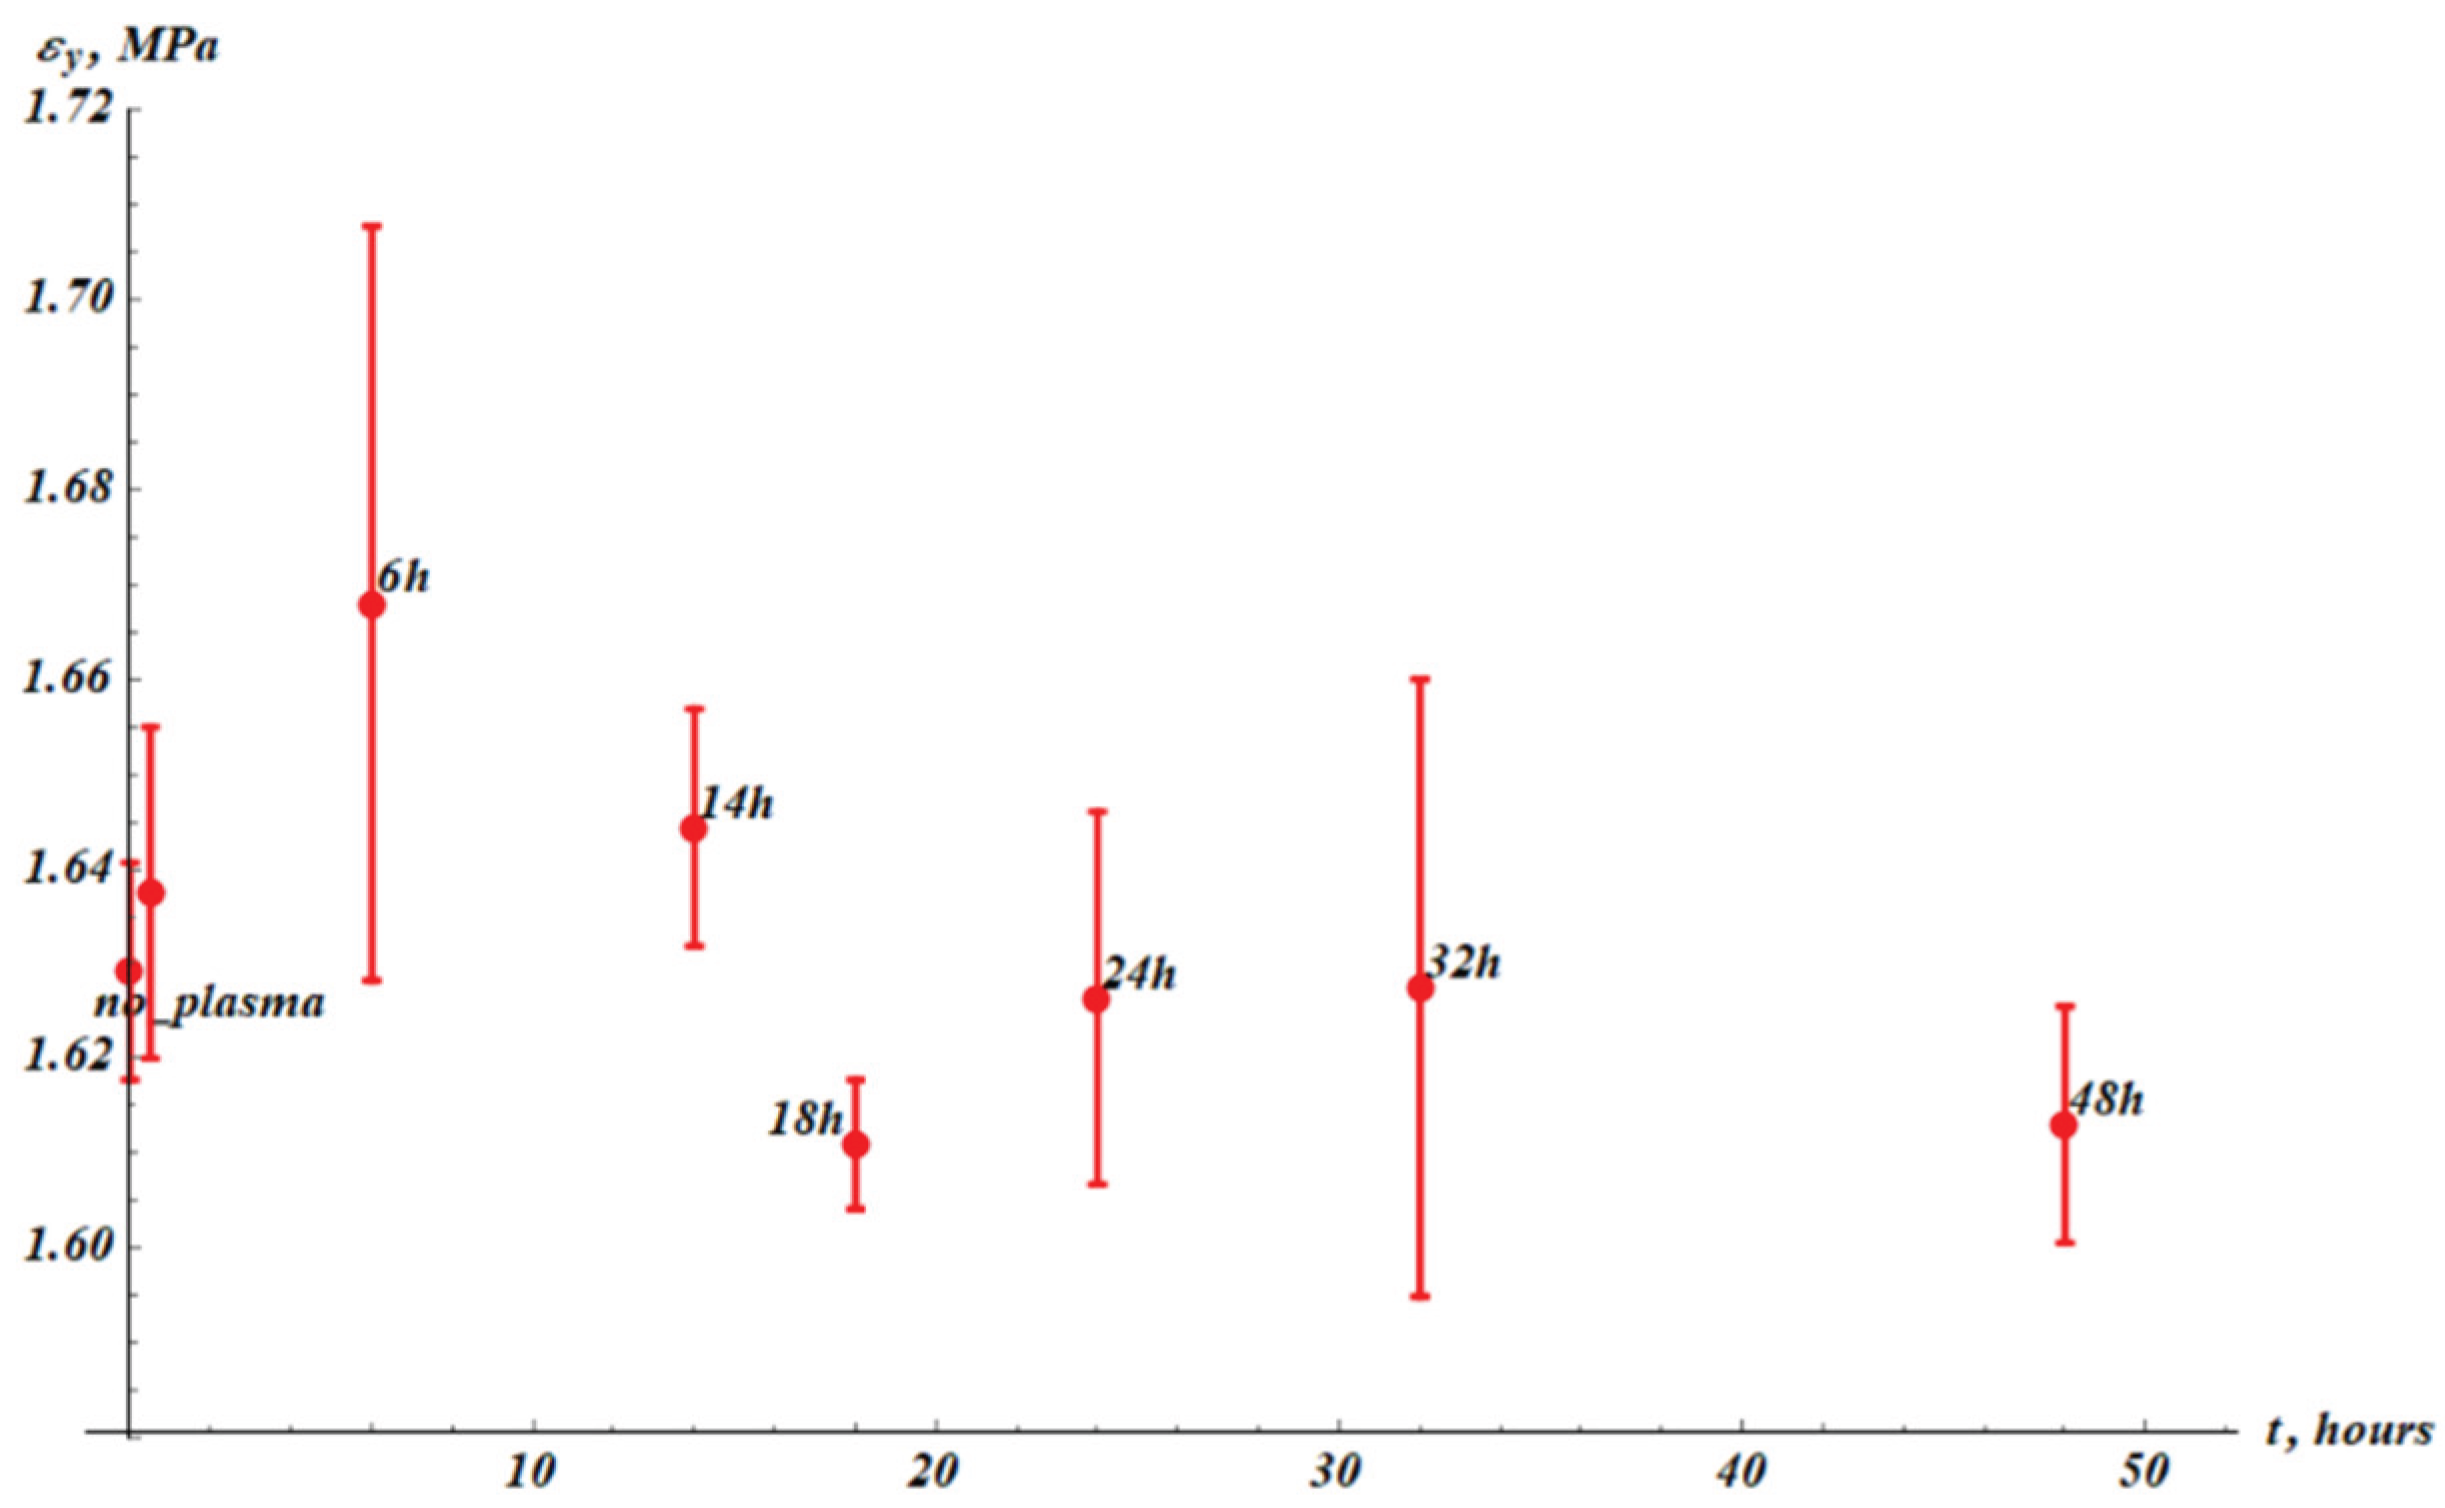
where is the yield strain (see Appendix B) corresponding to the yield stress . It is recognized from the data supplied in Appendix B that is practically independent of plasma treatment.
Beyond yield, the stress-strain curve has another slope, smaller than E. This is the tangent modulus or strain-hardening modulus, usually denoted . The plastic deformation is described by Eq. 4:
Let us discuss the time dependence of the tangent modulus labeled . The tangent modulus is increased by plasma treatment from to as shown in Figure 6. Afterwards the temporal behavior of follows the same pattern as , with the same characteristic time of total recovery (compare Figure 6 and Figure 3). The characteristic time scale of the tangent modulus change was established as close to that of maximal elongation. This result is quite reasonable: the recovery of plastic properties of the samples is governed by the same mechanism.
We now examine the temporal dependence of toughness, denoted and illustrated in Figure 7.
3.2. Toughness of the Virgin and Plasma-Treated PP Films
Recall, that toughness, denoted is defined by Eq. 5:
Toughness , given by Eq. 5, is the energy absorbed per unit volume by a specimen up to fracture. Numerically, it is the area under the stress–strain curve from zero strain to the fracture strain. The toughness is increased as a result of the plasma treatment, from the to . This is a very important result revealed in our investigation. The characteristic time scale of the toughness change was established as and is very close to that of maximal elongation .
Now address the ultimate tensile strength of the samples, abbreviated as UTS and depicted in Figure 8.
The UTS increased as a result of cold plasma treatment from to . The temporal behavior of the tangent modulus (), Toughness (, and UTS was the same (see Figure 6); .
It should be emphasized that the aforementioned time dependencies of mechanical characteristics of plasma-treated PP were the same for tensile speeds of 10 or 50 mm/min.
3.3. Surface Properties of the Virgin and Plasma-Treated PP Films
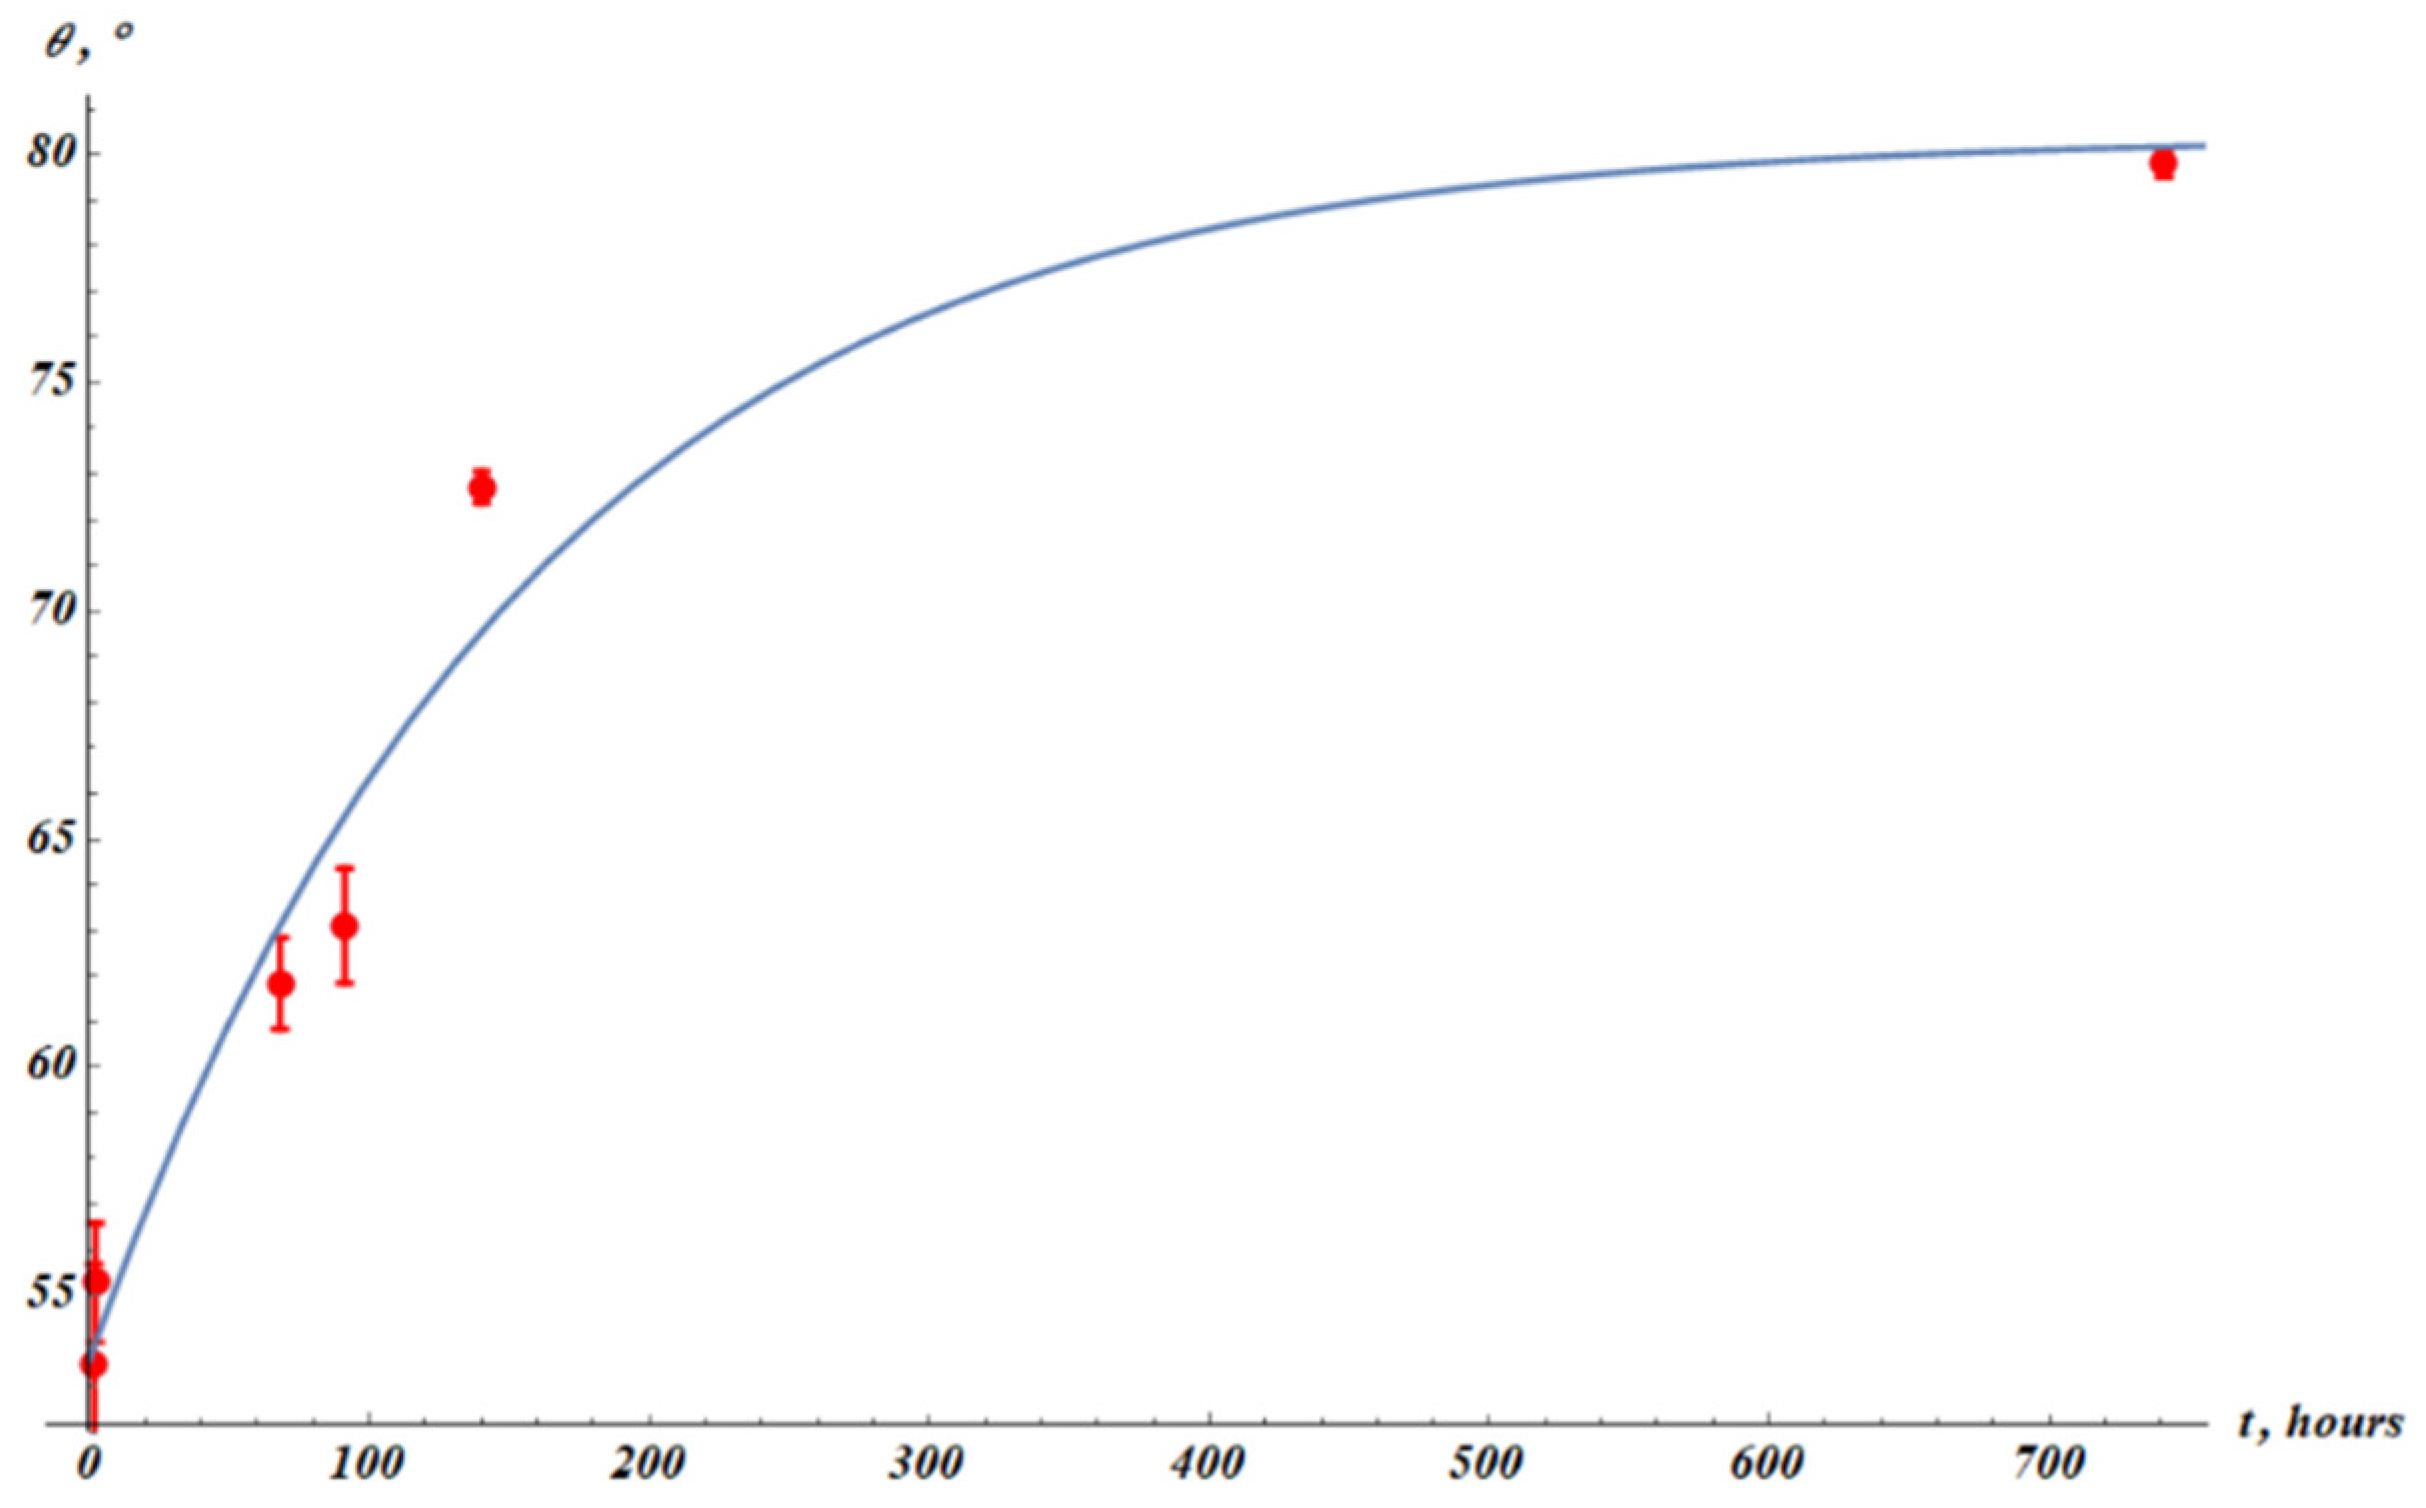
Now we observe the time dependence of the apparent water contact angle established for the plasma-treated PP. Plasma treatment decreased the apparent contact angle of PP, as depicted in Figure 9. The initial apparent contact angle was established as The apparent contact angle after the plasma treatment was .
The apparent contact angle was restored with time (this process is known as hydrophobic recovery [43,44,45,46,47]. Hydrophobic recovery is illustrated in Figure 10. The phenomenological fitting formula describing hydrophobic recovery (Eq. 6) is exponential:
where , , and are fitting parameters, and represents the measured apparent angle (Figure 10). The best-fit parameters are Squared Pearson correlation coefficient: .
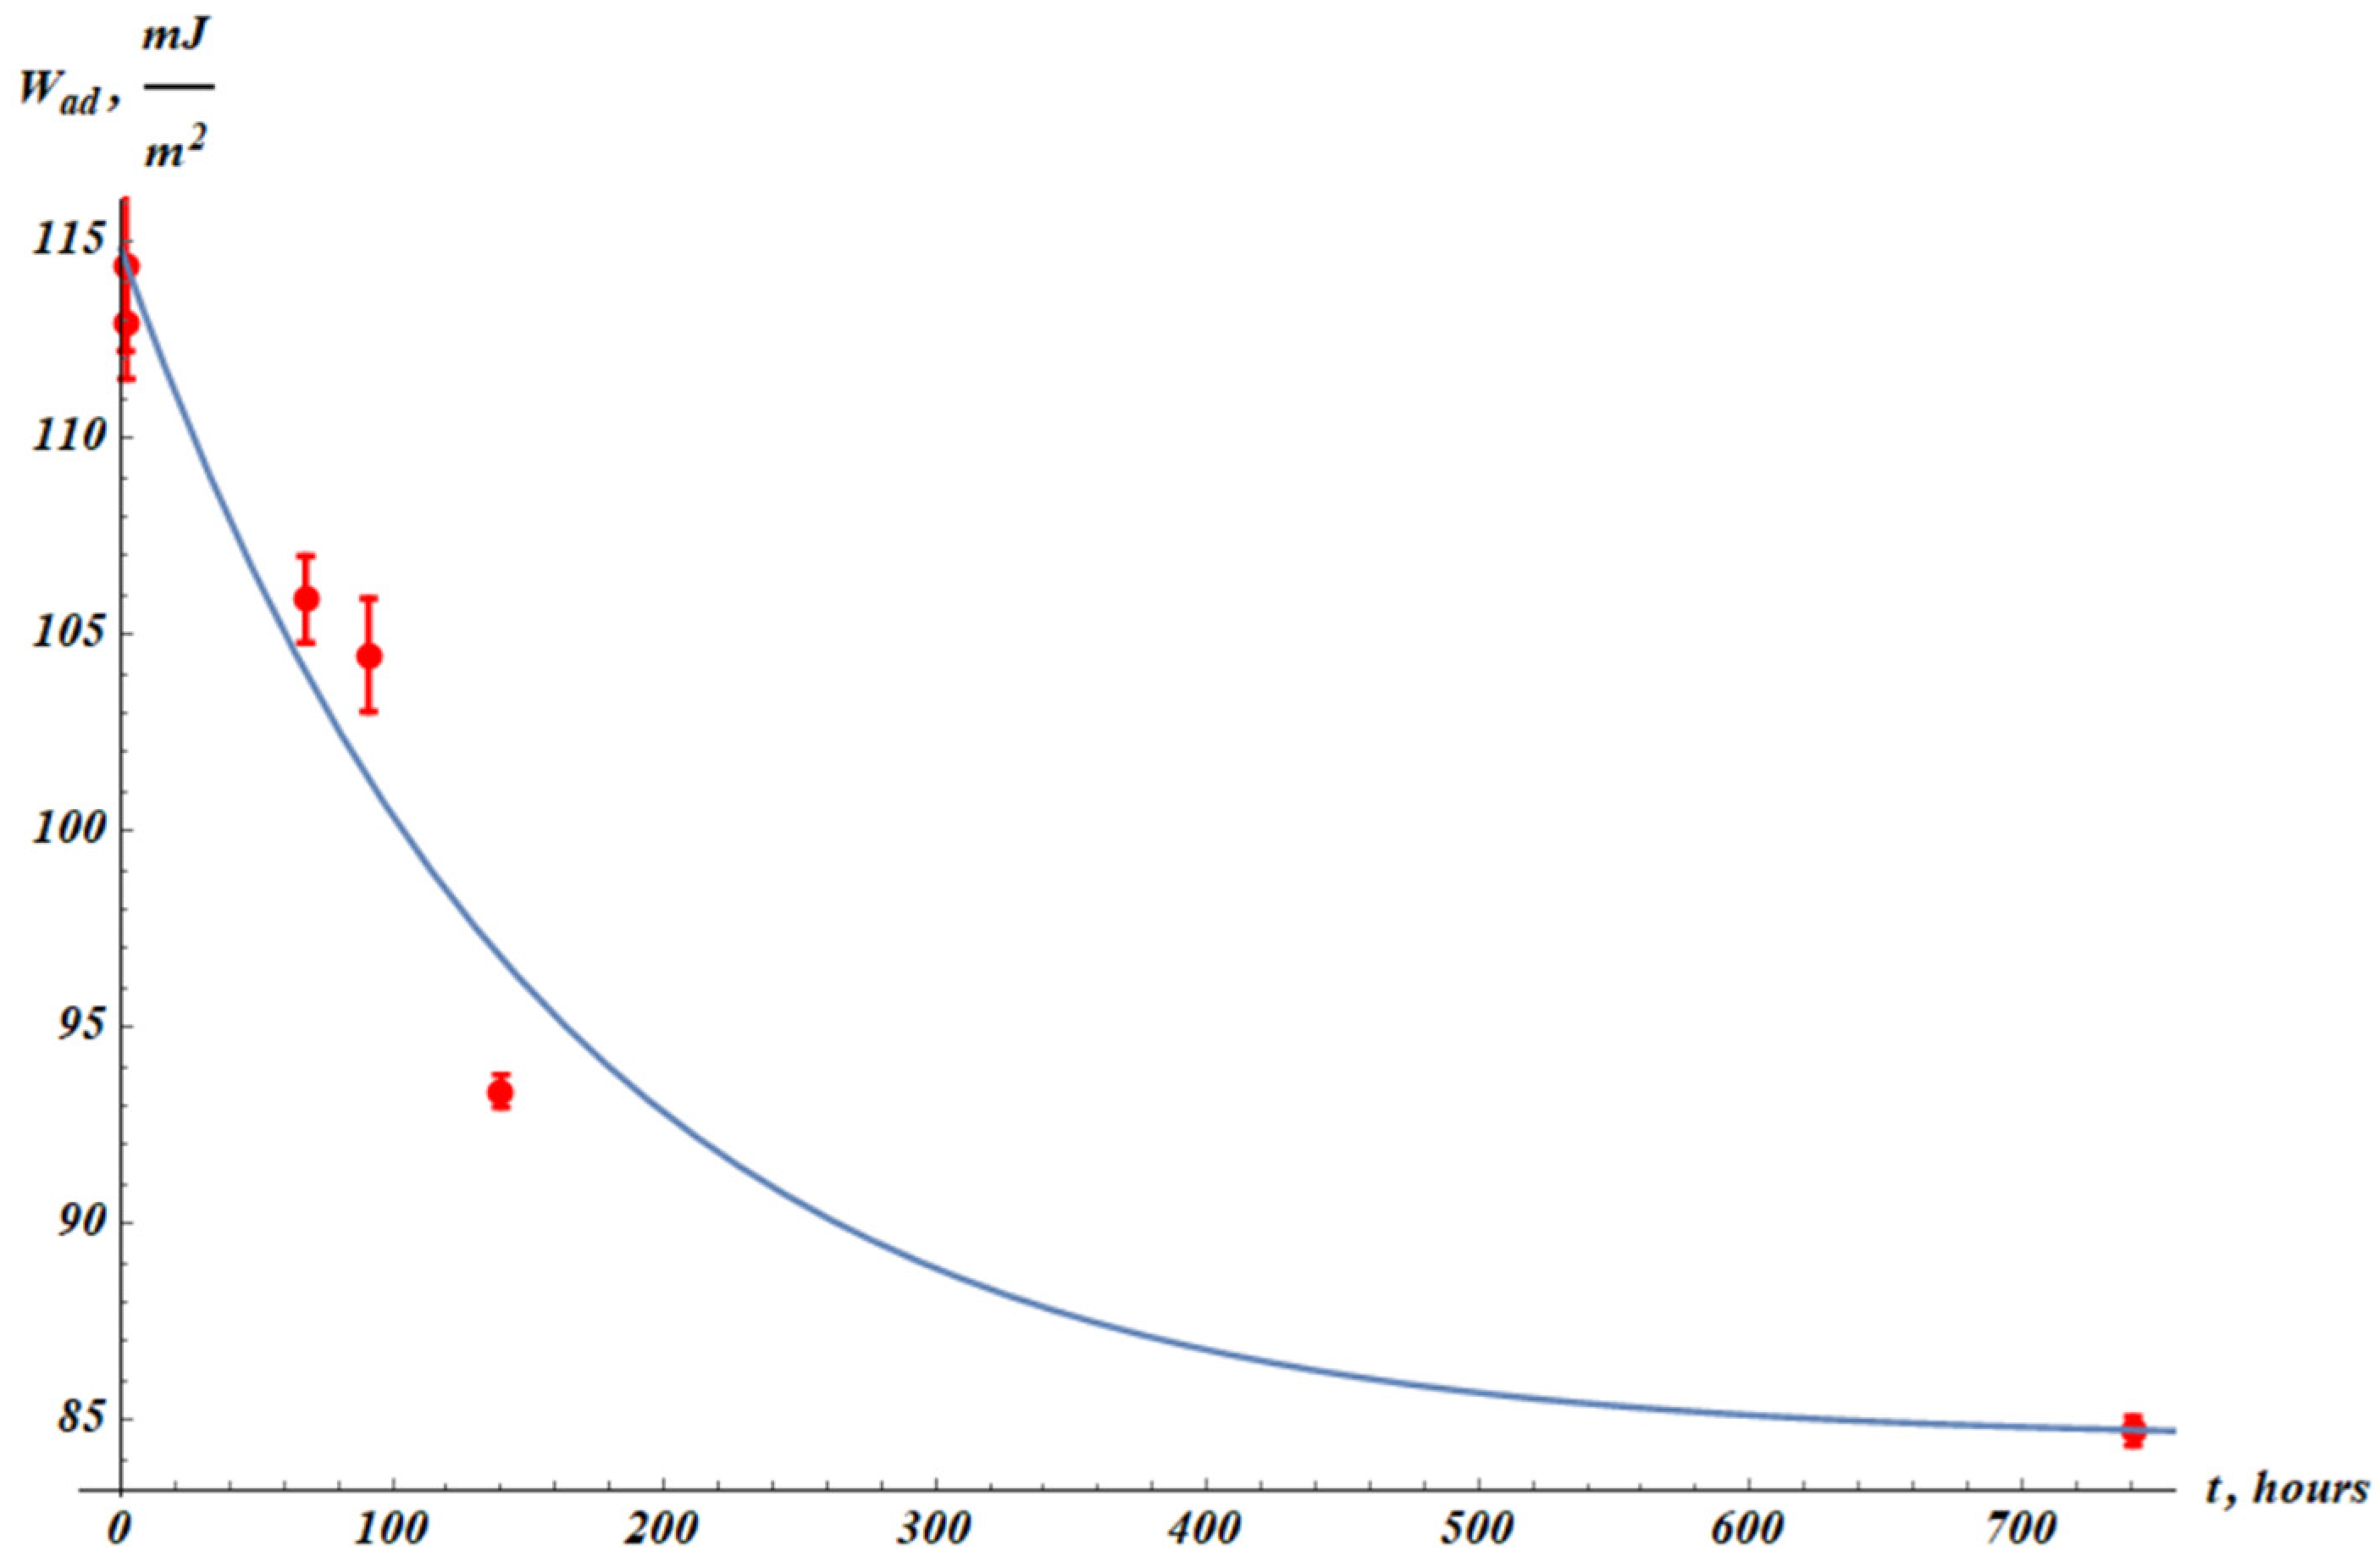
It was also instructive to establish the temporal dependence of the work of adhesion. The work of adhesion is defined as the work necessary for separation of a water droplet from a given surface [49]. The work of adhesion, denoted , is calculated according to the Young-Dupre equation:
where is water surface tension, and is the Young equilibrium contact angle [49]. The Young equilibrium contact angle established on the extruded polymer films is very close to the goniometrically established apparent contact angle, actually taken for the calculation of . The work of adhesion for the virgin PP samples is . The adhesion work of plasma-treated films is . The fitting formula describing hydrophobic recovery is exponential:
where , and are fitting parameters. Relaxation time is the same as for apparent contact angle. The best-fit parameters are Squared Pearson correlation coefficient:
Figure 11.
The work of adhesion () values established from apparent contact angle measurements (Figure 10). The blue fitting curve corresponds to Eq. 8 with fitting parameters: Squared Pearson correlation coefficient: .
Figure 11.
The work of adhesion () values established from apparent contact angle measurements (Figure 10). The blue fitting curve corresponds to Eq. 8 with fitting parameters: Squared Pearson correlation coefficient: .
4. Discussion
4.1.Main Experimental Findings and Their Interpretation
The main experimental findings of this study can be summarized as follows.
i) Cold air plasma treatment of PP films leads to substantial changes in their bulk properties. Maximal elongation, UTS, and toughness of the films are essentially increased by the plasma treatment. This is the most surprising and important result of our investigation, demonstrating potential for industrial applications of PP. The toughness of the films was markedly increased as a result of the plasma treatment, from to . This increase is due to the growth of both the maximal elongation and UTS of the plasma-treated samples. We do not explore in this paper the microscopic processes occurring in the plasma-treated PP films; however, it is reasonable to relate the improvement of mechanical properties of PP to the morphological transformations revealed in plasma-treated PP [50]. The virgin isotactic polypropylene is composed in bulk of smectic (partially ordered, liquid crystalline-like) and amorphous phases in the same proportions, and after the plasma treatment a more organized monoclinic α – phase was registered [50]. It was also reported that as a result of the nitrogen plasma treatment, two types of crystallization occurred, namely, smectic phase transformed into the α – phase and also amorphous phase transformed into the smectic phase [50]. This mechanism reasonably explains the changes in the bulk mechanical properties of the plasma-treated PP. Regrettably, the authors of Ref. [50] did not report the mechanical testing of plasma-treated PP, which is provided in our paper. Dramatic changes in bulk properties of solids due to their surface treatment are known in materials science as the Rehbinder effect [51,52,53,54].
Rehbinder’s effect (or Rehbinder phenomenon) refers to a reduction in the mechanical strength (or hardness) of a solid material due to adsorption of surface-active substances (surfactants, liquids, or gases) on its surface [51,52,53,54]. Adsorbed molecules modify the surface energy of a solid [51,52,53,54]. This influences dislocation motion and crack propagation – the key processes that control plastic deformation and fracture. In contrast, we report the “inverse Rehbinder effect”, whereby the plasma treatment improves the mechanical properties of PP. The physical mechanism of the “direct” and “inverse” Rehbinder effects are different, due to the fact that deformation of crystals and polymers is governed by very different physical laws [55].
ii) Plasma treatment of PP samples is followed by the temporal evolution of their mechanical and surface properties. The following hierarchy of the temporal scales is established: , where , and are the time scales of the change in apparent contact angle, elongation, toughness, ultimate tensile strength, and Young modulus respectively. This means that a diversity of processes is involved in the relaxation of the plasma-treated PP films. The slowest among them are the surface processes resulting in the time evolution of the apparent contact angle and adhesion energy.
Generally speaking, the relaxation of polymers may be described by Eq. 9:
where is the time-dependent physical parameter (Young modulus, toughness, etc.) and are the constant coefficients representing the contribution of the i-th relaxation process with the corresponding relaxation time [56,57,58]. Recovery of the relaxation spectrum from given experimental data is a non-trivial and challenging mathematical problem [58,59,60,61,62,63,64]. In a number of experimental situations, the relaxation spectrum of the polymer may be reasonably represented by the triad of relaxation times [64]. We restrict ourselves to this simplified model, considering the triad of relaxation times, namely: , and It is noteworthy that the longest of the relaxation times is related to the surface processes (i.e., hydrophobic recovery). We do not assert that the triad of relaxation times , and completely describes the relaxation spectrum of the plasma-treated PP; these are the relaxation time spans extracted from our experimental data.
iii) The stress-strain curves of the virgin and plasma-treated PP are well described by the twin-slope linear dependencies. The tangent modulus of the plasma-treated PP is increased by plasma treatment. The tangent modulus of the plasma-treated samples evolves with time. The characteristic time scale of the tangent modulus change was established as , close to that of the maximal elongation.
iv) There are no changes in the FTIR transmission spectra of plasma-treated PP films when compared to virgin ones (see Appendix A). More sensitive experimental techniques should be involved for revealing changes in the morphology and chemical composition of plasma-treated PP.
4.2. Trends for Future Investigations
In our future investigations we plan:
i) To investigate the changes in the chemical structure of the plasma-treated PP films.
ii) To investigate the morphological changes in the plasma-treated PP films.
iii) To study the cyclical plasma treatment of the PP films.
iv) To study the possibilities of controlling the recovery of surface and bulk properties of PP films. In particular, immersion of the plasma-treated films in polar liquids may influence this recovery.
v) To study the impact of different gaseous plasmas (e.g., oxygen, nitrogen) on the surface and bulk properties of PP films.
5. Conclusions
We conclude that both surface and bulk properties of PP are modified by the cold air plasma treatment. In our experiments, PP films were exposed to the radiofrequency (RF) air plasma. The plasma power was 11 W, plasma frequency was about 13 MHz, the average pressure in the plasma chamber was approximately 1 Torr (133 Pa). Essential changes in Young modulus, tangent modulus, maximal elongation, ultimate tensile strength (UTS), toughness, apparent contact angle, and adhesion energy of the samples were observed in our experiments. The post-plasma-treatment evolution of aforementioned bulk and surface properties of PP films were investigated. The UTS increased as a result of cold plasma treatment from to . The toughness of the films was markedly increased as a result of the plasma treatment, from to . This increase is due to the growth of both the maximal elongation and UTS of the plasma-treated samples. These results are important for the numerous applications of PP films, including their industrial applications in composite laminates [65]. It is noteworthy that, in contrast, X-rays, e-beam, and gamma irradiation did not change the bulk properties of PP films [66]. Plasma treatment modifies only nanometer-thick external layer of PP films, increasing the surface energy of the films [25,26,27,28]. This modification results in dramatic changes in the bulk properties of PP films. Thus, we observed the inverse Rehbinder effect, i.e., surface modification improved the bulk properties of the PP films, such as toughness and UTS. Usually, the surface modification leads to the reduction in the hardness and ductility of crystalline materials by a surfactant film. In our experiments, surface treatment of PP films resulted in the improvement of their bulk mechanical properties. That is why we designate the observed phenomenon the inverse Rehbinder effect. We relate the improvement of mechanical properties of PP to the morphological transformations in the plasma-treated PP films [50]. Bulk and surface properties of the plasma-treated PP films evolve with time. The following hierarchy of the temporal scales related to the studied relaxation processes is established: , where , , , , and are the time scales of change in apparent contact angle (hydrophobic recovery), elongation, toughness, ultimate tensile strength, and Young modulus respectively. The longest of the relaxation times is related to the surface processes, i.e., hydrophobic recovery. In our future research we plan to investigate the chemical modification and morphological changes in the plasma-treated PP films.
Author Contributions
Conceptualization, E. B. and A.G.; methodology, E.B.; S.S.; S.G.; A. G. software, A. G. validation, A. G. formal analysis, A.G; E. B.; investigation, A.G.; E. B.; S.S.; S. G.
Funding
This research received no external funding.
Institutional Review Board Statement
Not applicable.
Informed Consent Statement
Not applicable.
Data Availability Statement
The original contributions presented in this study are included in the article. Further inquiries can be directed to the corresponding author.
Conflicts of Interest
The authors declare no conflicts of interest.
Abbreviations
The following abbreviations are used in this manuscript:
FTIR – Fourier-Transform Infrared spectroscopy
RF – Radio frequency
PP – Polypropylene.
UTS – Ultimate tensile strength.
Appendix A
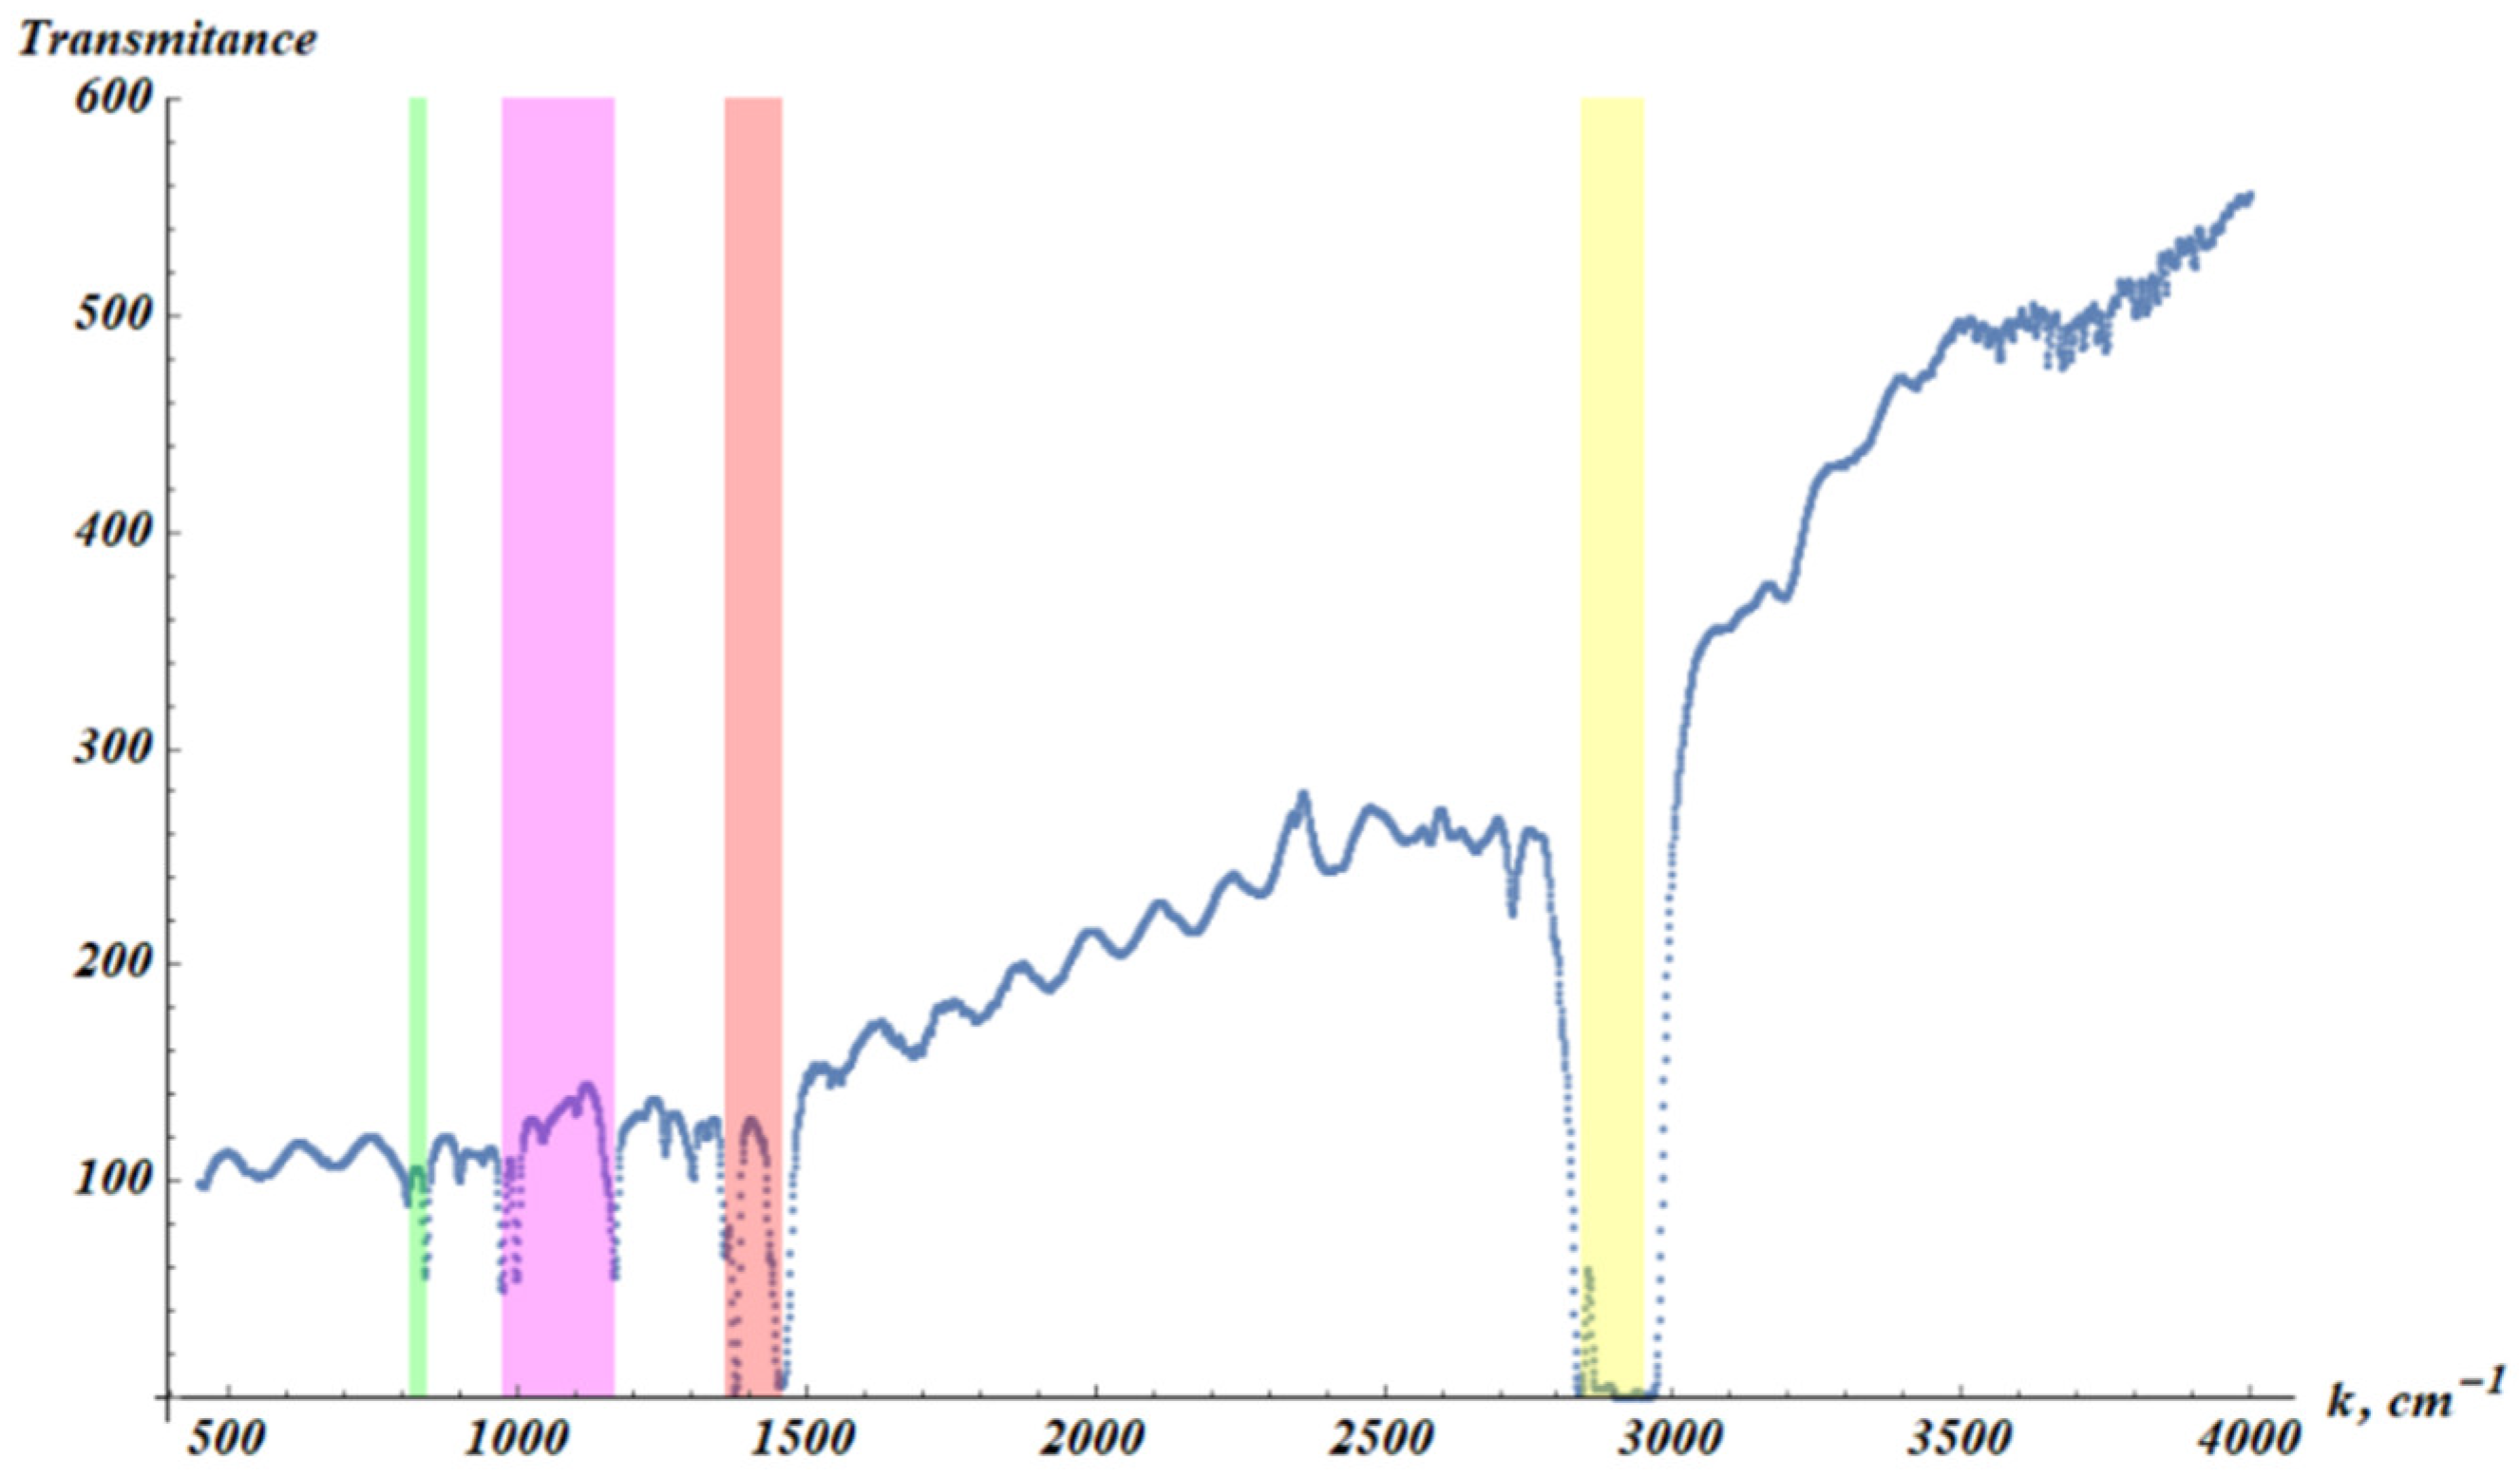
The transmittance spectrum of PP was measured with the Mid-IR FTIR spectrometer JASCO FT/IR-4600 at ambient conditions. The distinctive PP fingerprint lines can be seen in Figure A1, depicting the transmittance spectrum of PP films.
- Yellow zone: stretching vibration of CH2 can be observed around 2930 cm-1 and around 2850 cm-1. These lines correspond to asymmetric and symmetric stretching vibration of CH2. Antisymmetric and symmetric stretching vibration of CH3 can be recognized around 2960 cm-1 and 2870 cm-1, respectively.
- Red zone: symmetric in-plane vibration of C–H (–CH3) at 1455 cm-1 and the prominent peak around 1380 cm-1, which relates to CH3 asymmetric bending vibration seen in PP.
- Magenta zone: C-C deformation lines around 997–1000 cm-1 and vibrations of CH3 and CH2 groups at 970 cm-1.
- Green zone: C-C and C-H deformation lines around 810 cm-1 and 840 cm-1, respectively
Figure A1.
The polypropylene transmittance spectrum. The ordinate axis is the transmittance of the sample presented in arbitrary units.
Figure A1.
The polypropylene transmittance spectrum. The ordinate axis is the transmittance of the sample presented in arbitrary units.
The transmittance FTIR spectrum of the plasma-treated PP was identical to that of virgin PP.
Appendix B
Figure A2.
Yield strain () values (red points) established from experimental stress-strain curves (see Figure 2). The point “no_plasma” corresponds to the samples not treated with plasma. The next point (without label) corresponds to measurements immediately after plasma treatment.
Figure A2.
Yield strain () values (red points) established from experimental stress-strain curves (see Figure 2). The point “no_plasma” corresponds to the samples not treated with plasma. The next point (without label) corresponds to measurements immediately after plasma treatment.
References
- Calhoun, A. Polypropylene. In Multilayer Flexible Packaging; Elsevier, 2016; pp. 35–45.
- Polypropylene Handbook; Karger-Kocsis, J., Bárány, T., Eds.; Springer International Publishing: Cham, 2019; ISBN 978-3-030-12902-6.
- Tripathi, D. Practical Guide to Polypropylene; Rapra practical guide series; RAPRA Technology, 2002; ISBN 9781859572825.
- van der Ven, S. Polypropylene and Other Polyolefins. Polymerization and Characterization; Elsevier Science: Amsterdam, 1990; ISBN 0444886907.
- Tordjeman, Ph.; Robert, C.; Marin, G.; Gerard, P. The Effect of α, β Crystalline Structure on the Mechanical Properties of Polypropylene. European Phys. J. E 2001, 4, 459–465. [CrossRef]
- van Krevelen, D.W.; Nijenhuis, K. Properties of Polymers: Their Correlation with Chemical Structure; Their Numerical Estimation and Prediction from Additive Group Contributions; 4th ed.; Elsevier Science, 2009; ISBN 9780080915104.
- Brewis, D.M.; Briggs, D. Adhesion to Polyethylene and Polypropylene. Polymer 1981, 22, 7–16. [CrossRef]
- Aydemir, C.; Altay, B.N.; Akyol, M. Surface Analysis of Polymer Films for Wettability and Ink Adhesion. Color Res. Appl. 2021, 46, 489–499. [CrossRef]
- Tao, G.; Gong, A.; Lu, J.; Sue, H.-J.; Bergbreiter, D.E. Surface Functionalized Polypropylene: Synthesis, Characterization, and Adhesion Properties. Macromolecules 2001, 34, 7672–7679. [CrossRef]
- Bhat, N. V.; Upadhyay, D.J. Plasma-induced Surface Modification and Adhesion Enhancement of Polypropylene Surface. J. Appl. Polym. Sci. 2002, 86, 925–936. [CrossRef]
- Carrino, L.; Moroni, G.; Polini, W. Cold Plasma Treatment of Polypropylene Surface: A Study on Wettability and Adhesion. J. Mater. Process. Technol. 2002, 121, 373–382. [CrossRef]
- Sorrentino, L.; Carrino, L.; Napolitano, G. Oxygen Cold Plasma Treatment on Polypropylene: Influence of Process Parameters on Surface Wettability. Surface Eng. 2007, 23, 247–252. [CrossRef]
- Carrino, L.; Polini, W.; Sorrentino, L. Ageing Time of Wettability on Polypropylene Surfaces Processed by Cold Plasma. J. Mater. Process. Technol. 2004, 153–154, 519–525. [CrossRef]
- Zeiler, T.; Kellermann, S.; Münstedt, H. Different Surface Treatments to Improve the Adhesion of Polypropylene. J. Adhes. Sci. Technol. 2000, 14, 619–634. [CrossRef]
- Strobel, M.; Jones, V.; Lyons, C.S.; Ulsh, M.; Kushner, M.J.; Dorai, R.; Branch, M.C. A Comparison of Corona-Treated and Flame-Treated Polypropylene Films. Plasmas Polym 2003, 8, 61–95. [CrossRef]
- Walzak, M.J.; Flynn, S.; Foerch, R.; Hill, J.M.; Karbashewski, E.; Lin, A.; Strobel, M. UV and Ozone Treatment of Polypropylene and Poly(Ethylene Terephthalate). J. Adhes. Sci. Technol. 1995, 9, 1229–1248. [CrossRef]
- Sheng, E.; Sutherland, I.; Brewis, D.M.; Heath, R.J. Effects of the Chromic Acid Etching on Propylene Polymer Surfaces. J. Adhes. Sci. Technol. 1995, 9, 47–60. [CrossRef]
- Akishev, Y.; Grushin, M.; Dyatko, N.; Kochetov, I.; Napartovich, A.; Trushkin, N.; Minh Duc, T.; Descours, S. Studies on Cold Plasma–Polymer Surface Interaction by Example of PP- and PET-Films. J. Phys. D Appl. Phys. 2008, 41, 235203. [CrossRef]
- Bertin, M.; Leitao, E.M.; Bickerton, S.; Verbeek, C.J.R. A Review of Polymer Surface Modification by Cold Plasmas toward Bulk Functionalization. Plasma Processes and Polymers 2024, 21. [CrossRef]
- Kostov, K.G.; Nishime, T.M.C.; Castro, A.H.R.; Toth, A.; Hein, L.R.O. Surface Modification of Polymeric Materials by Cold Atmospheric Plasma Jet. Appl. Surf. Sci.
- 2014, 314, 367–375. [CrossRef]
- Grace, J.M.; Gerenser, L.J. Plasma Treatment of Polymers. J. Dispers. Sci. Technol. 2003, 24, 305–341. [CrossRef]
- Strobel, M.; Lyons, C.S.; Mittal, K.L. Plasma Surface Modification of Polymers: Relevance to Adhesion. VSP, Netherlands, Utrecht, 1994.
- Atmospheric Pressure Plasma Treatment of Polymers; Thomas, M., Mittal, K.L., Eds.; Wiley, 2013; ISBN 9781118596210.
- Yasuda, H.; Plasma polymerization for protective coatings and composite membranes, J. Membrane Sci. 1984, 18, 273-284.
- France, R.M.; Short, R.D. Plasma Treatment of Polymers Effects of Energy Transfer from an Argon Plasma on the Surface Chemistry of Poly(Styrene), Low Density Poly(Ethylene), Poly(Propylene) and Poly(Ethylene Terephthalate, Faraday Transactions 1997, 93, 3173–3178. [CrossRef]
- France, R.M.; Short, R.D. Plasma Treatment of Polymers: The Effects of Energy Transfer from an Argon Plasma on the Surface Chemistry of Polystyrene, and Polypropylene. A High-Energy Resolution X-Ray Photoelectron Spectroscopy Study. Langmuir 1998, 14, 4827–4835. [CrossRef]
- Wild, S.; Kesmodel, L.L. High Resolution Electron Energy Loss Spectroscopy Investigation of Plasma-Modified Polystyrene Surfaces. Journal of Vacuum Science & Technology A: Vacuum, Surfaces, and Films 2001, 19, 856–860. [CrossRef]
- Gaiser, S.; Schütz, U.; Hegemann, D. Top-down Approach to Attach Liquid Polyethylene Glycol to Solid Surfaces by Plasma Interaction. Plasma Processes & Polymers 2020, 17. [CrossRef]
- Bormashenko, E.; Whyman, G.; Multanen, V.; Shulzinger, E.; Chaniel, G. Physical Mechanisms of Interaction of Cold Plasma with Polymer Surfaces. J Colloid Interface Sci 2015, 448, 175–179. [CrossRef]
- Shapira, Y.; Chaniel, G.; Bormashenko, E. Surface Charging by the Cold Plasma Discharge of Lentil and Pepper Seeds in Comparison with Polymers. Colloids Surf. B 2018, 172, 541–544. [CrossRef]
- Lehocký, M.; Drnovská, H.; Lapčı́ková, B.; Barros-Timmons, A.M.; Trindade, T.; Zembala, M.; Lapčı́k, L. Plasma Surface Modification of Polyethylene. Colloids Surf A Physicochem Eng Asp 2003, 222, 125–131. [CrossRef]
- Preedy, E.C.; Brousseau, E.; Evans, S.L.; Perni, S.; Prokopovich, P. Adhesive Forces and Surface Properties of Cold Gas Plasma Treated UHMWPE. Colloids Surf. A 2014, 460, 83–89. [CrossRef]
- Hegemann, D.; Brunner, H.; Oehr, C. Plasma Treatment of Polymers for Surface and Adhesion Improvement. Nucl Instrum Methods Phys Res B 2003, 208, 281–286. [CrossRef]
- Correia, D.M.; Nunes-Pereira, J.; Alikin, D.; Kholkin, A.L.; Carabineiro, S.A.C.; Rebouta, L.; Rodrigues, M.S.; Vaz, F.; Costa, C.M.; Lanceros-Méndez, S. Surface Wettability Modification of Poly(Vinylidene Fluoride) and Copolymer Films and Membranes by Plasma Treatment. Polymer (Guildf) 2019, 169, 138–147. [CrossRef]
- Balu, B.; Breedveld, V.; Hess, D.W. Fabrication of “Roll-off” and “Sticky” Superhydrophobic Cellulose Surfaces via Plasma Processing. Langmuir 2008, 24, 4785–4790. [CrossRef]
- Bormashenko, E.; Eldar, B.; Chaniel, G.; Multanen, V.; Whyman, G. Influence of Cold Radiofrequency Air and Nitrogen Plasmas Treatment on Wetting of Polypropylene by the Liquid Epoxy Resin. Colloids Surf. A 2016, 506, 445–449. [CrossRef]
- Kamińska, A.; Kaczmarek, H.; Kowalonek, J. The Influence of Side Groups and Polarity of Polymers on the Kind and Effectiveness of Their Surface Modification by Air Plasma Action. Eur. Polym. J. 2002, 38, 1915–1919. [CrossRef]
- Tan, S.H.; Nguyen, N.-T.; Chua, Y.C.; Kang, T.G. Oxygen Plasma Treatment for Reducing Hydrophobicity of a Sealed Polydimethylsiloxane Microchannel. Biomicrofluidics 2010, 4. [CrossRef]
- Foerch, R.; McIntyre, N.S.; Hunter, D.H. Oxidation of Polyethylene Surfaces by Remote Plasma Discharge: A Comparison Study with Alternative Oxidation Methods. J Polym Sci A 1990, 28, 193–204. [CrossRef]
- Ladner, Y.; D’Orlyé, F.; Perréard, C.; Da Silva, B.; Guyon, C.; Tatoulian, M.; Griveau, S.; Bedioui, F.; Varenne, A. Surface Functionalization by Plasma Treatment and Click Chemistry of a New Family of Fluorinated Polymeric Materials for Microfluidic Chips. Plasma Processes & Polymers 2014, 11, 518–523. [CrossRef]
- Gomathi, N.; Neogi, S. Surface Modification of Polypropylene Using Argon Plasma: Statistical Optimization of the Process Variables. Appl. Surf. Sci. 2009, 255, 7590–7600. [CrossRef]
- Ciardiello, R.; D’Angelo, D.; Cagna, L.; Croce, A.; Paolino, D.S. Effects of Plasma Treatments of Polypropylene Adhesive Joints Used in the Automotive Industry. Proc. Inst. Mech. Eng. C J Mech. Eng. Sci, 2022, 236, 6204–6218. [CrossRef]
- Bormashenko, E.; Chaniel, G.; Grynyov, R. Towards Understanding Hydrophobic Recovery of Plasma Treated Polymers: Storing in High Polarity Liquids Suppresses Hydrophobic Recovery. Appl. Surf. Sci. 2013, 273, 549–553. [CrossRef]
- Hegemann, D.; Lorusso, E.; Butron-Garcia, M.-I.; Blanchard, N.E.; Rupper, P.; Favia, P.; Heuberger, M.; Vandenbossche, M. Suppression of Hydrophobic Recovery by Plasma Polymer Films with Vertical Chemical Gradients. Langmuir 2016, 32, 651–654. [CrossRef]
- Mortazavi, M.; Nosonovsky, M. A Model for Diffusion-Driven Hydrophobic Recovery in Plasma Treated Polymers. Appl. Surf. Sci. 2012, 258, 6876–6883. [CrossRef]
- Novák, I.; Florián, Š. Investigation of Long-Term Hydrophobic Recovery of Plasma Modified Polypropylene. J. Mater. Sci. 2004, 39, 2033–2036. [CrossRef]
- Vámos, C.; Füredi, M.; Hórvölgyi, Z.; Krafcsik, O.; Kiss, G.; Bárány, T.; Marosfői, B.B. Analysis of Time-Dependent Hydrophobic Recovery on Plasma-Treated Superhydrophobic Polypropylene Using XPS and Wettability Measurements. Sci. Rep. 2024, 14, 23715. [CrossRef]
- Tompkins, B.D.; Fisher, E.R. Evaluation of Polymer Hydrophobic Recovery Behavior Following H 2 O Plasma Processing. J. Appl. Polym. Sci. 2015, 132. [CrossRef]
- Bormashenko, E. Wetting of Real Surfaces; de Gruyter, Berlin, Ge. 2013; ISBN 9783110262926.
- Poncin-Epaillard, F.; Brosse, J.C.; Falher, T. Cold Plasma Treatment: Surface or Bulk Modification of Polymer Films? Macromolecules 1997, 30, 4415–4420. [CrossRef]
- Malkin, A.I.; Popov, D.A. The Rehbinder Effect in Fracturing of Metals and Rocks. Physics of Metals and Metallography 2022, 123, 1234–1244. [CrossRef]
- Riabokon, E.; Turbakov, M.; Kozhevnikov, E.; Poplygin, V.; Jing, H. The Rehbinder Effect in Testing Saturated Carbonate Geomaterials. Materials 2023, 16, 3024. [CrossRef]
- Rehbinder, P.A.; Lichtman, V. Effect of Surface Active Media on Strain and Rupture in Solids. In Proceedings of the Proceedings of the Second International Congress of Surface Activity; 1957; Vol. 3, pp. 563–580.
- Rehbinder, P.A. On the Influence of Changes in the Surface Energy on the Cleavage, Hardness and Other Properties of Crystals. P. A. Rehbinder. Selected Transactions. 1979, 2, 1–142.
- Callister Jr., W. D.; Rethwisch, D.G. Materials Science and Engineering. An Introduction.; 6th ed.; J. Wiley & Sons,: New York, USA, 2003.
- Bartenev, G.M.; Zelenev, Yu. V. Mechanical Relaxation Processes in Polymers. Polymer Mechanics 1972, 5, 25–42. [CrossRef]
- Bartenev, G.M.; Shelkovnikova, L.A.; Akopyan, L.A. Relaxation Spectra in Polymers. Polymer Mechanics 1975, 9, 133–136. [CrossRef]
- Stankiewicz, A. Two-Level Scheme for Identification of the Relaxation Time Spectrum Using Stress Relaxation Test Data with the Optimal Choice of the Time-Scale Factor. Materials 2023, 16, 3565. [CrossRef]
- Malkin, A.Ya.; Vasilyev, G.B.; Andrianov, A. V. On Continuous Relaxation Spectrum. Method of Calculation. Polymer Science Series A 2010, 52, 1137–1141. [CrossRef]
- Malkin, A.Ya. The Use of a Continuous Relaxation Spectrum for Describing the Viscoelastic Properties of Polymers. Polymer Science Series A 2006, 48, 39–45. [CrossRef]
- Stankiewicz, A.; Bojanowska, M.; Drozd, P. On Recovery of a Non-Negative Relaxation Spectrum Model from the Stress Relaxation Test Data. Polymers (Basel) 2023, 15, 3464. [CrossRef]
- Stankiewicz, A. Robust Recovery of Optimally Smoothed Polymer Relaxation Spectrum from Stress Relaxation Test Measurements. Polymers (Basel) 2024, 16, 2300. [CrossRef]
- Stankiewicz, A. Direct Identification of the Continuous Relaxation Time and Frequency Spectra of Viscoelastic Materials. Materials 2024, 17, 4870. [CrossRef]
- Pogreb, R.; Loew, R.; Bormashenko, E.; Whyman, G.; Multanen, V.; Shulzinger, E.; Abramovich, A.; Rozban, D.; Shulzinger, A.; Zussman, E. Relaxation Spectra of Polymers and Phenomena of Electrical and Hydrophobic Recovery: Interplay between Bulk and Surface Properties of Polymers. J. Polym. Sci. B Polym. Phys. 2017, 55, 198–205. [CrossRef]
- Folkes, M.J.; Hardwick, S.T. The Mechanical Properties of Glass/Polypropylene Multilayer Laminates. J. Mater. Sci. 1990, 25, 2598–2606. [CrossRef]
- Krieguer, B.; Marque, S.R.A.; Girard, F.; Dupuy, N.; Ludwig, N.; Kuntz, F.; Dorey, S. Investigation of X-Rays, E-Beam, and Gamma Irradiation on Chemical, Thermal, and Mechanical Properties of Polypropylene-Derivatives. Macromol. Chem. Phys. 2025. [CrossRef]
Figure 1.
Tensile Testing Machine UTM-65A. Test stroke: 650 mm (not including grips); resolution: 1/250000; force accuracy: <±0.5%.
Figure 1.
Tensile Testing Machine UTM-65A. Test stroke: 650 mm (not including grips); resolution: 1/250000; force accuracy: <±0.5%.
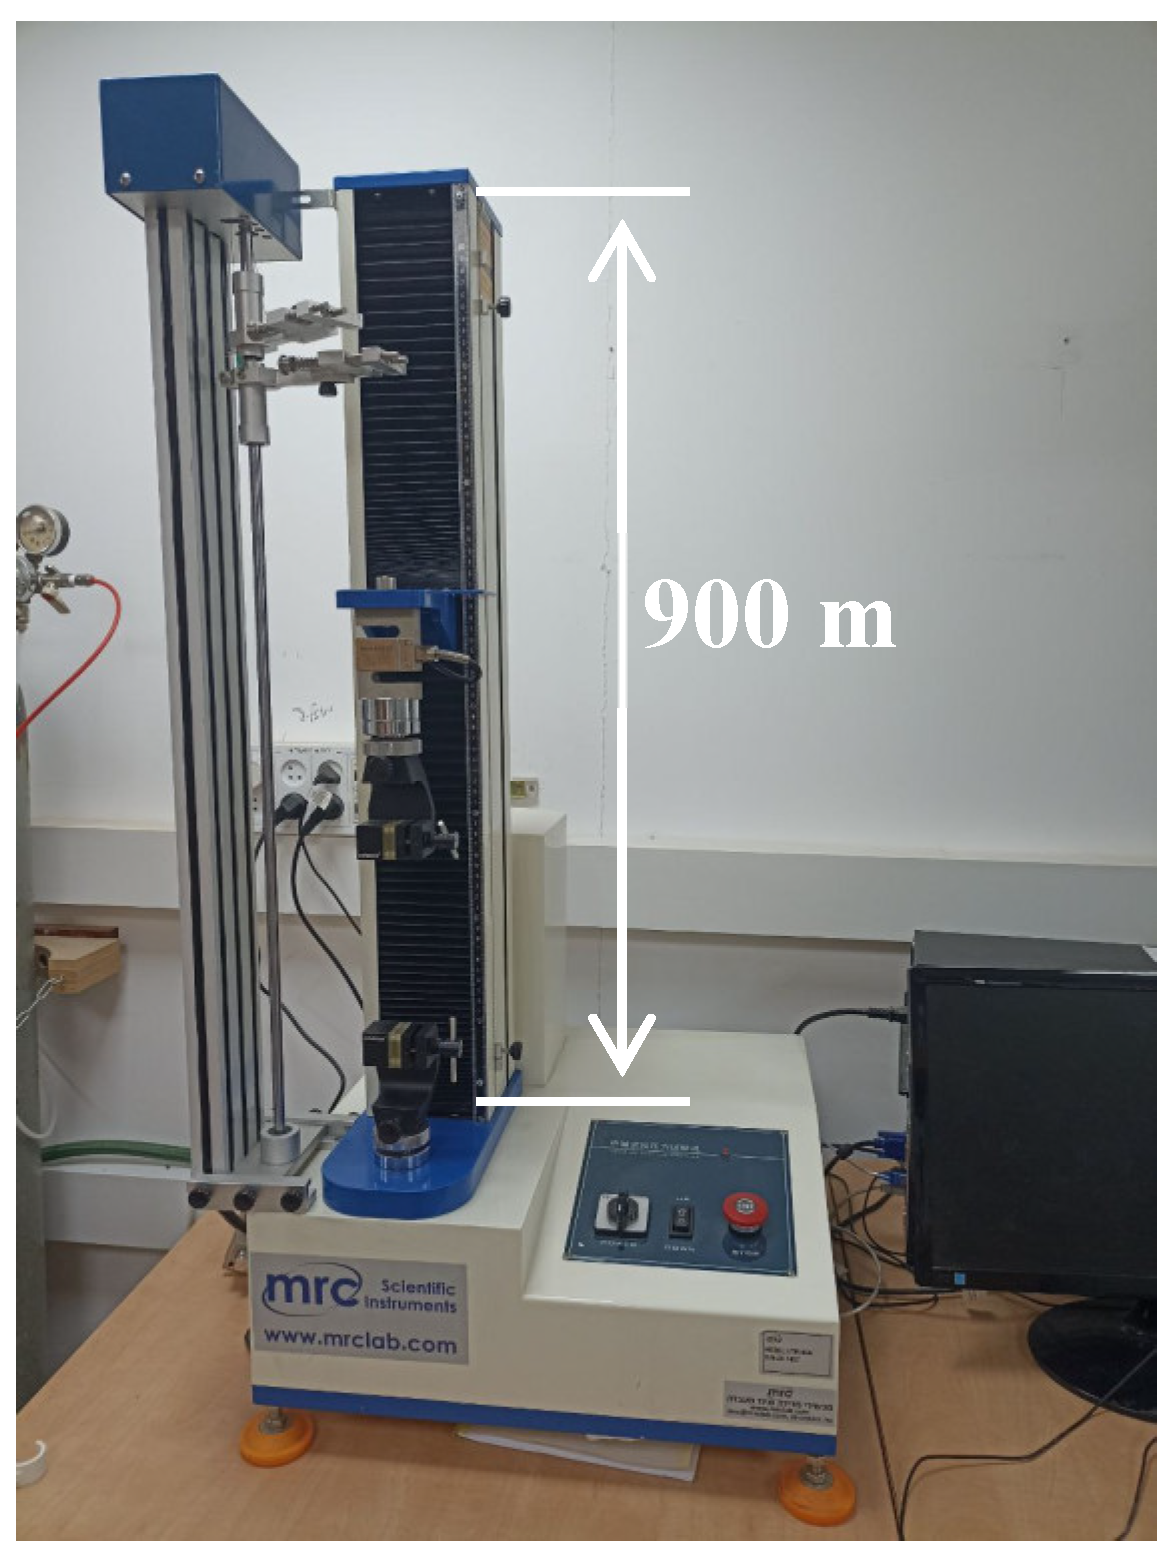
Figure 2.
Stress (σ)-strain (ε) experimental dependencies for non-plasma-treated samples (red curves) and for samples tested right after plasma treatment (blue curves). The inset depicts the initial stage of the deformation.
Figure 2.
Stress (σ)-strain (ε) experimental dependencies for non-plasma-treated samples (red curves) and for samples tested right after plasma treatment (blue curves). The inset depicts the initial stage of the deformation.
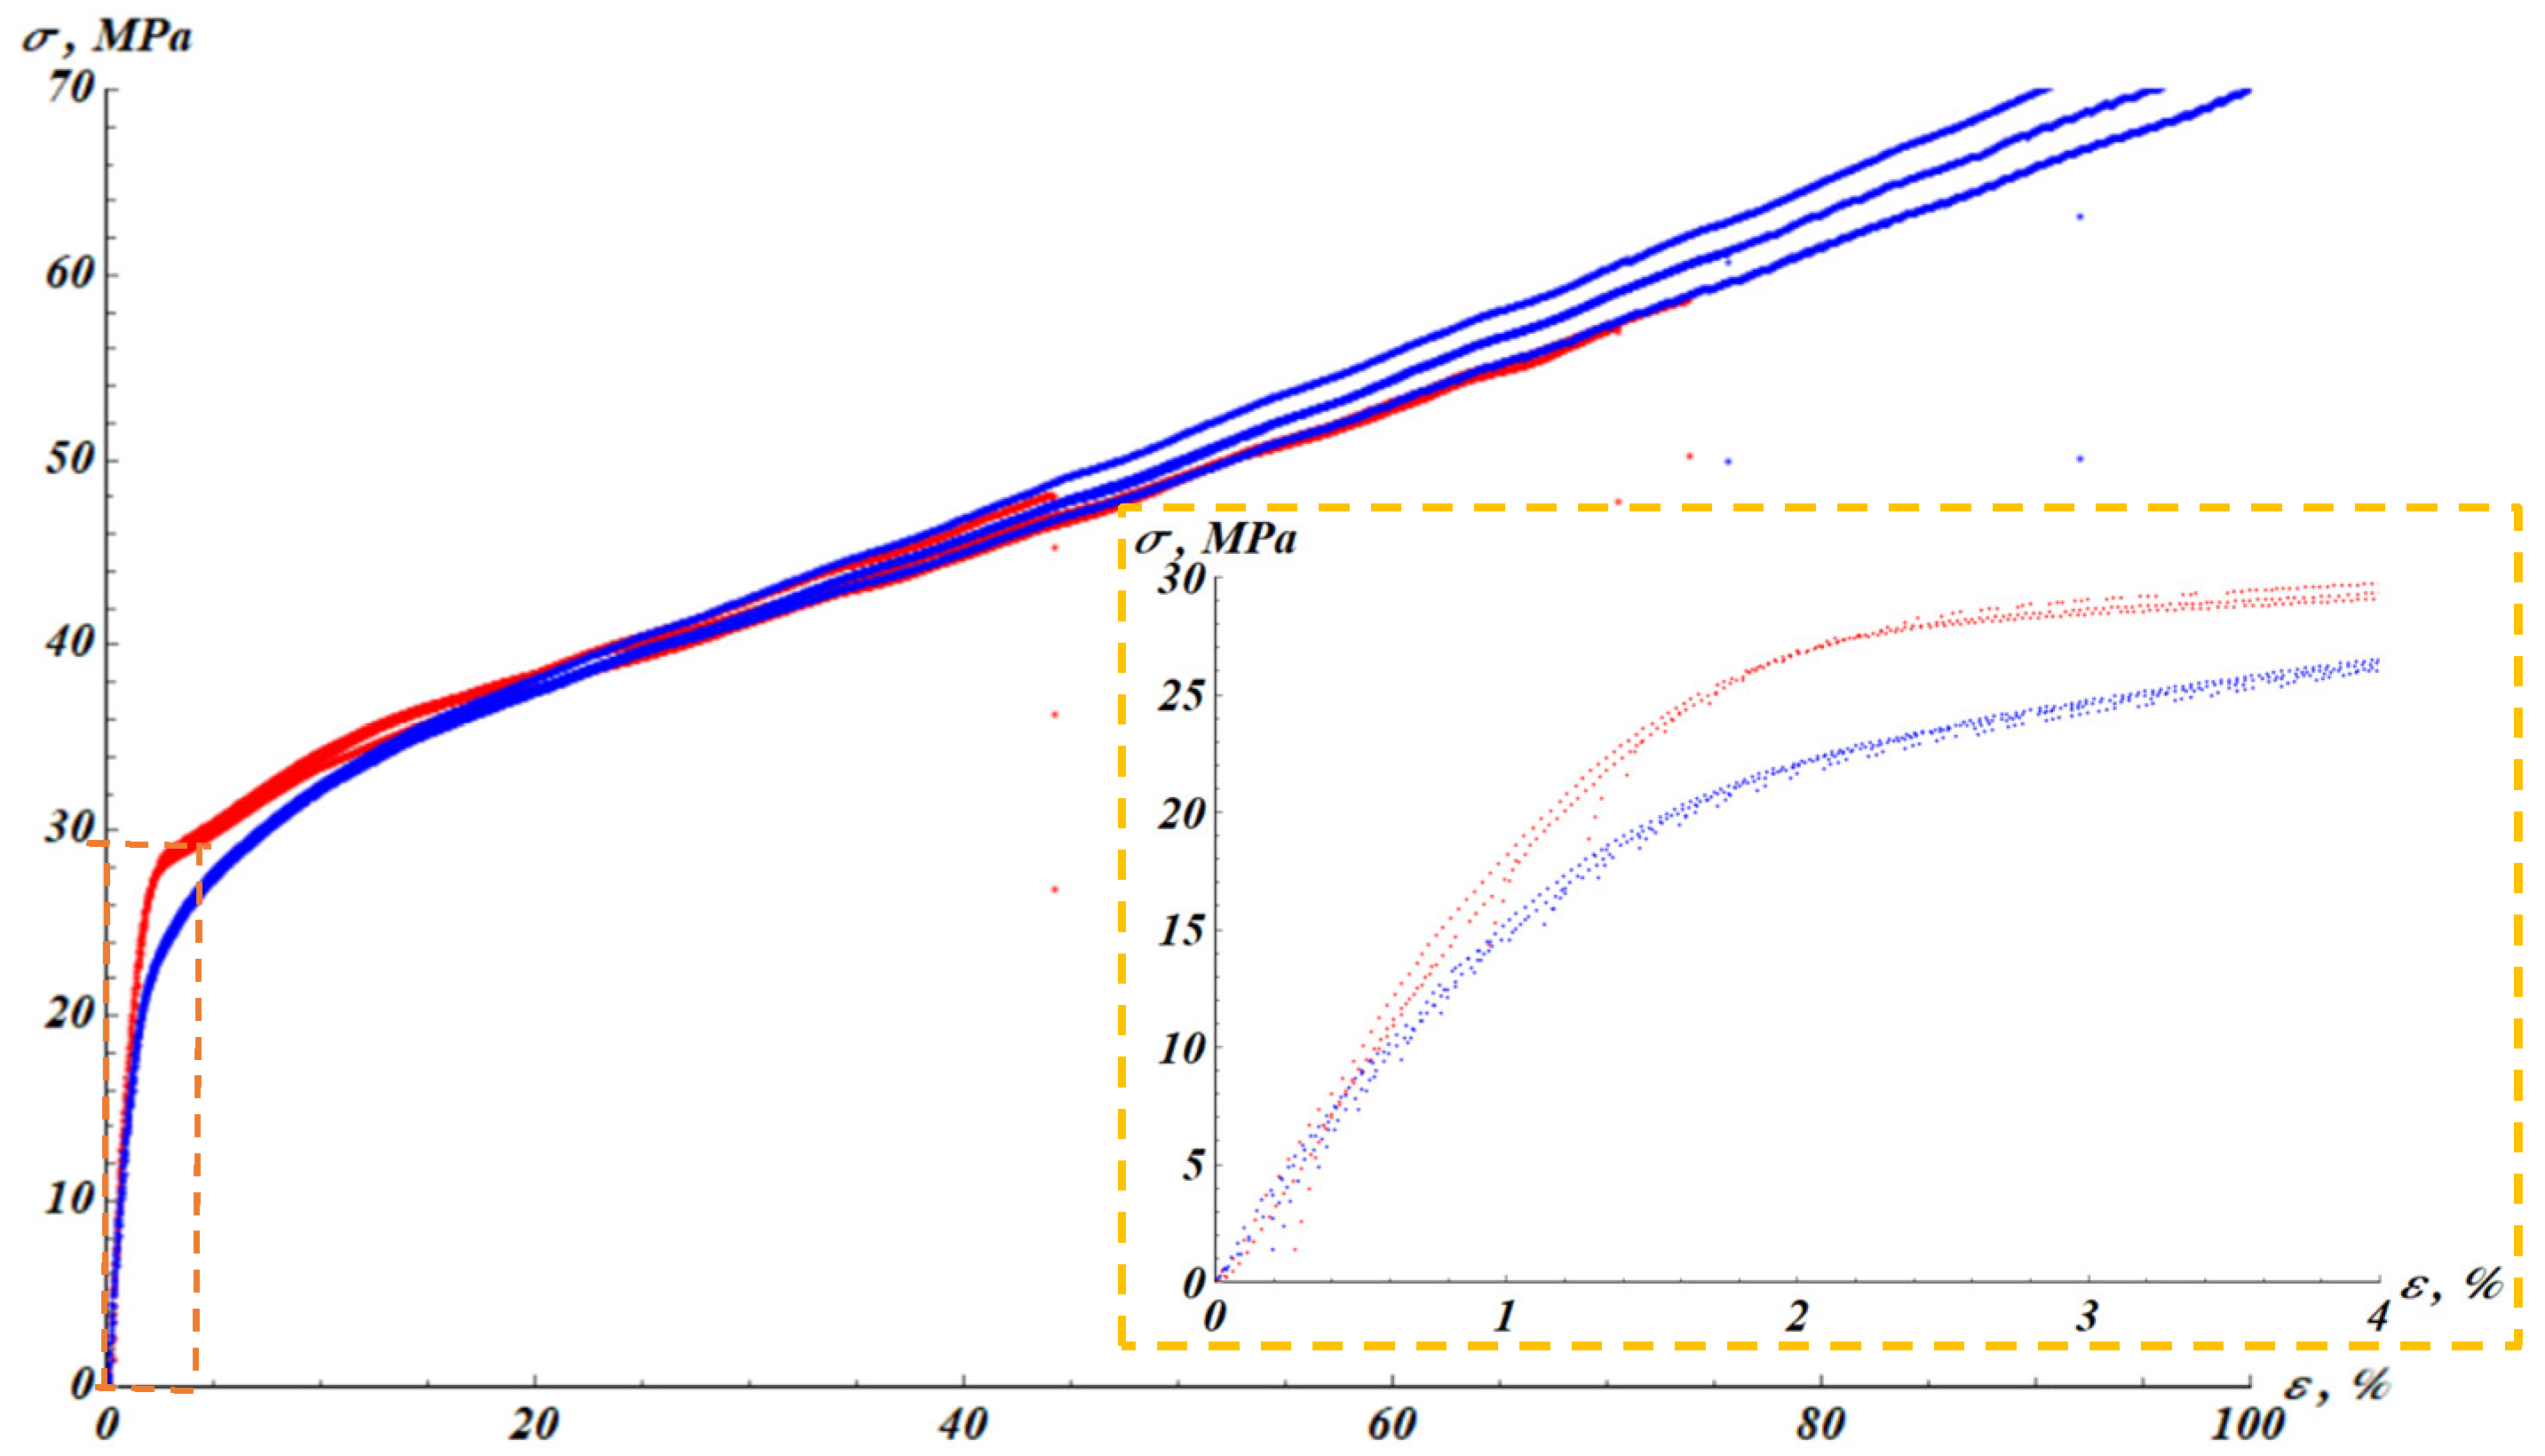
Figure 3.
Maximum elongation () values established from stress-strain experimental curves. The point labeled “no_plasma” corresponds to the virgin samples not treated with plasma. The next point (without label) corresponds to the measured right after plasma treatment.
Figure 3.
Maximum elongation () values established from stress-strain experimental curves. The point labeled “no_plasma” corresponds to the virgin samples not treated with plasma. The next point (without label) corresponds to the measured right after plasma treatment.
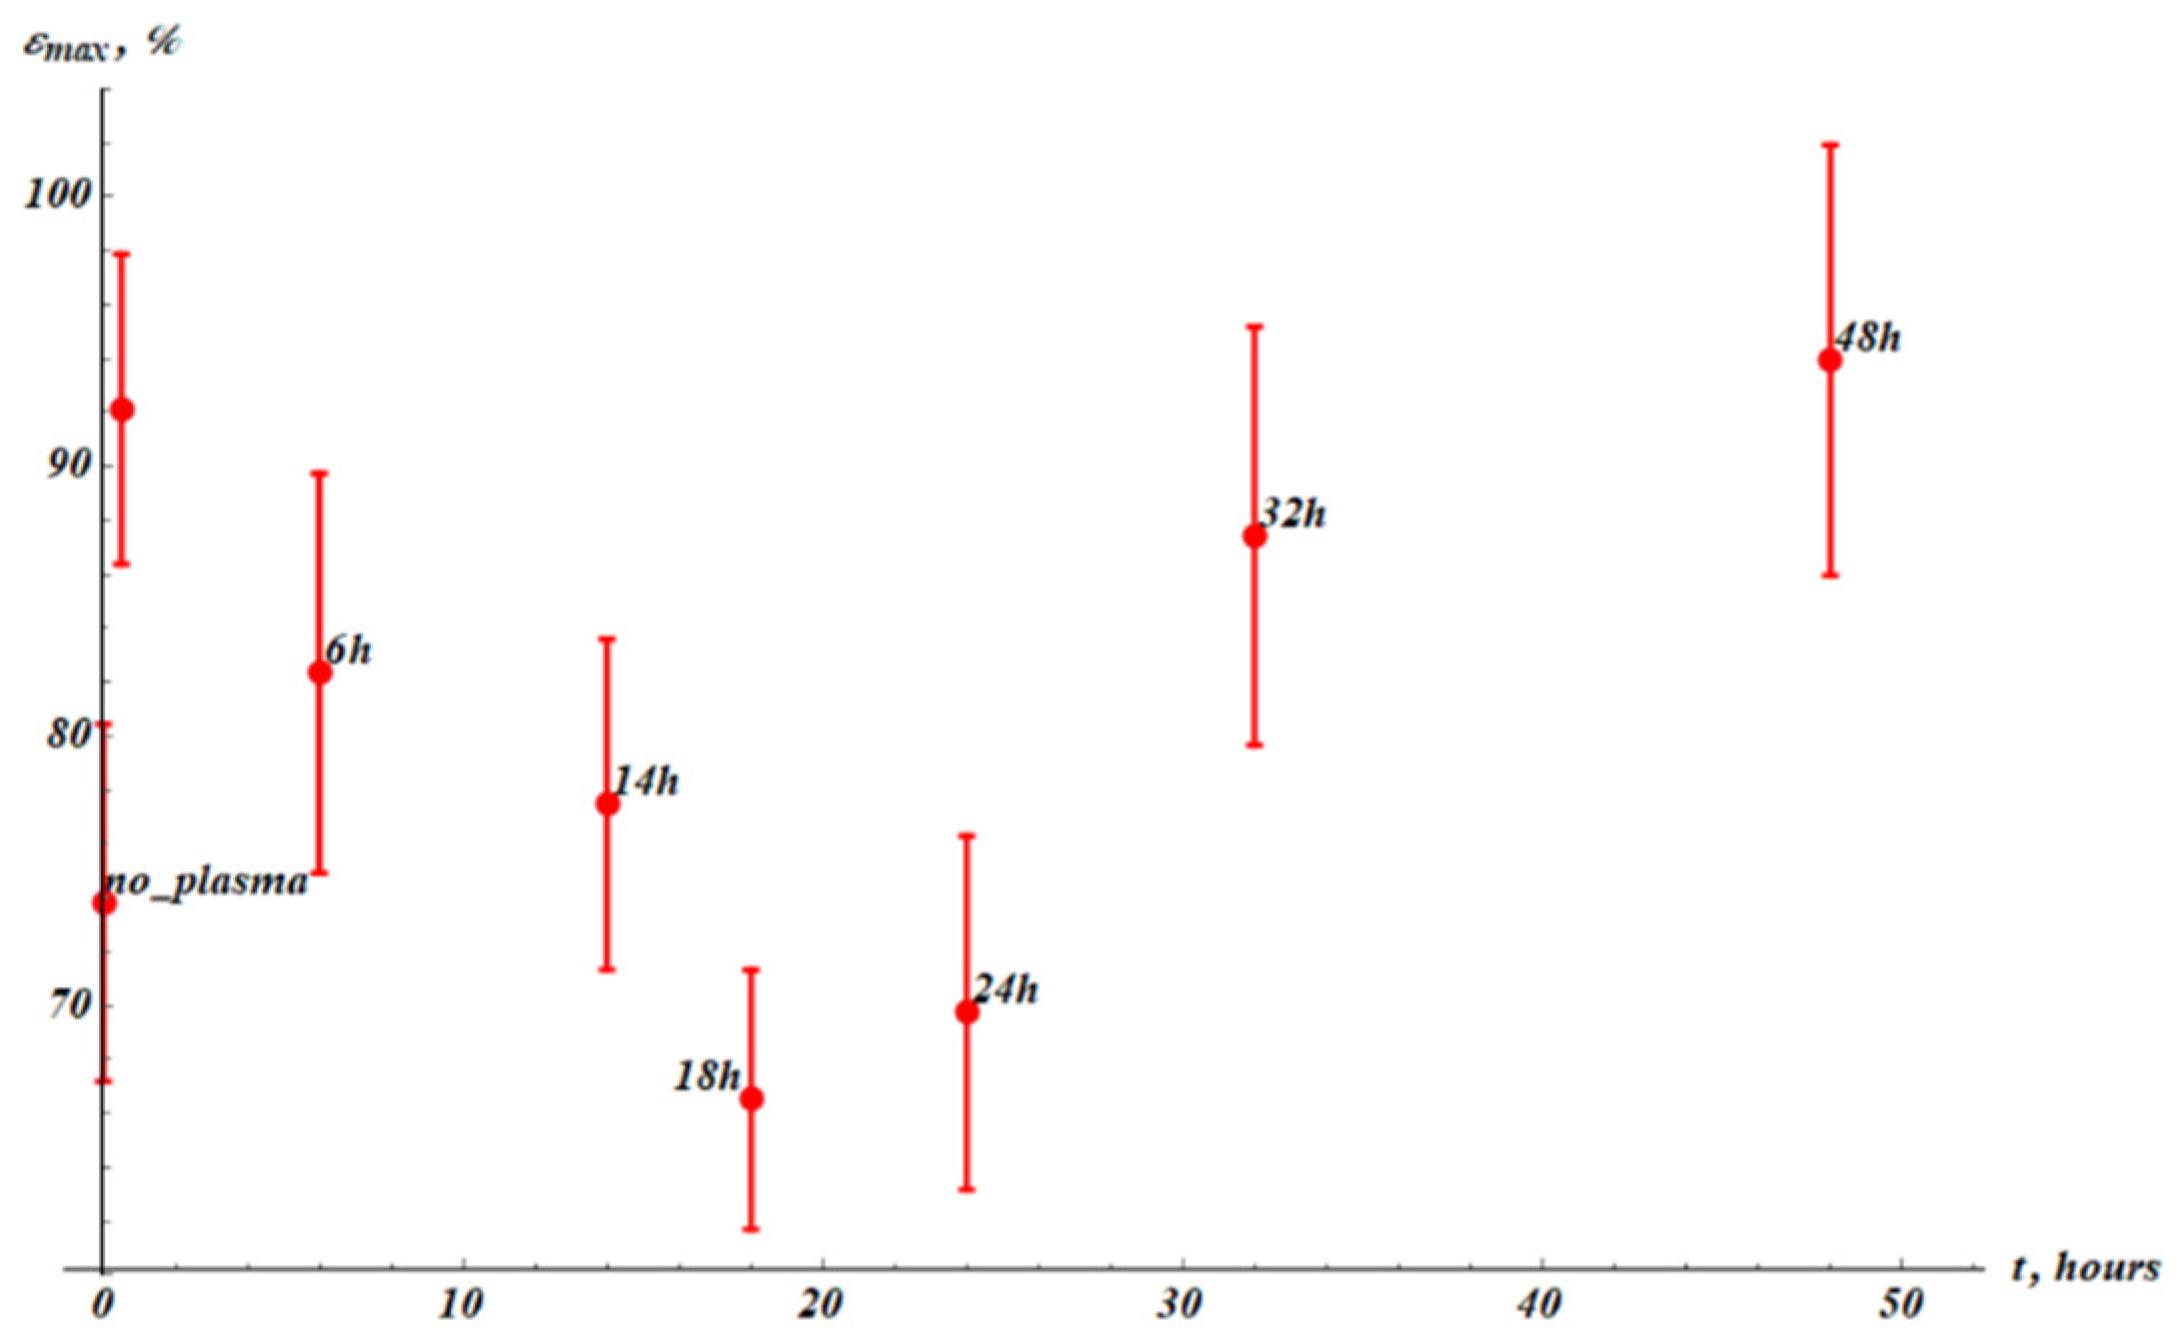
Figure 4.
Young modulus (E) values (red points) established from experimental stress-strain curves (see Figure 2). The point denoted “no_plasma” corresponds to the samples not treated with plasma. The next point (without label) corresponds to measurements immediately after plasma treatment. The blue fitting curve corresponds to Eq. 1 with fitting parameters:
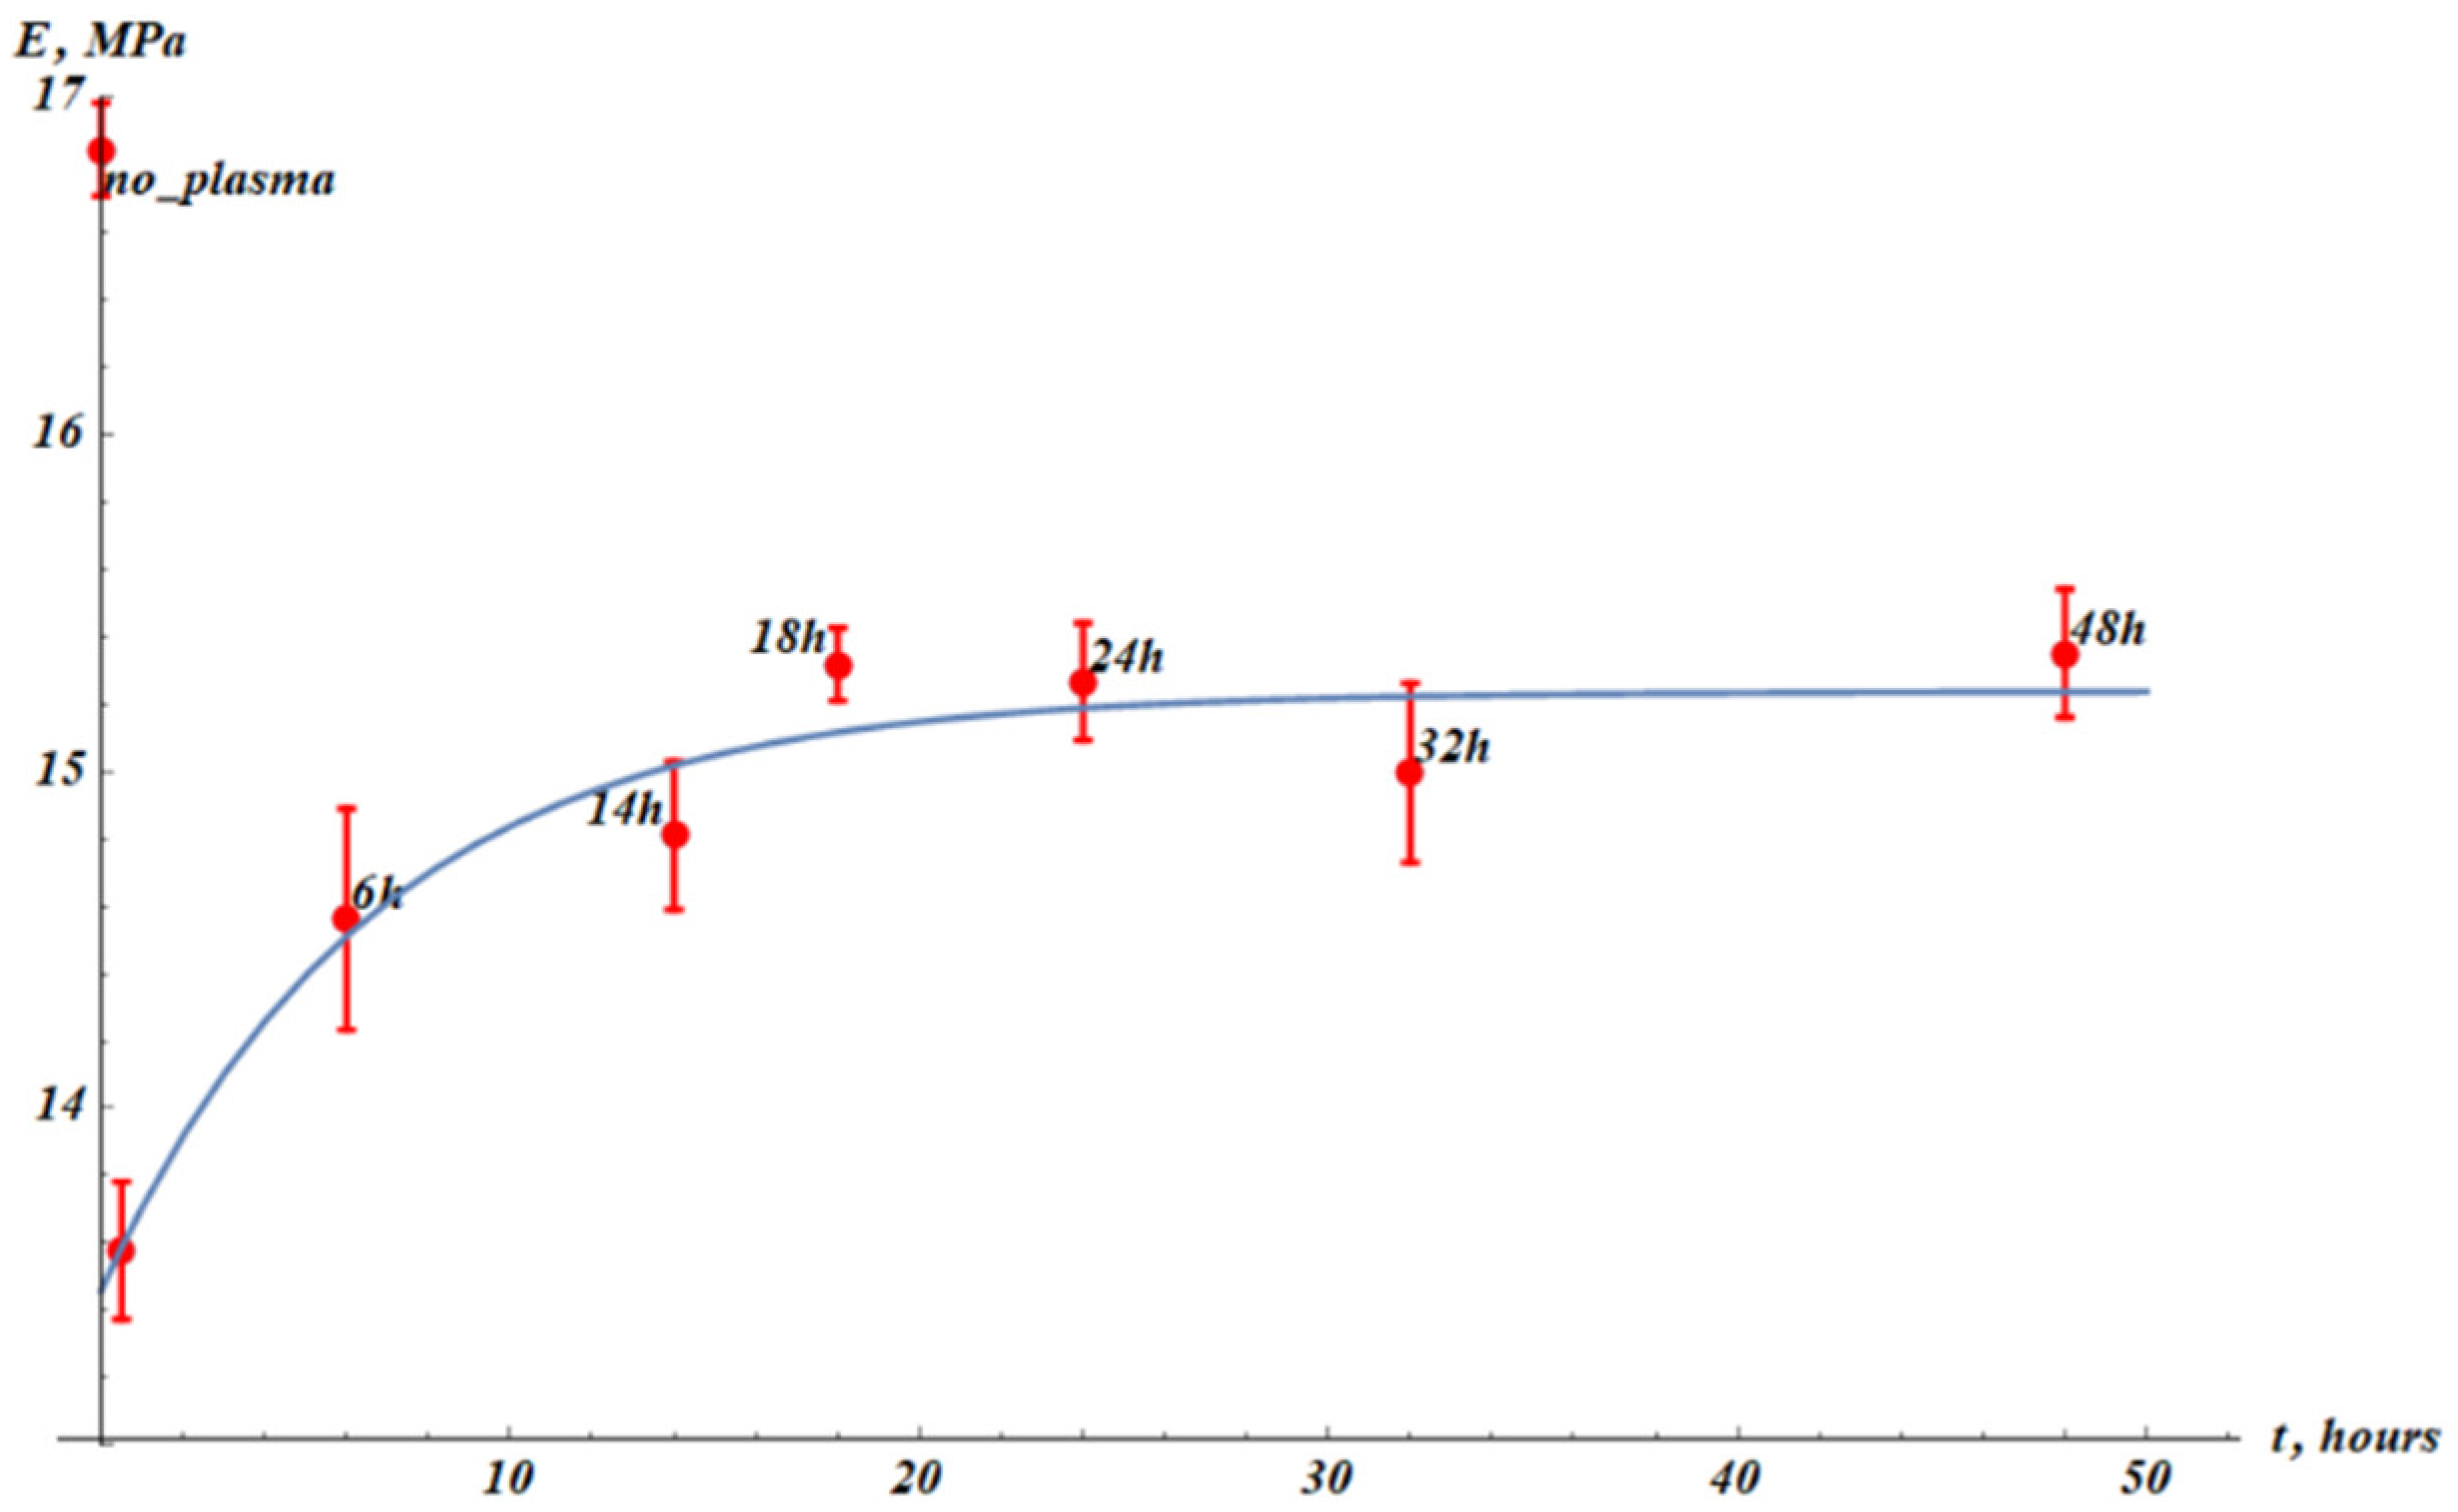
Figure 5.
Yield stress () values (red points) established from experimental stress-strain curves (see Figure 2). The point “no_plasma” corresponds to the samples not treated with plasma. The next point (without label) corresponds to measurements immediately after plasma treatment. The blue fitting curve corresponds to Eq. 2 with fitting parameters: Squared Pearson correlation coefficient 0.999.
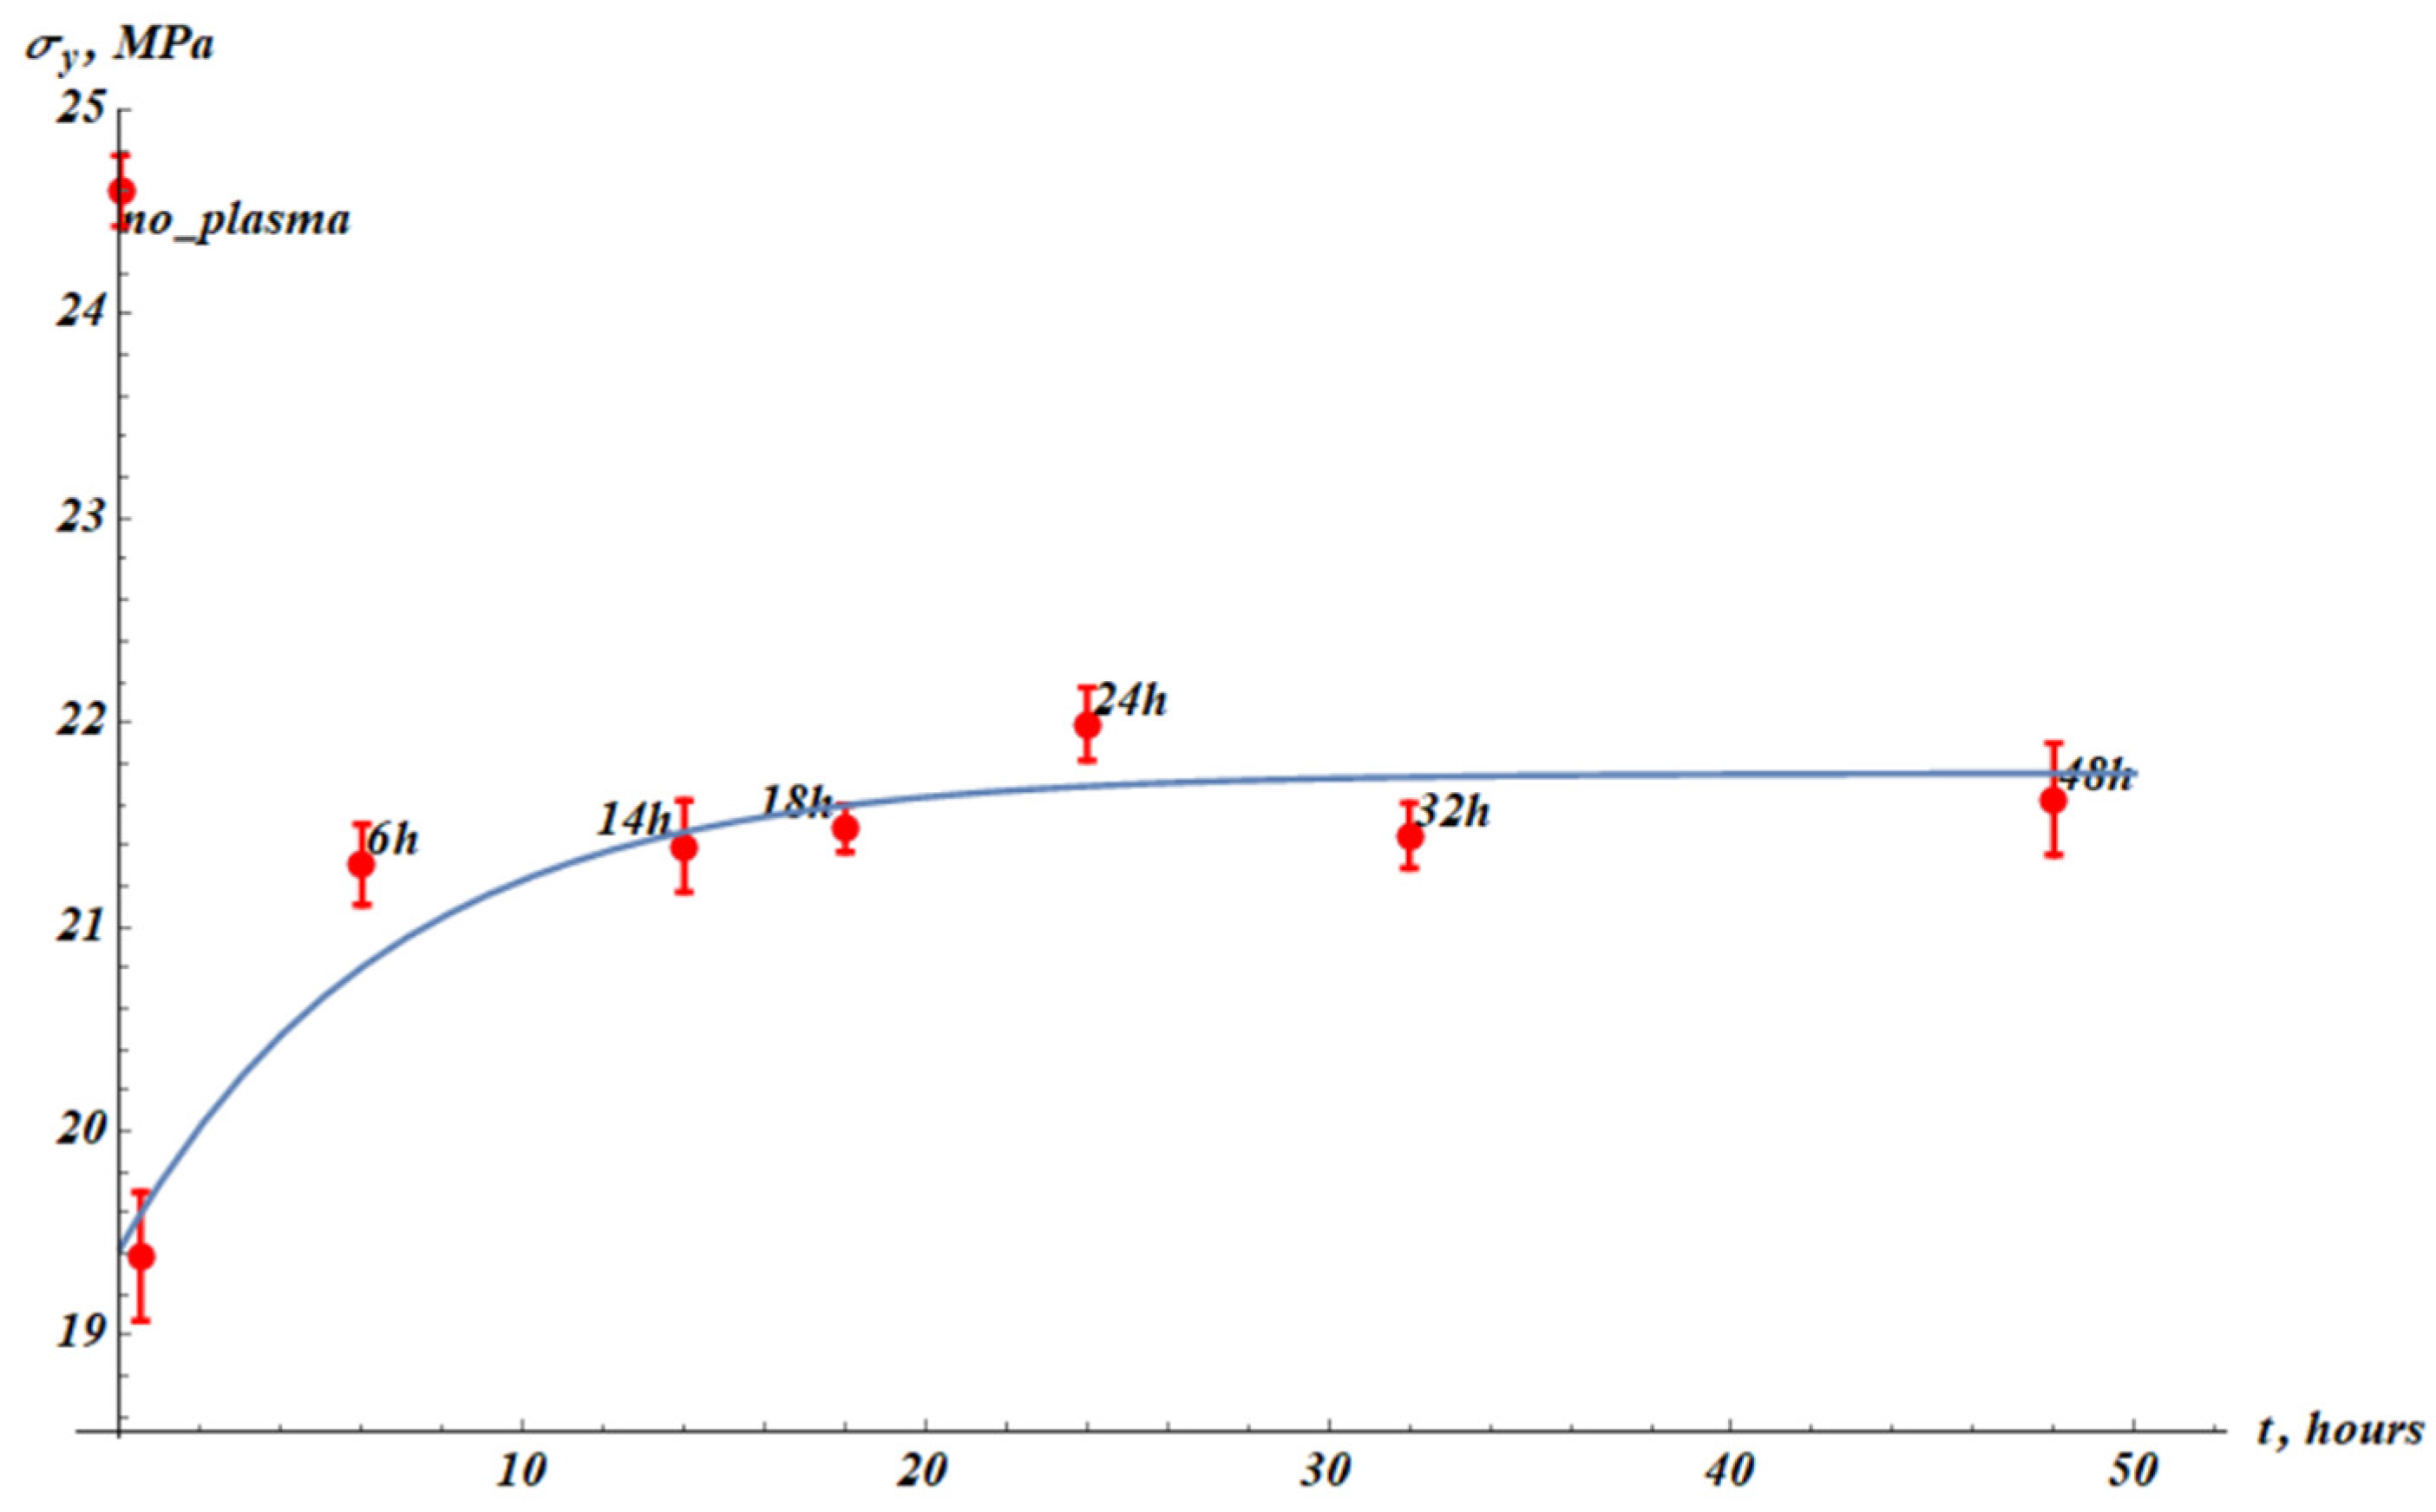
Figure 6.
Tangent modulus () values established from stress-strain experimental curves. The point “no_plasma” corresponds to the samples not treated with plasma. The next point (without label) corresponds to measurements immediately after plasma treatment.
Figure 6.
Tangent modulus () values established from stress-strain experimental curves. The point “no_plasma” corresponds to the samples not treated with plasma. The next point (without label) corresponds to measurements immediately after plasma treatment.
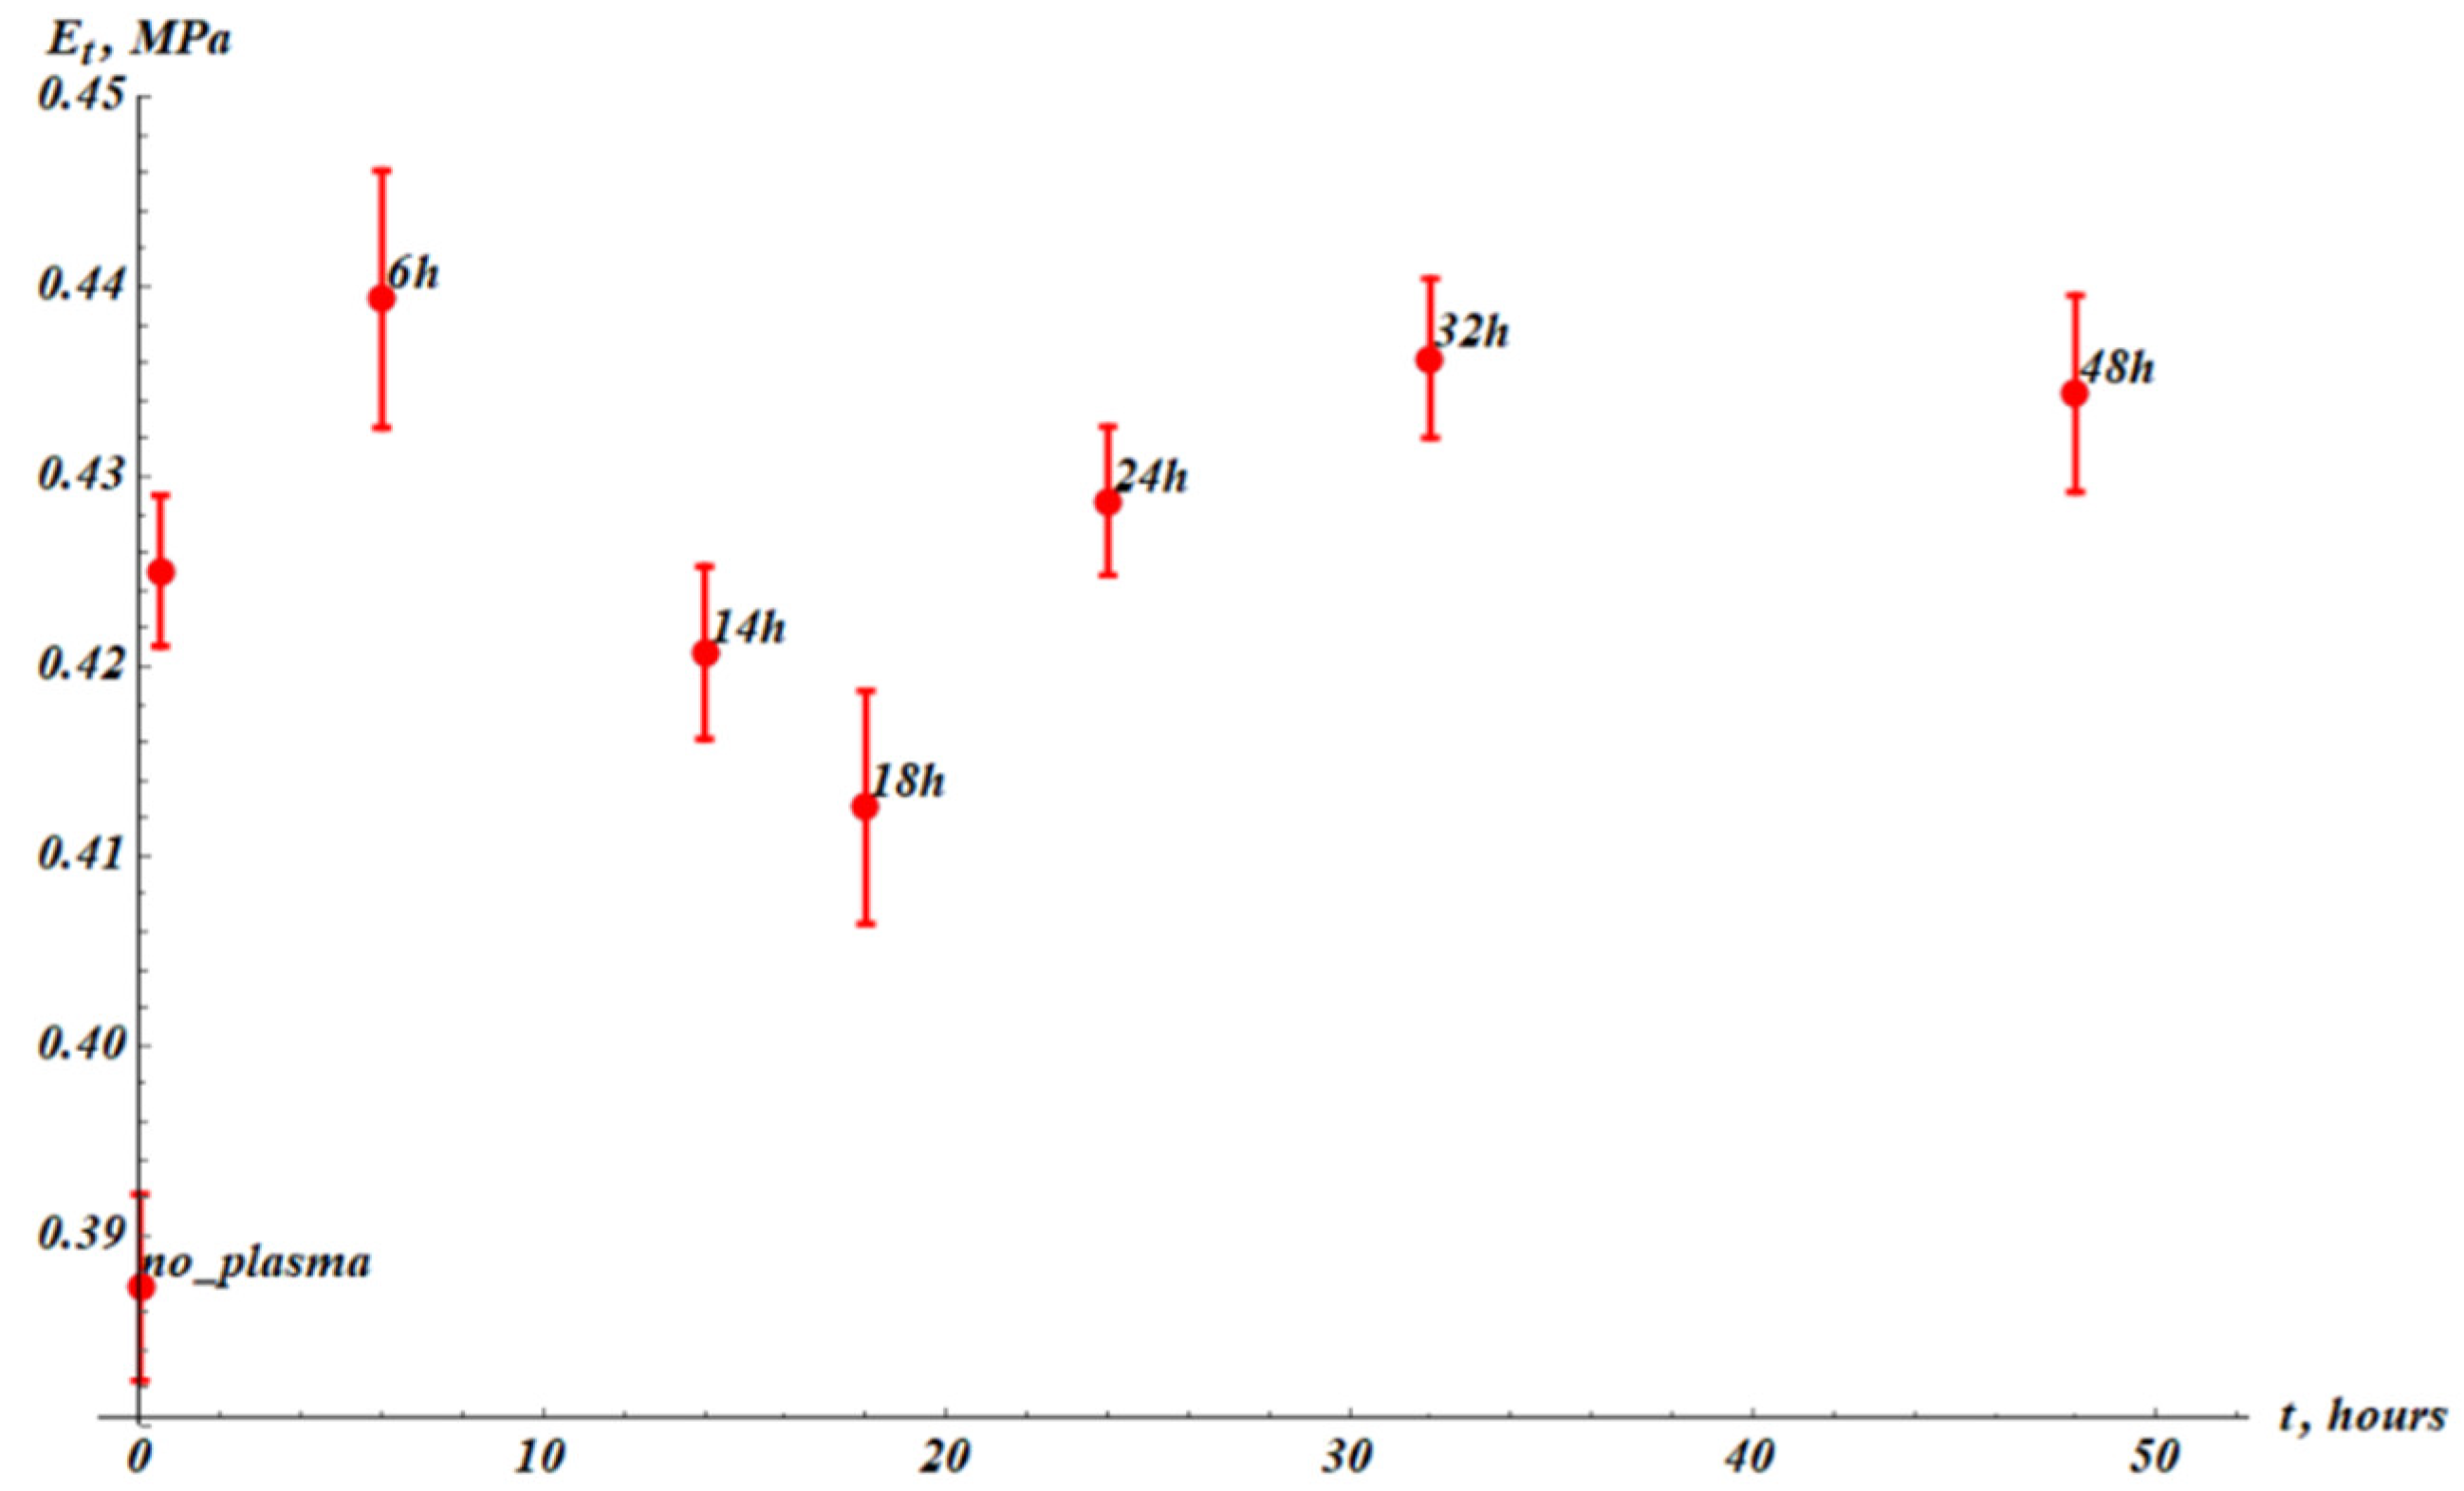
Figure 7.
Toughness () established as integral function (area under the curve) of stress-strain experimental curves. The point “no_plasma” corresponds to the virgin samples not treated with plasma. The next point (without label) corresponds to measurements immediately after plasma treatment.
Figure 7.
Toughness () established as integral function (area under the curve) of stress-strain experimental curves. The point “no_plasma” corresponds to the virgin samples not treated with plasma. The next point (without label) corresponds to measurements immediately after plasma treatment.
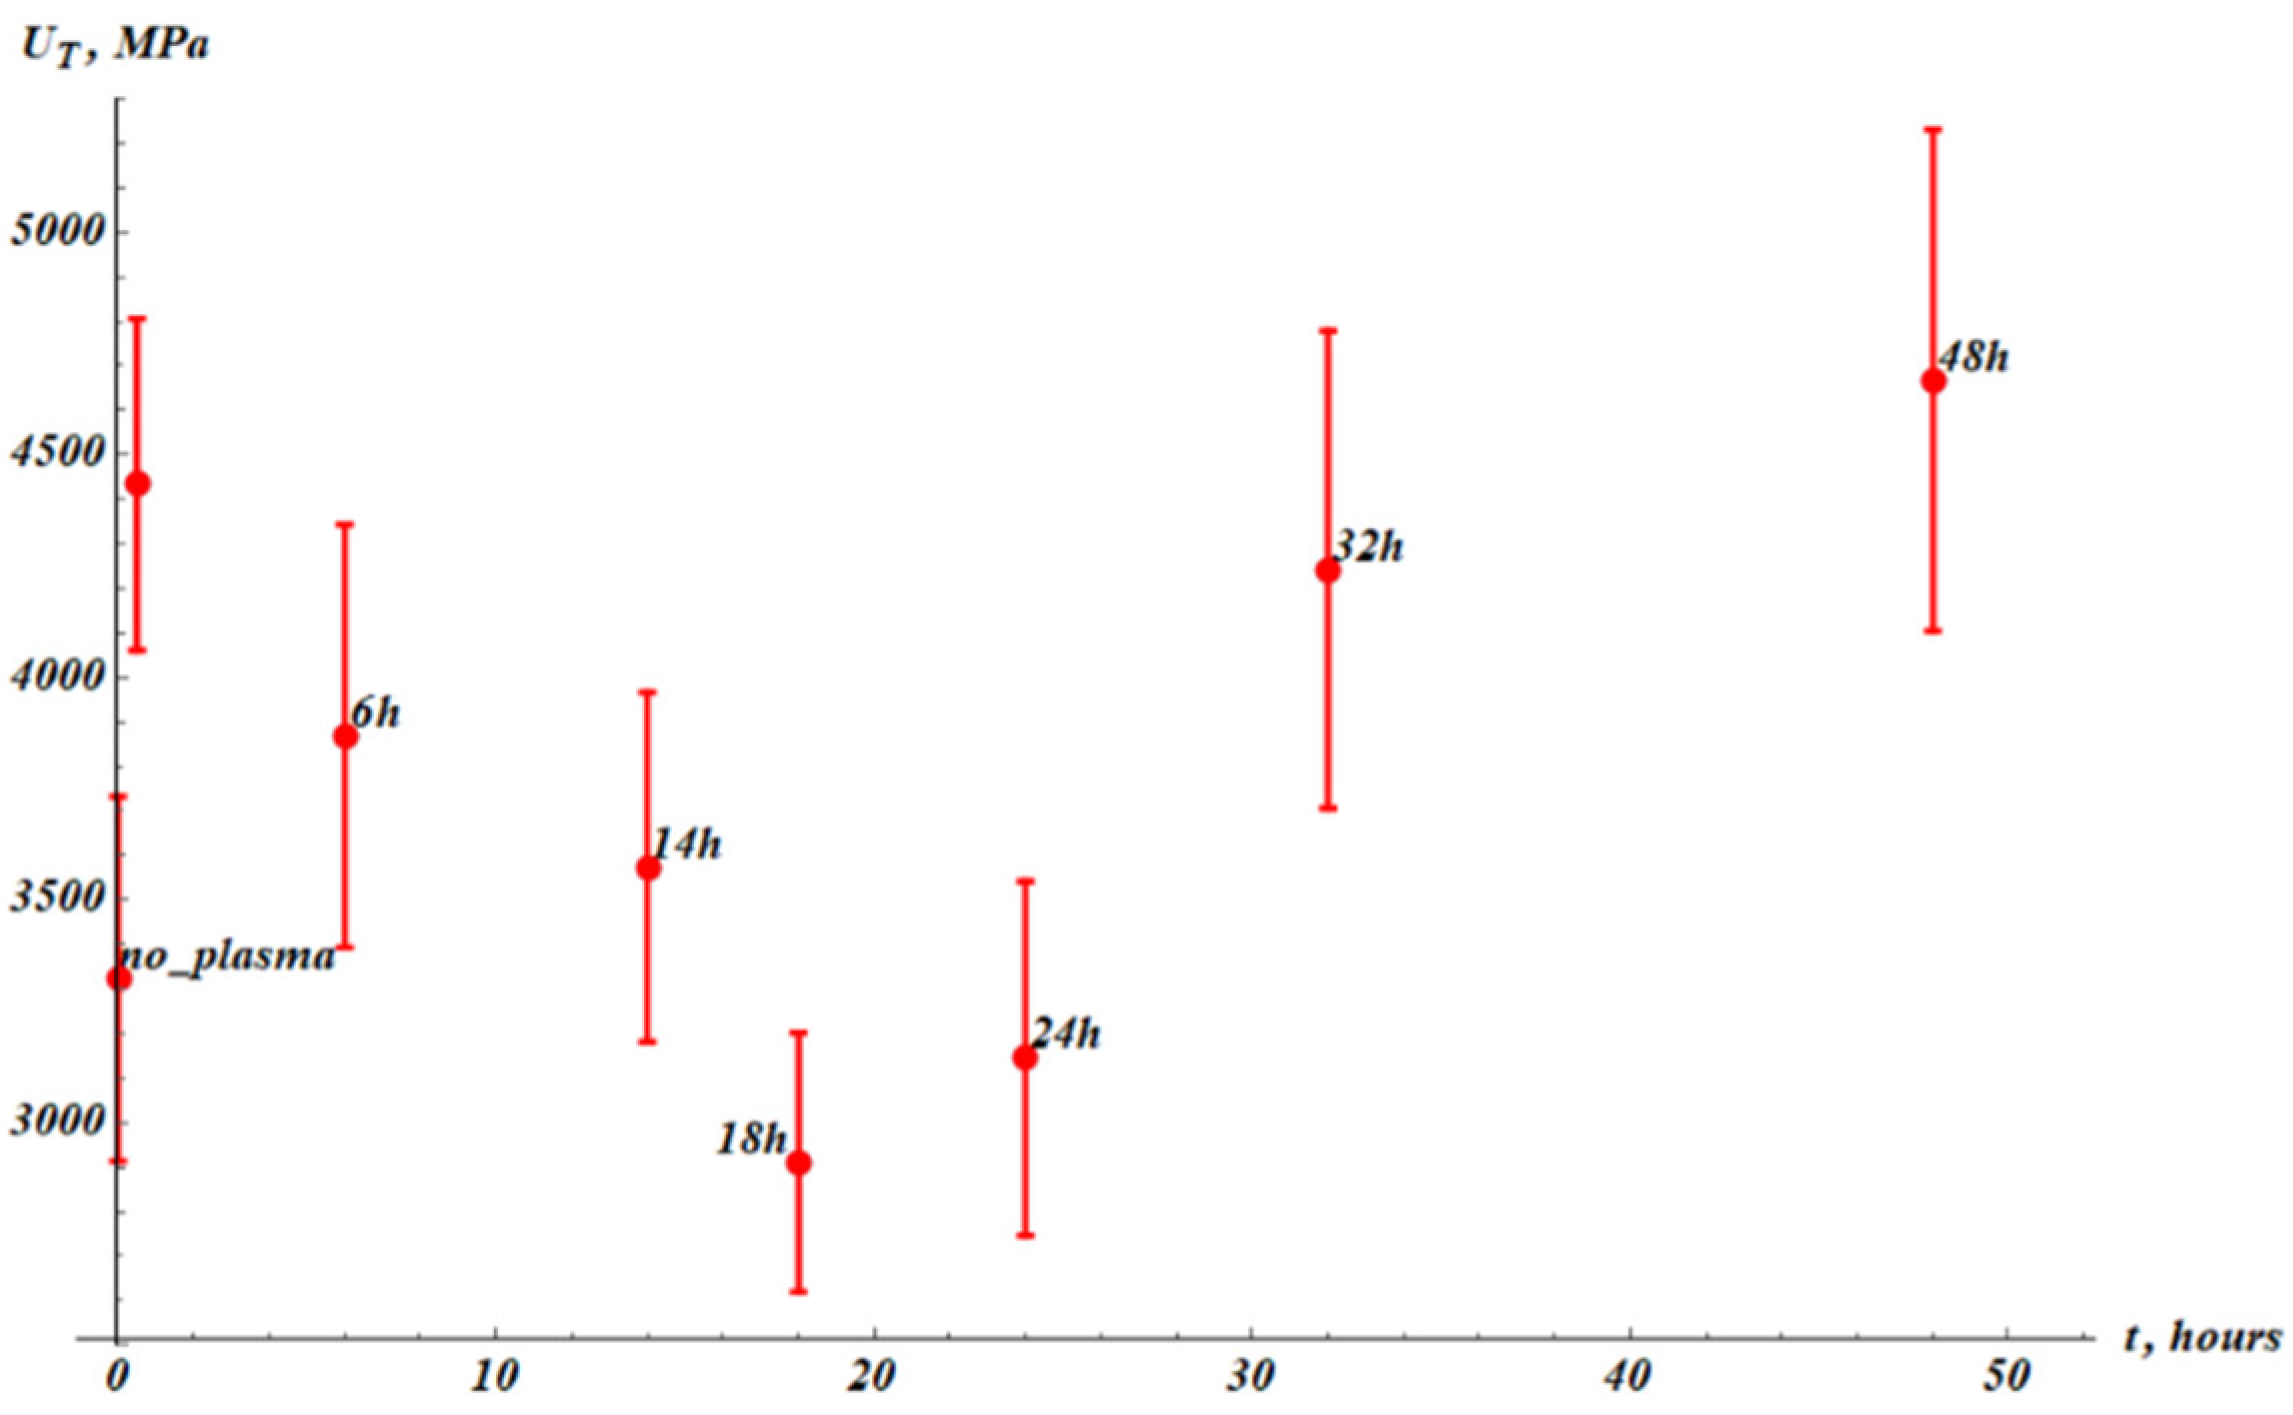
Figure 8.
The UTS () values established from stress-strain experimental curves. The point “no_plasma” corresponds to the virgin samples non-treated with plasma. The next point (without label) corresponds to measurements immediately after plasma treatment.
Figure 8.
The UTS () values established from stress-strain experimental curves. The point “no_plasma” corresponds to the virgin samples non-treated with plasma. The next point (without label) corresponds to measurements immediately after plasma treatment.
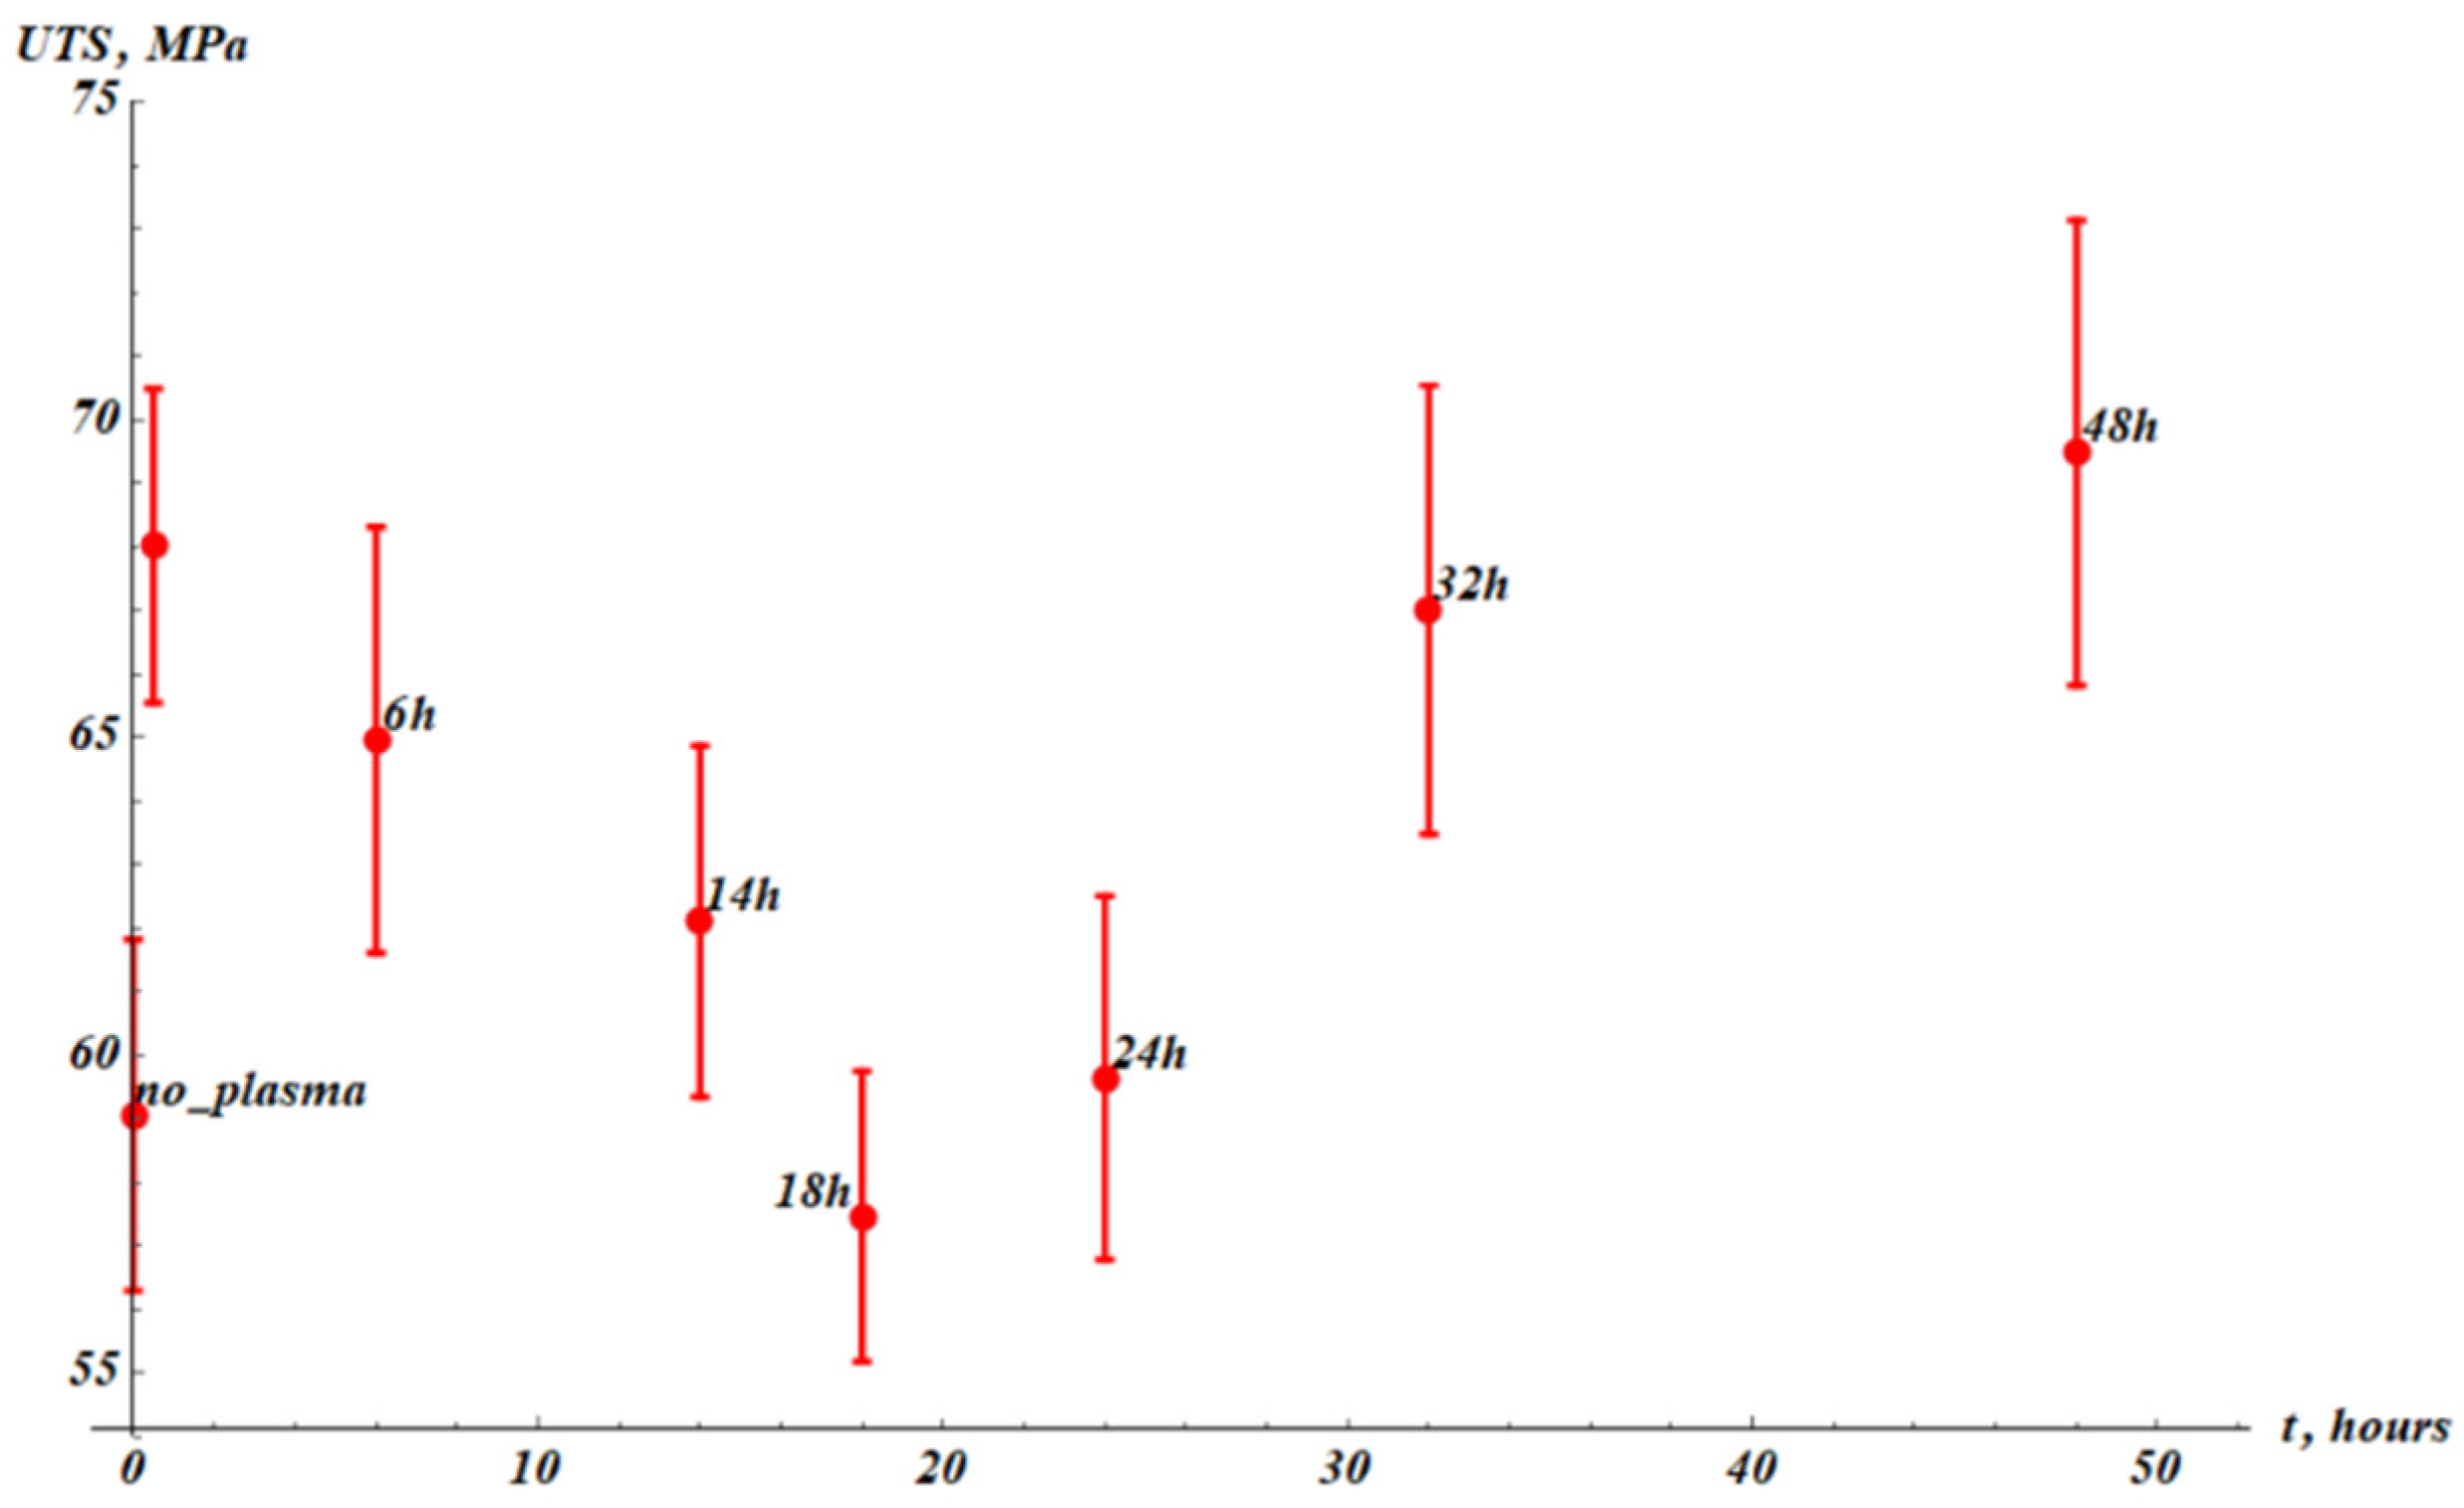
Figure 9.
Water droplet () placed on the PP samples: A) untreated PP sample, B) after plasma treatment. Scale bar is 2.5 mm.
Figure 9.
Water droplet () placed on the PP samples: A) untreated PP sample, B) after plasma treatment. Scale bar is 2.5 mm.
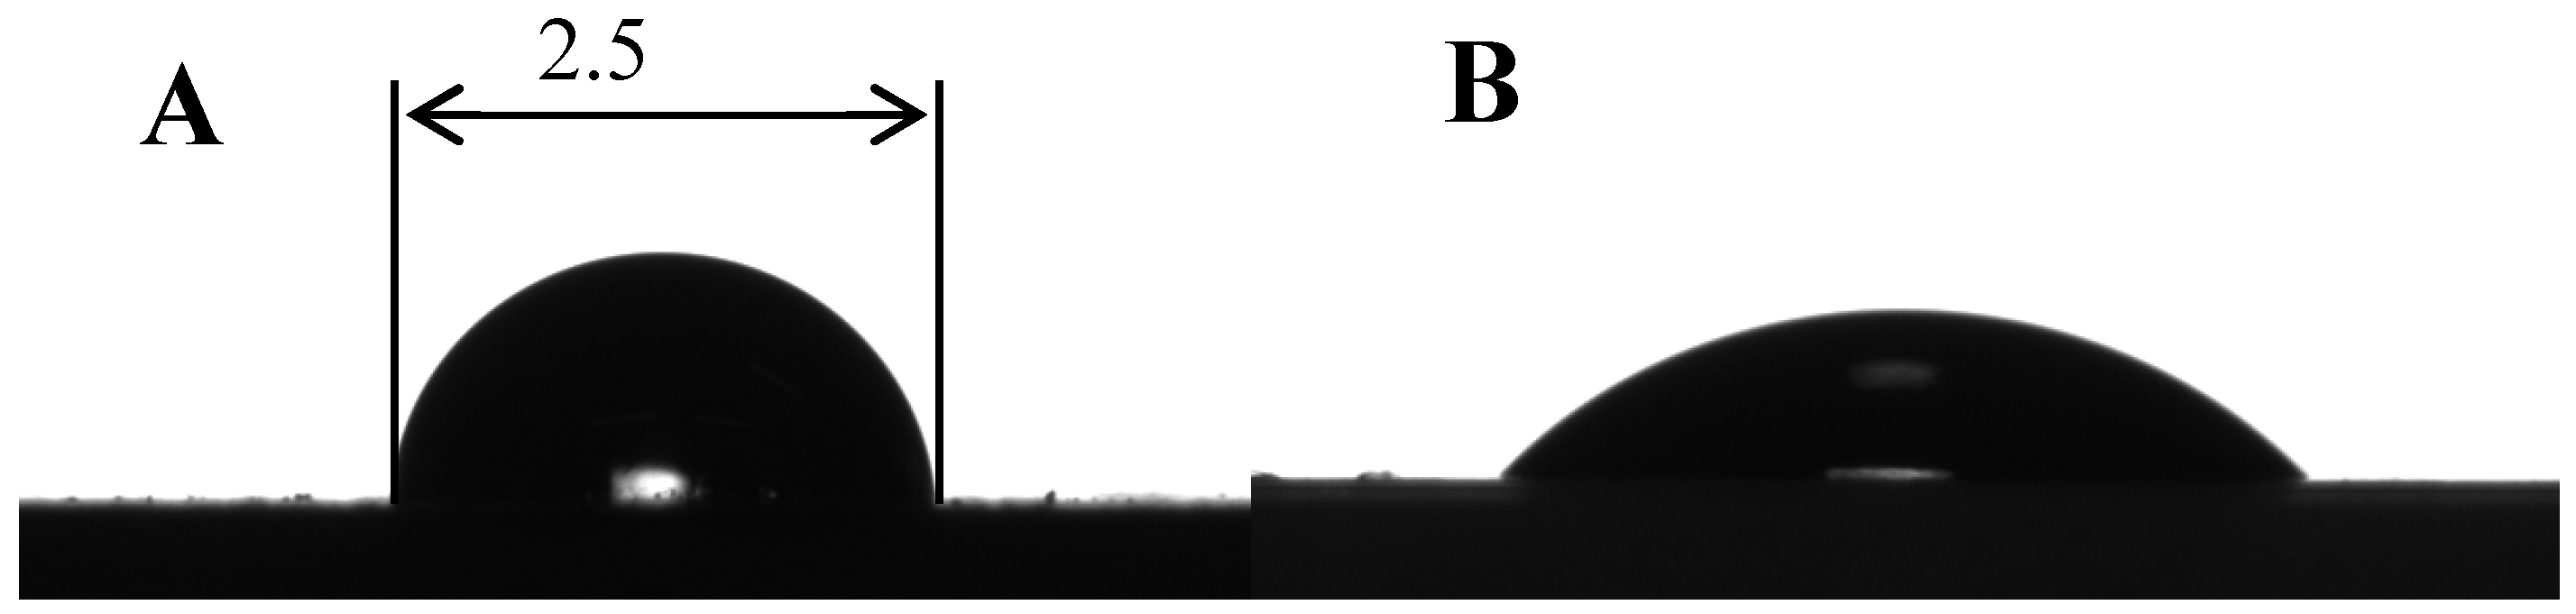
Figure 10.
Apparent contact angle () experimental data (red points). The blue fitting curve corresponds to Eq. 6 with fitting parameters: Squared Pearson correlation coefficient .
Figure 10.
Apparent contact angle () experimental data (red points). The blue fitting curve corresponds to Eq. 6 with fitting parameters: Squared Pearson correlation coefficient .
Disclaimer/Publisher’s Note: The statements, opinions and data contained in all publications are solely those of the individual author(s) and contributor(s) and not of MDPI and/or the editor(s). MDPI and/or the editor(s) disclaim responsibility for any injury to people or property resulting from any ideas, methods, instructions or products referred to in the content. |
© 2025 by the authors. Licensee MDPI, Basel, Switzerland. This article is an open access article distributed under the terms and conditions of the Creative Commons Attribution (CC BY) license (http://creativecommons.org/licenses/by/4.0/).
Copyright: This open access article is published under a Creative Commons CC BY 4.0 license, which permit the free download, distribution, and reuse, provided that the author and preprint are cited in any reuse.


