
Submitted:
15 October 2025
Posted:
16 October 2025
You are already at the latest version
Abstract
Background/Objectives: Melanin synthesis in normal skin involves numerous genes, and disturbances in their function may increase the risk of malignant transformation of mela-nocytes. Genes regulating pheomelanin synthesis are of particular interest, as this pig-ment may actively contribute to cutaneous malignant melanoma pathogenesis. Normal melanocytes differ in pheomelanin content depending on skin phototype, which affects susceptibility to neoplastic transformation. However, the influence of pheomelanin on melanoma cell characteristics has not yet been fully elucidated. Methods: To gain further insight, we examined the expression of pheomelanogenesis-related genes in two mela-noma cell lines of distinct pigmentation status, amelanotic C32 and melanotic G361. We analysed the expression of 44 genes involved in melanocyte development and pigmenta-tion, classifying them by their direct or indirect role in pheomelanogenesis. Gene expres-sion levels were quantified using real-time reverse transcription polymerase chain reac-tion (real-time RT-PCR). Results: Our results show that melanoma cells with distinct pig-mentation phenotypes exhibit heterogeneous expression patterns. For instance, G361 cells expressed higher levels of POMC, MC1R, TYRP1, TYR, SLC45A2, and CTNS, while SLC7A11 and DCT/TYRP2 were more abundant in C32 cells. Conclusions: These findings suggest that differences in the expression of pheomelanin-related genes may contribute to melanoma cell diversity and could play a role in defining tumour behaviour. Evaluation of melanogenesis-related gene expression and, in particular, the activity of pheomelano-genesis may therefore represent a valuable approach for melanoma classification, prog-nosis, and therapeutic decision-making.
Keywords:
melanoma
; pheomelanin
; gene expression
; pheomelanogenic genes
1. Introduction
Melanogenesis is the biosynthesis of melanin pigments, found in the skin, hair, and eyes, and occurs in melanocytes, whose main role is to produce brown-black eumelanin and yellow-red pheomelanin [1]. The molecular structure of melanin enables the absorption of ultraviolet (UV) and visible light; therefore, these pigments exert protective effects against UVR from sunlight [2]. Melanosomes present in the cytoplasm of melanocytes are responsible for melanin production and storage and require specific structural and enzymatic proteins to function [3,4]. TYR (tyrosinase) and DCT/TYRP2 (dopachrome tautomerase/tyrosinase related protein 2) are key enzymes influencing melanin quantity and quality [5,6]. L-tyrosine, derived from L-phenylalanine, serves as the substrate for both melanin types and melanogenesis is tightly regulated by a multienzymatic complex [7,8]. The process begins with tyrosine oxidation to dopaquinone (DQ), catalysed by TYR which then leads to eumelanin or, in the presence of cysteine, pheomelanin via benzothiazine and benzothiazole intermediates [9,10,11]. Melanogenesis yields mixtures of eumelanin and pheomelanin in varying proportions, largely determined by TYR activity and the concentrations of substrates tyrosine and cysteine. The key regulatory pathway in melanogenesis is the cAMP-dependent cascade, where cAMP activates PKA, stimulating phenylalanine hydroxylase and transcription of MITF, GTP-CHI, and THI [7,12]. Elevated cAMP may also trigger Ras/ERK, which suppresses melanin synthesis. MITF controls melanosome biogenesis, maturation, and transport [13,14], and hormonal signals via α-MSH/MC1R regulate eumelanin–pheomelanin balance and UV responses [15,16]. PKCβ, through RACK1, activates TYR and melanogenesis [17,18]. SOX10 and SOX9 transcription factors regulate MITF and other melanogenic genes; UVB enhances SOX9 activity, boosting melanin production [8,19]. PAX3 supports melanocyte proliferation and, with SOX10, induces MITF expression [20].
Both pheomelanin and eumelanin are capable of protecting the skin against harmful UV radiation [2,21]. However, pheomelanin, also acting in the opposite direction as a strong UV photosensitiser, contributes to the increased susceptibility of fair-skinned individuals to premature ageing, sunburn and malignant transformation [22,23]. It has been suggested that zinc, which is present in increased amounts in red hair, interacts with pheomelanin to produce greater amounts of ROS [24]. Furthermore, the photoreactivity of pheomelanin is higher in the presence of zinc, which induces structural changes within it. The genoprotective function of melanin seems to be of particular importance in skin cancers, including malignant melanoma, which are associated with sunlight exposure [25]. Eumelanin is more genoprotective than pheomelanin; therefore, the balance between the alternative biosynthetic pathways of melanin in the skin has a decisive impact on susceptibility to photocarcinogenesis [25,26]. The beneficial effects of eumelanin result from its ability to absorb UV radiation and to scavenge free radicals generated by this radiation. There is evidence that photolysis products of pheomelanin may be more toxic than those of eumelanin [25,27]. In some fair-skinned individuals, an increased rate of eumelanin turnover occurs in keratinocytes due to enhanced lysosomal degradation, which reduces their level of photoprotection. Pheomelanin may also promote malignant tumour development through indirect effects on the immune system. T lymphocytes require cysteine for proper functioning and activation. In tissues where pheomelanin content is high, cysteine concentrations decline, impairing the ability of local lymphocytes to eliminate mutated cells [28]. In addition, increased levels of ROS generated during pheomelanin synthesis inhibit the activity of CD8+ T lymphocytes [29]. While malignant transformation is often associated with the loss of specialised cellular functions, in melanoma the expression of tyrosinase and other melanogenic enzymes is generally elevated [30]. Tyrosinase overexpression in transformed melanocytes has been associated with defective melanosomes [24]. The detection of tyrosinase in blood serves as a diagnostic marker for melanoma; furthermore, tests detecting melanogenic metabolites in blood and urine are used for clinical monitoring [31,32]. Several mechanisms contributing to pheomelanin-induced carcinogenesis are linked to enhanced production of ROS, abundantly generated during its synthesis [27]. Pheomelanin synthesis requires large amounts of antioxidants, which in turn depletes antioxidants such as GSH, rendering melanocytes more vulnerable to damage. Many studies have demonstrated a relationship between GSH deficiency, resulting from its utilisation in pheomelanin synthesis, and cellular oxidative stress [33,34]. Moreover, the presence of sulphur in the aromatic ring of pheomelanin lowers its ionisation potential, making it less stable when generating ROS compared with eumelanin [35]. In recent years, suggestions have emerged that the mechanism of malignant transformation in melanocytes may involve chemiexcitation of melanins under oxidative stress, leading to UVR-independent formation of highly mutagenic cyclobutane pyrimidine dimers (CPDs). Studies have shown that pheomelanin is a much stronger generator of CPDs than eumelanin [35,36].
Tyrosinase, encoded by the TYR gene, is the main enzyme responsible for the conversion of tyrosine to melanin [6]. The ratio of eumelanin to pheomelanin depends on TYR activity. It is believed that reduced activity and/or availability of TYR in melanocytes promotes pheomelanin synthesis. TYR, together with two proteins, TYRP1 and TYRP2 (DCT), has been shown to form a multienzyme complex within melanocytes [37]. Mutations in the genes encoding these proteins impair the function of the complex and significantly affect skin pigmentation [38,39]. TYRP1 has been attributed roles in activating and stabilising TYR, shaping melanosomes, and regulating and/or influencing the type of melanin synthesised. DCT, on the other hand, is responsible for the conversion of DOPAchrome into a carboxylic acid derivative. Its main function is considered to be the regulation of eumelanin and pheomelanin levels in human skin cells. Reports indicate that reduced DCT expression enhances pheomelanogenesis .The absence of promoter activity for all three enzymes (TYR, TYRP1, and DCT) favours the synthesis of pheomelanin [24,40]. This is associated with the inhibition of MITF following the binding of ASP to MC1R, which normally regulates eumelanin synthesis. Binding of ASP to the receptor suppresses eumelanin production, thereby promoting pheomelanin synthesis [41,42]. Conversely, when α-MSH binds to MC1R, melanin synthesis is shifted towards eumelanin. The precursor of α-MSH is POMC. Reduced expression or mutation of the POMC gene prevents α-MSH formation, correlating with increased pheomelanin synthesis [43]. An inactivating mutation in MC1R results in complete inhibition of eumelanin synthesis. This disturbs the balance between the two skin pigments and leads to excessive pheomelanin production, which has been demonstrated to increase the risk of spontaneous malignant transformations towards melanoma [44].
A shift in the eumelanin/pheomelanin ratio towards pheomelanin is also associated with a decrease in intracellular cysteine levels [32,44]. The gene responsible for cysteine transport into melanocytes is SLC7A11 [34,45]. It encodes the xCT cystine/glutamate antiporter, which supplies cysteine for the synthesis of GSH, the main cellular antioxidant. Reduced GSH, in its active form, acts as a cofactor in ROS detoxification. Increased pheomelanin production results in chronic oxidative stress associated with constant cysteine consumption and, consequently, GSH depletion [24]. GSH deficiency impairs the removal of harmful ROS generated during oxidative stress. This predisposes to melanoma development, as melanocytes become more vulnerable to DNA damage [46]. The cystine/H+ symporter encoded by the CTNS gene also plays a role in pheomelanin synthesis]. It exports cystine from melanosomes. Silencing of CTNS due to mutation results in melanosomal acidification, leading to pigmentation defects and a markedly increased risk of melanoma [47,48,49]. It has been demonstrated that melanosomal pH is a key regulatory mechanism of both eumelanogenesis and pheomelanogenesis [50]. Acidic melanosomal pH promotes pheomelanin synthesis. Individuals with fair skin have relatively more acidic melanosomal interiors compared with those of individuals with darker skin. Numerous signalling cascades regulate melanosomal pH. One is the MC1R-associated cascade, in which activation by α-MSH leads to the production of transmembrane adenylyl cyclases (tmACs), which subsequently induce MITF, crucial for skin pigmentation and UVR protection [13]. Another signalling pathway involves cAMP. It has been shown that soluble adenylyl cyclase (sAC) also regulates melanosomal pH [51]. Loss of sAC activity results in a rapid rise in melanosomal pH and, consequently, reduced pheomelanin synthesis . The SLC45A2 gene is essential for maintaining melanosomal pH, as it facilitates H+ efflux from melanosomes [52]. Loss of SLC45A2 has been shown to cause melanosomal acidification, leading to reduced pigmentation and increased risk of malignant transformation [53,54,55,56].
Each of the above-mentioned genes and their protein products directly or indirectly influences the proper course of pheomelanin synthesis. Changes in the expression of these genes, together with mutations in any of them, may increase the risk of skin cancer development.
In this study, the expression of selected melanogenic genes was assessed in melanoma cell lines with distinct phenotypes, namely the amelanotic C32 and the melanotic G361. It is assumed that the amelanotic line may contain a higher proportion of pheomelanin compared with the melanotic line. This assumption is based on the lighter colour of pheomelanin relative to eumelanin, which hypothetically may be synthesised to a greater extent in lightly pigmented (amelanotic) melanoma than in darkly pigmented (melanotic) melanoma. The inconspicuous appearance of amelanotic melanoma often results in later detection, and delayed diagnosis increases the risk of metastasis. However, to date, no differences in survival have been documented between patients with amelanotic and melanotic melanoma [57,58]. Likewise, there is no evidence for differences in pheomelanin levels between pigmentationally distinct forms of melanoma; nevertheless, some indication supporting this hypothesis arises from observations of normal melanocytes derived from donors with light and dark skin pigmentation [59].
2. Materials and Methods
2.1. Materials
Human melanoma cell lines C32 (CRL-1585™) and G361 (CRL-1424™) were obtained from American Type Culture Collection (ATCC, Manassas, VA, USA). McCoy’s 5A Medium (modified with L-glutamine and sodium bicarbonate), penicillin-streptomycin solution (10 000 U penicillin, 10 mg streptomycin/mL) and fetal bovine serum (FBS) were purchased from Merck, Sigma-Aldrich (St. Louis, MO, USA). HEPES (4-(2-hydroxyethyl)-1-piperazineethanesulfonic acid, 1M) was obtained from Gibco, ThermoFisher Scientific (Grand Island, NY, USA). Dulbecco’s phosphate buffered saline (DPBS) was from Gibco, Life Technologies (Paisley, PA4, UK).
2.2. Cell Cultures
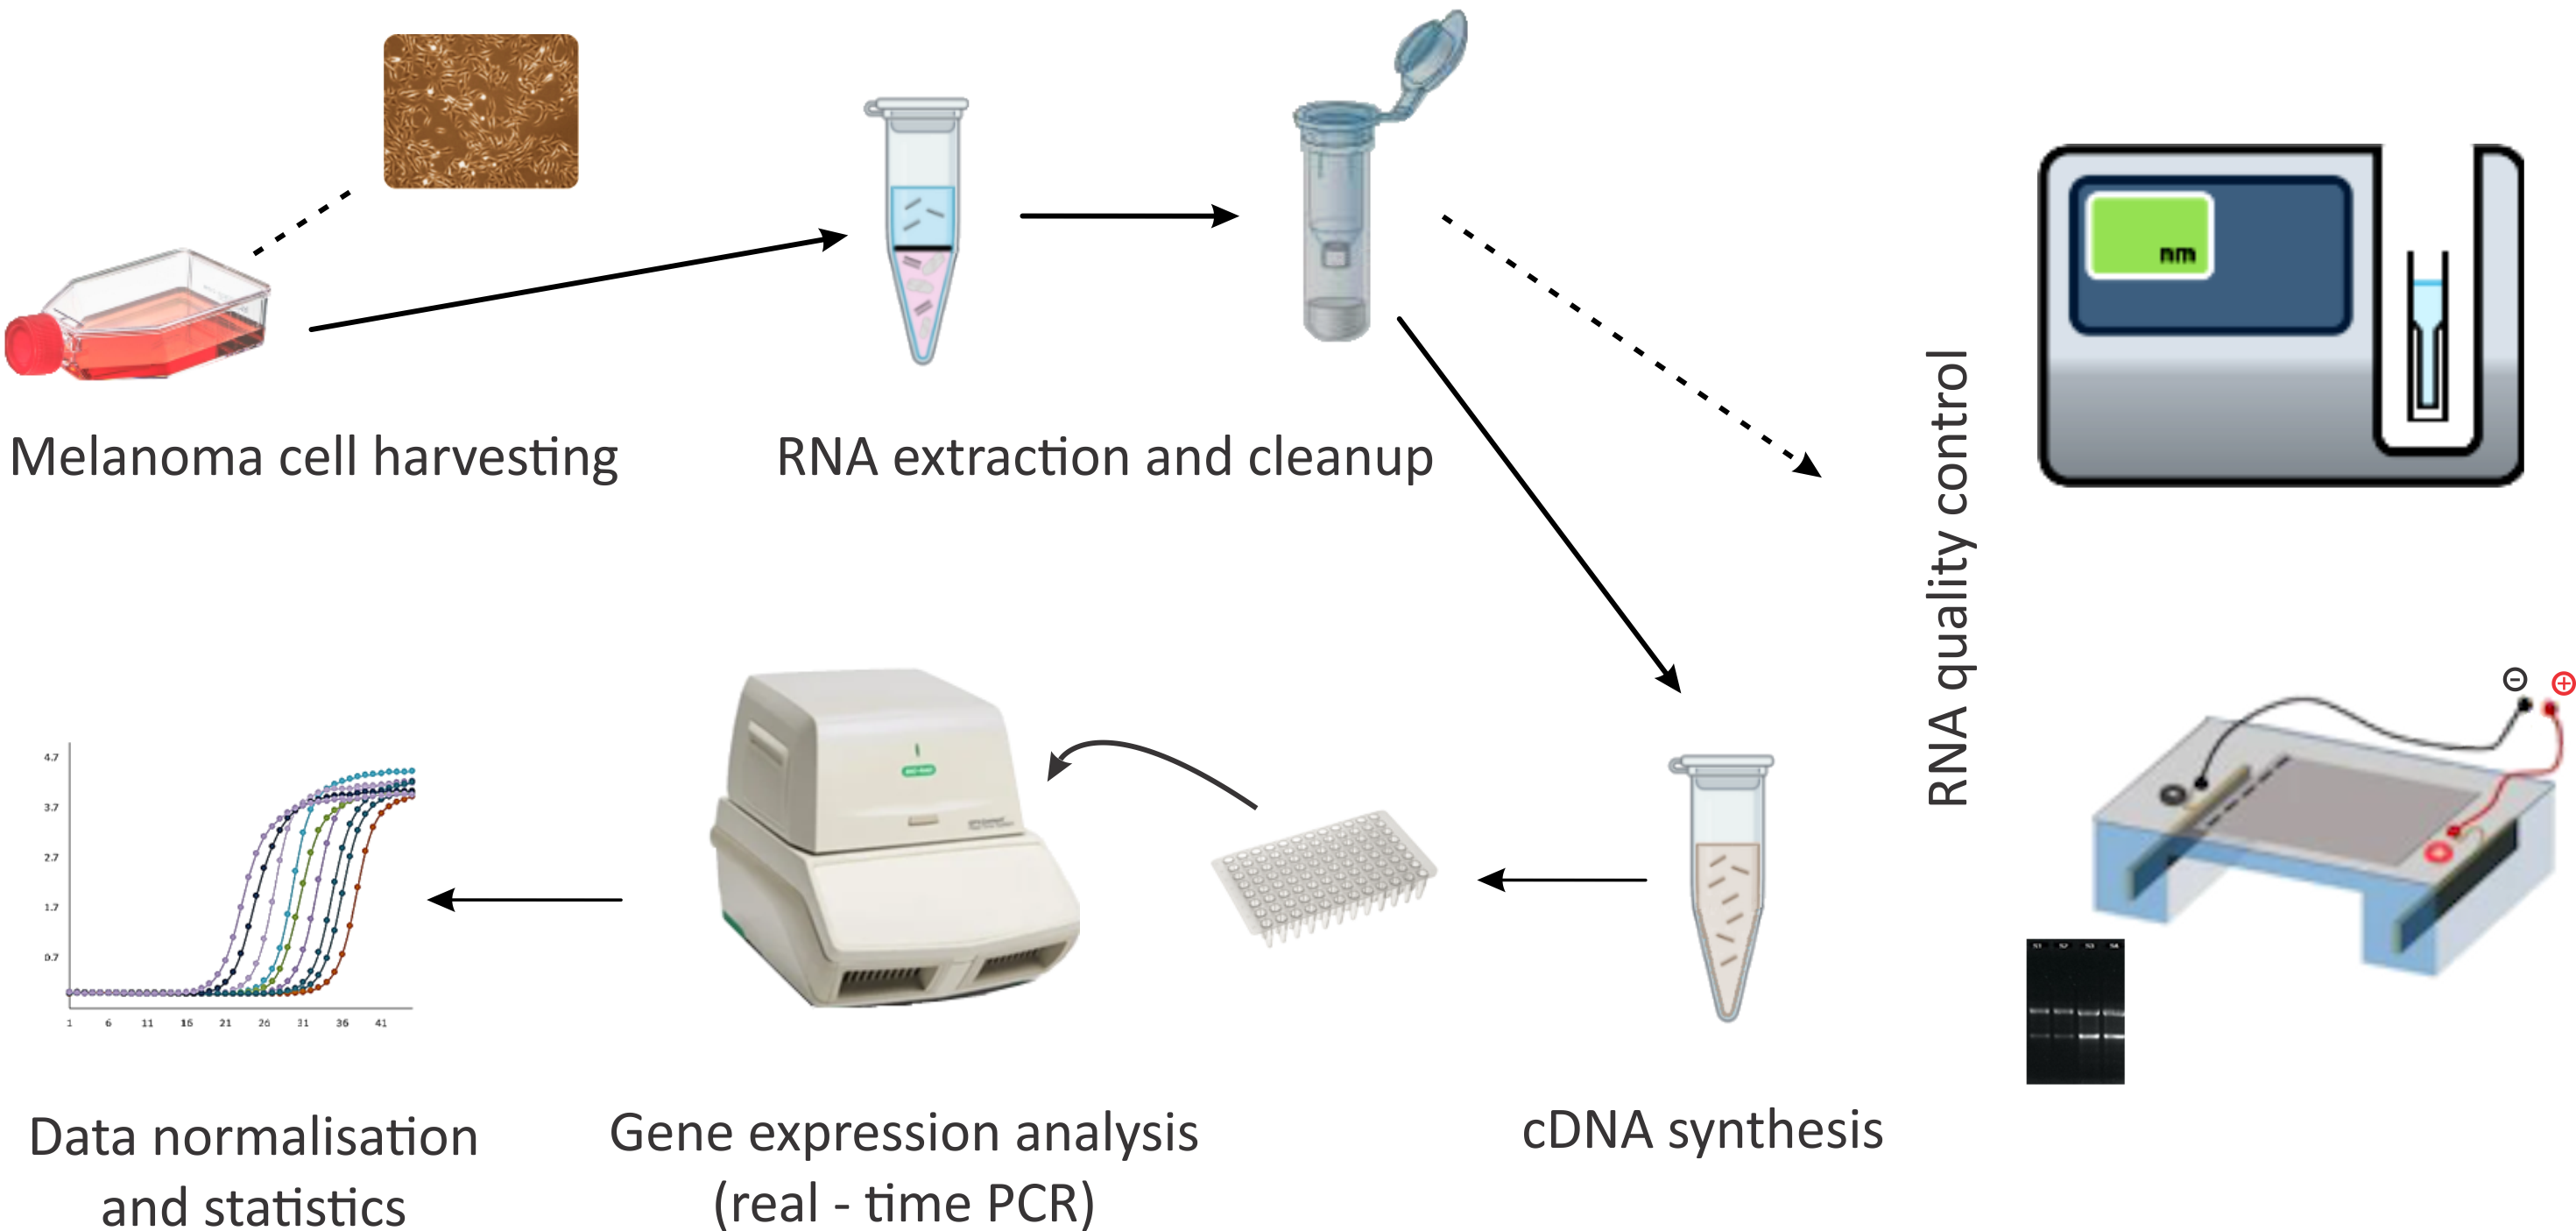
C32 and G361 human melanoma cells were grown in monolayer in McCoy’s 5A Medium, supplemented with HEPES (10 mM), FBS (10%) and antibiotics (penicillin 100 U/mL, streptomycin 100 ug/mL). Cells were seeded into tissue culture flasks at the density of 8 × 10⁴ cells/cm2 and incubated at 37°C in a humidified atmosphere of 95% air and 5% CO2. When the melanoma cultures reached about 80% confluence, the cells were washed twice with DPBS.
2.3. RNA Isolation and Real-Time PCR
Total cellular RNA was extracted from confluent melanoma cell cultures with TRI Reagent® according to the manufacturer’s protocol (Sigma-Aldrich Co, St. Louis, MO, USA). Residual genomic DNA, as well as any traces of melanin were removed using the RNA Clean-up Kit (Syngen Biotech, Wroclaw, Poland). RNA integrity was confirmed by agarose gel electrophoresis. The purity and concentration of the RNA was checked by UV spectrophotometry (MaestroNano MN-913; MaestroGen Inc, Hsinchu, Taiwan). Prior to RT-PCR, the RNA samples were treated with DNase 1 Amplification Grade (Sigma-Aldrich Co, St. Louis, MO, USA) according to the manufacturer's instructions. For cDNA synthesis, two micrograms of total RNA from each sample was reverse transcribed using the iScript™ Advanced cDNA Synthesis Kit for RT-qPCR (Bio-Rad Laboratories, Inc., Hercules, CA, USA) according to the manufacturer’s instructions.
The real-time PCR reactions were performed with the CFX Connect Real-Time System thermal cycler (Bio-Rad Laboratories, Inc., USA). cDNA was amplified using the SsoAdvanced Universal SYBR® Green Supermix (Bio-Rad Laboratories, Inc., Hercules, CA, USA); 20 µL of PCR mix was added to each well of PrimePCR plate containing primers for melanocyte development and pigmentation genes (Melanocyte development and pigmentation PrimePCR Plate 96; Bio-Rad Laboratories, Inc., Hercules, CA, USA). Real-time PCR reactions for SLC7A11 (Hs.390594), SLC45A2 (Hs.278962), CTNS (Hs.187667) and DCT gene (Hs.307865) were performed using individual primers designed for these genes (PrimePCR™ SYBR® Green Assay; Bio-Rad Laboratories).
A thermal cycling program used was: activation at 95°C for 30 s, denaturation at 95°C for 5 s (40 cycles), annealing and extension at 60°C for 30 s (40 cycles) and melt curve at 65-95°C (0.5 increments, 5 sec/step). Cycle threshold (Ct) values were used to quantify gene expression.
2.4. Data Analysis
The Ct values (threshold values) of the target genes were normalized against the Ct values of the housekeeping HPRT1 (hypoxanthine phosphoribosyltransferase 1; Hs.412707) gene, which exhibited a relatively high expression stability in melanoma cell lines [60]. The transcript level of HPRT1 was comparable between the two lines, confirming the accuracy of normalisation. Each sample was analysed in a minimum of three independent replicates, and the mean value was used in the statistical analysis.
The fold change in gene expression between the melanoma G361 and melanoma C32 pair was calculated using the relative quantification 2−ΔΔCt method. Two-fold or more differences in gene expression between C32 and G361 were considered significant.
Data represent the mean ± SEM from three independent experiments. The Shapiro–Wilk test was used to assess the normality of the data. One-way analysis of variance followed by post-hoc Tukey’s test (TIBCO Software Inc. Statistica version 13.3) were used for group comparisons. P-values < 0.05 were considered statistically significant.
3. Results
Analysis of a panel of 40 genes associated with melanocyte development and pigmentation, performed using a plate containing primers specific for these genes, showed detectable expression of all genes in both melanoma cell lines (Figure 1). Among these, six genes (KIT, KITLG, MC1R, POMC, PRKCB, and TYRP1) exhibited the most pronounced differential expression.
Several genes were consistently expressed at high levels in both cell lines, including CTNNB1, GNAS, MITF, PRKAR1A, and TYR. By contrast, high expression restricted to the C32 line was observed for LEF1 and PRKAR2B, whereas TYRP1 was highly expressed only in the G361 line.
Differential expression was observed for three genes encoding transport proteins involved in pheomelanogenesis (Figure 2). SLC7A11 and CTNS expression differed significantly between the two lines (p < 0.05), while SLC45A2 showed an even greater divergence (p < 0.01). Taken together, the melanotic line was characterised by higher expression of SLC45A2 and CTNS, whereas the amelanotic line showed elevated expression of SLC7A11. Unexpectedly, DCT expression was elevated in the amelanotic melanoma cell line relative to the melanotic counterpart. The observed difference in gene expression was highly statistically significant (p < 0.001).
Significant differences in gene expression between the melanoma cell lines studied were defined using a threshold of a twofold relative ratio (R ≥ 2). Using this criterion, 13 genes exhibited higher expression in the C32 line (Table 1), while as many as 20 genes were more highly expressed in the G361 line (Table 2).
The most pronounced differences were observed for PRKCB and KIT, whose expression was increased more than 305-fold and 165-fold, respectively, in G361 cells. Elevated expression of POMC and MC1R was also characteristic of G361, with POMC expressed over 100-fold and MC1R more than 80-fold higher than in C32 cells. Significantly increased expression of TYRP1 was also observed in the non-amelanotic line compared with the amelanotic line, reaching 38-fold higher levels in G361 cells, while TYR expression was approximately two-fold higher. Additional genes showing increased expression in G361 included: GRB2, SLC45A2, PDPK1, PIK3CD, RPS6KA1, FZD2, GNB2L1, CTNNB1, MITF,CTNS, AKT2, FZD5, and PRKG1 (Table 2).
By contrast, genes with higher expression in the amelanotic C32 line included: DCT/TYRP2 (37-fold higher), PRKAR2B (over 16-fold higher), and KITLG (11-fold higher), as well as LEF1, SOX10, PAX3, PRKAR1A, PRKACB, AKT1, SOS1, AKT3, CREBBP, and SLC7A11 (Table 1). The data also demonstrate that the amelanotic and melanotic melanoma cell lines exhibit distinct expression profiles of genes associated with pheomelanogenesis.
4. Discussion
The process of melanogenesis in the skin plays a key role in protection against the harmful effects of UVR. Abnormalities that may occur at different stages of pigment synthesis increase the risk of melanoma development [38,39]. Individuals with blonde hair, blue eyes, and fair skin complexion, i.e. with a phenotype suggesting predominance of pheomelanin, are at a higher risk of tumour transformation. However, little is known about a possible association between pheomelanin levels in melanoma cells and clinical features that ultimately affect disease progression and prognosis.
In the present study, the expression of selected genes associated with pheomelanogenesis was evaluated in melanoma cells displaying different pigmentation phenotypes. The research material consisted of two commercial human malignant melanoma cell lines, C32 and G361 (ATCC). The amelanotic melanoma cell line C32 was derived from a 53-year-old Caucasian male, whereas the non-amelanotic cell line G361 originated from a 31-year-old Caucasian male. C32 cells were obtained from depigmented lesions with a weak pigmentation phenotype, while G361 cells originated from strongly pigmented lesions.
Although the term ‘amelanotic melanoma’ implies a complete absence of tumour pigmentation, these lesions are thought to contain melanin and may be particularly enriched in pheomelanin. Wang et al. [61], using the Coherent Raman Scattering (CRS) microscopy, studied unstained sections of three cutaneous tumour lesions. Examination of normal skin surrounding the lesions revealed no pheomelanin, whereas high concentrations were observed within the amelanotic melanoma lesions. Pheomelanin was detected in all three examined samples. The authors emphasised that in order to determine the frequency of pheomelanotic melanoma among patients diagnosed with amelanotic lesions, a larger number of samples should be analysed.
At present, no direct methods are available to allow quantitative determination of pheomelanin in tissue, and mapping its spatial distribution in the skin also remains challenging. Raman spectroscopy therefore, appears to be a highly promising technique for the early detection of amelanotic melanoma - lesions caused by melanocytes that predominantly synthesise pheomelanin [62]. It should be stressed that amelanotic melanoma poses major diagnostic difficulties due to the lack of pigmentation and non-specific clinical presentation [63]. It is frequently misdiagnosed as dermatitis, which further delays proper diagnosis and the initiation of treatment. Consequently, its prognosis is much poorer compared with pigmented melanoma [64].
In this study, expression profiles of 44 genes associated with melanocyte development and pigmentation were analysed and classified according to their direct or indirect roles in pheomelanogenesis. Among them, particular attention was given to POMC, MC1R, TYRP1, and TYR.
The obtained results indicate that TYR expression was twice as high in G361 cells compared with C32 cells. Literature reports suggest that reduced availability or diminished activity of TYR promotes pheomelanin synthesis, with increased levels confirmed in atypical naevi and melanomas [24]. Furthermore, Hu et al. [65] demonstrated that in uveal melanoma, total eumelanin content was significantly lower than in normal melanocytes. Considering this, it can be assumed with high probability that decreased eumelanin levels in melanoma cells correlate with increased pheomelanin content. A significant difference between the two cell lines was observed in TYRP1 expression, which was more than 48-fold higher in G361 cells. One of the most important functions of the TYRP1 protein is the activation and stabilisation of TYR, thereby influencing the type of melanin synthesised. Mutations in TYRP1 result in the loss of this function, directly affecting TYR activity. Insufficient stabilisation of TYR causes melanogenesis to shift towards pheomelanin [24]. High relative expression values (G361 vs C32) were also recorded for MC1R and POMC, with expression more than 80-fold and 100-fold higher, respectively, in G361 cells. Polymorphisms in MC1R are associated with common variations in skin colour. Some of these genetic variants occur most frequently in fair-skinned individuals, who are consequently more sensitive to UVR. Such polymorphisms increase pheomelanin production [66]. Mutations in the MC1R gene may completely block eumelanin synthesis, directing melanogenesis exclusively towards pheomelanin [24]. Loss of POMC function due to mutations in the POMC gene directly affects MC1R activity, thereby enhancing pheomelanogenesis.
In this study, several other genes with a lesser impact on pheomelanogenesis were also analysed. The greatest difference in expression between the two cell lines was recorded for PRKCB, whose expression was 305-fold higher in G361 cells compared with C32. Overexpression of this gene has been shown to correlate with poor prognosis in cutaneous melanoma. Furthermore, PRKCB mutations affect TYR by inhibiting melanin production, thereby increasing the risk of melanoma transformation [66].
KIT, whose expression was more than 165-fold higher in the non-amelanotic line, is a critical gene in melanogenesis regulation. Hu et al. [67] also demonstrated that KIT interacts with other genes involved in pheomelanogenesis, such as TYR, MITF, and DCT. Moreover, KIT mutations and amplifications are most commonly observed in mucosal and acral melanomas [68,69]. It should be noted that melanoma originates from epidermal melanocytes and shares many molecular similarities with melanocyte precursors. This facilitates melanoma progression. Particularly relevant is the GRB2/PI3K/AKT signalling pathway, which is crucial for melanoma cell migration and invasion, and involves genes of central importance in the present study [69]. In this study, the expression of GRB2 and AKT2 was elevated by more than 10-fold and approximately 2-fold, respectively, in G361 cell. GRB2 has been reported to activate PI3K/AKT signalling, and its overexpression is directly associated with the promotion of secondary tumour formation. Overexpression of AKT induces an invasive melanoma phenotype, contributing to metastasis. Dysregulation of AKT pathway activation is observed in up to 70% of melanoma cases [70]. AKT activation is mediated by PDPK1, whose overexpression due to gene copy number increase occurs in most tumours directly correlating with PI3K/AKT pathway mutations [69,71]. Here, we show that PDPK1 expression was approximately sixfold higher in the non-amelanotic than in the amelanotic cell line.
MITF, which exhibited a threefold higher expression in G361 cells, is a well-characterised transcription factor specific to melanocytes. It coordinates numerous signalling pathways involved in melanoma development. Reduced MITF expression is associated with increased activity of a cell cycle inhibitor, correlating with a higher risk of distant metastases. Moderate MITF expression, in turn, induces melanoma cell proliferation. MITF is activated by SOX10, currently used as a highly sensitive and specific marker in the diagnosis of melanocytic tumours, including metastatic melanoma [69]. In this study, SOX10 expression was four times higher in C32 cells.
Attention should also be drawn to the Wnt/β-catenin signalling pathway, which is involved in melanocyte development]. β-catenin has been shown to play a dual role in both promoting and inhibiting melanoma progression [56]. Expression of CTNNB1, directly engaged in this pathway, was nearly threefold higher in G361 cells. Moreover, Wnt/β-catenin signalling mediates the activation of MITF. Recent studies have shown that activation of this pathway inhibits SOX10 expression, thereby blocking melanoma growth [68]. In summary, MITF, SOX10, and the Wnt/β-catenin signalling cascade share molecular similarities with melanocyte precursors, thereby influencing tumour transformation. Due to its role in melanoma pathogenesis and the significant differences in expression observed between the cell lines, the WNT signalling pathway associated with the FZD family also merits discussion. Deregulation of its components contributes to the metastatic progression of melanoma cells Li et al. [72] described the FZD3 receptor in detail, whose gene, one of three from this family, was also examined in the present study. No significant differences were observed in FZD3 expression between the two lines; however, differences were found for FZD2 and FZD5. FZD2 expression was more than fourfold, and FZD5 was more than twofold higher in G361 cells. Among genes more highly expressed in the amelanotic line compared with the non-amelanotic line were PRKAR2B, KITLG, LEF1, and PAX3. Of particular note is LEF1, whose expression was almost fivefold higher in C32 cells. LEF1 is responsible for tumour growth and progression and mediates MITF activation via the Wnt/β-catenin cascade. Kim et al. [73] demonstrated that LEF1 is highly expressed in cultured melanoma cells, and its inhibition delays melanoma cell growth and reduces proliferation.
The paradoxically high expression of DCT that we observed in the amelanotic melanoma line C32 reflects a deviation from the expected suppression of melanogenic genes in amelanotic cells. Our results indicate that, in amelanotic melanoma, DCT expression may be subject to regulatory cues distinct from those underlying the conventional melanogenic program. Several mechanisms may explain this finding. DCT expression can persist independently of functional melanogenesis through MITF regulation, even when other enzymes of the pathway are inactive [74]. Moreover, DCT may exert unconventional functions, such as antioxidant activity and roles in cell survival and signalling, which could confer an advantage to tumour cells [74,75]. Oncogenic alterations present in C32 (BRAF V600E mutation, PTEN loss) may further drive DCT transcription via MAPK and PI3K/AKT signalling [76]. Finally, incomplete silencing of the melanocytic programme or defects in protein processing could account for high mRNA levels without pigment production [77].
Transporter genes involved in pheomelanogenesis, such as SLC7A11, SLC45A2, and CTNS, are key regulators of cysteine and melanosomal metabolite availability. We observed that their expression differed across melanoma lines, implying a potential role in the observed variations in pheomelanin synthesis. To date, only limited literature is available regarding the expression of these genes, with most reports focusing on the effects of their silencing [78]. In the present study, we observed clear differences in their expression between the melanoma cell lines analysed. For SLC7A11 (xCT), higher expression was detected in the amelanotic C32 line. This gene encodes a transmembrane exchanger that regulates the uptake of cysteine into the cell and the export of glutamate. In melanocytes, SLC7A11 is directly involved in pheomelanin synthesis and plays a comparatively smaller role in eumelanin production [45]. Our findings therefore suggest 2-fold greater activity of this exchanger in the amelanotic line, which is very likely to promote increased pheomelanin synthesis in these cells. By contrast, SLC45A2 expression was substantially higher (10-fold) in the melanotic G361 line. This gene contributes to melanin biosynthesis by encoding a protein localised in the melanosomal membrane, where it regulates melanosomal pH and thereby modulates tyrosinase activity [48,54]. The protein, also known as the H+/sugar cotransporter, helps to neutralise melanosomal pH, preventing the reduction of tyrosinase activity (with its optimum pH being 6.8) [52]. Loss of function of SLC45A2 has been associated with reduced pigmentation and an increased risk of melanocyte carcinogenesis [79]. Furthermore, in vitro and in vivo studies in mice have demonstrated that deletion of this gene can accelerate melanoma progression and metastasis [55]. A similar pattern was observed for CTNS, where expression was higher in the melanotic G361 line. The CTNS gene encodes a protein that also participates in the regulation of melanosomal pH and influences tyrosinase activity [80]. Silencing of this gene results in melanosomal acidification (pH 5.8-6.3), which in turn inhibits tyrosinase activity. Under such conditions of reduced tyrosinase function, dopaquinone reacts with cysteine to form cysteinyl-DOPA, leading to increased pheomelanin synthesis [47,81]. Taken together, the higher expression of SLC45A2 and CTNS observed in the G361 line strongly suggests that melanogenesis in these cells is shifted towards eumelanogenesis, which in patients may correspond to the black pigmentation typically observed in such tumours.
5. Conclusions
Our study demonstrates that melanoma cell lines with distinct pigmentation phenotypes exhibit markedly different expression profiles of genes involved in melanogenesis and pheomelanogenesis. The paradoxically high expression of DCT in the amelanotic C32 line suggests that melanogenic genes may be regulated independently of visible pigment production, potentially reflecting alternative function of DCT in cell survival and signalling. Moreover, differential expression of transporter genes such as SLC7A11, SLC45A2, and CTNS suggests that the balance between cysteine availability and melanosomal environment critically influences the synthesis of pheomelanin versus eumelanin. Specifically, elevated SLC7A11 expression in amelanotic C32 cells may promote pheomelanin accumulation, whereas higher SLC45A2 and CTNS levels in melanotic G361 cells likely favour eumelanogenesis.
These findings highlight the complex molecular regulation of pigment synthesis in melanoma, and suggest that pheomelanin-related pathways may contribute to tumour phenotype, potentially affecting tumorigenesis, progression, and response to UVR. Understanding the distinct genetic and functional profiles of amelanotic and melanotic melanoma cells may provide insights into their differing clinical behaviour and could inform future diagnostic and therapeutic strategies targeting pigment-related pathways.
Supplementary Materials
The following supporting information can be downloaded at the website of this paper posted on Preprints.org. Table S1. List of genes assessed for expression with the Melanocyte Development and Pigmentation PrimePCR™ Plate (Bio-Rad Laboratories, Inc.).
Author Contributions
Conceptualisation, I.T, Ł.M. and S.K.; methodology, I.T.; formal analysis, I.T.; investigation, I.T, Ł.M., S.K. and J.S.; writing-original draft, I.T, Ł.M. and S.K.; writing-review and editing, I.T, Ł.M., S.K. and J.S.; visualisation, I.T. and S.K.; supervision, J.S.; project administration, I.T. and J.S. All authors have read and agreed to the published version of the manuscript.
Funding
This research was funded by the Medical University of Silesia in Katowice, Poland (grant no. PCN-1-046/K/1/F and BNW-1-054/K/3/F).
Data Availability Statement
The original contributions presented in this study are included in the article material. Further inquiries can be directed to the corresponding author.
Conflicts of Interest
The authors declare no conflicts of interest.
Abbreviations
The following abbreviations are used in this manuscript:
cAMP
Cyclic adenosine
monophosphate
CPDs
Cyclobutane pirymidine
dimers
CREB
cAMP response element
binding protein
CTNS
Lysosomal cysteine
transporter
DCT
Dopachrome tautomerase
(alias Tyrosinase-related protein 2)
GSH
Glutathione
MC1R
Melanocortin 1 receptor
MITF
Microphthalmia-associated
transcription factor
MSH
Melanocyte stimulating
hormone
PKA
Protein kinase A
PKC
Protein kinase C
POMC
Proopiomelanocortin
ROS
Reactive oxygen species
sAC
Soluble adenylyl cyclase
SOX
SRY-Box transcription factor
TYR
Tyrosinase
TYRP1
Tyrosinase-related protein 1
TYRP2
Tyrosinase-related protein 2
UVR
Ultraviolet radiation
References
- Yamaguchi, Y.; Brenner, M.; Hearing, V.J. The Regulation of Skin Pigmentation *. J. Biol. Chem. 2007, 282, 27557–27561. [Google Scholar] [CrossRef]
- Brenner, M.; Hearing, V.J. The Protective Role of Melanin Against UV Damage in Human Skin†. Photochem. Photobiol. 2008, 84, 539–549. [Google Scholar] [CrossRef]
- Cichorek, M.; Wachulska, M.; Stasiewicz, A.; Tymińska, A. Review Paper<br>Skin Melanocytes: Biology and Development. Adv. Dermatol. Allergol. Dermatol. Alergol. 2013, 30, 30–41. [Google Scholar] [CrossRef]
- Borovanský, J.; Riley, P.A. Physiological and Pathological Functions of Melanosomes. In Melanins and Melanosomes. In Melanins and Melanosomes; Borovanský, J., Riley, P.A., Eds.; Wiley-Blackwell: Weinheim, Germany, 2011; ISBN 978-3-527-32892-5. [Google Scholar]
- Park, H.Y.; Kosmadaki, M.; Yaar, M.; Gilchrest, B.A. Cellular Mechanisms Regulating Human Melanogenesis. Cell. Mol. Life Sci. 2009, 66, 1493–1506. [Google Scholar] [CrossRef]
- Bae-Harboe, Y.-S.C.; Park, H.-Y. Tyrosinase: A Central Regulatory Protein for Cutaneous Pigmentation. J. Invest. Dermatol. 2012, 132, 2678–2680. [Google Scholar] [CrossRef]
- Videira, I.F. dos S.; Moura, D.F.L.; Magina, S. Mechanisms Regulating Melanogenesis*. An. Bras. Dermatol. 2013, 88, 76–83. [Google Scholar] [CrossRef]
- D’Mello, S.; Finlay, G.; Baguley, B.; Askarian-Amiri, M. Signaling Pathways in Melanogenesis. Int. J. Mol. Sci. 2016, 17, 1144. [Google Scholar] [CrossRef] [PubMed]
- Ito, S.; Wakamatsu, K. Chemistry of Mixed Melanogenesis—Pivotal Roles of Dopaquinone. Photochem. Photobiol. 2008, 84, 582–592. [Google Scholar] [CrossRef] [PubMed]
- Simon, J.D.; Peles, D.; Wakamatsu, K.; Ito, S. Current Challenges in Understanding Melanogenesis: Bridging Chemistry, Biological Control, Morphology, and Function. Pigment Cell Melanoma Res. 2009, 22, 563–579. [Google Scholar] [CrossRef] [PubMed]
- Kondo, T.; Hearing, V.J. Update on the Regulation of Mammalian Melanocyte Function and Skin Pigmentation. Expert Rev. Dermatol. 2011, 6, 97–108. [Google Scholar] [CrossRef]
- Buscà, R.; Ballotti, R. Cyclic AMP a Key Messenger in the Regulation of Skin Pigmentation. Pigment Cell Res. 2000, 13, 60–69. [Google Scholar] [CrossRef]
- Aoki, H.; Moro, O. Involvement of Microphthalmia-Associated Transcription Factor (MITF) in Expression of Human Melanocortin-1 Receptor (MC1R). Life Sci. 2002, 71, 2171–2179. [Google Scholar] [CrossRef] [PubMed]
- Vachtenheim, J.; Borovanský, J. “Transcription Physiology” of Pigment Formation in Melanocytes: Central Role of MITF. Exp. Dermatol. 2010, 19, 617–627. [Google Scholar] [CrossRef]
- Slominski, A.; Wortsman, J. Neuroendocrinology of the Skin1. Endocr. Rev. 2000, 21, 457–487. [Google Scholar] [CrossRef] [PubMed]
- Abdel-Malek, Z.A.; Swope, V.B. Epidermal Melanocytes: Regulation of Their Survival, Proliferation, and Function in Human Skin. In Melanoma Development: Molecular Biology, Genetics and Clinical Application; Bosserhoff, A., Ed.; Springer: Vienna, Austria, 2011; ISBN 978-3-7091-0371-5. [Google Scholar]
- Park, H.-Y.; Wu, C.; Yonemoto, L.; Murphy-Smith, M.; Wu, H.; Stachur, C.M.; Gilchrest, B.A. MITF Mediates CAMP-Induced Protein Kinase C-β Expression in Human Melanocytes. Biochem. J. 2006, 395, 571–578. [Google Scholar] [CrossRef] [PubMed]
- Denning, M.F. Specifying Protein Kinase C Functions in Melanoma. Pigment Cell Melanoma Res. 2012, 25, 466–476. [Google Scholar] [CrossRef]
- Wegner, M. All Purpose Sox: The Many Roles of Sox Proteins in Gene Expression. SOX Transcr. Factors 2010, 42, 381–390. [Google Scholar] [CrossRef]
- Kubic, J.D.; Young, K.P.; Plummer, R.S.; Ludvik, A.E.; Lang, D. Pigmentation PAX-ways: The Role of Pax3 in Melanogenesis, Melanocyte Stem Cell Maintenance, and Disease. Pigment Cell Melanoma Res. 2008, 21, 627–645. [Google Scholar] [CrossRef]
- Solano, F. Melanins: Skin Pigments and Much More—Types, Structural Models, Biological Functions, and Formation Routes. New J. Sci. 2014, 2014, C. [Google Scholar] [CrossRef]
- Takeuchi, S.; Zhang, W.; Wakamatsu, K.; Ito, S.; Hearing, V.J.; Kraemer, K.H.; Brash, D.E. Melanin Acts as a Potent UVB Photosensitizer to Cause an Atypical Mode of Cell Death in Murine Skin. Proc. Natl. Acad. Sci. 2004, 101, 15076–15081. [Google Scholar] [CrossRef]
- Mariano, A.; Bigioni, I.; Scotto d’Abusco, A.; Baseggio Conrado, A.; Maina, S.; Francioso, A.; Mosca, L.; Fontana, M. Pheomelanin Effect on UVB Radiation-Induced Oxidation/Nitration of l-Tyrosine. Int. J. Mol. Sci. 2021, 23, 267. [Google Scholar] [CrossRef]
- Nasti, T.H.; Timares, L. MC1R, Eumelanin and Pheomelanin: Their Role in Determining the Susceptibility to Skin Cancer. Photochem. Photobiol. 2015, 91, 188–200. [Google Scholar] [CrossRef]
- Riley, P.A. Melanogenesis and Melanoma. Pigment Cell Res. 2003, 16, 548–552. [Google Scholar] [CrossRef]
- Zanetti, R.; Prota, G.; Napolitano, A.; Martinez, C.; Sancho-Garnier, H.; Østerlind, A.; Sacerdote, C.; Rosso, S. Development of an Integrated Method of Skin Phenotype Measurement Using the Melanins. Melanoma Res. 2001, 11, 551–557. [Google Scholar] [CrossRef]
- Morgan, A.M.; Lo, J.; Fisher, D.E. How Does Pheomelanin Synthesis Contribute to Melanomagenesis?: Two Distinct Mechanisms Could Explain the Carcinogenicity of Pheomelanin Synthesis. BioEssays 2013, 35, 672–676. [Google Scholar] [CrossRef]
- Srivastava, M.K.; Sinha, P.; Clements, V.K.; Rodriguez, P.; Ostrand-Rosenberg, S. Myeloid-Derived Suppressor Cells Inhibit T-Cell Activation by Depleting Cystine and Cysteine. Cancer Res. 2010, 70, 68–77. [Google Scholar] [CrossRef] [PubMed]
- Kusmartsev, S.; Nefedova, Y.; Yoder, D.; Gabrilovich, D.I. Antigen-Specific Inhibition of CD8+ T Cell Response by Immature Myeloid Cells in Cancer Is Mediated by Reactive Oxygen Species. J. Immunol. 2004, 172, 989–999. [Google Scholar] [CrossRef] [PubMed]
- Boyle, J.L.; Haupt, H.M.; Stern, J.B.; Multhaupt, H.A.B. Tyrosinase Expression in Malignant Melanoma, Desmoplastic Melanoma, and Peripheral Nerve Tumors. Arch. Pathol. Lab. Med. 2002, 126, 816–822. [Google Scholar] [CrossRef]
- Stevens, G.L.; Scheer, W.D.; Levine, E.A. Detection of Tyrosinase MRNA from the Blood of Melanoma Patients. Cancer Epidemiol. Biomarkers Prev. 1996, 5, 293–296. [Google Scholar] [PubMed]
- Wakamatsu, K.; Fukushima, S.; Minagawa, A.; Omodaka, T.; Hida, T.; Hatta, N.; Takata, M.; Uhara, H.; Okuyama, R.; Ihn, H. Significance of 5-S-Cysteinyldopa as a Marker for Melanoma. Int. J. Mol. Sci. 2020, 21, 432. [Google Scholar] [CrossRef]
- Ranadive, N.S.; Shirwadkar, S.; Persad, S.; Menon, I.A. Effects of Melanin-Induced Free Radicals on the Isolated Rat Peritoneal Mast Cells. J. Invest. Dermatol. 1986, 86, 303–307. [Google Scholar] [CrossRef] [PubMed]
- Galván, I.; Inácio, Â.; Romero-Haro, A.A.; Alonso-Alvarez, C. Adaptive Downregulation of Pheomelanin-related Slc7a11 Gene Expression by Environmentally Induced Oxidative Stress. Mol Ecol 2017, 26, 849–858. [Google Scholar] [CrossRef]
- Premi, S. Role of Melanin Chemiexcitation in Melanoma Progression and Drug Resistance. Front. Oncol. 2020, 10, 1305. [Google Scholar] [CrossRef]
- Premi, S.; Wallisch, S.; Mano, C.M.; Weiner, A.B.; Bacchiocchi, A.; Wakamatsu, K.; Bechara, E.J.H.; Halaban, R.; Douki, T.; Brash, D.E. Chemiexcitation of Melanin Derivatives Induces DNA Photoproducts Long after UV Exposure. Science 2015, 347, 842–847. [Google Scholar] [CrossRef] [PubMed]
- Kobayashi, T.; Hearing, V.J. Direct Interaction of Tyrosinase with Tyrp1 to Form Heterodimeric Complexes in Vivo. J. Cell Sci. 2007, 120, 4261–4268. [Google Scholar] [CrossRef]
- Slominski, R.M.; Sarna, T.; Płonka, P.M.; Raman, C.; Brożyna, A.A.; Slominski, A.T. Melanoma, Melanin, and Melanogenesis: The Yin and Yang Relationship. Front. Oncol. 2022, 12, 842496. [Google Scholar] [CrossRef]
- Snyman, M.; Walsdorf, R.E.; Wix, S.N.; Gill, J.G. The Metabolism of Melanin Synthesis—From Melanocytes to Melanoma. Pigment Cell Melanoma Res. 2024, 37, 438–452. [Google Scholar] [CrossRef]
- Costin, G.-E.; Hearing, V.J. Human Skin Pigmentation: Melanocytes Modulate Skin Color in Response to Stress. FASEB J. 2007, 21, 976–994. [Google Scholar] [CrossRef]
- Aberdam, E.; Bertolotto, C.; Sviderskaya, E.V.; Thillot, V. de; Hemesath, T.J.; Fisher, D.E.; Bennett, D.C.; Ortonne, J.-P.; Ballotti, R. Involvement of Microphthalmia in the Inhibition of Melanocyte Lineage Differentiation and of Melanogenesis by Agouti Signal Protein *. J. Biol. Chem. 1998, 273, 19560–19565. [Google Scholar] [CrossRef] [PubMed]
- Vachtenheim, J.; Novotna, H.; Ghanem, G. Transcriptional Repression of the Microphthalmia Gene in Melanoma Cells Correlates with the Unresponsiveness of Target Genes to Ectopic Microphthalmia-Associated Transcription Factor. J. Invest. Dermatol. 2001, 117, 1505–1511. [Google Scholar] [CrossRef] [PubMed]
- Harno, E.; Gali Ramamoorthy, T.; Coll, A.P.; White, A. POMC: The Physiological Power of Hormone Processing. Physiol. Rev. 2018, 98, 2381–2430. [Google Scholar] [CrossRef]
- Wakamatsu, K.; Zippin, J.H.; Ito, S. Chemical and Biochemical Control of Skin Pigmentation with Special Emphasis on Mixed Melanogenesis. Pigment Cell Melanoma Res. 2021, 34, 730–747. [Google Scholar] [CrossRef]
- Galván, I.; Inácio, Â.; Dañino, M.; Corbí-Llopis, R.; Monserrat, M.T.; Bernabeu-Wittel, J. High SLC7A11 Expression in Normal Skin of Melanoma Patients. Cancer Epidemiol. 2019, 62, 101582. [Google Scholar] [CrossRef]
- Chintala, S.; Li, W.; Lamoreux, M.L.; Ito, S.; Wakamatsu, K.; Sviderskaya, E.V.; Bennett, D.C.; Park, Y.-M.; Gahl, W.A.; Huizing, M.; et al. Slc7a11 Gene Controls Production of Pheomelanin Pigment and Proliferation of Cultured Cells. Proc. Natl. Acad. Sci. 2005, 102, 10964–10969. [Google Scholar] [CrossRef] [PubMed]
- Chiaverini, C.; Sillard, L.; Flori, E.; Ito, S.; Briganti, S.; Wakamatsu, K.; Fontas, E.; Berard, E.; Cailliez, M.; Cochat, P.; et al. Cystinosin Is a Melanosomal Protein That Regulates Melanin Synthesis. FASEB J. 2012, 26, 3779–3789. [Google Scholar] [CrossRef]
- Koppula, P.; Zhang, Y.; Zhuang, L.; Gan, B. Amino Acid Transporter SLC7A11/XCT at the Crossroads of Regulating Redox Homeostasis and Nutrient Dependency of Cancer. Cancer Commun. 2018, 38, 1–13. [Google Scholar] [CrossRef]
- Ohbayashi, N.; Fukuda, M. Recent Advances in Understanding the Molecular Basis of Melanogenesis in Melanocytes. F1000Research 2020, 9, F1000. [Google Scholar] [CrossRef] [PubMed]
- Ancans, J.; Tobin, D.J.; Hoogduijn, M.J.; Smit, N.P.; Wakamatsu, K.; Thody, A.J. Melanosomal PH Controls Rate of Melanogenesis, Eumelanin/Phaeomelanin Ratio and Melanosome Maturation in Melanocytes and Melanoma Cells. Exp. Cell Res. 2001, 268, 26–35. [Google Scholar] [CrossRef] [PubMed]
- Ota, K.; Zhou, D.; Zippin, J. 2321: Soluble Adenylyl Cyclase (SAC) Regulates Melanogenesis and Melanocyte Response to UVB. J. Clin. Transl. Sci. 2017, 1, 7–7. [Google Scholar] [CrossRef]
- Le, L.; Escobar, I.E.; Ho, T.; Lefkovith, A.J.; Latteri, E.; Haltaufderhyde, K.D.; Dennis, M.K.; Plowright, L.; Sviderskaya, E.V.; Bennett, D.C.; et al. SLC45A2 Protein Stability and Regulation of Melanosome PH Determine Melanocyte Pigmentation. Mol. Biol. Cell 2020, 31, 2687–2702. [Google Scholar] [CrossRef]
- Ibarrola-Villava, M.; Fernandez, L.P.; Alonso, S.; Boyano, M.D.; Peña-Chilet, M.; Pita, G.; Aviles, J.A.; Mayor, M.; Gomez-Fernandez, C.; Casado, B.; et al. A Customized Pigmentation SNP Array Identifies a Novel SNP Associated with Melanoma Predisposition in the SLC45A2 Gene. PLoS ONE 2011, 6, e19271. [Google Scholar] [CrossRef]
- Park, J.; Talukder, A.H.; Lim, S.A.; Kim, K.; Pan, K.; Melendez, B.; Bradley, S.D.; Jackson, K.R.; Khalili, J.S.; Wang, J.; et al. SLC45A2: A Melanoma Antigen with High Tumor Selectivity and Reduced Potential for Autoimmune Toxicity. Cancer Immunol. Res. 2017, 5, 618–629. [Google Scholar] [CrossRef]
- Liu, Y.; Chi, W.; Tao, L.; Wang, G.; Deepak, R.N.V.K.; Sheng, L.; Chen, T.; Feng, Y.; Cao, X.; Cheng, L.; et al. Ablation of Proton/Glucose Exporter SLC45A2 Enhances Melanosomal Glycolysis to Inhibit Melanin Biosynthesis and Promote Melanoma Metastasis. J. Invest. Dermatol. 2022, 142, 2744–2755.e9. [Google Scholar] [CrossRef]
- Liu, J.; Fukunaga-Kalabis, M.; Li, L.; Herlyn, M. Developmental Pathways Activated in Melanocytes and Melanoma. Adv. Melanocyte Melanoma Biol. 2014, 563, 13–21. [Google Scholar] [CrossRef]
- Muinonen-Martin, A.J.; O’Shea, S.J.; Newton-Bishop, J. Amelanotic Melanoma. BMJ 2018, 360, k826. [Google Scholar] [CrossRef]
- Gong, H.-Z.; Zheng, H.-Y.; Li, J. Amelanotic Melanoma. Melanoma Res. 2019, 29, 221–230. [Google Scholar] [CrossRef]
- Dzierżęga-Lęcznar, A.; Kurkiewicz, S.; Tam, I.; Marek, Ł.; Stępień, K. Pheomelanin Content of Cultured Human Melanocytes from Lightly and Darkly Pigmented Skin: A Pyrolysis-Gas Chromatography/Tandem Mass Spectrometry Study. J. Anal. Appl. Pyrolysis 2017, 124, 349–354. [Google Scholar] [CrossRef]
- Christensen, J.N.; Schmidt, H.; Steiniche, T.; Madsen, M. Identification of Robust Reference Genes for Studies of Gene Expression in FFPE Melanoma Samples and Melanoma Cell Lines. Melanoma Res. 2020, 30, 26–38. [Google Scholar] [CrossRef] [PubMed]
- Wang, H.; Osseiran, S.; Igras, V.; Nichols, A.J.; Roider, E.M.; Pruessner, J.; Tsao, H.; Fisher, D.E.; Evans, C.L. In Vivo Coherent Raman Imaging of the Melanomagenesis-Associated Pigment Pheomelanin. Sci. Rep. 2016, 6, 37986. [Google Scholar] [CrossRef] [PubMed]
- Neves, A.C. de O.; Zougagh, M.; Ríos, Á.; Tauler, R.; Wakamatsu, K.; Galván, I. Pheomelanin Subunit Non-Destructive Quantification by Raman Spectroscopy and Multivariate Curve Resolution-Alternating Least Squares (MCR-ALS). Chemom. Intell. Lab. Syst. 2021, 217, 104406. [Google Scholar] [CrossRef]
- Adler, M.; White, C. Amelanotic Malignant Melanoma. Semin Cutan Med Surg 1997, 16, 122–130. [Google Scholar] [CrossRef]
- Cheung, W.L.; Patel, R.R.; Leonard, A.; Firoz, B.; Meehan, S.A. Amelanotic Melanoma: A Detailed Morphologic Analysis with Clinicopathologic Correlation of 75 Cases. J. Cutan. Pathol. 2012, 39, 33–39. [Google Scholar] [CrossRef]
- Hu, D.-N.; Wakamatsu, K.; Ito, S.; McCormick, S.A. Comparison of Eumelanin and Pheomelanin Content between Cultured Uveal Melanoma Cells and Normal Uveal Melanocytes. Melanoma Res. 2009, 19, 75–79. [Google Scholar] [CrossRef]
- Wang, J.; Yang, J. Identification of Significant Genes with a Poor Prognosis in Skin Cutaneous Malignant Melanoma Based on a Bioinformatics Analysis. Ann. Transl. Med. 2022, 10, 448–448. [Google Scholar] [CrossRef] [PubMed]
- Hu, S.; Chen, Y.; Zhao, B.; Yang, N.; Chen, S.; Shen, J.; Bao, G.; Wu, X. KIT Is Involved in Melanocyte Proliferation, Apoptosis and Melanogenesis in the Rex Rabbit. PeerJ 2020, 8, e9402. [Google Scholar] [CrossRef]
- Guo, W.; Wang, H.; Li, C. Signal Pathways of Melanoma and Targeted Therapy. Signal Transduct. Target. Ther. 2021, 6, 424. [Google Scholar] [CrossRef] [PubMed]
- Pu, Y.; Lei, M.; Chen, Y.; Huang, Y.; Zhang, L.; Chen, J.; Zhang, Y.; Shao, X.; Liu, L.; Chen, J. Hey1 Promotes Migration and Invasion of Melanoma Cells via GRB2/PI3K/AKT Signaling Cascade. J. Cancer 2021, 12, 6979–6988. [Google Scholar] [CrossRef]
- Robertson, G.P. Functional and Therapeutic Significance of Akt Deregulation in Malignant Melanoma. Cancer Metastasis Rev. 2005, 24, 273–285. [Google Scholar] [CrossRef] [PubMed]
- Gagliardi, P.A.; Puliafito, A.; Primo, L. PDK1: At the Crossroad of Cancer Signaling Pathways. AGC Kinases Cancer Metastasis Immunocheckpoint Regul. Drug Resist. 2018, 48, 27–35. [Google Scholar] [CrossRef]
- Li, C.; Nguyen, V.; Clark, K.N.; Zahed, T.; Sharkas, S.; Filipp, F.V.; Boiko, A.D. Down-Regulation of FZD3 Receptor Suppresses Growth and Metastasis of Human Melanoma Independently of Canonical WNT Signaling. Proc. Natl. Acad. Sci. 2019, 116, 4548–4557. [Google Scholar] [CrossRef]
- Kim, G.-H.; Fang, X.-Q.; Lim, W.-J.; Park, J.; Kang, T.-B.; Kim, J.H.; Lim, J.-H. Cinobufagin Suppresses Melanoma Cell Growth by Inhibiting LEF1. Int. J. Mol. Sci. 2020, 21, 6706. [Google Scholar] [CrossRef] [PubMed]
- Ainger, S.A.; Yong, X.L.; Wong, S.S.; Skalamera, D.; Gabrielli, B.; Leonard, J.H.; Sturm, R.A. DCT Protects Human Melanocytic Cells from UVR and ROS Damage and Increases Cell Viability. Exp. Dermatol. 2014, 23, 916–921. [Google Scholar] [CrossRef] [PubMed]
- Roider, E.; Lakatos, A.I.T.; McConnell, A.M.; Wang, P.; Mueller, A.; Kawakami, A.; Tsoi, J.; Szabolcs, B.L.; Ascsillán, A.A.; Suita, Y.; et al. MITF Regulates IDH1, NNT, and a Transcriptional Program Protecting Melanoma from Reactive Oxygen Species. Sci. Rep. 2024, 14, 21527. [Google Scholar] [CrossRef] [PubMed]
- Dankort, D.; Curley, D.P.; Cartlidge, R.A.; Nelson, B.; Karnezis, A.N.; Damsky Jr, W.E.; You, M.J.; DePinho, R.A.; McMahon, M.; Bosenberg, M. BrafV600E Cooperates with Pten Loss to Induce Metastatic Melanoma. Nat. Genet. 2009, 41, 544–552. [Google Scholar] [CrossRef]
- Laurette, P.; Coassolo, S.; Davidson, G.; Michel, I.; Gambi, G.; Yao, W.; Sohier, P.; Li, M.; Mengus, G.; Larue, L.; et al. Chromatin Remodellers Brg1 and Bptf Are Required for Normal Gene Expression and Progression of Oncogenic Braf-Driven Mouse Melanoma. Cell Death Differ. 2020, 27, 29–43. [Google Scholar] [CrossRef]
- Li, P.; Yu, J.; Huang, F.; Zhu, Y.-Y.; Chen, D.-D.; Zhang, Z.-X.; Xie, Z.-C.; Liu, Z.-Y.; Hou, Q.; Xie, N.; et al. SLC7A11-Associated Ferroptosis in Acute Injury Diseases: Mechanisms and Strategies. Eur. Rev. Med. Pharmacol. Sci. 2023, 27, 4386–4398. [Google Scholar] [CrossRef] [PubMed]
- Hopkins, Z.H.; Carlisle, R.P.; Frost, Z.E.; Curtis, J.A.; Ferris, L.K.; Secrest, A.M. Risk Factors and Predictors of Survival Among Patients with Amelanotic Melanoma Compared to Melanotic Melanoma in the National Cancer Database. J. Clin. Aesthetic Dermatol. 2021, 14, 36–43. [Google Scholar]
- Bin, B.-H.; Bhin, J.; Yang, S.H.; Shin, M.; Nam, Y.-J.; Choi, D.-H.; Shin, D.W.; Lee, A.-Y.; Hwang, D.; Cho, E.-G.; et al. Membrane-Associated Transporter Protein (MATP) Regulates Melanosomal PH and Influences Tyrosinase Activity. PLOS ONE 2015, 10, e0129273. [Google Scholar] [CrossRef]
- Ito, S.; Wakamatsu, K. Human Hair Melanins: What We Have Learned and Have Not Learned from Mouse Coat Color Pigmentation. Pigment Cell Melanoma Res. 2011, 24, 63–74. [Google Scholar] [CrossRef]
Figure 1.
Comparative expression of genes involved in development and pigmentation in amelanotic C32 and melanotic G361 melanoma cells. The bar graphs depict mRNA expression levels (Ct values) normalized to HPRT1 (mean ± SD), where higher bars indicate lower gene expression. Ph - pheomelanogenesis-associated genes.
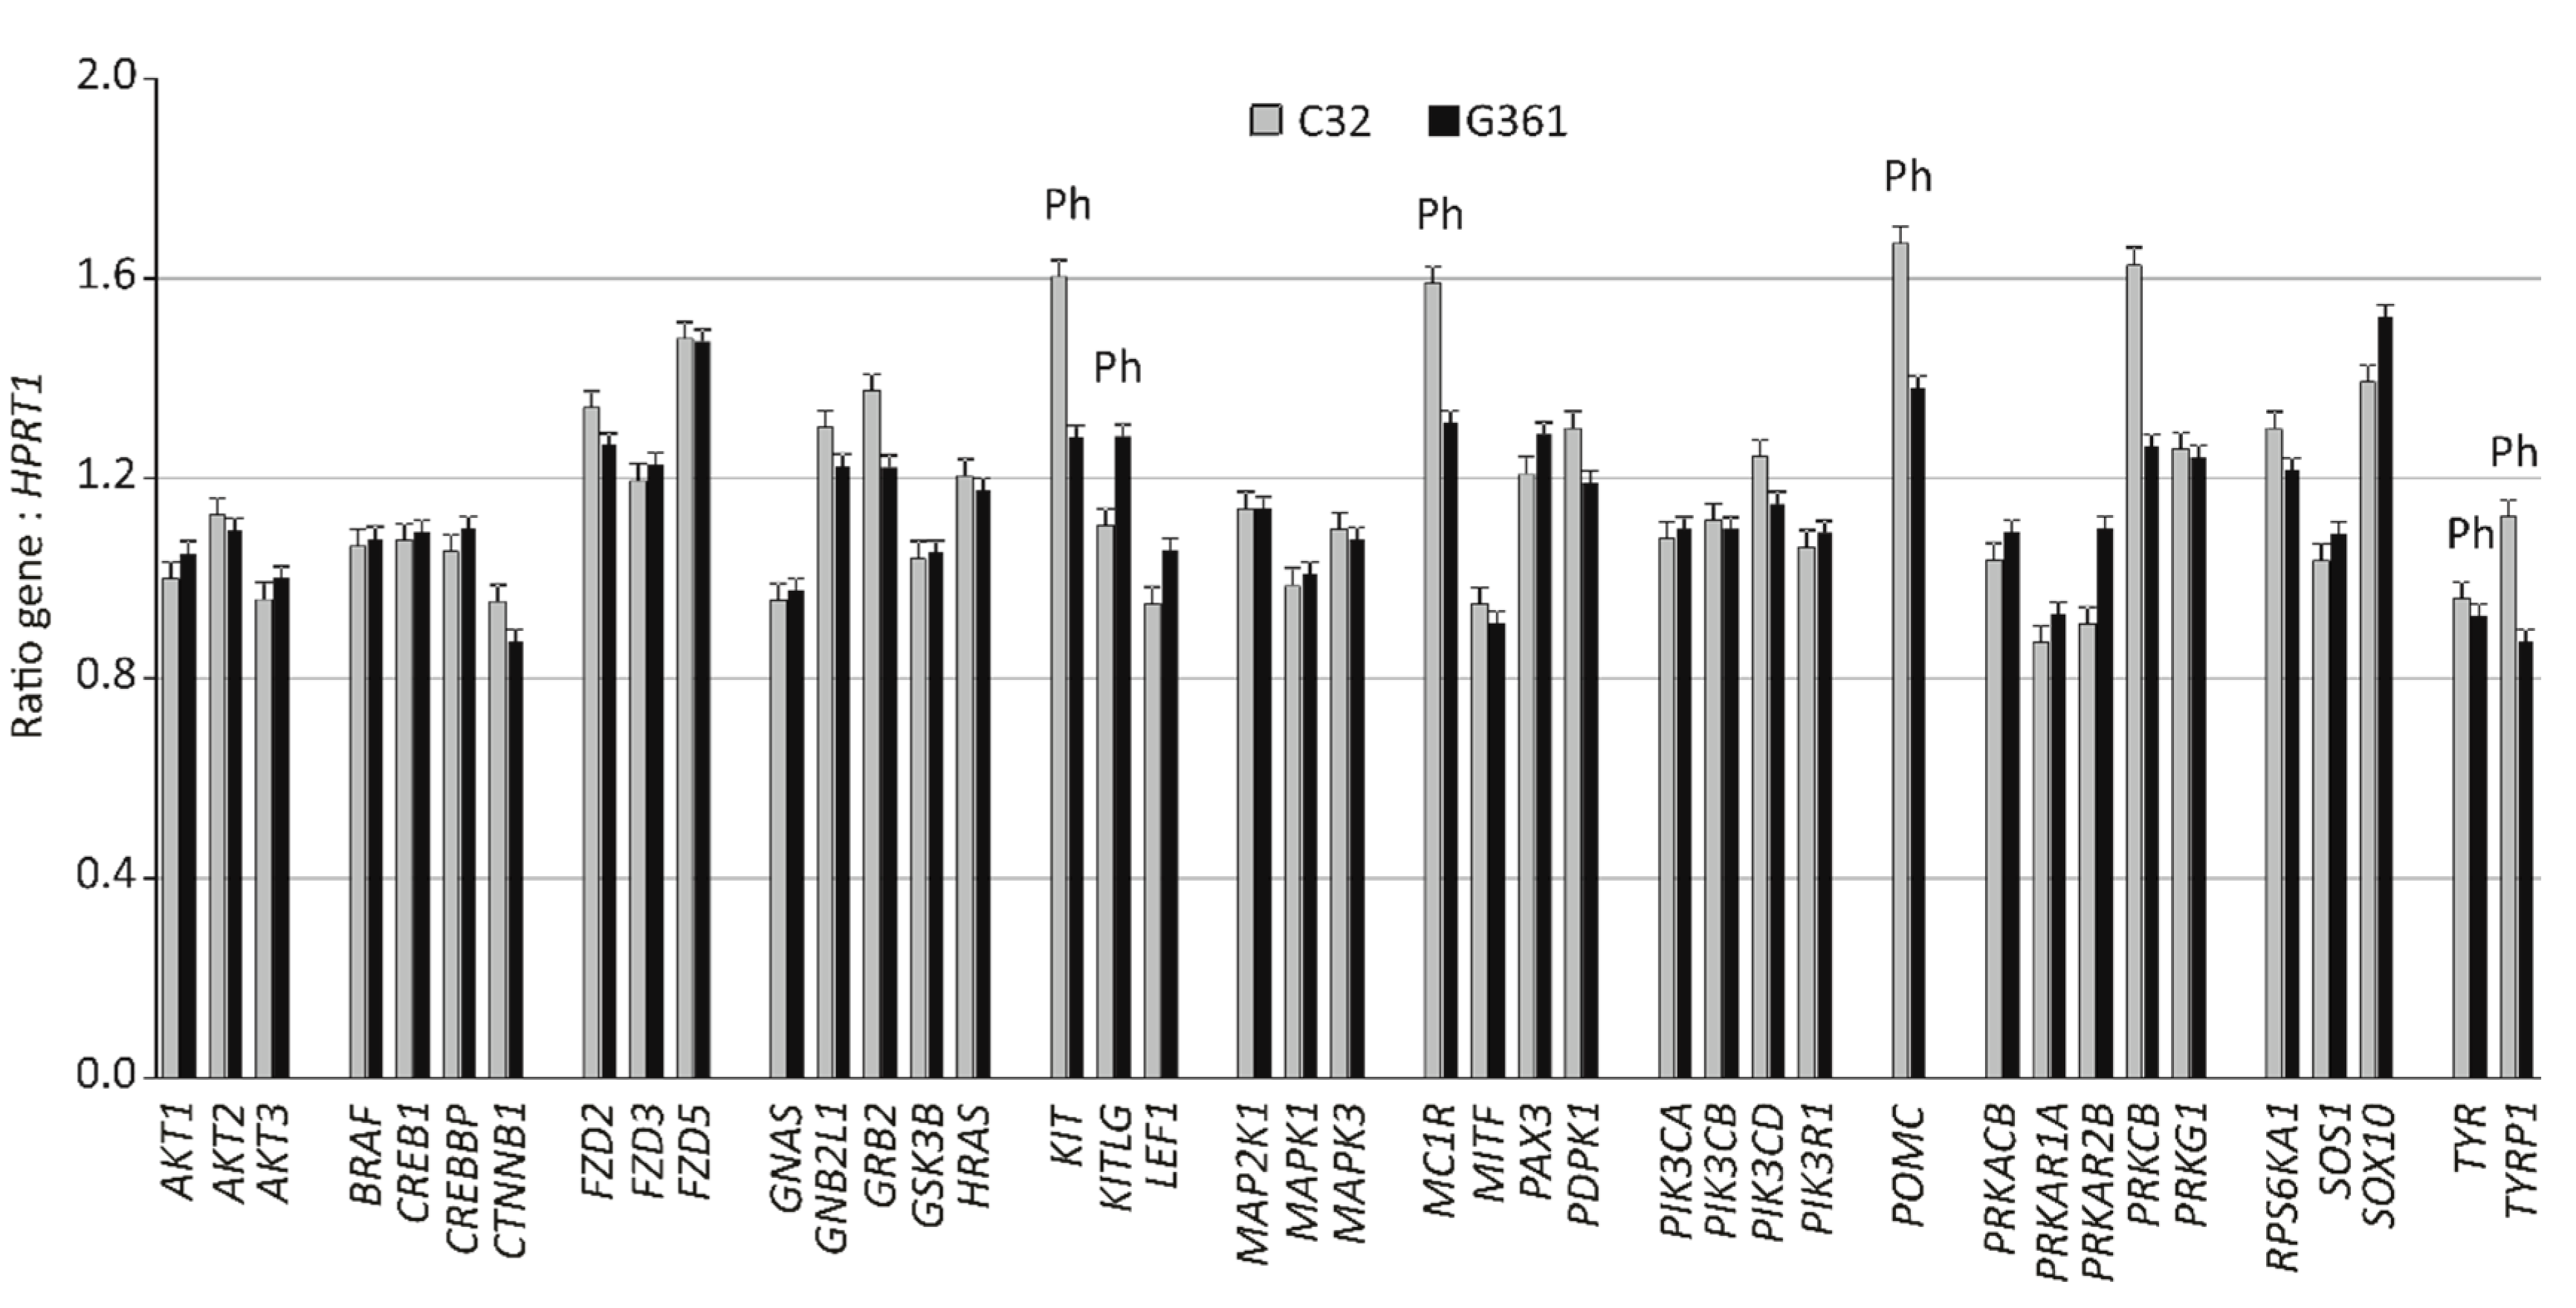
Figure 2.
Expression of pheomelanogenesis-related genes in amelanotic (C32) and melanotic (G361) melanoma cells. The bar graphs represent mRNA expression levels normalized to HPRT1 (mean ± SD), with bar height inversely correlated with gene expression. Statistical significance:*p < 0.05, **p< 0.01, ***p< 0.001.
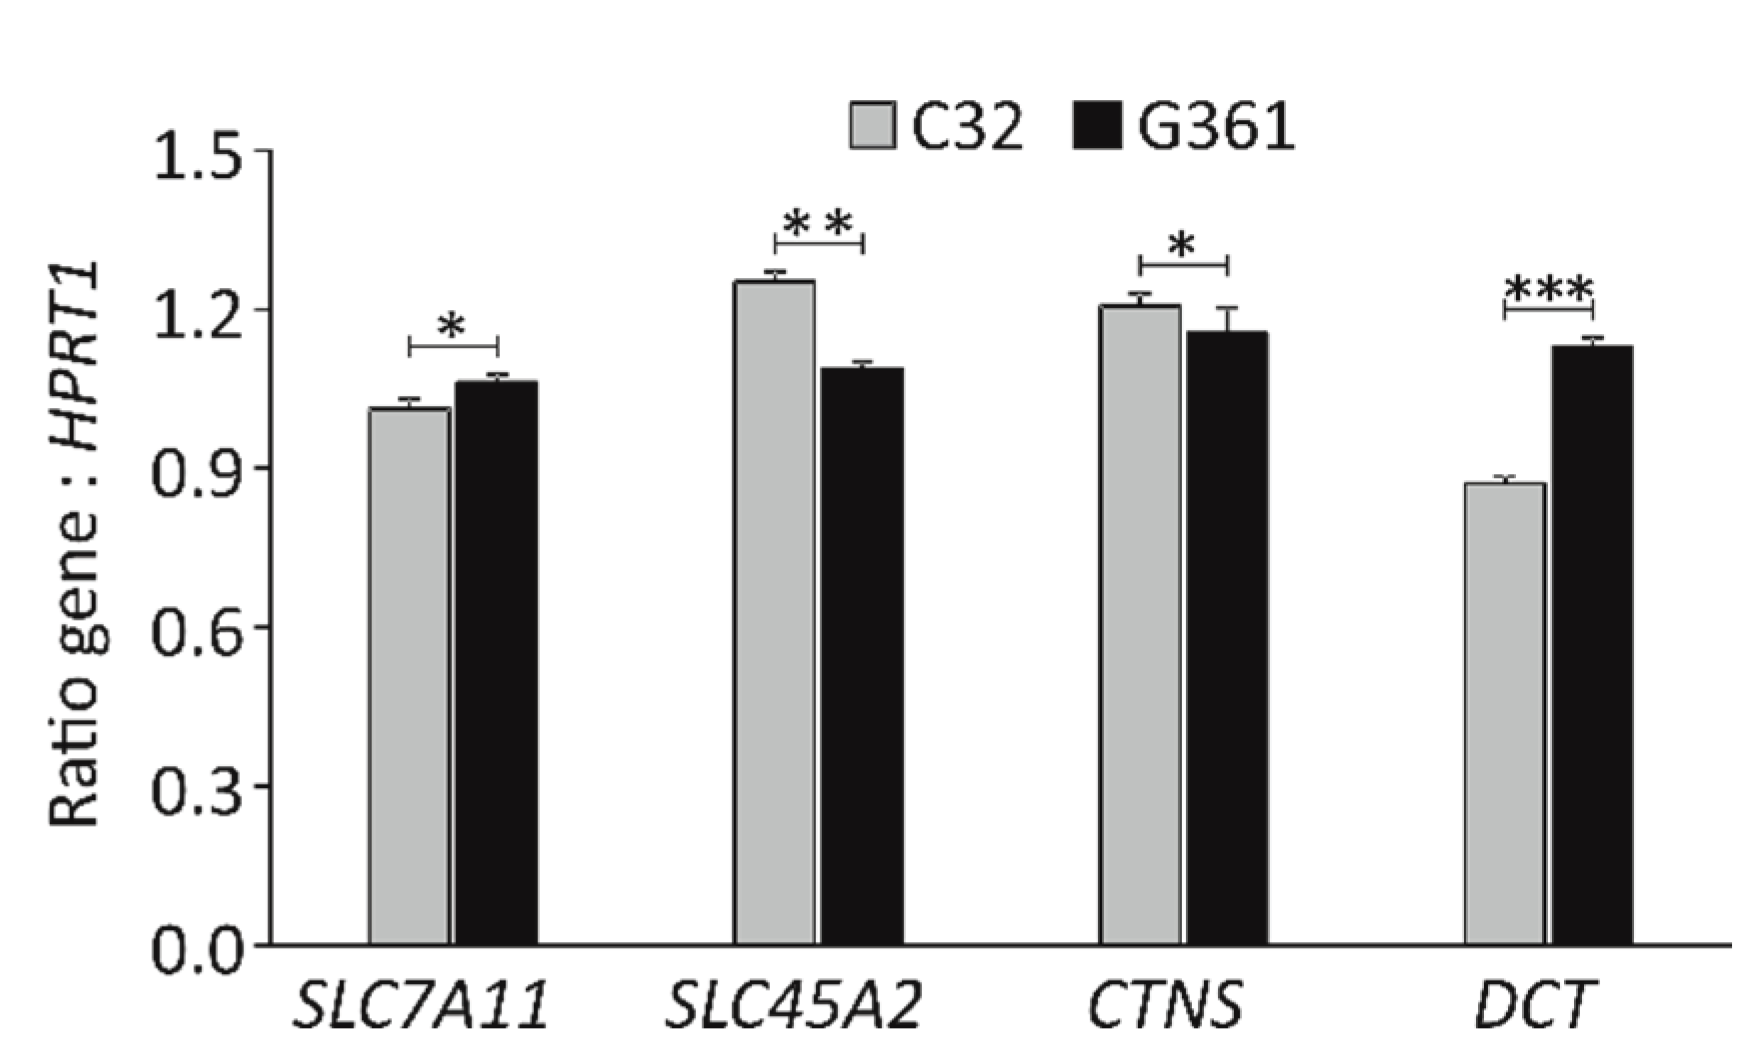

Table 1.
Genes responsible for pigmentation and melanocyte development characterised by higher expression in amelanotic C32 melanoma cells than in melanotic G361 melanoma cells.
Table 1.
Genes responsible for pigmentation and melanocyte development characterised by higher expression in amelanotic C32 melanoma cells than in melanotic G361 melanoma cells.
| Gene name | Gene symbol | UniGene ID | R (fold) | P-value | |
| Dopachrome tautomerase/tyrosinase related protein 2(*) | DCT/TYRP2 | Hs.307865 | 37 | 0.008 | |
| Protein kinase cAMP-dependent, type II regulatory subunit beta | PRKAR2B | Hs.433068 | 16 | 0.006 | |
| KIT ligand | KITLG | Hs.1048 | 11 | 0.005 | |
| Lymphoid enhancer binding factor 1 | LEF1 | Hs.555947 | 5 | 0.001 | |
| SRY-box transcription factor 10 | SOX10 | Hs.376984 | 4 | 0.001 | |
| Paired box 3 | PAX3 | Hs.42146 | 3 | 0.015 | |
| Protein kinase, cAMP-dependent type I regulatory subunit alpha | PRKAR1A | Hs.280342 | 2 | 0.008 | |
| Protein kinase, cAMP-dependent, catalytic, beta | PRKACB | Hs.487325. | 2 | 0.005 | |
| v-akt murine thymoma viral oncogene homolog 1 | AKT1 | Hs.525622 | 2 | 0.011 | |
| Son of sevenless homolog 1 | SOS1 | Hs.709893 | 2 | 0.002 | |
| v-akt murine thymoma viral oncogene homolog 3 | AKT3 | Hs.498292 | 2 | 0.009 | |
| CREB binding protein | CREBBP | Hs.459759 | 2 | 0.006 | |
| Solute carrier family 7 member 11(*) | SLC7A11 | Hs.390594 | 2 | 0.010 | |
Template cDNA, prepared from melanoma cells total RNA was characterized using the Melanocyte development and pigmentation PrimePCR Plate or PrimePCR™ SYBR® Green Assay(*) for a single gene (Bio-Rad Laboratories, Inc.). Two-fold or greater differences in gene expression between C32 and G361 were considered significant.
Table 2.
Genes responsible for pigmentation and melanocyte development characterised by higher expression in melanotic G361 melanoma cells than in amelanotic C32 melanoma cells.
Table 2.
Genes responsible for pigmentation and melanocyte development characterised by higher expression in melanotic G361 melanoma cells than in amelanotic C32 melanoma cells.
| Gene name |
Gene symbol |
UniGene ID | R (fold) | P-value |
| Protein kinase C beta | PRKCB | Hs.460355 | 305 | 0.002 |
| KIT-proto-oncogene, receptor tyrosinase kinase | KIT | Hs.479754 | 165 | 0.012 |
| Proopiomelanocortin | POMC | Hs.1897 | 108 | 0.006 |
| Melanocortin 1 receptor | MC1R | Hs.513829 | 88 | 0.018 |
| Tyrosinase-related protein 1 | TYRP1 | Hs.270279 | 38 | 0.005 |
| Growth factor receptor-bound protein 2 | GRB2 | Hs.444356 | 12 | 0.012 |
| Solute carrier family 45 member 2(*) | SLC45A2 | Hs.278962 | 10 | 0.010 |
| 3-phosphoinositide dependent protein kinase 1 | PDPK1 | Hs.459691 | 6 | 0.009 |
| Phosphatidylinositol-4,5-biphosphate 3-kinase catalytic subunit delta | PIK3CD | Hs.518451 | 5 | 0.002 |
| Ribosomal protein S6 kinase A1 | RPS6KA1 | Hs.149957 | 4 | 0.010 |
| Frizzled class receptor 2 | FZD2 | Hs.142912 | 4 | 0.006 |
| Guanine nucleotide binding protein subunit-2-like 1 | GNB2L1 | Hs.5662 | 4 | 0.012 |
| Catenin (cadherin-associated protein) beta 1 | CTNNB1 | Hs.476018 | 3 | 0.005 |
| Melanocyte inducing transcription factor | MITF | Hs.166017 | 3 | 0.024 |
| Cystinosin, Lysosomal Cystine Transporter(*) | CTNS | Hs.187667 | 2 | 0.004 |
| HRas proto-oncogene, GTPase | HRAS | Hs.37003 | 2 | 0.005 |
| AKT serine/threonine kinase 2 | AKT2 | Hs.631535 | 2 | 0.001 |
| Frizzled class receptor 5 | FZD5 | Hs.17631 | 2 | 0.003 |
| Tyrosinase | TYR | Hs.503555 | 2 | 0.015 |
| Protein kinase cGMP-dependent type I | PRKG1 | Hs.407535 | 2 | 0.009 |
Template cDNA, prepared from melanoma cells total RNA was characterized using the Melanocyte development and pigmentation PrimePCR Plate or PrimePCR™ SYBR® Green Assay(*) for a single gene (Bio-Rad Laboratories, Inc.). Two-fold or greater differences in gene expression between C32 and G361 were considered significant.
Disclaimer/Publisher’s Note: The statements, opinions and data contained in all publications are solely those of the individual author(s) and contributor(s) and not of MDPI and/or the editor(s). MDPI and/or the editor(s) disclaim responsibility for any injury to people or property resulting from any ideas, methods, instructions or products referred to in the content. |
© 2025 by the authors. Licensee MDPI, Basel, Switzerland. This article is an open access article distributed under the terms and conditions of the Creative Commons Attribution (CC BY) license (http://creativecommons.org/licenses/by/4.0/).
Copyright: This open access article is published under a Creative Commons CC BY 4.0 license, which permit the free download, distribution, and reuse, provided that the author and preprint are cited in any reuse.


