1. Introduction
People with Parkinson's disease (PD) experience motor symptoms that significantly impact daily activities and quality of life [
1]. Monitoring mobility provides crucial insights into disease progression and aids clinicians in devising effective treatment plans. Clinical mobility tests like the Timed Up and Go (TUG), Five Times Sit-to-Stand (FTSTS), and 10-meter walk test (10MWT) are commonly used to assess mobility in people with PD [
2]. The primary outcome of these tests is the completion time, which correlates with key mobility indicators including muscle strength, gait speed, balance, and fall risk [
3,
4,
5]. However, completion time itself does not provide specific information about underlying mobility characteristics, such as gait performance, turning ability, or squat performance.
Instrumented tests have therefore been developed to provide more detailed metrics such as gait speed, step length, turn duration and durations of sit-to-stand and stand-to-sit transfers, allowing clinicians to monitor specific mobility aspects more precisely [
6]. Yet, these tests typically capture isolated snapshots of mobility and may introduce biases like the white-coat effect. Ideally, mobility should also be assessed in settings that reflect real-world performance rather than only capacity under controlled conditions which has limited ecological value [
7]. This distinction between unsupervised performance and supervised capacity could be relevant for understanding the true impact of mobility difficulties in daily life [
8].
Augmented-reality (AR) neurorehabilitation platforms can engage individuals with PD in gait–and–balance enhancing exercises, in a gamified manner. An advantage of using AR technology is the continuous recording of 3D positional and orientation data of the AR-glasses using visual Simultaneous Localization and Mapping (vSLAM) algorithms [
9], which directly serves as a 6D motion capture device of the head. Previous studies have validated the use of this data to derive various mobility metrics during standard clinical tests (e.g., FTSTS, TUG, 10-meter walk test) demonstrating good-to-excellent agreement with reference systems in people with PD [
10,
11,
12].
Extending the use of AR glasses to capture 6D head movements during gamified exercises and translating these movements into specific mobility metrics offers several advantages. First, patients can receive real-time feedback on their mobility performance during exercises, an aspect that patients themselves reported as valuable during exercises and offers potential for self-management [
13]. Second, clinicians gain access to more detailed metrics without the need for resource-intensive and time-consuming mobility tests in the clinic. Third, this approach enables remote real-time derivation of mobility metrics over time, capturing continuous, objective data on motor performance during daily exercises. This could address the gap highlighted by Negi et al. (2025), who reported that infrequent clinic visits and reliance on subjective measurements limit effective clinical management and that by remotely tracking progression over time, subtle change in motor function can be detected outside the clinic, allowing interventions to be optimized in a timely and personalized manner [
14]. This potential could significantly reduce the growing burden on the healthcare system by decreasing the need for in-person visits and prioritizing assessments and interventions for those most in need [
15].
A critical step in deriving mobility metrics is accurate detection of motor states, such as walking, turning, squatting, and transfers. Identifying these states enhances extraction of specific parameters within those motor states, such as gait speed, step length, cadence, turning duration, peak turn velocity, squat duration, squat depth, sit-to-stand, and stand-to-sit duration. This study evaluates the concurrent validity of AR-derived motor states and associated mobility metrics by comparing them with a reference markerless motion capture system (Theia3D) [
16,
17]. By examining the agreement between mobility metrics derived from AR and Theia3D data, we aim to demonstrate the potential of AR technology for continuous derivation of mobility metrics in people with PD during gamified AR exercises.
2. Materials and Methods
2.1. Subjects
A convenience sample of 15 subjects diagnosed with Parkinson’s disease, who previously participated in the study by Harderman et al. (2024) (N=4) [
18] or the study by Hoogendoorn et al. (2025) (N=11) [
19] and were therefore familiar with gamified AR exercises, participated in this study (
Table 1). Participants did not have any other neurological of orthopaedic disorders that would significantly impact their mobility. All participants had sufficient cognitive function to understand and follow the instructions provided by the researchers. None reported experiencing hallucinations or had any visual or hearing impairment that could affect gamified AR exercises.
2.2. Experimental Setup and Procedures
Participants were invited for one visit to the gait lab at the Amsterdam University Medical Center (Amsterdam UMC), location VUmc, and were instructed to take their Parkinson’s medication/dopaminergic medication 1 hour prior to the visit. Participants completed 5 gamified AR exercises in a fixed order: (i.e.,
Smash,
Mole Patrolll,
Puzzle Walk,
Basketball, and
Wobbly Waiter) for 3 minutes each using Strolll’s AR neurorehabilitation platform (
Figure 1,
Figure 2,
Figure 3,
Figure 4 and
Figure 5 and Supplementary Material S1). This platform is specifically designed for people with Parkinson’s disease to improve gait and balance through gamified, personalised, and accessible exercises that can be performed both in the clinic and at home. Participants could take a break between games whenever needed. For each 3-minute game a portion of the gameplay was recorded with the Theia3D system, limited to 30-60 seconds due to processing issues with Theia3D when recording longer time periods.
2.3. Data Acquisition
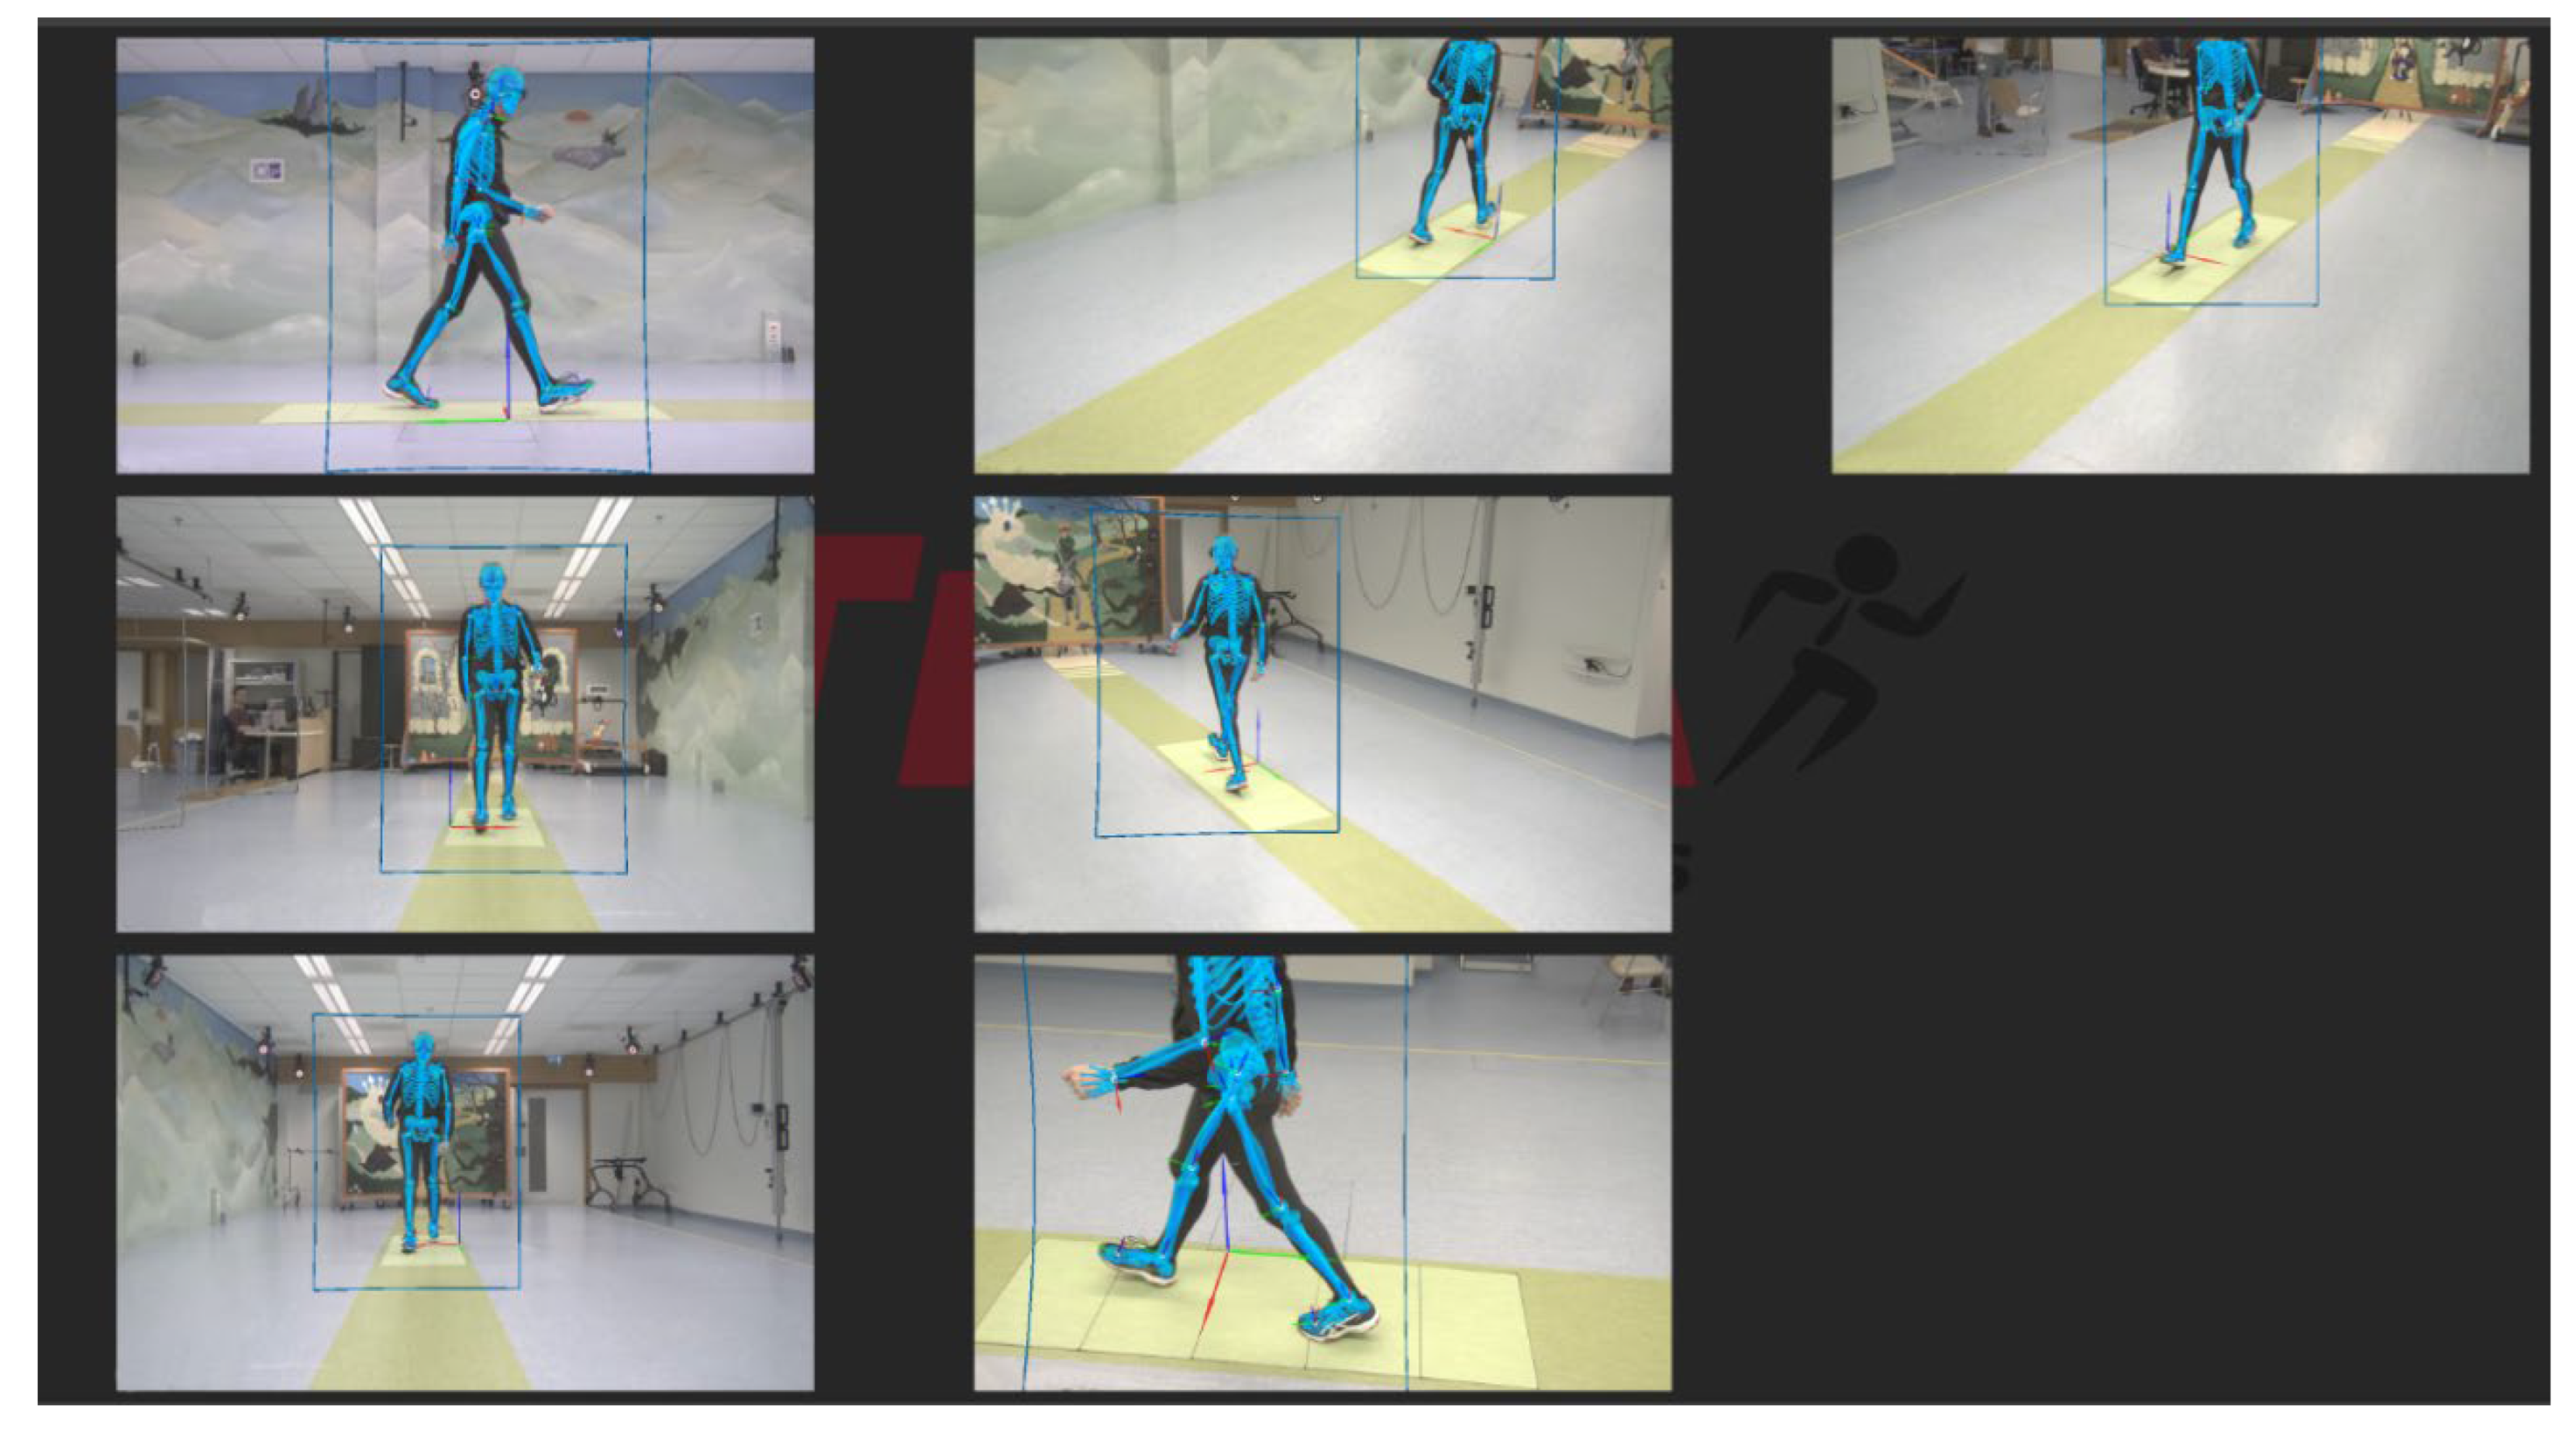
The AR-glasses used were Magic Leap 2 which captured user’s 3D position and orientation with regards to their surroundings at a sample rate of 60 Hz. Video data for Theia3D were collected for each game for 30 seconds with a sample rate of 100Hz, or 1 minute with a sample rate of 50Hz. The video data were collected using 7 Blackfly S USB3 cameras (Teledyne FLIR LLC, Wilsonville, Oregon, USA; resolution: 1920 × 1200 pixels, 2.3 megapixels; focal length: 6.5–15.5 mm), which were positioned around a 10-meter walkway at a distance of 2 to 3 meters (
Figure 6). Calibration for the camera system was performed before each measurement day to establish a consistent global reference frame.
2.4. Data Analysis
For the markerless processing, video data were transcoded using the h.264 codec within Vicon Nexus software (version 2.6, Vicon, UK). The transcoded video files were then processed using Theia3D software (v2023.1.0.3160, Theia Markerless Inc., Kingston, Ontario, Canada) with default settings, including a 6 Hz low-pass GVCSPL filter. The Theia3D default inverse kinematic model was applied. The output consisted of 4 × 4 transformation matrices for each body segment. For our analysis the segments of the head, pelvis, heels, and toes were used [
21]. The time series from both the Magic Leap 2 and Theia3D were resampled to a constant rate of 50 Hz using linear interpolation. Time series were smoothed using a Savitzky-Golay filter with a second-order polynomial and a window size of 61 frames. This filtering method was chosen because it effectively smooths data while preserving the original shape and features of the signal—such as peaks, troughs, and slopes—used in defining start and end indices of motor [
22]. Missing values in the Theia3D time series were interpolated using cubic spline interpolation. One trial (
Mole Patrolll) from a single participant (P8) was excluded for further analysis because more than 10% of the Theia3D data were missing due to the participant moving outside the camera capture range. Temporal alignment between systems was achieved by calculating the time lag of the maximal cross-correlation of the vertical position of the head from both systems. The consistency agreement between 3D position data of the AR-glasses and Theia3D head and between yaw angle of the AR-glasses and Theia3D pelvis was determined separately for each game. Theia3D pelvis yaw was used as a reference for the turning motor state because it provides a more stable and anatomically relevant measure of whole-body rotation, whereas head yaw could be more susceptible to non-turning related head motions, such as scanning. These additional head movements could inflate angular velocity estimates and introduce noise potentially reducing the accuracy of turning performance. For all other motor states, the Theia3D head data was used as the reference.
2.5. Motor-State Segment Classification and Derived Mobility Metrics
For each motor-state segment detected in the AR data, the temporal overlap with segments detected in Theia3D was evaluated. Overlap was defined as the proportion of AR frames that coincided with frames from a corresponding Theia3D segment. For each AR segment, the Theia3D segment with the highest overlap ratio was identified as the best match. A match was considered valid if the best overlap ratio was ≥ 50% of the AR segment. True positives were defined as AR segments with a corresponding Theia3D match, false positives as AR segments without a matching Theia3D segment, and false negatives as Theia3D segments without a matching AR segment.
Mobility metrics were determined only for true positive segments, and only the fully overlapping frames from both systems were used to calculate these parameters. The following sections outline in detail the methods used for identifying these motor-state-specific parameters.
2.5.1. Straight Walking Segments and Gait Metrics
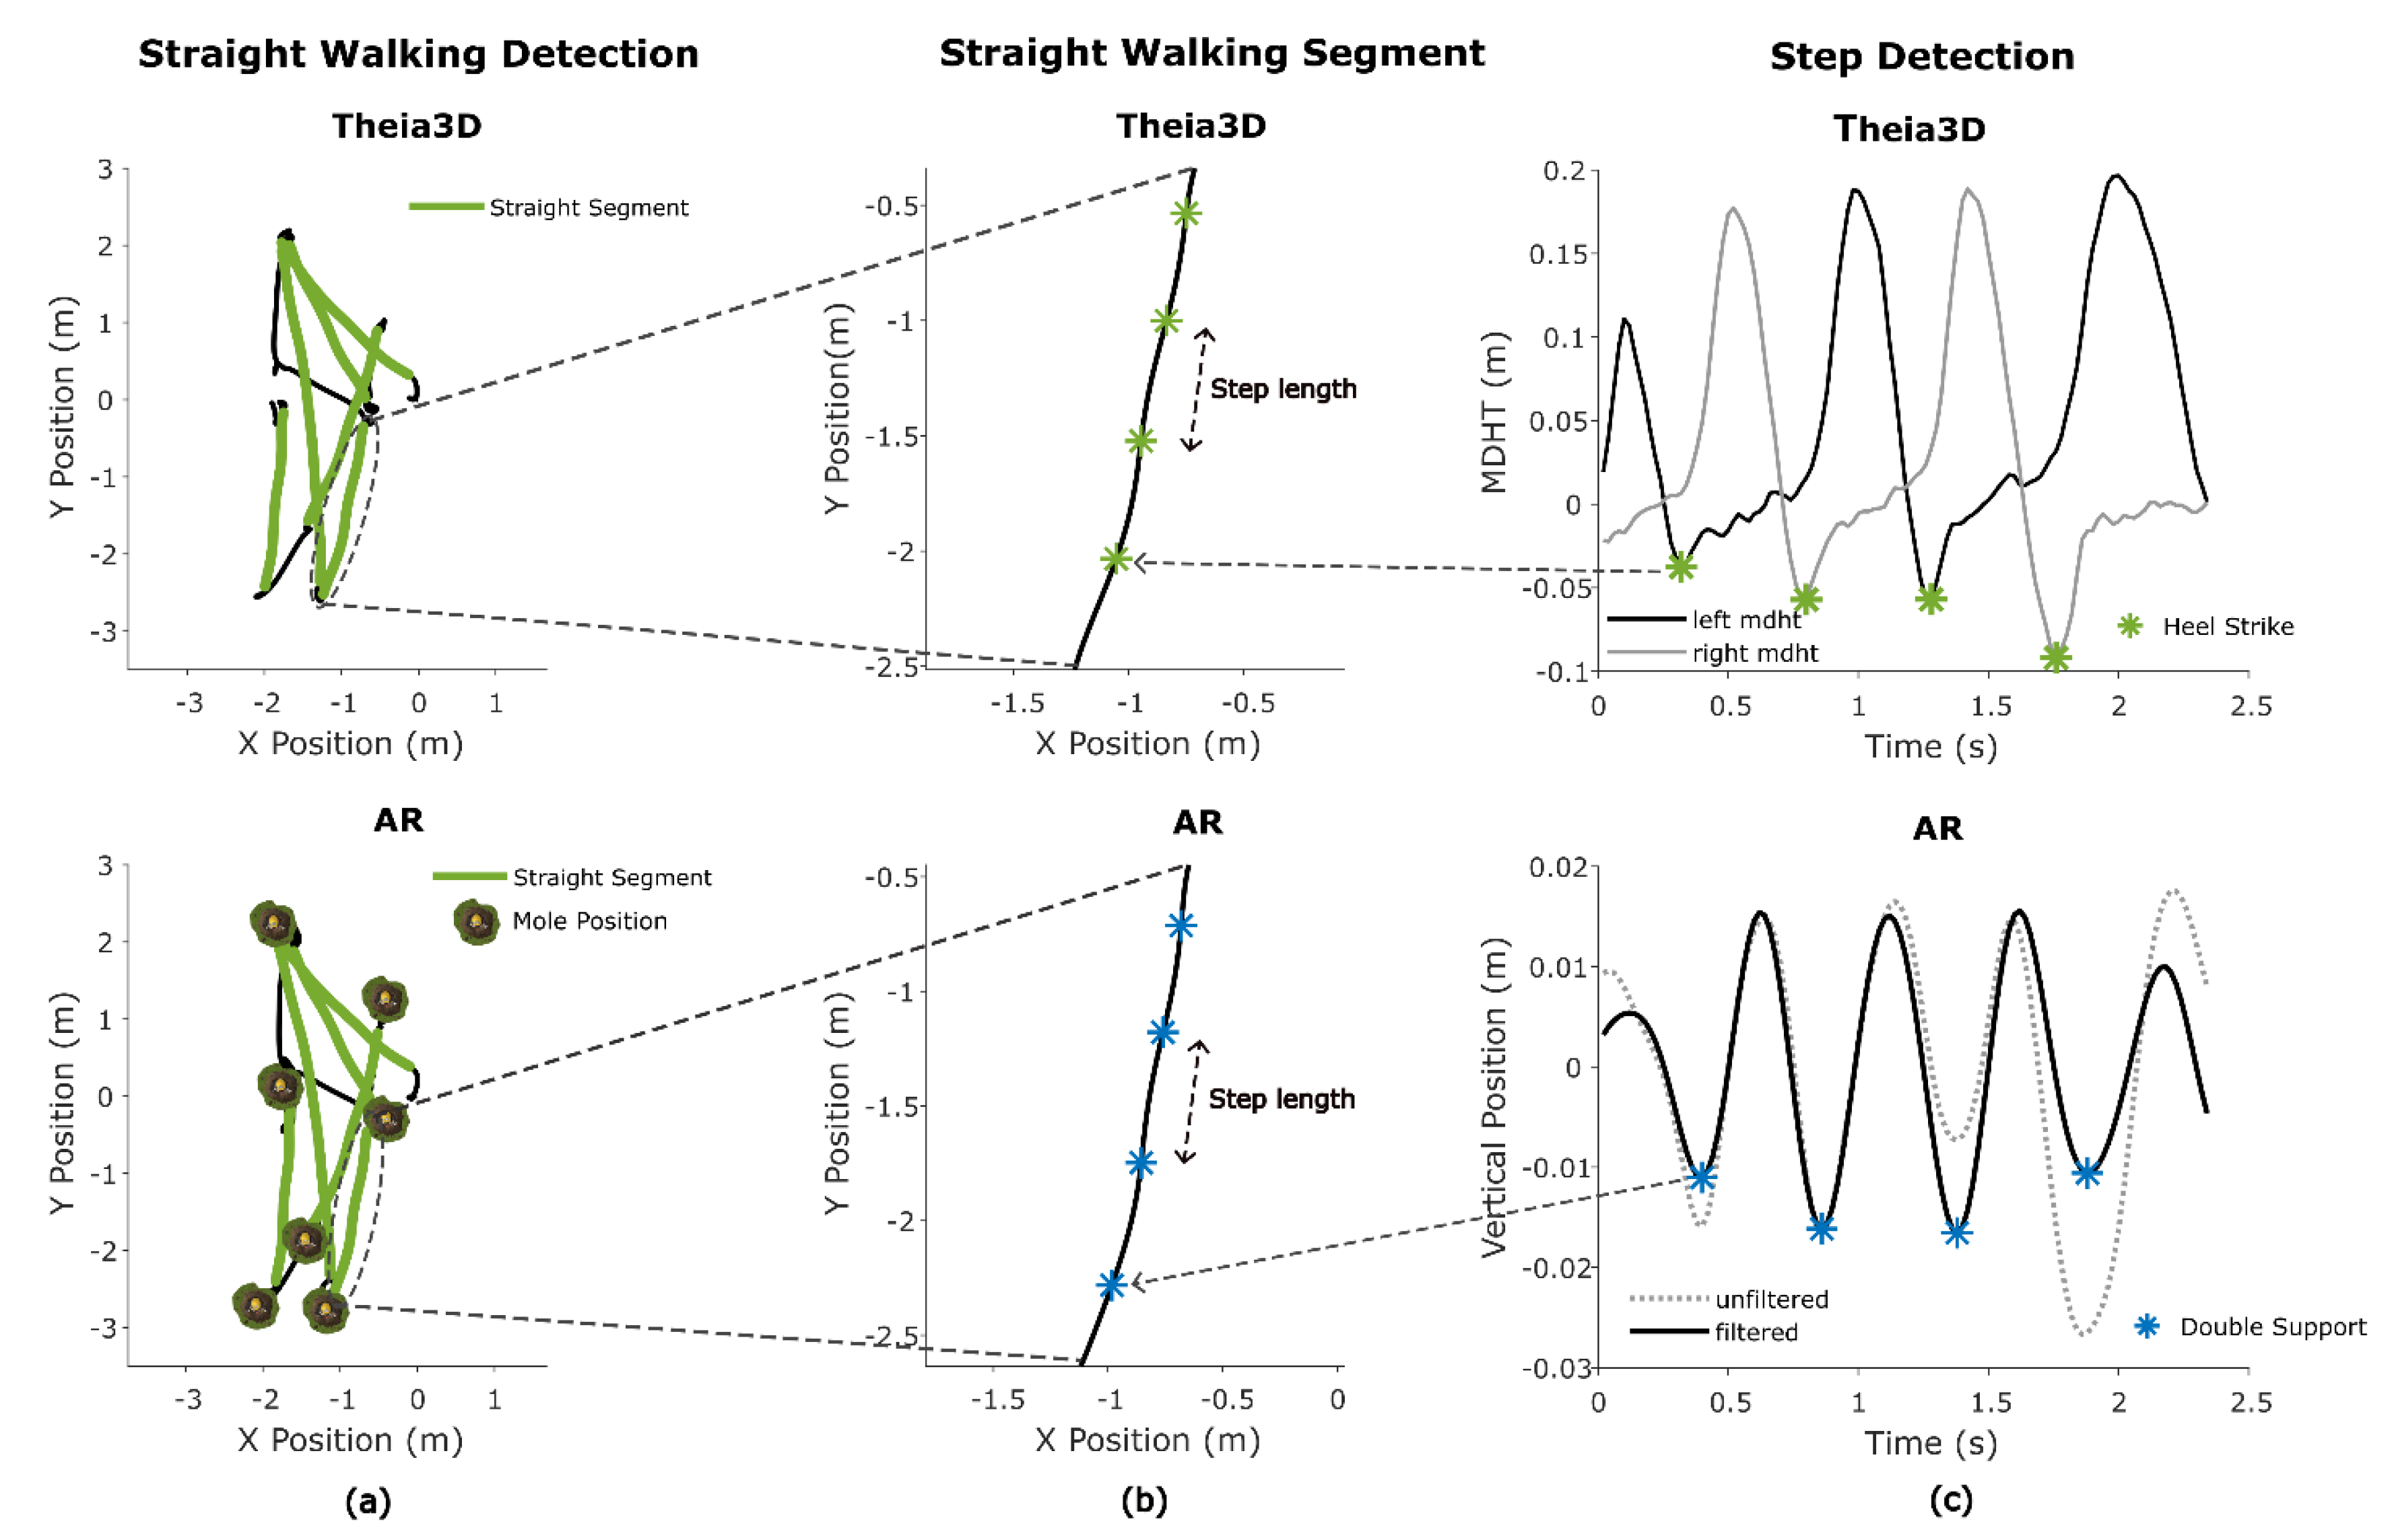
Straight walking segments for both systems in all games were identified by applying a custom algorithm to the horizontal position (x, y) and yaw angle time series of the head. The horizontal trajectory was first used to calculate arc length and frame-to-frame speed. To ensure a smooth and consistent heading direction, the trajectory was interpolated along uniform 0.01 m steps. The heading angle, defined as the instantaneous orientation of the horizontal trajectory in the plane, was derived from the tangent (first derivative) of the interpolated trajectory using the arctangent of the forward and lateral components, and subsequently mapped back to the original resolution. This processing was necessary to reduce noise in the heading angle.
Candidate straight walking segments were identified based on the following criteria: (1) the total segment length exceeded 2 meters, (2) the range of heading angles remained below 45 degrees, (3) the range of head yaw angles was below 45 degrees, (4) all instantaneous speeds within the segment exceeded a minimum speed threshold of 0.5 m/s (
Figure 7A).
Maximum gait speed was derived from AR and Theia3D straight-walking segment data as the highest instantaneous speed, computed from frame-to-frame 2D (x,y) head displacement over time. To reduce high-frequency fluctuations in the frame-by-frame speeds, a moving average filter with a window size of 0.5 seconds was applied. The maximum gait speed was then defined as the peak value of the filtered speed, calculated separately for each straight walking segment for both the AR and Theia3D systems.
To estimate mean step length from Theia3D, heel strike (HS) events were first detected using the minimal distance between heel and toe (MDHT) approach [
23]. This involved calculating the vertical difference between heel and toe positions. Candidate HS events were detected by identifying the local maxima in the MDHT signal using Matlab’s findpeaks with a prominence threshold of 0.01 and a minimum peak distance of 0.5 seconds (
Figure 7C). For each detected peak, the closest preceding minimum within a defined search range (0.05 to 0.5 seconds) was identified. If this minimum was at least 0.04 m below the peak and had an absolute value lower than 0.05 m, it was retained as a valid heel strike (HS). To avoid duplicate detections, consecutive minima at the same location were ignored (
Figure 7C). Step length was then calculated based on the Euclidian horizontal (x,y) Theia3D head segment displacement between consecutive HS events.
The mean step length for AR data was calculated using the vertical position time series. First the vertical position was pitch corrected, removing vertical position change due to changes in pitch. A cosine-based pitch correction was applied using the formula:
Where θ is the head pitch angle in radians and L = 0.2 is an empirically found scaling factor approximating the radius of the pitch circle when forward bending the head. The corrected signal was linearly detrended and a Butterworth bandpass filter with cutoffs at 1.5 and 3.5 Hz (based on the expected cadence) was applied to detect indices at or around the double support (DS) phase of the gait cycle. Local minima in the vertical position of the head, representing these indices [
24], were found using Matlab’s findpeaks with a minimum peak prominence of 0.001 and a minimum peak distance of 13 samples. Finally, the step length was calculated using the Euclidian horizontal (x,y) head displacement between consecutive DS events (
Figure 7B).
Cadence (steps per minute) was estimated for both Theia3D and the AR-glasses based on the timing of detected gait events. For Theia3D, this was done by calculating the median number of frames between consecutive heel strike events and converting this value into steps per minute. For AR, the same approach was used based on the detected DS events.
2.5.2. Turning Segments and Turn Metrics
For one game (
Smash), turn metrics were determined. In this game a 180 degree turn is required/performed (
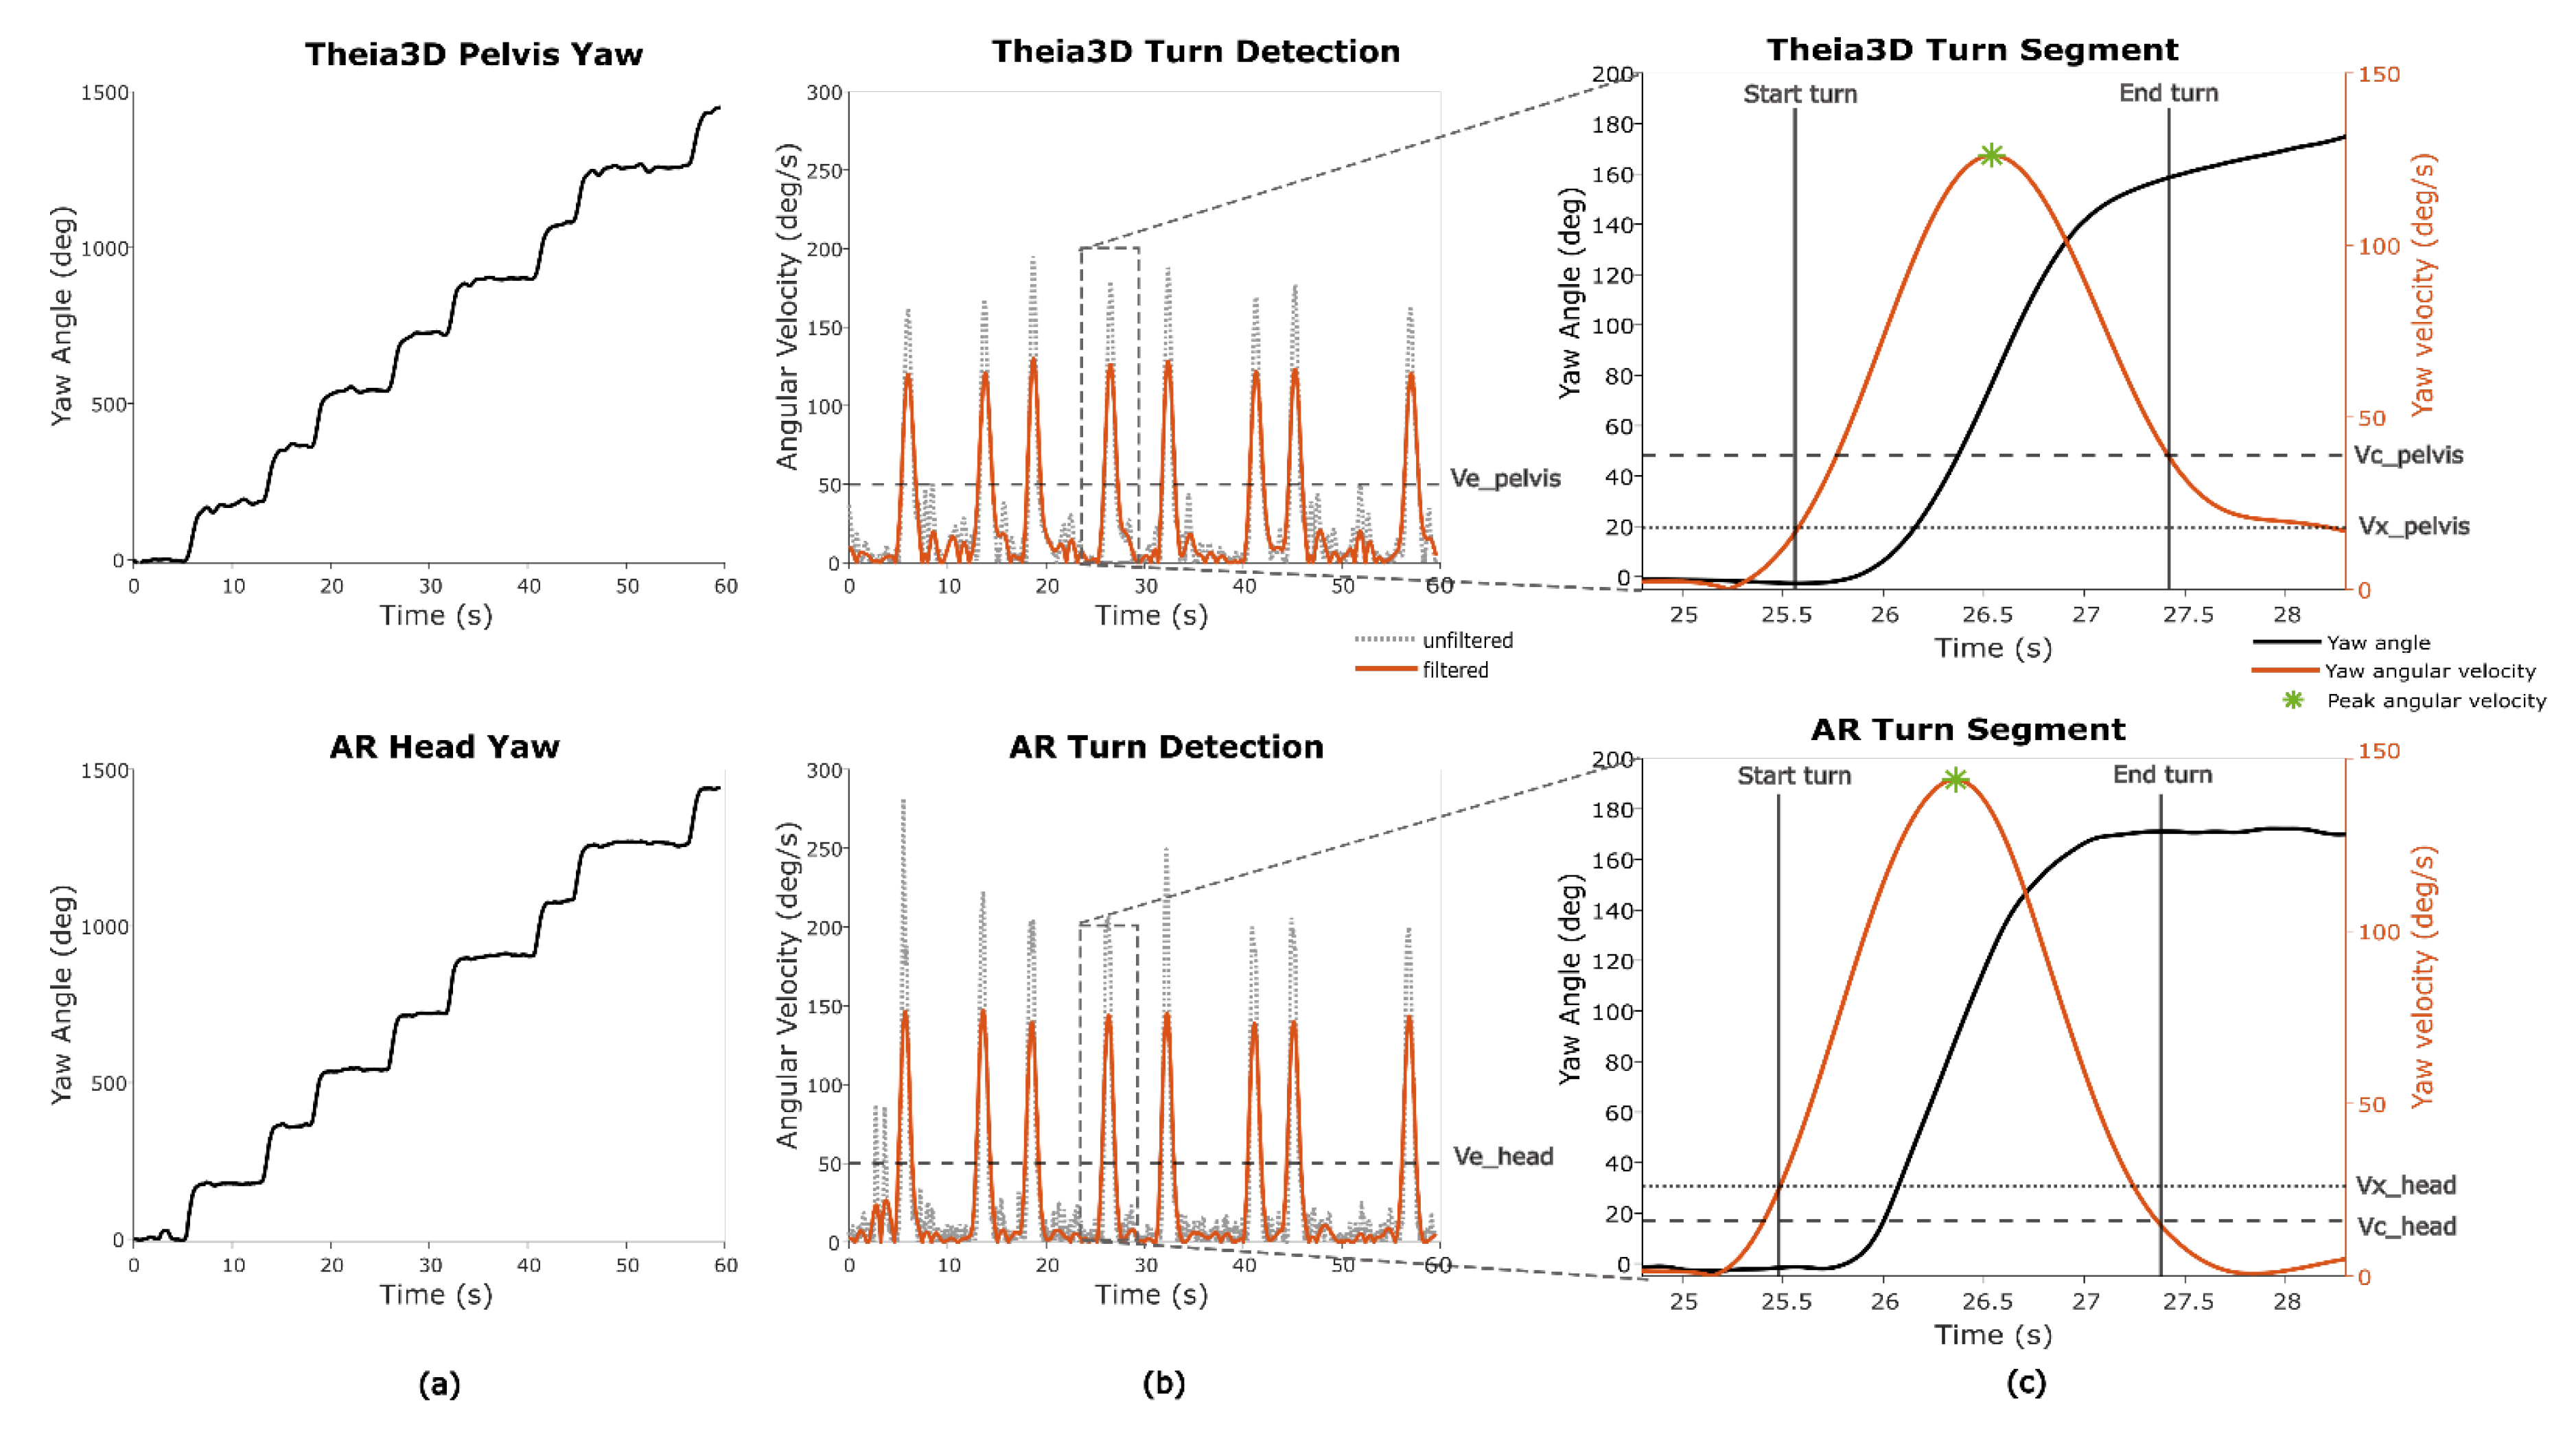
Figure 8A). The merged turn algorithm described by Shah et al. (2021) was used to estimate the start and end of a fixed 180 degrees turn based on the Theia3D pelvis yaw and the AR-glasses yaw data [
25]. The pelvis yaw angle from Theia3D was specifically used, instead of the head yaw angle from Theia3D, to ensure the AR-system was capable of distinguishing full-body turns from head-only movements. Since this algorithm relies on thresholds based on yaw angular velocity, the derivative of the yaw angle was computed. Because the original method was developed for real-world turning detection—typically involving slower, less abrupt turns—the thresholds were empirically optimized to better reflect the faster, more pivot-like turning observed in the game context (
Table 2) (
Figure 8B). Different thresholds were used for Theia3D pelvis yaw data and AR head yaw data to account for signal characteristics, with head yaw angles generally showing more variability and sharper angular changes than pelvis-based data (
Figure 8C).
To determine the optimal AR thresholds, an iterative error-cost approach was applied. A range of threshold combinations was systematically tested, and for each combination, turn durations derived from AR were compared against Theia3D pelvis-based turn durations. The intraclass correlation coefficient (ICC
(A,1)) was used as the optimization criterion, and the threshold set that produced the highest ICC value was selected as the final parameterization for AR (
Table 2). The mean of the turn durations and the peak turn velocity per participant was extracted for further analysis (
Figure 8C).
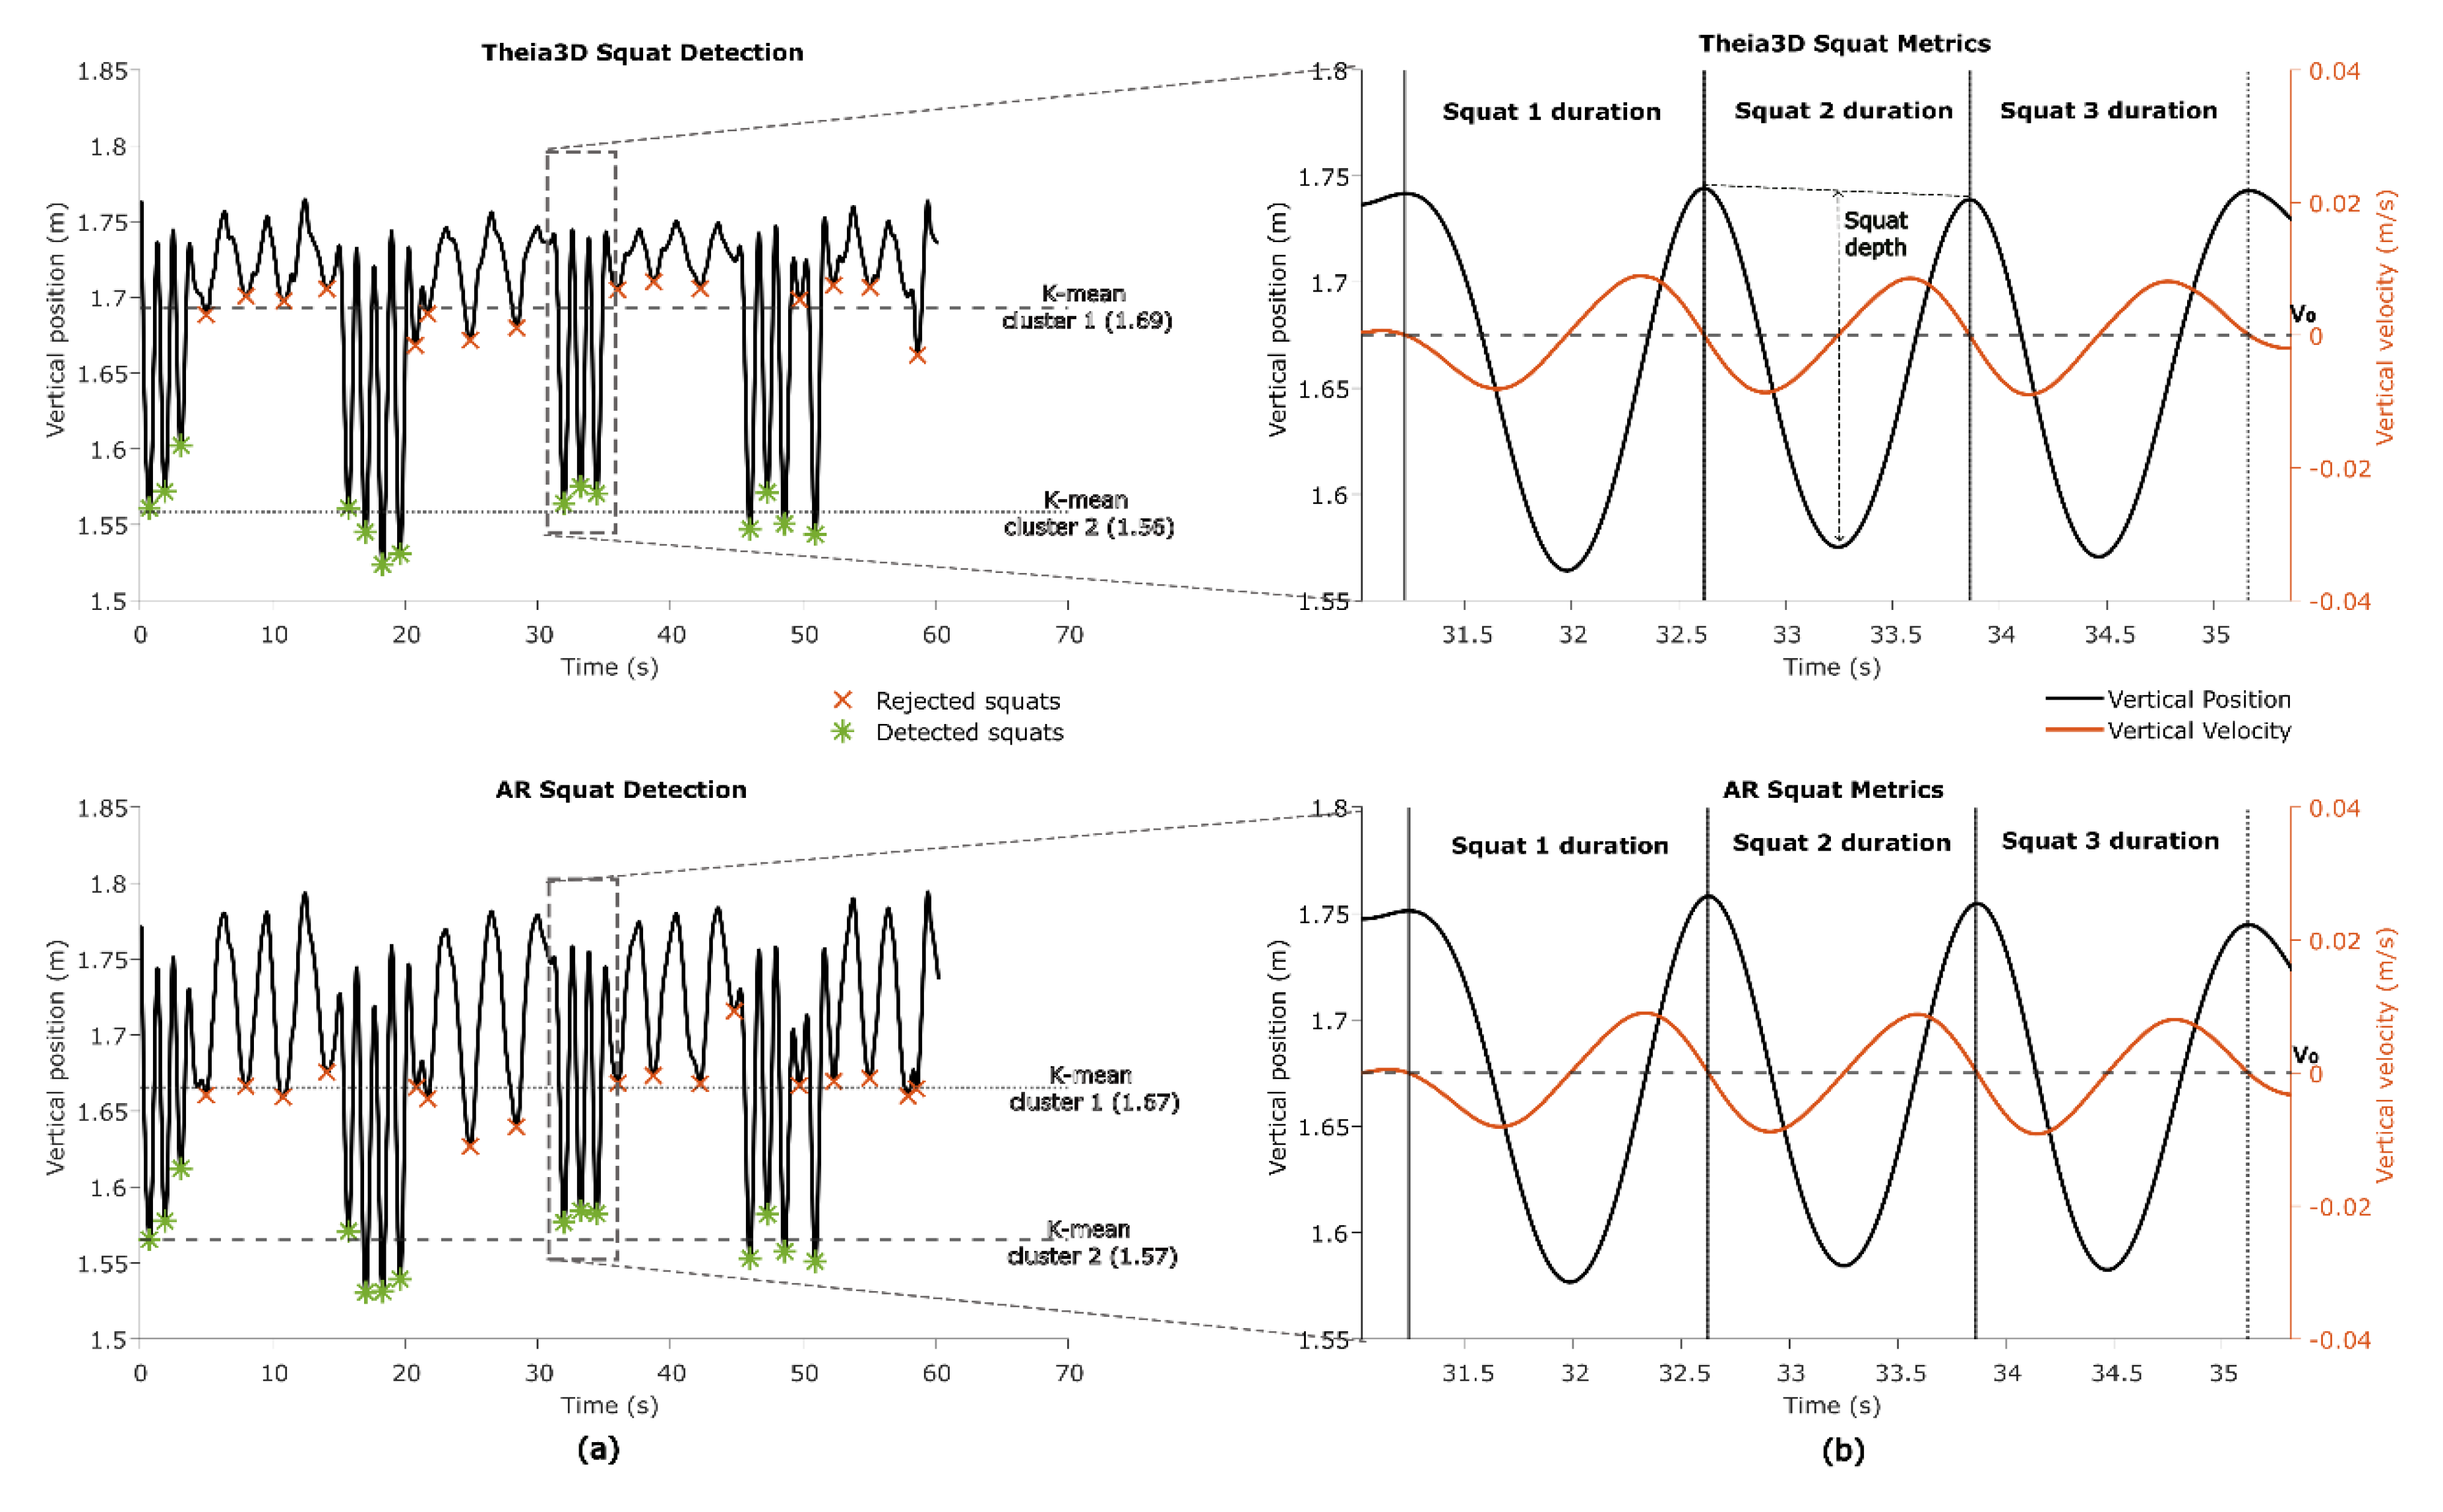
2.5.3. Squat Segments and Squat Metrics
In one game (
Basketball) squatting is an integral part of game play. To identify squats the vertical head position from both the Theia3D and AR system was analysed. First, the vertical head position from AR was corrected for pitch similarly as in section 2.5.1., to remove vertical position change due to changes in pitch. Second, local minima were identified using Matlab’s findpeaks on the inverted vertical signal. These minima were clustered using k-means (k=2, iteration=10) to distinguish deeper valleys (i.e., squats) from shallower ones (e.g., bending forward or minor dips) (
Figure 9A). Valleys that occurred close together (<8 s.) were grouped to account for consecutive squats performed in quick succession. Within each group, the vertical velocity signal was used to identify the start and end of individual squats. By searching backwards from each detected valley, the start of the squat was marked at the last time point where downward velocity reached the zero-crossing. Searching forwards from the valley, the end of the squat was marked at the first time point where upward velocity reached the zero-crossing (
Figure 9B).
The duration of each squat was then calculated. Squat depth was defined as the difference between the baseline vertical head position (average of the start and end positions) and the minimum vertical head position within the squat. Finally, the mean squat depth and mean squat duration per participant were used for further analyses.
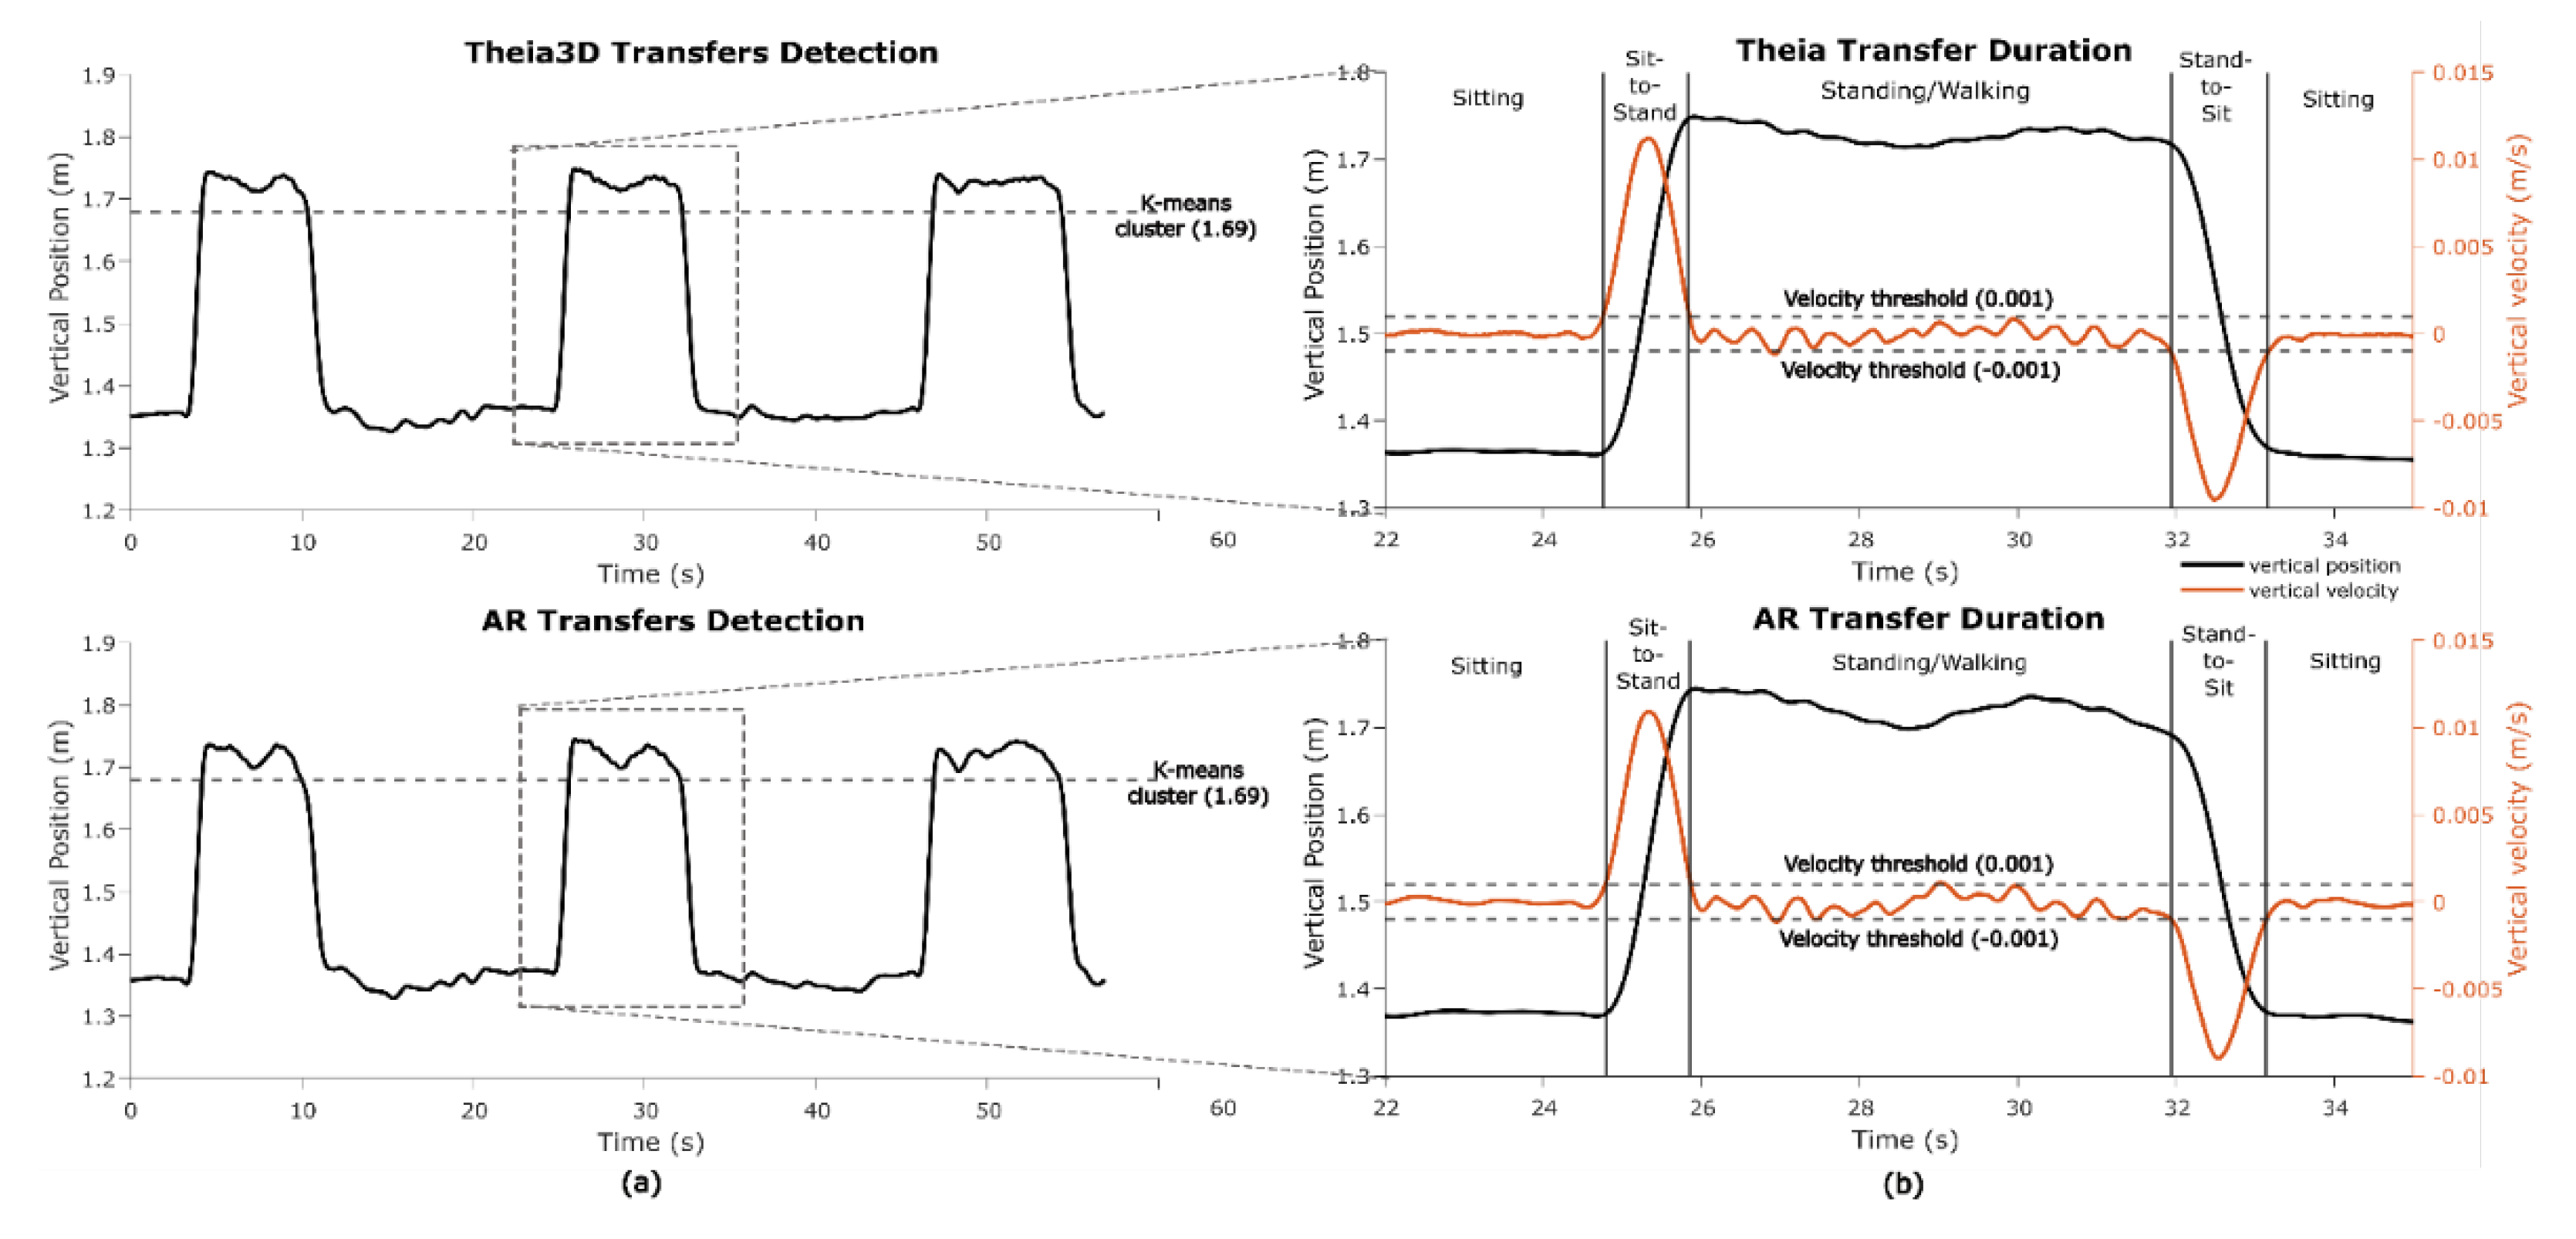
2.5.4. Transfer Detection and Transfer Metrics
In one game (
Wobbly Waiter) sit-to-stand and stand-to-sit transfers are key game-play motor states. To identify transfers, standing segments were first detected using k-means clustering (k = 2, iteration=10) on the vertical head position data from both the Theia3D and AR systems. The cluster with the highest centroid (i.e., highest vertical position) was classified as standing (
Figure 10A). For each standing segment the on- and offset of the sit-to-stand and stand-to-sit transfers were detected in the vertical speed signal using a 0.001 m/s threshold (
Figure 10B). Transfer durations were averaged per participant and taken for further analysis.
2.6. Statistical Analysis
Concurrent validity between AR and Theia3D time series was evaluated with the intraclass correlation coefficient for consistency ICC(C,1), and the root mean square error (RMSE). Before calculating these metrics, the data were preprocessed to account for differences in alignment due to different coordinate systems. Both AR and Theia3D signals were detrended to remove constant offsets.
For each detected motor state, performance parameters—i.e. precision, recall, F1-score, and mean overlap—were calculated.
Concurrent validity in mobility metrics derived from AR and Theia3D data was evaluated with the intraclass correlation coefficient for absolute agreement ICC
(A,1) [
26]. ICC values above 0.50, 0.75 and 0.90 were considered as moderate, good, and excellent agreement, respectively [
27]. ICC values for absolute agreement were complemented with bias and limits of agreement measures as calculated using a Bland-Altman analysis [
28]. Biases were evaluated using paired-sample t-tests under the verified assumption of normality using the Shapiro-Wilk tests. If data was not normally distributed the Wilcoxon-signed rank test was used to evaluate biases. Statistical analyses were run in Matlab version 2023b, with significance set at 0.05.
3. Results
3.1. Consistency Agreement in Time Series Between Systems
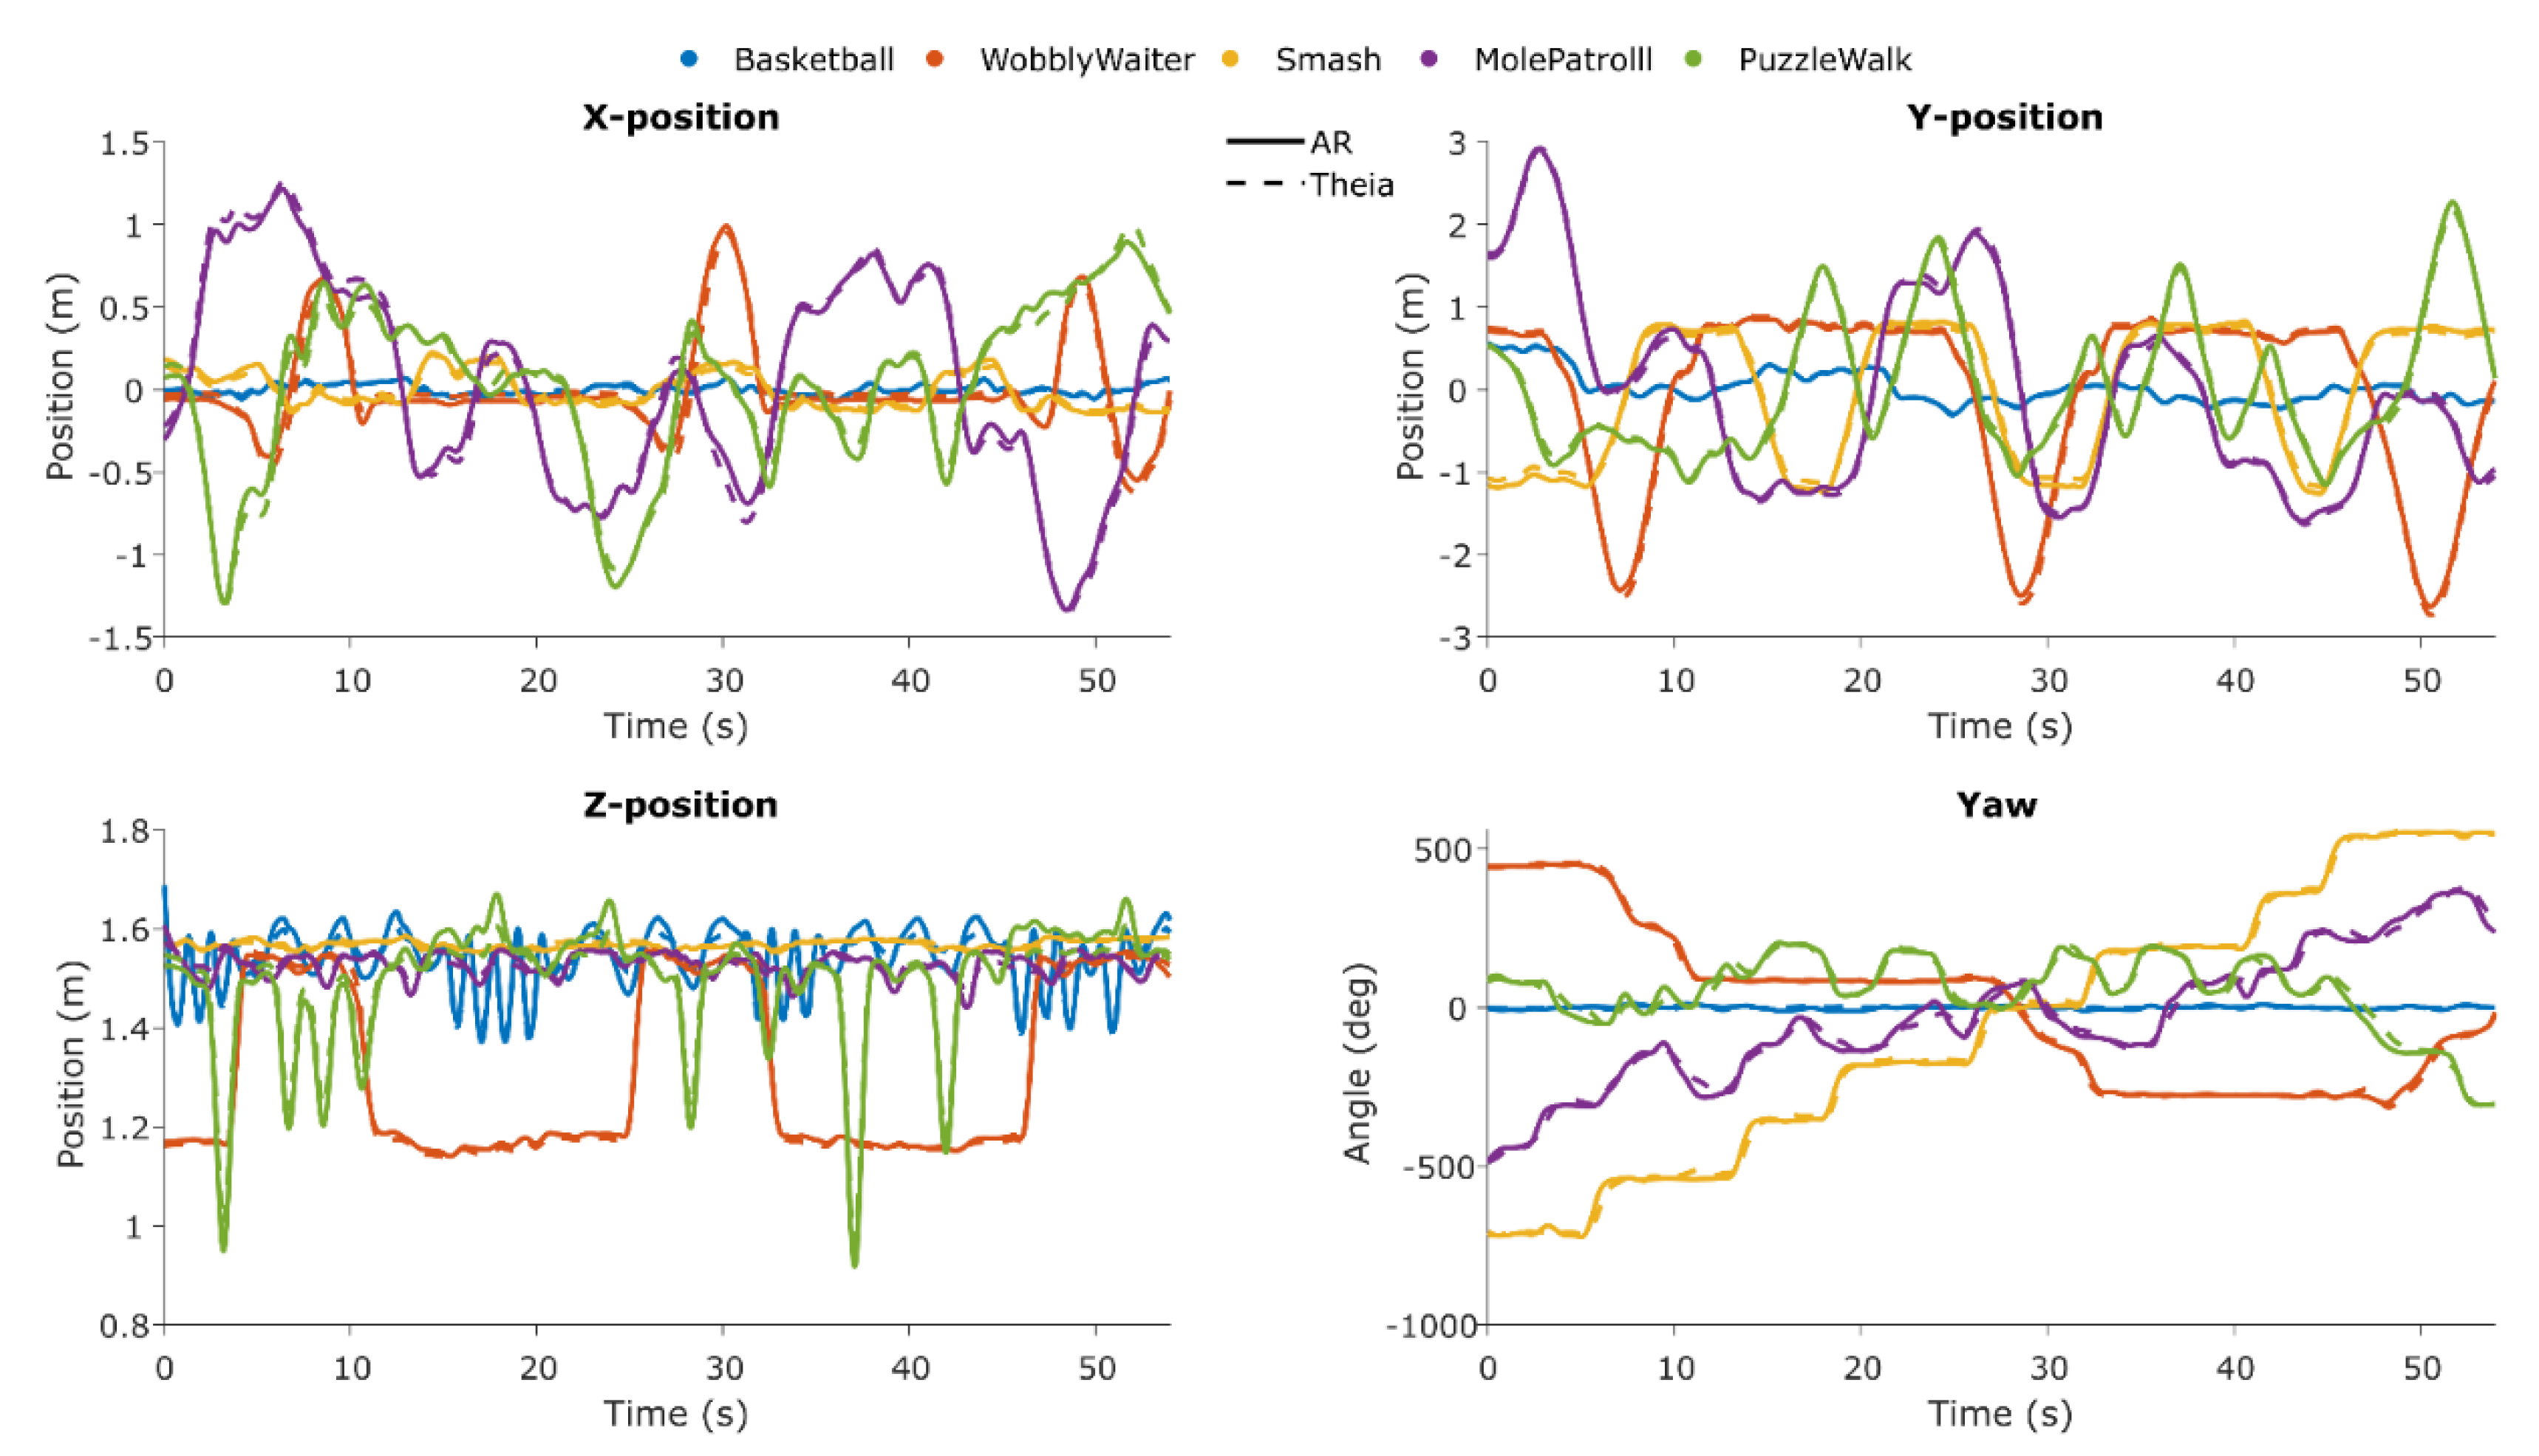
In
Figure 11, the time series for both systems are shown for each axis and for each game.
At a group level, the consistency agreement between Theia3D head and AR planar X and Y positions was excellent for all games (ICC
(C,1) > 0.932; RMSE 0.005-0.080 m). The consistency agreement between Theia3D head and AR vertical Z position was good to excellent (ICC
(C,1) = 0.736-0.998; RMSE 0.011-0.027 m). The consistency agreement between Theia3D pelvis yaw angle and AR yaw angle was excellent (ICC
(C,1) > 0.957; RMSE 12.0-21.6°), except for
Basketball (ICC
(C,1) = 0.335; RMSE 5.44°) (
Table 3).
3.2. Motor-State Segment Classification Statistics
For straight walking, 130 segments were detected in Theia3D and 134 in AR, with 125 true positives, 5 false positives, 9 false negatives, a precision of 0.962, recall of 0.933, F1-score of 0.947, and mean overlap of 97.1% ± 0.3%. Pivot turning had 114 segments detected in both systems, with 113 true positives, 1 false positive, 1 false negative, precision and recall of 0.991, F1-score of 0.991, and mean overlap of 78.3% ± 0.9%. Squatting was detected for 134 segments with perfect precision and recall (1.000) and mean overlap of 97.2% ± 0.6%. Sit-to-stand and stand-to-sit movements were also detected for 39 and 40 segments respectively with perfect precision and recall (1.000), with mean overlaps of 90.8% ± 0.4% and 93.1% ± 0.8%, respectively (
Table 4).
3.3. Absolute Agreement in Mobility Metrics
The absolute agreement between Theia3D head and AR mobility metrics was moderate to excellent. For gait metrics, mean step length and maximum gait speed showed excellent agreements (ICC
(A,1) = 0.936 and ICC
(A,1) = 0.999 respectively) without systematic bias, and cadence showed good agreement (ICC
(A,1) = 0.890) also without systematic bias. For turn metrics, turn durations showed excellent agreement (ICC
(A,1) = 0.904) without systematic biases, and moderate for peak angular velocity (ICC
(A,1) = 0.477) with a statistically significant bias (~18% of the mean) (
Table 5). For transfer metrics, both sit-to-stand and stand-to-sit mean durations showed excellent agreement (ICC
(A,1) > 0.978) without systematic bias. For squat metrics, squat duration showed excellent agreement (ICC
(A,1) = 0.995) without systematic bias, while squat depth also showed excellent agreement (ICC
(A,1) = 0.969) but with a statistically significant bias (~9% of the mean) (
Table 5).
4. Discussion
The aim of this study was to evaluate concurrent validity of AR time series, classified motor states and associated mobility metrics derived from AR glasses data against a reference markerless motion capture system (Theia3D) during gamified AR exercises in people with Parkinson’s disease. Overall, we found excellent between-systems consistency for head-position (X, Y, Z) and yaw angle time series; high accuracy for AR classified motor states straight walking, turning, squatting and transfers; and excellent absolute agreement for all mobility metrics, except for cadence and peak angular velocity. These findings are discussed below with reference to the state of the art, the strength and limitations and implications for future work.
4.1. Interpretation and Comparison with Other Literature
4.1.1. Consistency Agreement in Time Series
The consistency in planar X and Y positions between AR and Theia3D was excellent for all games (ICC
(C,1) > 0.932; RMSE ≤ 0.08 m;
Table 3), confirming the accuracy of the AR glasses’ tracking capabilities using vSLAM [
8]. In the vertical Z position, the consistency was excellent for games with substantial vertical head displacement. For games with limited vertical motion (i.e.,
Smash and
Mole Patrolll; ICC
(C,1) = 0.736 and 0.780, respectively), RMSE values were also slightly higher (0.011–0.016 m), reflecting the smaller amplitudes and the greater relative influence of noise on between-systems agreement (cf.
Figure 11) When comparing the pelvis yaw angle from Theia3D with AR yaw angle, we found excellent consistency across all games except
Basketball, which showed low agreement (ICC
(C,1) = 0.335; RMSE 5.438°) due to the absence of turning—the participants remained stationary while squatting and shooting, orienting their head to the rack of balls and the hoop, which were in the same line of sight. Overall, the strong agreement between pelvis and AR yaw highlights the potential of AR-derived head yaw as a surrogate for estimating turn parameters, offering a practical alternative to the commonly used lower-back yaw angle [
29].
4.1.2. Motor-State Segment Classification
Classified motor states (straight walking, turning, squatting, sit-to-stand, and stand-to-sit) with AR glasses showed excellent agreement compared to Theia3D, underscoring its ability to differentiate distinct motor behaviours in people with Parkinson’s disease. That said, some false positives (N = 5) and false negatives (N = 9) were identified for straight walking. These misclassifications are largely attributed to edge cases with respect to the threshold criteria applied for straight walking segments: (1) total segment length > 2 m, (2) heading angle range < 45°, (3) head yaw range < 45°, and (4) all instantaneous speeds > 0.5 m/s. When edge cases within 5% of these thresholds were included, all false positives and 8 of the 9 false negatives were correctly reclassified, resulting in a precision of 0.993, recall of 1.000, and an F1-score of 0.966. To put this in perspective, this would correspond to only 0.6% of motor state segments being falsely identified. Our results align with state of the art for gait classification in a real world-setting using a head-worn inertial sensor and feature-based machine learning [
30]. Likewise, for sit-to-stand and stand-to-sit transfer segments, Zijlstra et al. (2012) also reported high accuracy of body-fixed sensor-based transfer durations against counterparts derived from force plates in patients with Parkinson’s disease [
31]. Also, high accuracy in turning segments in people with Parkinson’s disease in a real-world setting has been shown using a single lower-back worn inertial sensor [
32,
33,
34]. Taken together, these studies and our new findings collectively underscore the potential of wearable sensors, including AR glasses, for classifying motor states in individuals with Parkinson’s disease.
4.1.3. Absolute Agreement in Mobility Metrics
Excellent absolute agreement was found for mean step length and maximum gait speed, with no systematic bias, while cadence showed good agreement with a small, insignificant bias. However, the limits of agreement were relatively wide. This may be due to the different methods used between systems for cadence calculation. For Theia3D data heel strike events (via the MDHT algorithm) were used, whereas for AR data cadence was estimated from minima in vertical head position, which occurs in the double-support phase [
24]. Since these approaches rely on different events -- heel strikes directly measure foot-ground contact while head-based double support is an indirect and less sharply demarcated event influenced by head movement or postural sway -- some variation between systems was to be expected. This likely explains the wider limits of agreement for cadence. Similar observations have been reported for AR-derived gait parameters compared with motion capture during 10-meter walk tests [
10,
12].
For transfer and squat metrics excellent absolute agreement statistics were observed for sit-to-stand, stand-to-sit, and squat durations, without systematic biases except for squat depth (~9% of the mean). This bias is likely due to differences in the definition of the coordinate system origins: the AR-glasses use a point located at the front, inside the glasses, whereas Theia3D defines the head origin around the midpoint between the ears [
21]. Because the AR origin sits more anterior, pitch rotations during squats exaggerate vertical head displacement compared to Theia3D. In addition, small misplacements or tilt of the headset in the sagittal plane may have further amplified this effect. Although pitch correction was applied (section 2.5.1), the larger pitch angles typically seen during squats may have exceeded the correction’s effective range, thereby contributing to the observed differences in squat depth between systems. As a result, vertical head displacement is exaggerated with head pitch in AR data because of its more anterior point of origin compared to Theia3D. Although pitch correction was applied (section 2.5.1), the larger pitch angles typically seen for squats possibly exceeded the correction’s effective range, which may have caused differences in squat depths between systems. Similar findings for AR transfer metrics have been reported before for transfers involved in the Five Times Sit-to-Stand test [
10]. Because squats involve a vertical movement pattern similar to a combination of stand-to-sit and sit-to-stand transfers, excellent agreement for squat duration was expected and confirmed.
For turn metrics excellent absolute agreement was found for turn duration without systematic bias, indicating that the duration of a 180-degree pivot turn, even though it relied on head yaw rather than the more commonly measured pelvis or trunk yaws [
35]. This result aligns with the findings of Rehman et al. (2020), who investigated the influence of sensor location on turning characteristics in the classification of Parkinson’s disease. In their study, inertial sensors were attached to both the head and lower back in 37 individuals with Parkinson’s disease. They demonstrated that turn metrics derived from head-mounted inertial sensors were comparable to counterparts obtained from the lower back, especially when combining spatiotemporal and signal-based features [
34]. These results reinforce the notion that the head can serve as a reliable proxy for assessing the durations of 180-degree pivot turns, provided that the analytical approach accounts for the distinct movement patterns and potential noise associated with head motion (e.g., nodding, dyskinesia, scanning). Moderate absolute agreement was found for peak angular velocity, with a significant bias of ~18% of the mean, as AR-derived values were consistently higher than those from Theia3D. This discrepancy is likely attributable to the nature of head movements, which may include non-turn-related actions such as looking around to scan the environment. Such additional head motions, unrelated to actual body turning, can inflate the measured angular velocity, introducing noise into the turn metric peak angular velocity when relying on AR yaw data only. Turn durations are less susceptible to such additional head motions, with excellent agreement statistics, and hence recommended as a robust turning metric.
4.2. Strengths and Limitations
A major strength of this study lies in its innovative use of AR-glasses as a continuous and unobtrusive tool to capture mobility metrics during gamified AR exercises. By comparing AR-derived mobility parameters with those obtained from a reference markerless motion capture system (Theia3D), we provide robust evidence supporting the concurrent validity of AR technology for deriving mobility metrics for various motor states in people with Parkinson’s disease. The inclusion of multiple gamified AR exercises promoting diverse motor states (e.g., straight walking, turning, squatting, transfers) enhances the generalizability of our findings to different functional tasks relevant in daily life.
However, some limitations must be acknowledged. First, the sample size was relatively small and consisted of a convenience sample of 15 persons with PD (modified Hoehn and Yahr stages 1-2), which may limit the generalizability to the broader PD population, especially those at more advanced disease stages. Second, the pitch correction model applied to the AR vertical position data was empirically derived and may not fully account for individual differences in head motion or posture during walking. Third, while Theia3D serves as a well-validated markerless motion capture system for accurately estimating the position and orientation of body segments, the subsequent calculation of mobility metrics depends heavily on the specific algorithms and computational pipelines applied to this data. These algorithm pipelines involve steps such as signal filtering, segmentation of gait cycles, event detection (e.g., heel strikes), and parameter extraction. As a result, differences in parameter thresholds, or processing assumptions may influence the derived mobility metrics, potentially affecting their accuracy and comparability with other measurement systems or across studies. We therefore explicitly reported all parameters and made our dataset available (S2. AR and Theia3D processed and time-aligned time series), and we encourage other researchers to do the same to facilitate comparison and interpretation of results across studies.
4.3. Implications and Future Work
This study contributes to the growing body of evidence supporting the use of AR-glasses as a promising tool for digital mobility assessment in people with PD. Beyond the feasibility of deriving valid mobility metrics from AR-based head tracking during standardized clinical tests [
11,
12], these findings underscore the potential of capturing mobility metrics during daily gamified AR exercises, which could facilitate more frequent, low burden assessments of mobility.
One prospect of our findings lies in the integration of remote mobility monitoring within home-based AR-rehabilitation programs prescribed by clinicians. Remote monitoring of mobility outcomes could enable clinicians to track progress more frequently, enhancing personalised treatment and allowing for timely adjustments to interventions based on mobility metrics frequently captured in the real world. This approach aligns with the findings of Negi et al. (2025), who highlighted that infrequent clinic visits and reliance on subjective assessments create a critical gap in Parkinson’s disease management, and that continuous, objective digital monitoring can fill this gap by capturing subtle changes in motor functioning over time, allowing for timely and personalized intervention [
13]. Emerging evidence further indicates that digital mobility outcomes (DMOs) derived from real-world assessments capture complementary aspects of functional mobility not observable during short, supervised clinical tests. Real-world DMOs, such as walking speed and step length, are often lower than laboratory measures, reflecting the challenges of everyday environments. Their moderate-to-weak correlations with clinical tests suggest that they provide distinct and valuable insights into functional mobility. This distinction between real-world performance and supervised capacity may therefore be
valuable for understanding the true impact of mobility difficulties and for tailoring rehabilitation [
8].
Another prospect is the possibility to present direct feedback on mobility performance during gamified AR exercises to the patient itself. Providing such feedback in real time could increase user engagement and adherence. Feedback tailored to individual mobility characteristics—such as step length, walking speed, or turn, squat, and transfer durations—can help users monitor their own (progress in) performance. This type of feedback was also considered valuable by patients themselves when partaking in a 6-week gamified AR exercises at home [
12]. Another study by Boege et al. (2024) emphasizes the potential of self-management systems, enabling patients to actively track and respond to their own functional performance, which enhances engagement, adherence, and empowerment in Parkinson’s disease care [
36]. Additionally, real-time adjustments or in-game feedback based on ongoing movement data may support more effective training by identifying deviations from intended movement patterns, such as incomplete squats or irregular turning, and prompting corrective actions when needed.
Future research should explore the sensitivity and responsiveness of AR-derived mobility metrics for disease progression and treatment effects through longitudinal studies, for example over a 6-week AR rehabilitation program at home [
19]. Examining changes in mobility metrics over time during a gamified AR exercises program—such as the changes in transfer durations, turning durations, or subtle declines in walking speed—could determine whether AR-glasses can reliably capture clinically meaningful changes in mobility. Demonstrating this sensitivity and responsiveness would support the use of AR glasses for long-term unobtrusive monitoring in people with Parkinson’s disease.
5. Conclusions
This study demonstrates that position data measured with AR glasses agree excellently with motion capture data. From this data, specific motor states and associated mobility metrics can be accurately derived in people with Parkinson’s disease during multiple gamified AR exercises. These findings support the use of AR glasses as a viable tool for capturing detailed mobility metrics beyond traditional standardized clinical tests. This approach could facilitate the derivation of mobility metrics in the clinic and remotely at home. Further research is warranted to evaluate the sensitivity and responsiveness of these metrics to disease progressing and treatments.
Supplementary Materials
The following supporting information can be downloaded at:
Preprints.org, Table S1: Strolll AR exercises; Datafile S2: AR and Theia3D processed and time-aligned time series.
Author Contributions
Conceptualization, M.R., E.N.J., and P.F.v.D.; methodology, P.F.v.D., E.N.J., and M.R.; software, P.F.v.D. and E.N.J.; validation, P.F.v.D., E.N.J., and M.R.; formal analysis, P.F.v.D.; investigation, P.F.v.D., resources, K.W., M.M.v.d.K,, and M.R.; data curation, P.F.v.D., K.W.; writing – original draft preparation, P.F.v.D. and M.R.; writing – review and editing, P.F.v.D., E.N.J., K.W., M.M.v.d.K., and M.R.; visualization, P.F.v.D.; supervision, M.R. and E.N.J.; project administration, M.R.; funding acquisition, M.R. All authors have read and agreed to the published version of the manuscript.
Funding
This project is funded by the EMIL project financial support to third parties, which is funded by the European Union, and by a Horizon Europe grant for project NavigAIt: An artificial intelligence application for augmented reality glasses to provide intelligent cueing to assist everyday walking for people with Parkinson’s disease anywhere, anytime (Accelerator grant awarded from the European Innovation Council, with grant funding received from United Kingdom Research and Innovation (UKRI) under their Horizon Europe Guarantee Extension (competition 1389)).
Institutional Review Board Statement
The study was conducted in accordance with the Declaration of Helsinki and approved by the Medical Research Ethics Committees United, the Netherlands (R24.008, NL86191.100.24, 18 April 2024)
Informed Consent Statement
Written informed consent was obtained from all participants prior to the study.
Data Availability Statement
All data is made available as Data file in the Supplementary Material.
Acknowledgments
The authors would like to thank the CAPARE team (Daphne Geerse, Lotte Hardeman, Eva Hoogendoorn, Jara van Bergem, and Annejet van Dam, and Sybren van Hall) for their contribution in obtaining ethical approval and patient recruitment. Special thanks go to Sybren van Hall for his support in patient recruitment and data collection. We would also like to thank Susan de Koning for her support with Theia3D measurements and Paul Pesman for serving as a model in Figures 1-5. During the preparation of this manuscript, the authors used ChatGPT (GPT-5, OpenAI) for assistance with algorithm development and text revisions. The authors have reviewed and edited the output and take full responsibility for the content of this publication.
Conflicts of Interest
M.R. is a scientific advisor with share options for Strolll Ltd., a digital therapeutics company building AR software for physical rehabilitation, alongside his full-time academic positions at Vrije Universiteit Amsterdam and Maastricht University. E.N.J. is VP of Data & AI at Strolll Ltd. The other authors declare no conflict of interest. The funder had no role in the design of the study, in the collection, analysis, or interpretation of data, in the writing of the manuscript, or in the decision to publish the results.
References
- Gómez-Esteban, J.C.; Zarranz, J.J.; Lezcano, E.; Tijero, B.; Luna, A.; Velasco, F.; Rouco, I.; Garamendi, I. Influence of Motor Symptoms upon the Quality of Life of Patients with Parkinson’s Disease. European Neurology 2007, 57, 161–165. [Google Scholar] [CrossRef] [PubMed]
- Bouça-Machado, R.; Duarte, G.S.; Patriarca, M.; Castro Caldas, A.; Alarcão, J.; Fernandes, R.M.; Mestre, T.A.; Matias, R.; Ferreira, J.J. Measurement Instruments to Assess Functional Mobility in Parkinson's Disease: A Systematic Review. Movement Disorders Clinical Practice 2020, 7, 129–139. [Google Scholar] [CrossRef] [PubMed]
- Duncan, R.P.; Leddy, A.L.; Earhart, G.M. Five Times Sit-to-Stand Test Performance in Parkinson's Disease. Archives of Physical Medicine and Rehabilitation 2011, 92, 1431–1436. [Google Scholar] [CrossRef]
- Lindholm, B.; Nilsson, M.H.; Hansson, O.; Hagell, P. The clinical significance of 10-m walk test standardizations in Parkinson’s disease. Journal of Neurology 2018, 265, 1829–1835. [Google Scholar] [CrossRef] [PubMed]
- Nocera, J.R.; Stegemöller, E.L.; Malaty, I.A.; Okun, M.S.; Marsiske, M.; Hass, C.J. Using the Timed Up & Go Test in a Clinical Setting to Predict Falling in Parkinson's Disease. Archives of Physical Medicine and Rehabilitation 2013, 94, 1300–1305. [Google Scholar] [CrossRef]
- Böttinger, M.J.; Labudek, S.; Schoene, D.; Jansen, C.-P.; Stefanakis, M.-E.; Litz, E.; Bauer, J.M.; Becker, C.; Gordt-Oesterwind, K. “TiC-TUG”: technology in clinical practice using the instrumented timed up and go test—a scoping review. Aging Clinical and Experimental Research 2024, 36. [Google Scholar] [CrossRef]
- Warmerdam, E.; Hausdorff, J.M.; Atrsaei, A.; Zhou, Y.; Mirelman, A.; Aminian, K.; Espay, A.J.; Hansen, C.; Evers, L.J.W.; Keller, A.; et al. Long-term unsupervised mobility assessment in movement disorders. The Lancet Neurology 2020, 19, 462–470. [Google Scholar] [CrossRef]
- Kirk, C.; Packer, E.; Polhemus, A.; Maclean, M.K.; Bailey, H.; Kluge, F.; Gaßner, H.; Rochester, L.; Del Din, S.; Yarnall, A.J. A systematic review of real-world gait-related digital mobility outcomes in Parkinson’s disease. npj Digital Medicine 2025, 8. [Google Scholar] [CrossRef]
- Theodorou, C.; Velisavljevic, V.; Dyo, V.; Nonyelu, F. Visual SLAM algorithms and their application for AR, mapping, localization and wayfinding. Array 2022, 15, 100222. [Google Scholar] [CrossRef]
- Geerse, D.J.; Coolen, B.; Roerdink, M. Quantifying Spatiotemporal Gait Parameters with HoloLens in Healthy Adults and People with Parkinson’s Disease: Test-Retest Reliability, Concurrent Validity, and Face Validity. Sensors 2020, 20, 3216. [Google Scholar] [CrossRef]
- Van Bergem, J.S.; Van Doorn, P.F.; Hoogendoorn, E.M.; Geerse, D.J.; Roerdink, M. Gait and Balance Assessments with Augmented Reality Glasses in People with Parkinson’s Disease: Concurrent Validity and Test–Retest Reliability. Sensors 2024, 24, 5485. [Google Scholar] [CrossRef]
- Van Doorn, P.F.; Geerse, D.J.; Van Bergem, J.S.; Hoogendoorn, E.M.; Nyman, E.; Roerdink, M. Gait Parameters Can Be Derived Reliably and Validly from Augmented Reality Glasses in People with Parkinson’s Disease Performing 10-m Walk Tests at Comfortable and Fast Speeds. Sensors 2025, 25, 1230. [Google Scholar] [CrossRef]
- Hardeman, L.E.S.; van Benten, E.; Hoogendoorn, E.M.; van Gameren, M.; Nonnekes, J.; Roerdink, M.; Geerse, D.J. Do People With Parkinson’s Disease Find a Home-Based Augmented-Reality Gait-and-Balance Exercise Program Acceptable?: A Qualitative Approach. 2025. [Google Scholar] [CrossRef]
- Negi, A.S.; Karjagi, S.; Parisi, L.; Daley, K.W.; Abay, A.K.; Gala, A.S.; Wilkins, K.B.; Hoffman, S.L.; Ferris, M.S.; Zahed, H.; et al. Remote real time digital monitoring fills a critical gap in the management of Parkinson’s disease. npj Parkinson's Disease 2025, 11. [Google Scholar] [CrossRef] [PubMed]
- Steinmetz, J.D.; Seeher, K.M.; Schiess, N.; Nichols, E.; Cao, B.; Servili, C.; Cavallera, V.; Cousin, E.; Hagins, H.; Moberg, M.E.; et al. Global, regional, and national burden of disorders affecting the nervous system, 1990–2021: a systematic analysis for the Global Burden of Disease Study 2021. The Lancet Neurology 2024, 23, 344–381. [Google Scholar] [CrossRef] [PubMed]
- Kanko, R.M.; Laende, E.K.; Strutzenberger, G.; Brown, M.; Selbie, W.S.; Depaul, V.; Scott, S.H.; Deluzio, K.J. Assessment of spatiotemporal gait parameters using a deep learning algorithm-based markerless motion capture system. Journal of Biomechanics 2021, 122, 110414. [Google Scholar] [CrossRef] [PubMed]
- Scataglini, S.; Abts, E.; Van Bocxlaer, C.; Van Den Bussche, M.; Meletani, S.; Truijen, S. Accuracy, Validity, and Reliability of Markerless Camera-Based 3D Motion Capture Systems versus Marker-Based 3D Motion Capture Systems in Gait Analysis: A Systematic Review and Meta-Analysis. Sensors 2024, 24, 3686. [Google Scholar] [CrossRef]
- Hardeman, L.E.S.; Geerse, D.J.; Hoogendoorn, E.M.; Nonnekes, J.; Roerdink, M. Remotely prescribed, monitored, and tailored home-based gait-and-balance exergaming using augmented reality glasses: a clinical feasibility study in people with Parkinson’s disease. Frontiers in Neurology 2024, 15. [Google Scholar] [CrossRef]
- Hoogendoorn, E.M.; Geerse, D.J.; van Doorn, P.F.; van Dam, A.T.; van Hall, S.J.; Hardeman, L.E.S.; Stins, J.F.; Roerdink, M. Cueing-assisted gamified augmented-reality home rehabilitation for gait and balance in people with Parkinson's disease: feasibility and potential effectiveness in the clinical pathway. 2025. [Google Scholar] [CrossRef]
- Larsen, T.A.; Calne, S.; Calne, D.B. Assessment of Parkinson's disease. Clin Neuropharmacol 1984, 7, 165–169. [Google Scholar] [CrossRef]
- Theia Markerless Inc. Default Model Description. Available online: https://docs.theiamarkerless.com/theia3d-documentation/theia-model-description/default-model-description (accessed on 15-07-2025).
- Rawash, Y.Z.; Al-Naami, B.; Alfraihat, A.; Owida, H.A. Advanced Low-Pass Filters for Signal Processing: A Comparative Study on Gaussian, Mittag-Leffler, and Savitzky-Golay Filters. Mathematical Modelling of Engineering Problems 2024, 11, 1841–1850. [Google Scholar] [CrossRef]
- Caron-Laramée, A.; Walha, R.; Boissy, P.; Gaudreault, N.; Zelovic, N.; Lebel, K. Comparison of Three Motion Capture-Based Algorithms for Spatiotemporal Gait Characteristics: How Do Algorithms Affect Accuracy and Precision of Clinical Outcomes? Sensors 2023, 23, 2209. [Google Scholar] [CrossRef]
- Dang, D.C.; Dang, Q.K.; Chee, Y.J.; Suh, Y.S. Neck Flexion Angle Estimation during Walking. Journal of Sensors 2017, 2017, 1–9. [Google Scholar] [CrossRef]
- Shah, V.V.; Curtze, C.; Mancini, M.; Carlson-Kuhta, P.; Nutt, J.G.; Gomez, C.M.; El-Gohary, M.; Horak, F.B.; McNames, J. Inertial Sensor Algorithms to Characterize Turning in Neurological Patients With Turn Hesitations. IEEE Trans Biomed Eng 2021, 68, 2615–2625. [Google Scholar] [CrossRef] [PubMed]
- McGraw, K.O.; Wong, S.P. Forming inferences about some intraclass correlation coefficients. Psychological Methods 1996, 1, 30–46. [Google Scholar] [CrossRef]
- Koo, T.K.; Li, M.Y. A Guideline of Selecting and Reporting Intraclass Correlation Coefficients for Reliability Research. Journal of Chiropractic Medicine 2016, 15, 155–163. [Google Scholar] [CrossRef]
- Bland, J.M.; Altman, D.G. Measuring agreement in method comparison studies. Statistical Methods in Medical Research 1999, 8, 135–160. [Google Scholar] [CrossRef]
- Novak, D.; Goršič, M.; Podobnik, J.; Munih, M. Toward Real-Time Automated Detection of Turns during Gait Using Wearable Inertial Measurement Units. Sensors 2014, 14, 18800–18822. [Google Scholar] [CrossRef]
- Tasca, P.; Salis, F.; Cereatti, A. Real-world gait detection with a head-worn inertial unit and features-based machine learning. Gait & Posture 2024, 114, S41. [Google Scholar] [CrossRef]
- Zijlstra, A.; Mancini, M.; Lindemann, U.; Chiari, L.; Zijlstra, W. Sit-stand and stand-sit transitions in older adults and patients with Parkinson’s disease: event detection based on motion sensors versus force plates. Journal of NeuroEngineering and Rehabilitation 2012, 9, 75. [Google Scholar] [CrossRef]
- Pham, M.H.; Elshehabi, M.; Haertner, L.; Heger, T.; Hobert, M.A.; Faber, G.S.; Salkovic, D.; Ferreira, J.J.; Berg, D.; Sanchez-Ferro, Á.; et al. Algorithm for Turning Detection and Analysis Validated under Home-Like Conditions in Patients with Parkinson’s Disease and Older Adults using a 6 Degree-of-Freedom Inertial Measurement Unit at the Lower Back. Frontiers in Neurology 2017, 8. [Google Scholar] [CrossRef]
- El-Gohary, M.; Pearson, S.; McNames, J.; Mancini, M.; Horak, F.; Mellone, S.; Chiari, L. Continuous Monitoring of Turning in Patients with Movement Disability. Sensors 2013, 14, 356–369. [Google Scholar] [CrossRef]
- Rehman, R.Z.U.; Klocke, P.; Hryniv, S.; Galna, B.; Rochester, L.; Del Din, S.; Alcock, L. Turning Detection During Gait: Algorithm Validation and Influence of Sensor Location and Turning Characteristics in the Classification of Parkinson’s Disease. Sensors 2020, 20, 5377. [Google Scholar] [CrossRef]
- Mancini, M.; El-Gohary, M.; Pearson, S.; McNames, J.; Schlueter, H.; Nutt, J.G.; King, L.A.; Horak, F.B. Continuous monitoring of turning in Parkinson’s disease: Rehabilitation potential. NeuroRehabilitation 2015, 37, 3–10. [Google Scholar] [CrossRef]
- Boege, S.; Milne-Ives, M.; Ananthakrishnan, A.; Carroll, C.; Meinert, E. Self-Management Systems for Patients and Clinicians in Parkinson's Disease Care: A Scoping Review. J Parkinsons Dis 2024, 14, 1387–1404. [Google Scholar] [CrossRef]
Figure 1.
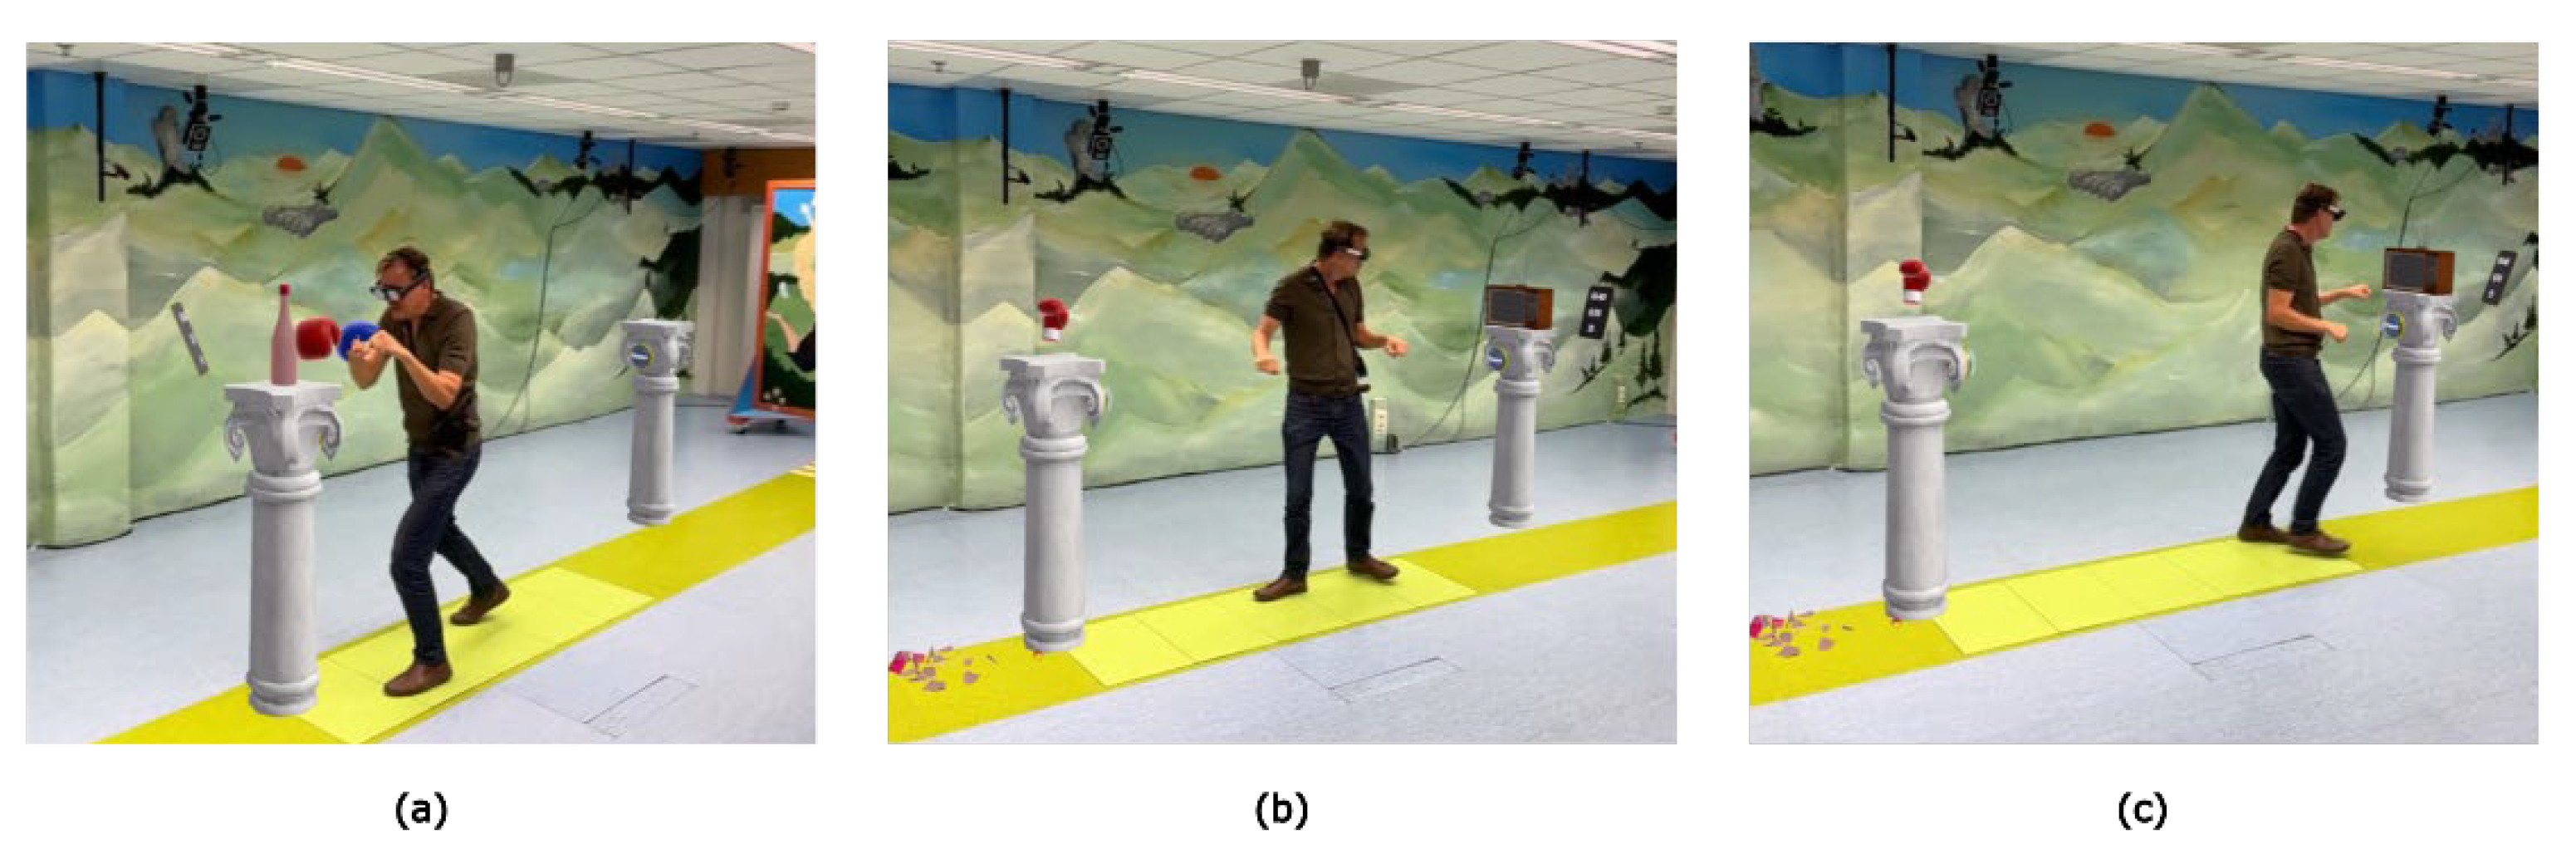
Smash, a gamified AR exercise involving (a) boxing an object from a pillar, (b) 180° turning toward (c) another pillar to repeat the sequence.
Figure 1.
Smash, a gamified AR exercise involving (a) boxing an object from a pillar, (b) 180° turning toward (c) another pillar to repeat the sequence.
Figure 2.
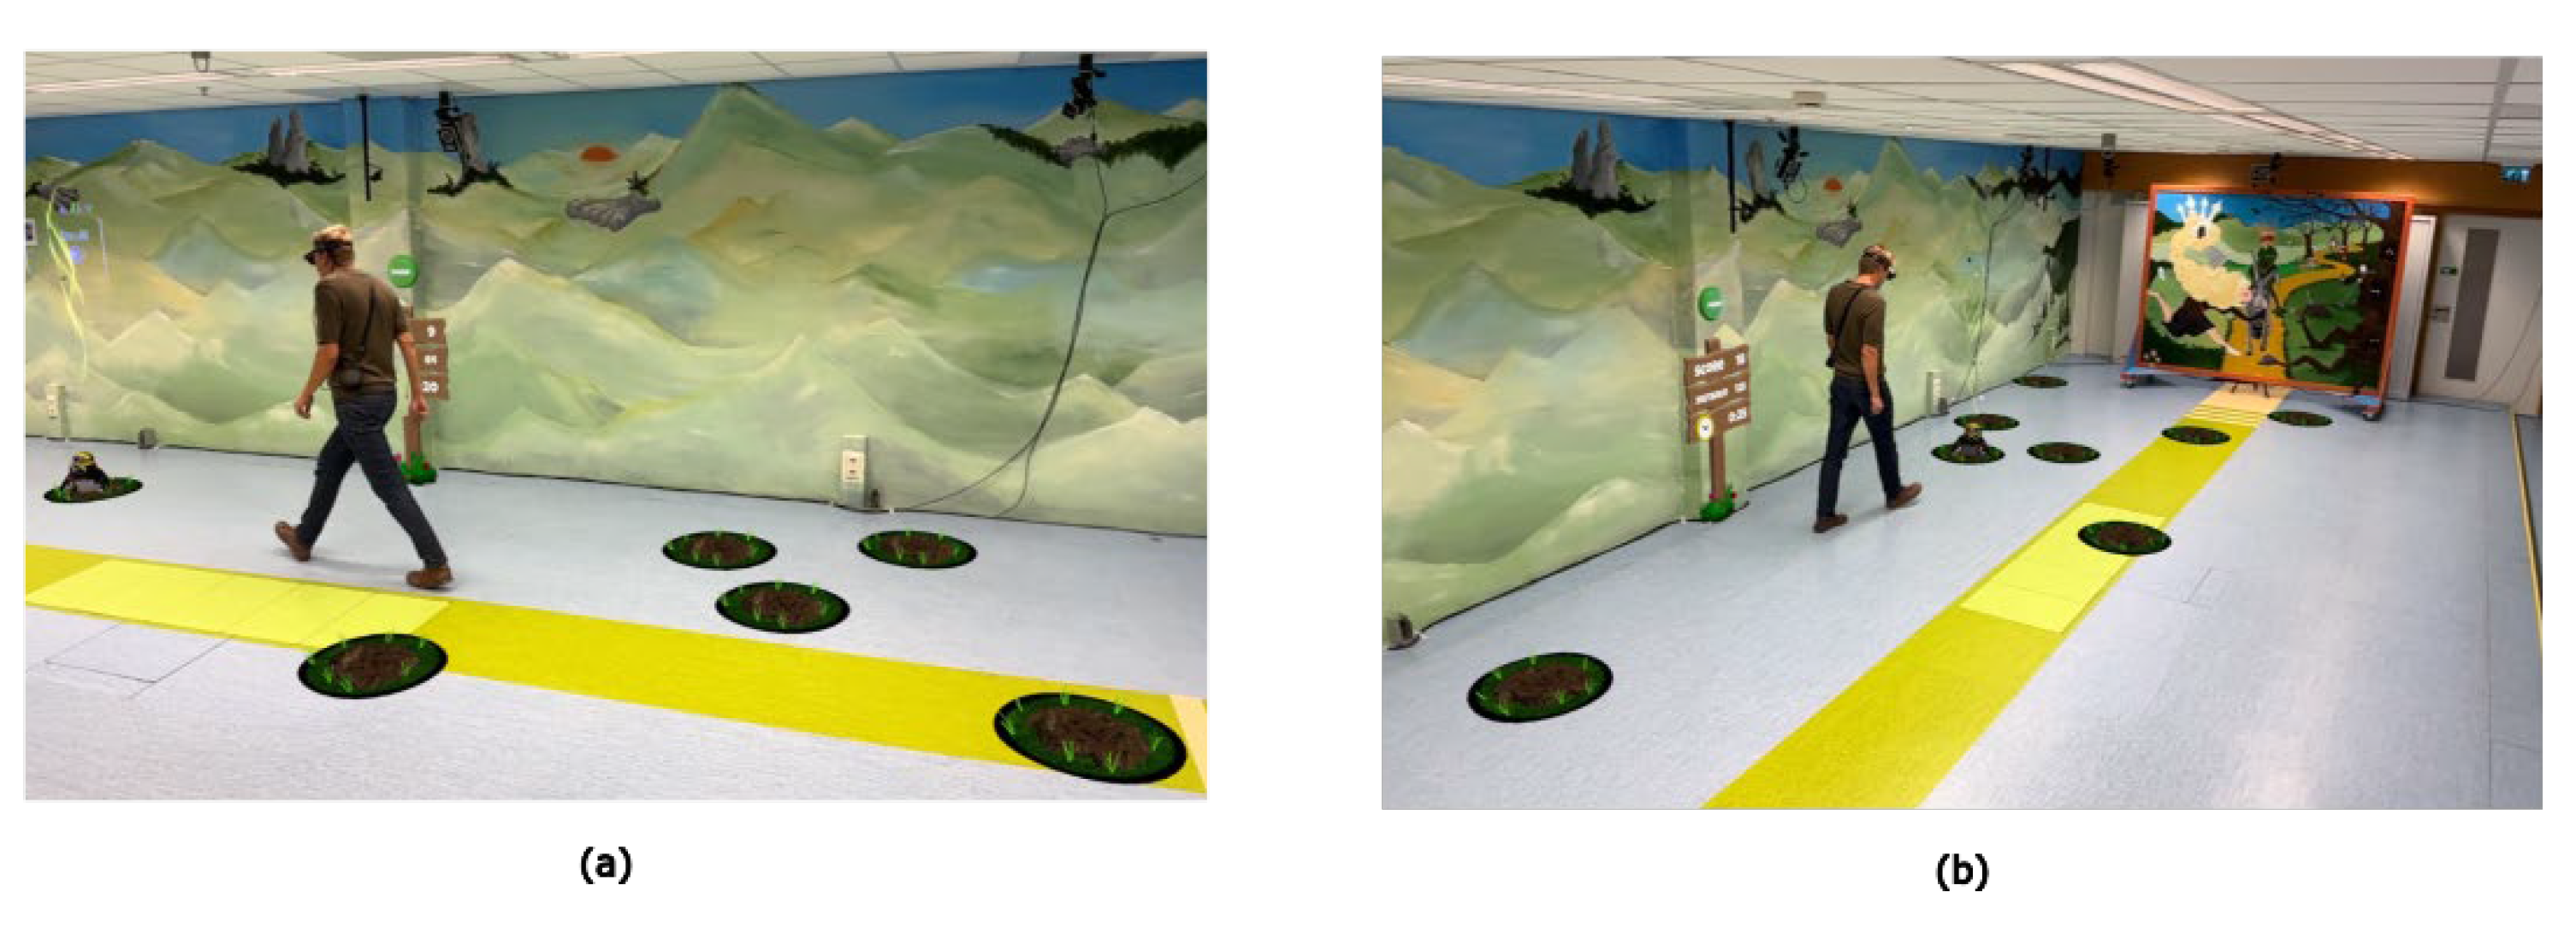
Mole Patrolll, a gamified AR exercise involving (a) stepping on a mole (b) search for the next mole and repeat the sequence.
Figure 2.
Mole Patrolll, a gamified AR exercise involving (a) stepping on a mole (b) search for the next mole and repeat the sequence.
Figure 3.
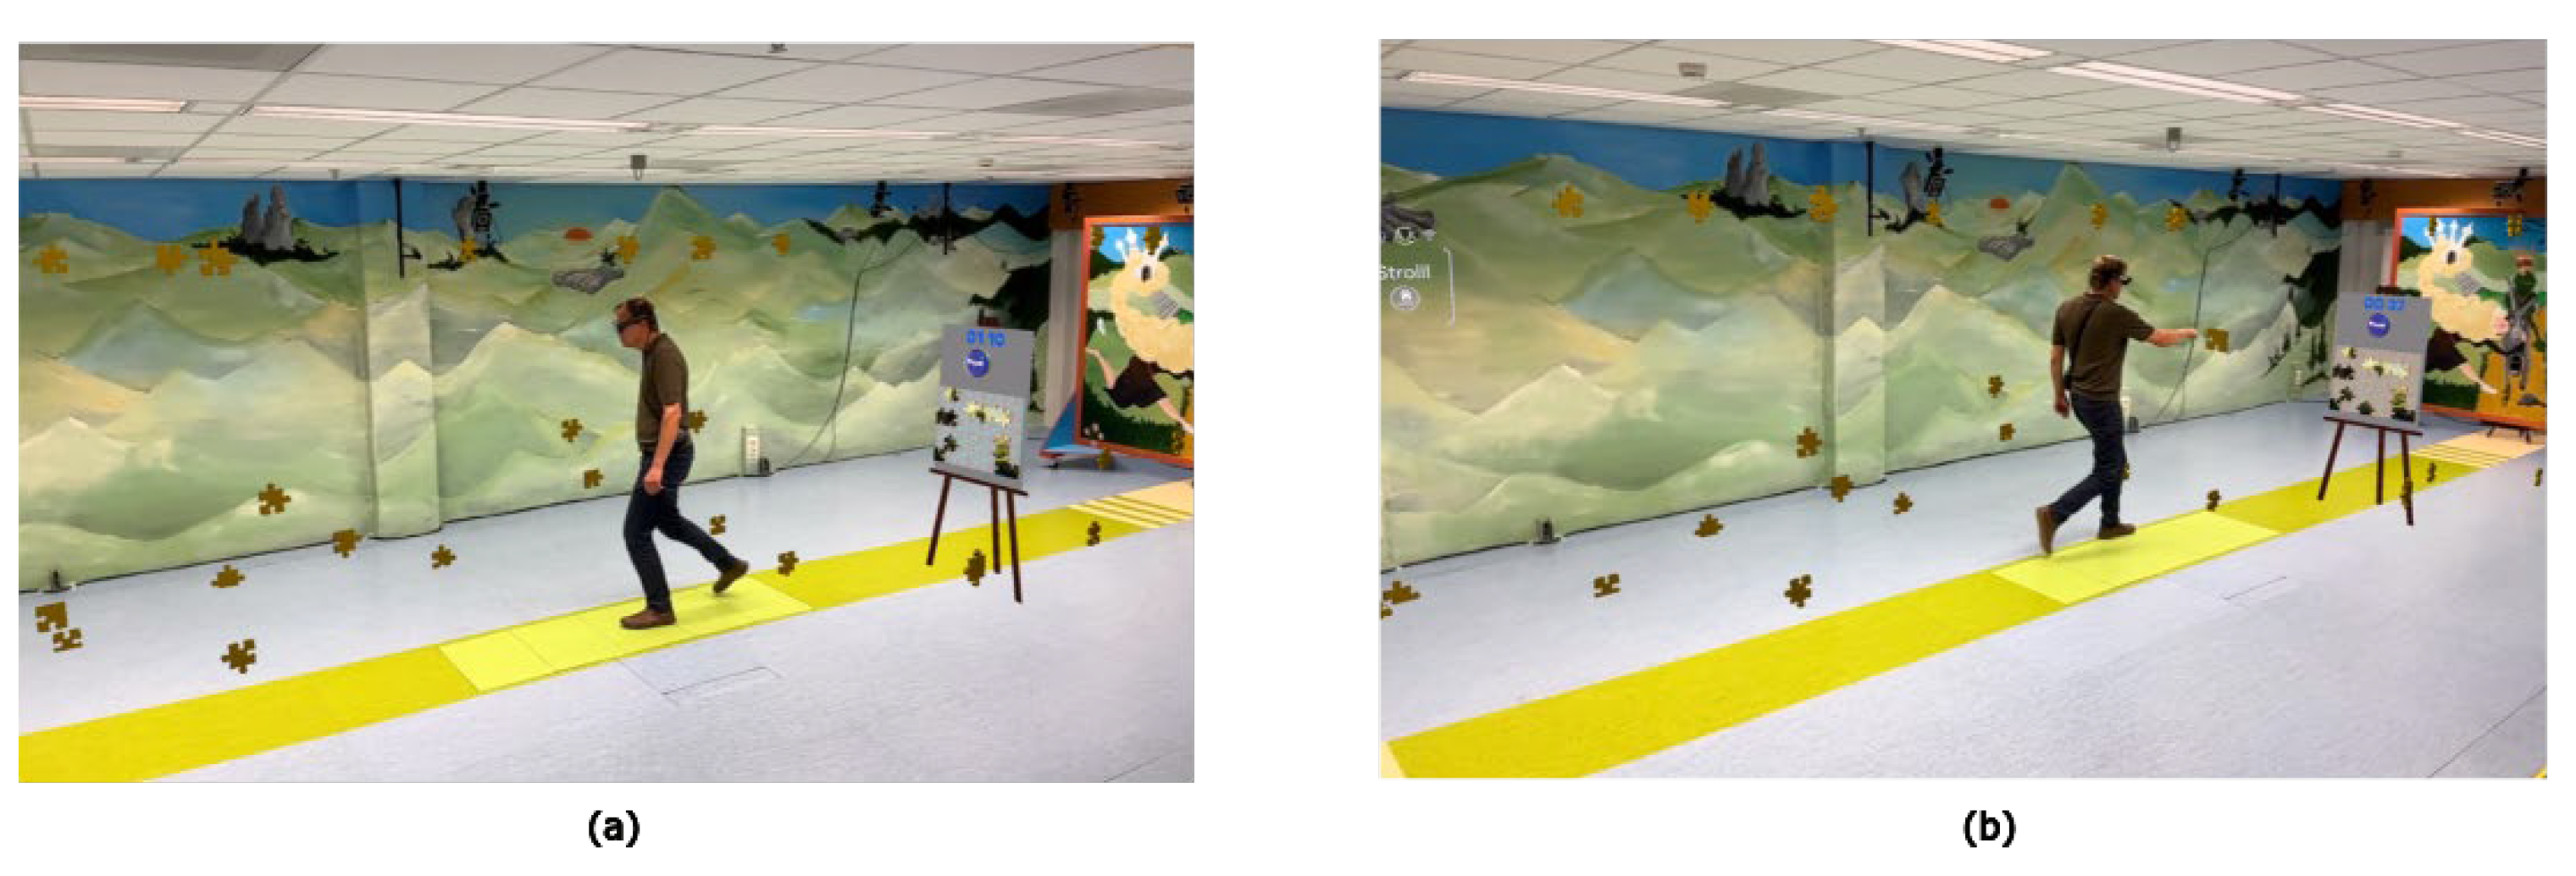
Puzzle Walk, a gamified AR exercise involving (a) searching and gathering puzzle pieces, and (b) place the puzzle piece on the easel and repeat the sequence.
Figure 3.
Puzzle Walk, a gamified AR exercise involving (a) searching and gathering puzzle pieces, and (b) place the puzzle piece on the easel and repeat the sequence.
Figure 4.
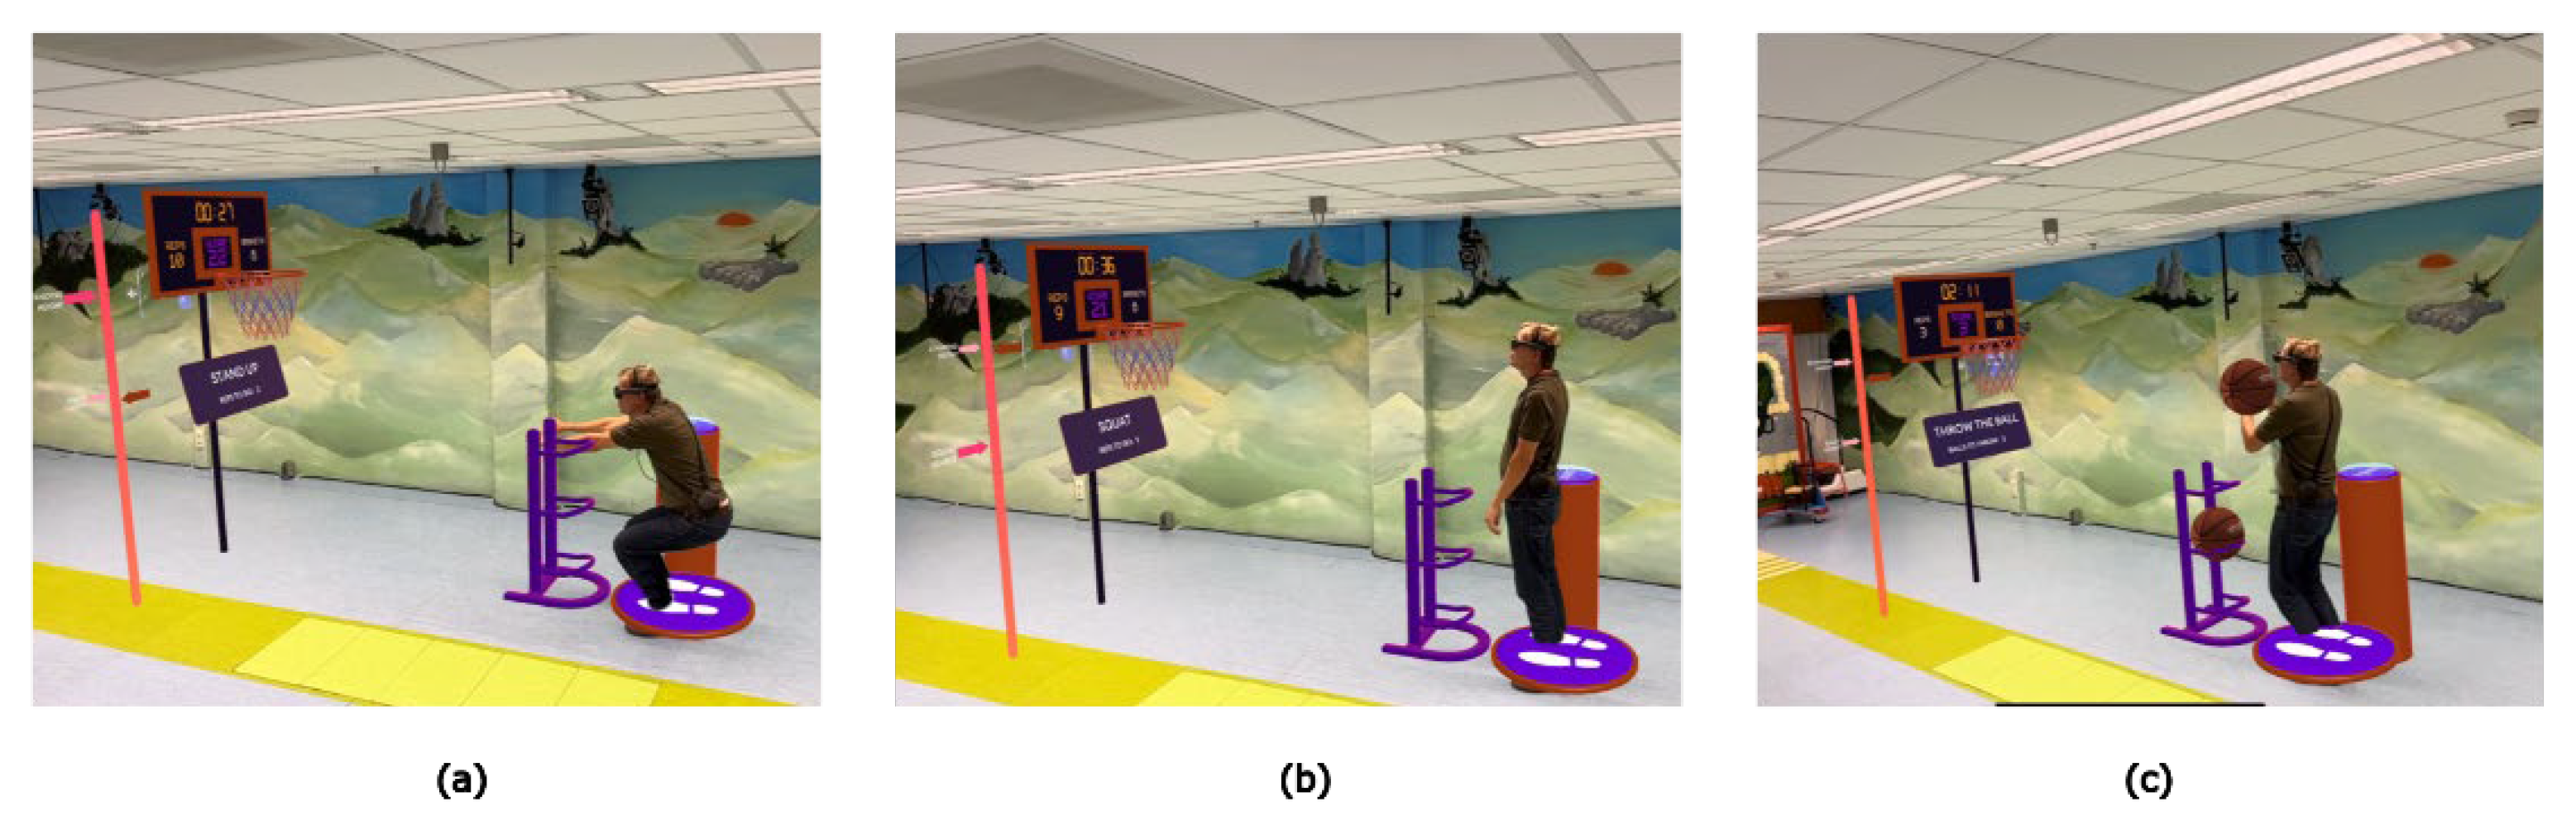
Basketball, a gamified AR exercise involving (a,b) squats to earn 3 basketballs to (c) throw in the basket and repeat the sequence.
Figure 4.
Basketball, a gamified AR exercise involving (a,b) squats to earn 3 basketballs to (c) throw in the basket and repeat the sequence.
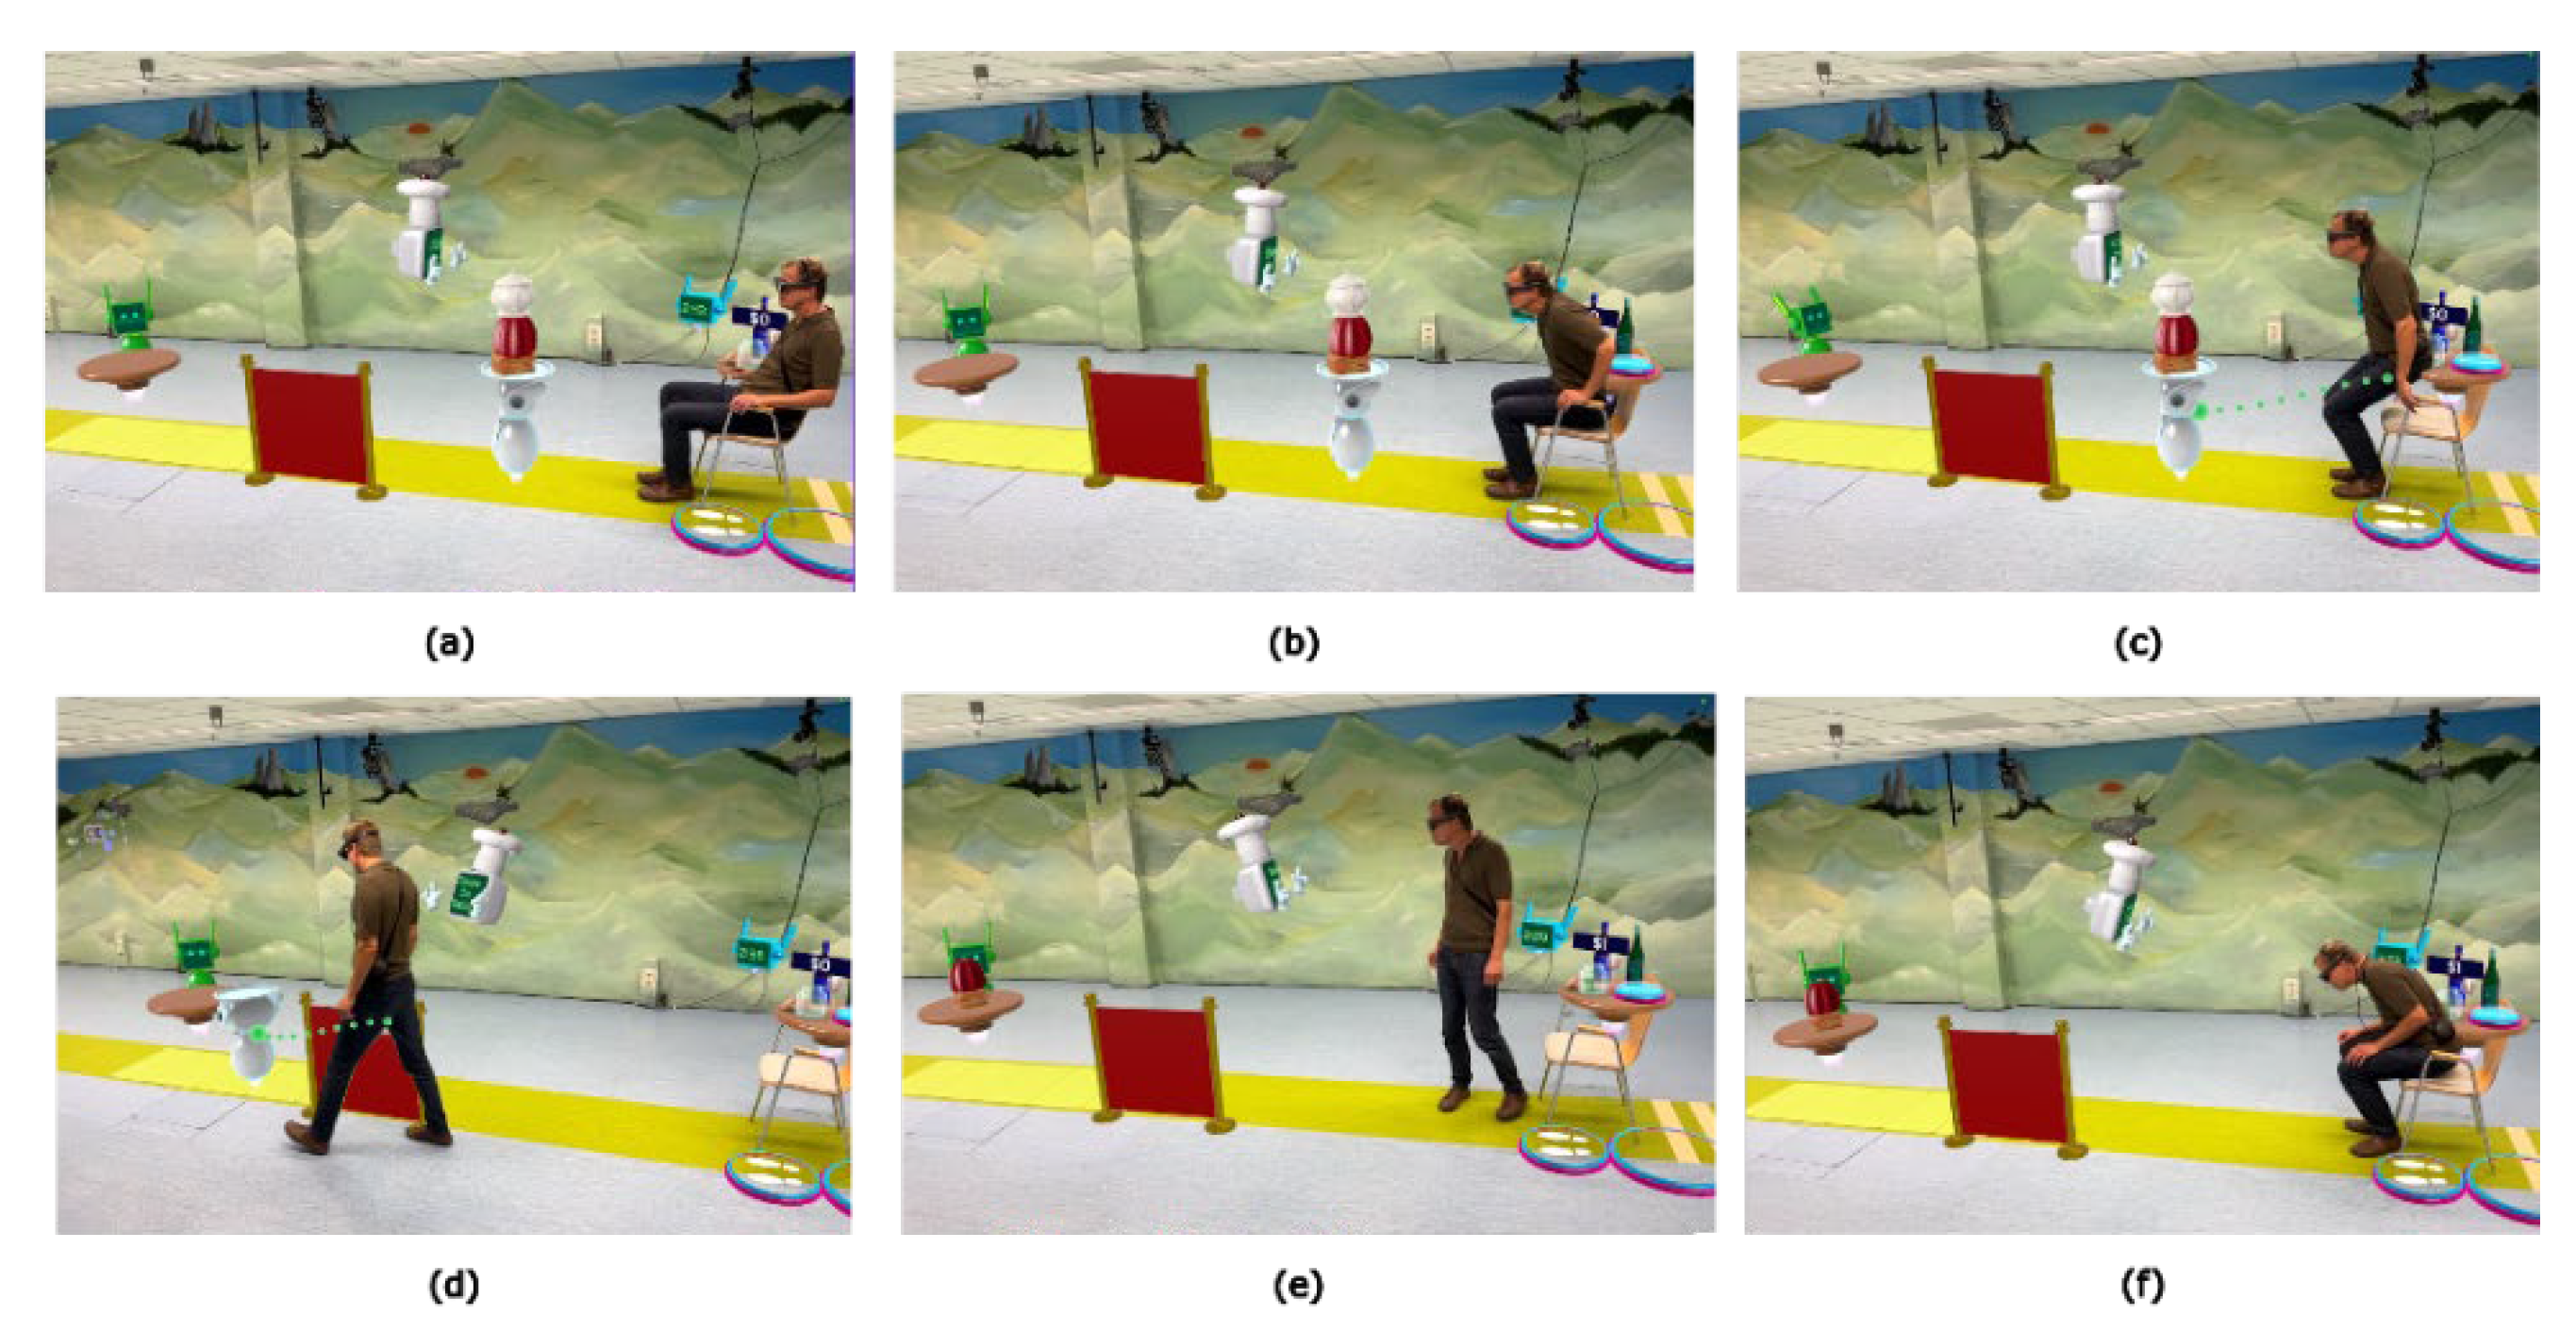
Figure 5.
Wobbly Waiter, a gamified AR exercise involving (a) memorizing an order and (b,c) perform a sit-to-stand transfer to (d) follow the waiter at the prescribed speed back to the chair, and (e,f) perform a stand-to-sit transfer and repeat the sequence.
Figure 5.
Wobbly Waiter, a gamified AR exercise involving (a) memorizing an order and (b,c) perform a sit-to-stand transfer to (d) follow the waiter at the prescribed speed back to the chair, and (e,f) perform a stand-to-sit transfer and repeat the sequence.
Figure 6.
Figure 6. Experimental setup, with the output of the 7 video cameras and the Theia3D overlay.
Figure 6.
Figure 6. Experimental setup, with the output of the 7 video cameras and the Theia3D overlay.
Figure 7.
Straight walking segments and gait metrics. (a): Detection of straight walking segments within the 2D-trajectory using specific criteria. (b): Example of a straight walking segment and the derivation of step length. (c): Heel strike detection using the minimal distance between heel and toe (MDHT) approach, and double support detection using minima in the bandpass filtered AR vertical position.
Figure 8.
Turn segments and turn metrics during Smash. (a) Yaw angle of both systems. (b) Filtering of yaw angular velocity and detection of turns based on a shared turn threshold (Ve). (c) Detection of on- and offset of turns based on edge thresholds for pelvis and head (Vx and Vc) and peak angular velocity as the local maximum.
Figure 9.
Squat segments and squat metrics. (a) Squat detection using k-means clustering of found minima. The cluster of minima with the lowest mean is identified as squats (cluster 2). (b) Squat duration using zero-crossing (V0) of the vertical velocity and squat depth derivation using vertical position.
Figure 10.
Transfer segments and transfer duration in Wobbly Waiter. (a) detection of transfers using k-means clustering to distinguish between standing and sitting motor states in the vertical position. (b) Detection of transfer durations using thresholds in the vertical velocity.
Figure 10.
Transfer segments and transfer duration in Wobbly Waiter. (a) detection of transfers using k-means clustering to distinguish between standing and sitting motor states in the vertical position. (b) Detection of transfer durations using thresholds in the vertical velocity.
Figure 11.
Time series of Theia3D and AR for each game and each used axis, showcasing consistency between systems and the level of variability of each axis per game.
Figure 11.
Time series of Theia3D and AR for each game and each used axis, showcasing consistency between systems and the level of variability of each axis per game.
Table 1.
Participants characteristics.
Table 1.
Participants characteristics.
| Characteristics |
Mean ± SD [Range] or No. |
| Age (years) |
66.8 ± 6.5 [55–78] |
| Weight (kg) |
85.4 ± 7.3 [75–102] |
| Height (cm) |
180.3 ± 10.4 [164–196] |
| Sex, male/female |
11/4 |
| Time since diagnosis (years) |
7.4 ± 5.6 [2–21] |
| Modified Hoehn and Yahr [20] stage, 1/2 |
4/11 |
Table 2.
Thresholds and filter parameters for turn segments and turn metrics.
Table 2.
Thresholds and filter parameters for turn segments and turn metrics.
| Description |
Theia3D pelvis value |
AR head value |
| Detection filter impulse response duration |
1.5 s |
1.5 s |
| Required depth for minima |
20 °/s |
20 °/s |
| Required velocity peak to detect turn (Ve) |
50 °/s |
50 °/s |
| Required velocity peak to detect edge (Vx) |
18 °/s |
26 °/s |
| Required velocity peak to detect edge (Vc) |
39 °/s |
16 °/s |
Table 3.
ICC consistency and RMSE of Theia3D head 3D-position compared to AR 3D-position and Theia3D pelvis yaw angle compared to AR yaw angle per game at group level.
Table 3.
ICC consistency and RMSE of Theia3D head 3D-position compared to AR 3D-position and Theia3D pelvis yaw angle compared to AR yaw angle per game at group level.
| Game |
Value |
X-position
ICC(C,1) (95% CI) |
Y-position
ICC(C,1) (95% CI) |
Z-position
ICC(C,1) (95% CI) |
Yaw angle
ICC(C,1) (95% CI) |
| Basketball |
ICC(C,1) (95% CI) |
0.963 [0.945, 0.981] |
0.999 [0.998, 1.000] |
0.981 [0.972, 0.989] |
0.335 [0.187, 0.483] |
| |
RMSE (95% CI) |
0.007 [0.006, 0.009] |
0.005 [0.004, 0.006] |
0.023 [0.021, 0.025] |
5.444 [3.60, 7.28] |
| Mole Patrolll |
ICC(C,1) (95% CI) |
0.995 [0.994, 0.996] |
0.998 [0.998, 0.999] |
0.780 [0.662, 0.897] |
0.986 [0.979, 0.993] |
| |
RMSE (95% CI) |
0.063 [0.053, 0.072] |
0.069 [0.061, 0.077] |
0.016 [0.012, 0.020] |
20.3 [16.7, 23.9] |
| Puzzle Walk |
ICC(C,1) (95% CI) |
0.993 [0.990, 0.995] |
0.996 [0.995, 0.997] |
0.976 [0.970, 0.983] |
0.957 [0.924, 0.990] |
| |
RMSE (95% CI) |
0.050 [0.042, 0.058] |
0.056 [0.050, 0.061] |
0.027 [0.023, 0.030] |
21.6 [19.1, 24.0] |
| Smash |
ICC(C,1) (95% CI) |
0.932 [0.894, 0.971] |
0.996 [0.995, 0.997] |
0.736 [0.619, 0.853] |
0.997 [0.993, 1.000] |
| |
RMSE (95% CI) |
0.032 [0.026, 0.037] |
0.080 [0.076, 0.085] |
0.011 [0.008, 0.013] |
14.1 [11.7, 16.5] |
| Wobbly Waiter |
ICC(C,1) (95% CI) |
0.984 [0.976, 0.992] |
0.998 [0.998, 0.999] |
0.998 [0.997, 0.998] |
0.996 [0.995, 0.998] |
| |
RMSE (95% CI) |
0.041 [0.033, 0.050] |
0.056 [0.053, 0.060] |
0.013 [0.011, 0.015] |
12.0 [10.3, 13.7] |
Table 4.
Motor-state segment classification statistics.
Table 4.
Motor-state segment classification statistics.
Motor
state |
Theia3D segments |
AR
segments |
True
positives |
False positives |
False
negatives |
Precision |
Recall |
F1-score |
Mean overlap ± SD |
| Straight Walking |
130 |
134 |
125 |
5 |
9 |
0.962 |
0.933 |
0.947 |
97.1% ± 0.3% |
| Turning |
114 |
114 |
113 |
1 |
1 |
0.991 |
0.991 |
0.991 |
78.3% ± 0.9% |
| Squatting |
134 |
134 |
134 |
0 |
0 |
1.000 |
1.000 |
1.000 |
97.2% ± 0.6% |
| Sit-to-stand |
39 |
39 |
39 |
0 |
0 |
1.000 |
1.000 |
1.000 |
90.8% ± 0.4% |
| Stand-to-sit |
40 |
40 |
40 |
0 |
0 |
1.000 |
1.000 |
1.000 |
93.1% ± 0.8% |
Table 5.
Concurrent validity statistics for absolute agreement in mobility metrics between systems.
Table 5.
Concurrent validity statistics for absolute agreement in mobility metrics between systems.
| Motor state and mobility metric |
Mean ± SD |
Mean ± SD |
Bias (95% Limits of Agreement) |
t-Statistics or Wilcoxon signed-rank-statistics1
|
ICC(A,1)
|
| Straight walking |
AR |
Theia3D head |
|
|
|
| Step length (m) |
0.61 ± 0.11 |
0.60 ± 0.11 |
-0.01 (-0.08 0.07) |
t(14) = 0.78, p = 0.448 |
0.936 |
| Max. gait speed (m/s) |
1.66 ± 0.35 |
1.66 ± 0.35 |
0.00 (-0.03 0.03) |
t(14) = -0.62, p = 0.543 |
0.999 |
| Cadence (steps/min) |
119.59 ± 14.63 |
121.24
± 14.69 |
1.65 (-11.86 15.16) |
t(14) = -0.93, p = 0.370 |
0.890 |
| Turning |
AR |
Theia3D pelvis |
|
|
|
| Turn duration (s) |
2.05 ± 0.22 |
2.07 ± 0.20 |
0.02 (-0.17 0.20) |
t(14) = -0.69, p = 0.504 |
0.904 |
Peak angular
velocity (deg/s) |
136.98 ± 16.95 |
116.06
± 18.24 |
-20.92 (-42.34 0.51) |
t(14) = 7.41, p < 0.001
|
0.477 |
| Squatting |
AR |
Theia3D head |
|
|
|
| Squat duration (s) |
2.08 ± 0.57 |
2.07 ± 0.58 |
-0.01 (-0.12 0.10) |
t(14) = 0.82, p = 0.425 |
0.995 |
| Squat depth (m) |
0.49 ± 0.17 |
0.45 ± 0.16 |
-0.04 (-0.08 0.01) |
t(14) = 5.68, p < 0.001
|
0.969 |
| Transfers |
AR |
Theia3D head |
|
|
|
Sit-to-stand
duration (s) |
1.20 ± 0.20 |
1.21 ± 0.17 |
0.00 (-0.07 0.08) |
W = 20, p = 0.146 |
0.979 |
Stand-to-sit
duration (s) |
1.57 ± 0.38 |
1.59 ± 0.41 |
0.01 (-0.15 0.18) |
W = 43, p = 0.352 |
0.978 |
|
Disclaimer/Publisher’s Note: The statements, opinions and data contained in all publications are solely those of the individual author(s) and contributor(s) and not of MDPI and/or the editor(s). MDPI and/or the editor(s) disclaim responsibility for any injury to people or property resulting from any ideas, methods, instructions or products referred to in the content. |
© 2025 by the authors. Licensee MDPI, Basel, Switzerland. This article is an open access article distributed under the terms and conditions of the Creative Commons Attribution (CC BY) license (http://creativecommons.org/licenses/by/4.0/).