1. Introduction
The small intestine plays a crucial role in the digestion and absorption of nutrients from food, while simultaneously acting as a barrier against the uptake of toxins, bacterial metabolites, and orally administered xenobiotics. This protective function is largely attributed to the 'intestinal biochemical barrier', in which multidrug resistance-associated protein 2 (MRP2/ABCC2) plays a pivotal role. MRP2 is a drug efflux pump belonging to the ATP-Binding Cassette (ABC) transporter superfamily, constitutively expressed on the apical membrane of enterocytes, primarily at the villus tips of the proximal jejunum [
1]. Its strategic location on the apical membrane of intestinal epithelial cells enables it to serve as a first line of defense by actively facilitating the excretion of potentially toxic compounds, such as environmental pollutants, as well as by limiting the oral bioavailability of many drugs. Thus, modulation of MRP2 expression can significantly impact the local and systemic concentrations of these compounds, thereby affecting their toxicity or efficacy and safety [
2,
3]. MRP2 can undergo modulation at the transcriptional and post-transcriptional levels in response to various internal and external signals, including changes associated with particular physiological or pathological states [
4].
Concomitantly, the intestine houses the IM, primarily composed of the phyla Firmicutes, Bacteroidetes, Actinobacteria, and Proteobacteria with a density gradient that grows from the stomach (around 10
3-10
4 bacteria per gram) to the colon (about 10
12-10
14 bacteria per gram). The relationship between intestinal microbiome and human health became one of the most important scientific discoveries of the past decade [
5,
6]. Increasing pieces of evidence have demonstrated that the composition and functionality of the intestinal microbial community influence the host's health [
7]. Therefore, the imbalance in the composition or function of the IM (dysbiosis) has been associated with the development of several human diseases, including its role in the pathogenesis of obesity [
8,
9,
10,
11].
Obesity, a chronic metabolic disorder, represents a major public health issue worldwide, having reached epidemic proportions. Significantly, it is a risk factor for the development of metabolic syndrome (MS), diabetes, cancer, and other conditions [
12,
13]. Research indicates a strong connection between HFD, reflecting dietary patterns prevalent in the Western world, IM dysbiosis, and the onset and subsequent development of obesity, referred to as "obese microbiota"[
5,
6]. In this regard, HFD is prone to be one of the most potent drivers of IM dysbiosis, altering rapid (within 24 to 48 hours) and profoundly the structure and function of microbial communities throughout the intestine. From a pathophysiological perspective, HFD-induced intestinal dysbiosis is characterized by an increased abundance of Lipopolysaccharide (LPS)-producing bacteria and a concurrent reduction in protective genera that maintain intestinal barrier integrity. These microbial shifts are accompanied by altered levels of key short-chain fatty acids (SCFAs), which are essential for intestinal homeostasis. Collectively, these alterations trigger early intestinal events, including increased pro-inflammatory cytokine secretion, inflammation-linked oxidative stress (OS), tight junction disruption, and enhanced intestinal permeability. These disturbances facilitate the translocation of LPS into the bloodstream, promoting metabolic endotoxemia, systemic inflammation, and OS, ultimately contributing to the metabolic dysfunctions characteristic of diet-induced obesity [
14,
15,
16]. In line with these observations, the interplay among HFD-induced inflammation, oxidative stress, metabolic disorders, and the IM has been suggested to be mechanistically dependent on LPS [
17,
18].
Interestingly, we have previously observed that regulating intestinal Mrp2 under endotoxemic conditions by administration of LPS, involves a combination of transcriptional and post-transcriptional mechanisms, with IL-1β mediating the endocytic internalization of Mrp2 in this context [
19]. Similarly, we demonstrated a significant reduction of Mrp2 in MS conditions induced in rats fed a fructose-rich diet (FRD), with inflammation and OS acting as key mediators [
20,
21]. In both models, although the contribution of dysbiosis was not specifically addressed, the reduction in Mrp2 activity was consistently associated with enhanced absorption of its substrates, suggesting a functional impairment of this transporter under such conditions, which could ultimately impact the systemic bioavailability, efficacy, and toxicity of these compounds.
Human and animal studies have shown that obesity and HFD are associated with significant alterations the pharmacokinetic and pharmacodynamic profiles of drugs commonly prescribed for obesity-related comorbidities [
22]. Likewise, variability in drug responses has been associated with differences in IM composition [
23]. Although the underlying mechanisms remain incompletely understood in both cases, the IM consistently emerges as an important modulator of drug-metabolizing enzymes and transporters [
24,
25,
26]. Notably, while much of the research in this field has focused on the liver, the contribution of the intestine has been comparatively less explored. This knowledge gap is particularly critical given the essential role of intestinal efflux ABC transporters, such as Mrp2, which are responsible for the first-pass clearance of many clinically significant drugs and whose regulatory mechanisms under diet-induced obesity remain poorly characterized. Moreover, while certain studies suggest that alterations in IM composition can influence Mrp2 expression [
27], it remains largely unknown whether IM dysbiosis associated with HFD-induced obesity represents a key factor in the regulation of Mrp2 under this condition, as well as the mediating mechanisms involved, thereby underscoring the need for further investigation.
In this dysbiotic environment, prebiotics, such as inulin, represent a promising therapeutic approach, as they can beneficially modulate the IM and its metabolites, specifically SCFAs, improving intestinal barrier function and reducing local and systemic inflammation and metabolic dysfunctions associated with obesity [
28,
29].
Based on current knowledge, we hypothesize that IM dysbiosis is a key driver of intestinal Mrp2 downregulation in diet-induced obesity, impairing its barrier function via downstream factors, with inflammation and OS as the main candidates. Inulin administration, by reversing dysbiosis and restoring parameters associated with intestinal homeostasis, consequently restores Mrp2-dependent barrier function, supporting the central role of the IM in its regulation. To investigate this, we initially conducted a comprehensive analysis of the Mrp2 regulation in our experimental obesity model, including mRNA and protein expression as well as functional activity, an approach not previously reported.
Collectively, the findings of the present study reveal a mechanistic link between the IM and Mrp2 function, connecting xenobiotic clearance with the regulation of intestinal immune and redox systems, and emphasizing the role of MRP2 in contributing to the maintenance of intestinal functional integrity.
2. Materials and Methods
2.1. Chemicals
1-chloro-2,4-dinitrobenzene (CDNB), glutathione, fluorescein isothiocyanate-dextran (FD-4), 2-vinylpyridine, thiobarbituric acid, nitroblue tetrazolium (NTB), pepstatin A, phenylmethylsulfonyl fluoride (PMSF) and hydrogen peroxide were purchased from Sigma-Aldrich (St. Louis, MO, USA). Inulin (dahlia tubers-derived, ≥90% purity) was obtained from Santa Cruz Biotechnology, Inc. (Dallas, TX USA). 2-Vinylpyridine was obtained from Fluka Chemical Corp (Milwaukee, WI, USA). All other chemicals and reagents used were commercial products of analytical-grade purity.
2.2. Animals and Treatments
Male C57BL/6 mice (5 weeks old, 20–25 g) were obtained from the Centro de Investigación y Producción de Reactivos Biológicos (CIPReB), School of Medicine, National University of Rosario, Santa Fe, Argentina.
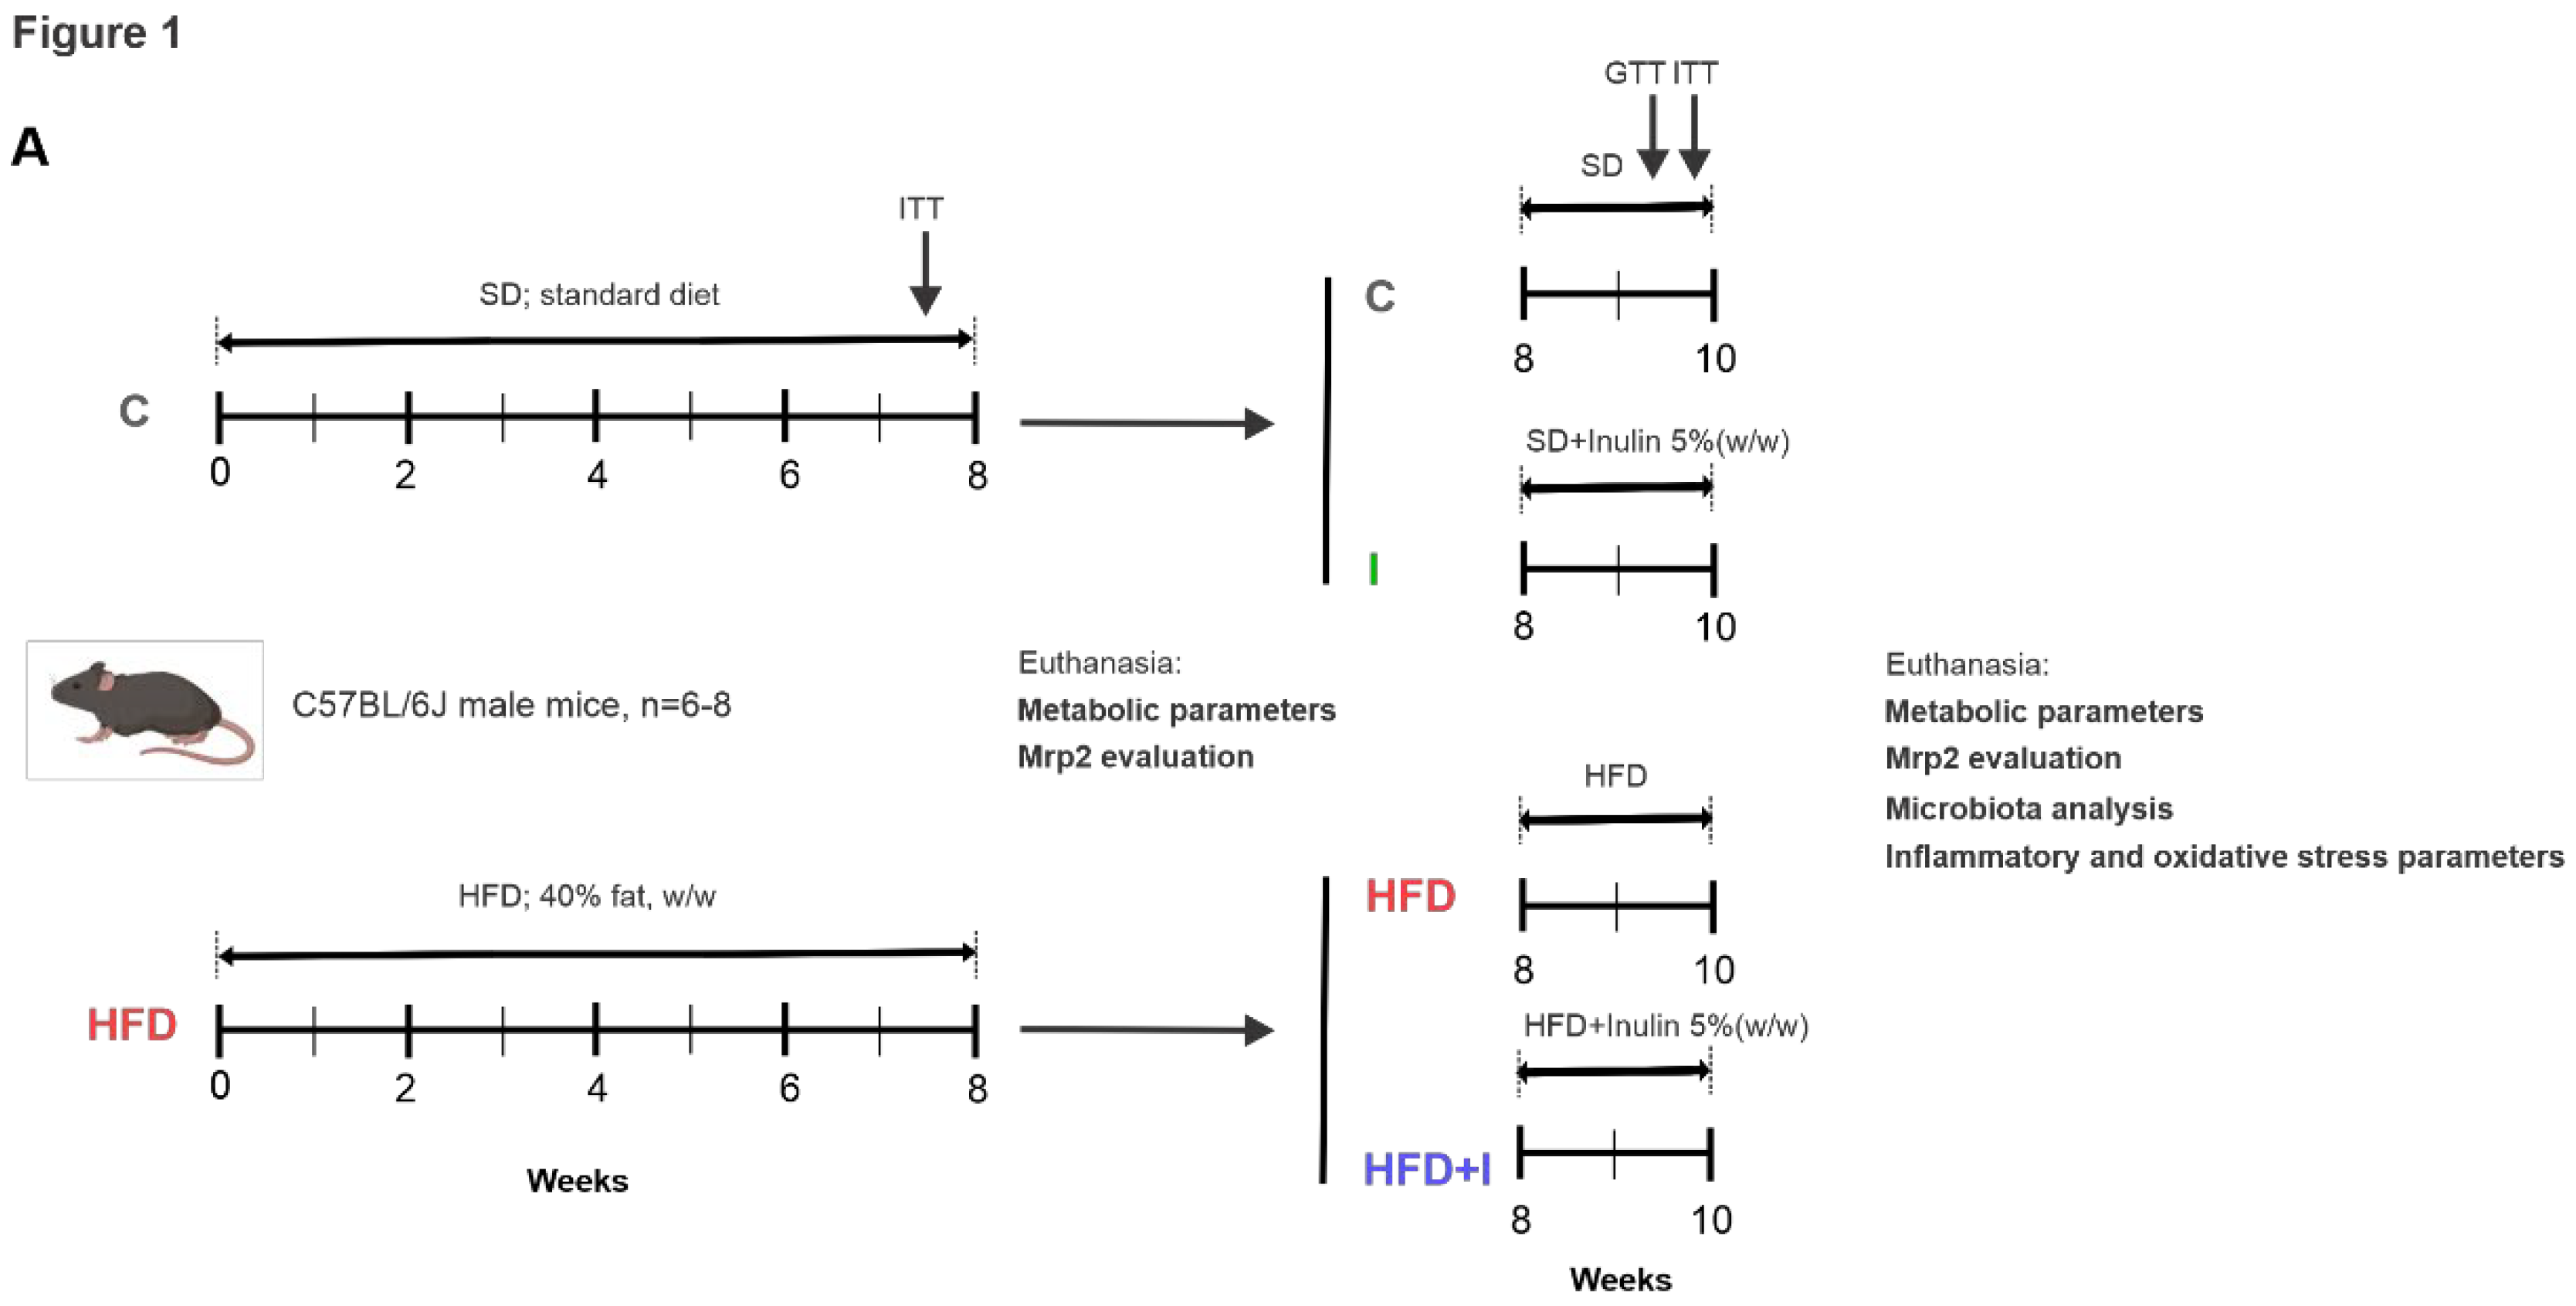
To induce obesity, animals were initially fed an HFD (40% fat, w/w) for 8 weeks, prepared according to the previously described composition [ 30, 43]. After confirmation of the obese phenotype based on weight gain and metabolic parameters, animals were randomly assigned to four groups (n = 6–8/group): control (C), HFD, HFD plus inulin (HFD+I), and inulin alone (I). The C group received a standard commercial diet throughout the experimental period. The HFD group was maintained on the HFD for a total of 10 weeks. The HFD+I group received the HFD for 8 weeks, followed by 2 additional weeks on the same diet supplemented with 5% (w/w) inulin. The I group received a standard diet for 8 weeks, followed by 2 weeks on the same diet supplemented with 5% (w/w) inulin. This treatment protocol is schematically illustrated in
Figure 1.
Mice were housed six per cage under controlled conditions (23 ± 2 °C; 12-h light/dark cycle) with free access to tap water and food. Body weight (grams) and calorie intake (kilocalories per animal) were measured.
Five and three days before the end of the treatments, glucose tolerance (GTT) and/or insulin tolerance (ITT) tests were performed, respectively, to evaluate glucose metabolism and confirm the development of insulin resistance [21, 43].
All the experimental protocols were performed according to the Regulation for the Care and Use of Laboratory Animals and were approved by the Institutional Animal Use Committee of the National University of Rosario, Argentina (CUDI Nº 26233/2023, Resolution 651/2023).
2.3. Specimen Collection
At the end of the treatments, animals were fasted for 12 h before euthanasia, which was performed under intraperitoneal anesthesia (ketamine, 200 mg/kg body weight; midazolam, 5 mg/kg body weight) between 08:00 and 09:00 h. After laparotomy, blood samples were collected by cardiac puncture into heparinized tubes for measurement of plasma glucose, triacylglycerol, total cholesterol, and endotoxin levels. Epididymal, abdominal, and retroperitoneal fats were excised and weighed; values were expressed as a percentage of final body weight. The entire small intestine was removed from the pyloric sphincter to the ileocecal valve. The first 4 cm starting from the pyloric valve, corresponding to the duodenum, were excluded, and the next part was considered as proximal jejunum [
30]. This segment was gently flushed with ice-cold saline and dried with filter paper. For western blot studies, the jejunum was immediately opened lengthwise, the mucus layer was carefully removed, and the mucosa was scraped, weighed, and used for brush border membrane (BBM) preparation. For total RNA isolation, small rings from the jejunum were cut, snap-frozen in liquid nitrogen, and kept at −70 °C until further processing. For Mrp2 transport studies in vitro, segments of the jejunum were used fresh to prepare everted intestinal sacs. In addition, non-everted segments were used for ROS detection and permeability assays. For immunohistochemical analysis, similar jejunum rings were fixed in buffered formalin. Aliquots of proximal jejunum were homogenized in saline (1:2) for assessment of lipid peroxidation and antioxidant enzyme activities.
2.4. Biochemical Assays
Plasma glucose, triglyceride, and cholesterol levels were determined using enzymatic kits (Wiener Lab, Rosario, Argentina). Glucose and insulin tolerance tests (GTT and ITT) were performed as previously described [
21]. The area under the curve (AUC) was calculated, and the results were expressed in mM/min.
2.5. Western Blot Studies
BBMs were prepared from mucosal scrapings. Protein concentration was measured using bovine serum albumin as a standard [
31]. Aliquots of the BBM preparations were kept on ice and used the same day for Western blot studies. Mrp2 was detected in BBMs as described previously [
1]. Equal amounts of protein (20 µg) were separated by SDS–PAGE and transferred to PVDF membranes. Uniformity of loading was verified by Ponceau S staining and β-actin detection. Blots were probed with anti-MRP2 (M2 III-6, Alexis Laboratories, San Diego, CA, USA), anti-occludin (71–1500, ZYMED), and anti-β-actin (A-2228, Sigma-Aldrich), followed by appropriate HRP-conjugated secondary antibodies. Immunoreactive bands were detected using a chemiluminescence kit (Pierce™ ECL Western Blotting Substrate, Thermo Scientific), and quantification was performed using ImageJ software.
2.6. Microscopy Studies
For
in situ immunodetection of Mrp2, intestinal rings from jejunum were sectioned (thickness, 5 μm) and fixed as described previously [
21,
36]. Mrp2 was detected with the respective antibody, and the cell nuclei were detected with 4,6-diamino-2-phenylindole Mblue fluorescence as described previously [
21,
36]. All confocal studies were performed with a Nikon (Tokyo, Japan) C1 Plus microscope. To ensure comparable staining and image capture performance for the different groups belonging to the same experimental protocol, intestinal slices were prepared on the same day, and mounted on the same glass slide.
2.7. Real-Time Polymerase Chain Reaction (PCR) Studies
Mrp2, IL-1β, and IL-6 gene expression was measured in the jejunum by real-time PCR, and results were normalized to the 36B4 gene. Total RNA was extracted from the jejunum using TRIzol reagent (Invitrogen, Carlsbad, CA, USA). Reverse transcription was performed with 5 µg of RNA using the Omniscript RT kit (Qi-agen, Venlo, The Netherlands). Real-time PCR was carried out using Power SYBR Green Master Mix (Solis BioDyne, Tartu, Estonia) on a StepOnePlus system (Applied Biosystems, Thermo Fisher Scientific Inc., CA, USA). The primer sequences were as follows: Abcc2 forward 5′-accttccacgtagtgatcct-3′, reverse 5′-acctgctaagatggacggtc-3′; IL-1β forward 5′-ttgacggaccccaaaagatg-3′, reverse 5′-agaaggtgctcatgtcctca-3′; IL-6 forward 5′-cttccatccagttgccttcttg-3′, reverse 5′-tgggagtggaatcctctgtgaagt-3′; and 36B4 (RPLP0, ribosomal protein lateral stalk subunit P0) forward 5′-gtaacccgttgaaccccatt-3′, reverse 5′-ccatccaatcggtagtagcg-3′. Relative mRNA expression was determined using the 2^−ΔΔCT method [
21].
2.8. Assessment of Mrp2 Activity In Vitro
Mrp2 transport activity was assessed using the everted intestinal sac model. The jejunal segments (3 cm) were everted and incubated for 30 min in the presence of 200 μM CDNB in the mucosal compartment as described previously [
32]. After diffusion of CDNB into the enterocyte, and further endogenous conjugation with glutathione, the accumulation of the product dinitrophenyl-S-glutathione (DNP-SG) in the mucosal compartment was quantified by high-performance liquid chromatography.
2.9. Intestinal Microbiome Analysis
Fecal samples were collected before euthanasia and stored at −80 °C. DNA extraction was performed using the QIAamp DNA Stool Mini Kit (Qiagen), followed by 16S rRNA gene sequencing (V3–V4) using the Illumina MiSeq platform. Microbial composition was analyzed using QIIME2 [
33,
34].
2.10. Assessment of Intestinal Paracellular Permeability
Paracellular permeability was studied using the FD-4 probe (4 kDa) permeation rate through the small intestine as described [
35]. Non-everted intestinal sacs (3 cm) were filled with 1 mg/mL FD-4 and incubated for 30 min at 37 °C. The fluorescence intensity of FD-4 samples in the same mucosal compartment was determined by excitation at 485 nm and emission at 535 nm using a DTX 880 multimode detector plate reader (Beckman Coulter, Brea, Calif.) [
36].
2.11. Assessment of Plasma Endotoxin Levels
Plasma endotoxin was determined using a limulus amebocyte lysate (LAL) kit according to the manufacturer’s instructions (Lonza, Walkersville, MD, USA). Absorbance was measured at 405 nm using a microplate reader (Beckman Coulter DTX 880 Multimode Detector), and endotoxin concentrations were calculated from a standard curve generated with known concentrations of Escherichia coli O111:B4 endotoxin.
2.12. Assessment of Lipid Peroxidation and ROS Production
Lipid peroxidation was assessed by measuring TBARS in intestinal homogenates as described previously [
21,
36,
37]. ROS production was quantified using the fluorescent probe 2’,7’-dichlorodihydrofluorescein diacetate (DCFH-DA). Briefly, intestinal segments (3 cm) were filled with 5 µM DCFH-DA and incubated for 30 min at 37°C with 5 % CO2. Subsequently, the sacs were washed and the mucosa layer was scraped. The 2’,7’-dichlorofluorescein (DCF) formation in supernatant was monitored at an excitation wavelength of 488 nm and an emission wavelength of 525 nm using a DTX 880 multimode detector plate reader (Beckman Coulter, Brea, Calif.) [
38].
2.13. Assessment of Antioxidant Enzyme Activities
Superoxide dismutase (SOD) activity was determined spectrophotometrically from the inhibition of nitroblue tetrazolium reduction, while catalase (CAT) activity was measured by monitoring the decomposition rate of H₂O₂ at 240 nm, as previously described [
36].
2.14. Statistical Analysis
Data are expressed as mean ± standard deviation, and as % of control group. Statistical comparisons were made by one-way ANOVA followed by the Tukey post hoc test. P < 0.05 was considered statistically significant. All analyses were conducted using GraphPad Prism 3.1 (GraphPad Software, San Diego, CA, USA).
4. Discussion
In the present study, we addressed the interrelationship between HFD-induced obesity, intestinal dysbiosis, and the regulation of intestinal Mrp2, using inulin, a well-established beneficial modulator of the IM, as an experimental intervention. To this end, we employed a murine model, as human and rodent IM are comparable at the phylum level, and HFD feeding reproduces key features of obesity, allowing the assessment of its consequences [
39,
40]. Given that long-term oral therapies are often required to manage obesity-associated comorbidities [
22,
41], understanding how obesity-induced intestinal alterations impact drug absorption is crucial. In this context, the efflux transporter Mrp2 is particularly relevant due to its apical localization in enterocytes and broad substrate specificity, which both influence drug bioavailability and protect the host from xenobiotics and microbial metabolites.
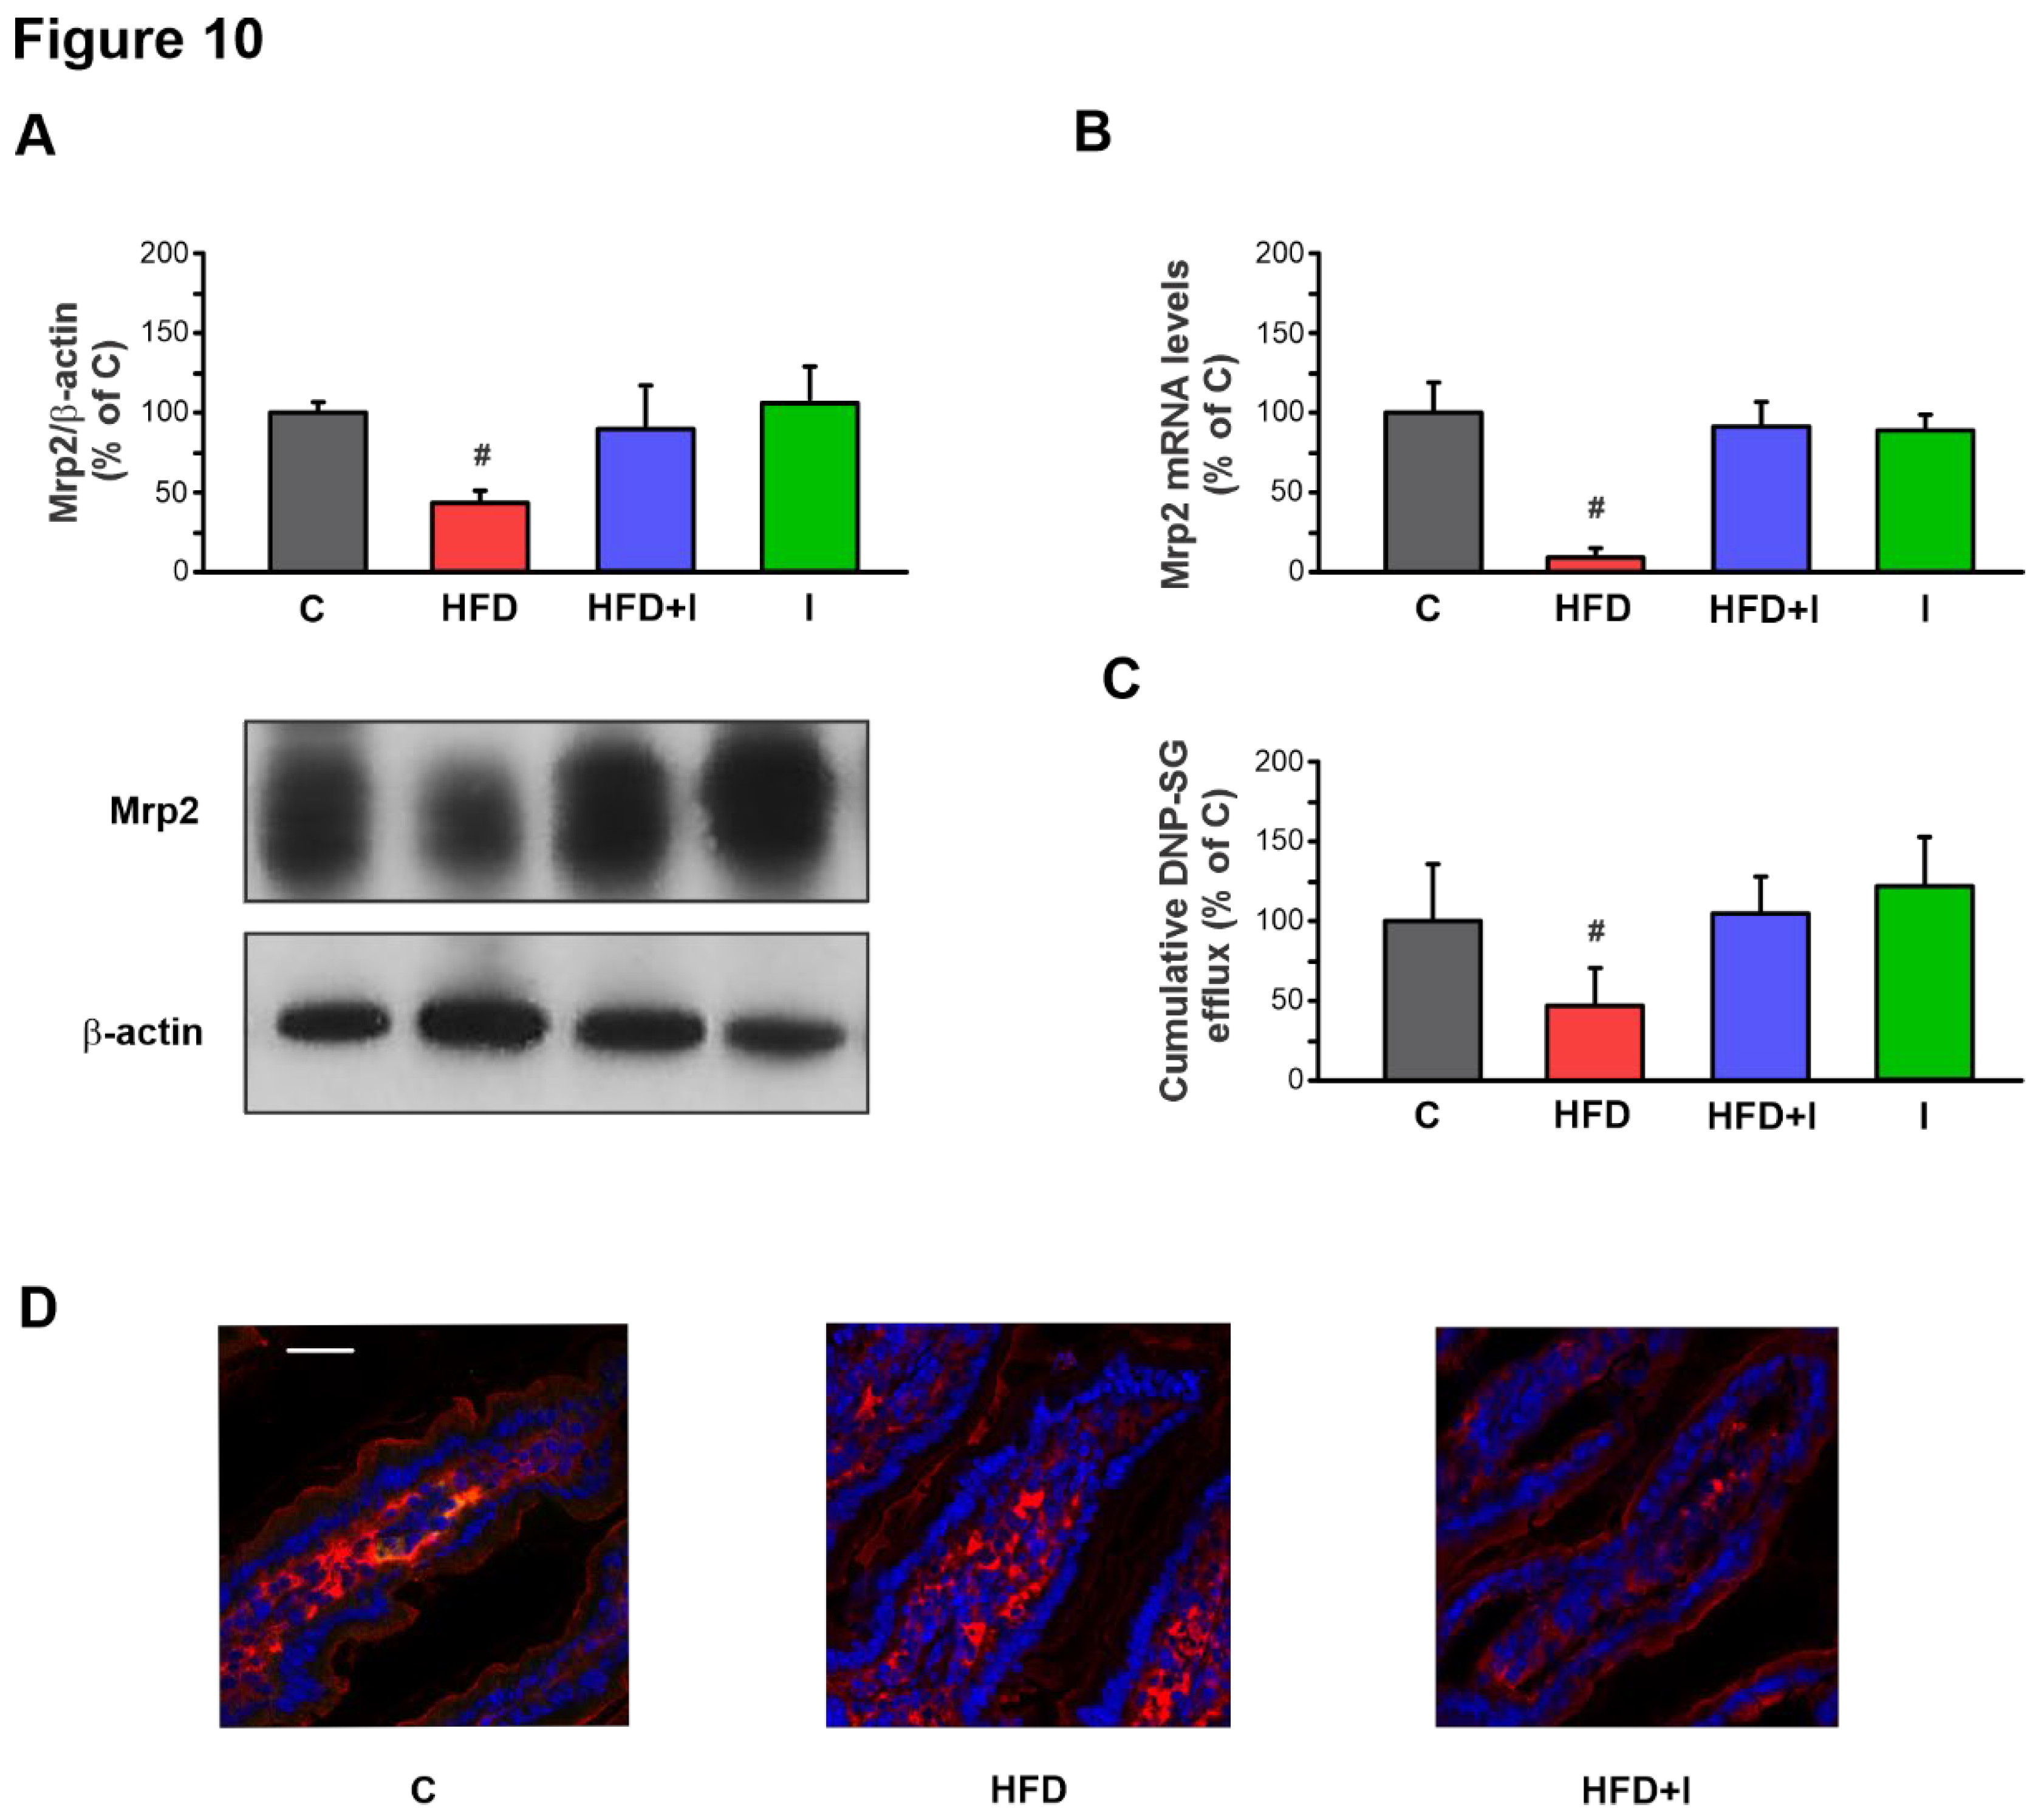
Initial experiments conducted to validate the obesity model revealed that mice subjected to a HFD for 8 weeks developed marked hyperglycemia, hypertriglyceridemia, hypercholesterolemia, increased adiposity, excessive body weight gain, and insulin resistance. These alterations confirm the effective establishment of a diet-induced obesity phenotype under the present experimental protocol. Significantly, under these conditions, Mrp2 expression in the jejunum, its main site of expression and the primary site of nutrient and drug absorption, was markedly reduced at both protein and mRNA levels, suggesting that its regulation may occur, at least in part, at the transcriptional level. More critically, this downregulation resulted in a substantial loss of transport activity, as demonstrated by the decreased apical excretion of its prototypical substrate, DNP-SG. This impairment of the Mrp2-dependent biochemical barrier could have profound implications, not only by altering the bioavailability and safety of clinically important substrate drugs, but also by leading to the tissue accumulation of potentially toxic endogenous metabolites and xenobiotics under obesity-related pathological conditions.
These findings are particularly relevant because, to our knowledge, this represents the first comprehensive study characterizing the alteration of intestinal Mrp2 in the context of diet-induced obesity. To date, only the studies by Lu et al. (2019) [
42] and our previous work [
43], which employed different HFD-induced obesity models (24 and 16 weeks of HFD feeding, respectively), have investigated this topic. Both studies reported a downregulation of intestinal Mrp2 mRNA expression; however, they remain limited in scope. Moreover, importantly, no study has specifically examined the potential key regulatory mechanisms responsible for intestinal Mrp2 modulation in obesity.
As described above, HFD-induced intestinal dysbiosis involves an increase of LPS-producing bacteria accompanied by a reduction in beneficial genera that preserve barrier function [
44]. This imbalance is associated with alterations in the SCFA profile, metabolites essential for maintaining intestinal homeostasis. Together, these changes initiate early intestinal disturbances, including increased secretion of pro-inflammatory cytokines, associated OS, disruption of epithelial integrity, and enhanced permeability. These events facilitate the translocation of LPS into the systemic circulation, leading to metabolic endotoxemia and, consequently, systemic inflammation and further OS, which ultimately contribute to the metabolic dysfunctions characteristic of diet-induced obesity, as demonstrated in our model. Importantly, endotoxemia, OS, and pro-inflammatory cytokines are recognized regulators of intestinal drug transporter expression and activity [
36,
38,
45,
46]. Nevertheless, whether these factors contribute to Mrp2 downregulation in the context of obesity-associated dysbiosis remains to be elucidated.
Interestingly, as previously reported [
47], supplementation with the prebiotic inulin can alleviate HFD-induced intestinal dysbiosis, improving intestinal barrier function and reducing inflammation, at least in part, through SCFA modulation, which together enhance barrier integrity. These intestinal improvements are associated with the attenuation of systemic metabolic dysfunctions characteristic of obesity. In this context, we propose that this dietary intervention, by initially correcting intestinal dysbiosis and thus interrupting the subsequent cascade of pathological events, could not only mitigate alterations in Mrp2, but also implicate the IM as a key factor, along with downstream candidate mediators (e.g. inflammation and OS), in the mechanisms underlying its regulation. Accordingly, we conducted a sequential evaluation of the metabolic and intestinal alterations in HFD-fed mice compared to those receiving inulin supplementation.
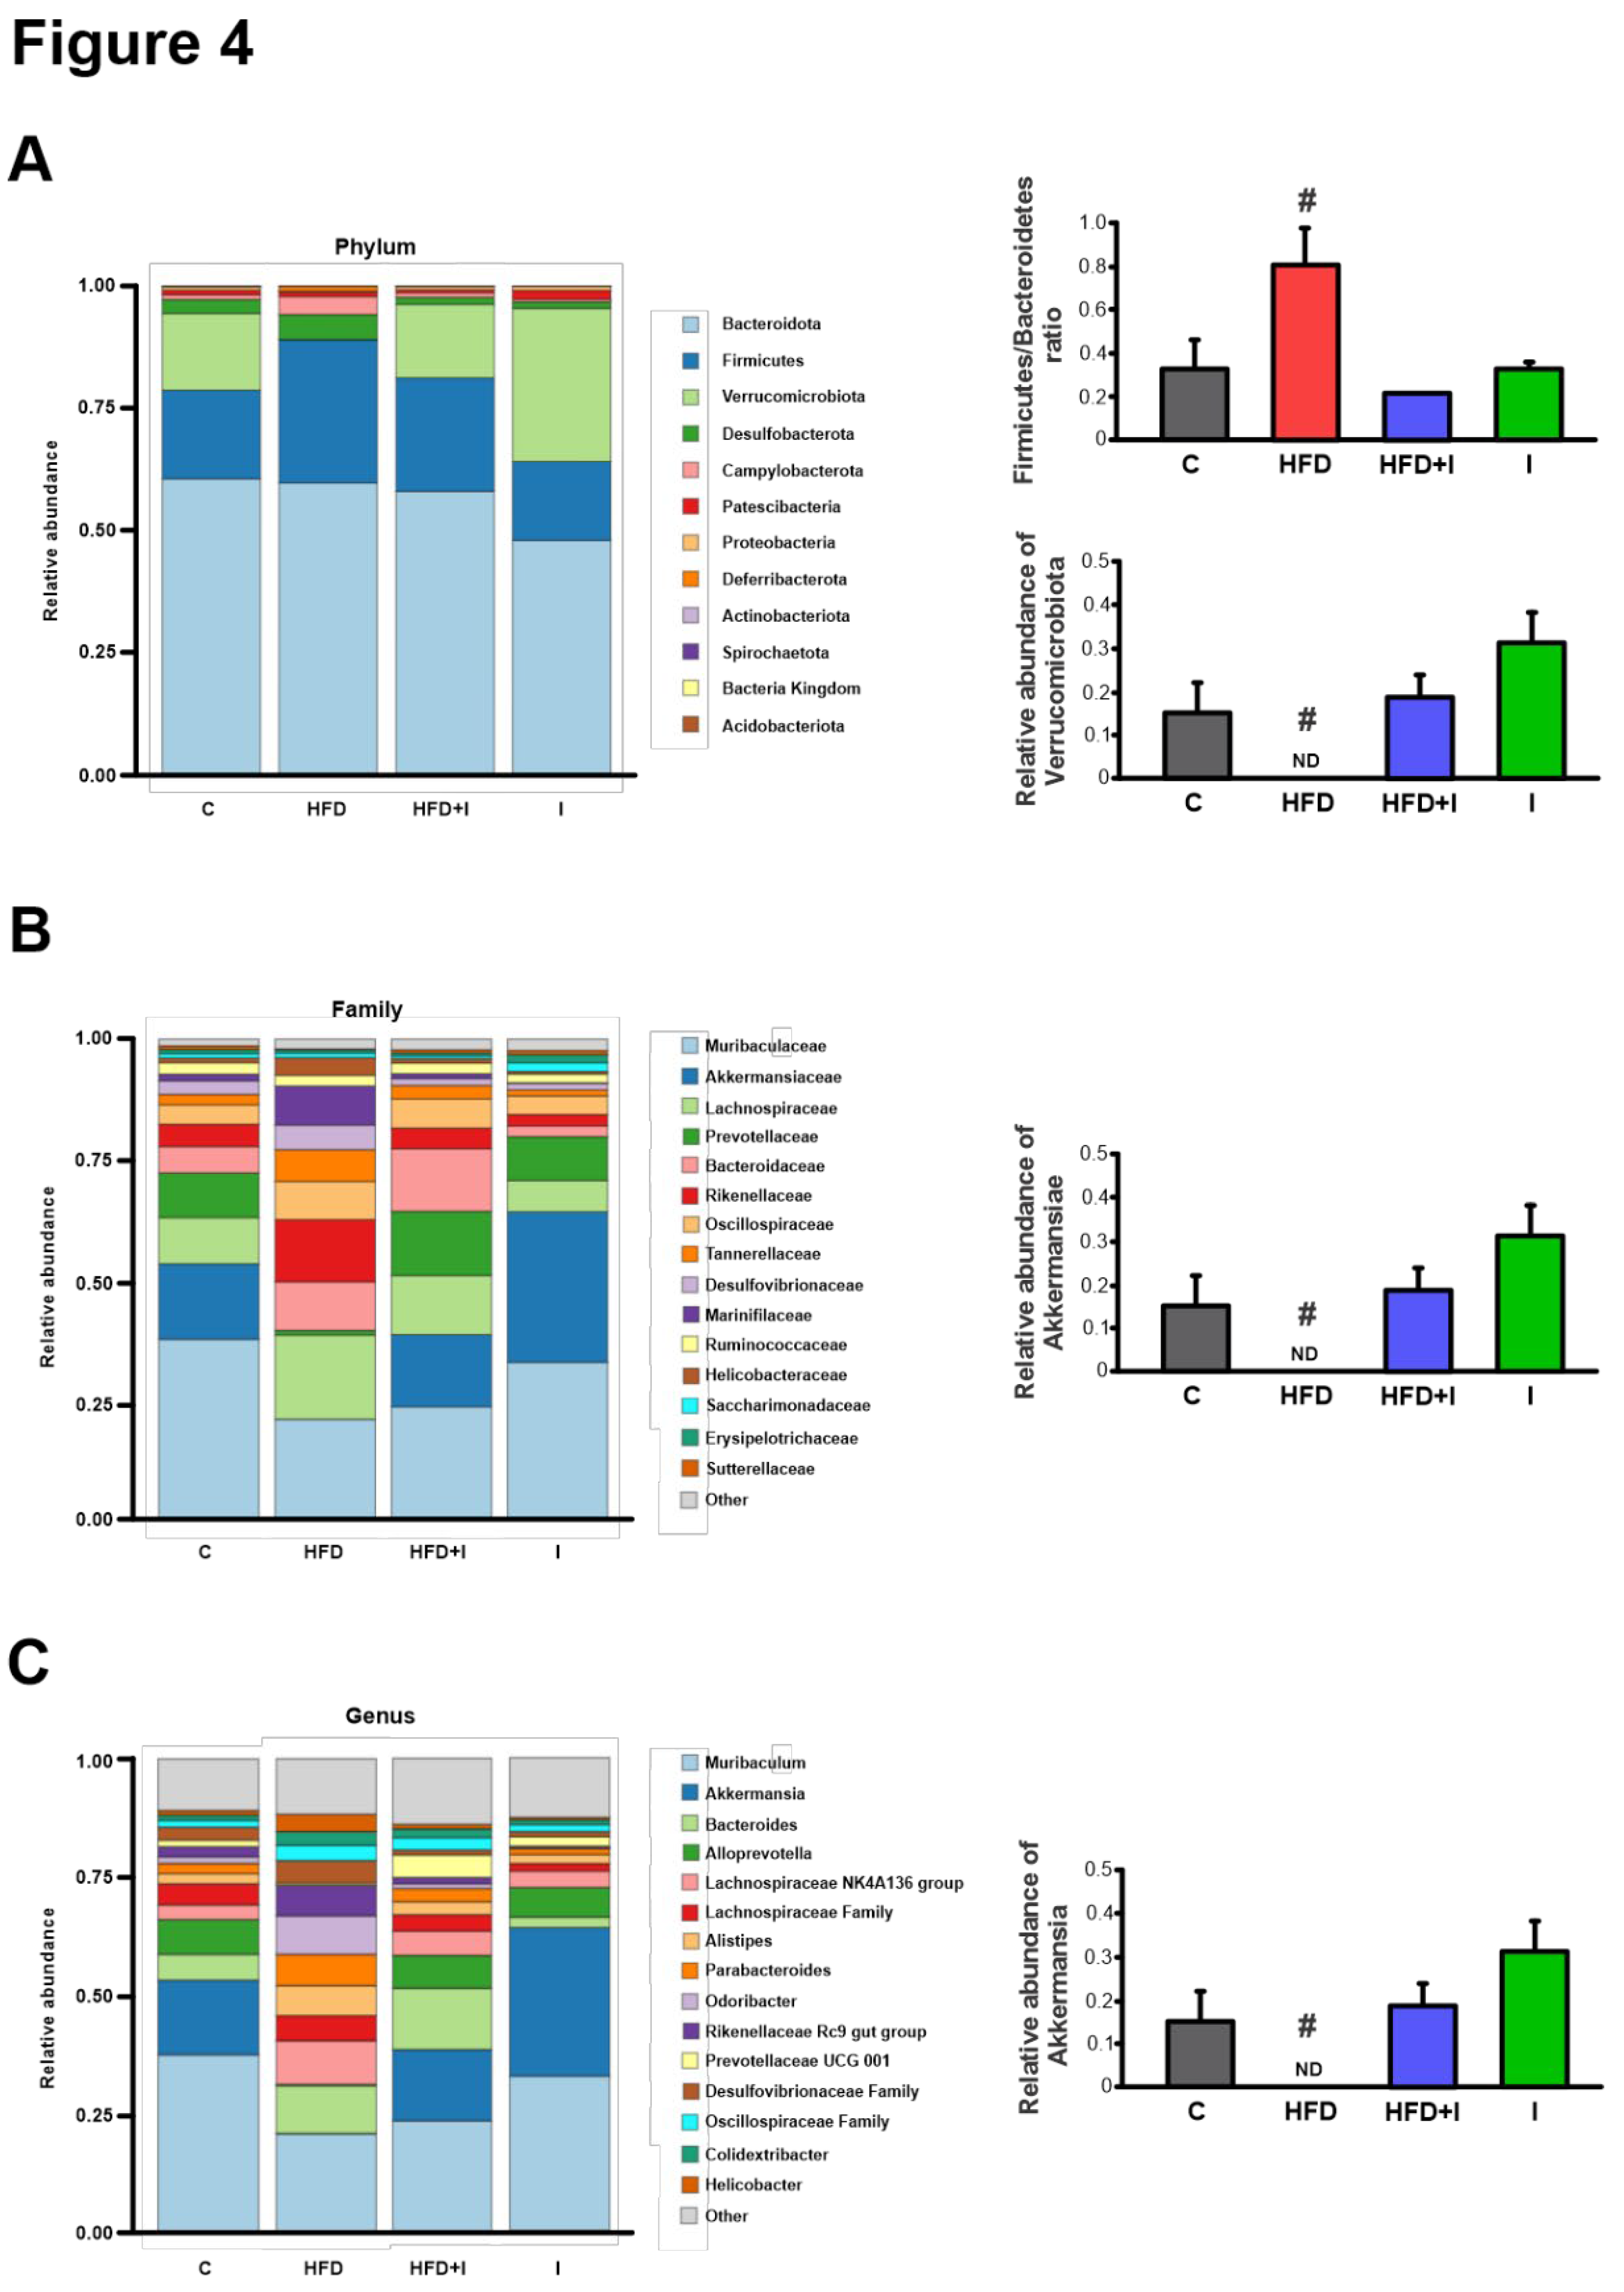
Based on the 16S rRNA sequencing results and consistent with the well-documented microbial signature of obesity, characterized by an increased Firmicutes-to-Bacteroidetes ratio, the HFD group displayed a significant rise in Firmicutes and a concomitant decrease in Bacteroidetes, along with a marked reduction in Verrucomicrobiota, including the complete depletion of the genus Akkermansia. Inulin supplementation effectively counteracted these alterations, normalizing the Firmicutes/Bacteroidetes ratio and restoring Akkermansia abundance, as previously reported [
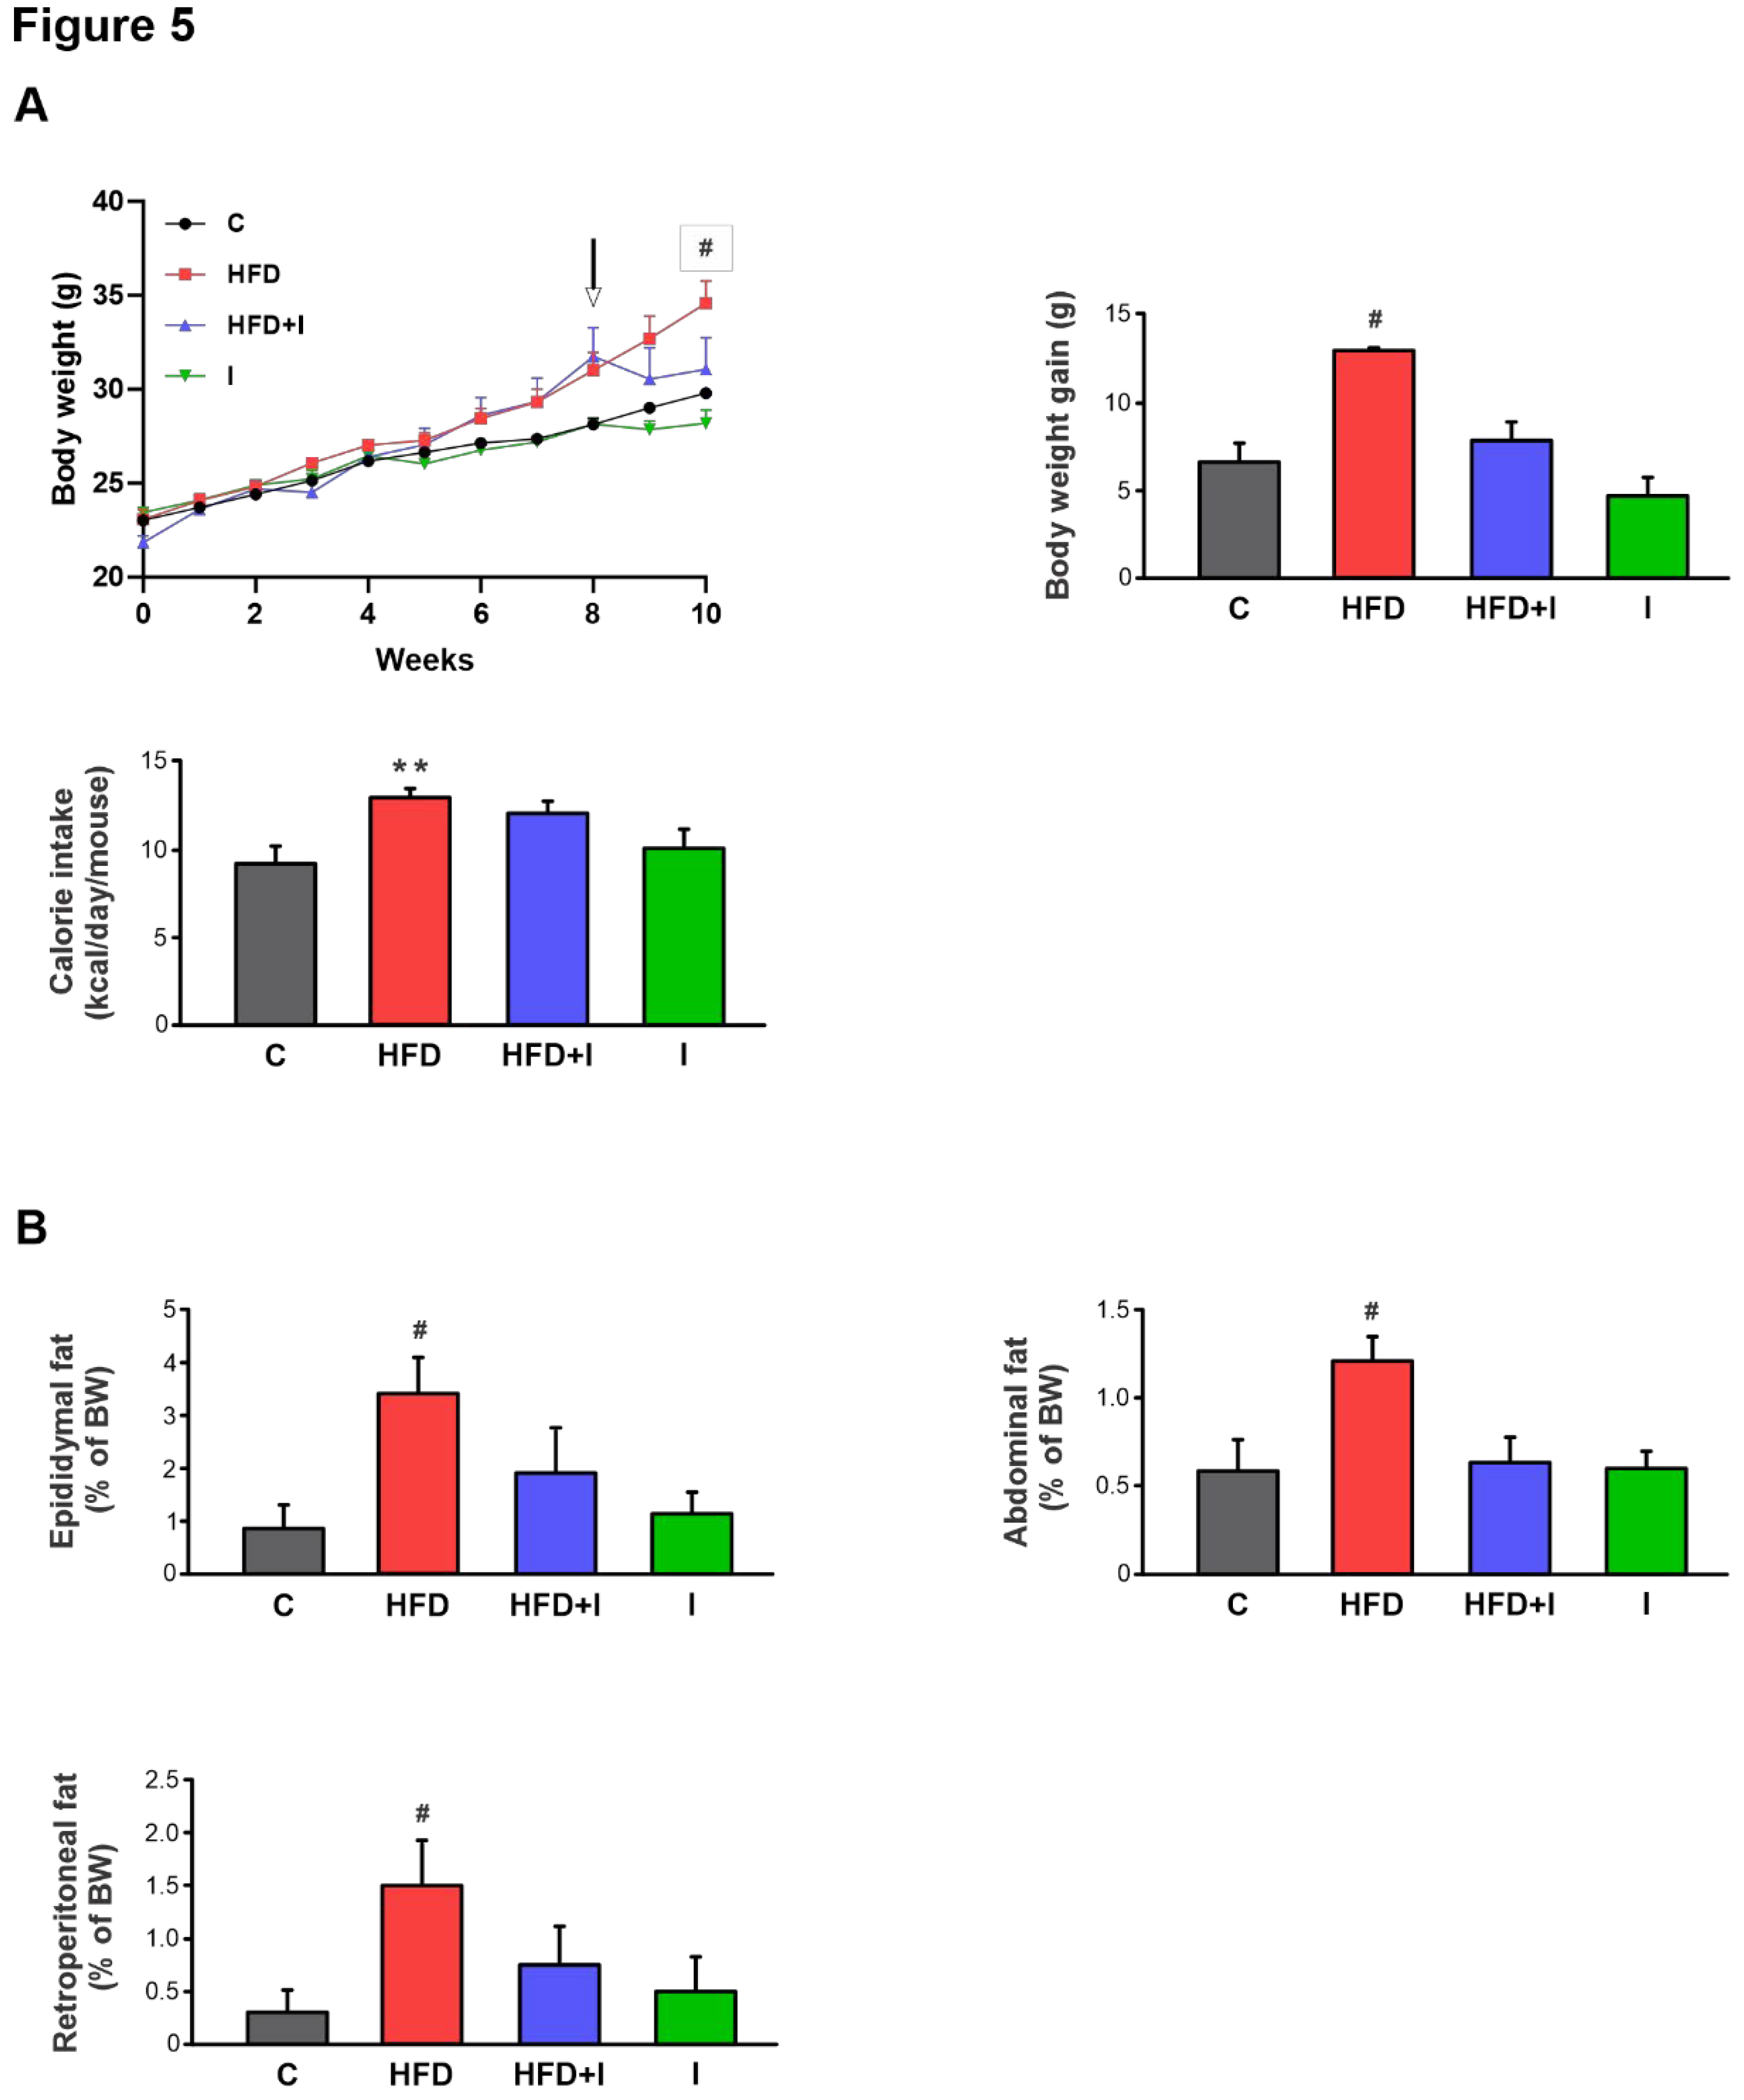
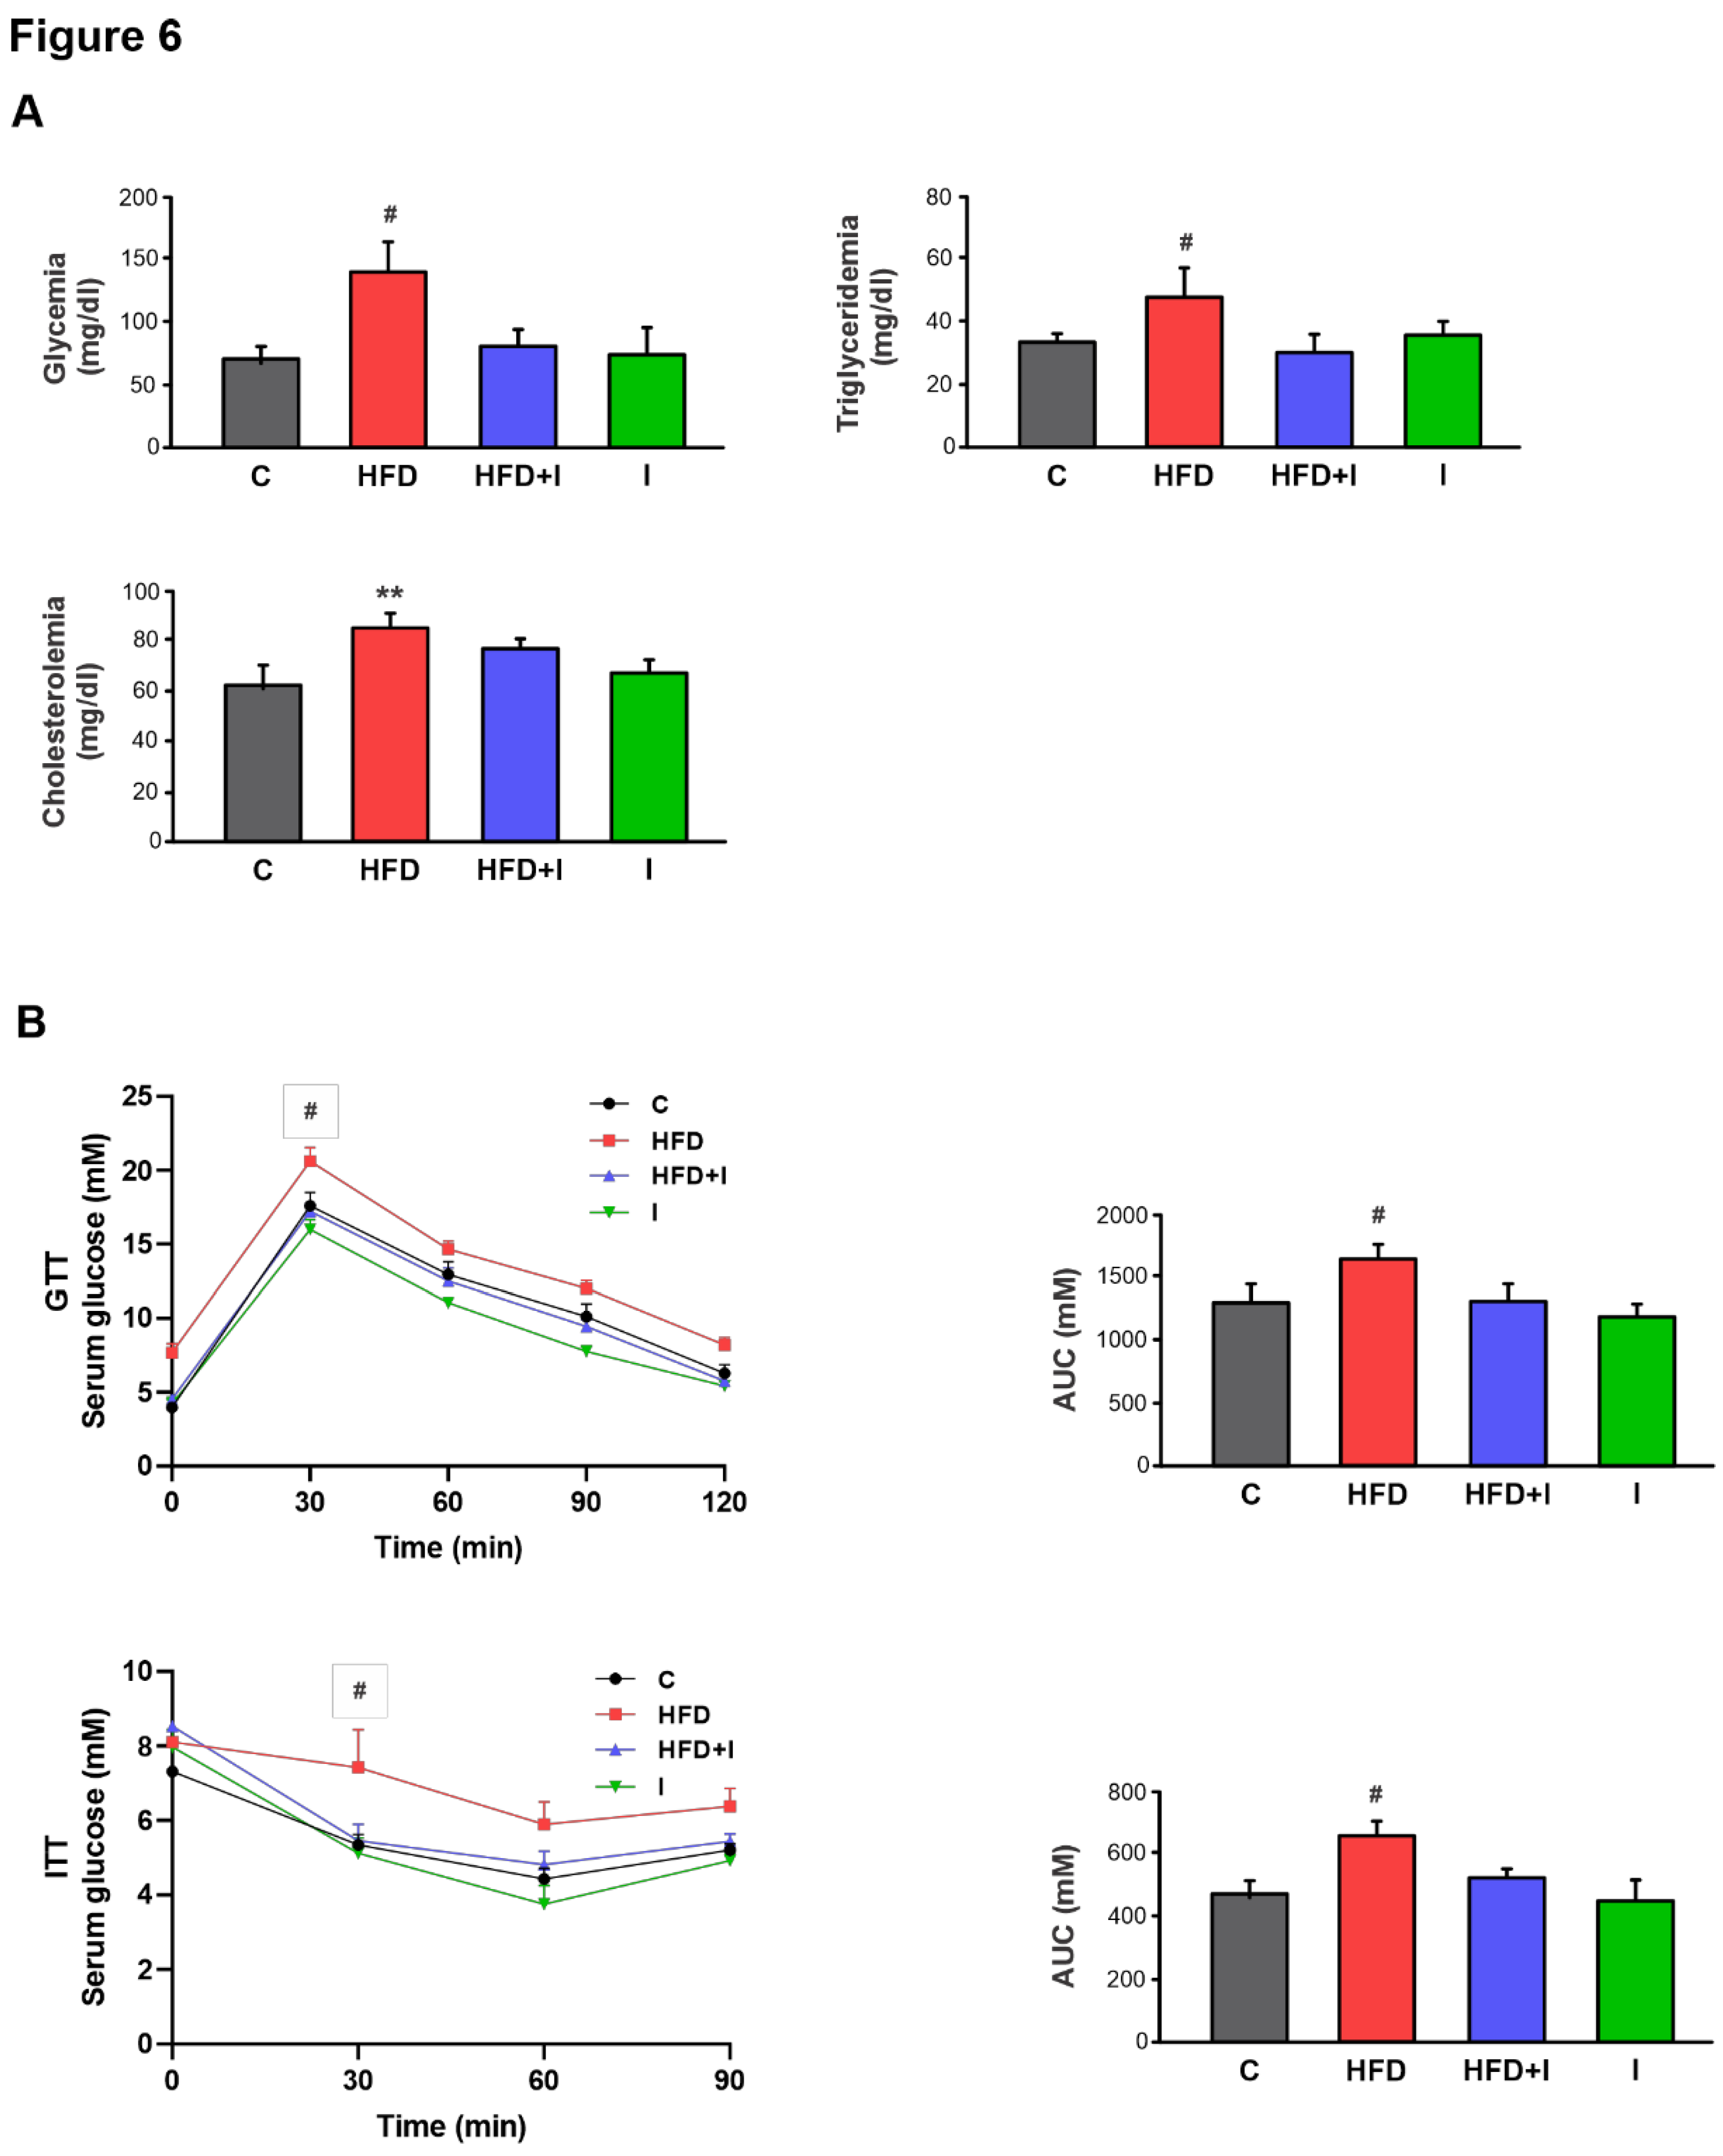
34]. These changes in intestinal microbiota paralleled substantial improvements in systemic metabolic parameters: inulin attenuated body weight gain, reduced adiposity, normalized plasma glucose and triglyceride levels, and significantly improved glucose and insulin tolerance, while plasma cholesterol remained unaffected. Altogether, these findings support previous evidence indicating that inulin supplementation beneficially remodels the IM and ameliorate obesity-associated metabolic disturbances [
34,
48,
49].
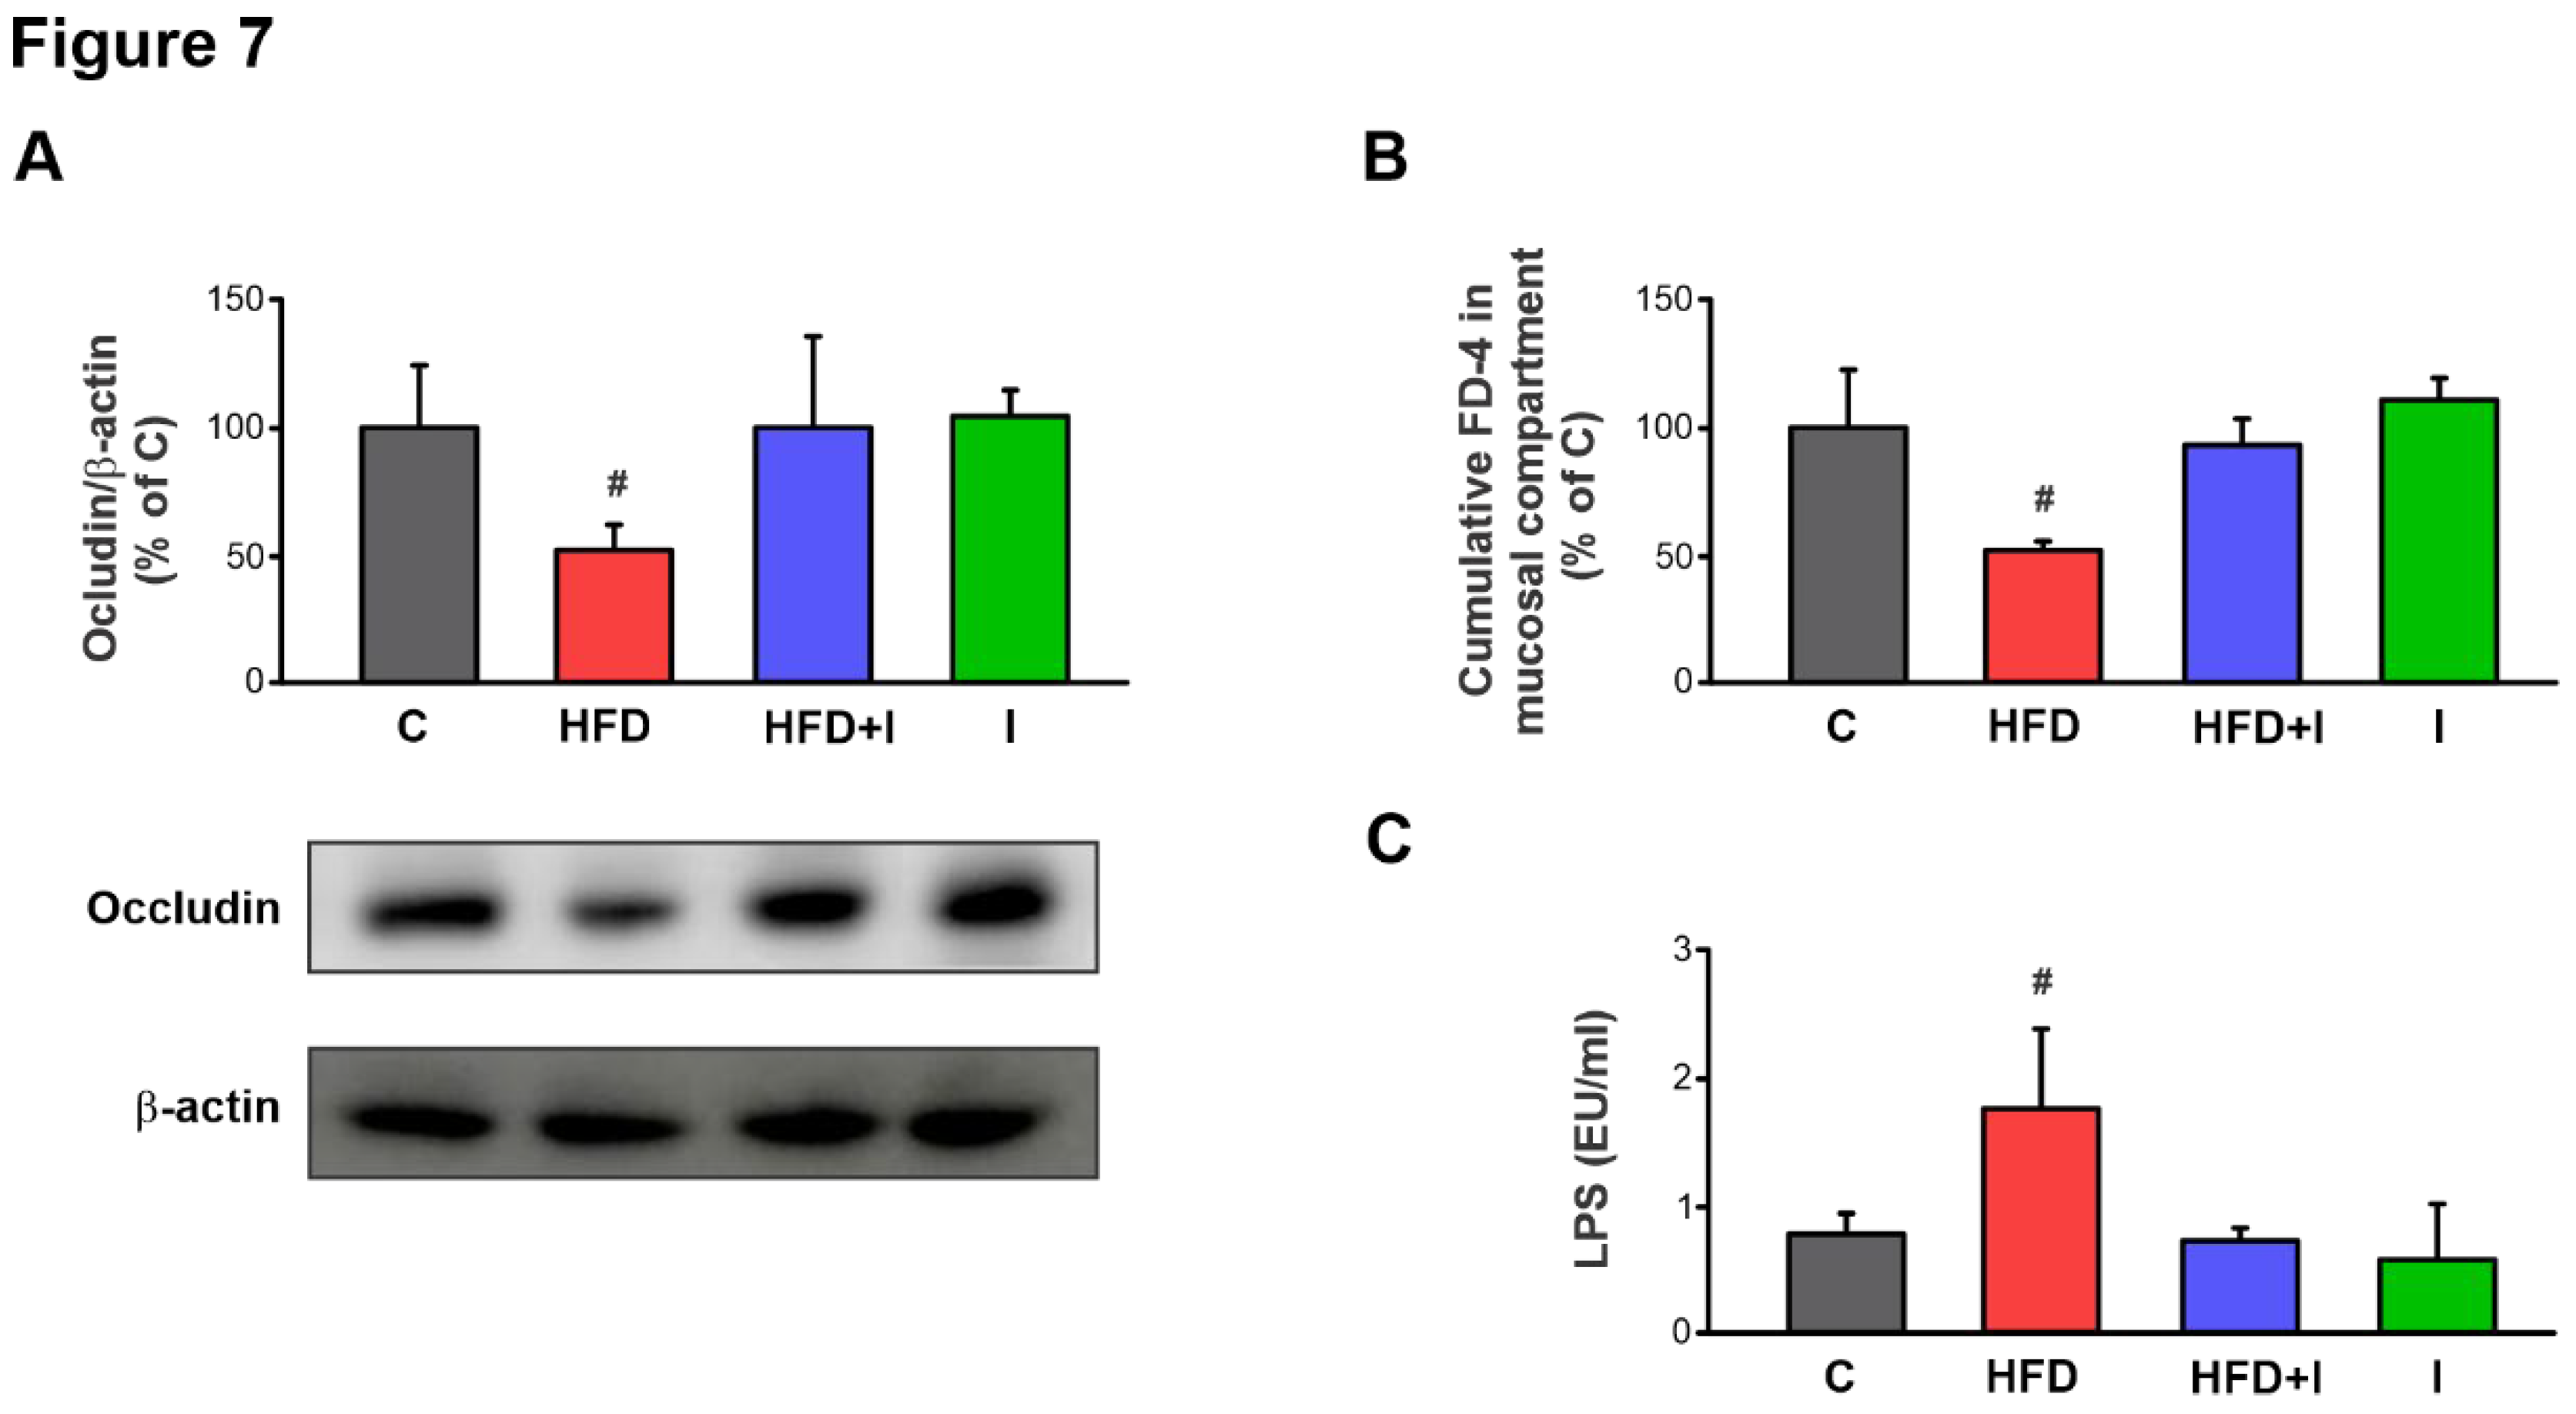
In turn, under our experimental conditions, this intestinal dysbiosis led to increased intestinal permeability, as demonstrated by a significant rise in paracellular FD-4 permeation in the HFD group compared to controls, an effect that was at least partially due to lower expression of the tight junction protein, occludin. Consistent with these findings, endotoxin plasma levels were significantly higher in HFD-fed mice, confirming elevated circulating LPS and supporting an increased proportion of LPS-containing microbiota in the intestine, as demonstrated [
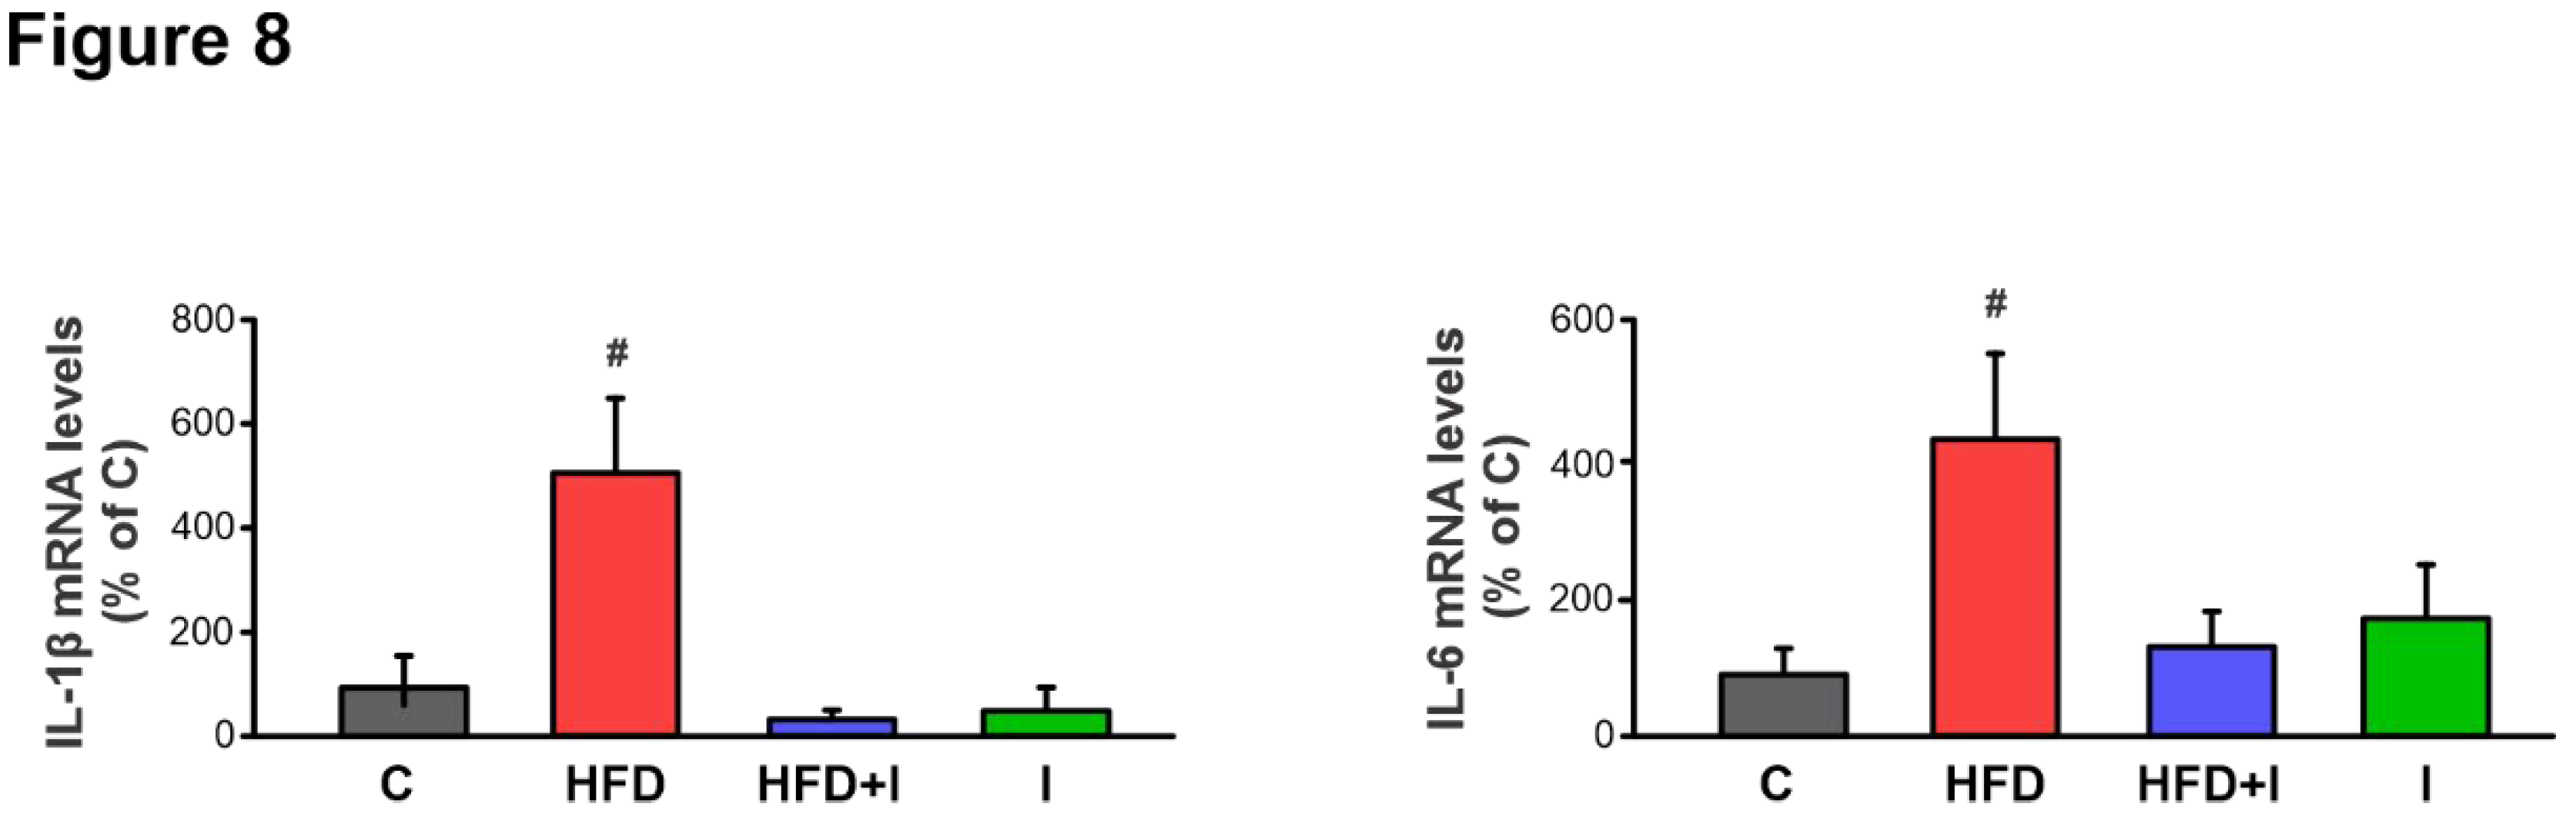
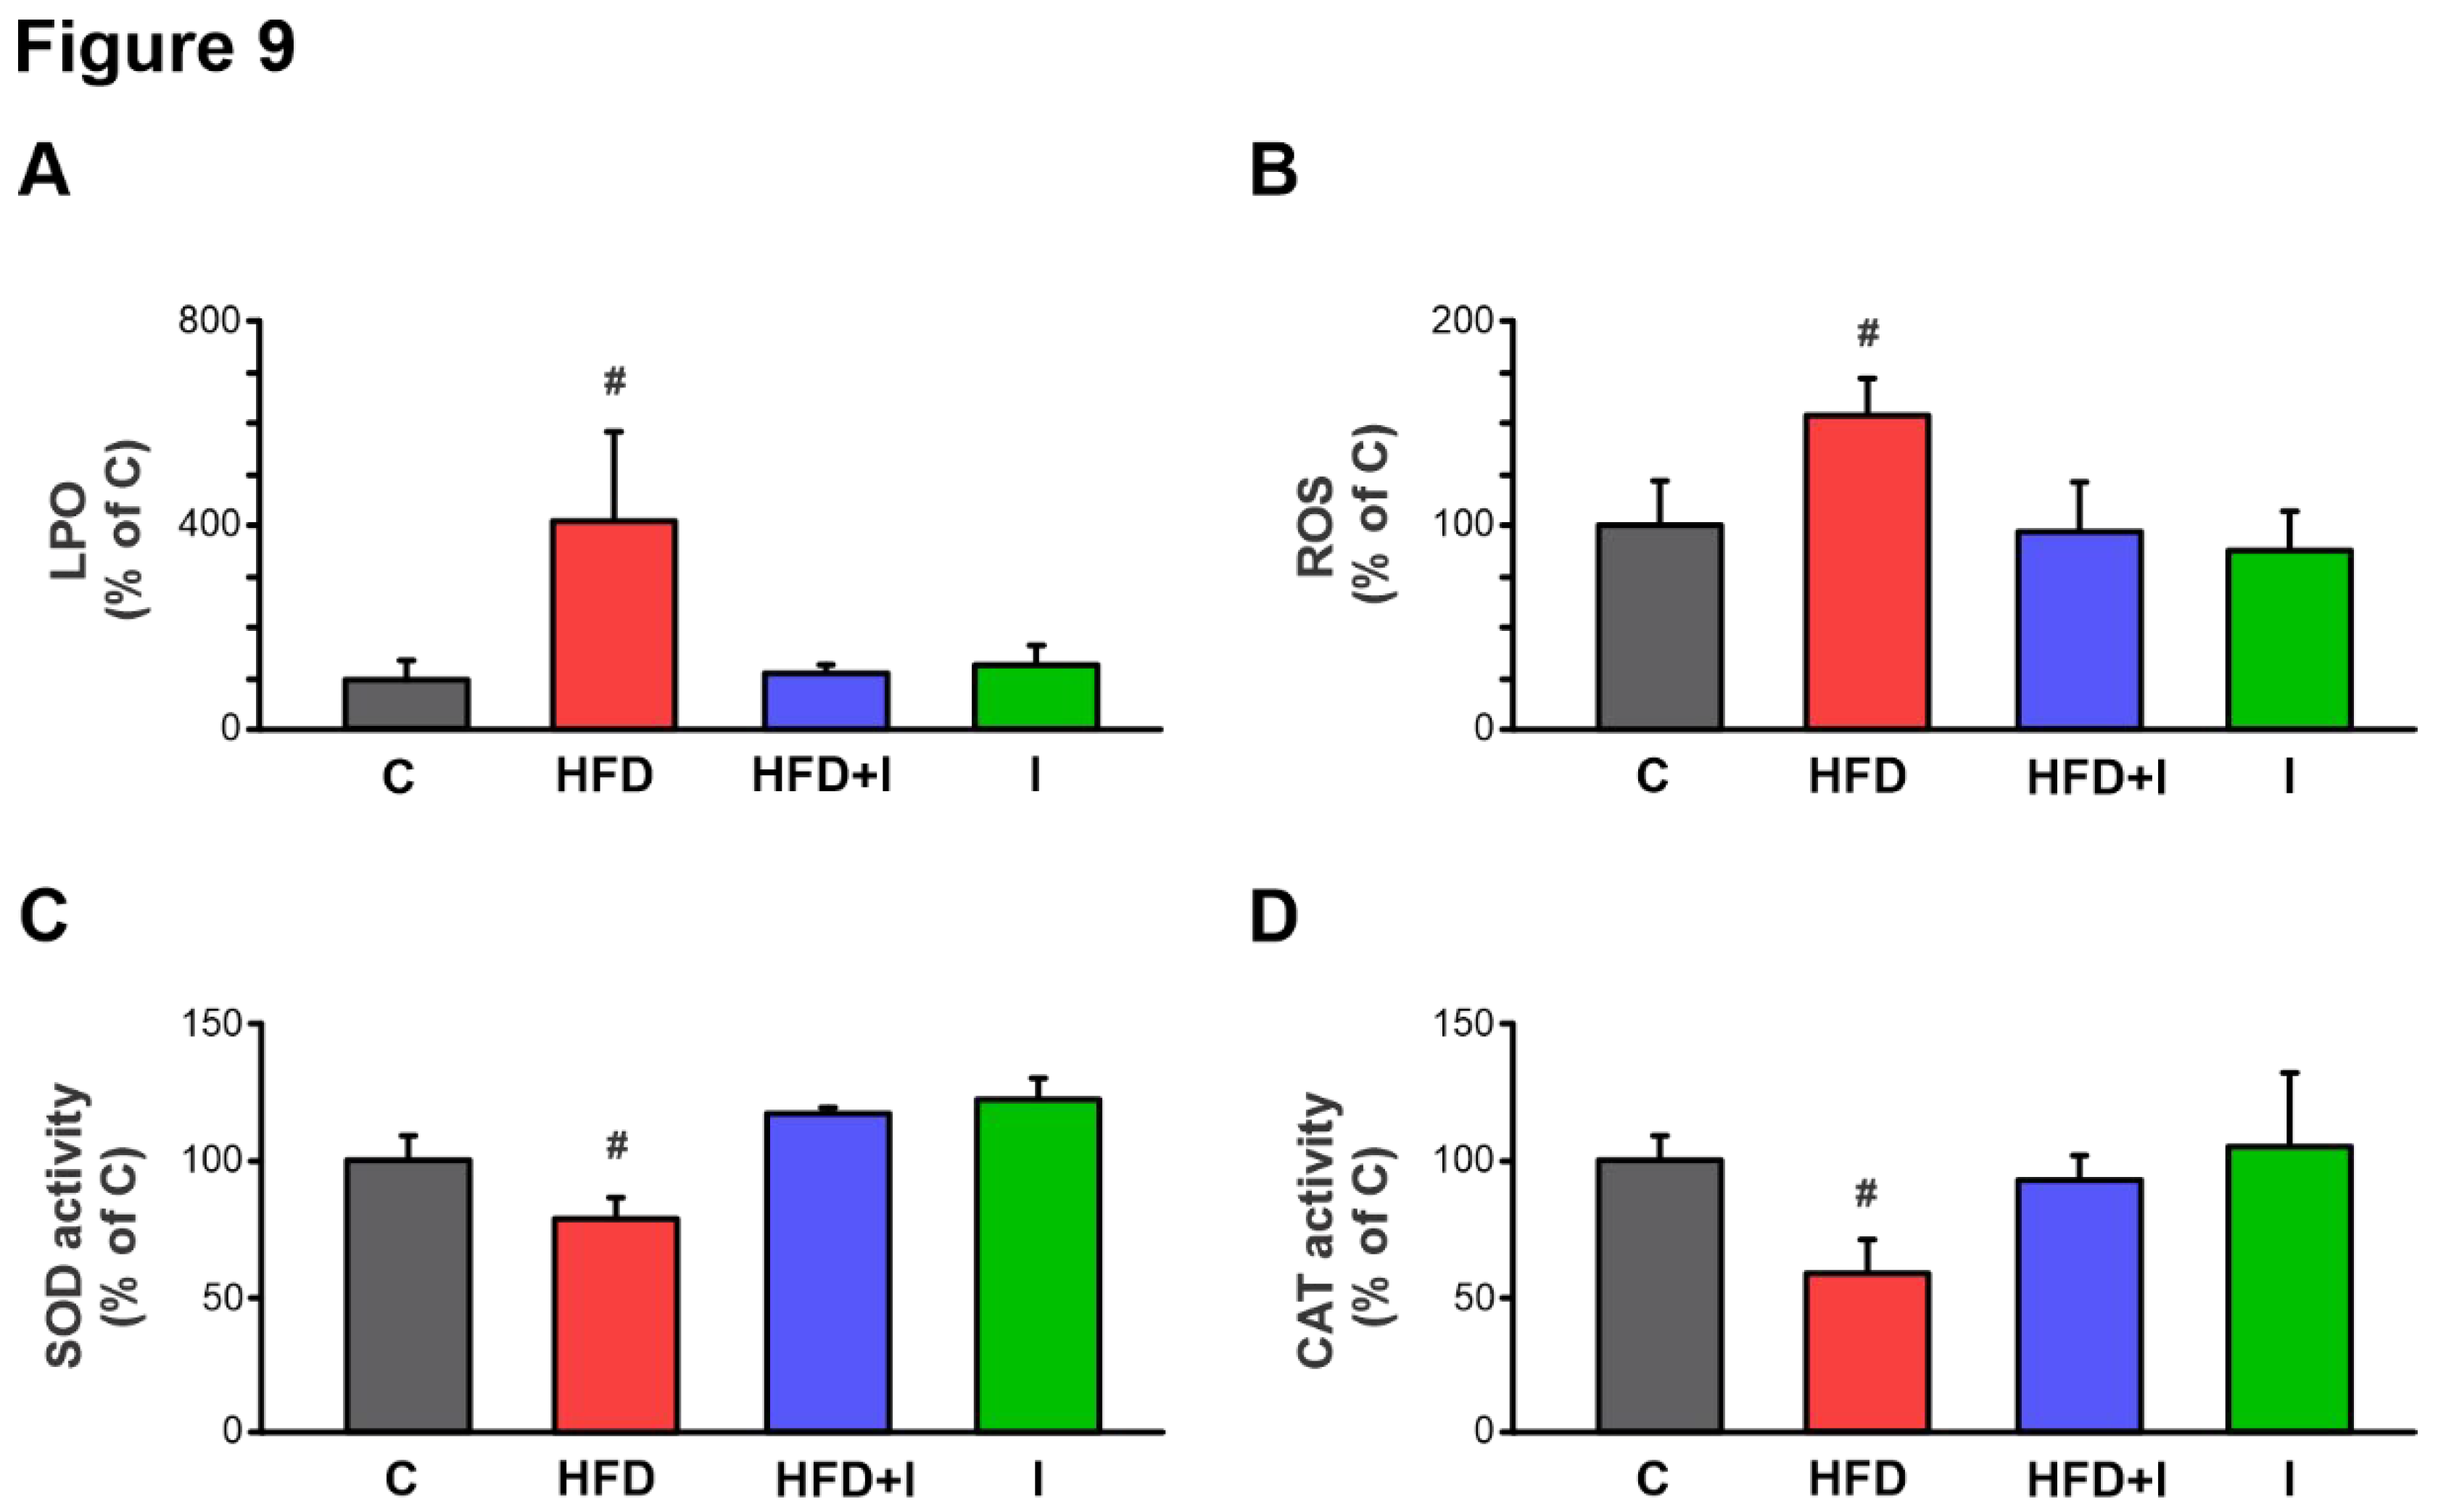
14]. Following the sequence of events, we next evaluated the local induction of an inflammatory response and associated pro-oxidant status in the intestinal tissue of HFD-fed mice. This analysis revealed a marked upregulation of the pro-inflammatory cytokines IL-1β and IL-6 compared with controls. Moreover, this inflammatory process was accompanied by a redox imbalance, as evidenced by increased levels of LPO and ROS, and reduced activities of the antioxidant enzymes SOD and CAT in the HFD group. Importantly, inulin administration effectively reversed the increase in intestinal permeability, restored occludin expression, and reduced the elevation in circulating LPS levels, while concomitantly attenuating both inflammation and OS in HFD-fed mice. Altogether, these correlations support an evident interconnection between IM, endotoxemia, and local inflammation and OS in intestinal tissue during HFD feeding, and further indicate that positive modulation of the MI by administration of the inulin prebiotic can effectively counteract these downstream pathophysiological alterations. This aligns with previous observations in visceral adipose tissue from obese mouse models, where modulation of the MI normalized LPS levels and mitigated inflammatory and OS markers [
15], and is also consistent with prior studies demonstrating the beneficial effects of inulin on the specific parameters evaluated in the present work [
34,
48,
49].
More significantly, the observed intestinal alterations occurred concomitantly with the downregulation of Mrp2 at both protein and transcriptional levels, resulting in a notable reduction in efflux activity. Moreover, our data suggest that the IM may play a central role in modulating this transporter, acting as an initiating factor within the regulatory network. The previously observed normalization of the IM with inulin treatment further supports this hypothesis, as it coincided with a reversal of the Mrp2 alterations. These findings are further supported by Zhou et al. (2022) [
27], reporting that in antibiotic-treated rats, changes in the IM alters the pharmacokinetics of cyclosporine A at least in part by downregulating intestinal P-gp and Mrp2 expression, which was reversed in the group subjected to fecal microbiota transplantation. Even though their experimental model differs from ours, and the results are limited by the lack of specification of the intestinal region analyzed and the absence of an evaluation of the specific impact on Mrp2 activity using a model substrate, these findings are particularly valuable, as they underscore the relevance of our original findings in the context of obesity.
In turn, although we provide key and novel information derived from our experimental approach using inulin, we recognize that direct evidence validating dysbiosis as the central link in the negative regulation of Mrp2 is still lacking. Nevertheless, two additional observations provide further strong support for this possibility: (i) we previously demonstrated that jejunal Mrp2 expression and activity are markedly reduced in a FRD-induced MS model in rats, where inflammation and OS emerged as critical drivers of this impairment [
20,
21], and further identified OS as a key mediator of the Mrp2 post-translational regulation [
36,
38]; and (ii) Di Luccia et al. [
50] showed that in FRD-fed rats, the development of MS was directly correlated with IM alterations, as treatment with antibiotics or fecal samples significantly reduced metabolic, inflammatory, and OS markers. Together, these evidences suggest that altered IM may contribute to the regulation of Mrp2 not only under FRD conditions but also in the present HFD model.
On another note, although few studies have demonstrated that bacteria play a direct role in the regulation of ABC transporters, they have been found to exhibit significant correlations with several factors involved in the regulation of these proteins. For instance, Clostridium_sensu_stricto_1 showed positive correlations with the inflammatory cytokines IL-6 and TNF-α [
51]. More importantly, in our study, Spearman's correlation analysis demonstrated a negative correlation between Akkermansia, known for its anti-inflammatory properties [
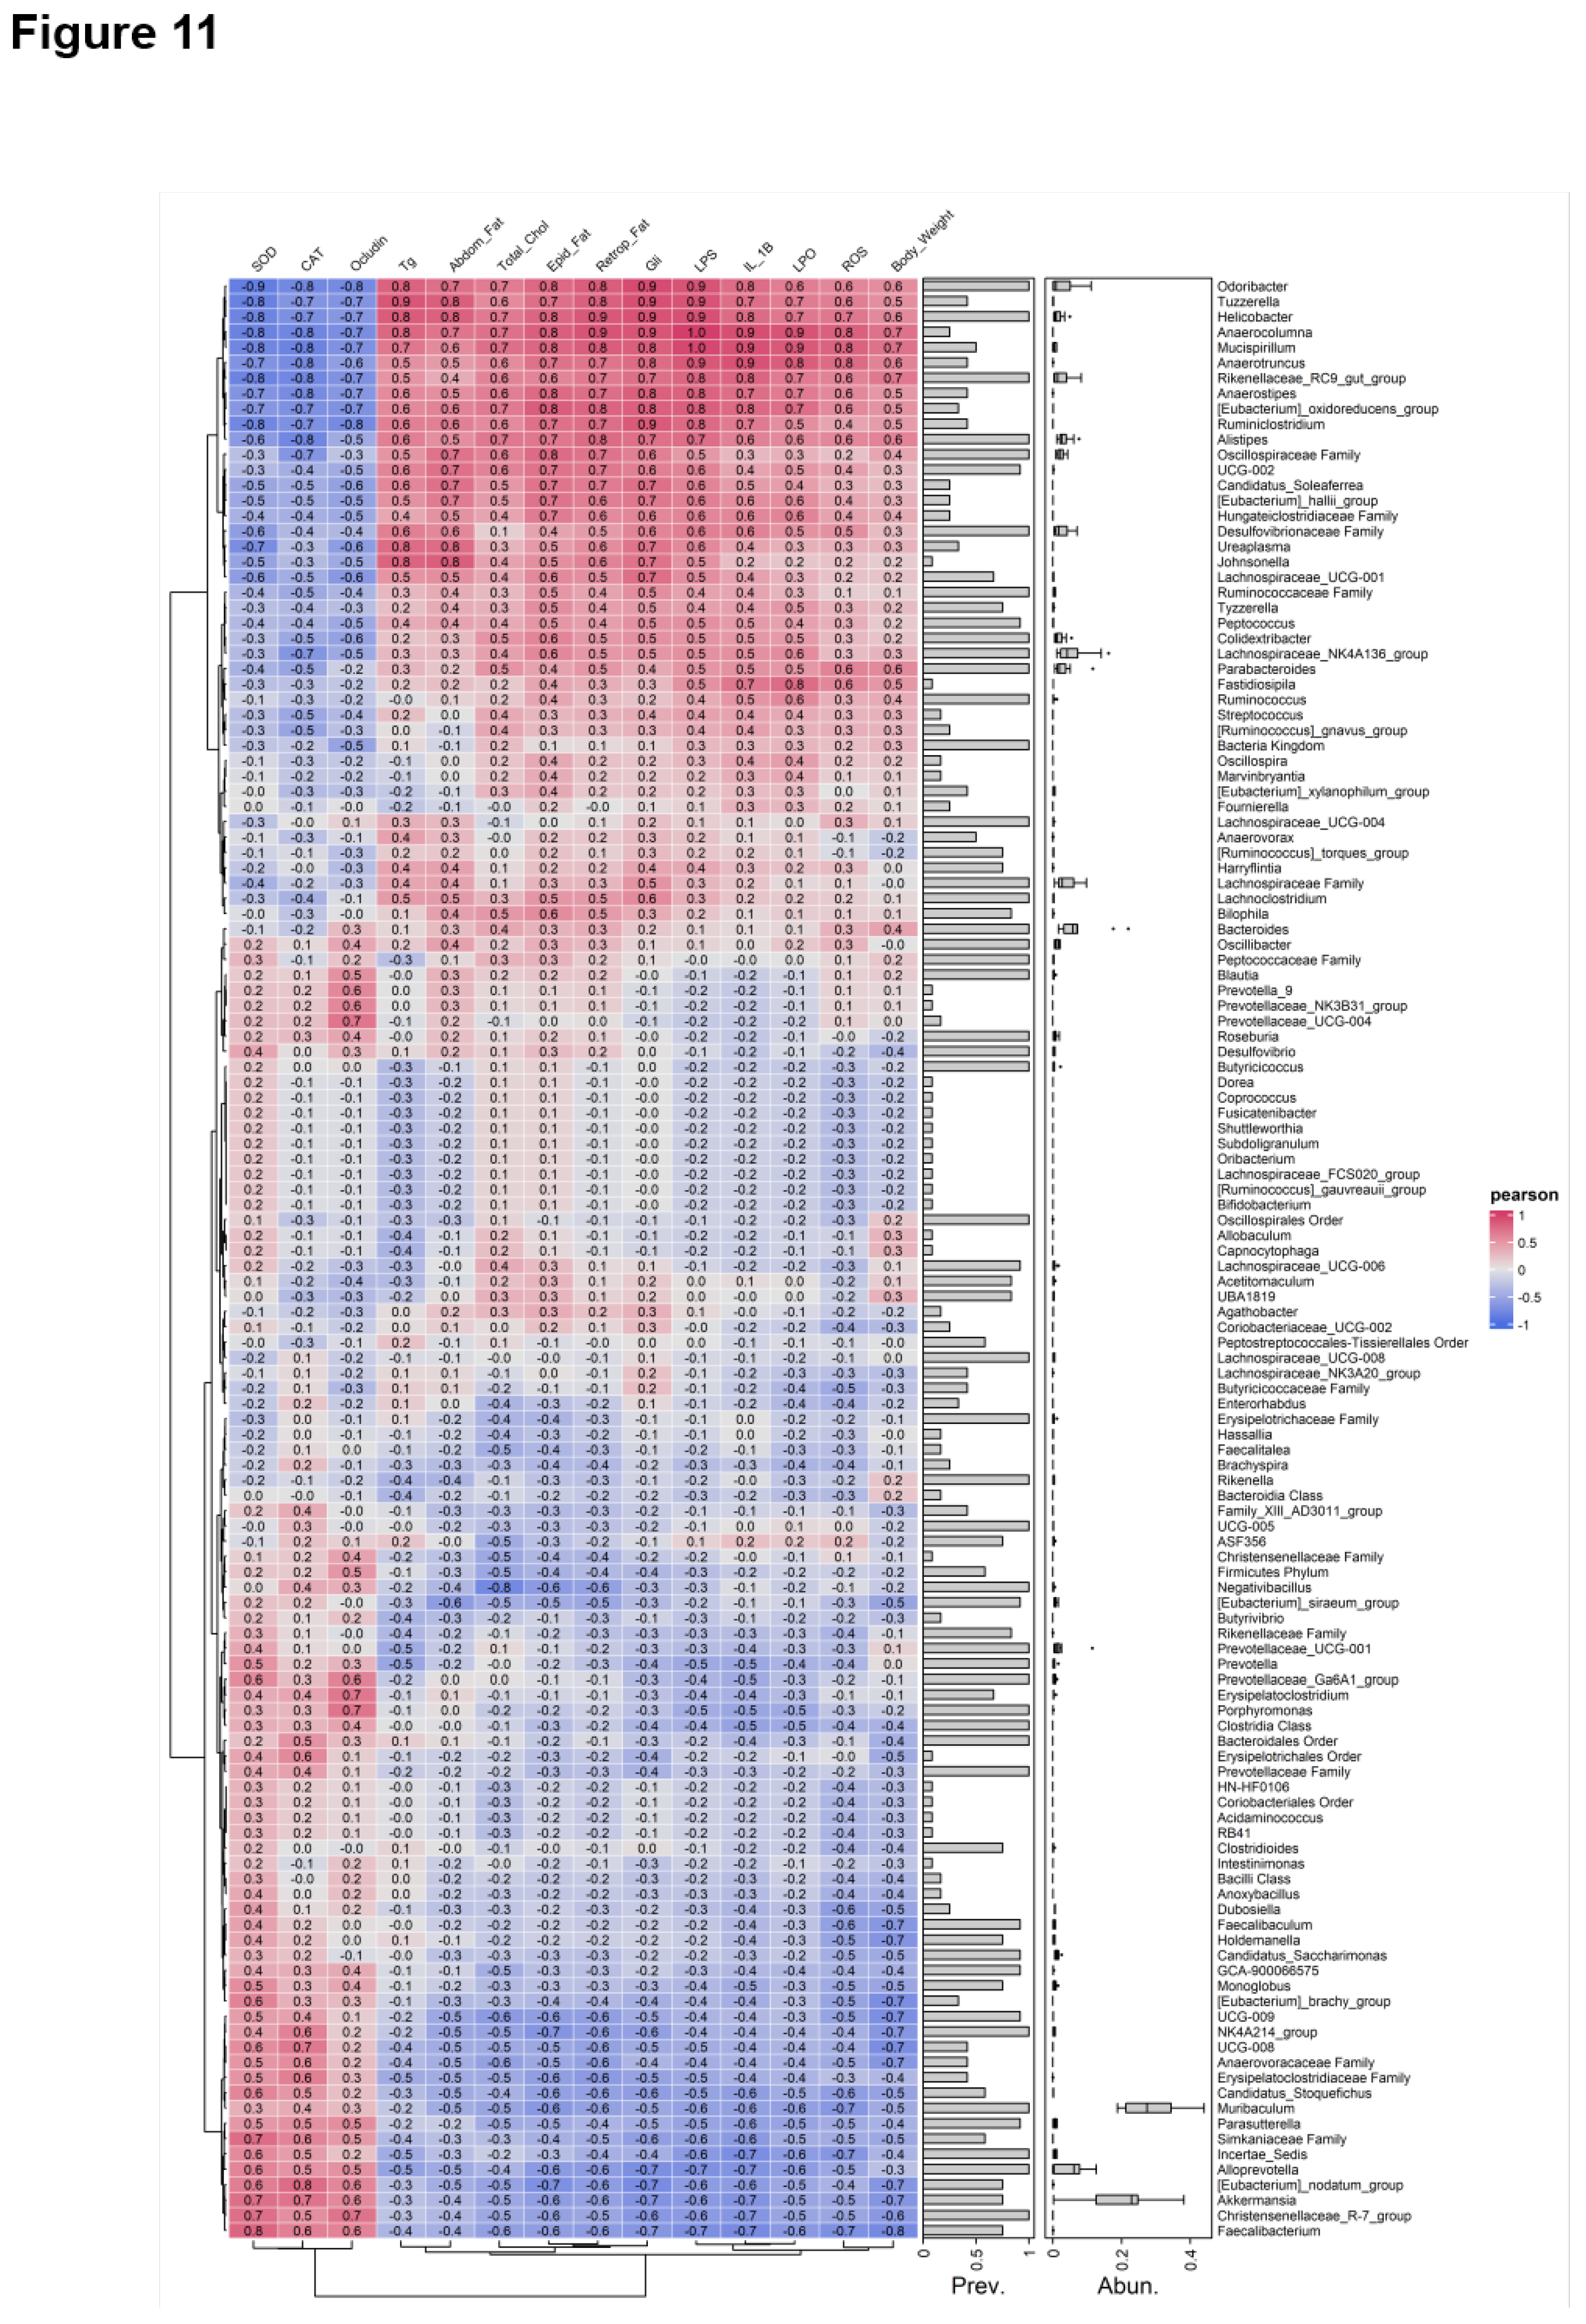
52], and the OS and pro-inflammatory indices, further supporting the role of OS and inflammation as key mediating factors. Moreover, previous studies have shown that Akkermansia can upregulate the production of SCFAs, which in turn modulate the expression of ABC transporters [
53]. Therefore, future qualitative and quantitative analyses of microbial derived metabolites could help clarify the underlying mechanisms in greater detail.
Figure 1.
Schematic representation of treatment protocol. The duration of the protocol was 10 weeks in total. The initial 8 weeks correspond to the installation of the obese model, which was verified by the insulin tolerance test (ITT), 3 days before the end of the treatments, and metabolic parameters (physiological and biochemical parameters): C and HFD groups. Treatment with inulin was initiated at the end of week 8 and continued for 2 weeks, while the HFD was maintained until the end: C, HFD, HFD+I, and I groups. Glucose tolerance (GTT) and insulin tolerance (ITT) tests were performed 5 and 3 days before the end of the treatments, respectively.
Figure 2.
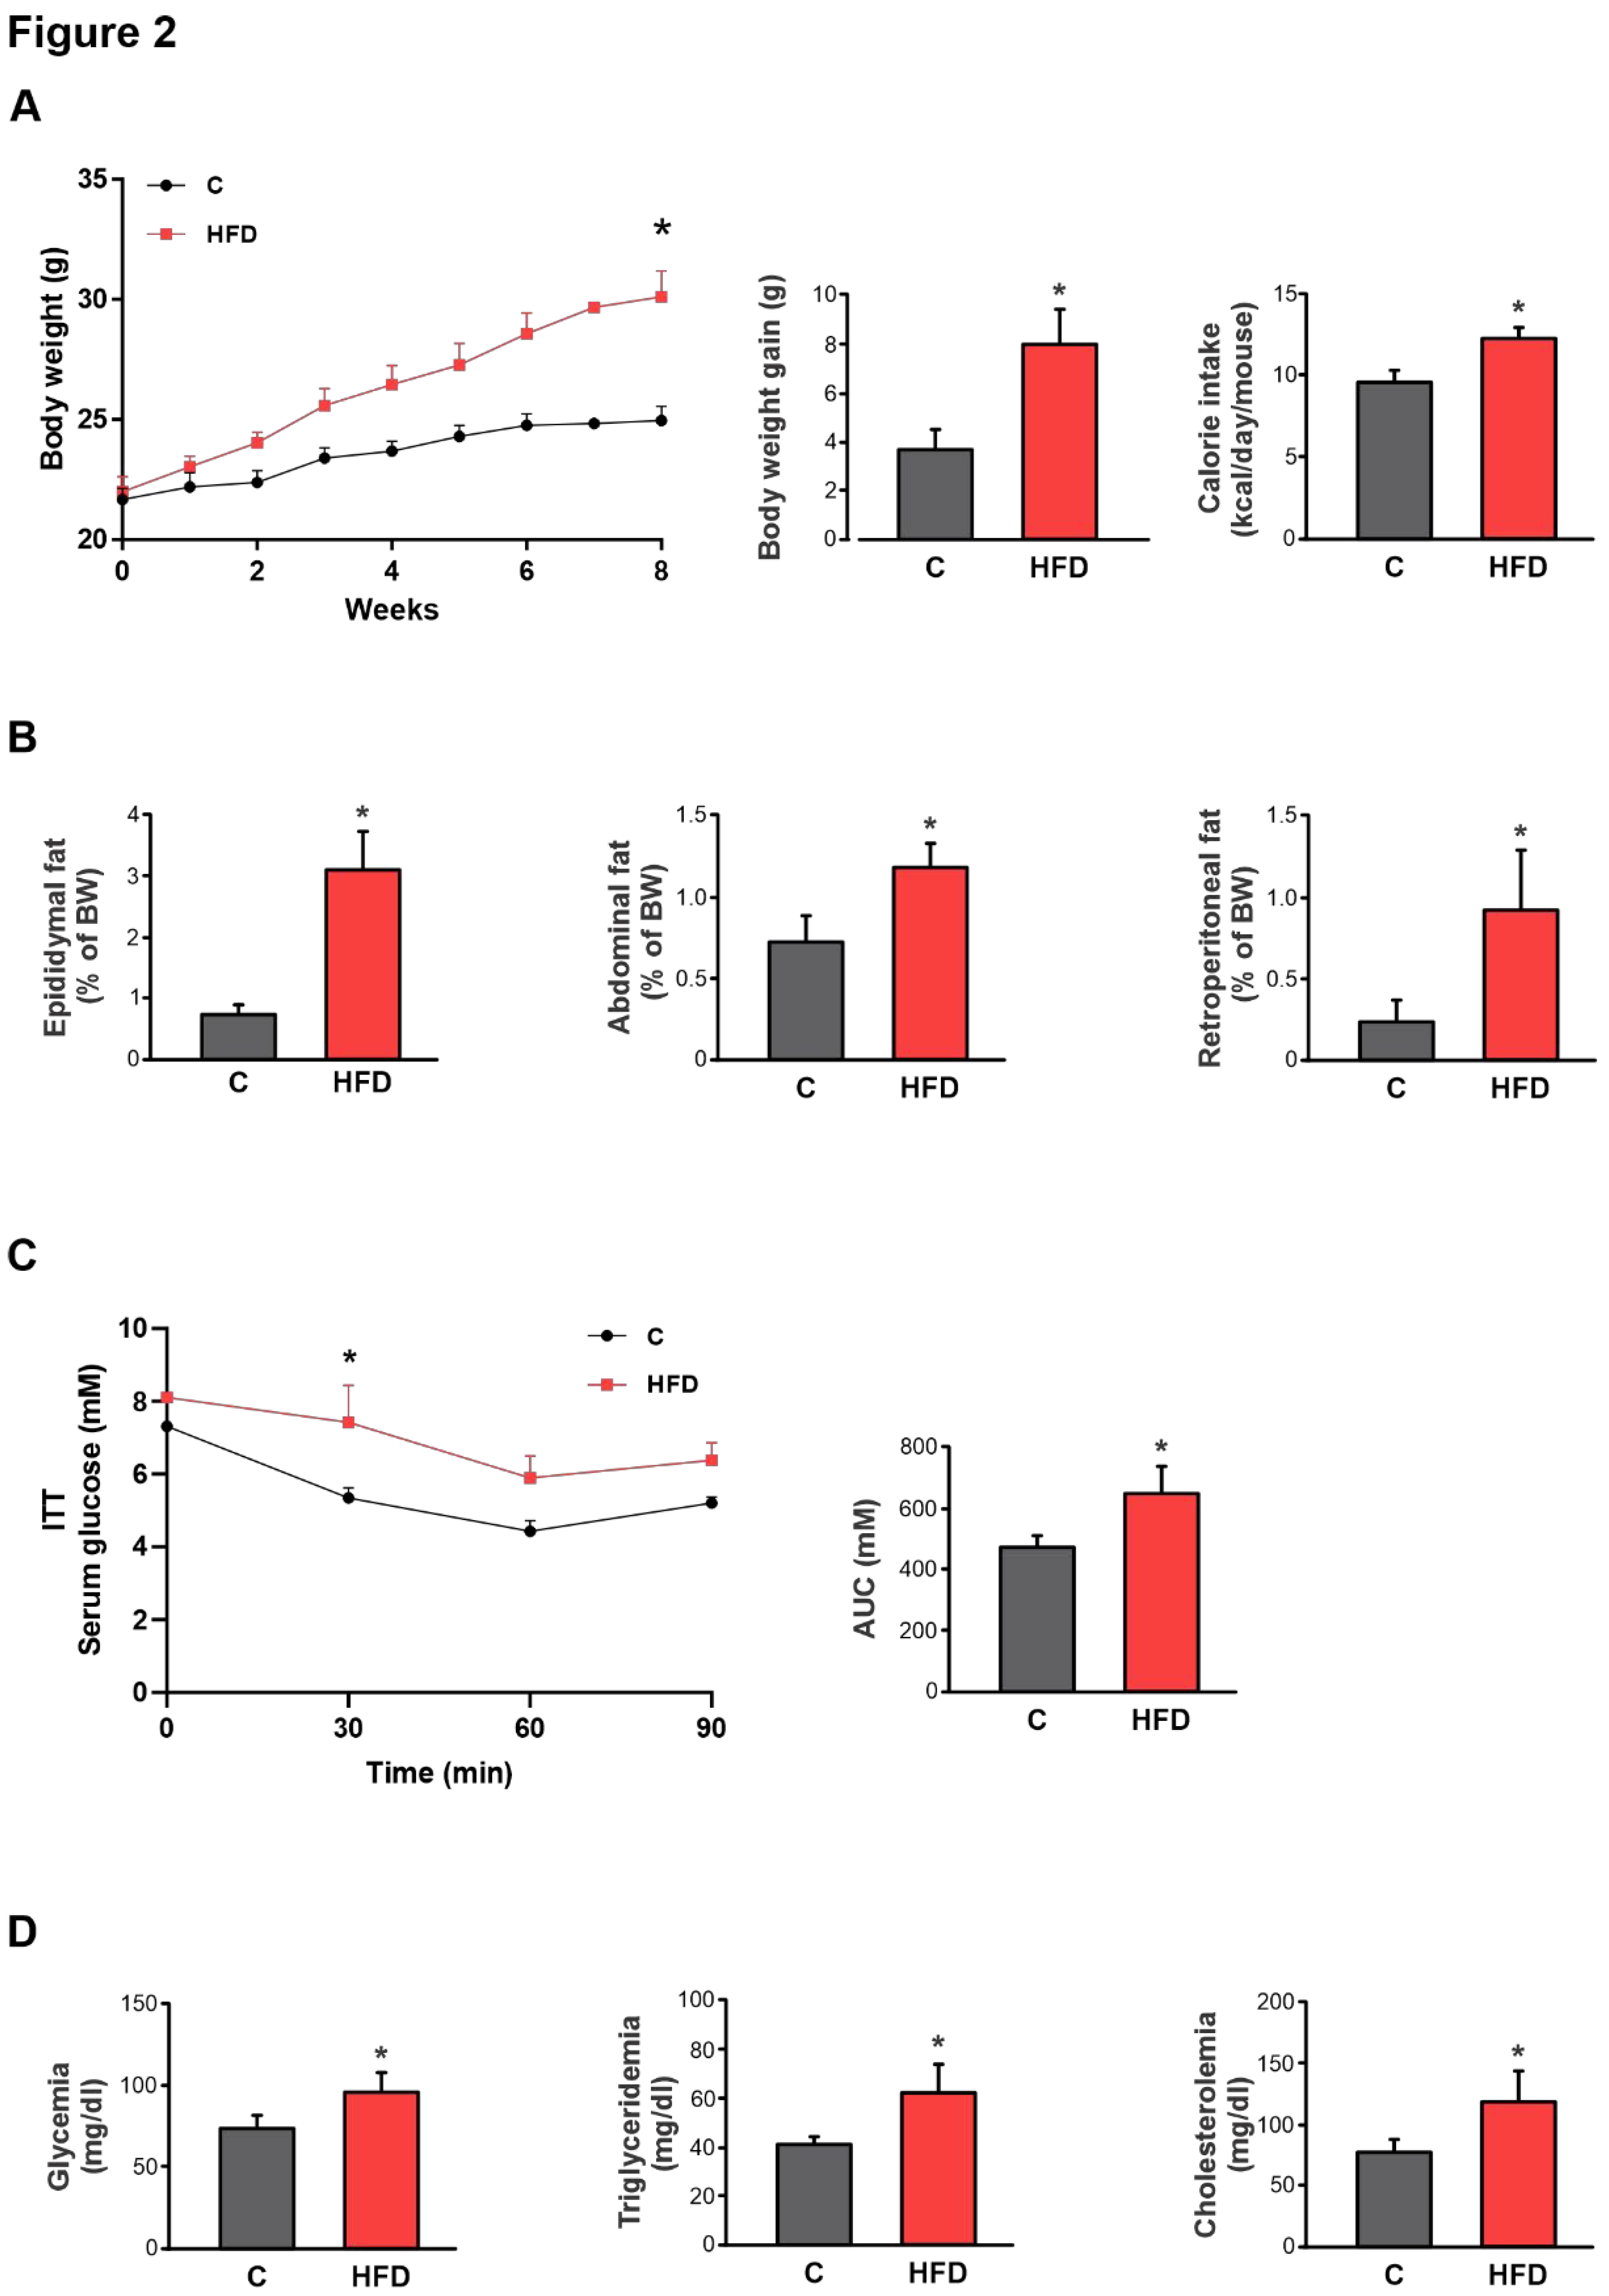
Establishment of the HFD-induced obesity model. A) Temporal evolution of body weight (BW), cumulative weight gain (g), and caloric intake (kcal/day/mouse) in male C57BL/6 mice during 8 weeks of treatments. B) The amount of epididymal, abdominal, or retroperitoneal fat was calculated as fat weight x 100/final BW. C) Response curves during the intraperitoneal insulin tolerance (ITT) tests. Bar graph depicts quantification of cumulative glucose clearance in the ITT by integration of the area under the curve (AUC) in 90 min. D) Glycemia, triglyceridemia, and cholesterolemia after 8 weeks of treatments. Results are expressed as mean ± standard deviation (n =6-8). * Significantly different from C group, P < 0.05. .
Figure 2.
Establishment of the HFD-induced obesity model. A) Temporal evolution of body weight (BW), cumulative weight gain (g), and caloric intake (kcal/day/mouse) in male C57BL/6 mice during 8 weeks of treatments. B) The amount of epididymal, abdominal, or retroperitoneal fat was calculated as fat weight x 100/final BW. C) Response curves during the intraperitoneal insulin tolerance (ITT) tests. Bar graph depicts quantification of cumulative glucose clearance in the ITT by integration of the area under the curve (AUC) in 90 min. D) Glycemia, triglyceridemia, and cholesterolemia after 8 weeks of treatments. Results are expressed as mean ± standard deviation (n =6-8). * Significantly different from C group, P < 0.05. .
Figure 3.
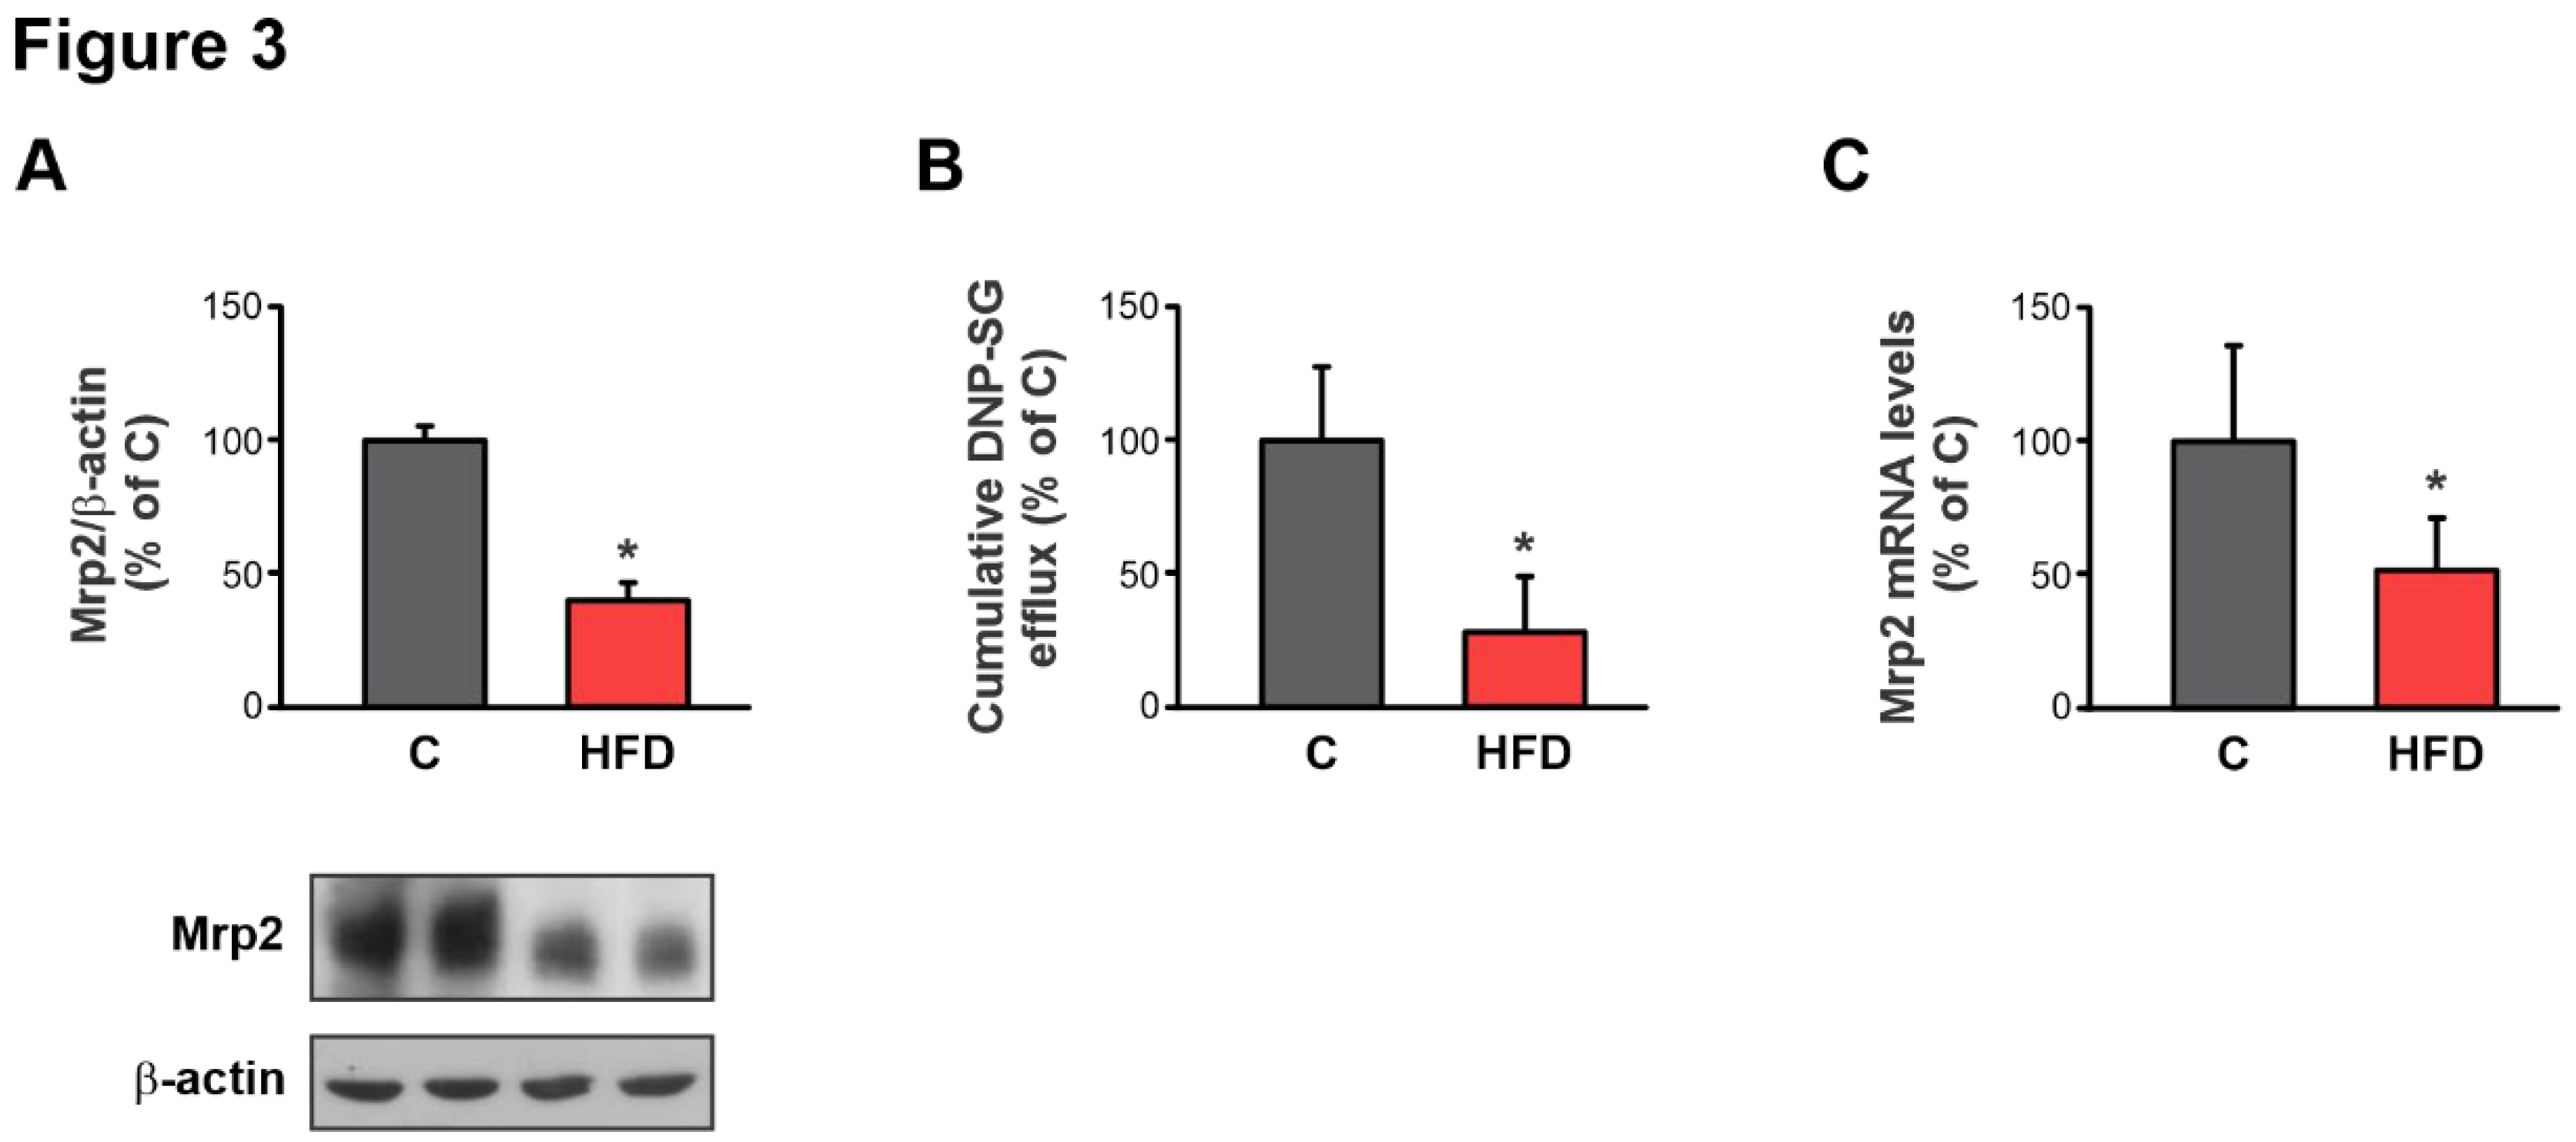
Effect of HFD on Mrp2 expression and activity. A) Western blot analysis of Mrp2 in Brush Border Membranes from jejunum. Equal amounts of total protein (20 μg) were loaded in all lanes. Uniformity of protein loading and transfer from gel to PVDF membrane was controlled with Ponceau S and detection of β-actin. Densitometry data were related to β-actin. B) Cumulative DNP-SG content in the mucosal compartment of everted intestinal sacs after 30 min of incubation with CDNB. C) Quantitative real-time PCR assessment of Mrp2 mRNA levels in jejunum. The results were normalized to the 36B4 mRNA as the housekeeping gene. Data are presented as % of controls (C) and expressed as mean ± standard deviation (n =6-8). # Significantly different from C, HFD+I and I groups, P < 0.05.
Figure 3.
Effect of HFD on Mrp2 expression and activity. A) Western blot analysis of Mrp2 in Brush Border Membranes from jejunum. Equal amounts of total protein (20 μg) were loaded in all lanes. Uniformity of protein loading and transfer from gel to PVDF membrane was controlled with Ponceau S and detection of β-actin. Densitometry data were related to β-actin. B) Cumulative DNP-SG content in the mucosal compartment of everted intestinal sacs after 30 min of incubation with CDNB. C) Quantitative real-time PCR assessment of Mrp2 mRNA levels in jejunum. The results were normalized to the 36B4 mRNA as the housekeeping gene. Data are presented as % of controls (C) and expressed as mean ± standard deviation (n =6-8). # Significantly different from C, HFD+I and I groups, P < 0.05.
Figure 4.
Effect of high fat diet feeding and Inulin treatment on intestinal microbiota. Relative abundance of cecal microbiota from male C57BL/6 mice: A) at phylum level and Firmicutes/Bacteroidetes ratio; B) at family level and C) at genus level. Data are expressed as mean ± standard deviation (n =3-4). #, significantly different from C, HFD+I and I groups, P < 0.05.
Figure 5.
Effect of HFD and Inulin treatment on physiological parameters and energy intake. A) Temporal evolution of body weight (BW) cumulative weight gain (g) and calorie intake (kcal/day/mouse) in male C57BL/6 mice during 10 weeks of treatments. The arrow indicates the beginning of Inulin supplementation B) The amount of epididymal, abdominal, or retroperitoneal fat was calculated as fat weight x 100/final BW. Data are presented as % of controls (C) and expressed as mean ± standard deviation (n=6-8). # Significantly different from C, HFD+I and I groups, p< 0.05. **Significantly different from C and I groups, P < 0.05.
Figure 6.
Effect of HFD and Inulin treatment on biochemical parameters. A) Glycemia, triglyceridemia, and cholesterolemia after 10 weeks of treatments. B) Response curves during the intraperitoneal glucose and insulin tolerance tests (GTT and ITT, respectively). Bar graphs depict quantification of cumulative glucose clearance in the GTT and ITT by integration of the area under the curve (AUC) in mM/120 min and mM/90 min, respectively. Results are expressed as mean ± standard deviation (n =6-8). # Significantly different from C, HFD+I and I groups, P < 0.05. .
Figure 7.
Effect of HFD and Inulin treatment on intestinal paracellular barrier and plasma endotoxin levels. A) Western blot analysis of occludin in brush border membrane (BBM) fraction. Equal amounts of total protein (20 µg) were loaded in gels. Uniformity of protein loading and transfer from gel to PVDF membranes were controlled with Ponceau S and detection of β-actin. Densitometry data was related to β-actin. B) Paracellular permeation of FD-4 across intestinal barrier. FD-4 accumulated in the mucosal compartment was measured after 30 min of intestinal sacs incubation. C) Plasma endotoxin levels was determined using a limulus amebocyte lysate (LAL) kit (Lonza, Walkersville, MD, USA). Results are expressed as mean ± standard deviation (n =6-8). # Significantly different from C, HFD+I and I groups, P < 0.05. .
Figure 8.
Effect of HFD and Inulin treatment on intestinal proinflammatory cytokine levels. Quantitative real-time PCR assessment of IL-1β and IL-6 mRNA levels in jejunum homogenates. The results were normalized to the 36B4 mRNA as the housekeeping gene. Data are presented as % of controls (C) and expressed as mean ± standard deviation (n =6-8). # Significantly different from C, HFD+I and I groups, P < 0.05.
Figure 9.
Effect of HFD and Inulin treatment on intestinal redox balance and antioxidant defenses. Lipoperoxidation (LPO), quantified by Thiobarbituric acid reactive substances (TBARS); reactive oxygen species (ROS); superoxide dismutase (SOD) and catalase (CAT) activity were determined in in jejunum homogenates. Data are presented as % of controls (C) and expressed as mean ± standard deviation (n =6-8). # Significantly different from C, HFD+I and I groups, P < 0.05.
Figure 10.
Effect of HFD administration and Inulin treatment on intestinal Mrp2. A) Western blot analysis of Mrp2 in brush border membrane (BBM) fraction. Equal amounts of total protein (20 ug) were loaded in gels. Uniformity of protein loading and transfer from gel to PVDF membranes were controlled with Ponceau S and detection of β-actin. Densitometry data was related to β-actin. B) RT-qPCR analysis of Mrp2 mRNA levels. The results were normalized to the 36B4 mRNA as the housekeeping gene. C) Cumulative DNP-SG content in the mucosal compartment of everted intestinal sacs after 30 min of incubation with CDNB. D) Confocal microscopy detection of Mrp2 in the intestinal villus. Mrp2 was labeled with red fluorescence and nuclei were stained with Hoechst 33258 (blue fluorescence). Scale bar is indicated in white and correspond to 50 μm. Data are presented as % of controls (C) and expressed as mean ± standard deviation (n =6). #, significantly different from C, HFD+I and I, p<0.05.
Figure 11.
Correlation analysis between IM composition and metabolic, inflammatory, oxidative stress, and paracellular barrier parameters. Spearman’s correlation heatmap showing associations between the relative abundance of intestinal bacterial taxa and host metabolic, inflammatory, OS, and paracellular barrier parameters in male C57BL/6 mice. Color scale indicates correlation coefficients (blue: negative; red: positive).