Submitted:
14 October 2025
Posted:
17 October 2025
You are already at the latest version
Abstract
A new method for measuring the quantitative indicator of the degree of red blood cell (RBC) aggregation in autologous blood plasma by automated analysis of images obtained using a light microscope is described. A method for measuring the degree of RBC aggregation in autologous blood plasma includes preprocessing, image acquisition and automated image analysis, image binarization, defining the boundaries of objects found, classifying objects into two classes (single RBC and aggregates) and calculating a numerical indicator reflecting the degree of RBC aggregation. The result of the treatment is an indicator of the degree of RBC aggregation in autologous blood plasma. The proposed method makes it possible to assess of RBC aggregation in autologous blood plasma and thereby obtain additional diagnostic and scientific information, increase the accuracy of assessing the degree of RBC aggregation in autologous blood plasma.
Keywords:
red blood cell
; degree of aggregation
; autologous plasma
; automated image processing
; microscope
Introduction
The ability to aggregation is one of the most important properties RBC aggregation is a reversible process of formation and destruction of RBC aggregates, which largely determines blood viscosity at low shear stresses [1,2,3]. As a consequence, the aggregation of RBCs significantly affects the efficiency of blood microcirculation and oxygen delivery to tissues. At the same time, the degree of RBC aggregation significantly changes in diabetes, hypertension, sepsis and many other diseases [4,5,6]. This makes the study of RBC aggregation an important task both for the development of blood rheology as a scientific direction and for clinical practice.
The most common methods of studying the process of RBC aggregation in the form of rouleaux are photometric methods [7,8].
However, the existing methods of registering erythrocyte aggregation are either time-consuming or do not show an objective picture of the degree of RBC aggregation into complexes.
In this paper, we present method that combines reliable visualization of the process, simple preparation of a preparation for measuring RBC aggregation and software processing of aggregation images to obtain its numerical value.
Thus, the aim of the study was to develop and test a method for obtaining a standardized image of RBC aggregation and its subsequent processing using a special computer program.
Materials and Methods
Blood was drawn from healthy donors and diabetic patients upon obtaining their informed consent according to the Helsinki Committee Regulation.
Fifteen diabetic patients and 10 healthy subjects participated in the study. Diabetic patients had all been diagnosed with type 2 diabetes mellitus.
Venous blood was collected into vacuum tubes containing 3.8% sodium citrate (9:1). Immediately after collection, citrated blood was centrifuged at 2000g for 20 min, the plasma was aspirated and saved, and the buffy coat was discarded. To investigate RBC aggregation were resuspended at 0.25% hematocrit in autologous plasma.
After that, a drop of 0.25% of a mixture of plasma with RBCs was placed on a slide in the field of view of a light microscope (Primo Star, Carl Zeiss, Germany) equipped with a megapixel digital color television camera. With the help of a digital camera, an image was obtained at a total magnification of 200x, it was processed using computer vision algorithms.
Automated image analysis using computer vision algorithms includes image preprocessing, image binarization for searching for objects, determining the boundaries of found objects, classifying objects into two classes (single RBCs and aggregates) and calculating a numerical indicator reflecting the degree of RBC aggregation.
At the stage of image preprocessing, a median filter is applied to eliminate pulse noise and adaptive histogram alignment is performed to increase the contrast and image quality. Then the image is binarized by the Otsu's method. Due to the color heterogeneity of the desired objects, gaps are formed inside the objects in the binarized image. To eliminate these gaps and improve the quality of binarization (and, consequently, the quality of has at least one neighbor belonging to this set), then the contours of the connected areas are constructed.
After determining the contours of the desired objects, they are classified into single RBCs and aggregates. It should be noted that single red object recognition), a circle-shaped neighborhood is examined for each pixel of the image (a circular neighborhood is used, since the shape of RBCs in the image is close to a circle), and the percentage of black and white pixels in this neighborhood is calculated. If the ratio is greater than 80%, it is assumed that an object has been found inside which there is a gap, and all pixels inside the investigated neighborhood are painted black. Then the objects obtained as a result of binarization are selected. First, connected areas are selected (a connected area is an image area in which each pixel blood cells have the shape of a circle, therefore, it is necessary to separate objects having the shape of a circle and figures of complex shape (aggregates). This is implemented by calculating the center of mass of each object. The center of mass of single RBCs, whose shape is close to a circle, is located in the center of the object, therefore, the distance from the center to each point of the contour is approximately equal. The center of mass is determined for each object, then the distances from the center of mass to each point of the object contour are calculated and the value of the indicator characterizing the deviation of the distances from the average value (variance) is calculated. If the variance value is close to 0 (it lies in the range from 0 to 1), the object is considered a single RBC, otherwise it is an aggregate.
In the image aggregated RBCs are indicated in red, individual cells are indicated in green.
Next, the calculation of the value of the indicator characterizing the degree of aggregation of RBCs as the ratio of the area of aggregated to the area of single cells is performed.
Statistical Analysis
Data are presented as the mean ± standard error mean (SEM). The results of this study were tested by using nonparametric statistics methods using the Mann-Whitney test. The level of significance was considered as ρ value <0.05.
Results
The results of study of RBC aggregation in autologous plasma healthy subjects are shown in Figure 1. Figure 1A shows the formation of rouleaux in autologous plasma in healthy subjects. The indicator of the degree of RBC aggregation was 5.34 ± 0.82 (Figure 1B).
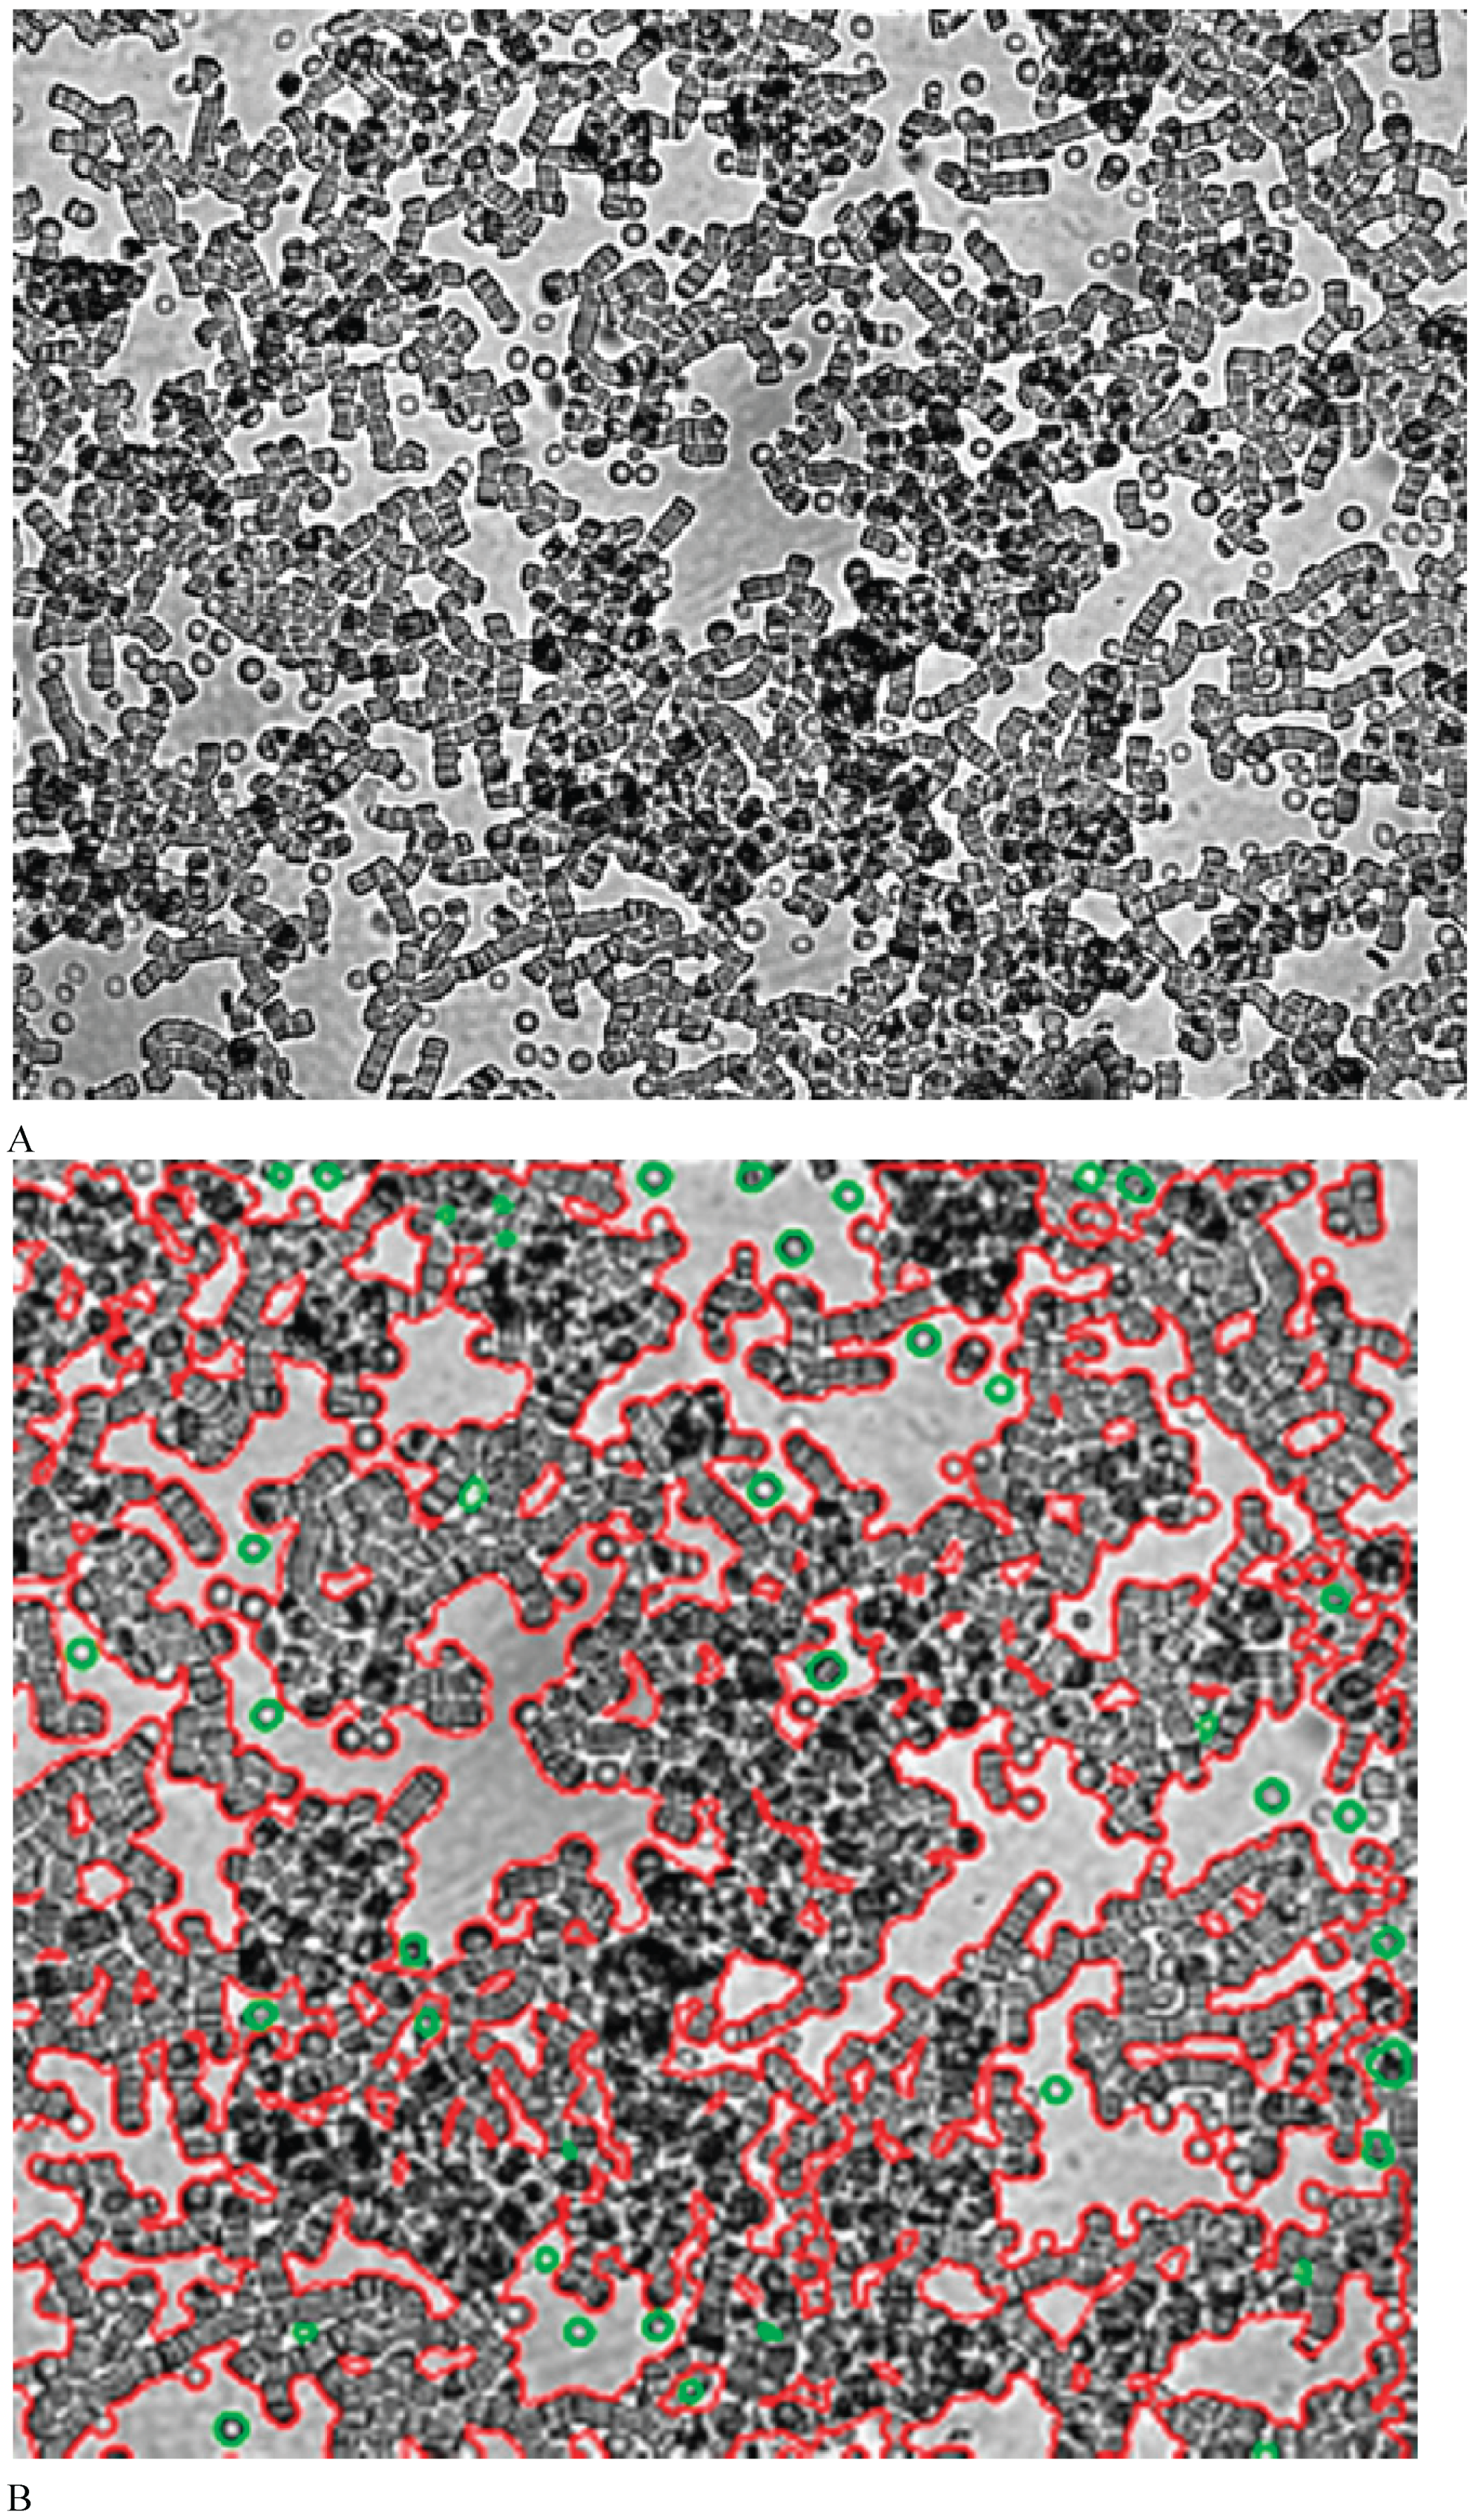
It was shown that in diabetic patients the degree RBC aggregation in autologous plasma increased. In contrast with rouleaux formed in healthy subjects, pathologic globular structures of RBC aggregates were observed in diabetic patients (Figure 2A). The indicator degree of aggregation of RBCs in a patient with type 2 diabetes mellitus was 12.17 ± 1.90 (p<0.05). The indicator of the degree of RBC aggregation in patients with diabetes mellitus increased 2-fold.
Conclusion
Thus, the study showed that the method of automated processing of images obtained using a light microscope makes it possible to measure the degree of RBC aggregation. This method can be widely used in clinical laboratories to measure the degree of aggregation of RBC aggregation in various pathological conditions of a person.
Fundings
The research did not receive any special grants from funding agencies in the public, commercial, or not - for - profit sectors.
Conflicts of Interests
The author declare that they have no known competing financial interests or personal relationships that could have appeared to influence the work reported in this paper.
Statement of Ethics
Ten healthy blood donors and fifteen diabetic patients gave written informed consent. The study protocol was approved by the Local Ethics Committee for Human Research at the Privolzhsky Research Medical University (Russia) (number of investigation 103) from 9/10/2025.
References
- G. Barshtein, R. Ben-Ami, S. Yedgar, Role of red blood cell flow behavior in hemodynamics and hemostasis, Expert Rev. Cardiovasc. Ther. 5 (2007) 743– 752. [CrossRef]
- Baskurt , H.J. Meiselman, Erythrocyte aggregation: basic aspects and clinical importance, Clin. Hemorheol. Microcirc. 53 (2013) 23-37. [CrossRef]
- M. Rampling , H.J. Meiselman, B. Neu, O.K. Baskurt, Influence of cell-specific factors on red blood cell aggregation, Biorheology 41 (2004) 91-112. [CrossRef]
- C. Le Devehat, M. Vimeux, G. Bondoux, A. Bertrand, Red blood cell aggregation and disaggregation in diabetes mellitus, Clin. Hemorheol. Microcirc. 9 (1989) 845-854. [CrossRef]
- R.B. Ami, G. Barshtein, D. Zeltser, Y. Goldberg, I. Shapira, A. Roth, G. Keren, H. Miller, V. Prochorov, A. Eldor, S. Berlinger, S. Yedgar, Parameters of red blood cell aggregation as correlates of the inflammatory state, Amer. J. Physiol. Heart Circ. Physiol. 280 (2001) H1982-H1988. [CrossRef]
- Ya.A. Sheremet'ev, A.N. Popovicheva, M.M. Rogozin, G.Ya. Levin, Red blood cell aggregation, disaggregation and aggregate morphology in autologous plasma and serum in diabetic foot disease, Clin. Hemorheol. Microcirc.72 (2019) 221-227. [CrossRef]
- H. Schmid-Schönbein, J. von Gosen, J.L. Klose, E. Volger, A counter-rotating rheoscope chamber for the study of the microrheology of blood cell aggregation by microscopic observation and microphotometry, Microvasc. Res. 6 (1973) 366-376. [CrossRef]
- Baskurt, M. Uyuklu, P. Ulker, M. Cengiz, N. Nemeth, T. Alexy, S. Shin , M.R. Hardeman, H.J. Meiselman, Comparison of three instruments for measuring red blood cell aggregation, Clin. Hemorheol. Microcirc. 43 (2009) 283-298. [CrossRef]
Figure 1.
Aggregation of RBCs healthy subjects in autologous plasma. Image before (A) and after (B) processing using computer vision algorithms. It shows aggregates of RBCs in red, and individual cells in green. Magnification 200x.
Figure 1.
Aggregation of RBCs healthy subjects in autologous plasma. Image before (A) and after (B) processing using computer vision algorithms. It shows aggregates of RBCs in red, and individual cells in green. Magnification 200x.
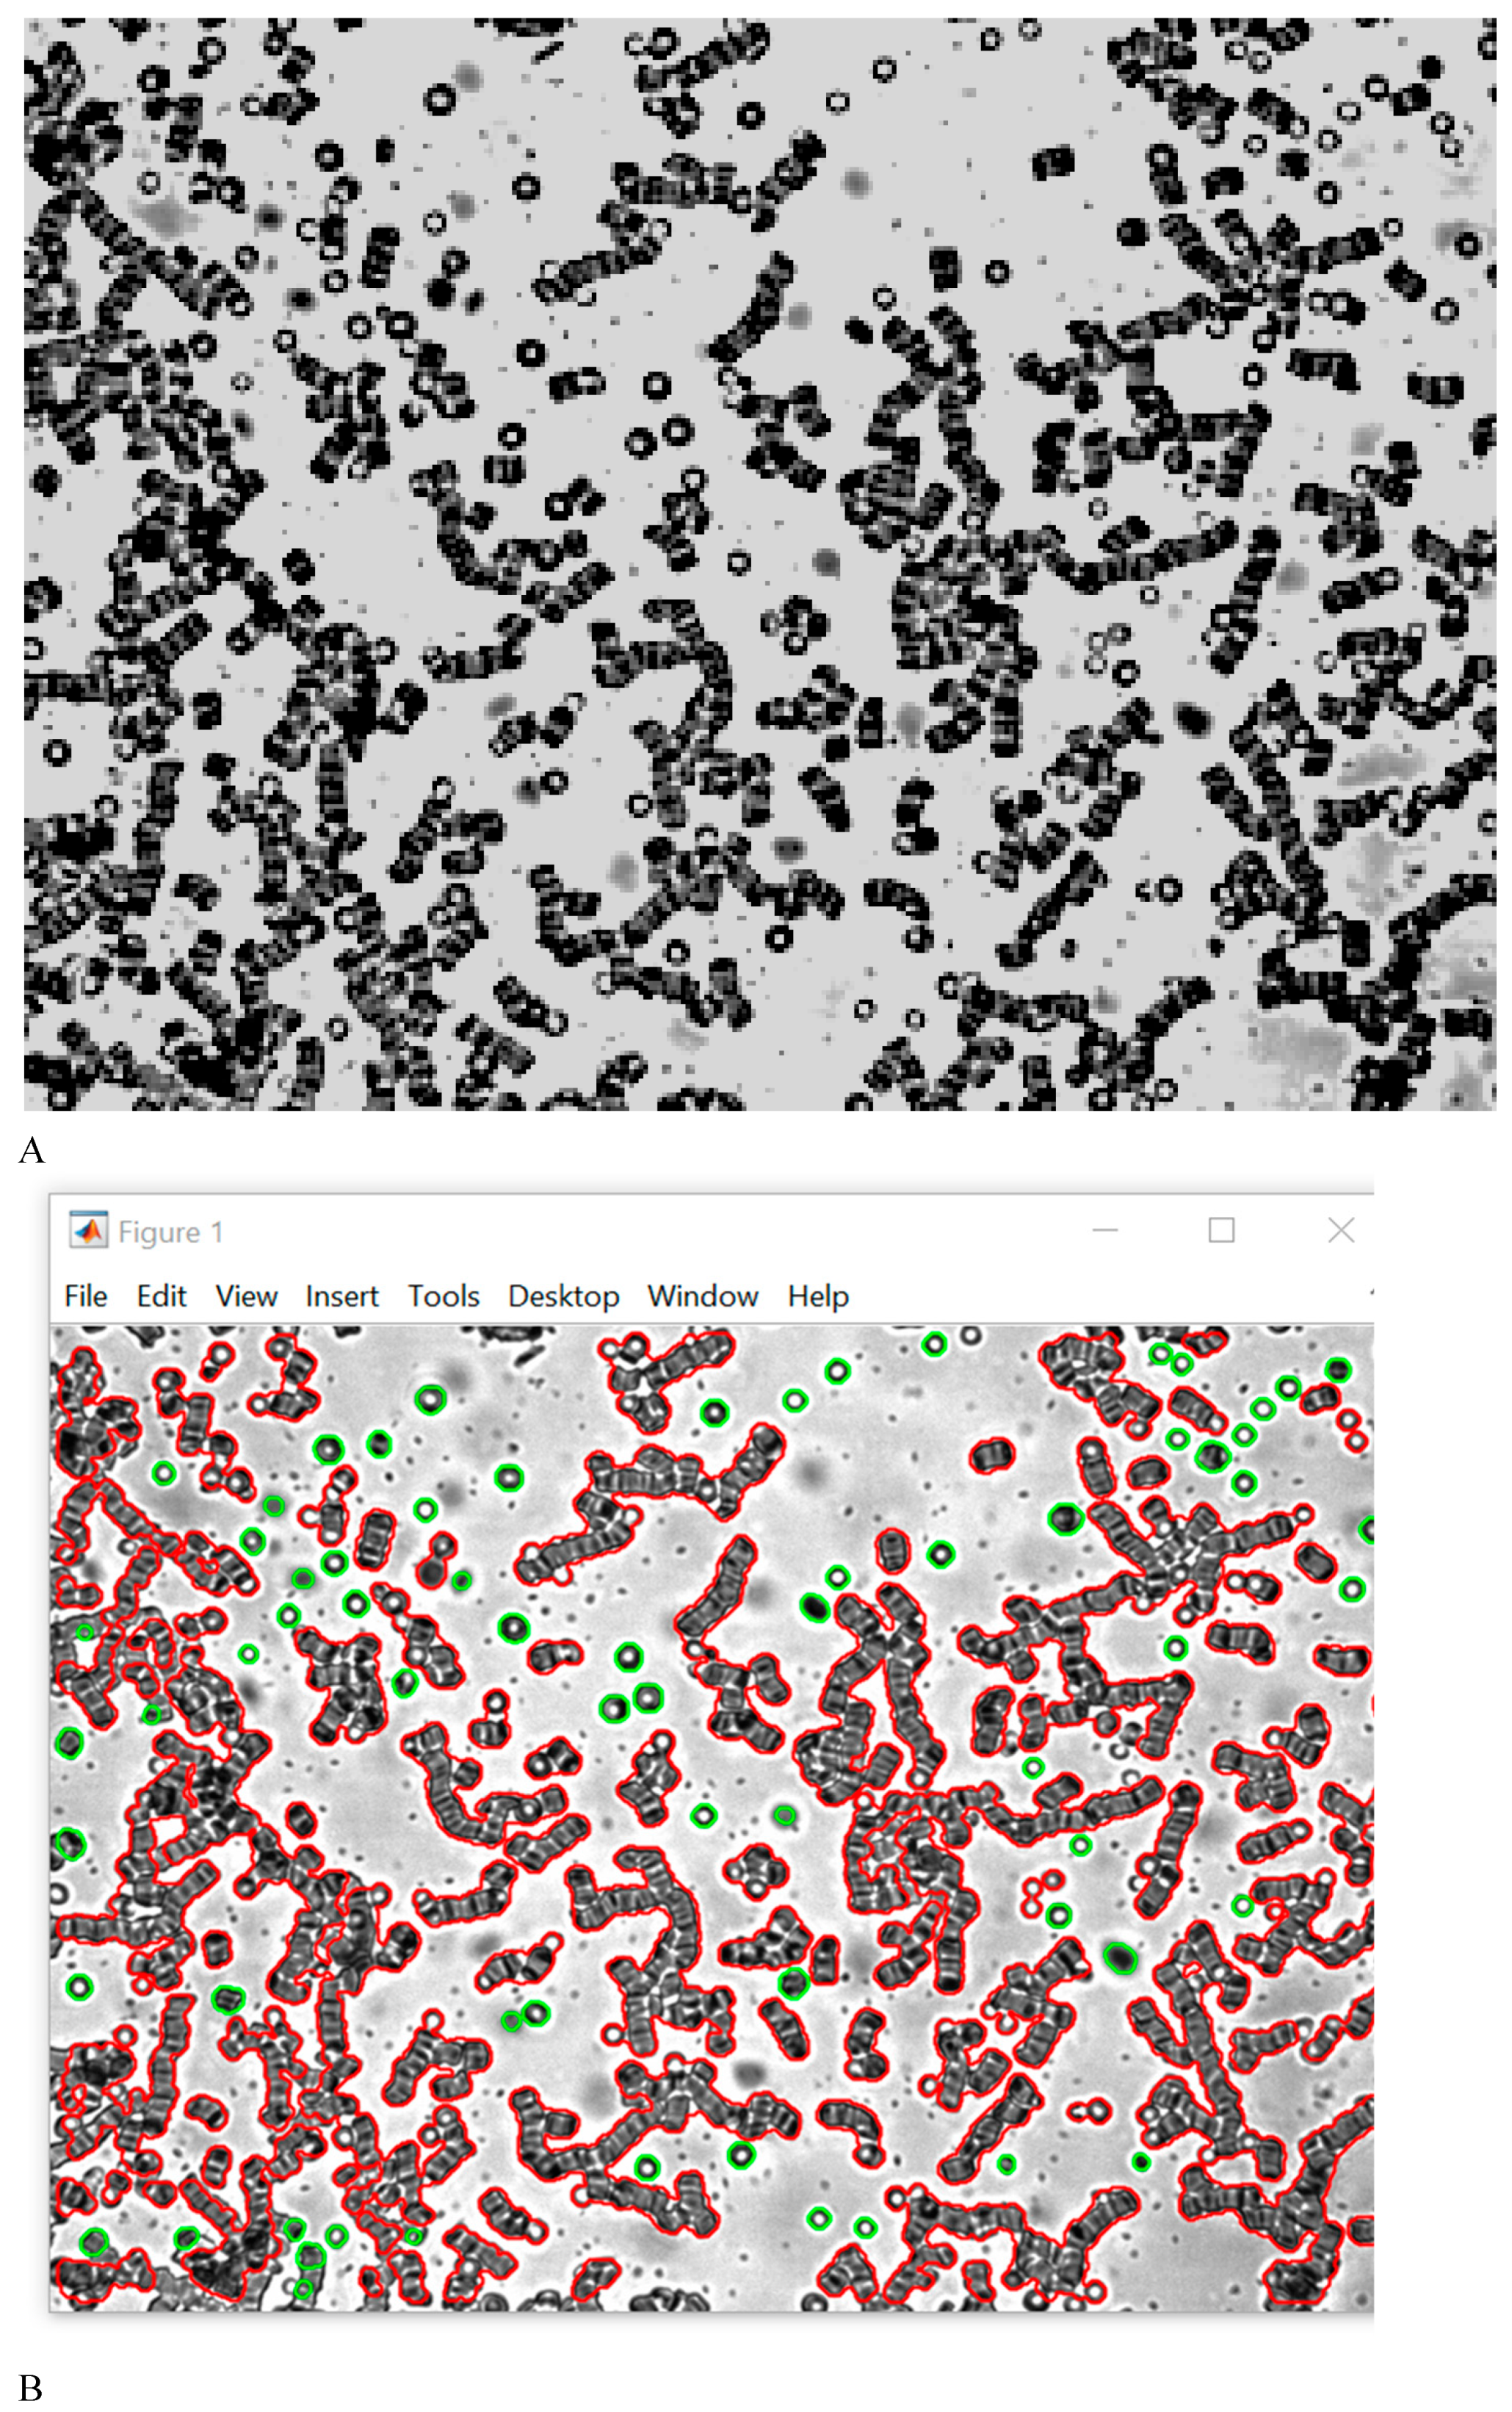
Figure 2.
Aggregation of RBC patients with diabetes in autologous plasma. Image before (A) and after (B) processing using computer vision algorithms. It shows aggregates of RBCs in red, and individual cells in green. Magnification 200x.
Figure 2.
Aggregation of RBC patients with diabetes in autologous plasma. Image before (A) and after (B) processing using computer vision algorithms. It shows aggregates of RBCs in red, and individual cells in green. Magnification 200x.
Disclaimer/Publisher’s Note: The statements, opinions and data contained in all publications are solely those of the individual author(s) and contributor(s) and not of MDPI and/or the editor(s). MDPI and/or the editor(s) disclaim responsibility for any injury to people or property resulting from any ideas, methods, instructions or products referred to in the content. |
© 2025 by the authors. Licensee MDPI, Basel, Switzerland. This article is an open access article distributed under the terms and conditions of the Creative Commons Attribution (CC BY) license (http://creativecommons.org/licenses/by/4.0/).
Copyright: This open access article is published under a Creative Commons CC BY 4.0 license, which permit the free download, distribution, and reuse, provided that the author and preprint are cited in any reuse.


