Submitted:
14 October 2025
Posted:
14 October 2025
You are already at the latest version
Abstract
Defects in pipes adversely affect both the jacking construction process and long-term operational safety, yet their specific impacts on mechanical properties remain unclear. This study investigates pipe jacking segments under deflection, using the Changsha Meixi Lake project as a case study. Similar model tests combined with digital image correlation were employed to examine the evolution of stress and deformation under various deflection angles and defect conditions. The reliability of the indoor test results is demonstrated using normalized parameters. The results indicate that stress distribution characteristics are jointly determined by the deflection mode and load. Co-directional deflection exhibits a more significant stress concentration effect; under identical load and angle conditions, it results in higher stress levels due to a superposi-tion effect, whereas diagonal deflection shows a weakening effect. Joint deformation progresses through three distinct stages: an initial linear strain-load relationship under stable deflection (load < 2 kN), followed by nonlinear strain growth with a slowing de-formation rate (2–4 kN), and finally a slow linear strain increment (load > 4 kN). In-creasing load and deflection angle significantly amplify axial deformation, particu-larly revealing a "thick-in-the-middle, thin-at-the-sides" compression characteristic in the 45° vault zones. Furthermore, segment defects markedly exacerbate stress non-uniformity. Defect angles ≥60° substantially increase the frequency and amplitude of compressive stress in the vault, accelerate the decay of tensile stress at the bottom, and critically reduce structural stability. These findings provide significant insights for deflection control and structural safety assessment in pipe jacking engineering.
Keywords:
pipe jacking
; model test
; segment deflection
; defect combination
; deformation and dis-placement
; characteristic stress
1. Introduction
Pipe jacking segments often experience deflection due to factors such as over excavation during construction, insufficient grouting, and significant axis deviation in soft-hard uneven composite strata [1,2]. The presence of such deflection leads to eccentric compression at the joint, which subsequently causes stress redistribution in the segment and stress concentration at the eccentric compression location. Ultimately, this may induce issues such as segment cracking, spalling, water leakage, and structural failure [3,4], all of which significantly reduce the safety and durability of the pipeline. Therefore, in-depth research on the influence of deflection on segment de-formation and displacement is of great significance for improving the design and construction quality of pipe jacking projects.
Currently, some achievements have been made domestically and internationally regarding tunnel deformation and stress problems. The main research methods include theoretical analysis [5,6,7,8], numerical analysis [9,10,11], and model tests [12,13,14]. In terms of theoretical calculation, Röhner et al. [15] analyzed the stress calculation method for segment joints in the European standard and concluded that the compression zone area, deflection angle, and segment length are key factors affecting joint stress. Zhang et al. [16] proposed a method for describing the reasonable arch axis based on the three-hinged arch theory, revealing the significant influence of pipe jacking burial depth and soil internal friction angle on the vertical load. Ye et al. [17] proposed a jacking force calculation method considering the thixotropy of slurry, which was based on the elastic theory of semi-infinite space cylindrical hole expansion. In terms of numerical analysis, Zhang et al. [18] used ABAQUS to simulate the influence of the pre-ceding pipe jacking on the jacking force of the subsequent pipe jacking and found that the preceding pipe jacking amplifies the side friction resistance of the subsequent pipe jacking. Huang [19] studied the influence of temperature changes on tunnel lining using numerical methods and concluded that temperature changes can cause lining deflection. Liu et al. [20] used numerical methods to study the construction process of steel pipe jacking and observed that the peak stress of the segments gradually increases with the increase of the jacking distance. Model testing, as a commonly used research method, can effectively highlight the main contradictions and accurately capture the internal connections of phenomena [21,22,23,24,25]. Liu et al. [26] studied the mechanical characteristics of concrete pipe jacking under deflection conditions through indoor model tests and found that the maximum tensile stress appears at the vault of the segment under a deflection angle of 1.5°. Liu et al. [27] obtained the internal force of the circumferential reinforcement in pipe jacking through field monitoring and re-ported that the circumferential stress of eccentrically compressed segments is con-trolled by the deflection angle and grouting pressure. Zhen et al. [28] analyzed the buckling deformation characteristics of deflected steel pipe jacking under jacking force through field tests on steel pipe jacking.
The aforementioned research provides a theoretical basis for the deformation analysis and stress characteristics of tunnels. However, based on the above analysis, it can be seen that existing research on segment stress mostly focuses on qualitative de-scription and lacks quantitative models. Moreover, less attention has been paid to the issue of diagonal deflection in segments. Particularly, the structural stress problem under segment defect conditions and defect combinations is seldom addressed. Under different deflection types, the deflection modes of segments vary, and the mechanical structural behavior becomes more complex, especially when segment defects are in-volved. Due to the existence of rotation angles at the pipe jacking segment joint, stress concentration is prone to occur, leading to failure problems such as cracking of the socket or spigot. The mechanical properties of segments obtained under different failure modes differ significantly.
In view of this, this paper establishes similar segment models with 4 different de-flection angles and 5 defect states. Using digital image correlation technology, it systematically analyzes the characteristic stress and evolution characteristics of segments under deflection and compares the distribution patterns of segment stress nephograms under different deflection angles. This paper is structured as follows: Chapter 1 intro-duces the research background. Chapter 2 presents the project overview. Chapter 3 describes the test setup and procedure. Chapter 4 elaborates on the test results and discussion. Chapter 5 provides the summary and conclusions. The research results help to understand the occurrence and response mechanism of pipe jacking deflection, thereby providing a reference for pipe jacking construction and attitude control.
2. Project Overview
The construction area of the Changsha Meixi Lake pipe jacking project is located on YingRi Road, Changsha City, in northern Hunan Province, China, as shown in Figure 1. The monitored section of the pipe jacking has a drive length of 78 meters. The burial depth of the pipe jacking ranges from 6.49 to 6.79 meters. A single segment is 3.0 meters long.
The inner diameter of the segment is 1800 mm. The outer diameter of the segment is 2200 mm. The wall thickness of the segment is 200 mm. The geological strata in the project area are complex and interwoven.
The segments were manufactured using C35 ordinary Portland cement, which has a uniaxial compressive strength of 23.4 MPa. Although the axial compressive strength of the segments is high, cracking, defects and damage occurred on the outer wall of the segments during the initial jacking stage. Shortly after the pipe jacking entered the composite stratum, damage problems appeared on the inner wall of the segments, as shown in Figure 2. Preliminary field investigation concluded that the morphological deflection of the pipeline during loading led to an increase in local stress within the segments. Tensile or compressive stresses on the inner and outer walls of the pipeline exceeded the design stress values. This ultimately led to spalling of the side walls. Therefore, research on the stress response characteristics of segments under conditions of pipe jacking deflection and defects was carried out.
3. Test System and Scheme
3.1. Test Setup
Based on the actual field project, an indoor test system was designed. The indoor model test system for pipe jacking is shown in Figure 3, which includes a model box, a loading system, a measurement system, and a data processing system. The model box dimensions are: length × width × height (1.6m × 0.85m × 0.75m). The top is open, and the sides have reserved holes for applying load to the segments. The loading system includes loading plates, expansion cables, and a self-developed load control machine. The measurement system includes strain gauges, dial indicators, a static strain instrument (DH3818Y), speckle standard points, high-speed cameras, etc. The data processing system includes a Donghua strain recorder, an Ncorr system, etc. The load was set to 6 levels, with each level increasing by 1 kN. Each load level was maintained steadily for 3 minutes. The load was applied to the segments evenly and in steps.
To clarify the influence of the relative contact relationship between segments and the loading conditions on the axial mechanical behavior of the pipe jacking, this paper designed indoor model tests related to the pipe jacking deflection angle. The main physical quantities in the model tests include geometric dimensions l, unit weight γ, elastic modulus E, Poisson’s ratio μ, deflection angle φ, stress σ, and strain ε. The gravitational acceleration is the same for the model tests and the prototype tests. Using dimensional analysis and the second theorem of similarity theory, the relationships between the similarity ratios of each physical parameter were finally obtained as follows: geometric similarity ratio Cl=10; unit weight similarity ratio Cγ=1; similarity ratios for Poisson’s ratio, strain, and deflection angle Cμ=Cε=Cφ=1; similarity ratios for elastic modulus and stress CE=Cσ=10. Acrylic tubes were selected as the model material for the tests. The elastic modulus of the acrylic tube segments, measured through indoor compression tests, is E = 2500 MPa.
3.2. Deflection Test Scheme
3.2.1. Segment Deflection Simulation Test
The segment deflection angle is simulated through the relative displacement between segments. The distance between the jack and the socket end of the segment is l. The relative deflection angle of the segments is φ, the misalignment height of the jack is ΔH. The relationship between these three parameters is shown in Formula (1).
ΔH=l sin(φ/2),
In Formula (1): l is the distance from the segment socket end to the jack; ΔH is the jack thrust distance; φ is the relative deflection angle of the segments.
3.2.2. Monitoring Point Layout
Five strain monitoring sections were arranged along the model axis, at the middle and ends of the segments, as shown in Figure 4. The deformation monitoring point for Joint 1-2 is named DS1. The deformation monitoring point for Joint 2-3 is named DS2. Inside the segment joint socket, two monitoring sections were arranged along the circumference at 45° intervals. Each monitoring section has a total of 8 measurement points. They are named clockwise from the vault as C1 to C8 and C9 to C16. Three monitoring sections were arranged along the circumference at the middle of the segment at 45° intervals. Each section has 8 measurement points. They are named clockwise from the vault as G1 to G8, G9 to G16, and G17 to G24.
Strain gauges inside the test segments were arranged along the direction of the applied load. They were connected to a static strain instrument. Axial strain during the jacking process was collected in real-time. Segment stress was obtained through conversion. To better reflect the segment deflection mode, three test segments were used in the model test to simulate pipe jacking deflection. Two types of deflection modes were set in the test: diagonal deflection and co-directional deflection. The load was applied to the socket end face of Segment #3. The test segments were installed sequentially by spigot-and-socket joint. Deflection jacks were installed at the bottom or right side of Segment #2 and Segment #3. This simulated the pipe jacking deflection phenomenon under complex contact conditions. The applied deflection angles and load levels are shown in Table 1.
3.3. Deformation Test Scheme
To study the deformation characteristics of pipe jacking joints, DIC and virtual extensometer technology were used to analyze the surface strain field during the deformation process of pipe jacking joints. This allows for a quantitative calculation and analysis of the non-uniform strain response characteristics of the segment joints. DIC technology was used to analyze the real-time strain field of the pipe jacking segments. The basic principle is as follows: a rectangular reference subset of size (2M+1)×(2N+1) is selected with as the center point. The calculation formula is as shown in Equations (2) to (3). The center point of the target subset is obtained by searching for the maximum value of the correlation function. By comparing the positional changes of the image subsets before and after deformation, the displacement and strain information of each point is obtained. The calculation program used in this paper is Ncorr [29,30]. A virtual extensometer [31] is an optical measurement analysis method based on DIC technology. It calculates the deformation amount by arranging symmetrical measurement points on both sides of a crack, as shown in Figure 5.
In the formula, , are the coordinates before deformation, and , are the coordinates of any point in the subset after deformation. , represent the coordinate differences of any point in the and directions before and after deformation. , are the displacement components in the shape parameter vector. ,, and are the displacement gradients of and in the and directions, respectively.
After the segment is subjected to force, the deformation characteristics of the segment joints can directly reflect the force-deformation behavior during the pipe jacking construction process. Therefore, a quarter of the segment length was selected to conduct the segment joint deformation test. First, a white primer was evenly sprayed on the outer wall of the segment. Then, a marker pen was used to arrange speckles on the segment. Next, the segments were installed sequentially, and the image capture device was set up for photography. Finally, DIC digital image technology was used to process the test images.
3.4. Segment Defect Test Scheme
To investigate the influence of pipeline damage on the longitudinal mechanical behavior of the structure, a segment defect test was designed and conducted, as shown in Figure 6. First, segments were cut to create defects. The defect length was 5 cm. The defect width increased in increments of 15°. For single defects, the defect angles were 30°, 45°, 60°, 75°, and 90°. For double defect combinations, the defect angle was set to 90°, combined with 30°, 45°, 60°, 75°, and 90°. Then, monitoring points were arranged and the segments were connected. Finally, graded loading was applied to the defective segments, and stress testing was conducted to obtain the stress variations under different working conditions.

Table 2.
Test condition settings for segment deflection.
| Test Condition | Angle/° | Defect Location | |||||
|---|---|---|---|---|---|---|---|
| Single Defect Angle | 30 | 45 | 60 | 75 | 90 | Vault | |
| Combined Defect Angle | 90 | 90 | 90 | 90 | 90 | Vault & | |
| 30 | 45 | 60 | 75 | 90 | Bottom | ||
4. Analysis of Test Results
4.1. Characteristics of Segment Stress and Deformation Fields
4.1.1. Co-directional Deflection and Axial Stress Response
The polar coordinate diagram of the segment joint under co-directional deflection is shown in Figure 7. In the figure, a negative axial stress indicates the segment is under compression, while a positive axial strain indicates the segment is under tension. Under co-directional deflection, the pipeline exhibits significant horizontal eccentric compression and a relatively low vertical stress level. As the deflection angle and load level increase, the axial stress also increases correspondingly. The stress diagram shows a “horizontal cone” shape. When the deflection angle increases from 1.5° to 2°, the stress on the far-left side increases abruptly. The reason for this phenomenon is the mutual extrusion at the right joint of the segment after deflection and the direct action of the load on the joint measurement points, which causes local compressive deformation.
4.1.2. Diagonal Deflection and Axial Stress Response
The variation law of axial stress at the mid-span of the segment under diagonal deflection is shown in Figure 8. During the test, the diagonal deflection direction was set vertically. Under diagonal deflection, sections 1-1 and 2-2 exhibited opposite stress concentration effects. Both were symmetrically distributed along the 90°~270° axis. When the deflection angle was constant, the axial stress increased with the load level. When the load level was constant, the axial stress increased with the deflection angle. Specifically, the 45°~135° range of Segment #1 was the eccentric compression zone.
The 225°~315° range of Segment #2 was the eccentric compression zone. The strain level in Segment #2 was higher than that in Segment #1. The reason for this phenomenon is that after loading, the restraint from the joint caused the deflection angle φ12 between Segment #1 and Segment #2 to be smaller than the deflection angle φ23 between Segment #2 and Segment #3. Comparing the stress conditions under the same load level, the stress level for diagonal deflection is less than that for co-directional deflection. For example, when the deflection angle is 2° and the load is 6 kN, the compressive stress under co-directional deflection at the 270° position of section 2-2 is 131.8% of that under diagonal deflection. The compressive stress under co-directional deflection at the 315° position of section 2-2 is 134% of that under diagonal deflection. It is speculated that the reason for this phenomenon is that the deflection angles in co-directional deflection are on the same side, while in diagonal deflection they are on opposite sides. At the 1-2 and 2-3 sections, the co-directional deflection has two superimposed effects, whereas the diagonal deflection has mutually weakening effects.
4.2. Joint Deformation Characteristics
To obtain the deformation law of the pipeline joint, DIC was used to investigate the deformation law of the segment joint after deflection. The deformation stages of the segment deflection angle during the loading process are shown in Figure 9. Observation revealed that the preset deflection angle gradually decreased as the load level increased during loading. To clarify the influence of the decreasing deflection angle on segment stress during loading, the axial deformation at the midpoint of the compression zone of the Segment #2 joint was selected for analysis. As the load level increased, the segment deformation rate initially increased and then tended to stabilize. As shown in Figure 9, as the load level increases, the contact pressure at the vault of the joint continuously increases, leading to an increase in deformation strain. In the initial stage (load < 2 kN), the segment deflection angle does not change, and the strain increment is linearly related to the load. In the deflection angle change stage (load < 4 kN), the rate of strain increase slows down, and the strain increment exhibits more nonlinear deformation. When entering the slow growth stage (load > 4 kN), the strain increment slowly increases linearly with the load.
The cloud diagram of the deformation displacement field distribution of the segment joint is shown in Figure 10. Taking the midpoint of the segment joint gap as the coordinate origin and the loading direction as the positive direction, compression deformation of the segment is negative and elongation is positive. The stress nephograms at the loading stages of 1 kN, 3 kN, and 6 kN for deflection angles of 0.5°~2° were selected for analysis. The overall axial deformation of the joint increases with the load level and deflection angle. In the diagram, significant compression deformation occurs in the vault left and right 45° areas of the segment joint. The deformation nephogram of this area in the horizontal direction shows a characteristic of being “thick in the middle and thin on both sides”. When the deflection angles are 0.5° and 1°, an increase in load level does not change the stress distribution of the joint. When the deflection angles are 1.5° and 2°, an increase in load level reduces the stress difference between the segment joints. Taking a deflection angle of 0.5° as an example, as the load increases, the compressive stress distribution at the joint does not change significantly, but the displacement degree intensifies. The maximum deformation value and the strain change gradient both increase, and the radiation area of strain concentration expands. When the deflection angle is 0.5° and the jacking force is 6 kN, the force transmission from the end of Segment #2 to the end of Segment #1 causes its average axial strain to decay by 72.6%. When the deflection angle is 2° and the jacking force is 6 kN, the axial strain decay from the end of Segment #2 to the end of Segment #1 is only 36%. This shows that the increase in the deflection angle changes the contact mode of the joint, and the force transmission path at the vault of the joint becomes more significant.
4.3. Axial Stress Response Induced by Defects
4.3.1. Mechanical Characteristics under Single Defect Conditions
Under the condition of no defect in the segment, as shown in Figure 11 (a) and (b), an axial uniformly distributed load is applied. The entire segment is under compression. As the load gradually increases, the segment strain increases in a step-like pattern. From the perspective of vault stress (curves U-1, U-4, U-8, U-12, U-16, U-20, U-22), the overall stress is predominantly compressive, with mostly negative strain values. As the load increases from 1 kN to 6 kN, the absolute value of the compressive stress shows a significant upward trend. In the initial loading stage (small distance/time step range), the stress exhibits some fluctuations but gradually stabilizes as the distance increases. The stress stratification corresponding to different loads is clear: the greater the load, the higher the compressive stress level at the vault. The vault stress distribution appears relatively gentle overall, showing a compressive state with a strain peak at point 20. The bottom stress (curves D-1, D-4, D-8, D-12, D-16, D-20, D-22) also increases with the load, but the increase is not as significant as the load level rises. D-22 shows a trend of first increasing, then decreasing, and then increasing again, exhibiting an alternation between tensile and compressive stress.
With a 30° defect at the bottom, as shown in Figure 11 (c) and (d), the vault stress remains predominantly compressive with mostly negative strain values. However, compared to the 0° defect condition, under the same load level, the absolute value of the compressive stress decreases, and the stress distribution becomes less uniform, showing more pronounced local fluctuations. As the load increases from 1 kN to 6 kN, the absolute value of the compressive stress shows an increasing trend, but under larger loads (e.g., 5 kN, 6 kN), the fluctuation range expands. This indicates that the 30° defect disturbs the transmission and distribution of the vault compressive stress. Tensile stress appears at the bottom. Compared to the 0° defect, the 30° defect alters the growth rate and distribution pattern of the bottom tensile stress, exhibiting more significant non-uniformity under load. Particularly when the load reaches a certain level (e.g., 6 kN), the D-22 curve shows an abrupt stress change, indicating that the 30° defect reduces the stability of the bottom stress and increases the risk of stress concentration.
With a 45° defect at the bottom, as shown in Figure 11 (e) and (f), the distribution of vault compressive stress exhibits more complex variations compared to the 0° and 30° defect conditions. As the load increases from 1 kN to 6 kN, the absolute value of the compressive stress increases significantly. Within specific distance intervals, obvious stress peaks appear (e.g., near a distance of about 40 cm, the stress curves under various loads show prominent peaks). This indicates that the 45° defect alters the transmission path of the vault compressive stress, making the local stress concentration more significant. Compared to the 0° and 30° defects, the 45° defect accelerates the decay rate of the bottom tensile stress. As the distance increases, the absolute value of the tensile stress shows a rapid decreasing trend, which is more pronounced under larger loads (e.g., 6 kN). This reflects that the 45° defect significantly weakens the bearing capacity against tensile stress at the bottom, further reducing its stability.
With a 60° defect at the bottom, as shown in Figure 11 (i) and (j), the distribution and variation trend of the vault compressive stress differ significantly from the 45° defect condition. As the load increases from 1 kN to 6 kN, the absolute value of the compressive stress continues to increase. In the distance range of approximately 20-40 cm, stress peaks occur more frequently and with higher amplitudes (e.g., under a 6 kN load, the stress peak is close to 10 MPa). This indicates that the 60° defect further alters the transmission path of the vault compressive stress, making the local stress concentration more prominent and intensifying the degree of compression at the vault. Compared to the 45° defect, the 60° defect makes the distribution of the bottom tensile stress more dispersed, and the overall level of tensile stress further decreases. As the distance increases, the tensile stress shows a continuous decreasing trend. Under larger loads (e.g., 6 kN), some curves even show signs of tensile stress transitioning to compressive stress. This reflects that the 60° defect further weakens the tensile stress bearing capacity at the bottom, substantially decreasing its stability.
With a 75° defect at the bottom, as shown in Figure 11 (k) and (l), the uniformity of the vault compressive stress distribution is further reduced, and the range of stress fluctuations is larger compared to the 60° defect condition. As the load increases from 1 kN to 6 kN, the absolute value of the compressive stress continues to increase. In the initial loading stage, more significant abrupt stress changes occur (e.g., in the initial distance segment, the stress curves show obvious drops and recoveries). This indicates that the 75° defect causes stronger disturbance to the transmission of the vault compressive stress, with local stress concentration and fluctuation effects superimposed, significantly reducing the stability of the vault stress. Compared to the 60° defect, the 75° defect intensifies the decay trend of the bottom tensile stress. As the distance increases, the absolute value of the tensile stress decreases rapidly. Under larger loads (e.g., 6 kN), the tensile stress almost approaches zero, with compressive stress appearing in some areas. This reflects that the 75° defect has a very significant weakening effect on the tensile stress bearing capacity; the bottom can hardly effectively bear tensile stress, and the stress state is extremely unstable.
With a 90° defect at the bottom, as shown in Figure 11 (m) and (n), the distribution of the vault compressive stress shows extreme non-uniformity, with stress fluctuations and concentration phenomena reaching a considerable degree compared to the 75° defect condition. As the load increases from 1 kN to 6 kN, the absolute value of the compressive stress continues to increase. In the distance range of approximately 40-60 cm, extremely prominent stress peaks appear. This indicates that the 90° defect fundamentally changes the transmission path of the vault compressive stress. The local stress concentration is extremely significant, and the degree of compressive stress concentration at the vault already poses a serious threat to structural safety. The situation of the bottom stress is completely different from previous defect conditions where tensile stress was dominant. As the load increases from 1 kN to 6 kN, the absolute value of the bottom compressive stress increases significantly. Near a distance of about 20 cm under the 6 kN load, a clear compressive stress peak of -40 MPa appears. This reflects that the 90° defect fundamentally alters the nature of the stress at the bottom. For example, the stress at position D-4 transitions from being compressive stress-dominated to tensile stress-dominated. The stress state at the bottom is completely unbalanced, and the stability and rationality of the structural stress are severely compromised.
4.3.2. Mechanical Characteristics of Segments Under Combined Vault and Bottom Defects
The structural variation characteristics under the combined 90° bottom and 30° vault defects are shown in Figure 12 (a) and (b). For the vault stress of segment #2, the strain at different positions exhibits phase variations with the time step, fluctuating within a certain range. The variation trends and amplitudes differ among the curves. The stress distribution along the segment length is relatively uniform, with peak stresses occurring at 15 cm and 55 cm from the interface. The bottom strain-time step curve of segment #2 shows that the strain at positions D-1 and D-4 also displays phase characteristics. Compared to the vault, the bottom stress exhibits a more regular symmetrical distribution. At this time, position D-8 remains unaffected by the load, in a zero-stress state during loading. The maximum tensile stress occurs 40 cm from the segment interface, reaching 3.5 MPa.
The structural responses under the combined 90° bottom and 45° vault defects are shown in Figure 12 (c) and (d). Under this defect combination, the strain and stress responses at the vault and bottom of segment #2 exhibit specific patterns. The vault strain shows distinct phase variations with the time step, and the strain curves at different monitoring positions (e.g., U-1, U-4) differ significantly, reflecting the complexity of the structural mechanical behavior. The embedded stress-distance subplot indicates that the stress distribution along the segment length varies under different loads (1 kN, 2 kN, etc.). As the load increases, the stress variation amplitude becomes more significant, demonstrating the sensitivity of the vault’s stress response to the load. The combination of defects also results in a non-uniform stress distribution. The bottom strain of the segment also changes in phases with the time step; however, its value range and variation trend differ from those at the vault, indicating a different deformation mechanism due to its position and interaction with the defects. The stress-distance subplot shows a unique bottom stress distribution under different loads, with significant stress peaks at specific distances, which is closely related to the combined effect of the defects and the load.
The structural responses under the combined 90° bottom and 60° vault defects are shown in Figure 12 (e) and (f). The vault strain of segment #2 exhibits phase variations with the time step, with significant differences at various positions. The diverse shapes of the strain curves (e.g., U-1, U-4) reflect the complexity of the mechanical state at the vault. The stress-distance subplot shows that the stress distribution along the segment length varies with the load (1 kN, 2 kN, etc.). Increased load intensifies the changes in stress peaks and valleys, indicating the sensitivity of the vault’s stress response. The combination of a 60° vault and a 90° bottom defect leads to prominent stress non-uniformity. The bottom strain also changes in phases, but its value range and variation trend are distinctly different from the vault’s, reflecting a different deformation mechanism influenced by its position and interaction with the defects. The stress-distance subplot reveals a unique bottom stress distribution under different loads, with significant stress peaks in specific intervals, resulting from the combined action of the defects and the load.
The structural responses under the combined 90° bottom and 75° vault defects are shown in Figure 12 (i) and (j). Under this condition, the vault strain of segment #2 shows distinct phase variations and significant differences across monitoring positions (e.g., U-1, U-4) as the time step increases, reflecting a complex mechanical state. The stress-distance subplot indicates that the stress distribution along the segment length differs considerably under different loads (1 kN, 2 kN, etc.). Stress peaks and valleys change more intensely with increasing load, highlighting the high sensitivity of the vault’s structural stress response. The combination of defects causes more intense stress non-uniformity. The bottom strain also exhibits phase variations, but its value range and trend are distinctly different from the vault’s, demonstrating a significantly different deformation mechanism due to its position and interaction with the defects.
The structural responses under the combined 90° bottom and 90° vault defects are shown in Figure 12 (k) and (l). When both the bottom and vault have 90° defects, the mechanical response of segment #2 exhibits unique patterns. The vault strain shows obvious phase variations and significant differences across positions (e.g., U-1, U-4) as the time step increases. The strain curves have various shapes, fluctuating within a certain range with large amplitudes at some positions, reflecting the complexity of the mechanical behavior under this symmetric defect combination. The stress-distance subplot shows that the stress distribution along the segment length differs significantly under different loads (1 kN, 2 kN, etc.). Stress fluctuations and changes become more pronounced with increasing load, indicating that the vault’s stress response is extremely sensitive to the load magnitude. The dual 90° defects result in a unique non-uniform stress distribution, with quite prominent fluctuations and changes in specific distance intervals. The bottom strain also changes in phases, but its value range and variation trend are distinctly different from the vault’s, reflecting a significantly different deformation mechanism due to its position, interaction with defects, and differences in load transfer paths. The stress-distance subplot shows a unique bottom stress distribution under different loads, with significant stress peaks in specific intervals. As the load increases, the peak amplitude and distribution pattern of the stress continuously change, indicating that the stress bearing and transfer characteristics of the bottom structure under this defect combination are relatively complex.
5. Discussion
The typical stress characteristic curve is shown in Figure 13. From the perspective of stress changes, the stresses at different monitoring locations exhibit complex spatiotemporal similarity variation characteristics. For example, the stress at the top location reached -10.18 MPa during the initial construction period (approximately 10.0 days), and subsequently exhibited stress peaks at different time points (such as 13.5 days, 17.0 days, 20.5 days, etc.), among which around 13.5 days the stress dropped to -13.12 MPa, after which it fluctuated and recovered; the stress at the right-1 location also showed significant fluctuations at different time points, such as approximately 1.35 MPa around 12 days and 2.31 MPa around 17 days.
To compare the differences in stress response between field test results and laboratory test results, denormalization (Equation 4) analysis was adopted to reflect the variations of the test results and laboratory tests with load levels.
In the formula, is the load level, is the cross-sectional area of pipe, is the stress level.
The analysis of normalization results is shown in Figure 14. The normalization values range from -1 to 2.5. The normalized values of the monitoring results exhibit significant fluctuations. This reflects the complexity of field testing and the diversity of influencing factors. Both co-directional deflection and diagonal deflection remain in a relatively stable state. Their variation range is small. This to some extent reflects the reliability and repeatability of the processed laboratory test results. However, the development trends of diagonal deflection and co-directional deflection differ. Diagonal deflection tends to approach zero as the deflection angle increases. In contrast, co-directional deflection shows a trend of moving away from zero. This indicates that more stringent control methods should be adopted after the occurrence of co-directional deflection. This avoids the expansion of this unstable trend.
6. Conclusions
A simplified indoor model test was conducted to address the issues of pipe jacking deflection and defects. The influence of segment deflection and segment defects on the structural mechanical characteristics was investigated. The main research conclusions are as follows:
(1) The stress distribution in segments is governed by the combined effect of deflection mode and jacking force, with more pronounced stress concentration under co-directional deflection. Segment stress response strongly correlates with deflection mode, angle, and load magnitude. Co-directional deflection induces a horizontal cone-shaped stress distribution with notable eccentric compression, whereas diagonal deflection generates symmetric stress concentrations along the 90°–270° axis. Co-directional deflection yields higher stress due to effect superposition at sections 1–2 and 2–3, unlike the weakening effect under diagonal deflection.
(2) Segment joint deformation exhibits a three-stage evolution under loading, modulated by deflection angle and load. DIC and virtual extensometer data reveal: initial linear strain-load relation below 2 kN; nonlinear strain growth from 2–4 kN with slowed deformation; and post-4 kN linear but slow strain increase. Increased load and deflection angle amplify axial joint deformation, producing a “thick-middle, thin-edge” compression profile near the vault. Deflection angle critically influences force transfer efficiency.
(3) Segment defects—single or combined—aggravate stress non-uniformity, with defect angle and configuration dictating the stress state and stability. Single defects reduce vault stress uniformity and intensify local stress fluctuations and concentrations. For defect angles ≥60°, vault compressive peaks rise sharply and tensile stress at the bottom decays rapidly, impairing stability. Combined defects involving 90° bottom and varying vault angles produce distinct stress patterns; vault defects ≥45° exacerbate stress non-uniformity and peak-valley divergence across loads.
This study focused on segment behavior under deflection without considering soil-structure interaction. Future work should address structural performance under geotechnical-structural coupling.
Author Contributions
Conceptualization, Z.L. and X.Z.; methodology, Y.Z.; software, J.C.; validation, Z.L., J.C. and H.W.; formal analysis, Z.L.; investigation, J.C.; resources, Y.Z.; data curation, H.W.; writing—original draft preparation, Z.L.; X.Z.; H.W. and J.C.; writing—review and editing, Z.L.; Y.Z.; J.C.; visualization, H. W.; supervision, Y.Z.; project administration, Y.Z.; funding acquisition, Y.Z. All authors have read and agreed to the published version of the manuscript.
Funding
This research was funded by Southwest Municipal Engineering Design & Research Institute of China Limited Project (2023GH-JSHZ-01).
Data Availability Statement
Dataset available on request from the authors
Acknowledgments
This research was funded by Southwest Municipal Engineering Design & Research Institute of China Limited Project ( 2023GH-JSHZ-01).
Conflicts of Interest
The authors declare no conflicts of interest.
References
- Li, B.; Wang, F.; Fang, H.; Yang, K.; Zhang, X.; Ji,Y.; Experimental and numerical study on polymer grouting pretreatment technology in void and corroded concrete pipes. Tunn Undergr Sp Tech. 2021, 113: 103842. [CrossRef]
- Luo, Z.; Zhang, Y.; Chen, J.; Ou,X.; Zhang, X. Stress and deformation response of pipe jacking in upper-soft and lower-hard strata: A case study in Changsha. Eng Fail Anal. 2024: 108879. [CrossRef]
- Zhou, H.; Huang, S.; Ma, B.; Zhao,Y.;Tan,X.; Zhang, H. Prestressed steel wires impact on axial bearing capacity of ultra-large section jacking prestressed concrete cylinder pipe (JPCCP): Field experiment and simulation. Eng Fail Anal. 2025, 167: 109046. [CrossRef]
- Zhang, X.; Fang, H.; Hu, Q.; Ma,B.; Hu, S.; Du, M.; Yang, K.; Li, B.; Shi, M. Mechanical performance of corroded reinforced concrete pipelines rehabilitated with sprayed-on cementitious liners subjected to combined loads. Tunn Under Gr Sp Tech. 2022, 120: 104266. [CrossRef]
- Liu, W.; Tan, J.; Shi, J.; Huang, W. A Method for calculating jacking force of parallel pipes considering Soil Arching Effect and Pipe-Slurry-Soil Interaction. Comput Geotech. 2024, 173: 106528. [CrossRef]
- Ma, P.; Shimada, H.; Sasaoka, T.; Hamanaka, A.; Moses, D.; Dintwe, T.; Matsumoto, F.; Ma, B.; Huang, S. A new method for predicting the friction resistance in rectangular pipe-jacking. Tunn Under Gr Sp Tech. 2022, 123: 104338. [CrossRef]
- Qian, D.; Jiao, H.; Li, Z.; Zhu, Y.; Liu, J.; Chen, Z. Ground settlement law, jacking force prediction, and control countermeasures for large-section rectangular pipe jacking of national highway underpass. Sustainability. 2023, 15(17): 12888. [CrossRef]
- Yang, X.; Xiao, Y.; Li, Y.; Chen, J. Calculation method of the earth pressure for parallel pipe jacking with small spacing. J Eng Sci. 2021, 43(10): 1376-1384. [CrossRef]
- Feng, X.; Hu, J.; Zhou, J.; Zhang, S.; Wang,Y. Hydrothermal Coupling Analysis of Frozen Soil Temperature Field in Stage of Pipe Roof Freezing Method. Sustainability, 2025, 17(2): 620. [CrossRef]
- Lu, D.; Zhang, F.; Dong, H.; et al.; Study on ground instability modes and formation mechanisms induced by tunnel excavation using the RPM method. J Basic Sci Eng. 2024, 32(04): 926-943. [CrossRef]
- Zhao, Z.; Shao, G.; Stability analysis of wall stability of steel pipe in pipe-jacking and optimization of proper wall thickness. Chin. J. Underground Space Eng. 2011, 44(4): 481-486.
- Wei, G.; Zhang, S.; Yu, J.; Ding, Z.; Cui, Y. Model tests and theoretical analyses of influences of surface surcharge on confining pressure of shield tunnels. Chin J Geotech Eng. 2022, 44(10): 1789-1798. [CrossRef]
- Li, L.; Yang, J.; Wang, S.; Wu, J.;Wang, Z.; Xiang, M. Experimental study and treatment measure of track-uplift disease caused by water pressure in high-speed railway tunnel. J Cent South Univ (Sci Technol). 2022, 53(04): 1341-1351.
- Fang, H.; Tan, P.; Du, X.; Li, B.; Yang, K.; Zhang, Y. Mechanical response of buried HDPE double-wall corrugated pipe under traffic-sewage coupling load. Tunn Under Gr Sp Tech. 2021, 108: 103664. [CrossRef]
- Röhner, R.; Hoch, A.; Calculation of jacking force by new ATV A-161. Tunn Under Gr Sp Tech. 2010, 25: 731-735. [CrossRef]
- Zhang, Y.; Tao, L.; Zhao, X.; Liu, J.; Liao, W.; Gao, F.; Yang, X.; Zhong, R. Analytical model of vertical load acting on jacked pipe considering soil arching effect in cohesionless soil. Undergr Space, 2024, 14(1): 263-284. [CrossRef]
- Ye, Y.; Peng, L.; Yang, W.; Lei, M.;Shi, C.; Wang, Z. Calculation of jacking force for pipe-jacking considering mud slurry thixotropy. Chin J Geotech Eng. 2015, 37(09): 1653-1659. [CrossRef]
- Zhang, Y.; Tao, L.; Zhao, X.; Dong, L.; Bian, J.; Gao, F. Influence analysis of horizontally arranged advance pipes on jacking force of subsequent pipes. J. Southeast Univ. Nat. Sci. Ed. 2021, 51(05): 762-769. [CrossRef]
- Huang, H.; Chen, J.; Zhang, D.; Lateral asymptotic deflection evolution and mechanical behavior of secondary linings of freeze-thaw tunnels in cold regions. Chin J Geotech Eng. 2019, 41(11): 2126-2132. [CrossRef]
- Liu, H.; Zhang, G.; Pan, W.; Wen,S.; Cui, Q. Study on mechanical properties of composite pipe jacking with a super-large rectangular section during construction. J Tianjin Univ (Sci Technol). 2023, 56(11): 1115-1124.
- Huang, D.; Xu, C.; Luo, W.; Jiang, H.; Li, Q. Design and application of modular step-by-step scale model test for earth pressure balance shield construction. J Traffic Transp Eng. 2023, 23(04): 248-257. [CrossRef]
- Shen, X.; Yuan, D.; Wu, J.; Li, X.; Jin, D.; Wang, T. Development and application of model test platform for slurry balance shield under high water pressure. China J Highway Transport. 2020, 33(12): 164-175. [CrossRef]
- Liu, C.; Li, S.; Zhou, Z.; Li, L.; Wang, K. Hou, F. Qin, C.; Gao,C. Model test on mechanical characteristics of surrounding rock during construction process of super-large section tunnel in complex strata. Rock Soil Mech. 2018, 39(09): 3495-3504. [CrossRef]
- Guo, R.; He, C.; Feng, K.; Tang, R.; Model test study on instability failure of shield tunnel under weak resistance strata. J China Railway Soc., 2015, 37(03): 72-78.
- Ye, F.; Yang, P.; Mao, J.; Mao, Y.;Chen, Z.; Sun, C. Longitudinal rigidity of shield tunnels based on model tests. Chin J Geotech Eng. 2015, 37(01): 83-90. [CrossRef]
- Liu, K.; Chen, X.; Zhang, P.; Ma, B.; Feng, X.; Zhang, Y.; Tan, X.; Xu,T. Axial mechanical response of concrete pipe jacking considering the deflection of the bell-and-spigot joint: Full-scale test and numerical simulation. Tunn Under Gr Sp Tech. 2024, 149: 105805. [CrossRef]
- Liu, X.; Bai, H.; Chen, X.; Chen, J.; Wang,J. Field test of mechanical properties of large diameter concrete jacking pipe in soft soil. J Shanghai Jiao Tong Univ. 2014, 48(11): 1503-1509. [CrossRef]
- Zhen, L.; Chen, J.; Qiao, P.; Wang, J. Analysis and remedial treatment of a steel pipe-jacking accident in complex underground environment. Eng Struct. 2023, 59: 210-219. [CrossRef]
- Xiao, H.; Li, C.; Feng, M.; Large deformation measurement method of speckle images based on deep learning. Acta Opt Sin. 2023, 43(14): 123-135. [CrossRef]
- Tang, H.; Li, D.; Li, L.; Chen, P.; Wang, R.; Wang, Q. Planar object surface shape speckle pattern deflectometry based on digital image correlation. Acta Opt Sin. 2019, 39(02): 192-198. [CrossRef]
- Sun, H.; Xiao, Z.; Wei, K.; Yang, X.; Qi, J. Effect of pre-bending deformation on mechanical properties of complex phase steel CP800. J Mater Sci Technol, 2021, 49(08): 81-88. [CrossRef]
Figure 1.
Plan and profile of the Meixi Lake sewage pipe jacking construction section.
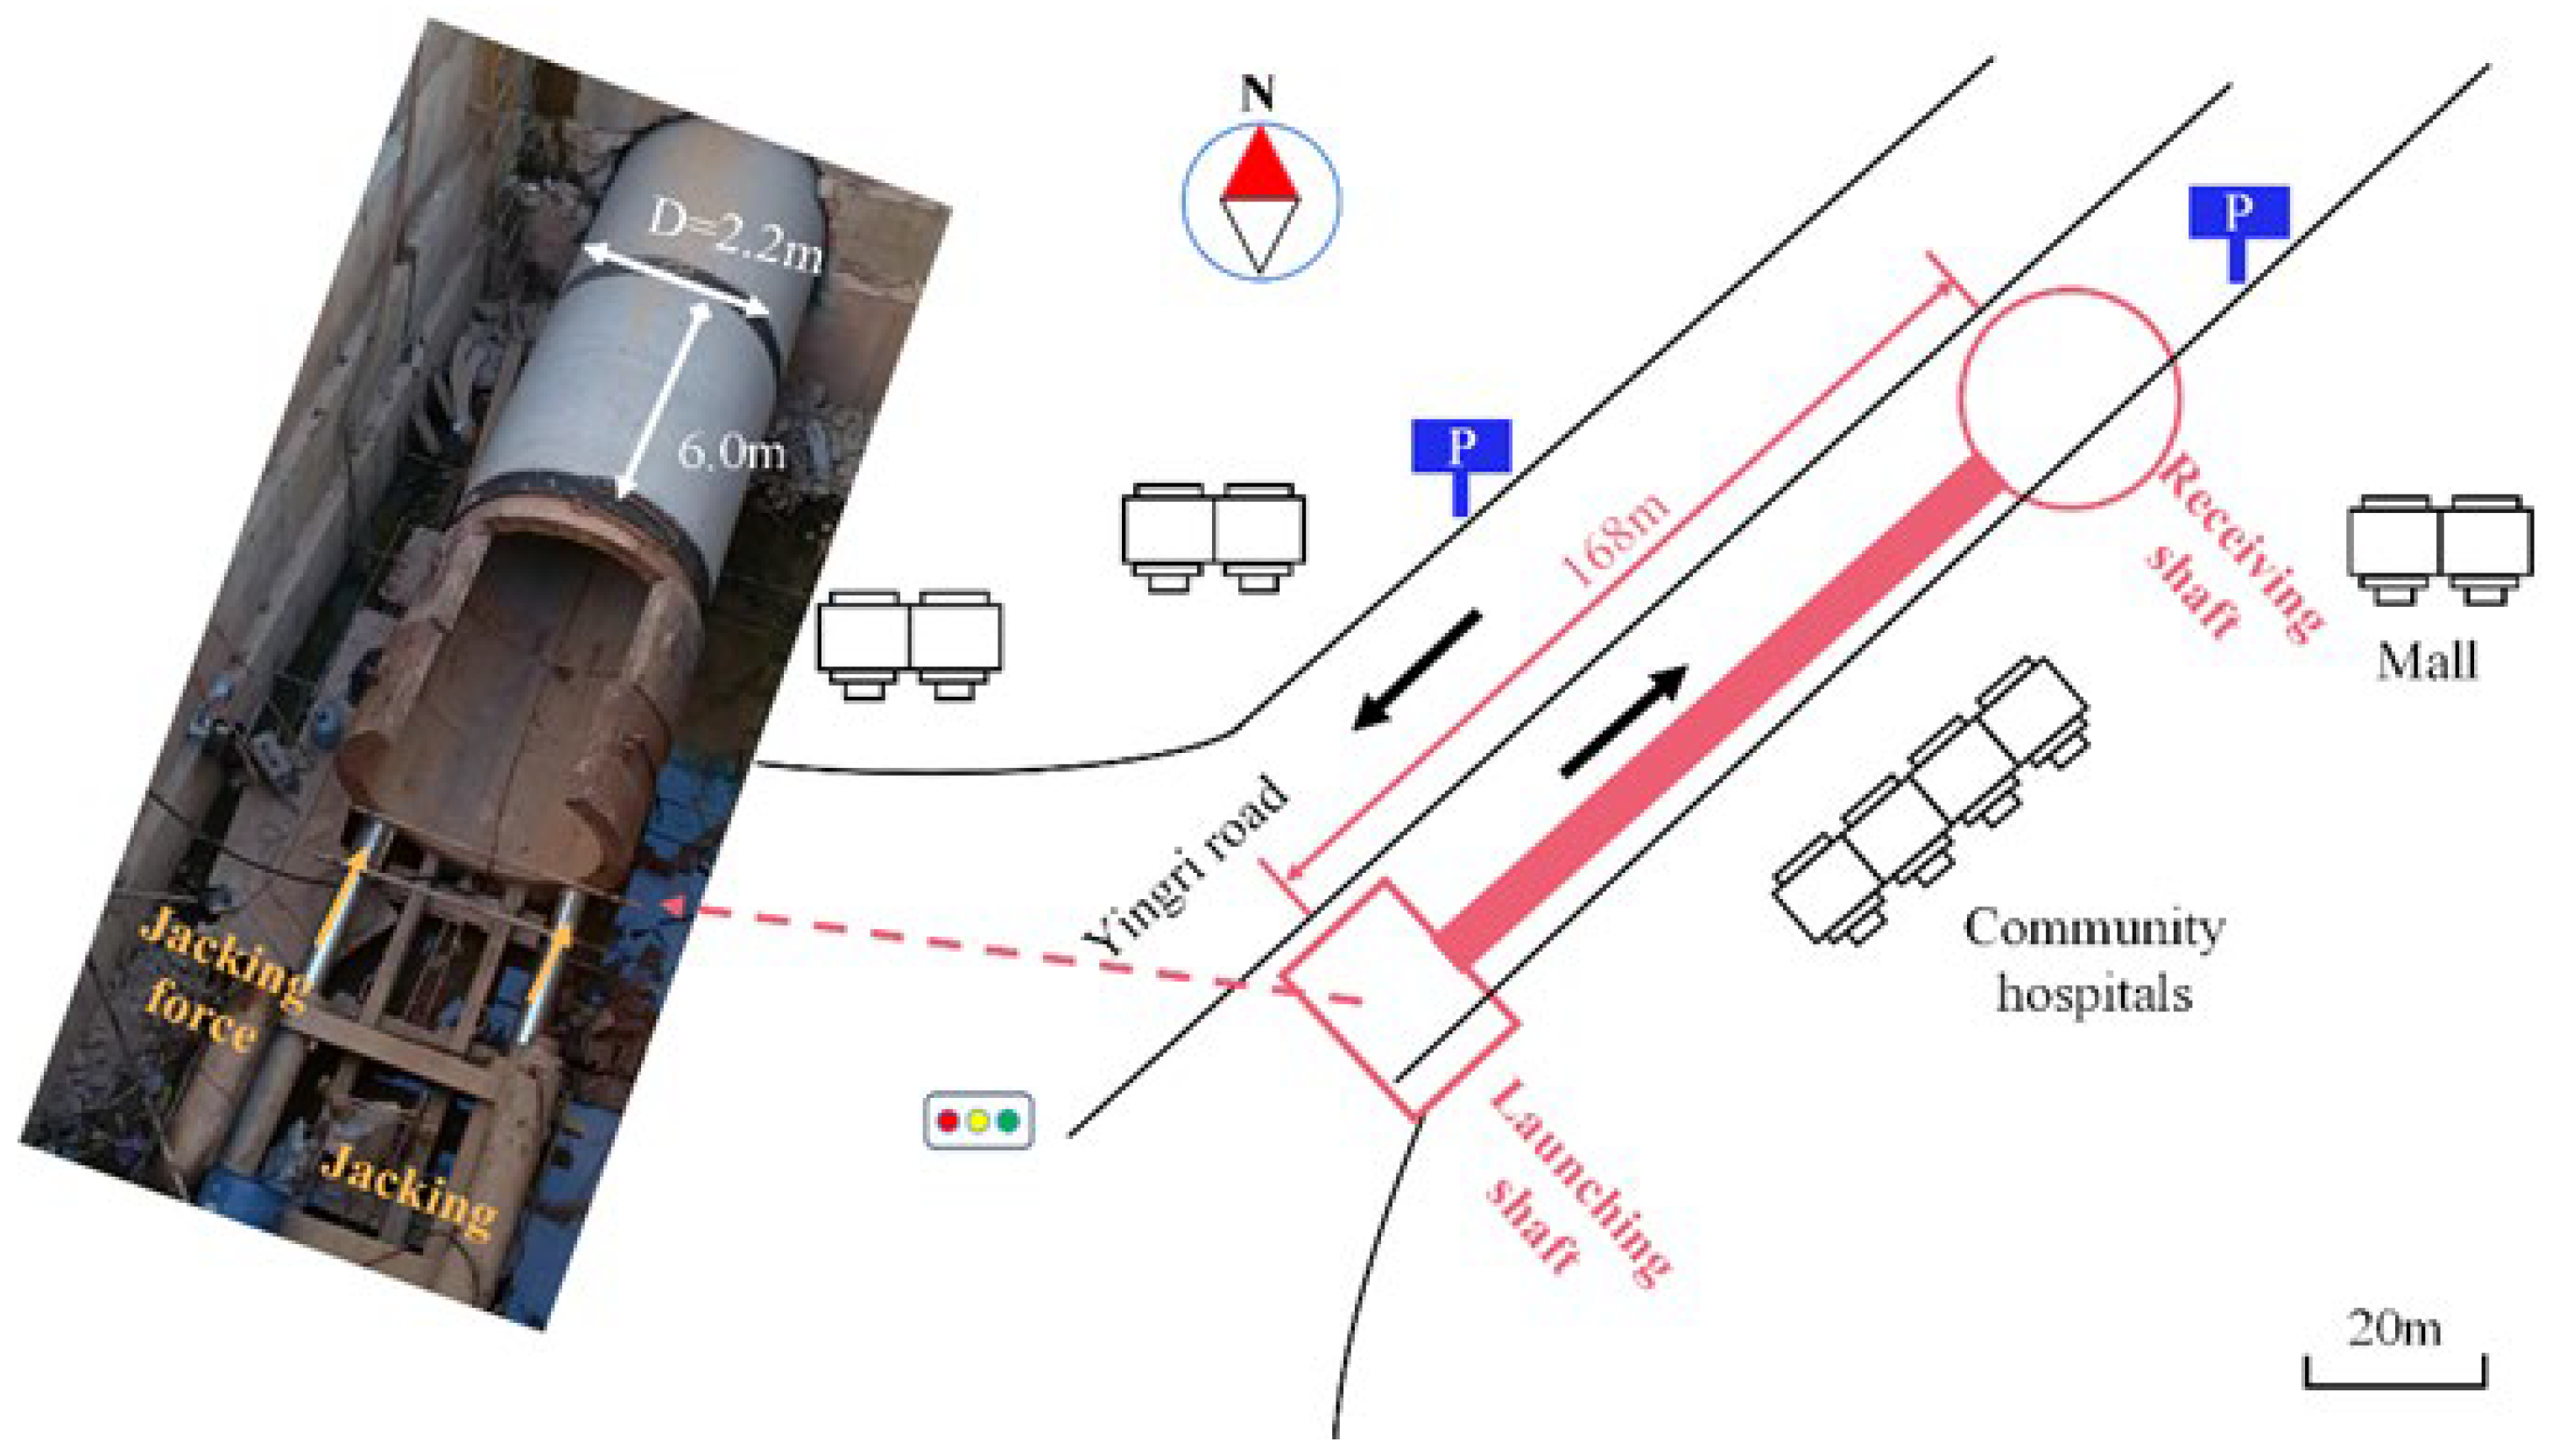
Figure 2.
Plan and profile of the Meixi Lake sewage pipe jacking construction section.
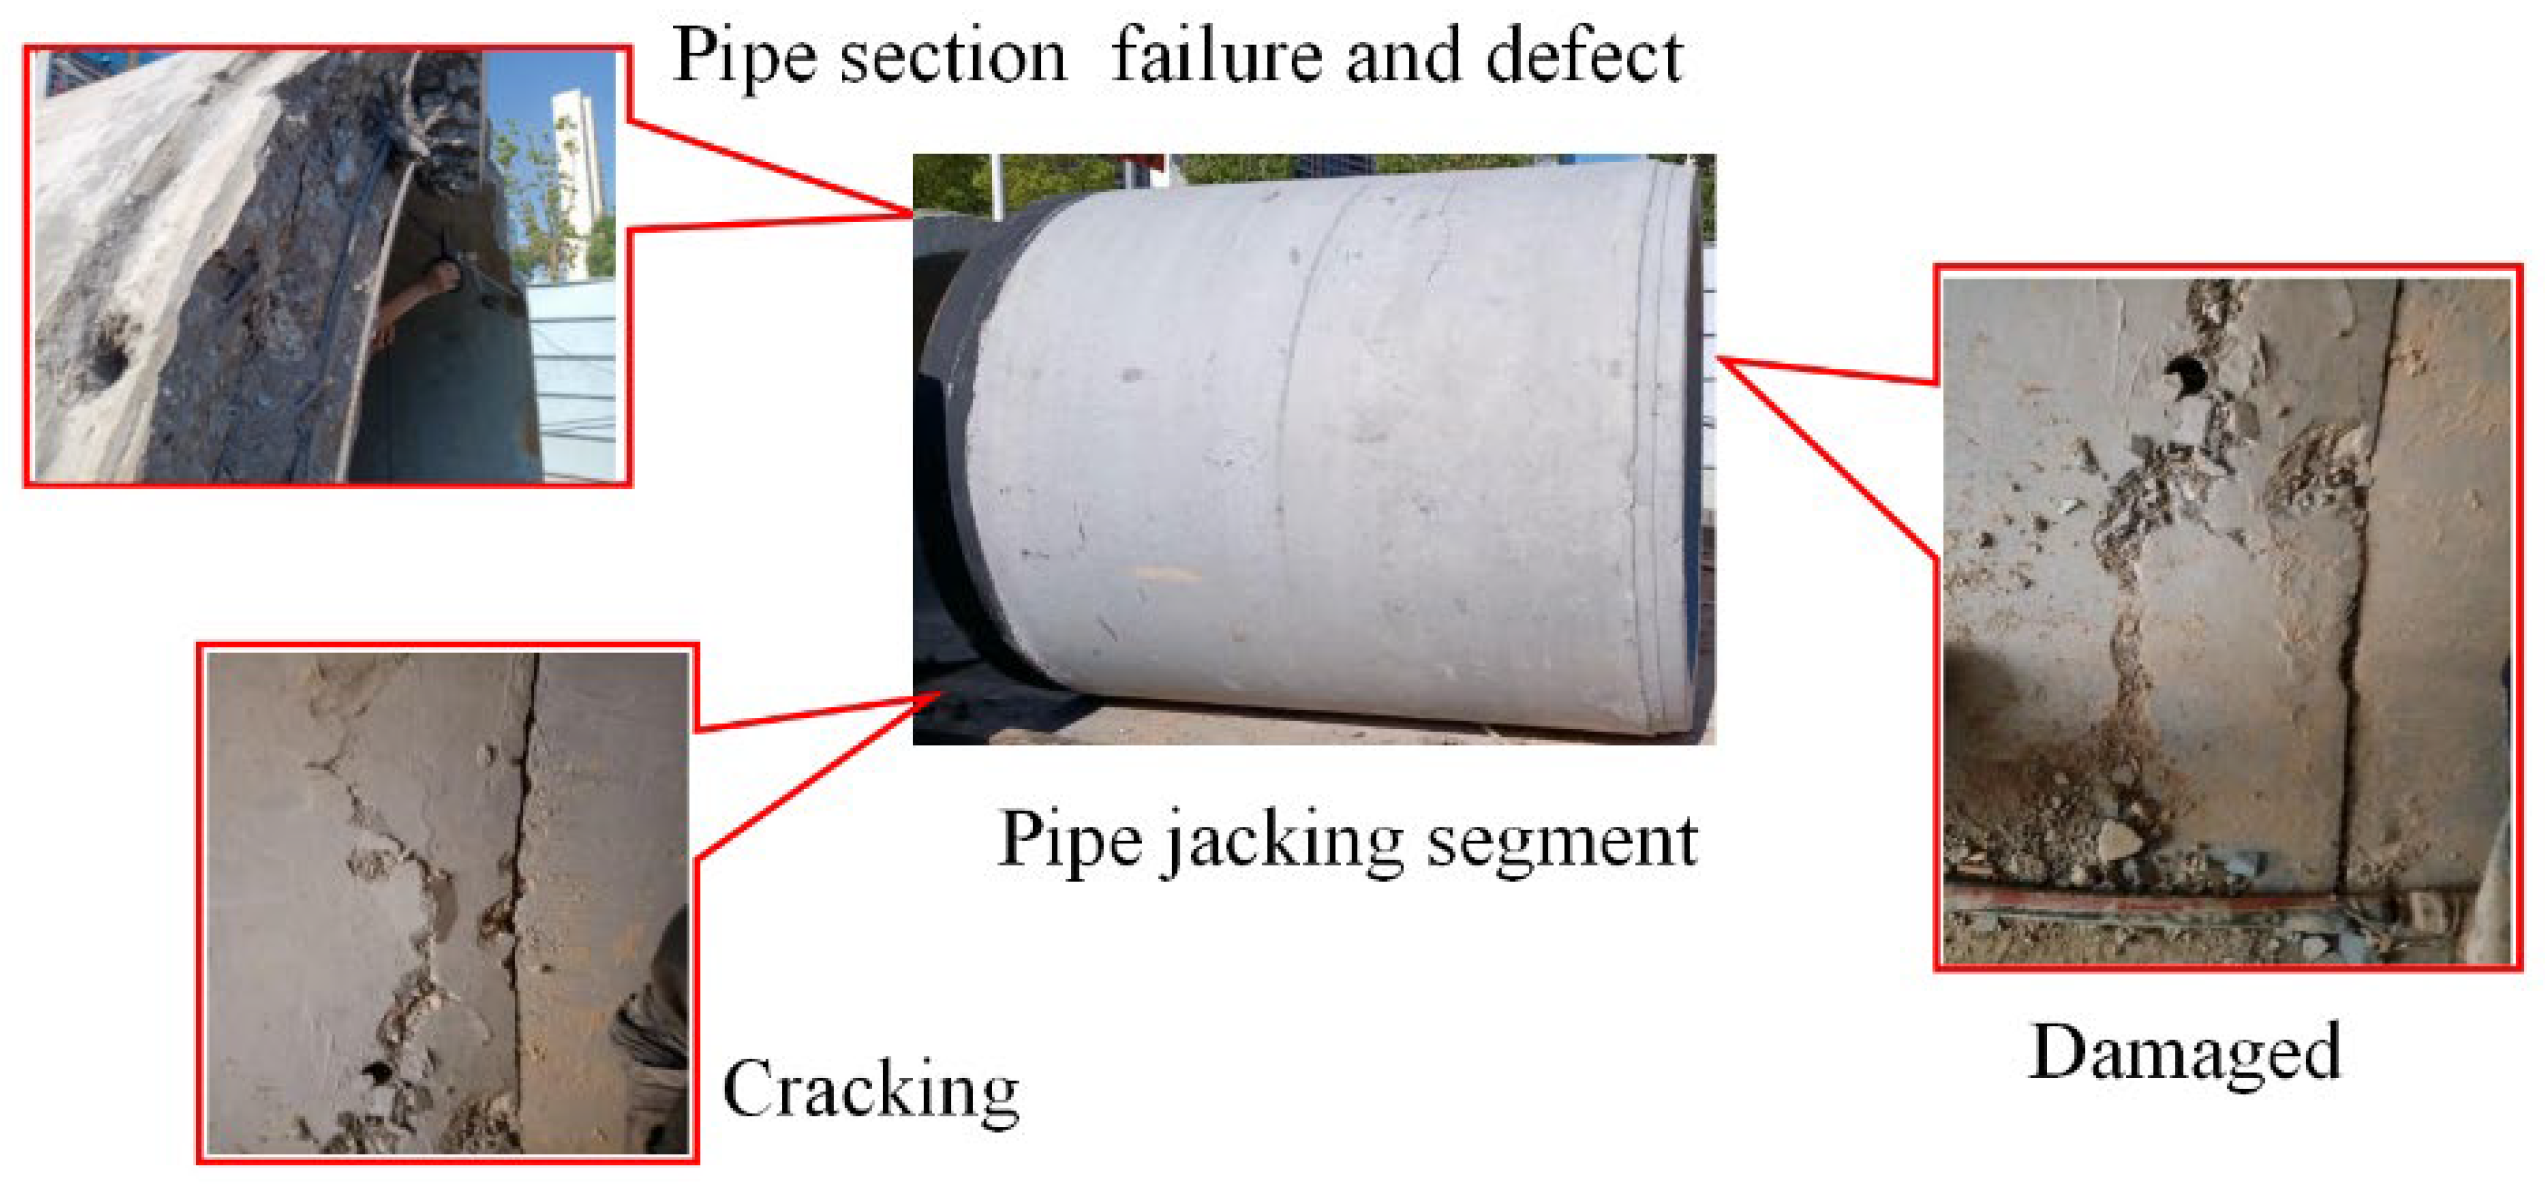
Figure 3.
Indoor deflection test system for pipe jacking.
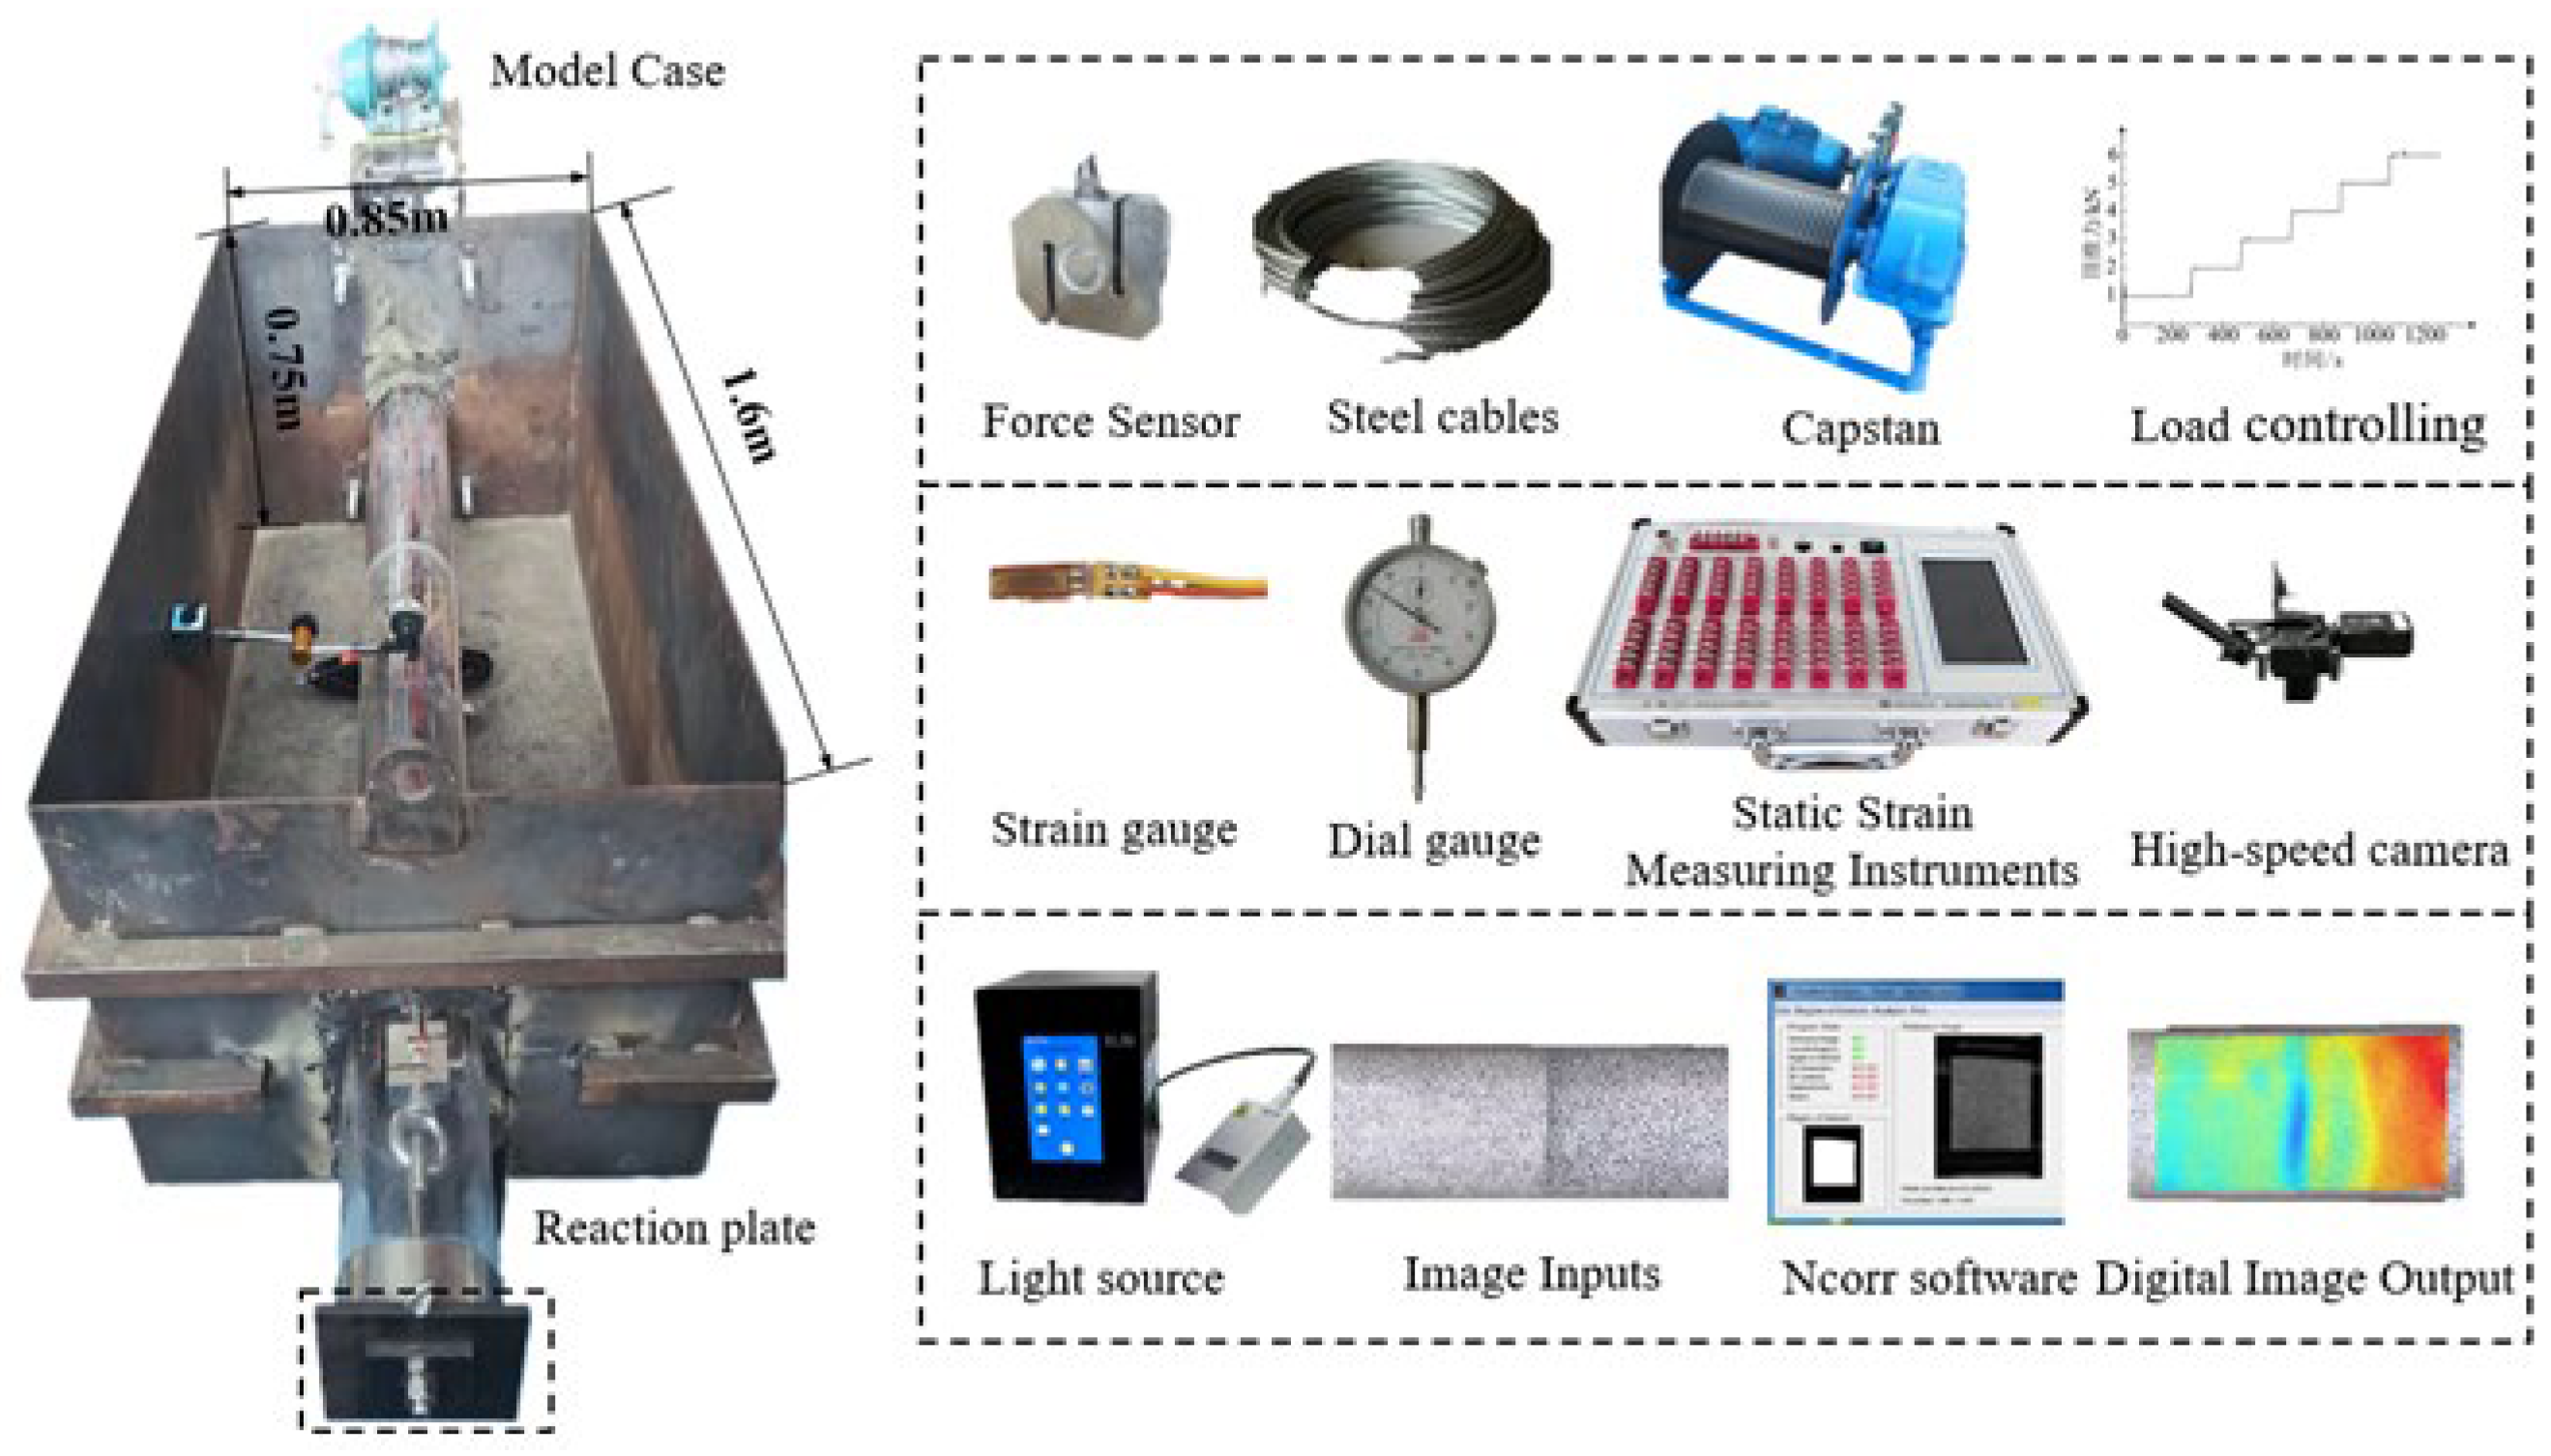
Figure 4.
Monitoring point layout.
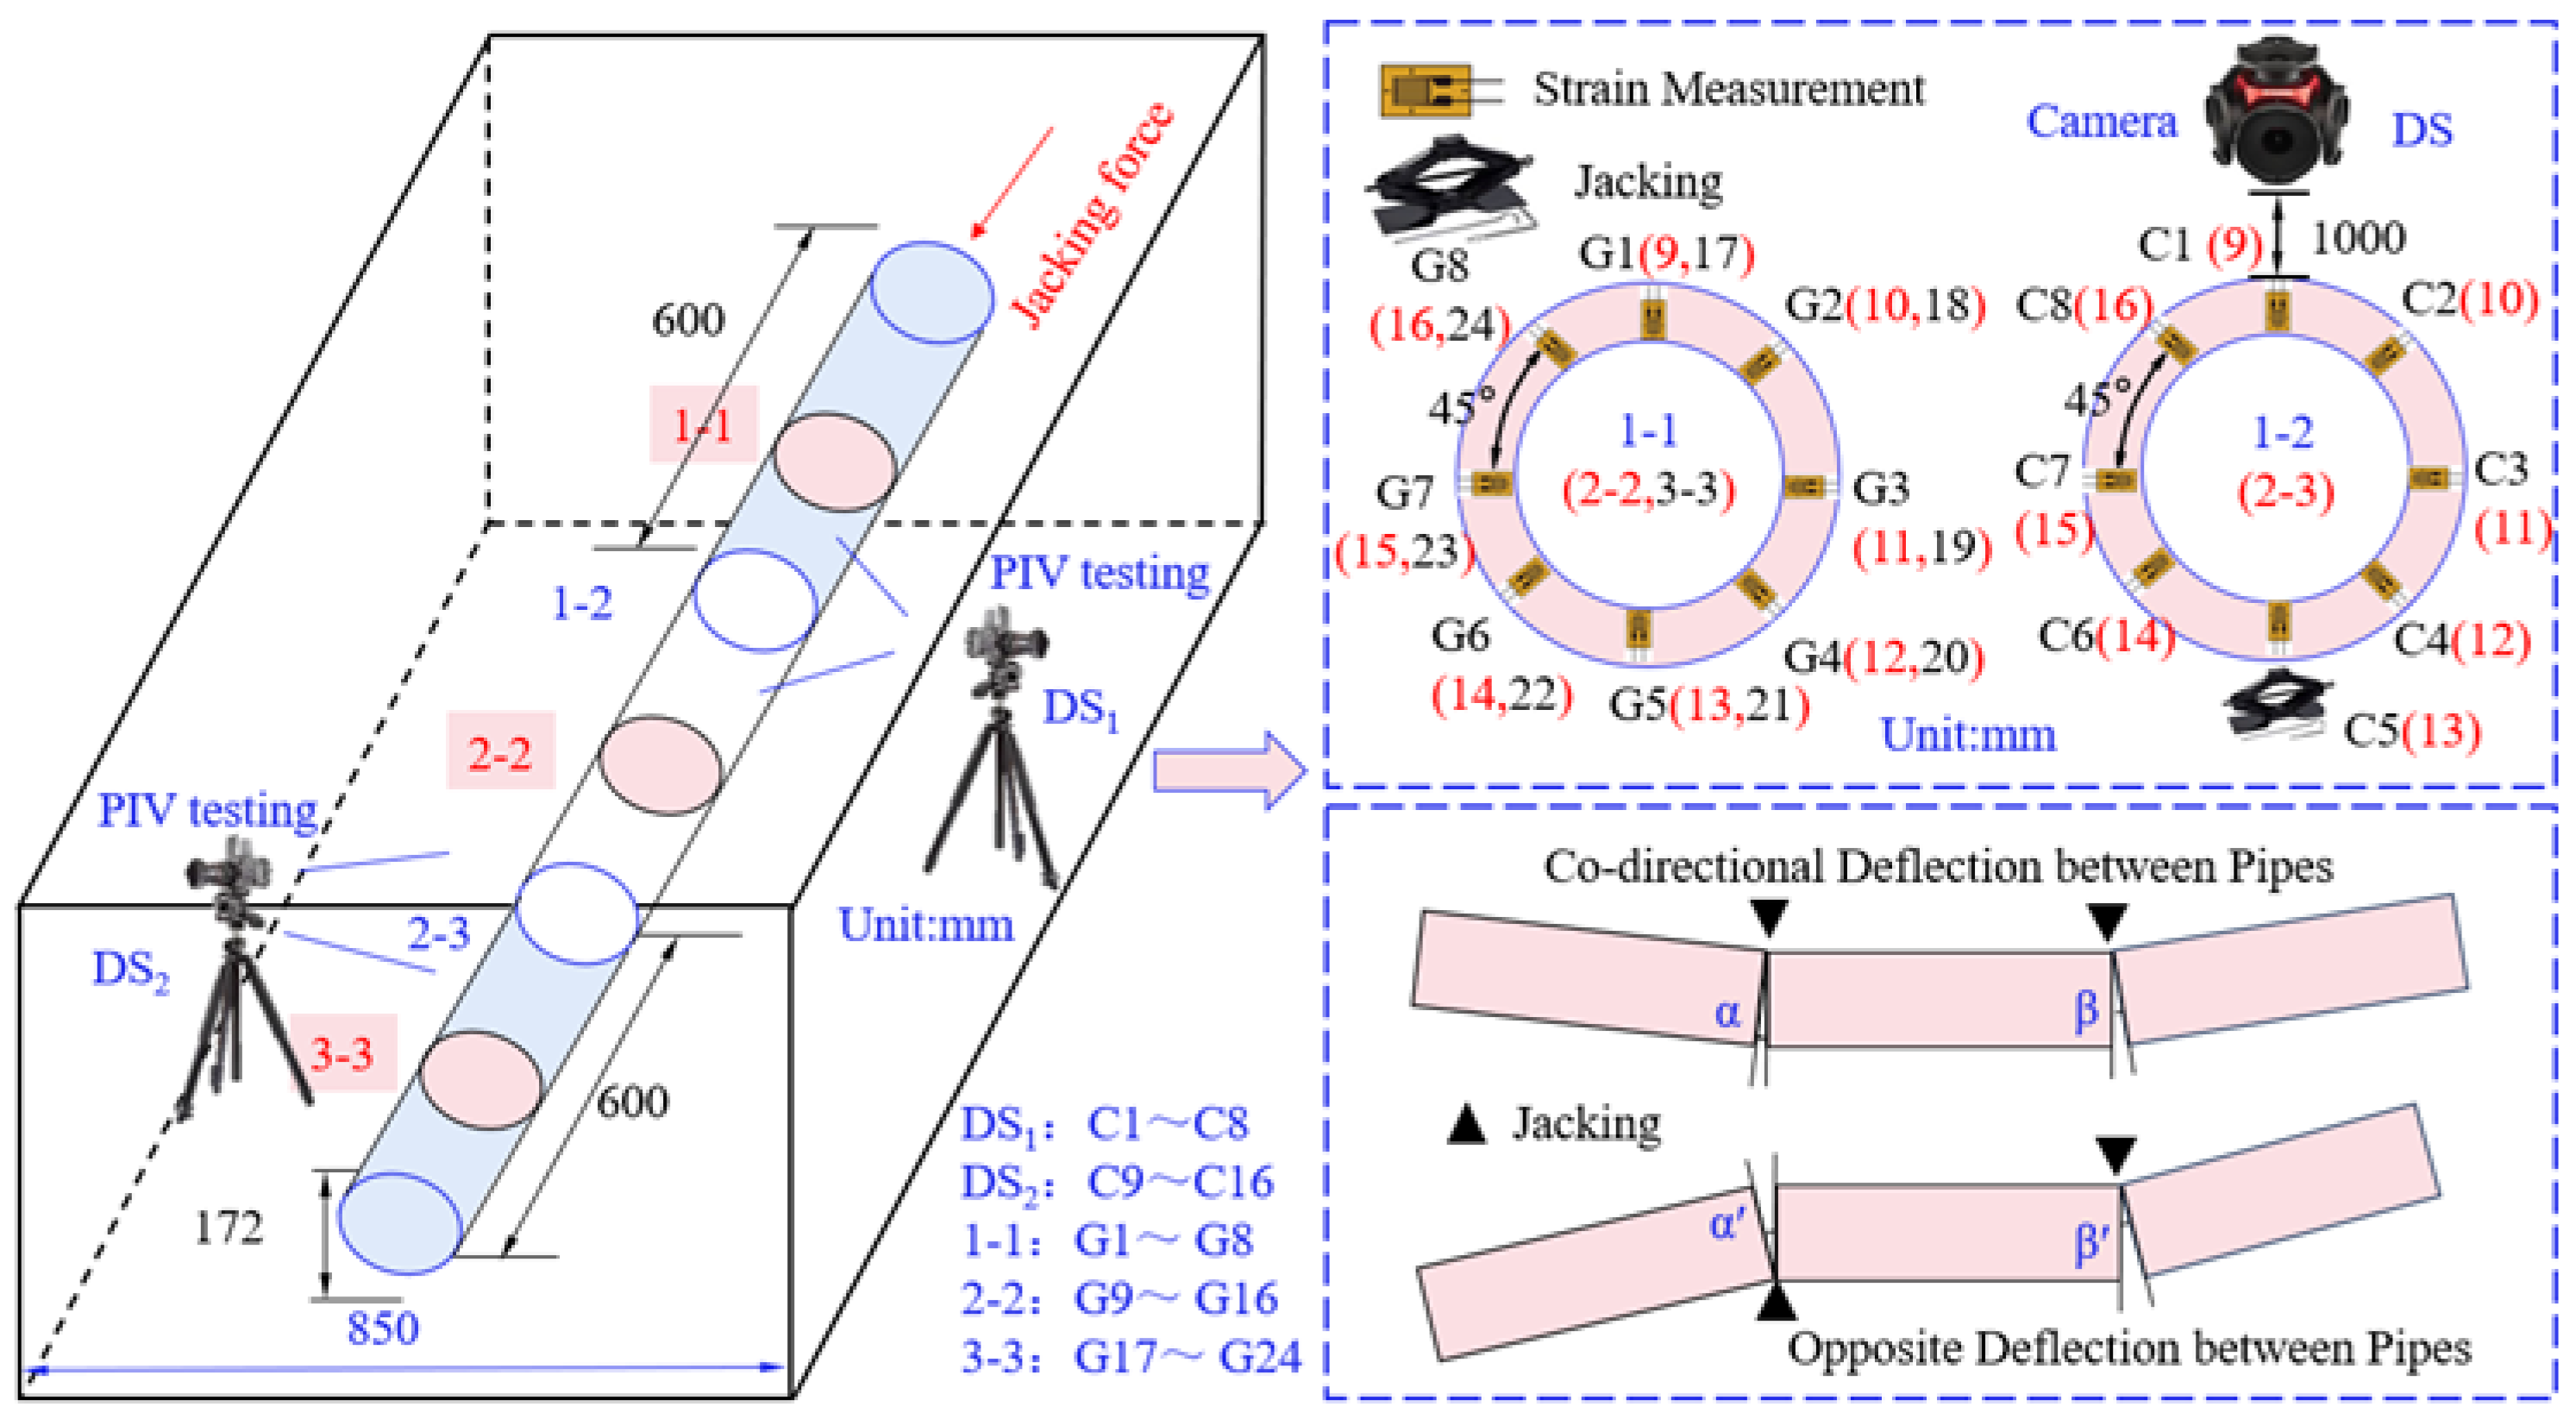
Figure 5.
Schematic diagram of DIC deformation.
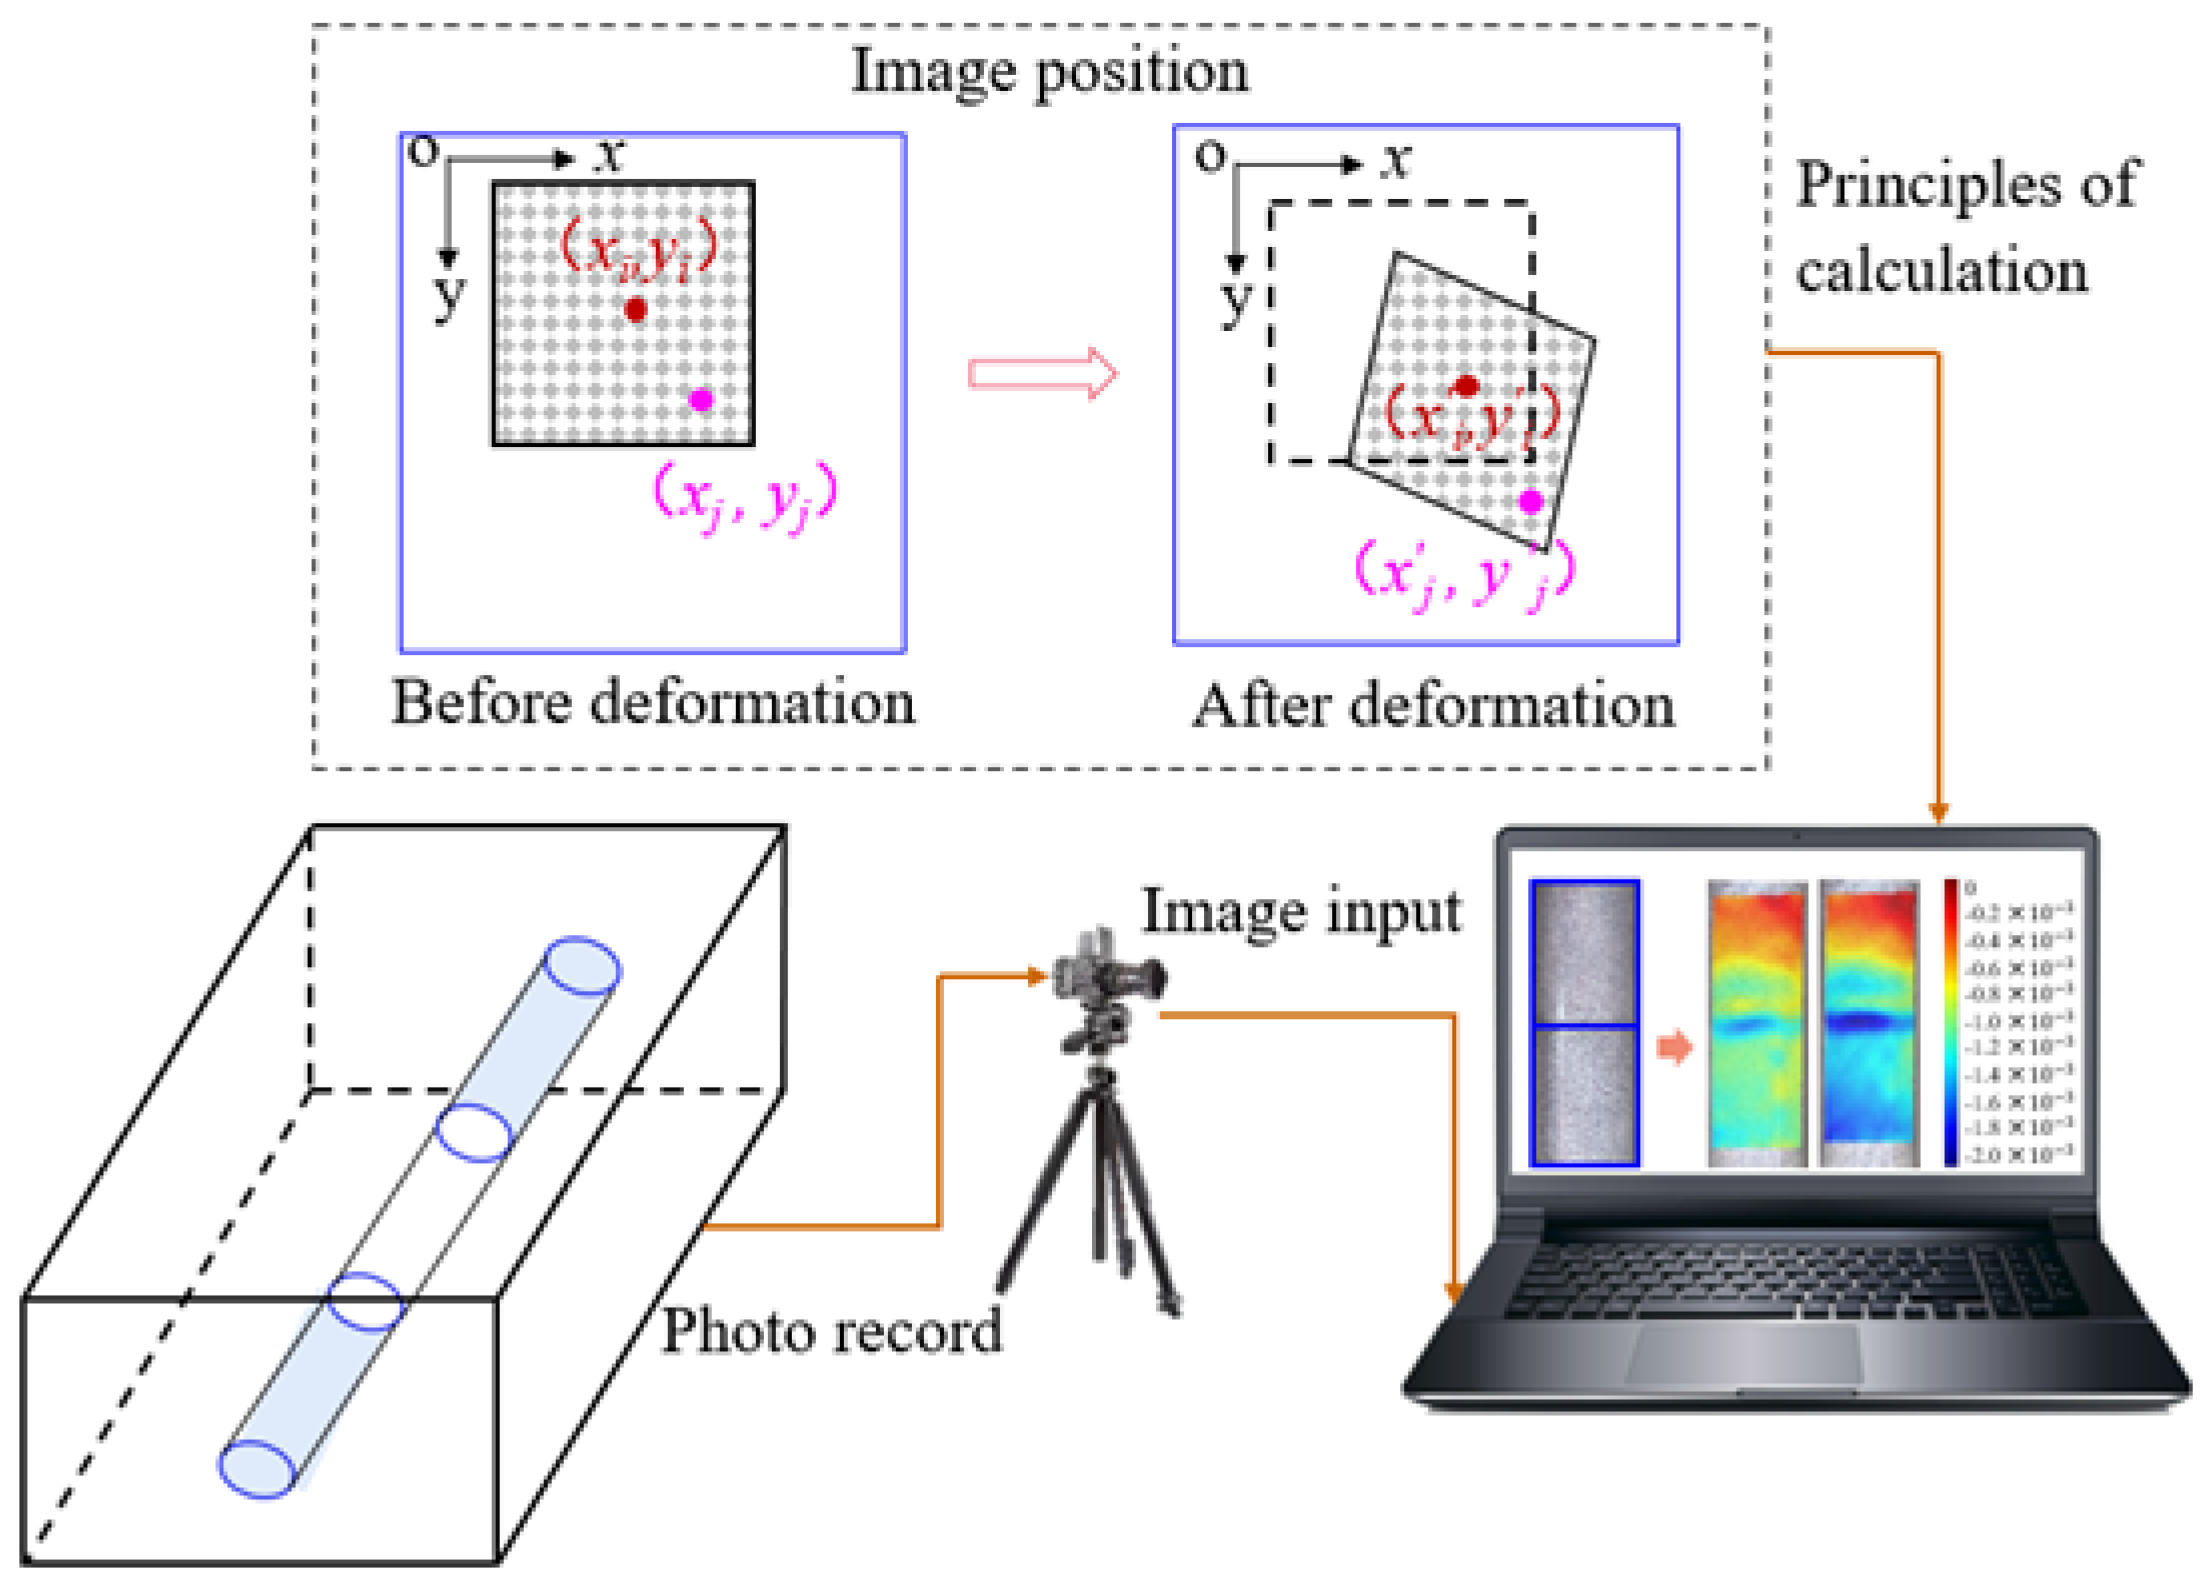
Figure 6.
Segment defect stress test.
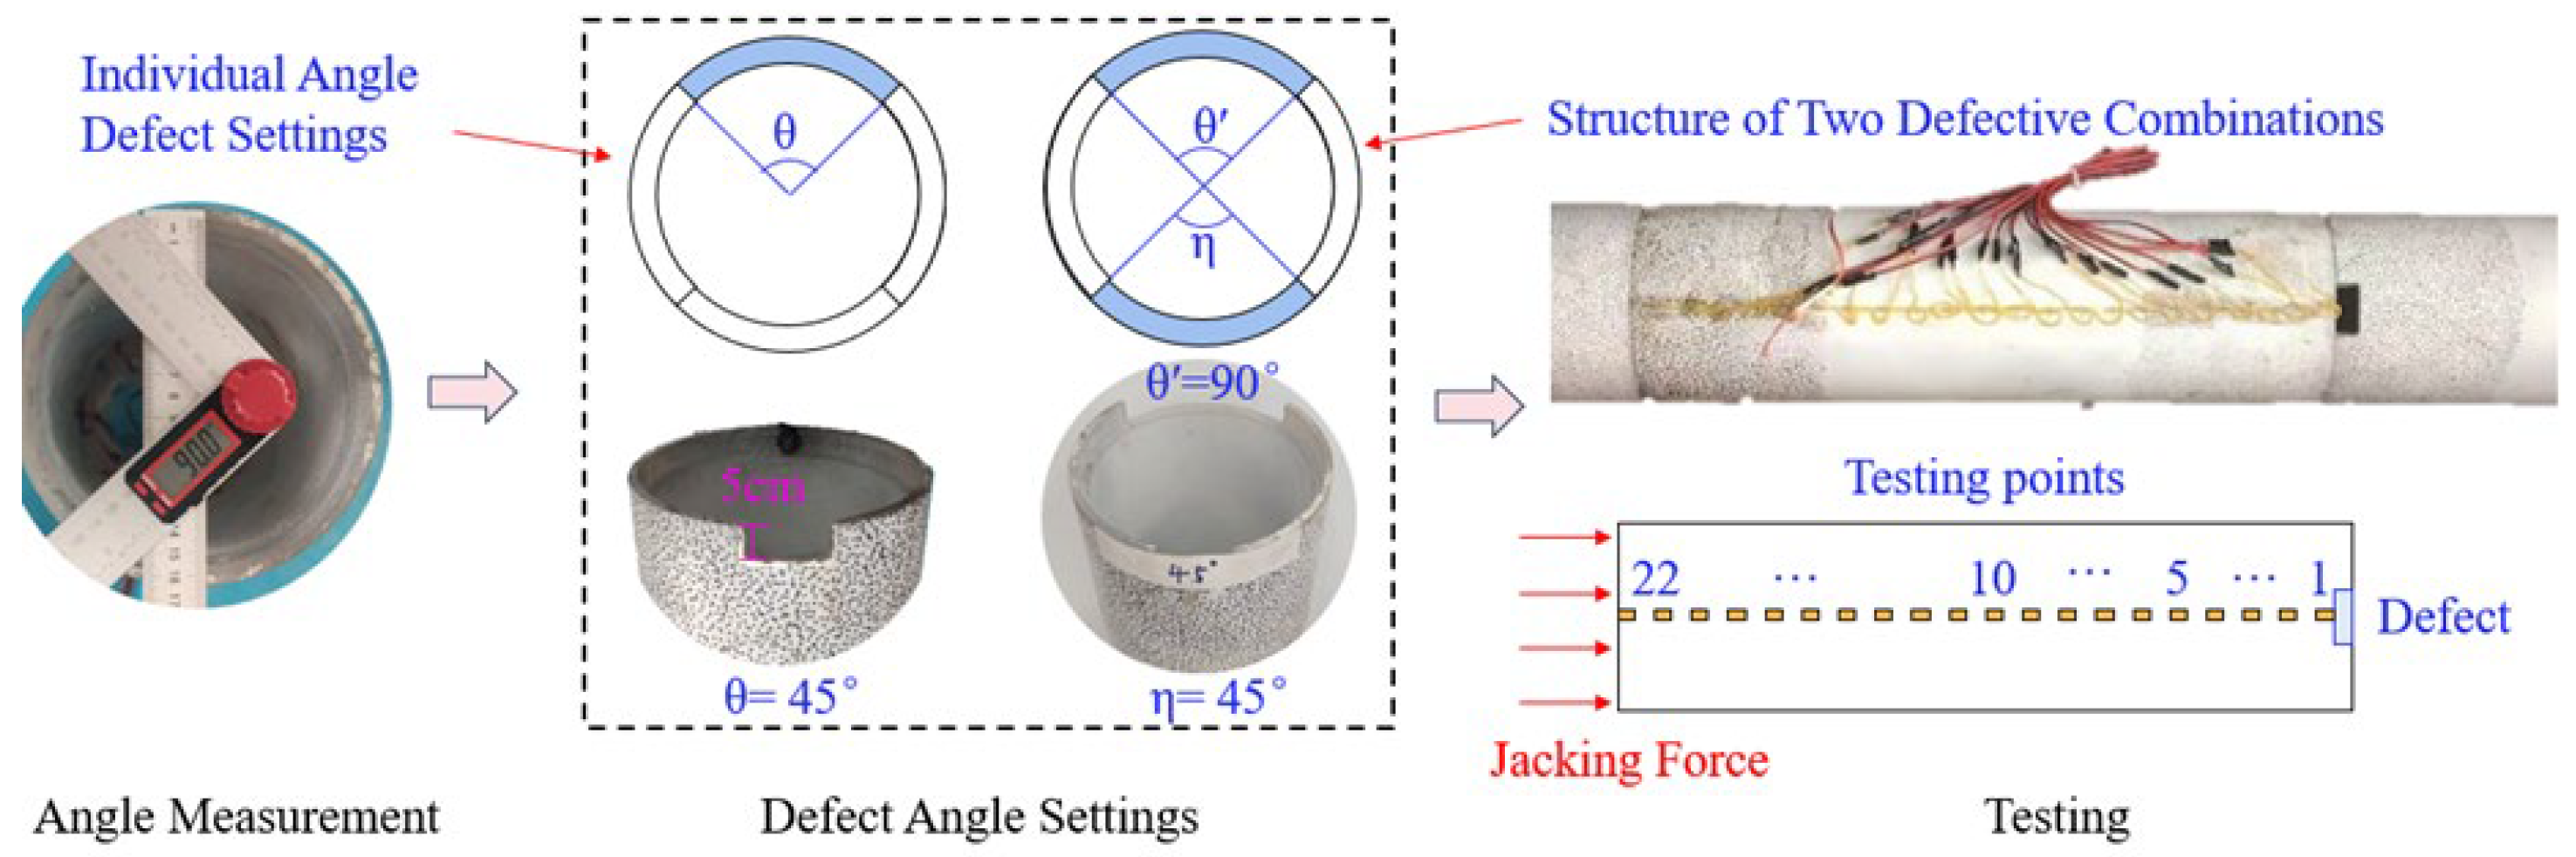
Figure 7.
Axial stress distribution diagram at the mid-point of the pipe segment under co-directional deflection: (a) 0°&0°,Segment1#; (b) 0°&0°, Segment2#;.(c) 0°&0°,Segment 3#; (d) 1°&1°,Segment 1#; (e) 1°&1°, Segment 2#; (f) 1°&1°, Segment 3#;.(i) 2°&2°, Segment 1#; (j) 2°&2,° Segment 2#;.(k) 2°&2°, Segment 3#; (l) 3°&3°, Segment 1#;.(m) 3°&3°, Segment 2#; (n) 3°&3°,Segment 3# .
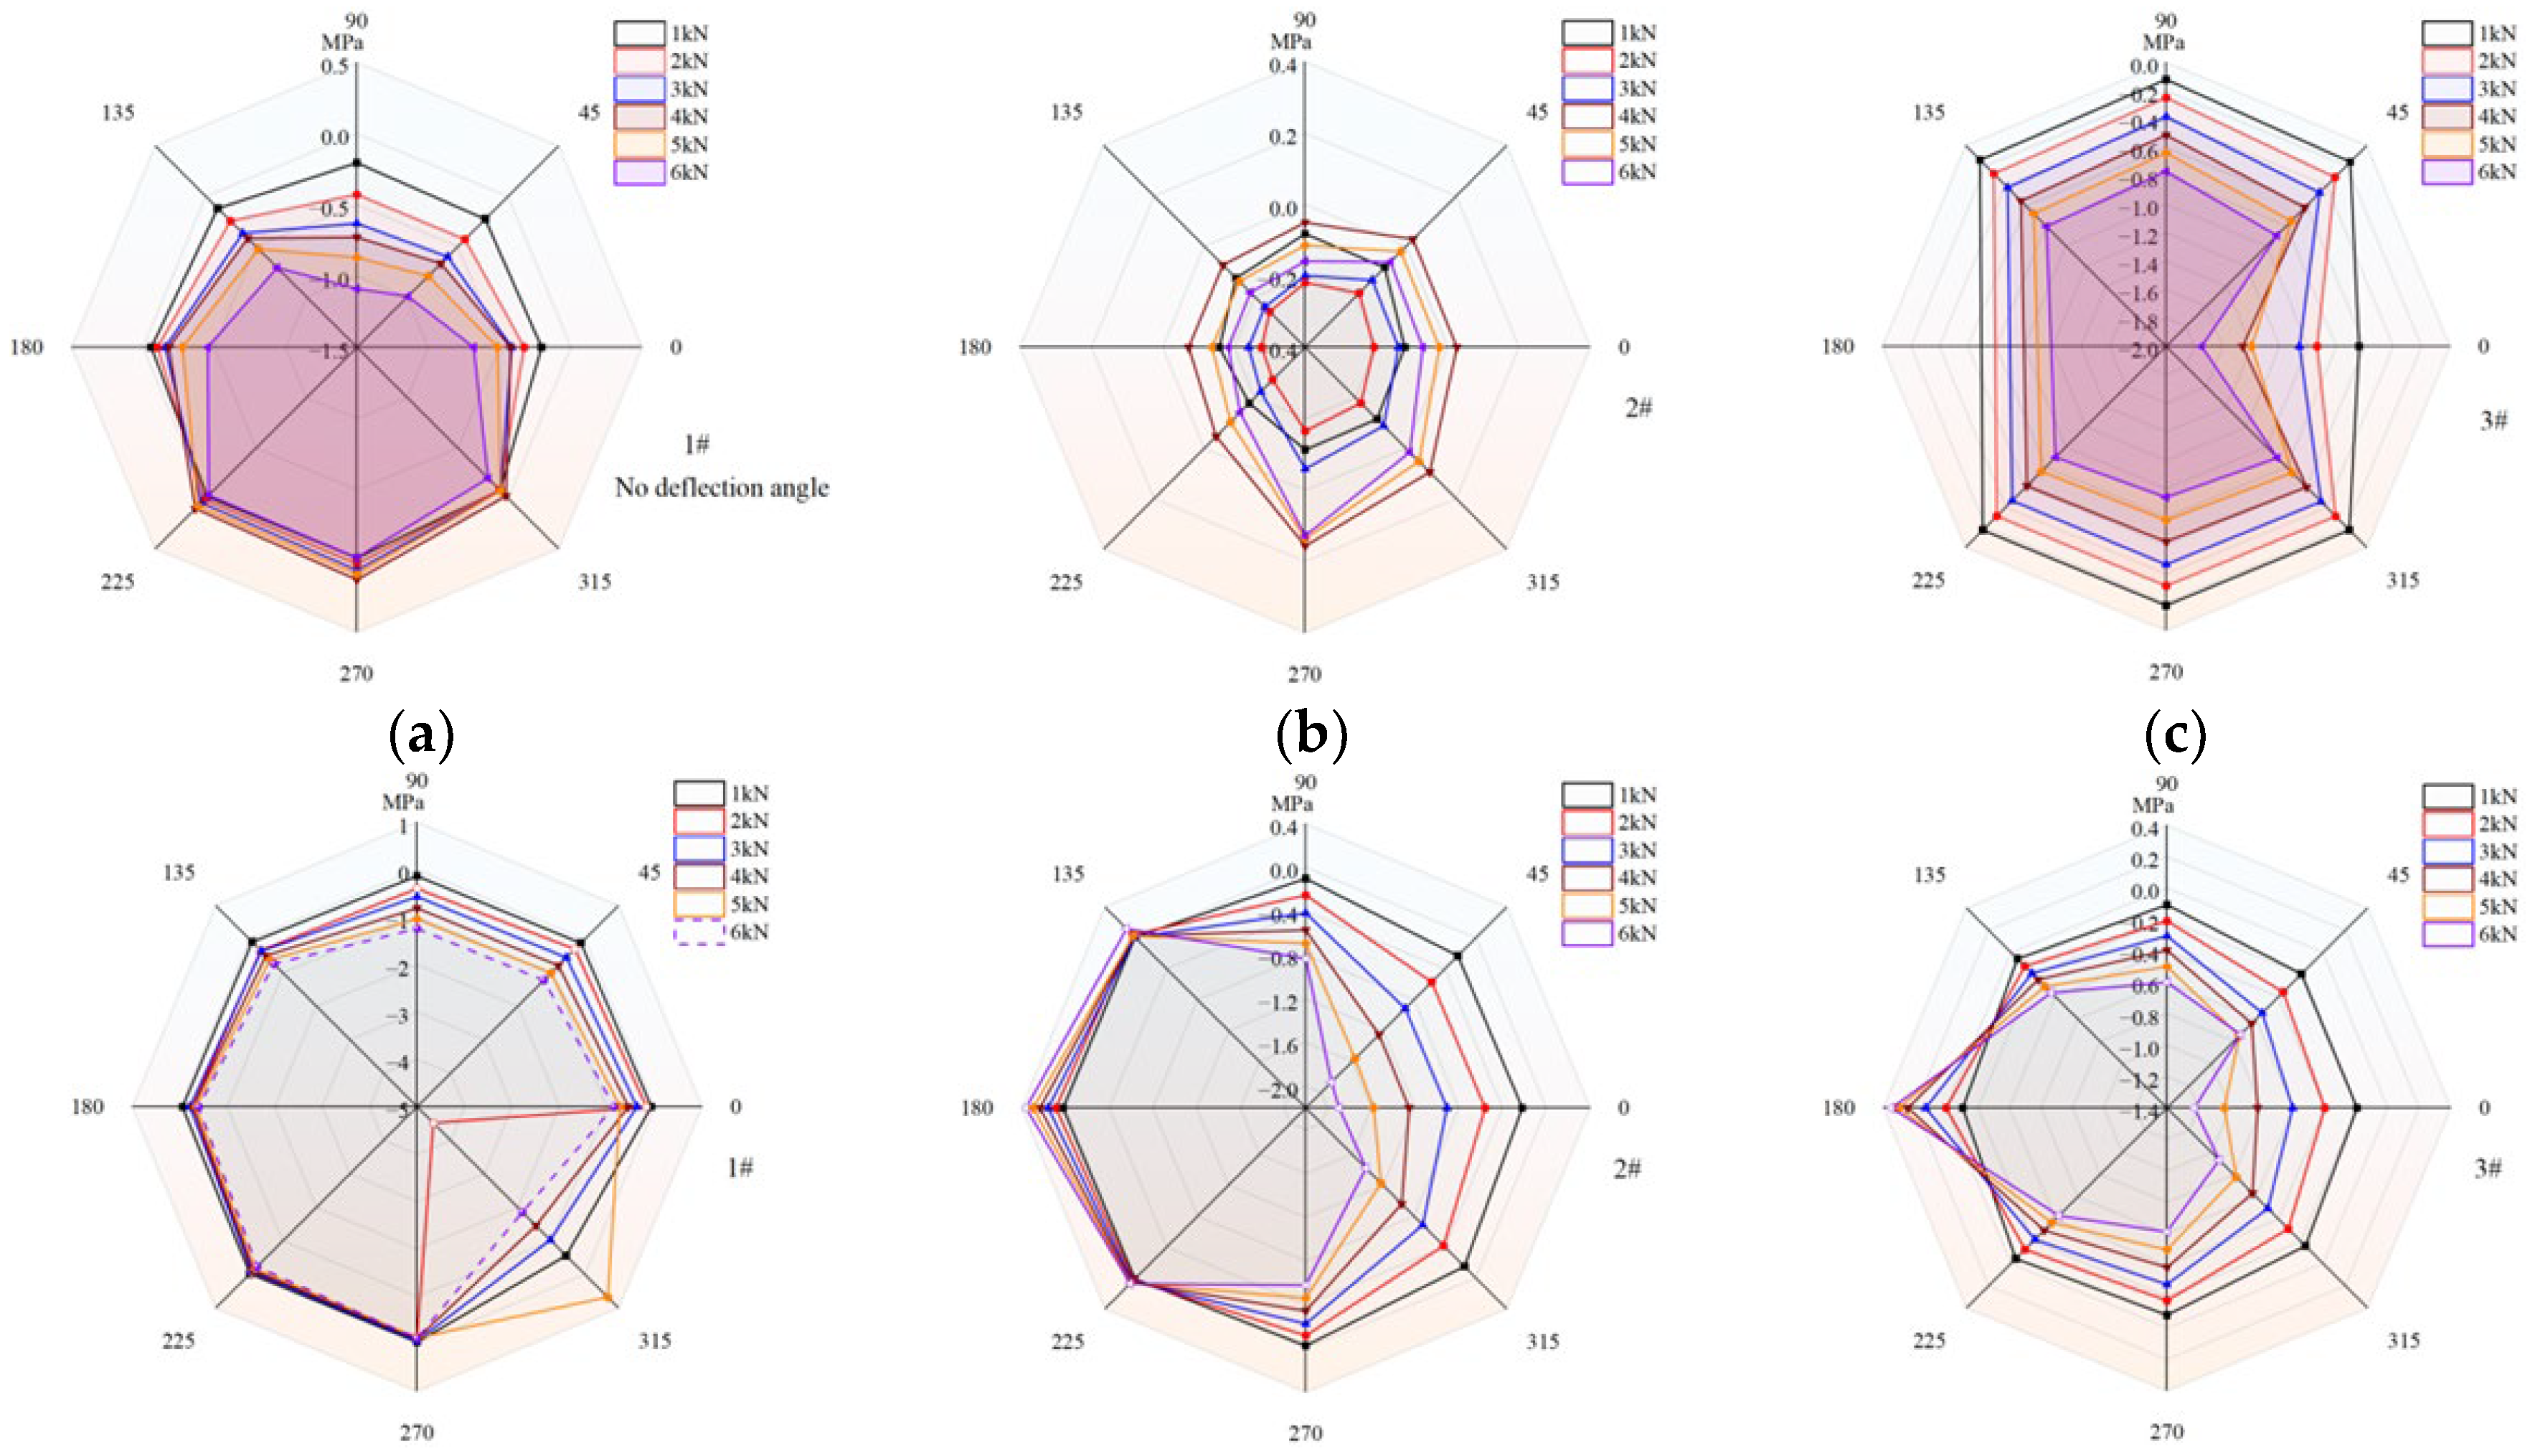
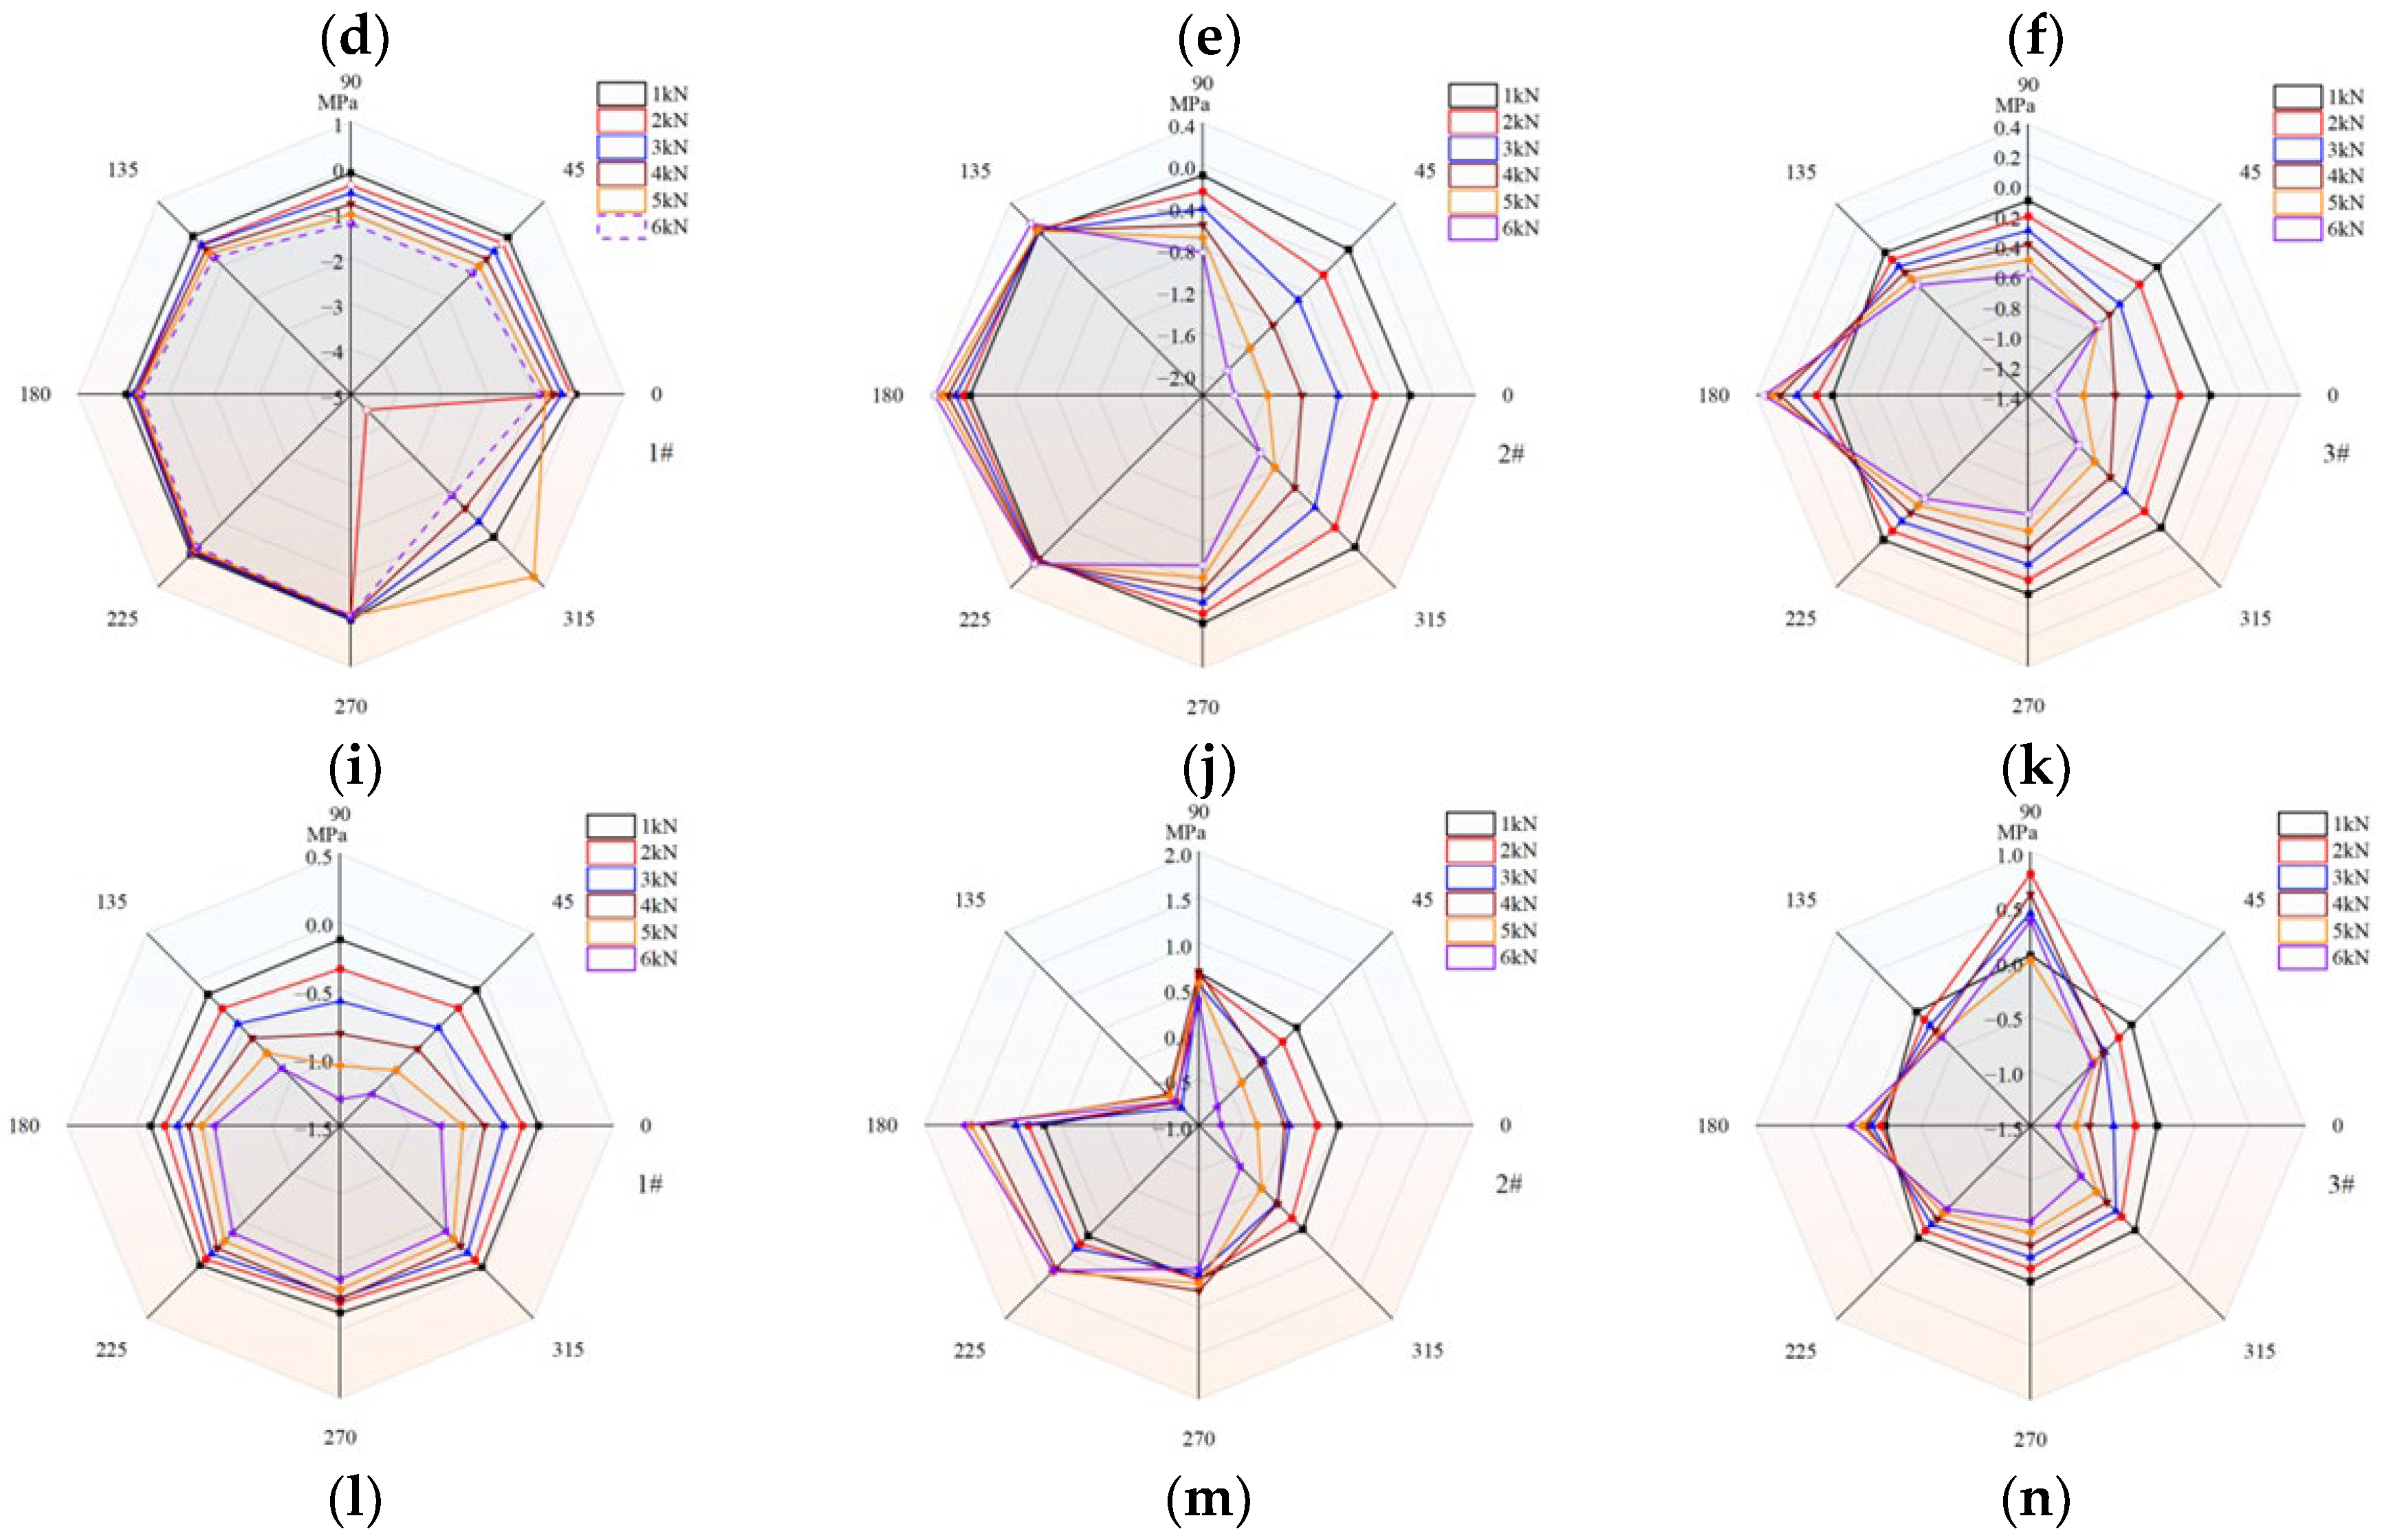
Figure 8.
Axial strain distribution diagram at the mid-point of the pipe segment under diagonal deflection: (a)1° & 1° combination: Segment #1; (b) 1° & 1° combination: Segment #2;.(c) 1° & 1° combination: Segment #3; (d) 2° & 2° combination: Segment #1; (e) 2° & 2° combination: Segment #2; (f) 2° & 2° combination: Segment #3;.(i) 3° & 3° combination: Segment #1; (j)3° & 3° combination: Segment #2;.(k) 3° & 3° combination: Segment #3.
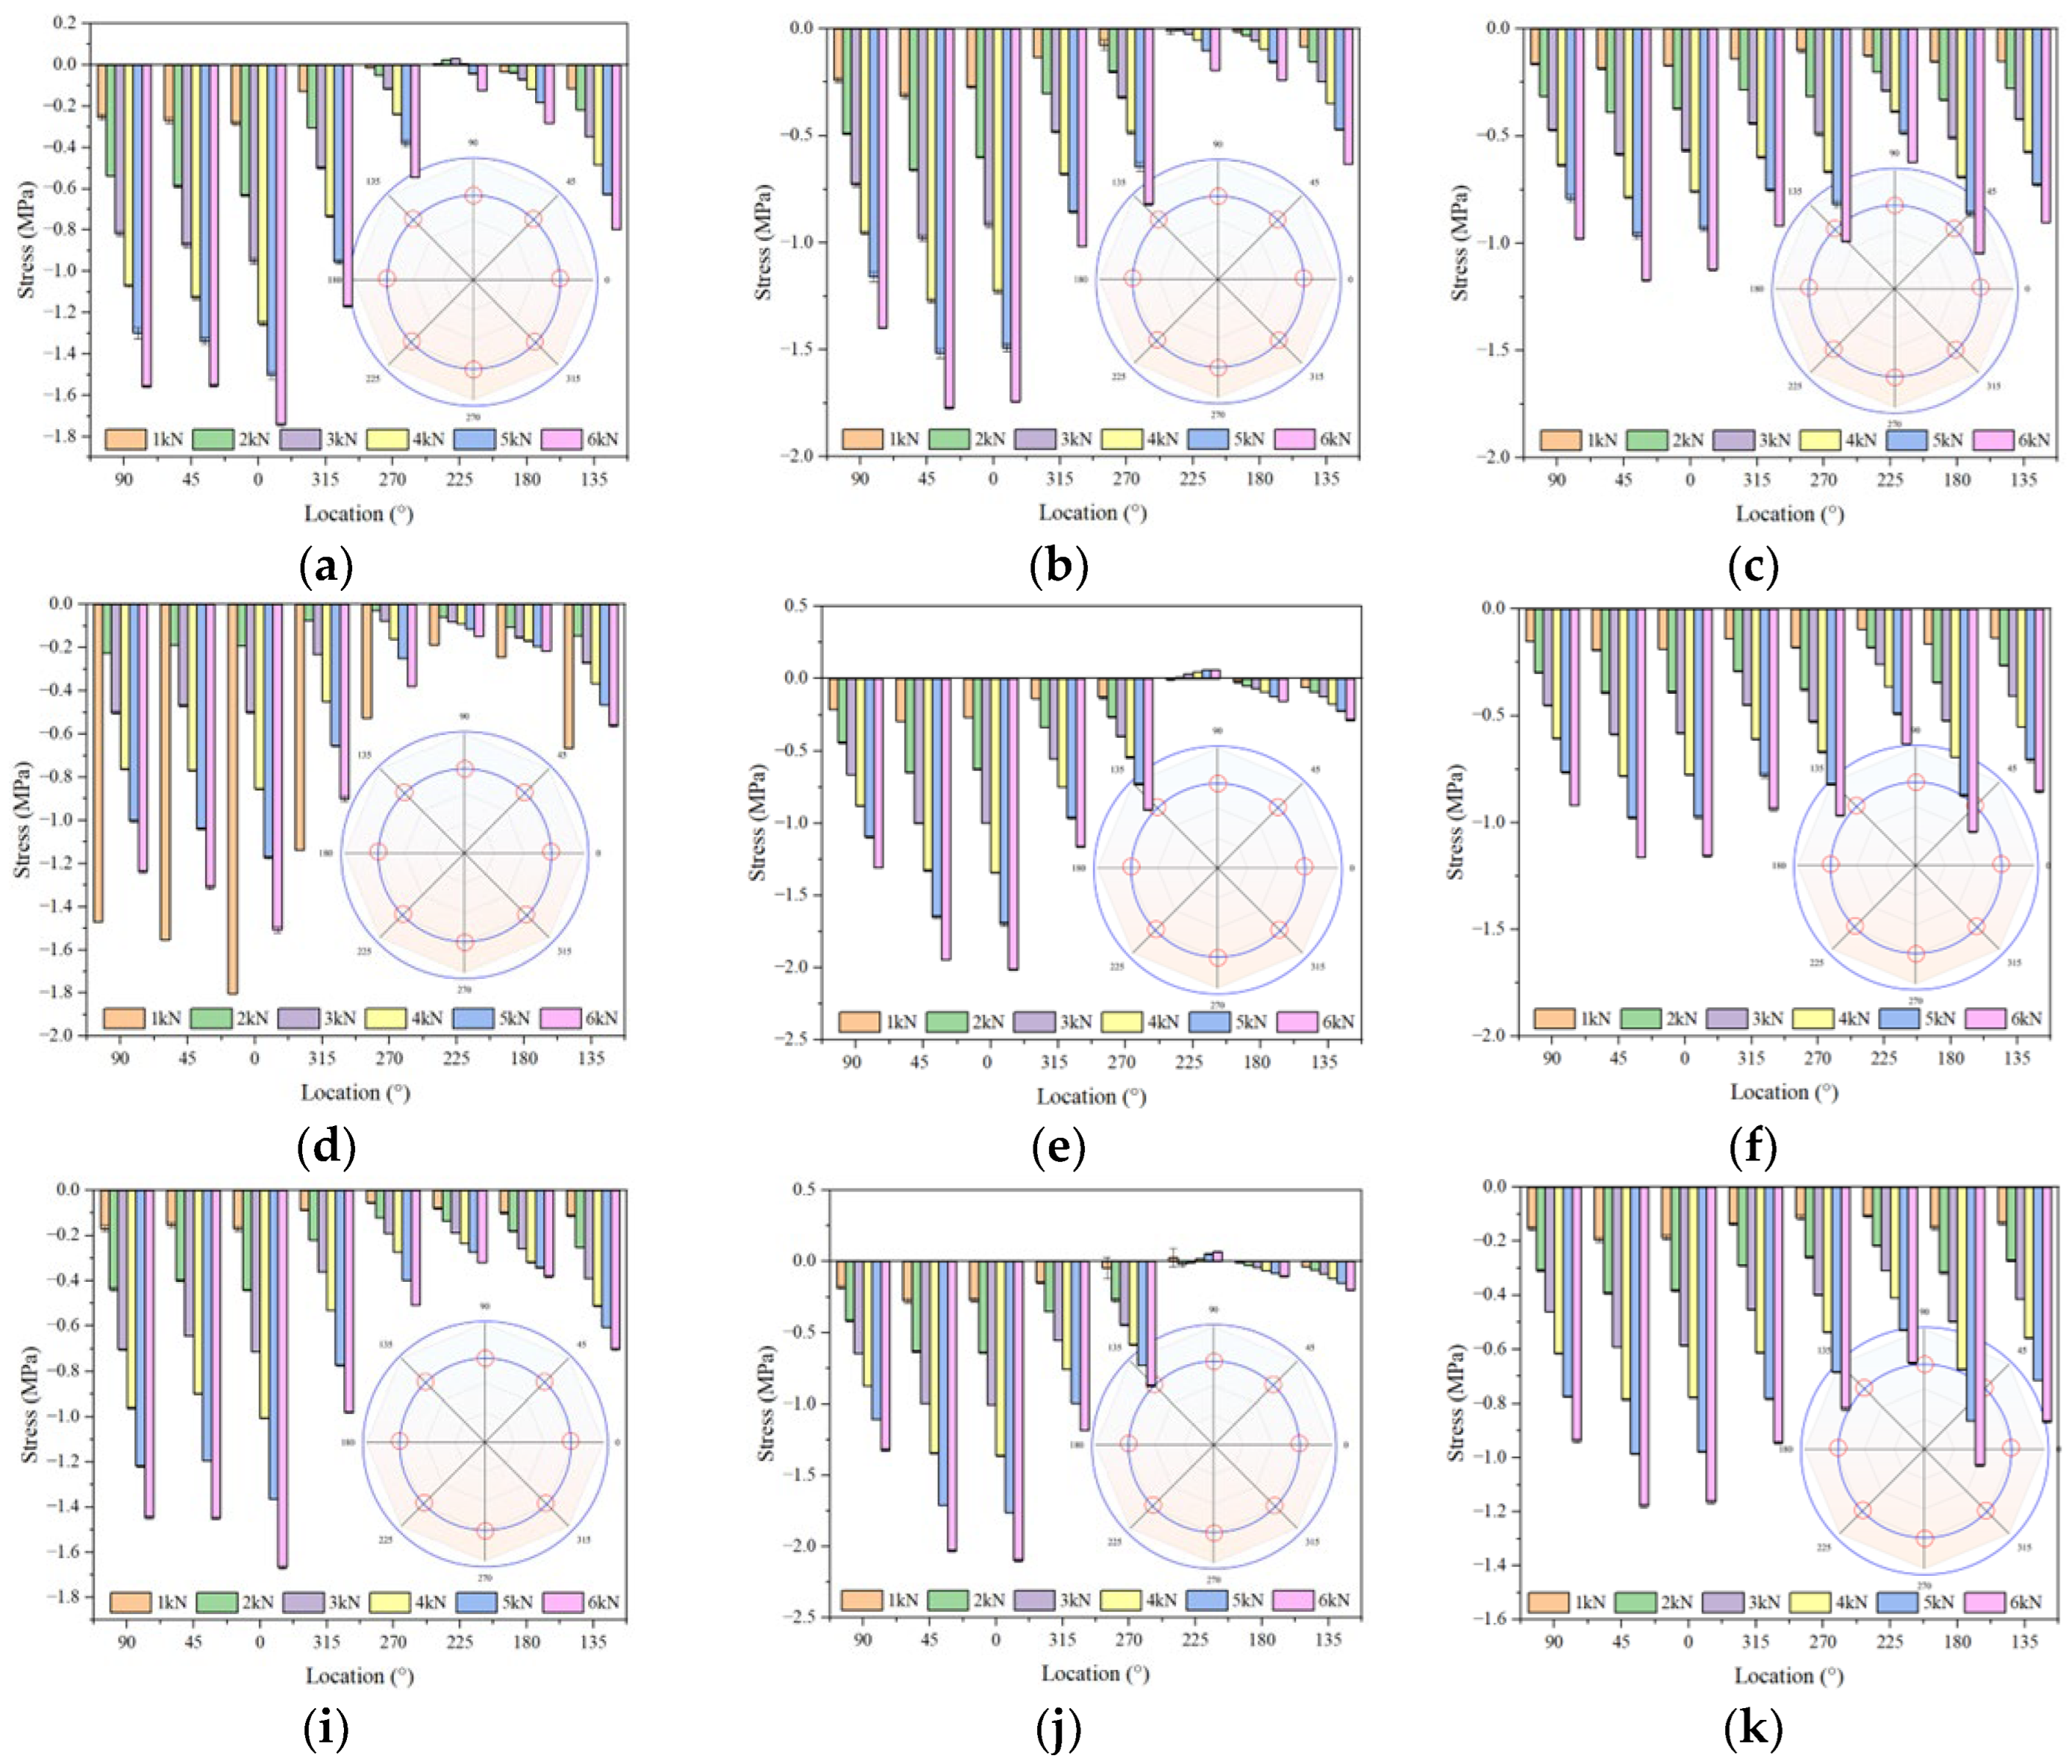
Figure 9.
Strain curve at the midpoint of the vault compression zone.
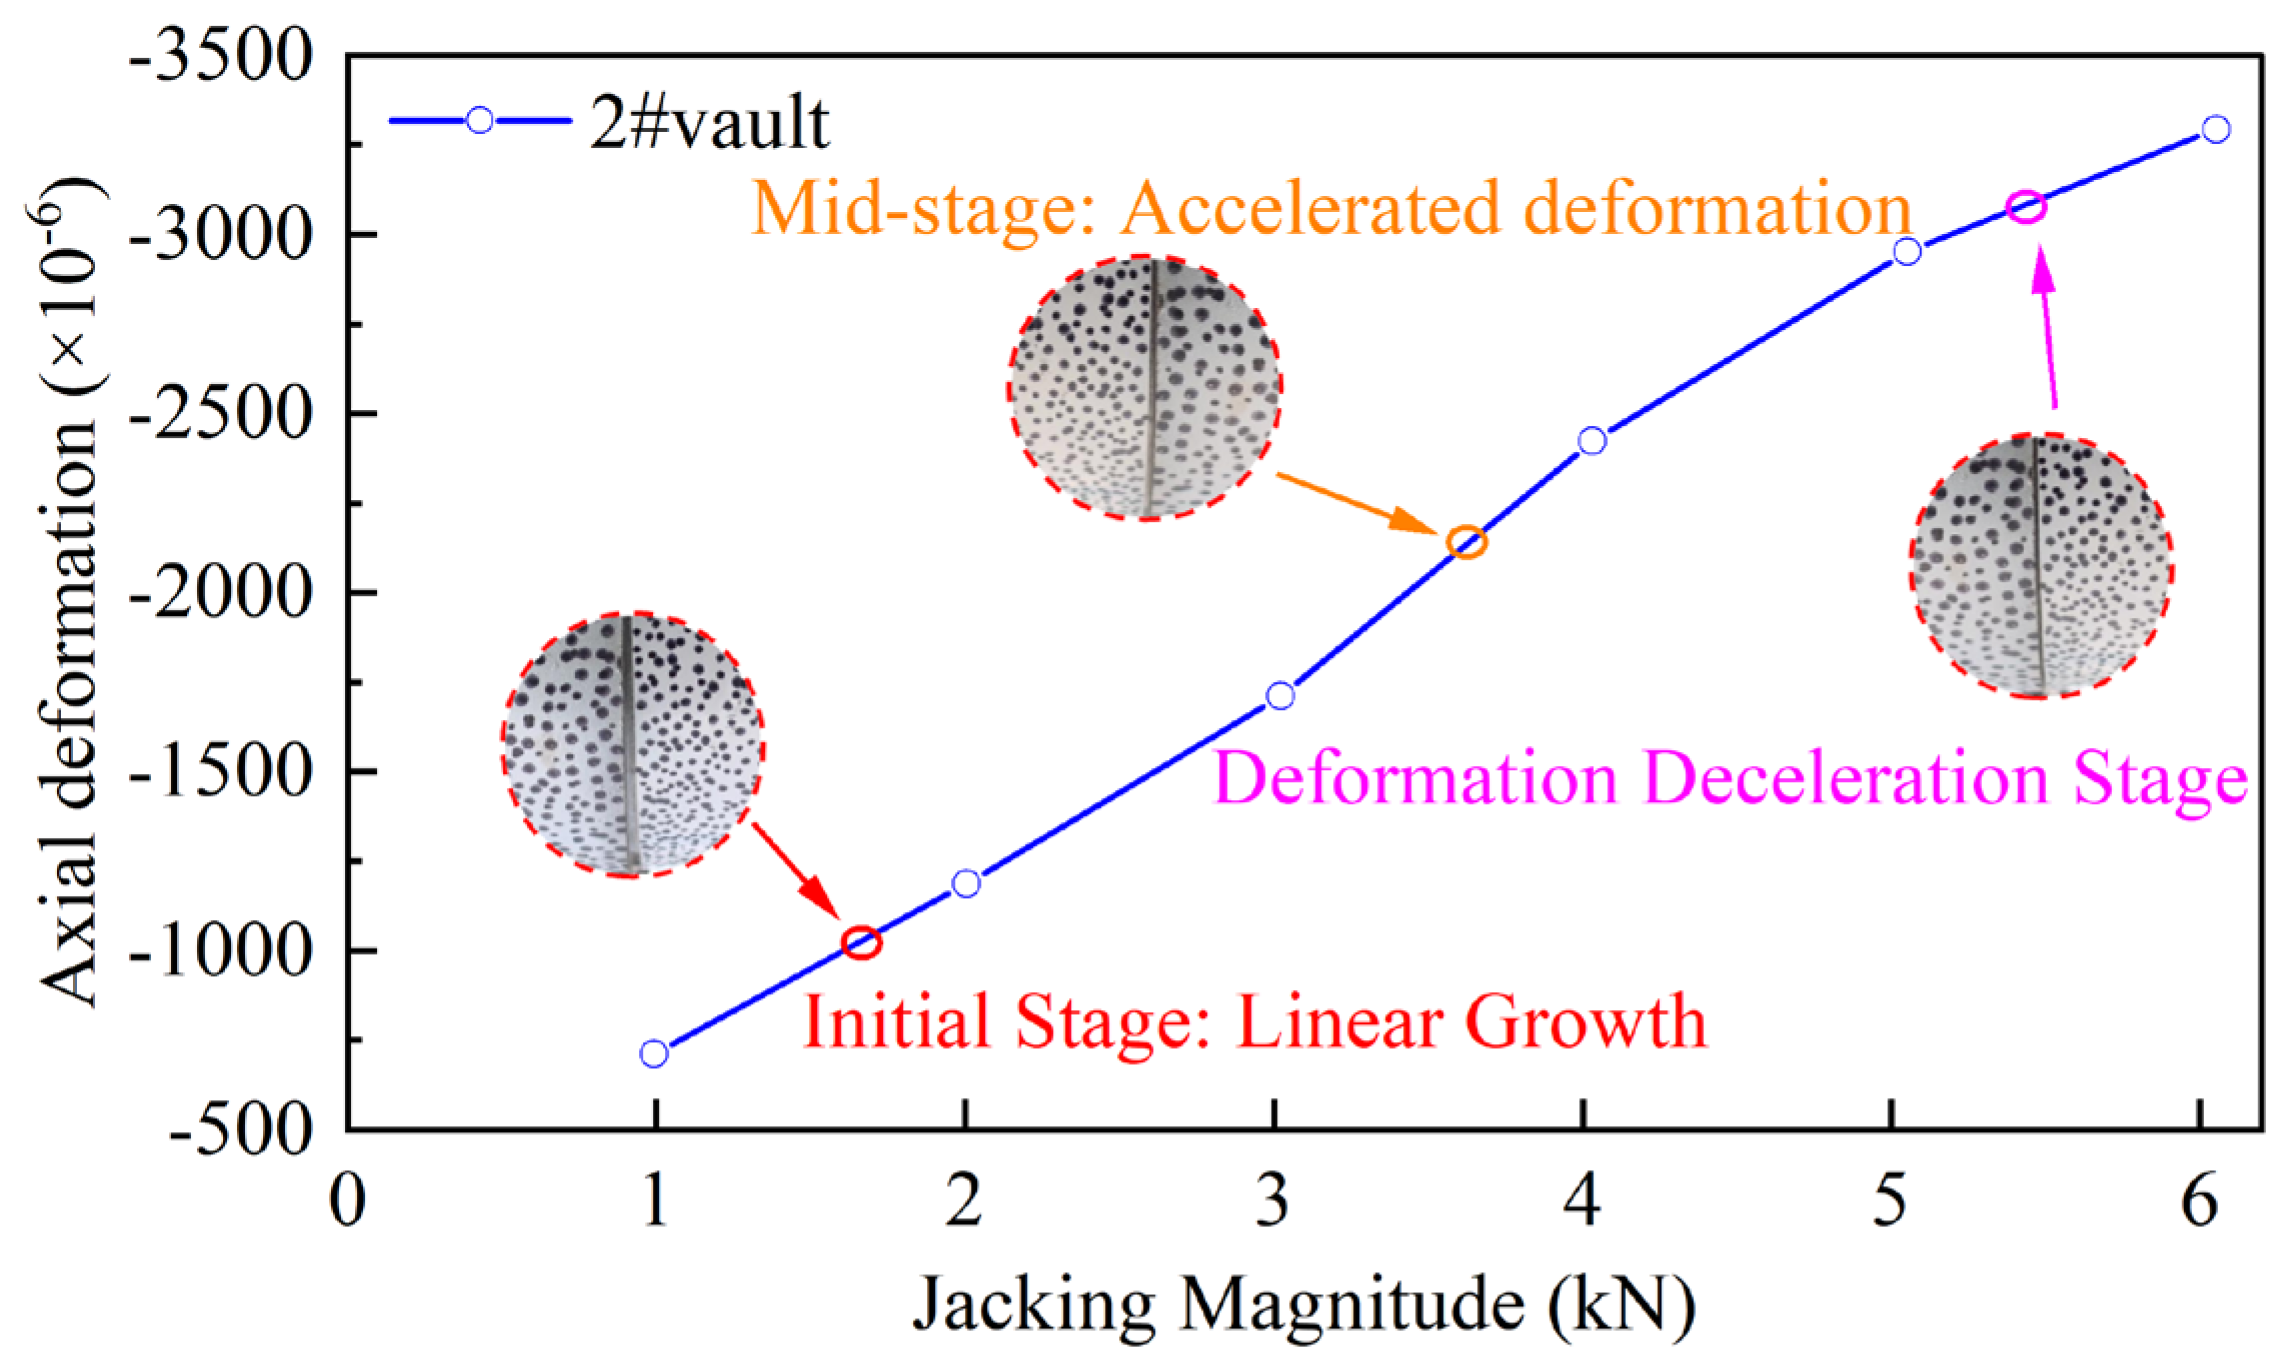
Figure 10.
Cloud diagram of axial strain distribution at DIC measurement point DS1: (a)0.5°; (b) 1°;(c)1.5°; (d)2.0°.
Figure 10.
Cloud diagram of axial strain distribution at DIC measurement point DS1: (a)0.5°; (b) 1°;(c)1.5°; (d)2.0°.
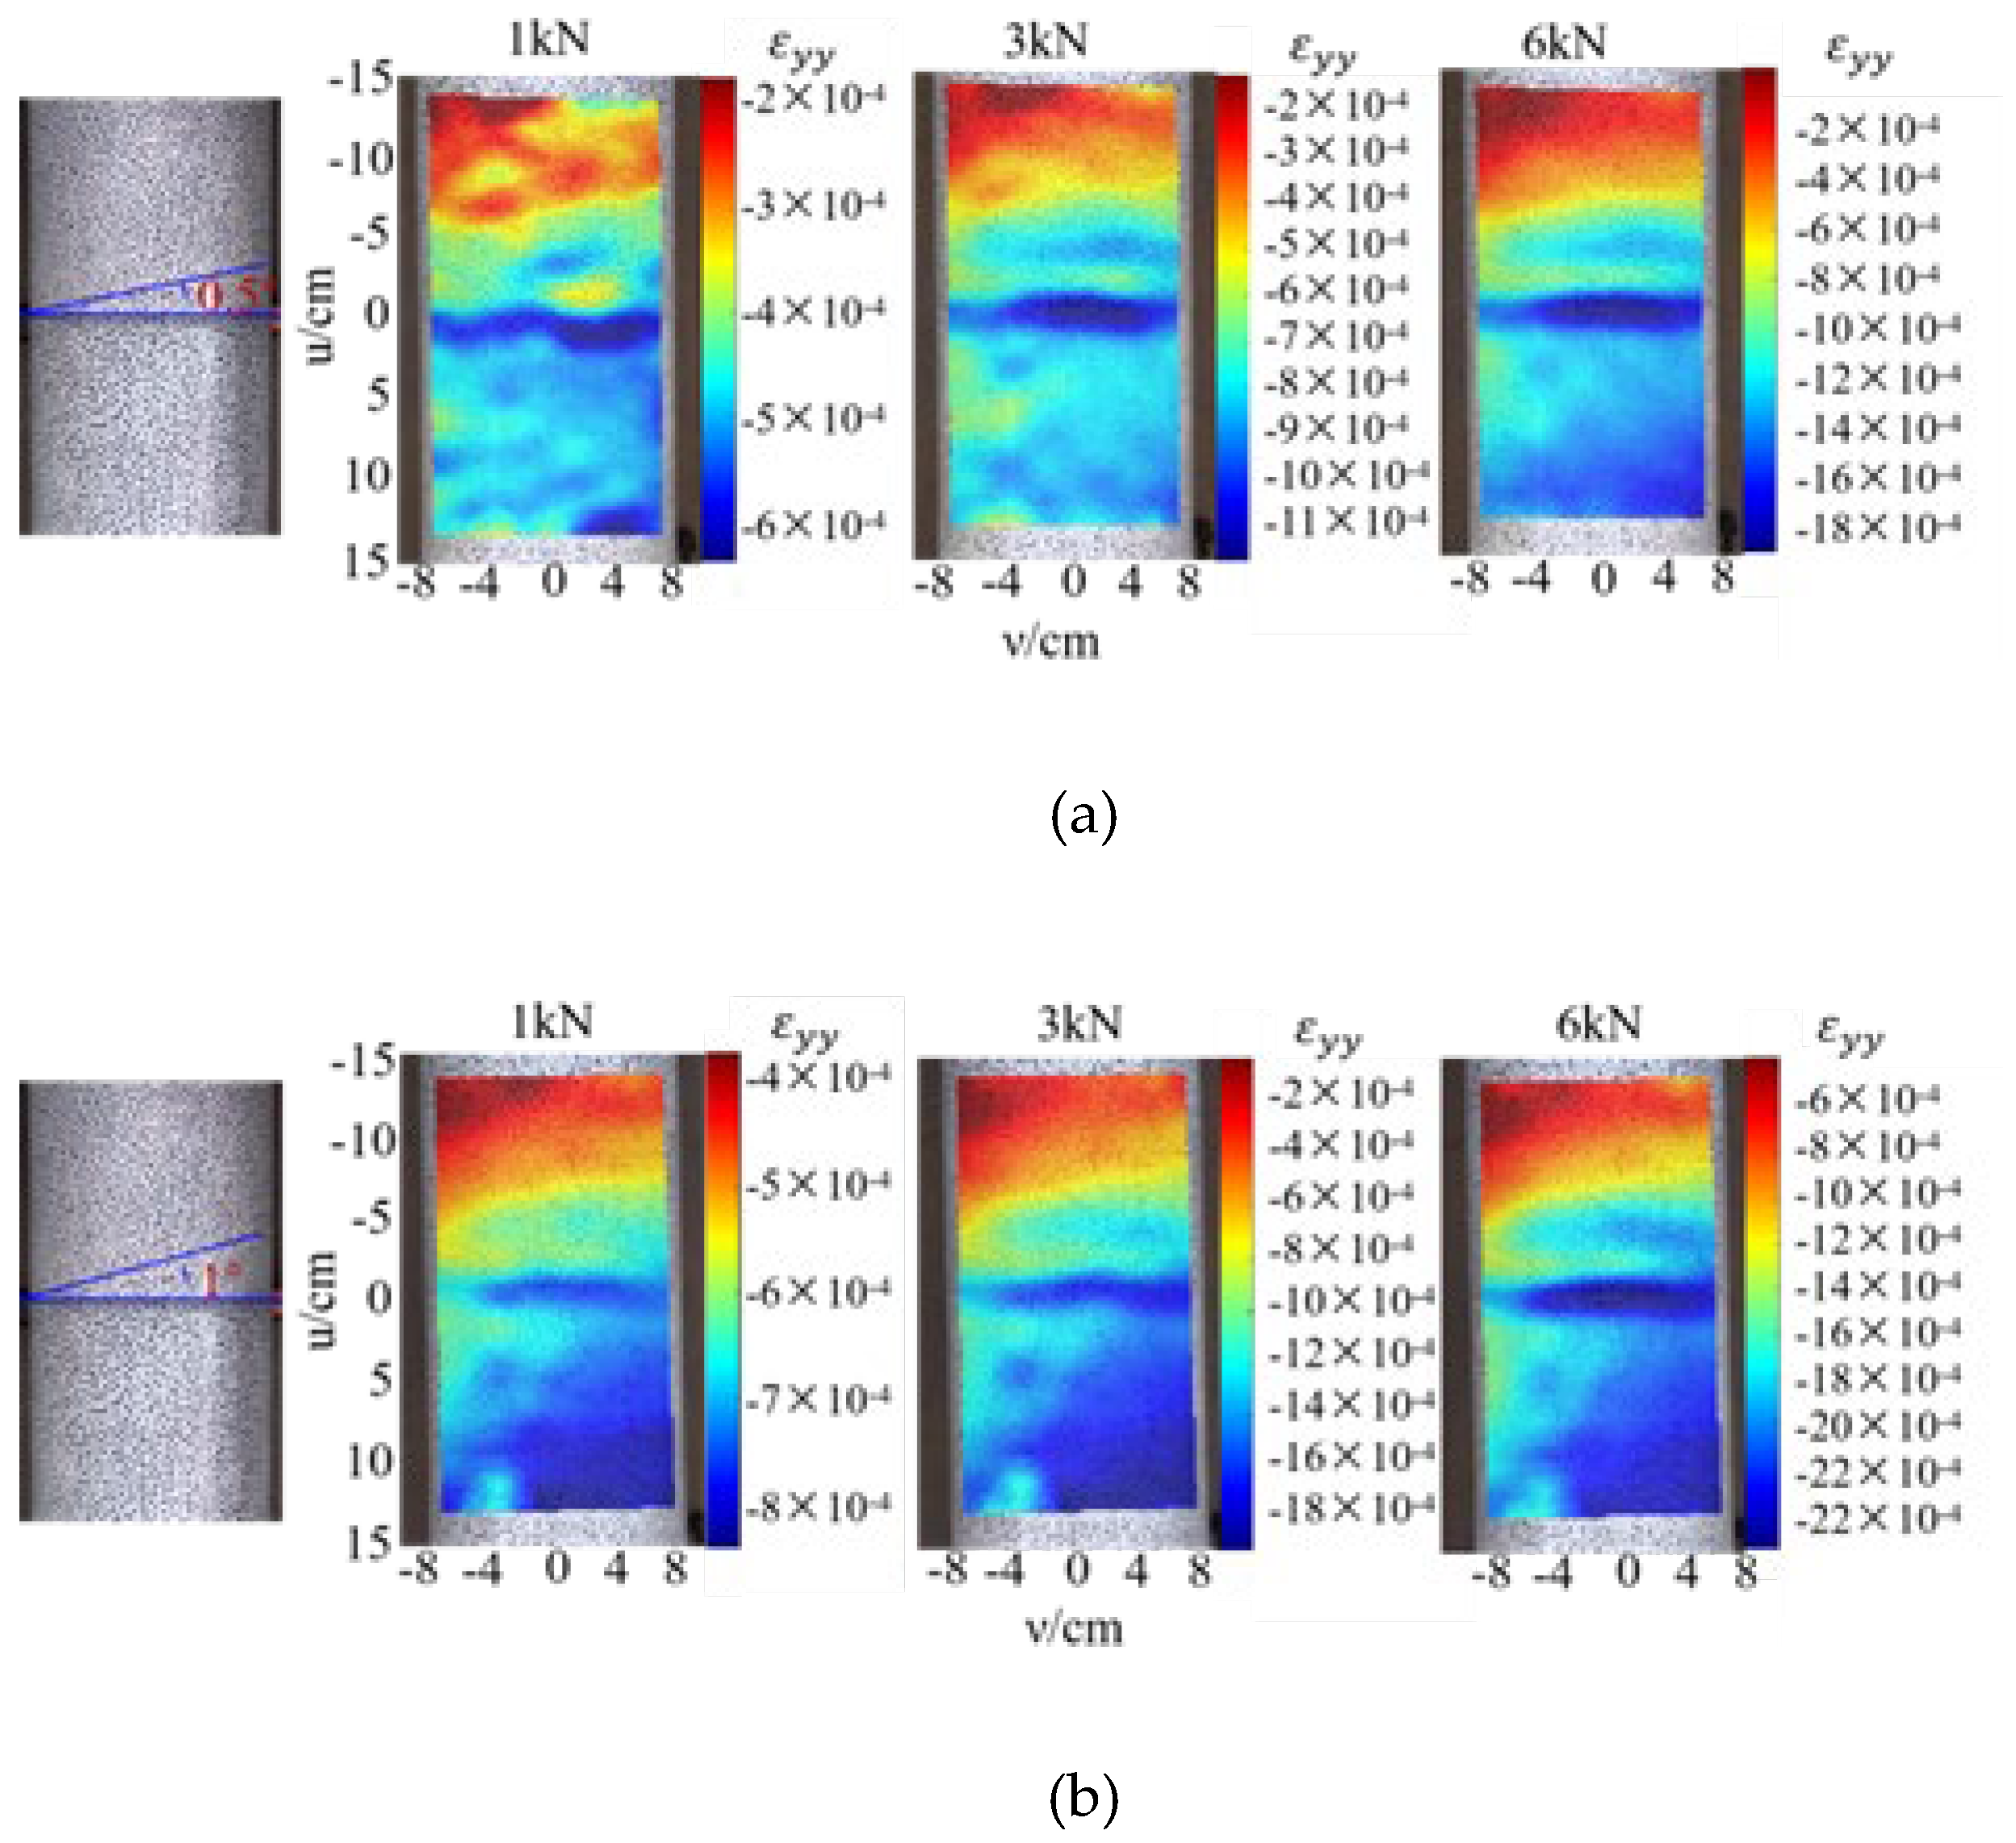
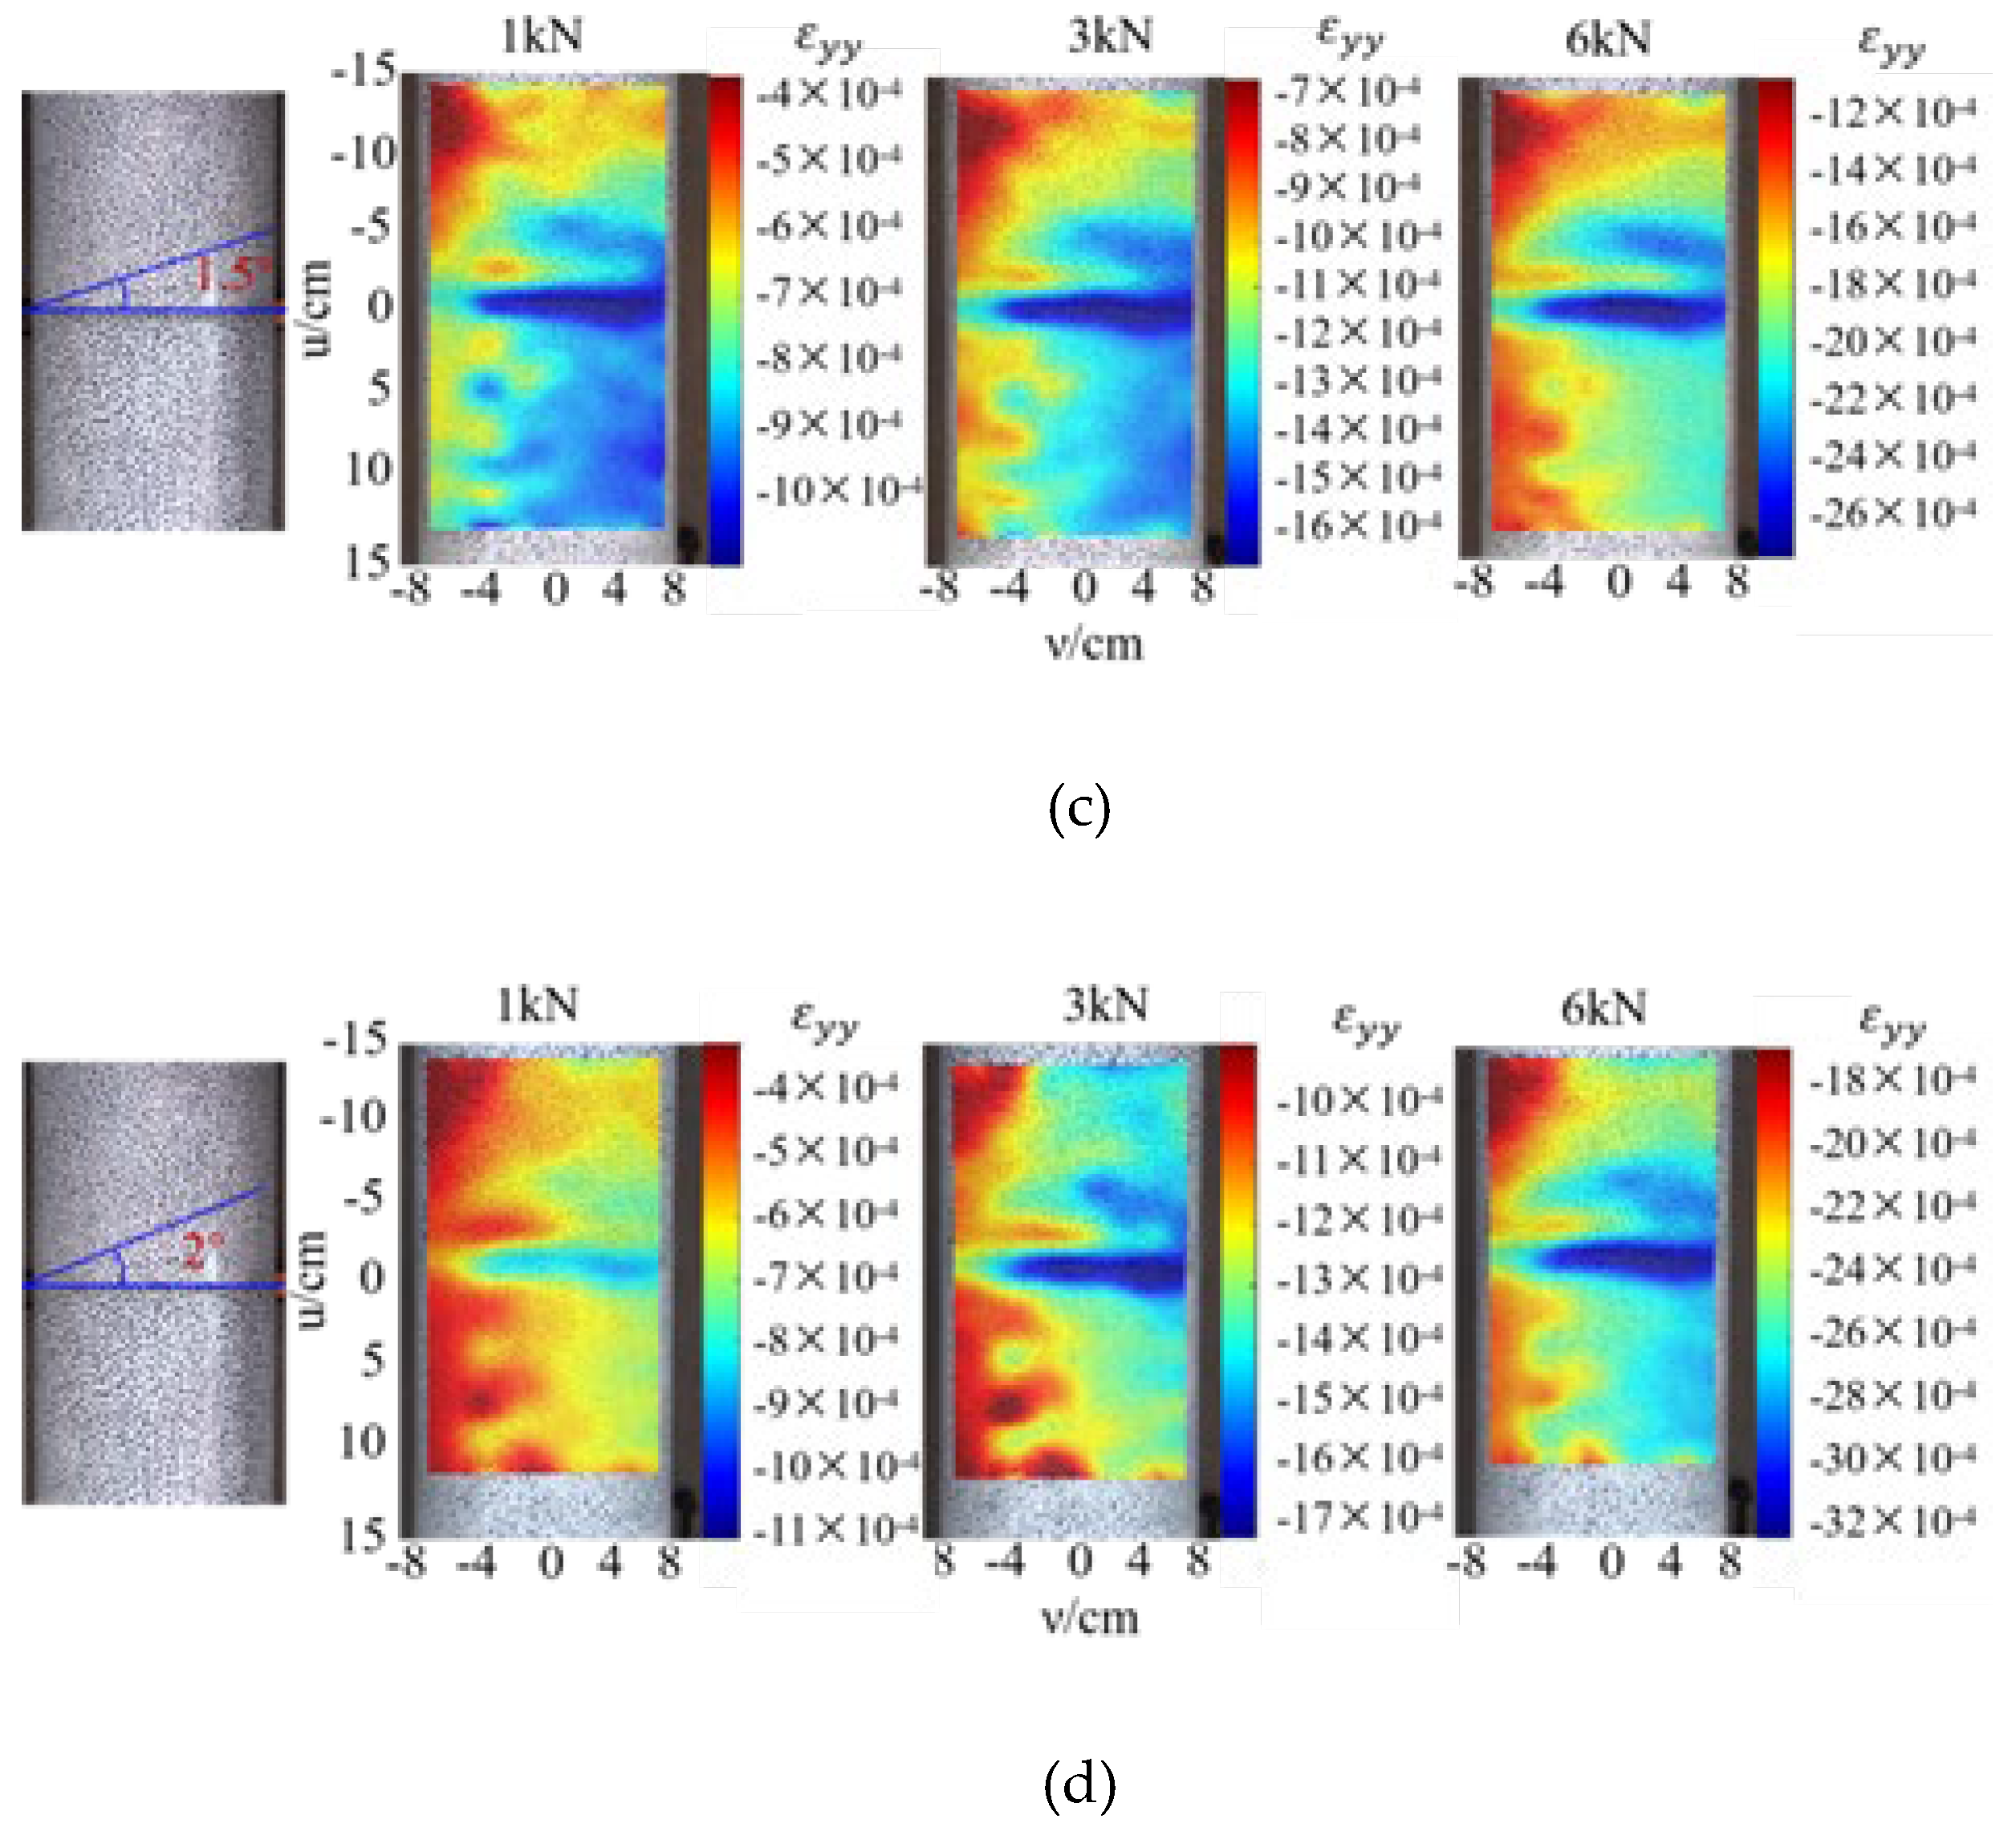
Figure 11.
Mechanical characteristics of the segment structure under single defect conditions: (a) Vault stress of segment #2 with 0° defect; (b) Bottom stress of segment #2 with 0° defect; (c) Vault stress of segment #2 with bottom 30° defect; (d) Bottom stress of segment #2 with bottom 30° defect; (e) Vault stress of segment #2 with bottom 45° defect; (f) Bottom stress of segment #2 with bottom 45° defect; (i) Vault stress of segment #2 with bottom 60° defect; (j) Bottom stress of segment #2 with bottom 60° defect; (k) Vault stress of segment #2 with bottom 75° defect; (l) Bottom stress of segment #2 with bottom 75° defect; (m) Vault stress of segment #2 with bottom 90° defect; (n) Bottom stress of segment #2 with bottom 90° defect.
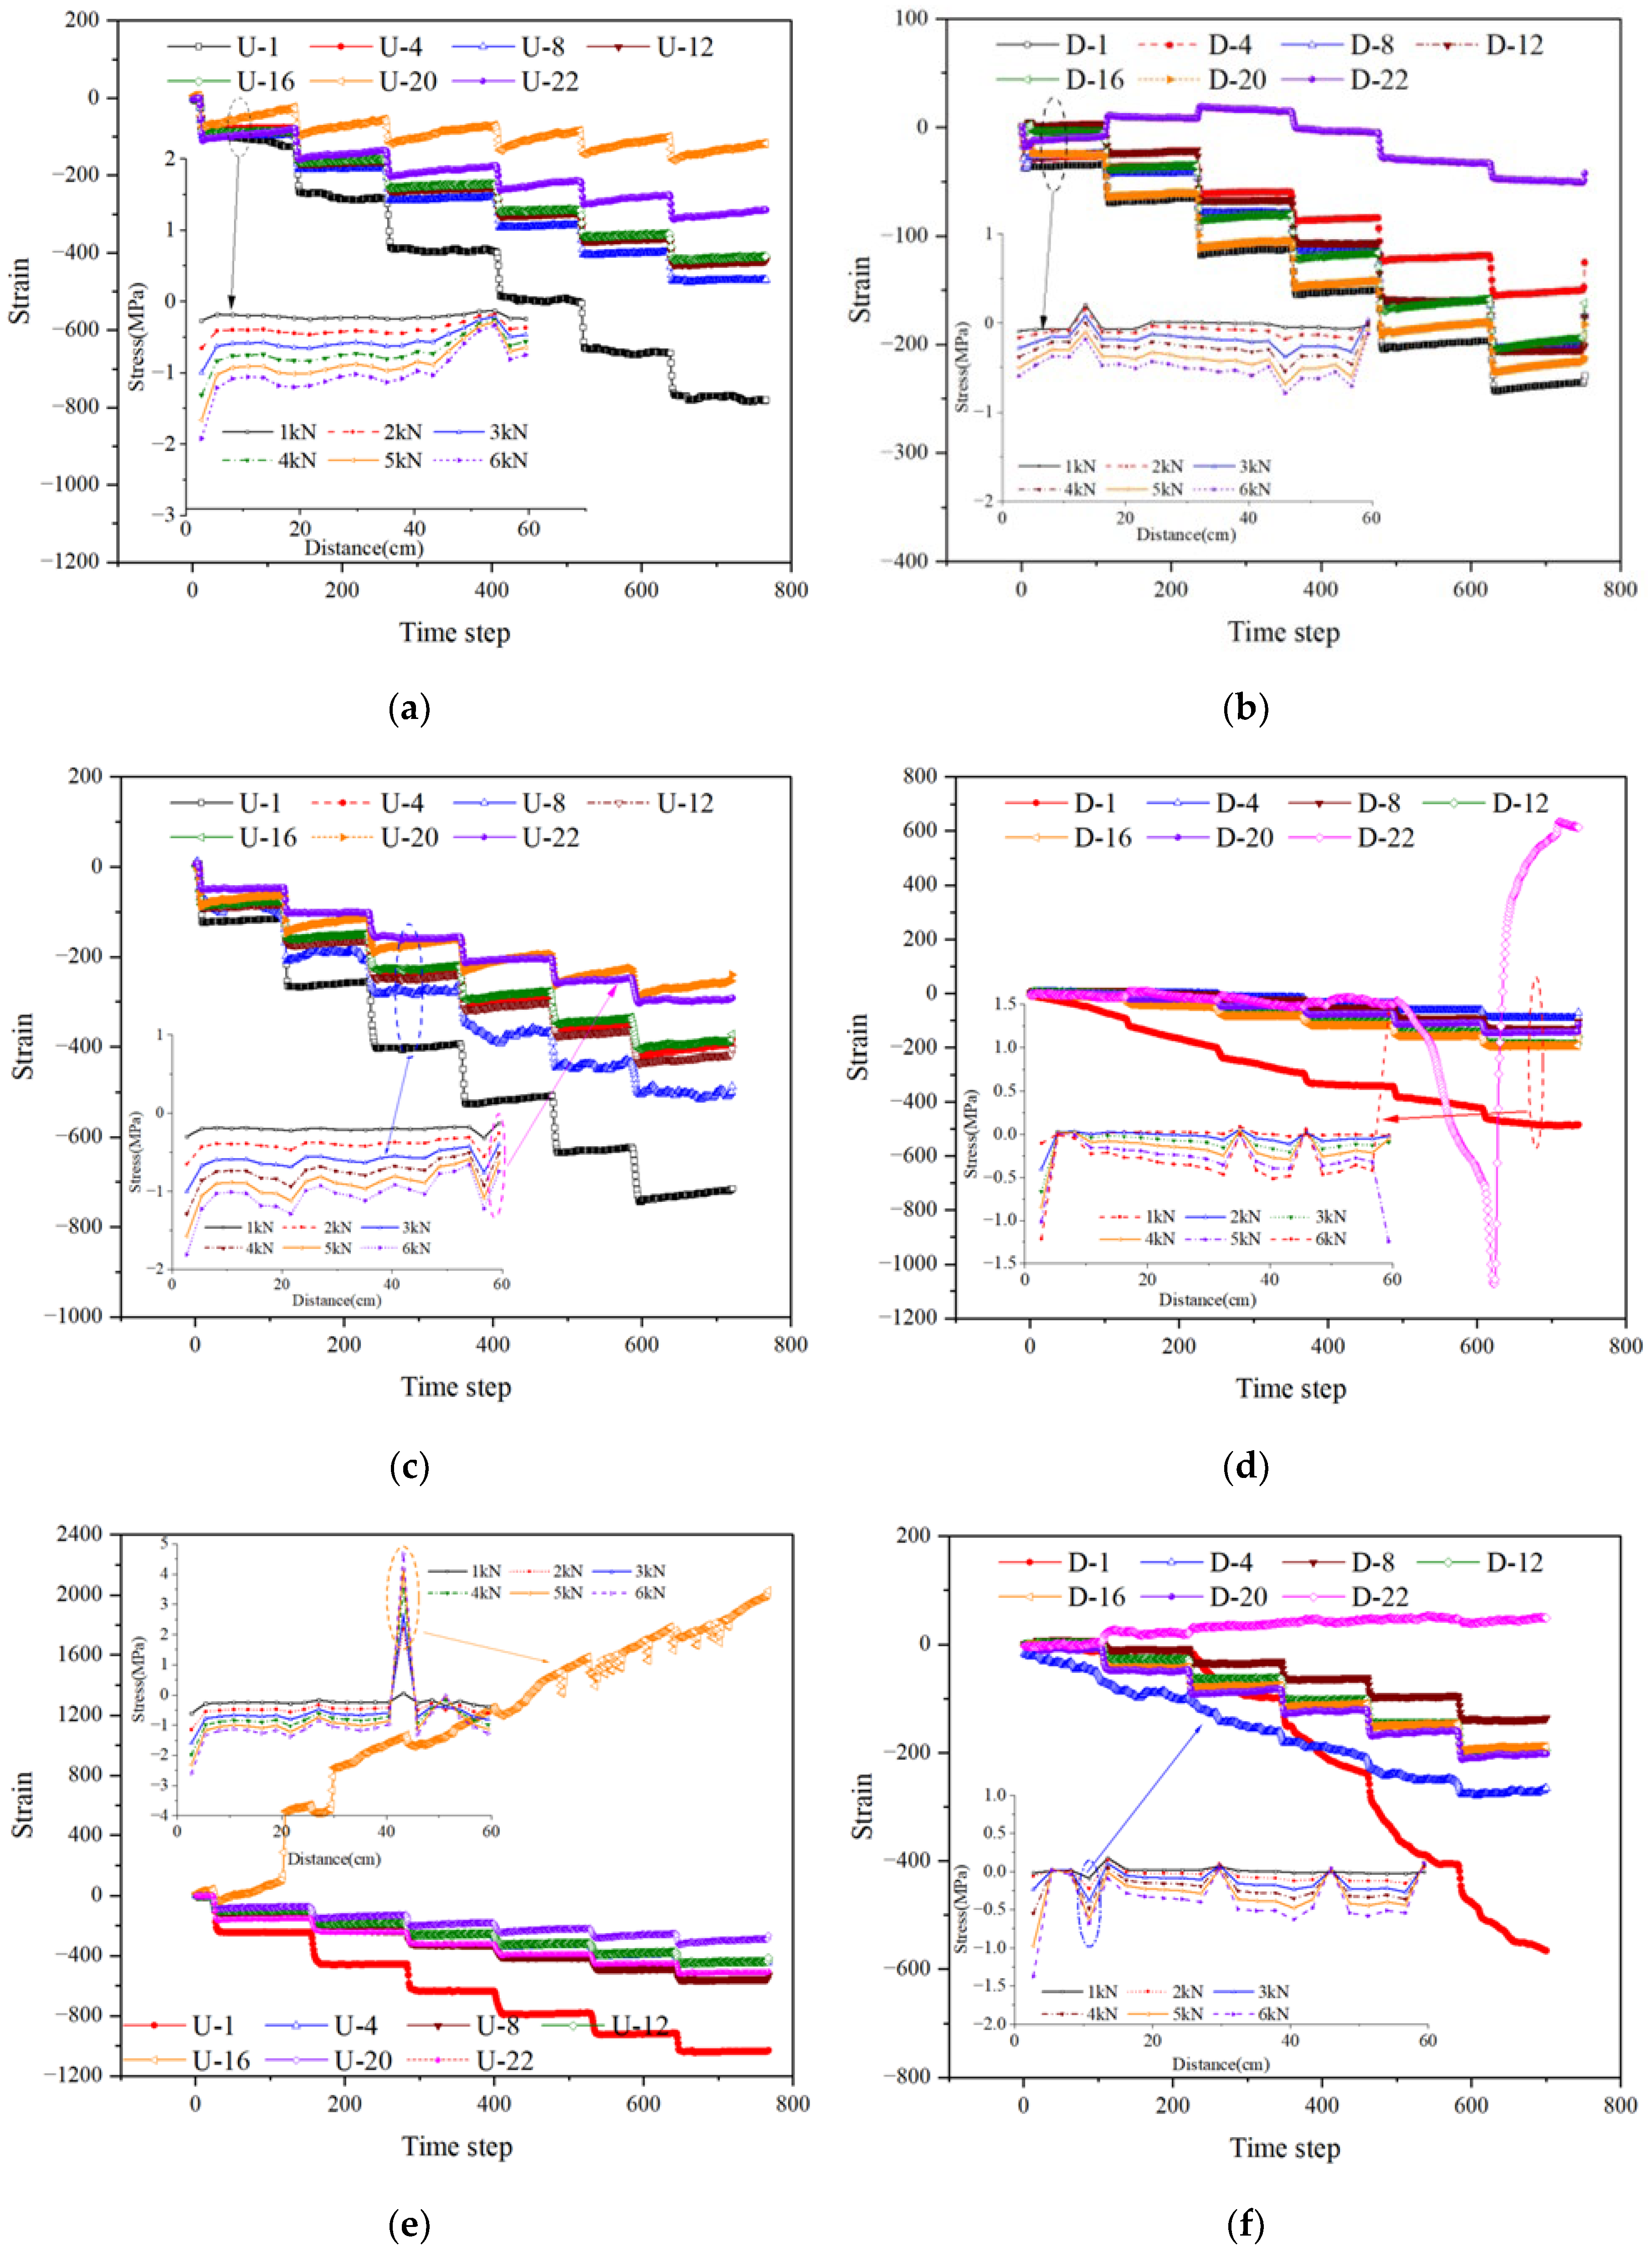
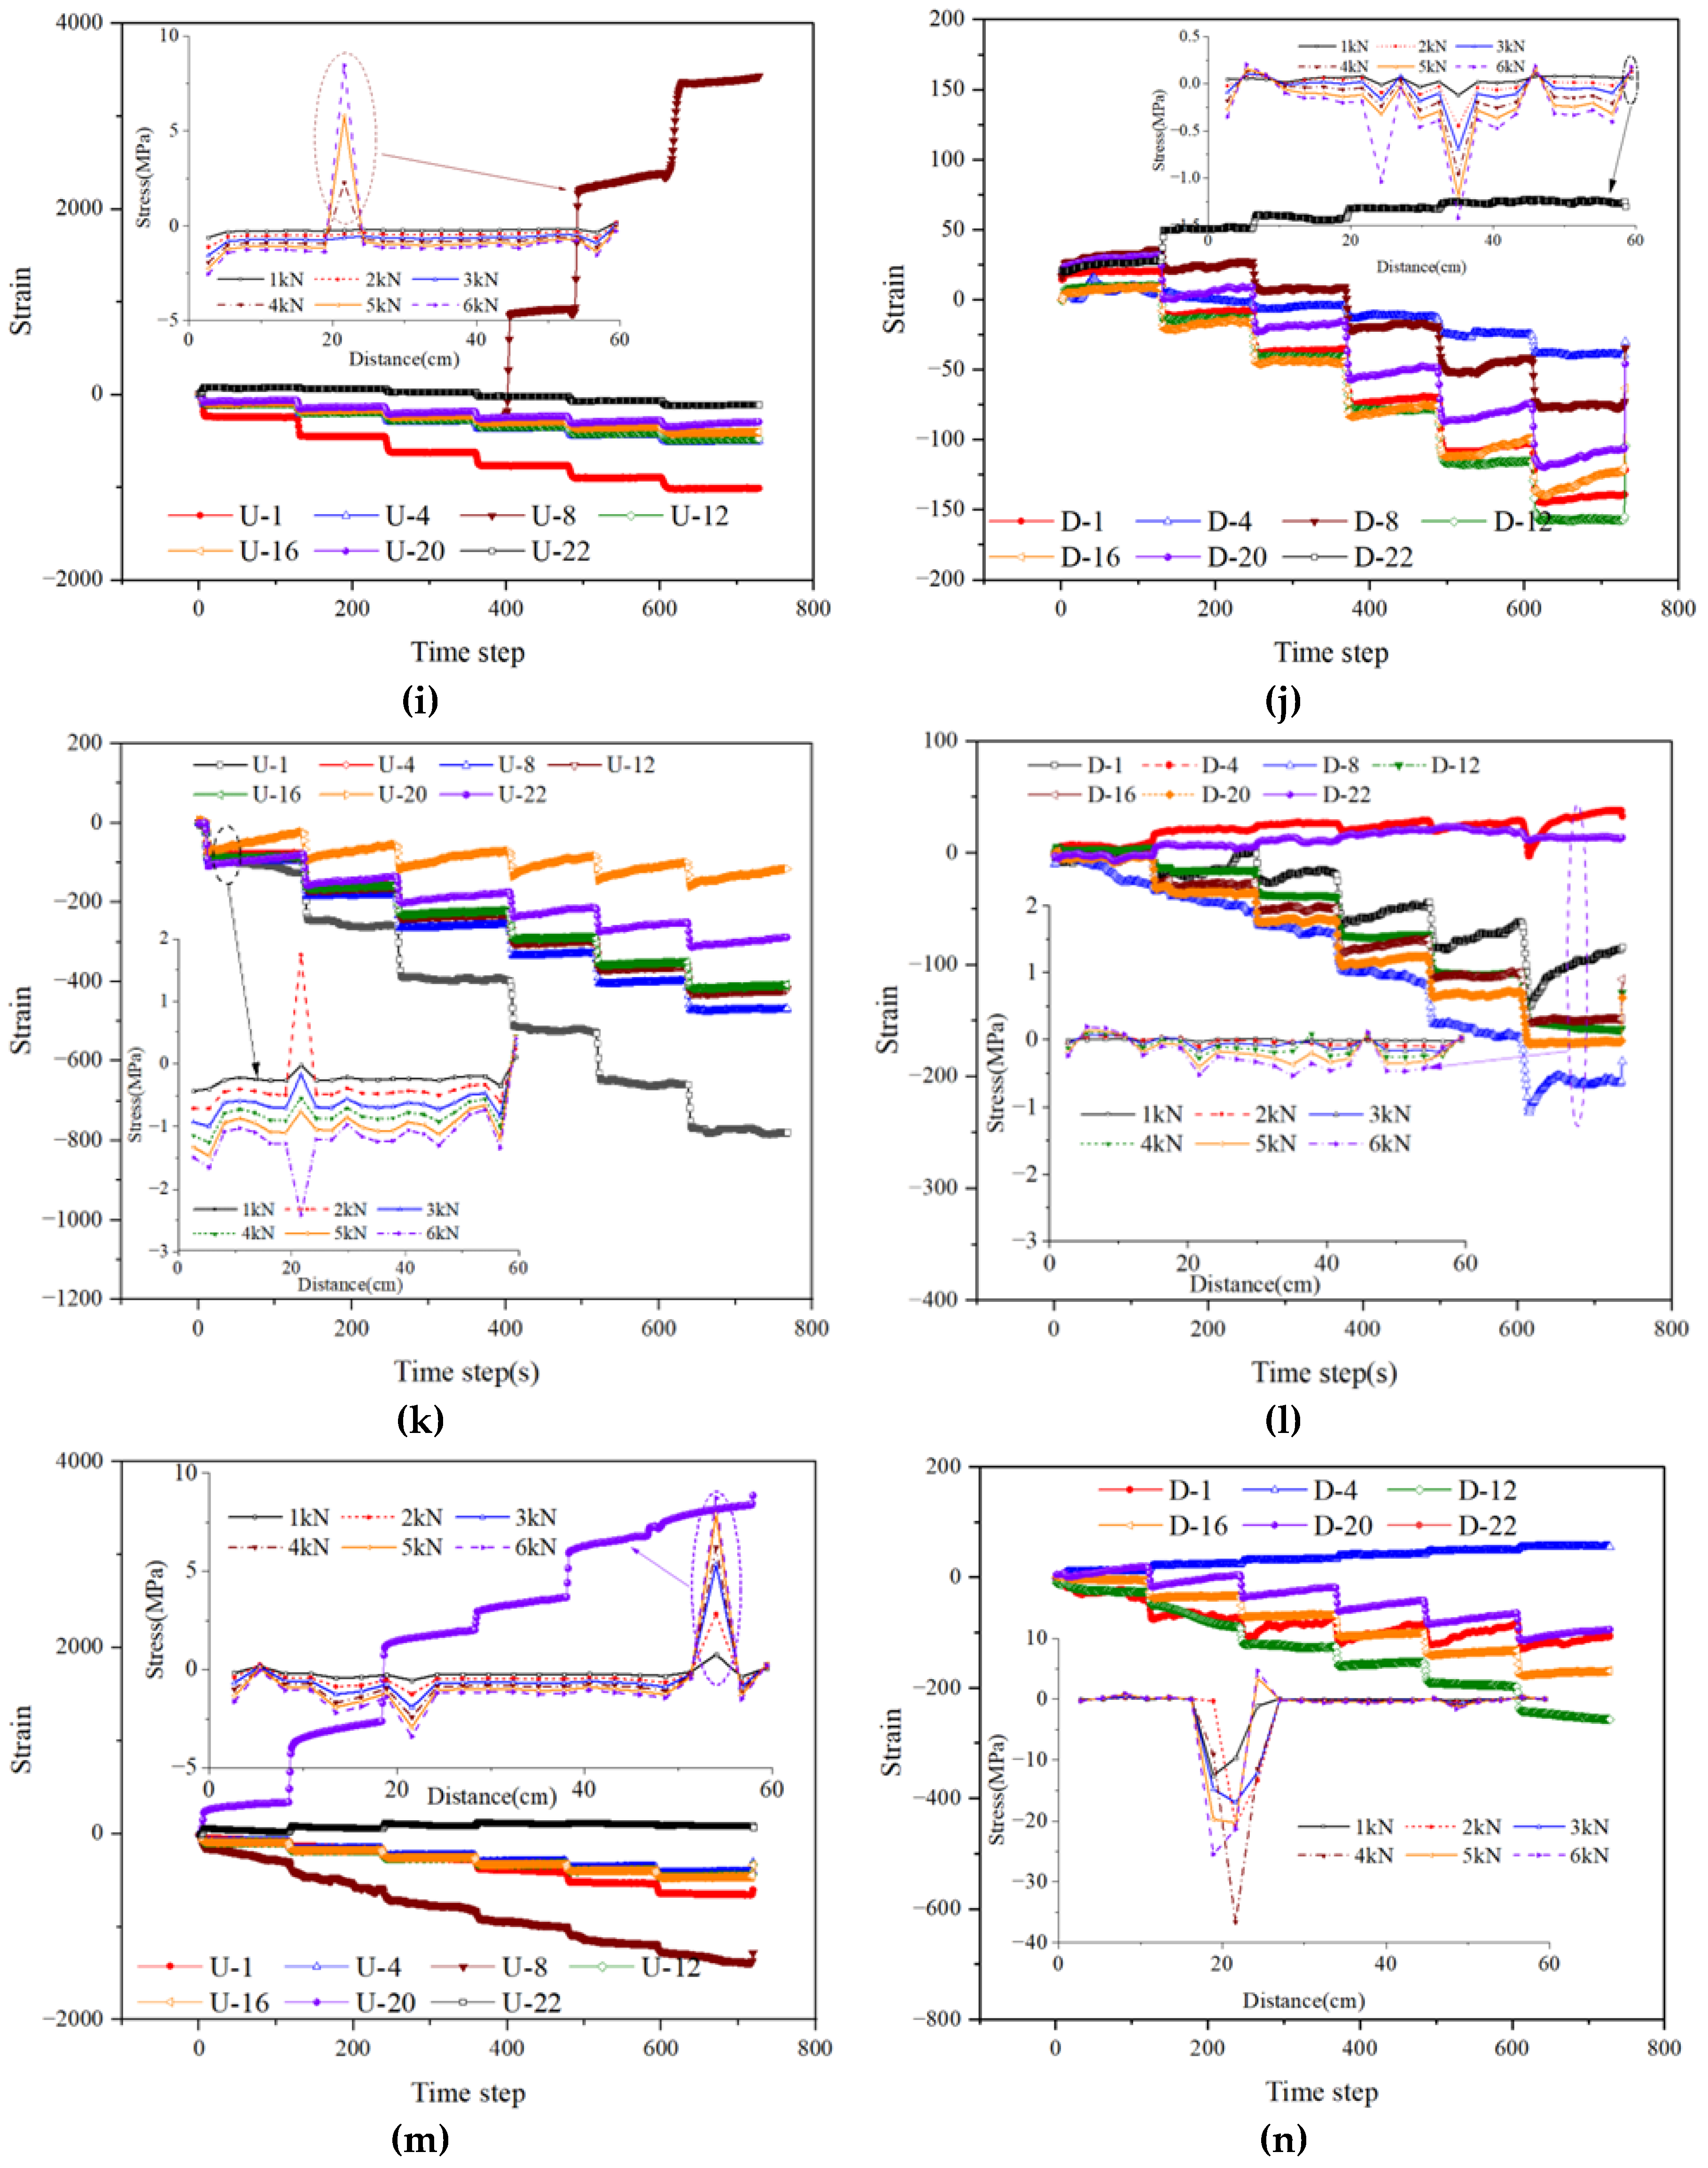
Figure 12.
Mechanical characteristics of the segment structure under combined defect conditions: (a) Vault stress of segment #2 with bottom 90° & vault 30° defects; (b) Bottom stress of segment #2 with bottom 90°& vault 30° defects; (c) Vault stress of segment #2 with bottom 90° & vault 45° defects; (d) Bottom stress of segment #2 with bottom 90°& vault45° defects; (e) Vault stress of segment #2 with bottom 90° & vault 60° defects; (f) Bottom stress of segment #2 with bottom 90°& vault 60° defects; (i) Vault stress of segment #2 with bottom 90° & vault 75° defects; (j) Bottom stress of segment #2 with bottom 90°& vault 75° defects; (k) Vault stress of segment #2 with bottom 90° & vault 90° defects; (l) Bottom stress of segment #2 with bottom 90°& vault 90° defects.
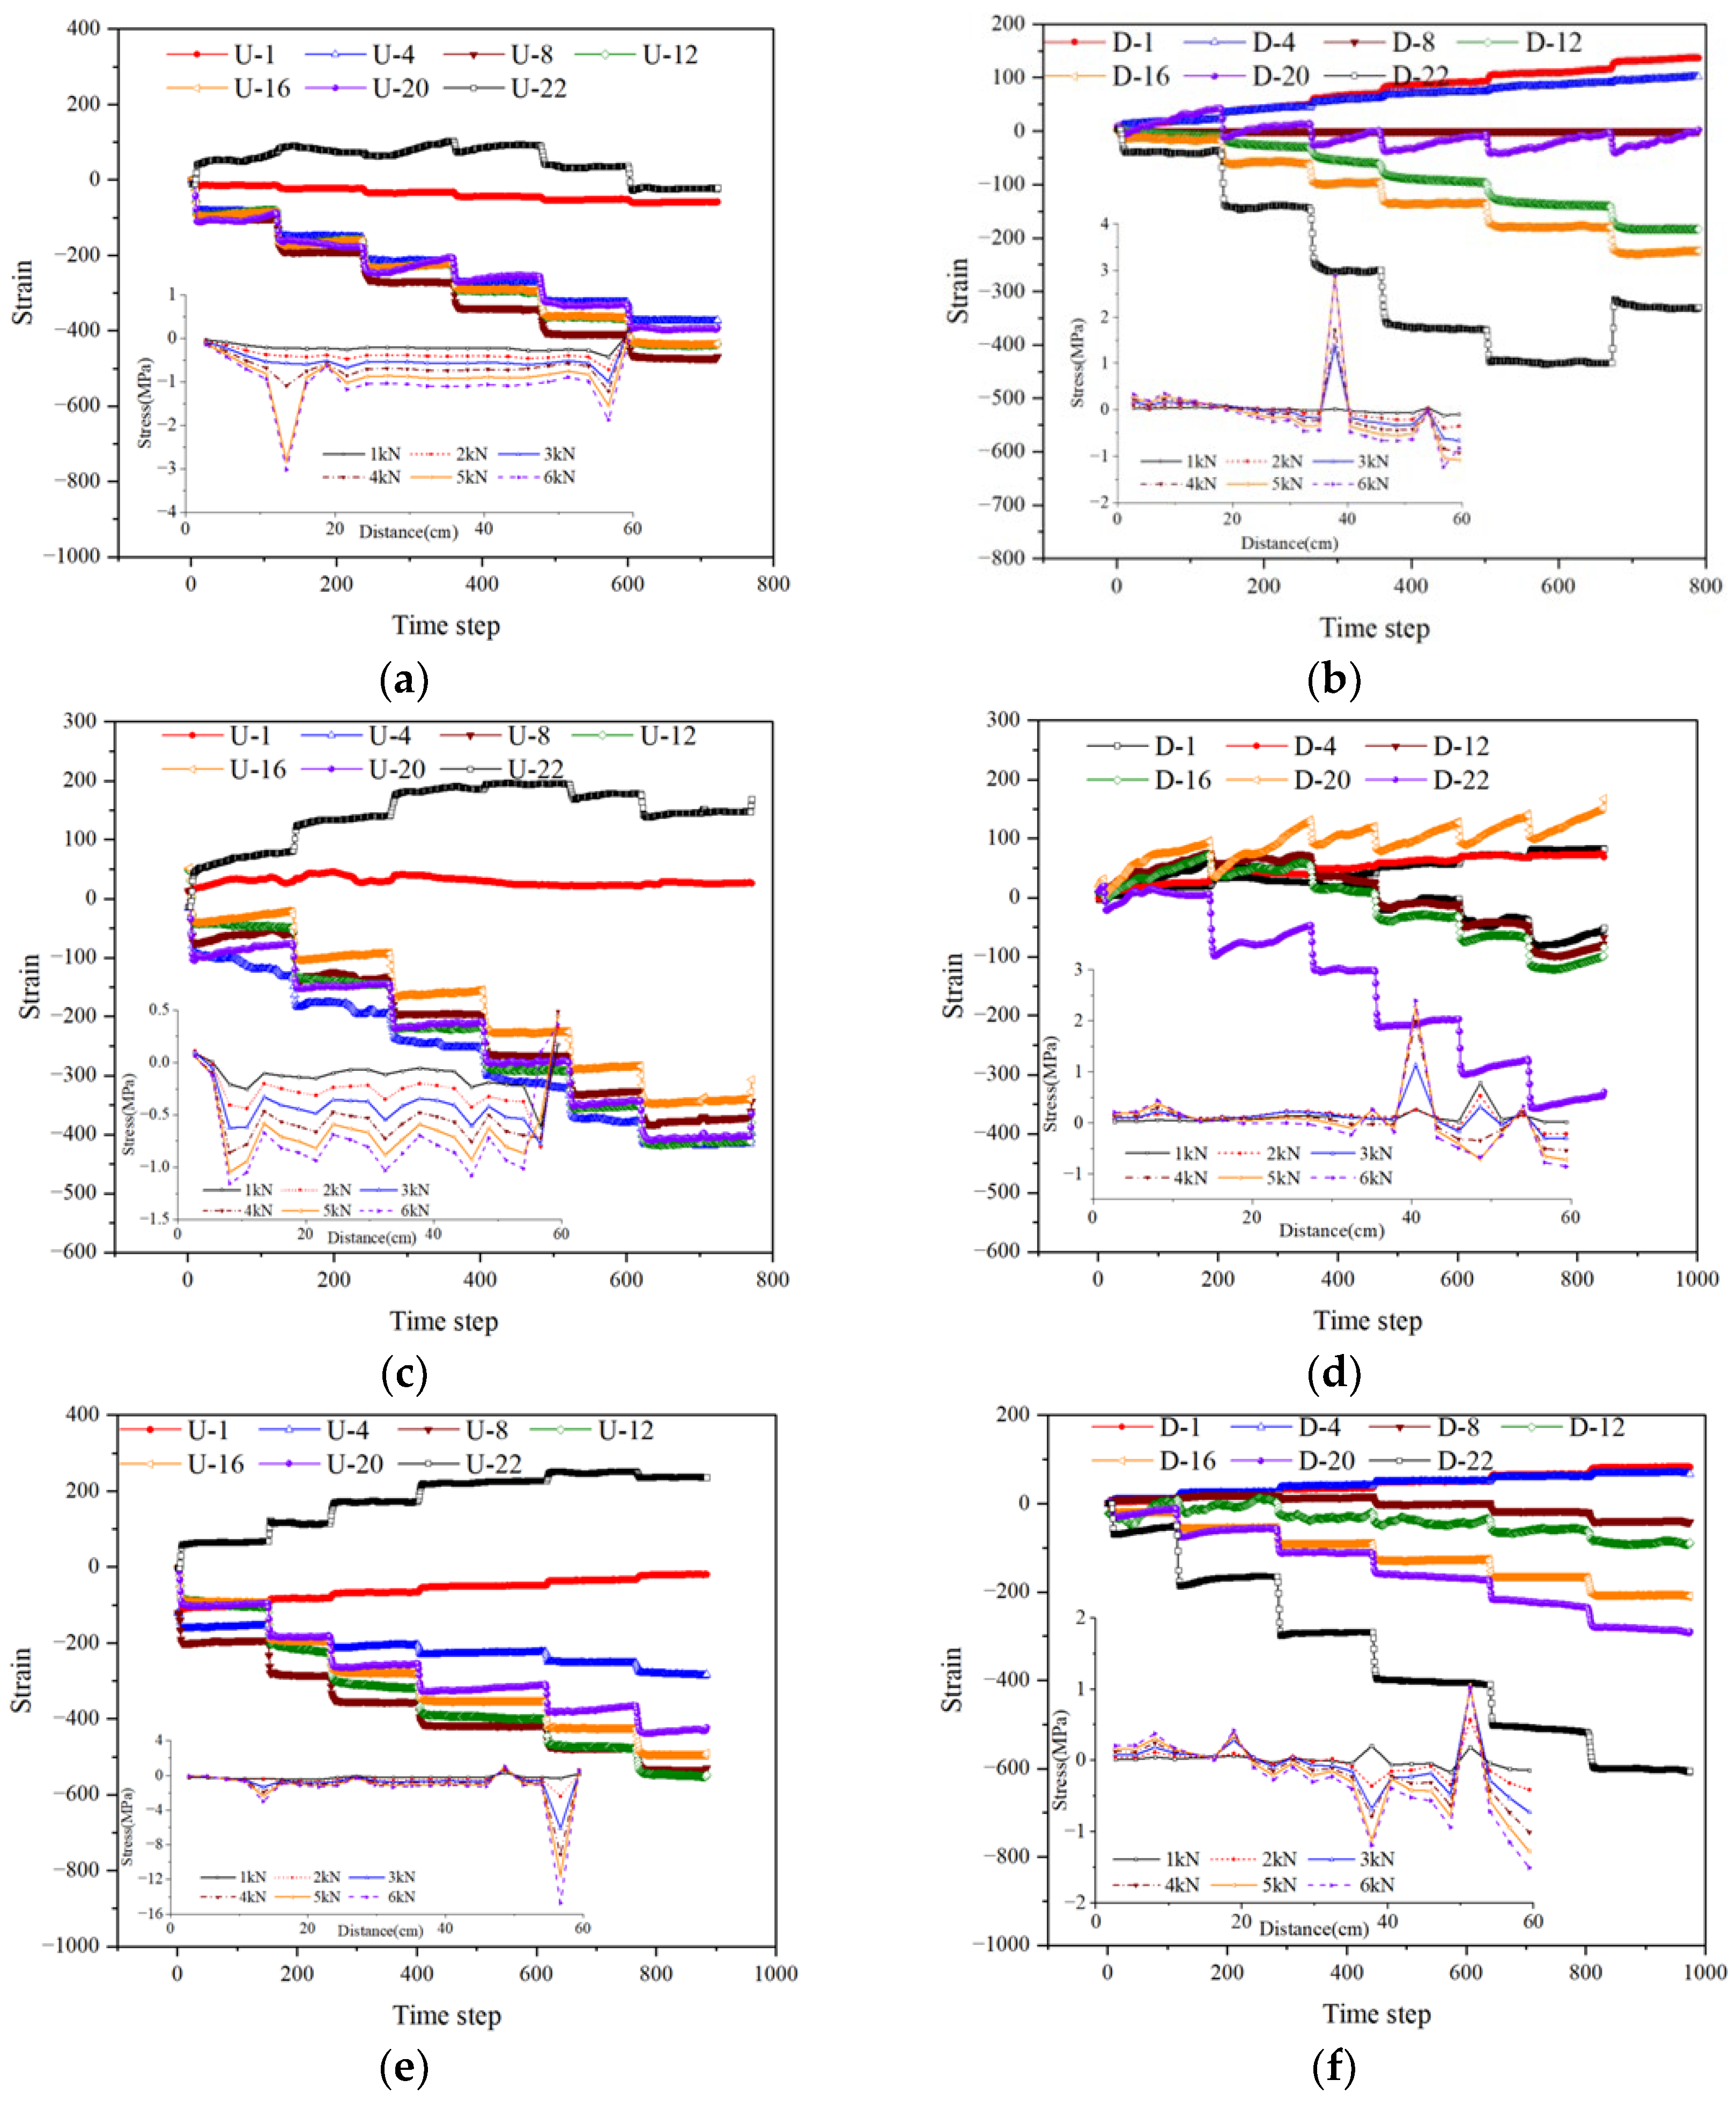
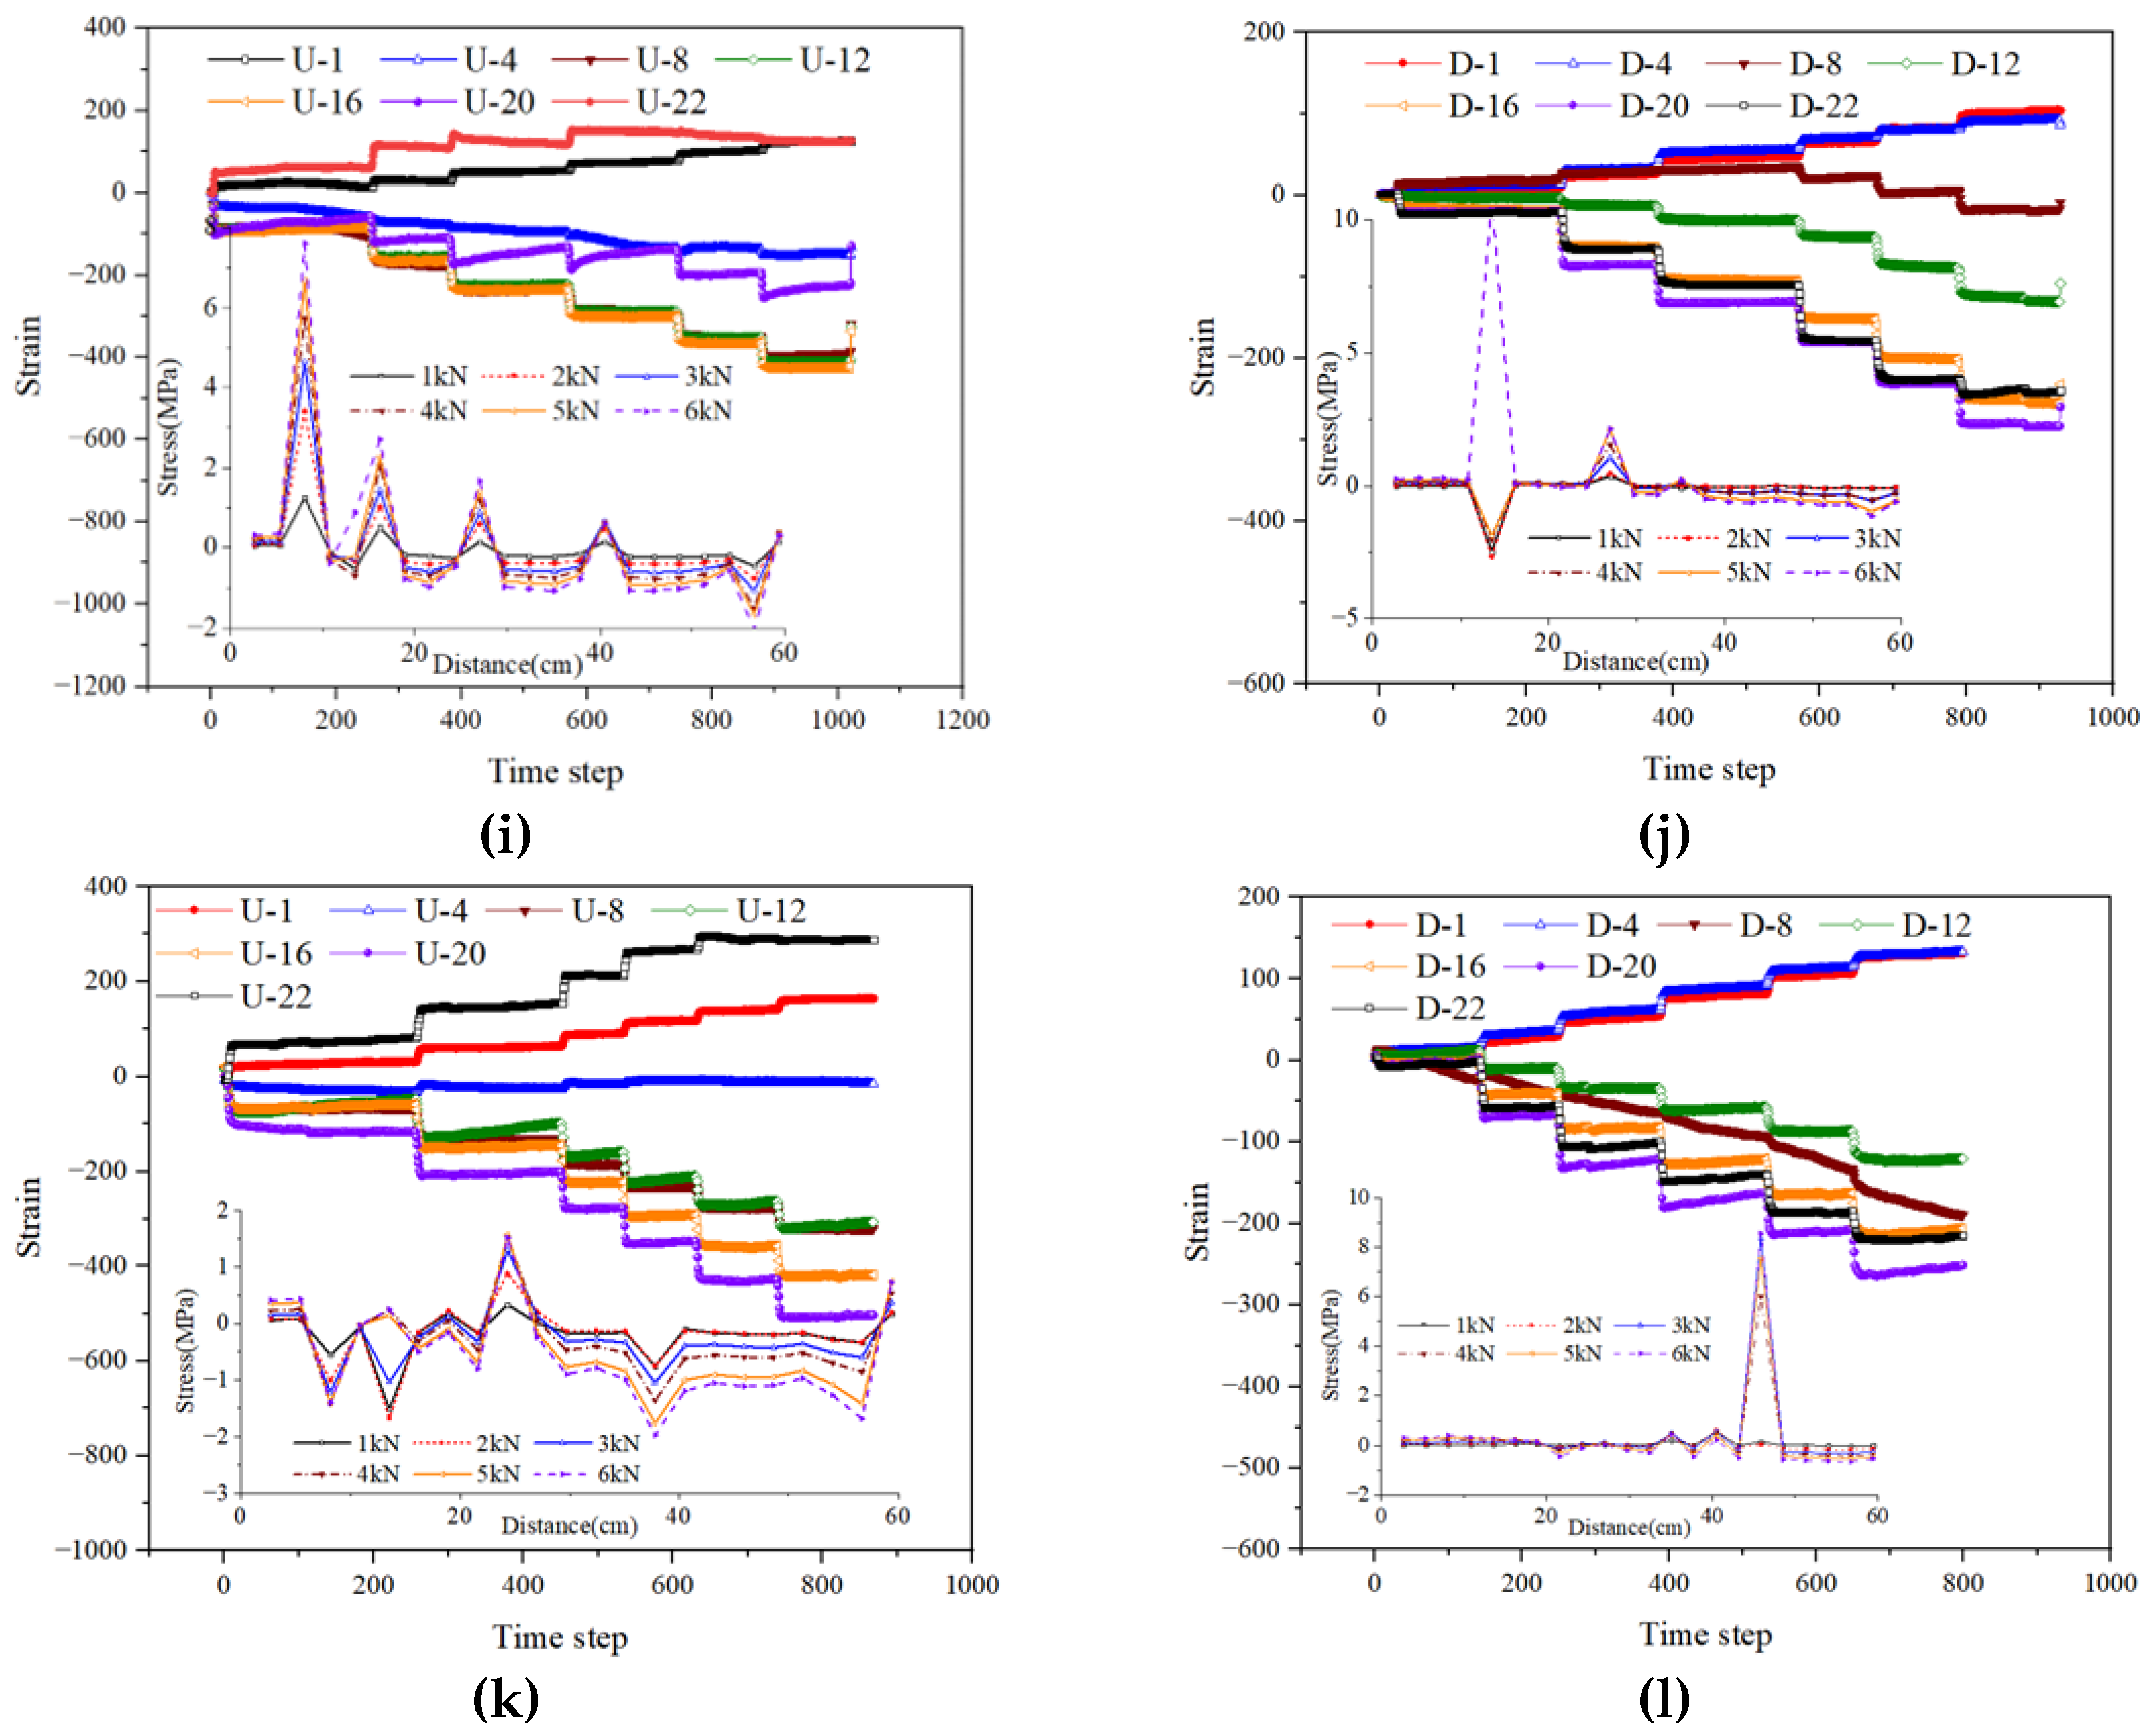
Figure 13.
The typical stress characteristic curve on monitoring.
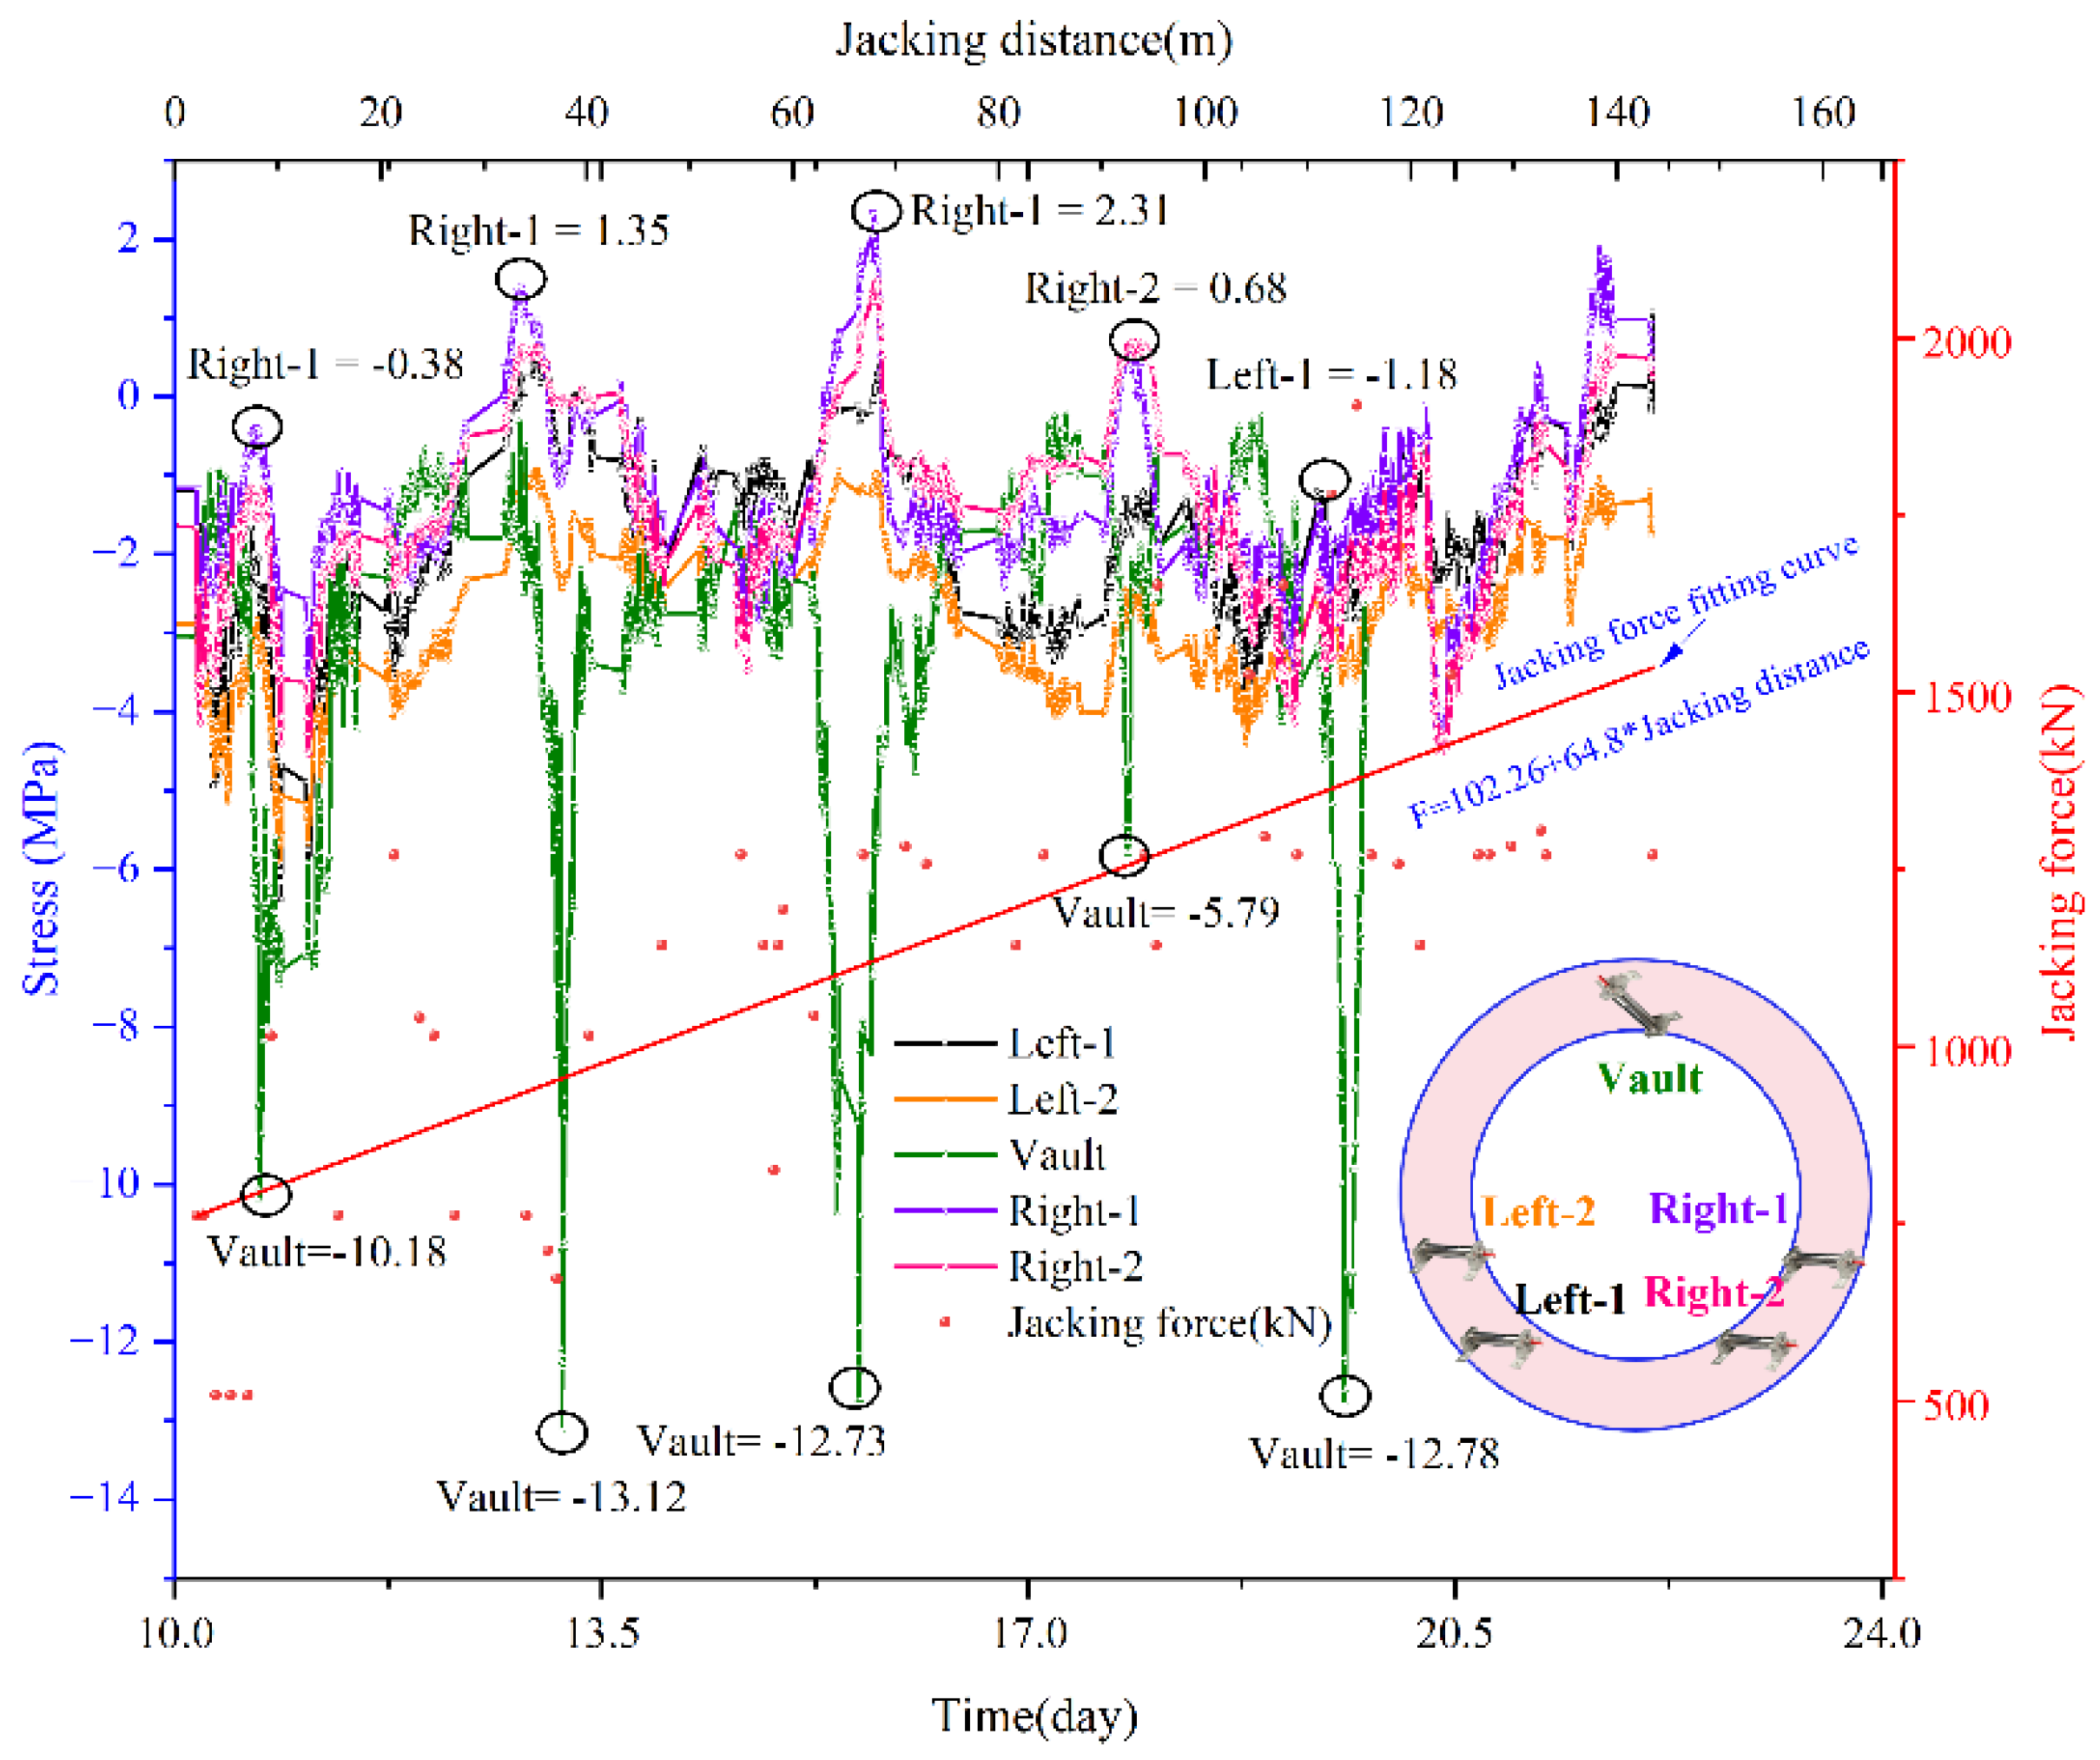
Figure 14.
Normalized Analysis of Results.

Table 1.
Test condition settings for segment deflection.
| Test Condition | Deflection Angle | ||||||
|---|---|---|---|---|---|---|---|
| Co-directional Deflection | α | 0.5 | 1.0 | 1.5 | 2.0 | 2.5 | 3.0 |
| β | 0.5~3.0 | 0.5~3.0 | 0.5~3.0 | 0.5~3.0 | 0.5~3.0 | 0.5~3.0 | |
| Diagonal Deflection | α′ | 0.5 | 1.0 | 1.5 | 2.0 | 2.5 | 3.0 |
| β′ | 0.5 | 1.0 | 1.5 | 2.0 | 2.5 | 3.0 | |
Disclaimer/Publisher’s Note: The statements, opinions and data contained in all publications are solely those of the individual author(s) and contributor(s) and not of MDPI and/or the editor(s). MDPI and/or the editor(s) disclaim responsibility for any injury to people or property resulting from any ideas, methods, instructions or products referred to in the content. |
© 2025 by the authors. Licensee MDPI, Basel, Switzerland. This article is an open access article distributed under the terms and conditions of the Creative Commons Attribution (CC BY) license (http://creativecommons.org/licenses/by/4.0/).
Copyright: This open access article is published under a Creative Commons CC BY 4.0 license, which permit the free download, distribution, and reuse, provided that the author and preprint are cited in any reuse.


