Submitted:
02 August 2023
Posted:
03 August 2023
You are already at the latest version
Abstract
The UHPC grouted bellow is an innovative technology for connecting assembled buildings, where the anchorage performance of the rebar and UHPC filled in bellows plays a critical role in determining the overall connection effectiveness. To ascertain a dependable anchorage length and establish a bond-slip relationship between the rebar and UHPC within the bellow, we conducted tests on 8 groups of 16 specimens of metal corrugated pipes filled with UHPC and rebar under tension. The tests considered varying parameters such as the aperture ratio D/d and anchorage length L. By analyzing the failure modes, load versus deflection curves, and steel strain data, we gained valuable insights into the influence of the aperture ratio and anchorage length on the anchorage performance. Furthermore, we calculated the experimental curve of the bond-slip relationship between the rebar and the UHPC interface grouted in the bellows and derived a bond-slip model through fitting. These findings serve as a crucial foundation for the force analysis of assembled structures connected using UHPC grouted bellows.
Keywords:
anchorage performance
; UHPC grouted bellow connection
; aperture ratio
; anchorage length
; bond-slip
1. Introduction
Assembly technology is a modern approach in civil engineering that involves dividing a building into multiple components for prefabrication and later assembling them on-site to form the complete structure. This method offers several advantages, including reduced on-site work, rapid assembly, shorter construction periods, and eco-friendly practices, making it an inevitable trend in the industry[1].One crucial aspect of assembly technology is the use of UHPC grouted corrugated pipes [6] for connecting precast columns, as illustrated in Figure 1. This method entails embedding bellows in the foundation or cap beam, inserting reinforcing bars which extending from the pier into the corresponding bellows during splicing, and subsequently filling the bellows with ultra-high-performance concrete (UHPC). UHPC is a cement-based composite material reinforced with fibers, providing it with remarkable toughness and durability. The connection between components is facilitated through the bonding stress between the rebar and UHPC within the bellows. Due to its reliability and ease of construction, this technology holds significant promise for various assembly-type construction projects in civil engineering. A few experimental studies [7] have been conducted in recent years to investigate the performance of precast columns connected using grouted corrugated pipes with UHPC grouting material. For instance, Mostafa Tazarv and M. Saiid Saiidi [7] designed and tested half-scale precast reinforced concrete columns (PNC) and low-damage precast columns (HNC) connected to footings with an ultra-high-performance concrete (UHPC) filled duct connection. The cyclic testing revealed that the UHPC-filled duct connection exhibited no damage in both PNC and HCS columns, performing comparably to conventional connections. Additionally, Tao Fu et al. [8]developed a hollow prefabricated square column with high-strength reinforcement to achieve optimal seismic performance. They connected the columns to the cap using grouted sleeves with UHPC grouting material. Experimental results demonstrated that the configuration of high-strength reinforcement significantly influenced the seismic performance of the column. In conclusion, the assembly technology combined with the UHPC grouted corrugated pipe connection method shows immense potential for enhancing the efficiency and seismic performance of precast columns in civil engineering applications.
The anchoring performance of both the rebar and the UHPC filled within the bellows plays a pivotal role in facilitating force transmission between the structural members and determining the overall mechanical behavior of the structure. To conduct a comprehensive structural force analysis of UHPC grouted bellow connections, it is essential to understand the bond-slip relationship between the rebar and the UHPC interface. While many scholars [15] have focused on researching the interfacial bonding performance of rebar and UHPC through tensile tests, there has been limited consideration given to the unique scenario where UHPC is infilled within the bellows, unlike the forces experienced by rebar buried directly in UHPC as depicted in Figure 2. This distinction is crucial as it may affect the overall performance of the connection.
Huaxiang Su et al. [15]conducted direct shear tests to investigate the shear mechanism and strength of a novel gravity-type grouted sleeve connection using ultra-high-performance concrete (UHPC). Their findings indicated that the UHPC-based connection exhibited the shear strength at least 50% higher than that of traditional connections. Moreover, the failure mode of the UHPC-based connection resembled that of cast-in-place (CIP) specimens. Fehling et al. [16]explored the impact of different protective layer thicknesses and anchorage lengths on the anchorage performance of rebar-UHPC connections through pullout tests. They discovered that for rebar with a diameter of 12 mm, the reliable anchorage lengths were 4d, 6d, and 8d, corresponding to protective layer thicknesses of 2.5d, 2d, and 1.5d, respectively. Yuan and Graybeal [17] investigated the effects of rebar diameter, spacing, and coating on the anchorage performance of rebar-UHPC connections using pullout tests. Their results revealed that rebar with diameters of 13 mm and 25 mm exhibited average bond strengths from 20 MPa to 35 MPa. For protective layer thicknesses of 3d and spacing between rebar of 2d, the minimum reliable anchorage length for the rebar was 8d. Vidya Sagar Ronanki et al. [18]conducted rebar pull-out tests to study the effect of rebar diameter (ranging from 13 mm to 22 mm), anchorage length (6d to 10d), protective layer thickness, and maintenance age on the anchorage performance of rebar-UHPC connections. Their experimental results demonstrated that the average bond strength of rebar-UHPC was approximately 5 times (9.7 MPa to 16.6 MPa) that of rebar-ordinary concrete bond strength, with the average bond strength increasing with the rise of rebar anchorage length. The bond stress was non-uniform, with the majority being distributed along the anchorage length within 2.5d. Aoxiang Hu et al. [19]conducted a series of pullout tests to investigate the bond characteristics of deformed high-strength steel bars embedded in ultrahigh-performance concrete (UHPC). Their results indicated that UHPC significantly increased the bond strength of deformed reinforcing steel bars, with the bond strength increasing with bar diameter. Additionally, the average bond stress of deformed reinforcing steel bars embedded in UHPC increased with increasing steel fiber volume content (up to 3%), concrete cover, and bar grades; it decreased with an increase in bar embedment length. Jianan Qi et al. [20]explored the bond behavior of reinforcing bars in ultra-high performance concrete (UHPC) through both experimental and theoretical pullout tests. They found that inadequate concrete cover depth led to splitting failure, while short embedment length resulted in concrete cone failure, leading to lower bond strengths. The bond strength increased by up to 229.8%, and the pullout energy increased by 401.4% as the concrete cover depth increased from 0.5d to 2d. They recommended development lengths of 6d and 8d corresponding to concrete cover depths of 2d and 1.5d, respectively. Heng Liu et al. [21]conducted central unidirectional pull-out tests on 54 prismatic specimens with deformed steel bars embedded in UHPC without lateral constraints. Their results revealed that when the anchorage length exceeded two times the diameter of the steel bar, the maximum strain occurred at approximately 1.5 times the diameter away from the loading end. The maximum bond stress decreased with increasing anchorage length but increased with increasing concrete cover. But excessive concrete cover did not yield a noticeable gain effect.
However, it is important to note that the aforementioned studies on the anchorage performance of the rebar-UHPC interface only considered a single interface between the rebar and the UHPC, as depicted in Figure 3(a). They did not take into account the specific connection technology of UHPC grouted bellows, where the rebar is inserted inside the UHPC within the bellows (Figure 3b). Moreover, the protective layer thickness of the rebar is closely related to the diameter D of the grouted bellows and the diameter d of the longitudinal rebar, known as the aperture ratio D/d. Unfortunately, there are very limited studies that address the anchorage performance of rebar constrained by UHPC filled within the bellows, and the relevant interfacial bond-slip model is rarely reported in the literature. This gap in research needs to be addressed to gain a comprehensive understanding of the performance of the UHPC grouted bellow connections.
a)Interface of rebar and UHPC b)Interface of rebar and UHPC grouted bellows
In this research, we delve into the anchorage performance of the rebar-UHPC grouted bellows, specifically considering the scenario with pre-buried bellows. The focus of our study lies on the interface between the rebar and the grouted UHPC inside the bellows, as depicted in Figure 1.3b. To achieve this, we conducted a series of tests on 16 specimens comprising metal corrugated pipes filled with UHPC and rebar, considering various aperture ratios (D/d) and anchorage lengths (L), and subjected them to tension. Through analysis of failure modes, load versus deflection curves, and steel strain data, we aimed to determine the reliable anchorage length and establish the bond-slip relationship between the rebar and UHPC within the bellows. These findings serve as a fundamental basis for the widespread adoption and application of the UHPC grout-filled bellow connection technology.
2. Experimental program
2.1. Specimens and Test matrix
The study primarily focused on two key factors: the aperture ratio (D/d), which represents the ratio of the bellows diameter (D) to the diameter of the rebar (d), and the anchorage length (L). To investigate these factors, tension tests were performed on the specimen illustrated in Figure 3b.
Based on previous literature [15-21], it was observed that when the anchorage length (L) of the rebar inserted into the UHPC grouted bellows exceeded 10 times the rebar diameter (10d), no bond damage occurred at the interface between the rebar and UHPC, thus ensuring a reliable anchorage. On the other hand, if the anchorage length (L) was less than 10d, bond damage might occur. Therefore, the specimens were categorized into two series: Series A, with anchorage length (L) greater than 10d, was utilized to explore the impact of the aperture ratio (D/d) and anchorage length (L) on the anchorage performance. In contrast, Series B, where bond damage might occur due to L being less than 10d, was employed to study the interfacial bond-slip relationship between the rebar and the UHPC grouted bellows. These distinct series allowed for a comprehensive analysis of the anchorage behavior and bond-slip characteristics under varying conditions.
In this study, C25 rebar of grade HRB400 was utilized. Series A was comprised of 4 groups, each with a different anchorage length (10d, 15d, 20d, 24d), and contained 1 specimen per group. On the other hand, Series B included 4 groups (3d, 5d, 7d, 10d) based on the anchorage length, with 2 specimens in each group, resulting in a total of 8 groups and 16 specimens, as detailed in Table 1.
2.2. Specimen fabrication
In Series A, the specimens were positioned on three ordinary concrete anchor blocks measuring 1200 mm × 1200 mm. Among them, two blocks had a height (H) of 600 mm, while one had a height (H) of 800 mm, to account for different anchorage depths. The concrete grade used for the anchor blocks was C50. To mitigate any potential influence between individual specimens, the spacing between adjacent bellows was set at 300 mm [22], as illustrated in Figure 4(a).
As for Series B, the objective was to investigate the interfacial bond-slip relationship between the rebar and the UHPC grout-filled bellow. Each specimen was independently fabricated, and the corrugated pipe was pre-buried in C50 concrete test blocks. These test blocks had dimensions of 250 mm × 250 mm, and the heights (H) were set at 320 mm, 250 mm, and 200 mm, respectively, according to the anchorage length, as shown in Figure 4(b).
To prevent stress concentration at the ends of the connection between the rebar and the concrete specimen block from affecting the interfacial bonding performance, a section of PVC pipe was pre-fixed at the connection ends. This section of PVC pipe acted as an unbounded section for the rebar, thus controlling the different anchorage lengths of the rebar. The metal bellows used in the specimens had a diameter of 80 mm.
Figure 5 shows the fabrication process of series A and series B specimens. The main steps include pre-burial of the bellows → casting and curing the anchor block concrete → positioning of the rebar → filling the bellows with UHPC → curing and forming the UHPC.
2.3 Material properties
The specimens were composed of various materials, including normal concrete (C50) for the anchor blocks, C25 rebar, UHPC, and φ80 metal bellows. The mechanical properties of the bellows were provided by the manufacturer, while the mechanical properties of the other main materials were tested and recorded, as depicted in Figure 6.
The test results revealed that the compressive strength of the ordinary concrete used for the anchor blocks was 51.19 MPa, with a modulus of elasticity of 34.98 GPa. As for the C25 rebar, the average values for yield strength, tensile strength, and modulus of elasticity were 445.1 MPa, 615.1 MPa, and 205.5 GPa, respectively. Under normal temperature curing conditions, the average 28-day tensile strength of UHPC was determined to be 8.41 MPa. Additionally, the average compressive strength of UHPC at the 28-day mark was recorded as 116.1 MPa.
2.4. Test Set-up and instrumentation
(1) Loading solutions and instrumentation
For continuous loading in a load-controlled manner, a through-core electro hydraulic jack with a 100t capacity was employed. The loading speed was regulated at 15-20 kN/min until the bar yielded, after which it was adjusted to 8-10 kN/min. In case of bar pull-out, pull-off, or splintering damage, the test was immediately halted.
During the tests, the tensile force (F) in the axial direction of the rebar was measured using a force sensor in the jack, while the displacement at the loading end of the rebar was recorded with a displacement meter.
(2) Arrangement and testing of strain gauges on rebar
To measure the stress at the contact interface between the rebar and UHPC, strain gauges were strategically placed on the rebar. The strain measurements were taken using a strain test analyzer, specifically model DH3816, with an acquisition frequency of 1 Hz.
The arrangement of strain gauges is illustrated in Figure 8. In Series A, the first strain gauge (Gauge 1) was positioned 50 mm above the surface of the specimen, and a total of 5 additional strain gauges were evenly spaced downward in the anchorage section of the rebar. This resulted in 6 strain gauges placed at 50 mm intervals from one another. The number of strain gauges used was dependent on the height (H) of the specimen.
3. Result and discussion
3.1. Failure mode
The failure modes and characteristic load values of each specimen are summarized in Table 2. It is evident that when the anchorage length exceeded 10d, all the steel bars in the specimens broke under tension, as depicted in Figure 9a. This observation confirms that the rebar were reliably anchored, ensuring a robust connection.
For specimens in Series B, with an anchorage length (L) less than 10d, two primary failure modes were observed: 1)In specimen C25-80-10d, the rebar experienced tensile failure, indicating that the anchorage length was sufficient, and the anchorage was reliable.2) For anchorage lengths of 3d, 5d, and 7d, the rebar underwent pull-off, signifying that bonding failure occurred at the rebar-UHPC interface.
Table 2 presents the failure mode and characteristic load values of each specimen, with the load characteristic values being averaged for 2 specimens of the same anchorage length in Series B.
3.2. Load versus deflection curves
Figure 10 displays the load versus deflection curves of the specimens. Notably, the two series of specimens exhibited significantly different trends in their load-deflection behavior, attributed to the varying anchorage length (L). The curves of Series A (L≥10d) displayed a three-stage development process, characterized by linear growth, yielding, and subsequent strengthening. This pattern closely resembled the mechanical properties of steel bars, indicating a reliable anchorage. Conversely, for the specimens in Series B (L≤10d), distinct behaviors were observed based on the anchorage length. When L=7d and 10d, the two groups of reinforcement exhibited yielding. However, for L=3d and 5d, the reinforcement did not yield, leading to bond damage at the interface between the reinforcement and UHPC. Consequently, when the load reached the limit value, it experienced a rapid drop, and the load-deflection curves demonstrated non-linear characteristics.
Figure 10(a) presents a comparison of the load versus deflection curves for two specimens within Series A, both having the same anchorage length (L) but differing bellows diameters (D). It is evident that as the diameter (D) increases, the load capacity also increases correspondingly. In Figure 10(b), the load versus deflection curves for two specimens within the same group, sharing the same anchorage length, are displayed. Remarkably, the curves within each group exhibit close similarities, indicating consistent behavior among specimens of the same group.
3.3. Analysis of factors influencing anchorage performance of rebar-UHPC grouted bellows
3.3.1. Aperture ratio D/d
The load versus deflection curves for specimens with different aperture ratios (D/d) are presented in Figure 10(a). The experimental results indicate that effective anchorage of the rebar is achieved when the aperture ratio (D/d) is greater than 2.4.
Furthermore, for specimens with the same anchorage length (L), those with an aperture ratio (D/d) of 3.2 exhibit higher yield and ultimate loads compared to those with a ratio of 2.4. The strength characteristic values from Table 2 further reveal that, for series A specimens, the ultimate loads increase by 15.47%, 8.89%, and 9.75% for anchorage lengths of 10d, 15d, and 20d, respectively. This trend highlights that using metal bellows with a larger diameter (D) provides enhanced anchorage force and stronger anchorage performance for rebar of the same diameter (d).
3.3.2. Anchorage length L
Figure 11 illustrates a comparison of the load versus deflection curves for specimens with the same aperture ratio (D/d) but varying anchorage lengths (L). In Series A specimens, where the anchorage length is longer (L≥10d), the anchorage is notably reliable. The interfacial bond between the reinforcement and the UHPC inside the bellows is robust, resulting in the reinforcement ultimately breaking near the loading end.
Interestingly, in the figure, it is evident that when L=10d, 15d, 20d, and 24d, the load versus deflection curves exhibit similar patterns. This implies that the anchorage length has a minor influence on the yield load and ultimate load. Thus, when employing UHPC grouted metal or plastic bellows for node connection, an anchorage length (L) of at least 10d can ensure reliable anchorage. Consequently, it is recommended to utilize an effective anchorage length (La) of 10d.
In Series B specimens, where the anchorage length (L) is ≤10d, Figure 11(b) showcases a comparison of the load versus deflection curves for specimens with different anchorage lengths, further substantiating the findings. When L=10d, the anchorage is reliable, and the load versus deflection curve exhibits a clear yielding platform, akin to the curve characteristics observed in Series A. At L=7d, the rebar initially yields, but as it progresses into the strengthening stage, bond damage occurs at the interface between the rebar and UHPC, ultimately reducing the ultimate bearing capacity. For the two groups of specimens with L=5d and 3d, the insufficient anchorage length results in bond damage at the interface before the rebar yields, leading to rebar pull-out and a significant reduction of 35.0% and 36.3%, respectively, in the ultimate bearing capacity compared to that of specimens with L=10d.
Clearly, the aperture ratio (D/d) and anchorage length (L) are two crucial factors influencing the anchorage performance of the rebar in UHPC grouted bellows. The conditions for reliable anchorage of the rebar are D/d≥2.4 and L≥10d.
4. Bond-slip relationship of the rebar-UHPC grouted bellows interface
4.1. Load-strain curves(F-ε)
To establish the bond-slip relationship curve at the interface between the rebar and the UHPC grouted bellows, strain analysis was conducted for the specimens in Series B, where interfacial bond damage had occurred. Figure 12 depicts the variation curve of strain on the rebar of Series B specimens with load (F-ε).
As the load increases, the force transmission from the upper part of the anchorage section to the remote end occurs through the interfacial bond, leading to varying strains in the test specimens.
At L=3d, several strain values near the loading end (1-5) initially increase and then decrease. This behavior can be attributed to the small anchorage length, causing the upper part of the anchorage section to start slipping when the load reaches 90 kN. Consequently, the strain value for the upper part of the anchorage section becomes smaller.
At L=7d, several strain measurement points near the loading end (1, 2, and 4) suddenly increase when the load reaches approximately 225 kN. This occurrence is due to the rebar entering the yield platform, while the displacement at the loading end continues to increase even when the load remains constant, resulting in a sudden rise in strain values.
4.2 Experimental curve for bond-slip relationship
4.2.1 Standardization of strain positions
To investigate the force transfer mechanism of rebar in the UHPC grouted bellows, the position of strain measurement points in the anchorage section was standardized by defining an x-coordinate axis along the direction of the rebar, representing the anchorage position downwards in a positive direction, and indicating the anchorage length, with the origin (0) located at the beginning of the anchorage section. Each strain gauge's position (x) was then divided by the total anchorage section length (L) to determine the relative position of each measurement point. The coordinate axis is illustrated in Figure 13.
The strain-position curves after position standardization are depicted in Figure 14. Notably, as the anchorage length increases, the strain peak progressively moves closer to the loading end. Moreover, the longer the anchorage length, the more pronounced the shift of the strain peak towards the loading end becomes.At anchorage lengths L=3d and L=5d, the strain peaks appeared at x=0.5L and x=0.18L, respectively. For anchorage lengths in the range of 7d≤L≤10d, the strain peaks appeared close to x=0.12L. Notably, at L=10d, when the specimen was approaching damage, the strain-position curve exhibited a gradual transition to a bimodal shape, with two peaks emerging near x=0.12L and x=0.35L. This behavior indicates complex force transfer characteristics within the anchorage section as the specimen approaches its ultimate limit.
4.2.2 Interfacial bond-slip relationship curves
Based on the reference [23], when strain gauges are closely arranged, the average bond stress between two adjacent gauges can be approximated as the bond stress at that specific point. This approximation can be represented using equation (1):
In equation (1), 'd' represents the diameter of the rebar, ∆x denotes the distance between the two measurement points, and 'Es' stands for the modulus of elasticity of the rebar.
The displacement at the loading end of the rebar is composed of two primary components. The first part corresponds to the elongation of the rebar, while the other part accounts for the slip occurring between the rebar and the UHPC grouted bellows from all sectors of the surface. The slip (s) can be calculated using the following formula:
In the context of equation (1) and (2), where 's1' represents the displacement at the loaded end of the test, 's2' represents the displacement at the free end, and ∆l signifies the elongation of the rebar from the loaded end to the upper surface of the bonded section of the anchored rebar.
By employing equation (1) and (2), the bond stress-slip (τ-s curve) test curve for three groups of specimens (L=3d, 5d, 7d) in which interfacial bond-slip damage occurred was calculated from the strain data, as illustrated in Figure 15.
4.3. Model for bond-slip relationship
The τ-s curves obtained from the tests were standardized by normalizing the horizontal axis (slip) by dividing it by the maximum value (su), and the vertical axis (bond stress) by dividing it by the maximum value (τu). The standardized curves are presented in Figure 16, which clearly demonstrates a consistent form for the τ-s curves of each group of specimens after standardization.
Utilizing the anchorage length (L) and the aperture ratio (D/d) as parameters, we conducted a fitting process for the standardized bond stress-slip curve and characteristic eigenvalues. As a result, we derived the following model for the bond stress-slip relationship in rebar-UHPC grouted metal bellows:
The model includes the following parameters: τu, which represents the peak bond stress, su denoting the corresponding peak slip, τr as the residual bond stress, and sr representing the corresponding residual slip.
Based on the experimental data, the fitting results for each eigenvalue are as follows:
where d is the diameter of the rebar, la is the anchorage length and D is the diameter of the bellows.
5. Conclusions
This research is centered around the connection technology of UHPC grout-filled bellows. To study its anchorage performance, 8 groups of 16 steel-UHPC grouted metal bellows specimens were designed with different aperture ratios (D/d) and anchorage lengths (L) for tensile testing. Through this experimental setup, we analyzed the influence of the aperture ratio (D/d) and anchorage length (L) on the anchorage performance of the rebar and the UHPC grouted in the bellows. Consequently, we established a bond-slip model for the interface between the rebar and the UHPC within the bellows. The main conclusions drawn from this study are as follows:
- The anchorage length (L) significantly impacts the anchorage performance of the rebar in the UHPC grouting bellows. For L ≥ 10d, the rebar anchorage is deemed reliable, and all specimens experienced rebar pull-off damage. Conversely, when L < 10d, bond damage between the rebar and the UHPC interface within the bellows was observed, leading to rebar pull-out. Thus, reliable rebar anchorage in the UHPC grouted bellows requires lengths of L ≥ 10d.
- When considering the same rebar diameter (d), it was evident that a larger bellows diameter (D) provided a stronger anchorage force. Throughout this experiment, reliable anchorage was achieved with an aperture ratio (D/d) of ≥ 2.4. Notably, with an anchorage length (L) of 10d, the specimen possessing an aperture ratio (D/d) of 3.2 exhibited a remarkable increase in both the yield load and ultimate load by 15.47% and 15.62%, respectively, when compared to the specimen with a D/d ratio of 2.4.
- The strain distribution along the interface of the rebars exhibits a single peak. With an increase in anchorage length, the peak strain moves closer to the loading end, and this trend becomes more pronounced as the anchorage length extends further. After standardization, it becomes evident that the bond stress at the interface varies with position, forming a bond stress-position curve with a single peak. Notably, this peak occurs at approximately 0.14L distance from the loading end.
- The proposed three-stage bond-slip curve model effectively captures the characteristics of the bond stress-slip relationship between the rebar and UHPC interface at various stages. This model aligns closely with the test curve, further confirming its accuracy in describing the bond behavior between the rebar and UHPC at different phases.
The research presented in this paper holds significant reference value for the design and application of the connection technology involving UHPC grout-filled bellows. It offers valuable insights and findings that can be utilized to enhance the effectiveness and reliability of such connections in practical applications.
Acknowledgments
This research was supported by the Guangdong Provincial Natural Science Foundation (no. 2019A1515012222), Guangzhou Science and Technology Planning Project (no. 202102080446), and Guangzhou Urban Planning and Design Survey Research Institute (no. 2019-39).
References
- Cogurcu, M. T., & Uzun, M. (2022). Experimental investigation of a new precast column-foundation connection under cyclic loading. Journal of Building Engineering, 50, 104245.Author 1, A.; Author 2, B. Title of the chapter. In Book Title, 2nd ed.; Editor 1, A., Editor 2, B., Eds.; Publisher: Publisher Location, Country, 2007; Volume 3, pp. 154–196. [CrossRef]
- Hofer, L., Zanini, M. A., Faleschini, F., Toska, K., & Pellegrino, C. (2021). Seismic behavior of precast reinforced concrete column-to-foundation grouted duct connections. Bulletin of Earthquake Engineering, 19, 5191-5218.Author 1, A.B.; Author 2, C. Title of Unpublished Work. Abbreviated Journal Name year, phrase indicating stage of publication (submitted; accepted; in press). [CrossRef]
- Zhang, Q., & Alam, M. S. (2020). State-of-the-art review of seismic-resistant precast bridge columns. Journal of Bridge Engineering, 25(10), 03120001. [CrossRef]
- Wang, J. Q. , Wang, Z. , Gao, Y. F. , & Zhu, J. Z. . (2019). Review on aseismic behavior of precast piers: new material, new concept, and new application. Engineering Mechanics.
- Haber, Z. B. , Mackie, K. R. , & Al-Jelawy, H. M. . (2017). Testing and analysis of precast columns with grouted sleeve connections and shifted plastic hinging. Journal of Bridge Engineering, 22(10), 04017078.1-04017078.14. [CrossRef]
- Deng, Y., Ge, S., & Shah, Y. I. (2023, March). Experimental study and numerical simulation of precast segmental bridge column with a central RC tenon. In Structures (Vol. 49, pp. 842-854). Elsevier. [CrossRef]
- Tazarv, M., & Saiidi, M. S. (2015). UHPC-filled duct connections for accelerated bridge construction of RC columns in high seismic zones. Engineering Structures, 99, 413-422. [CrossRef]
- Fu, T., Zhu, Z., Ren, X., Wang, K., Meng, L., & Sun, Z. (2023). Research on the seismic behaviour of hollow prefabricated square column with high-strength reinforcement using UHPC grouting materials. Case Studies in Construction Materials, 18, e01816. [CrossRef]
- Xu, W. , Ma, B. , Duan, X. , & Li, J. (2021). Experimental investigation of seismic behavior of UHPC connection between precast columns and footings in bridges. Engineering Structures, 239(5), 112344. [CrossRef]
- J. Gao, N. Xiang, J. Li, W. Xu. (2023) Cyclic behavior of precast double-column bridge bents with lap splice connections by UHPC. Journal of Bridge Engineering, 28 (7). [CrossRef]
- Y. Xu, Z. Zeng, Z. Wang, et al(2021). Experimental studies of embedment length of precast bridge pier with socket connection to pile cap. Engineering Structures, 233 (2), Article 111906. [CrossRef]
- Lei Song; Liu Laijun; Wu Fangwen; Lin Weiwei; Peng Kai; Cao Jincheng(2023). Seismic performance of short precast columns with UHPC grouted sleeve connections: An experimental and numerical study. Structures, Volume 55,. pp 427-440.
- Zhang Guangda; Han Qiang; Xu Kun; Song Yanchen; Li Zhipeng; Du Xiuli (2023). Parameter analysis and design on socket CFST column-cap beam joint with UHPC grouted connection. Engineering Structures, Volume 292.
- Zhang, G. , Han, Q. , Xu, K. , Du, X. , & He, W. . (2021). Quasi-static tests of cfst embedded rc column-to-precast cap beam with socket connection. Engineering Structures, 241(oct.1), 112443. [CrossRef]
- Su, H., Fan, W., Wang, H., Liu, B., Sun, W., & Shao, X. (2023). Direct shear strength of UHPC-based gravity-type grouted sleeve connection members. Journal of Building Engineering, 69, 106266. [CrossRef]
- Fehling, E., Lorenz, P., & Leutbecher, T. (2012, March). Experimental investigations on anchorage of rebars in UHPC. In Proceedings of Hipermat 2012 3rd International Symposium on UHPC and Nanotechnology for High Performance Construction Materials (pp. 533-540). Kassel, Germany.
- Yuan, J., & Graybeal, B. A. (2014). Bond behavior of reinforcing steel in ultra-high performance concrete (No. FHWA-HRT-14-090). United States. Federal Highway Administration. Office of Infrastructure Research and Development.
- Ronanki, V. S., Aaleti, S., & Valentim, D. B. (2018). Experimental investigation of bond behavior of mild steel reinforcement in UHPC. Engineering Structures, 176, 707-718. [CrossRef]
- Hu, A., Liang, X., & Shi, Q. (2020). Bond characteristics between high-strength bars and ultrahigh-performance concrete. Journal of Materials in Civil Engineering, 32(1), 04019323. [CrossRef]
- Qi, J., Cheng, Z., Ma, Z. J., Wang, J., & Liu, J. (2021). Bond strength of reinforcing bars in ultra-high performance concrete: Experimental study and fiber–matrix discrete model. Engineering Structures, 248, 113290. [CrossRef]
- Liu, H., Liu, Y., Li, A., & Lei, H. (2023). Experimental study on the bond performance of deformed steel bar in ultrahigh performance concrete. Case Studies in Construction Materials, 18, e01874. [CrossRef]
- Wang Hao, Liu Jiawei, Shi Peng, Tao Tianyou, Zhu Qingxin(2020). Experimental study on anchorage performance of rebar-corrugated metal duct for grout splicing. Journal of southeast university (Natural Science Edition), 50(02): 215-221.
- Yoo, D. Y. , Kwon, K. Y. , Park, J. J. , & Yoon, Y. S. . (2015). Local bond-slip response of GFRP rebar in ultra-high-performance fiber-reinforced concrete. Composite Structures, 120, 53-64. [CrossRef]
- Khaksefidi, S. , Ghalehnovi, M. , & Brito, J. D. . (2020). Bond behaviour of high-strength steel rebars in normal (nsc) and ultra-high performance concrete (uhpc). Journal of Building Engineering, 33(2021), 101592. [CrossRef]
Figure 1.
UHPC grouted bellows connection technology.
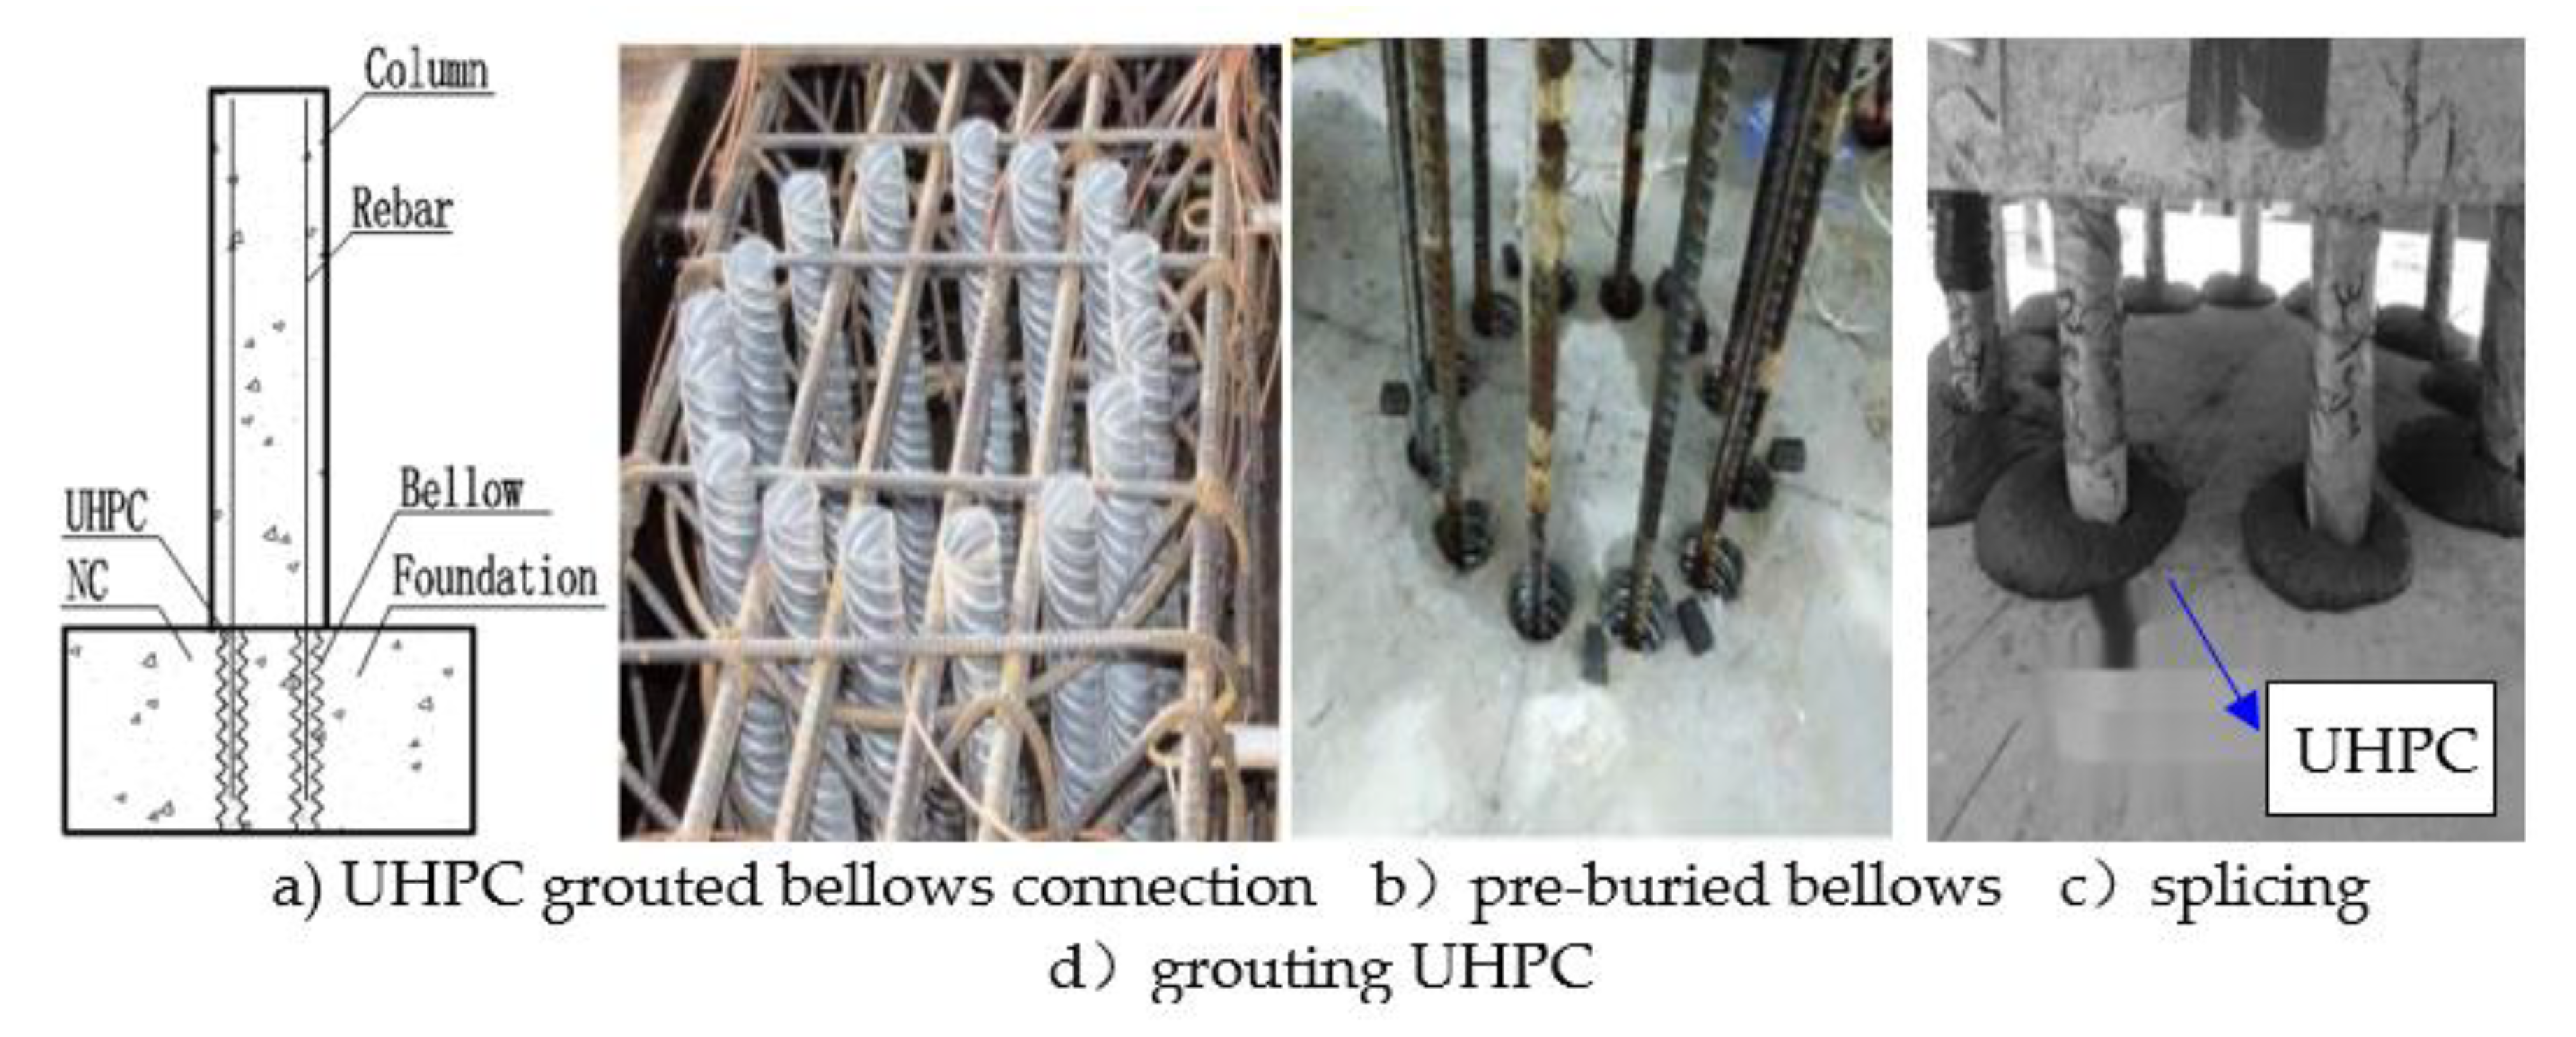
Figure 2.
Schematic diagram of rebar-UHPC tensile test[11].
Figure 2.
Schematic diagram of rebar-UHPC tensile test[11].

Figure 3.
Interface in UHPC grouted bellow connection.
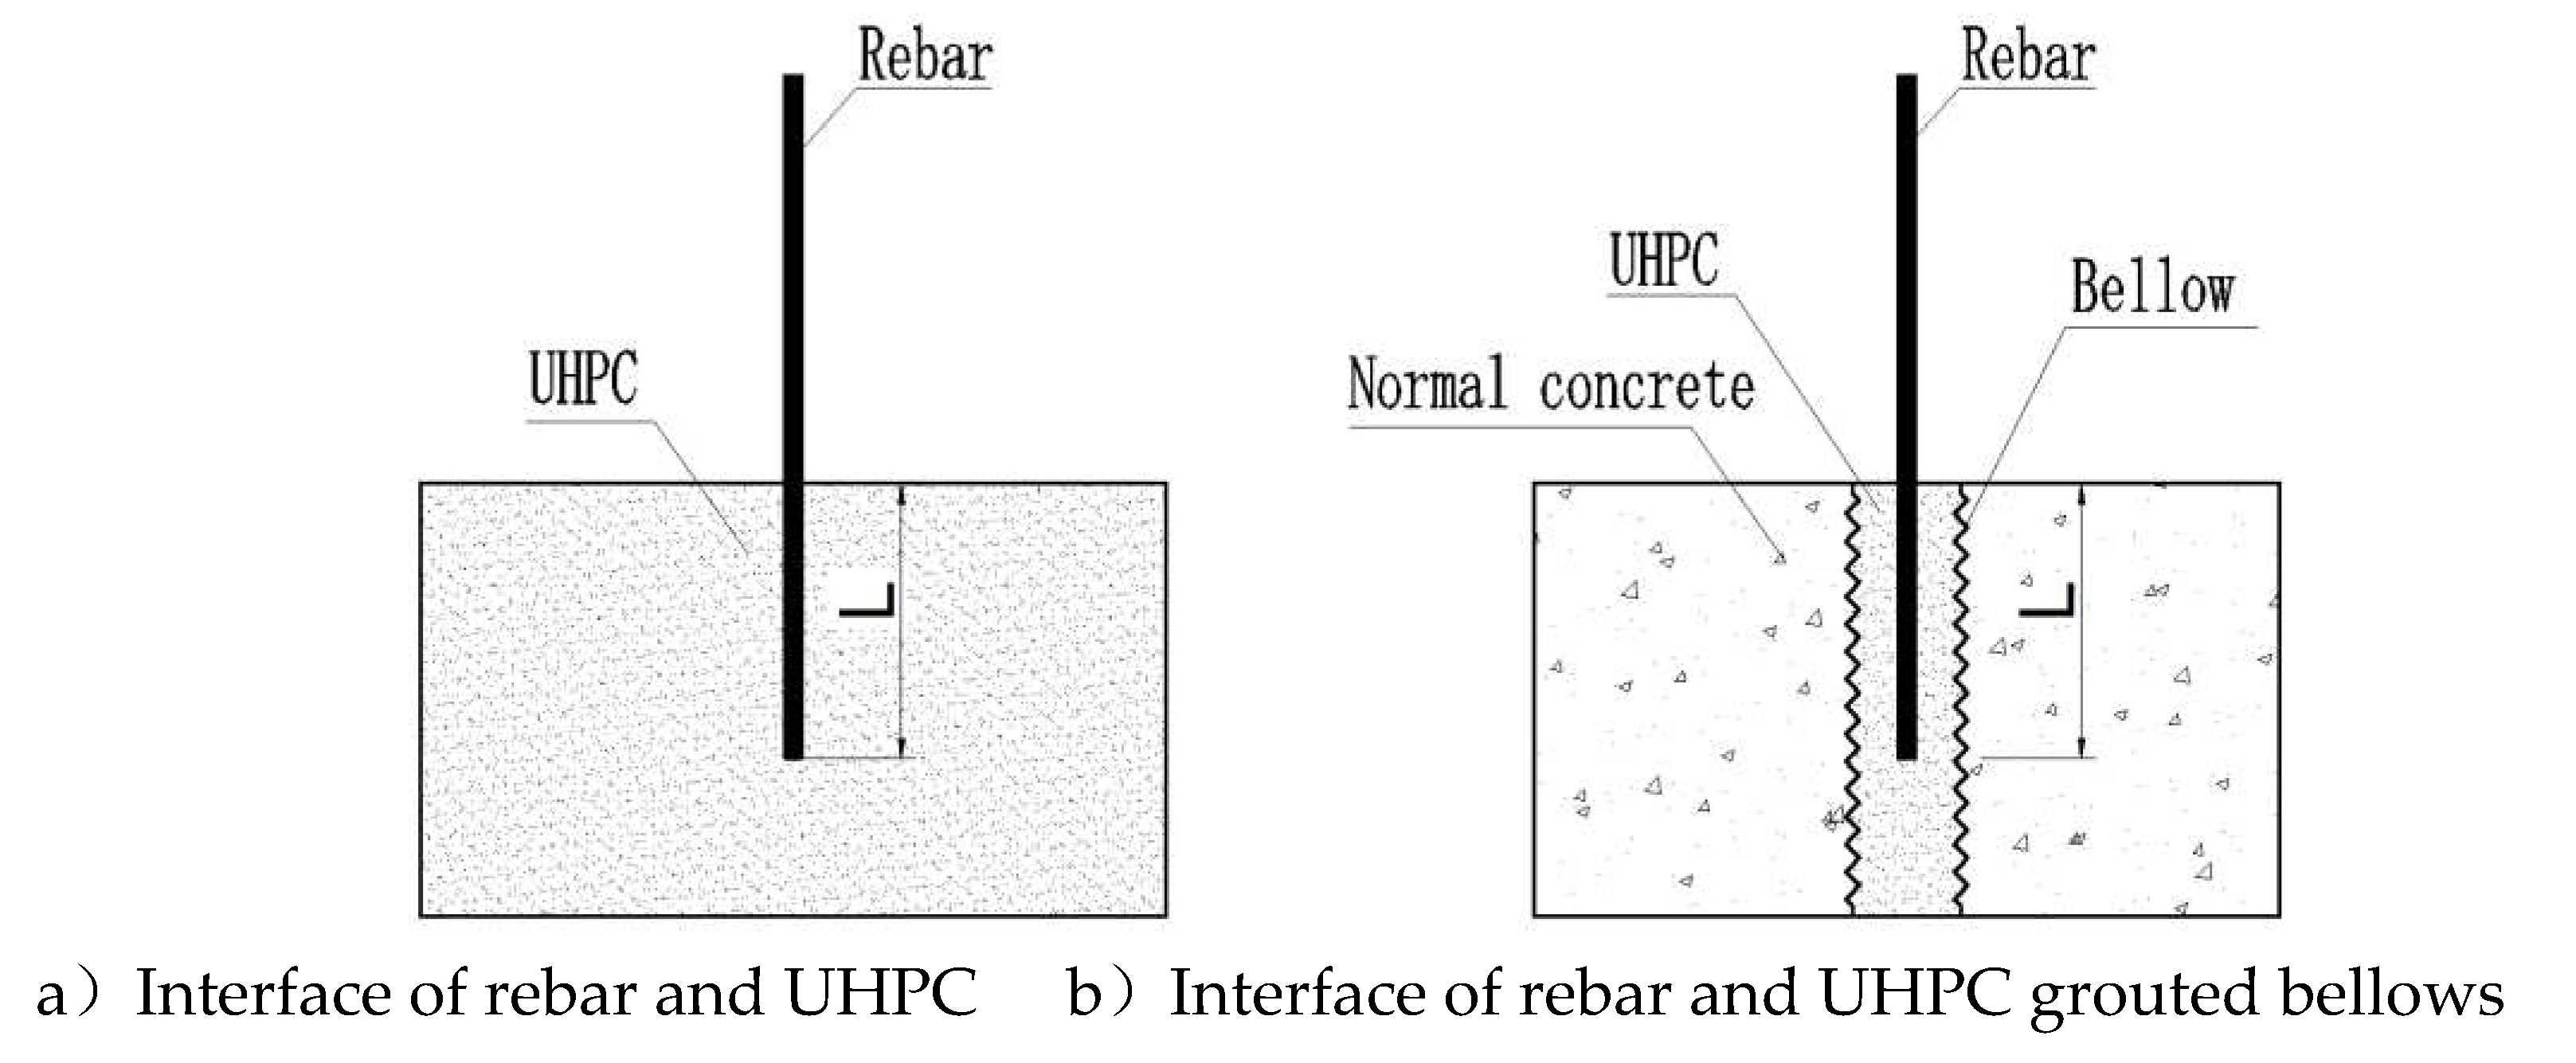
Figure 4.
Schematic diagram of the specimens.
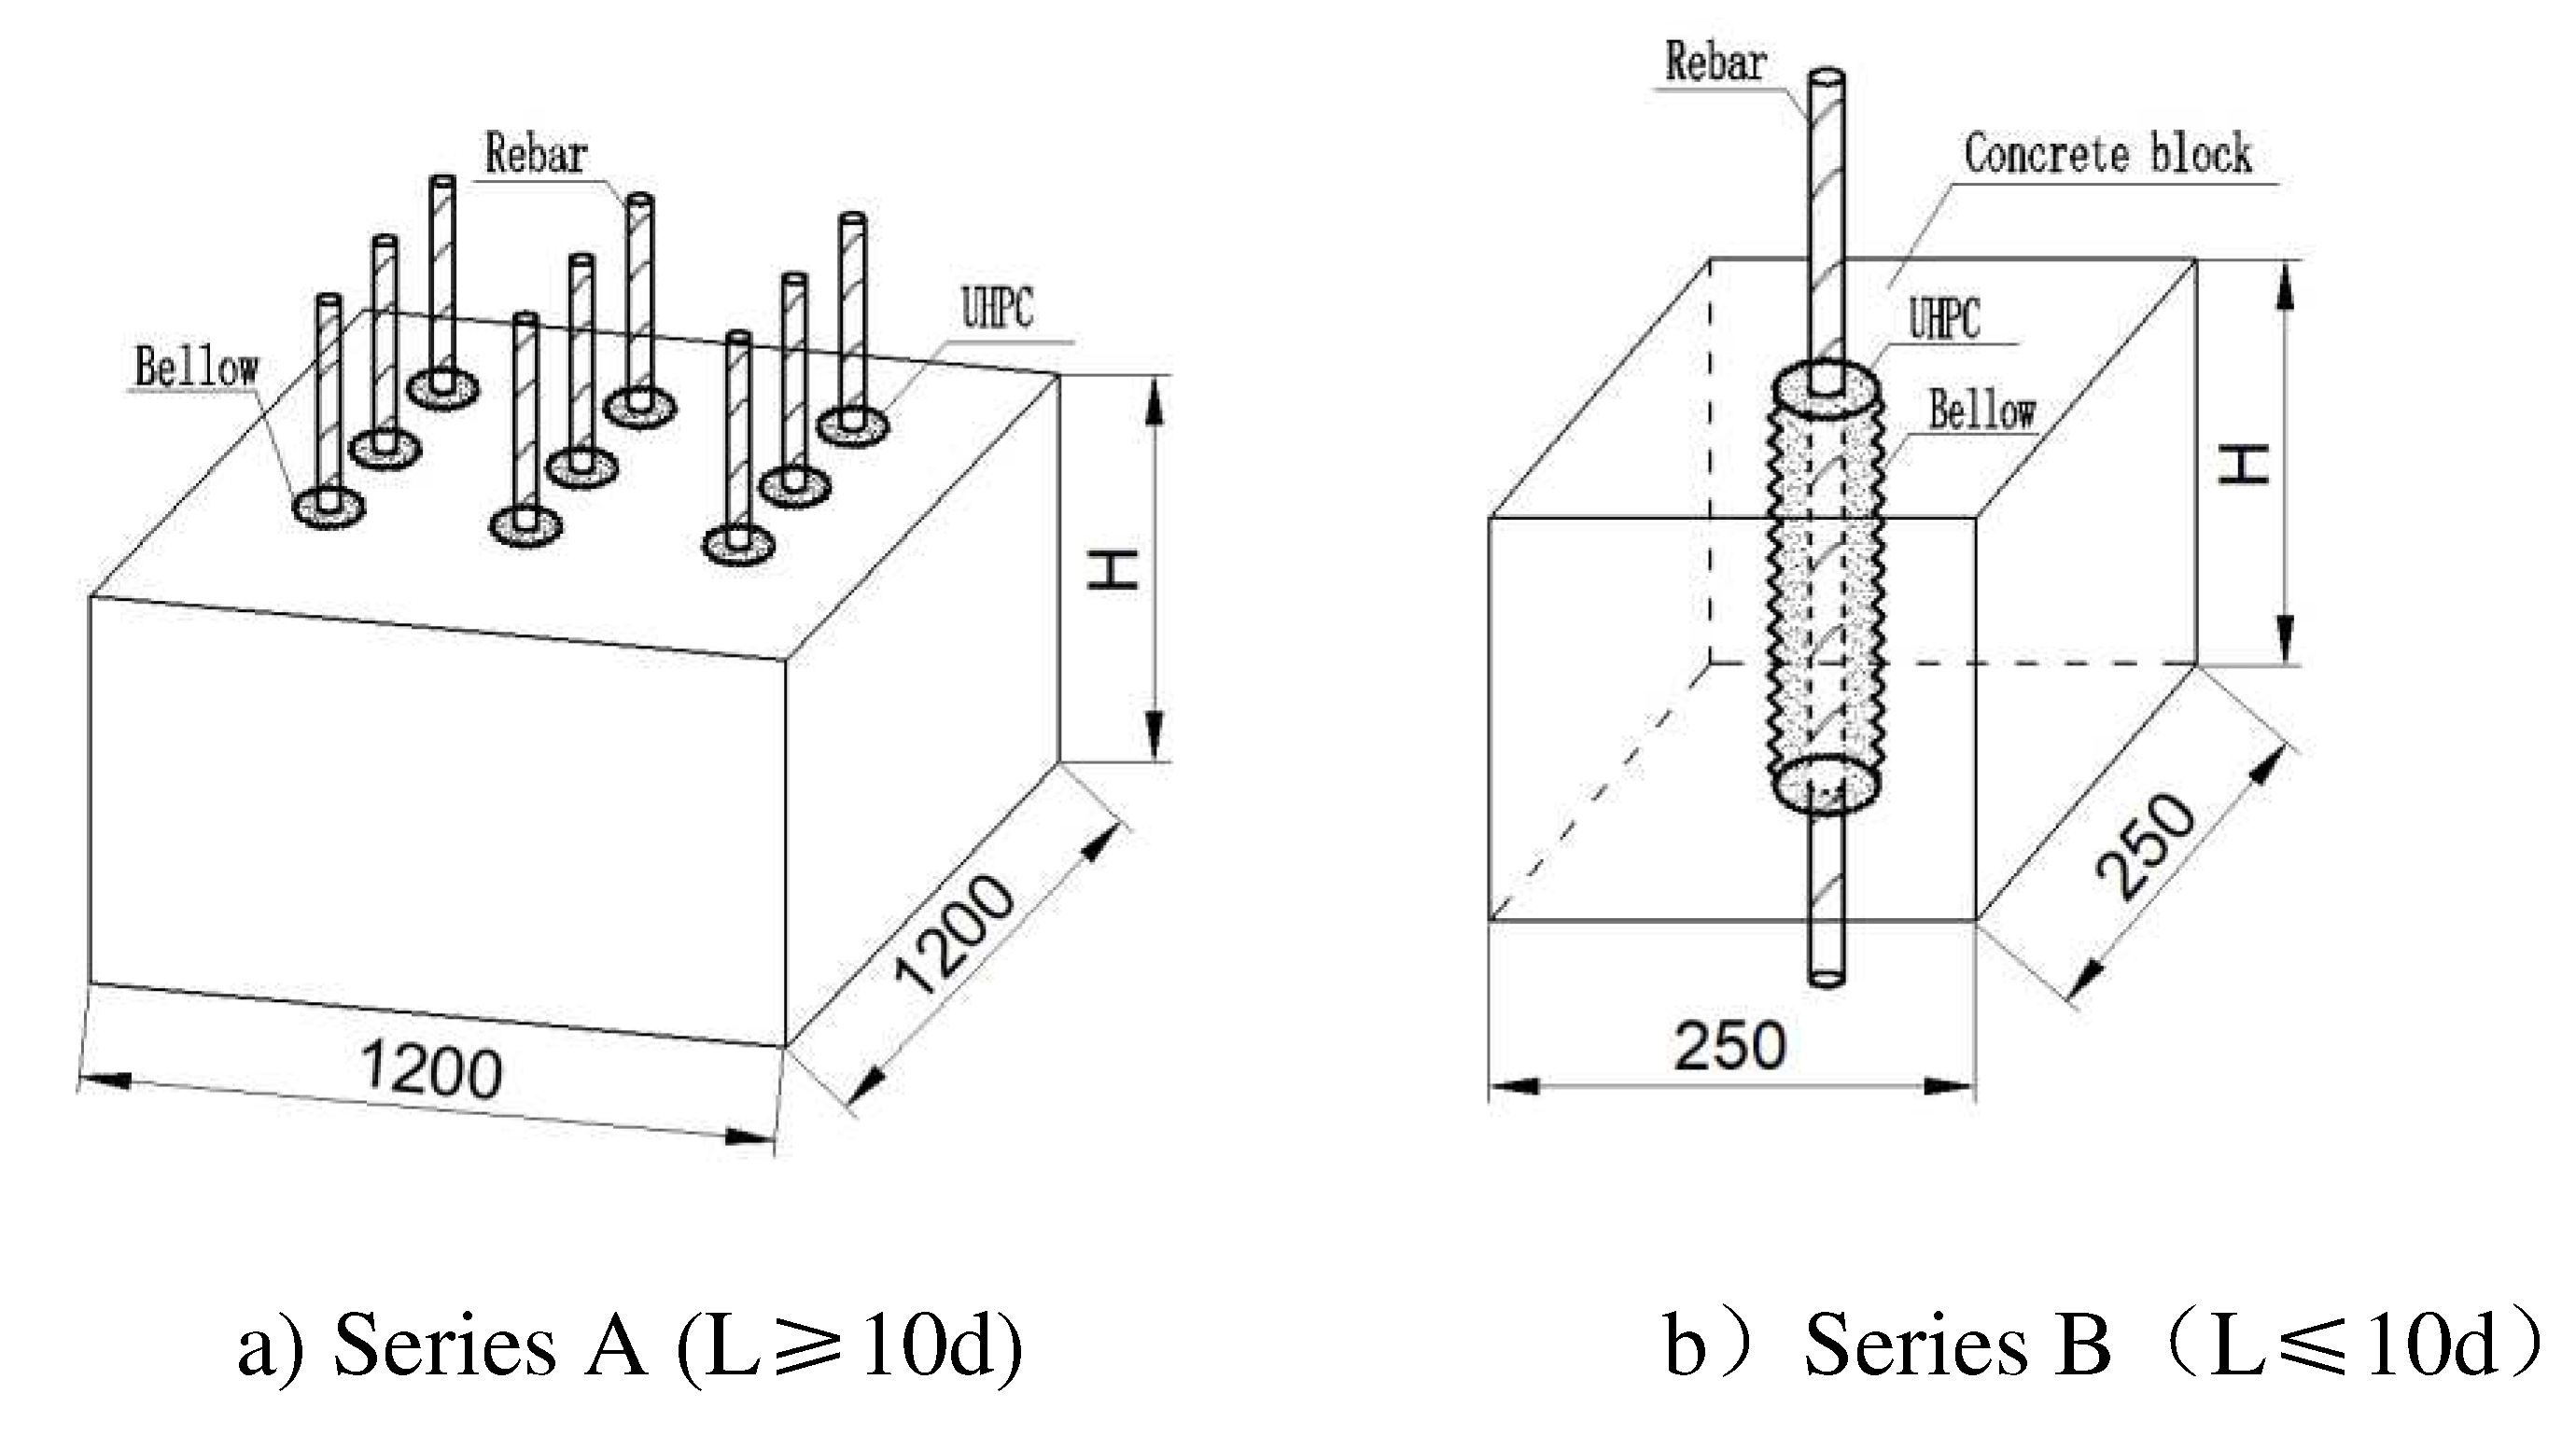
Figure 5.
Specimens fabrication.
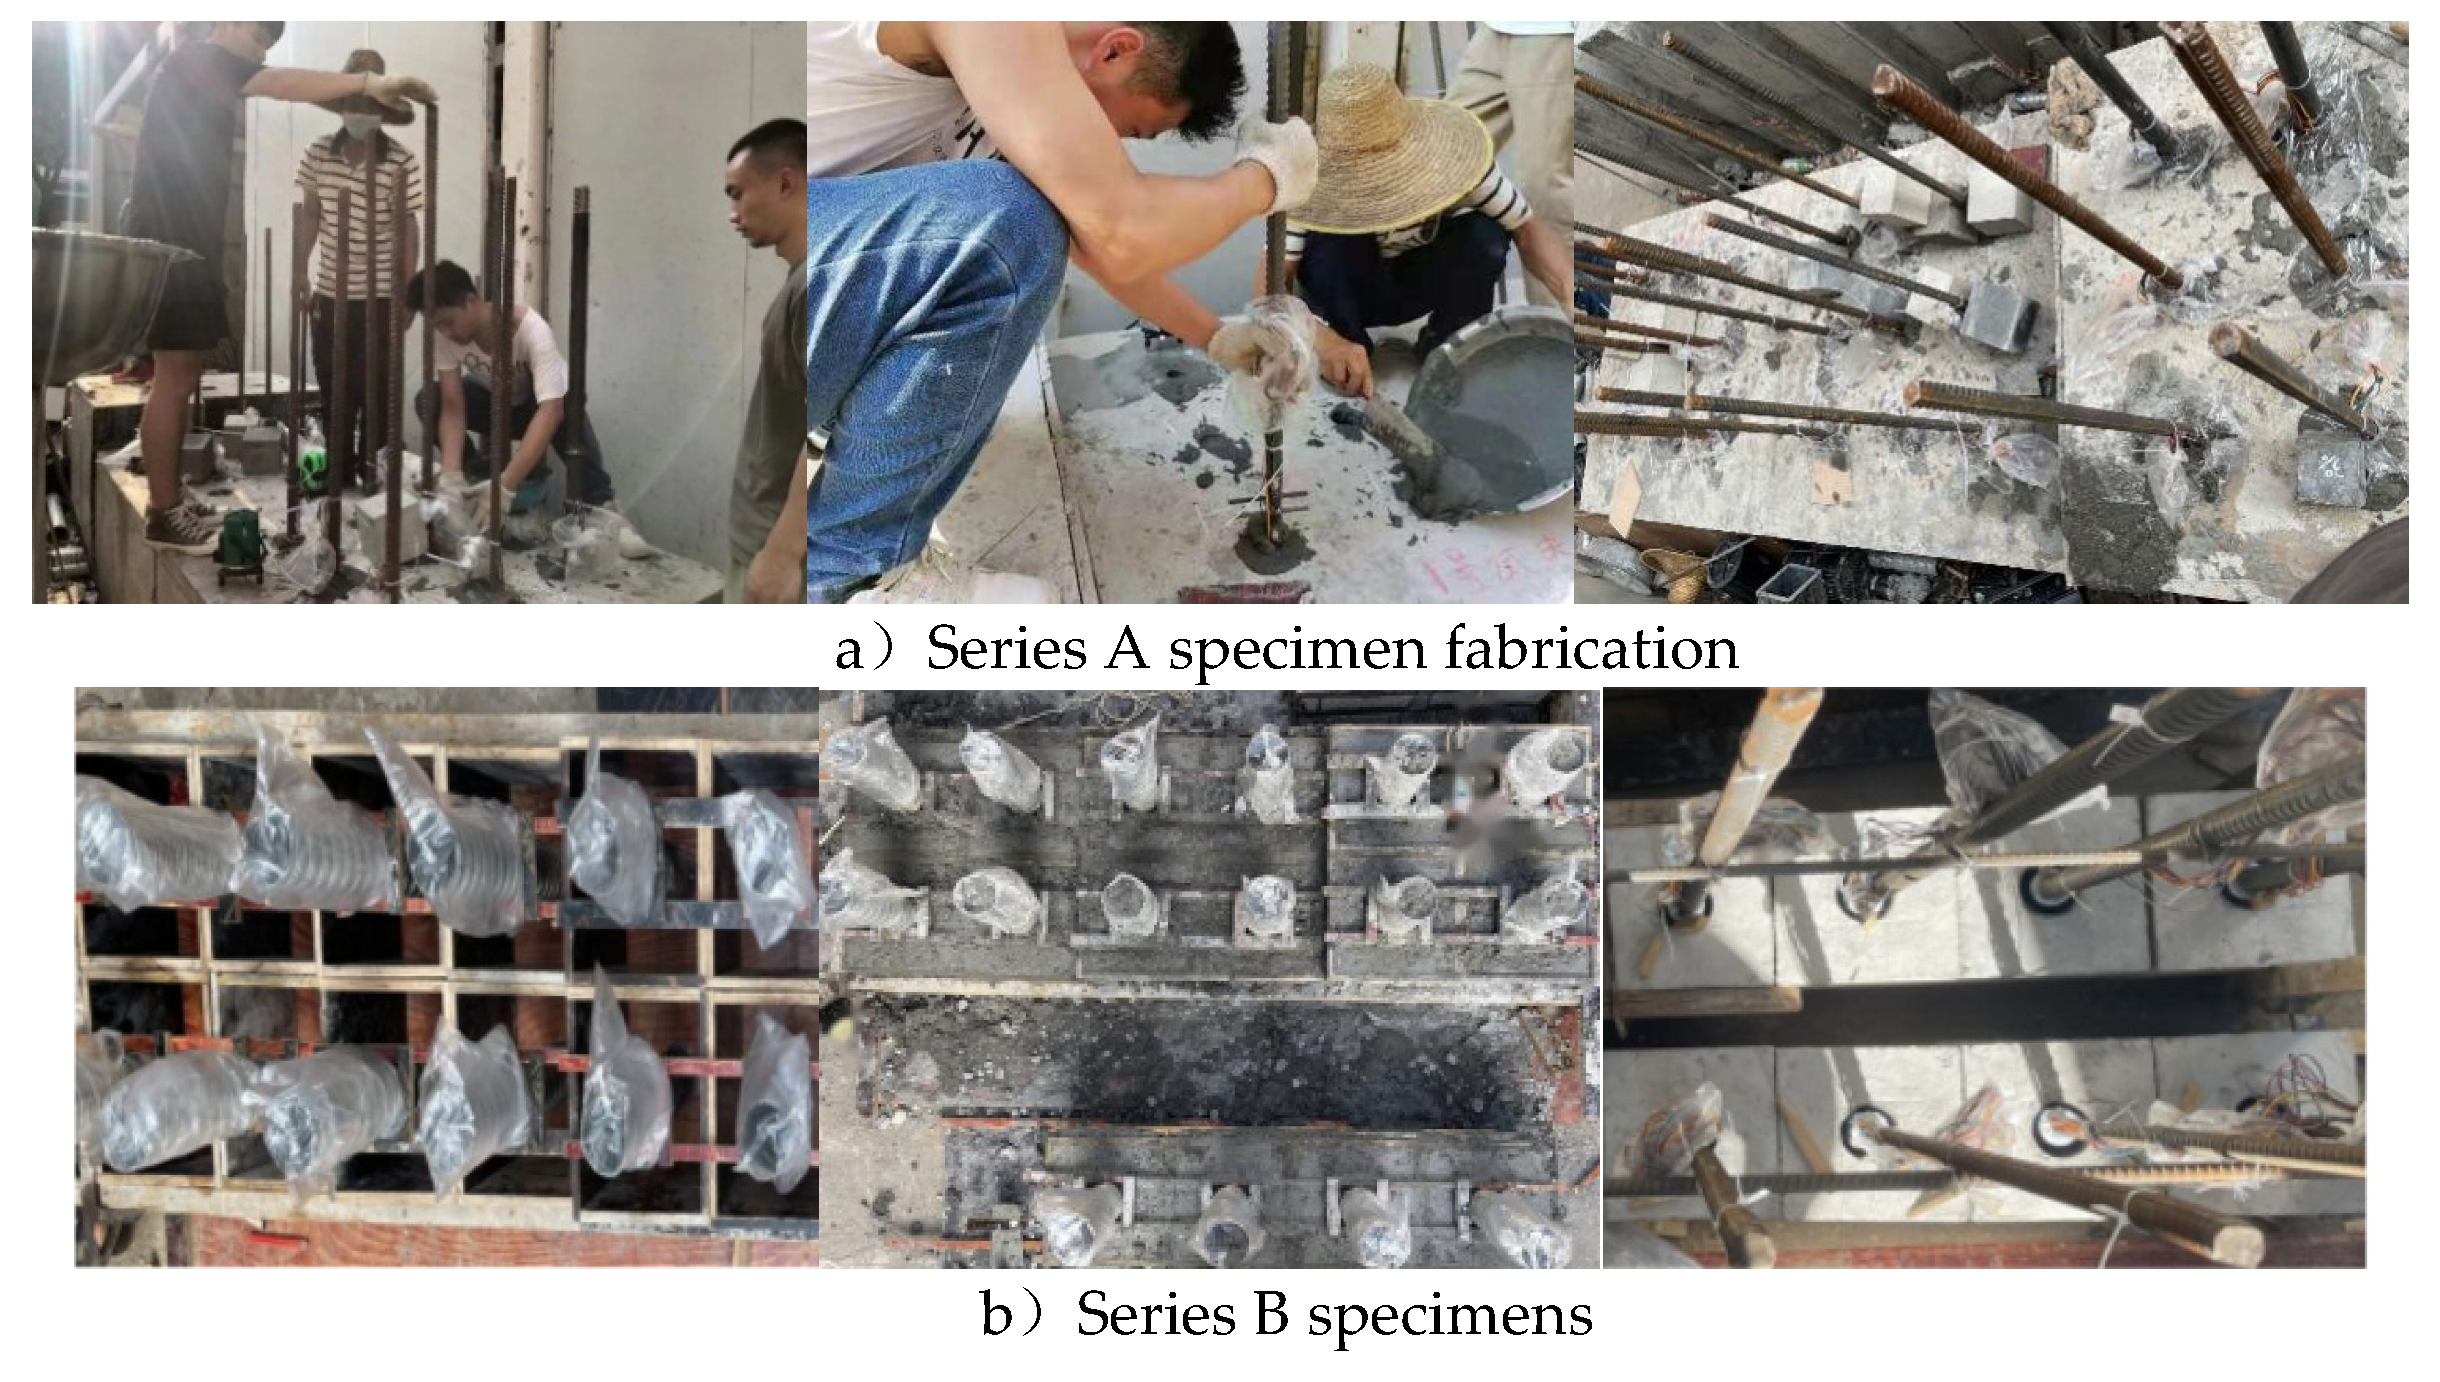
Figure 6.
Test of mechanical property for materials.
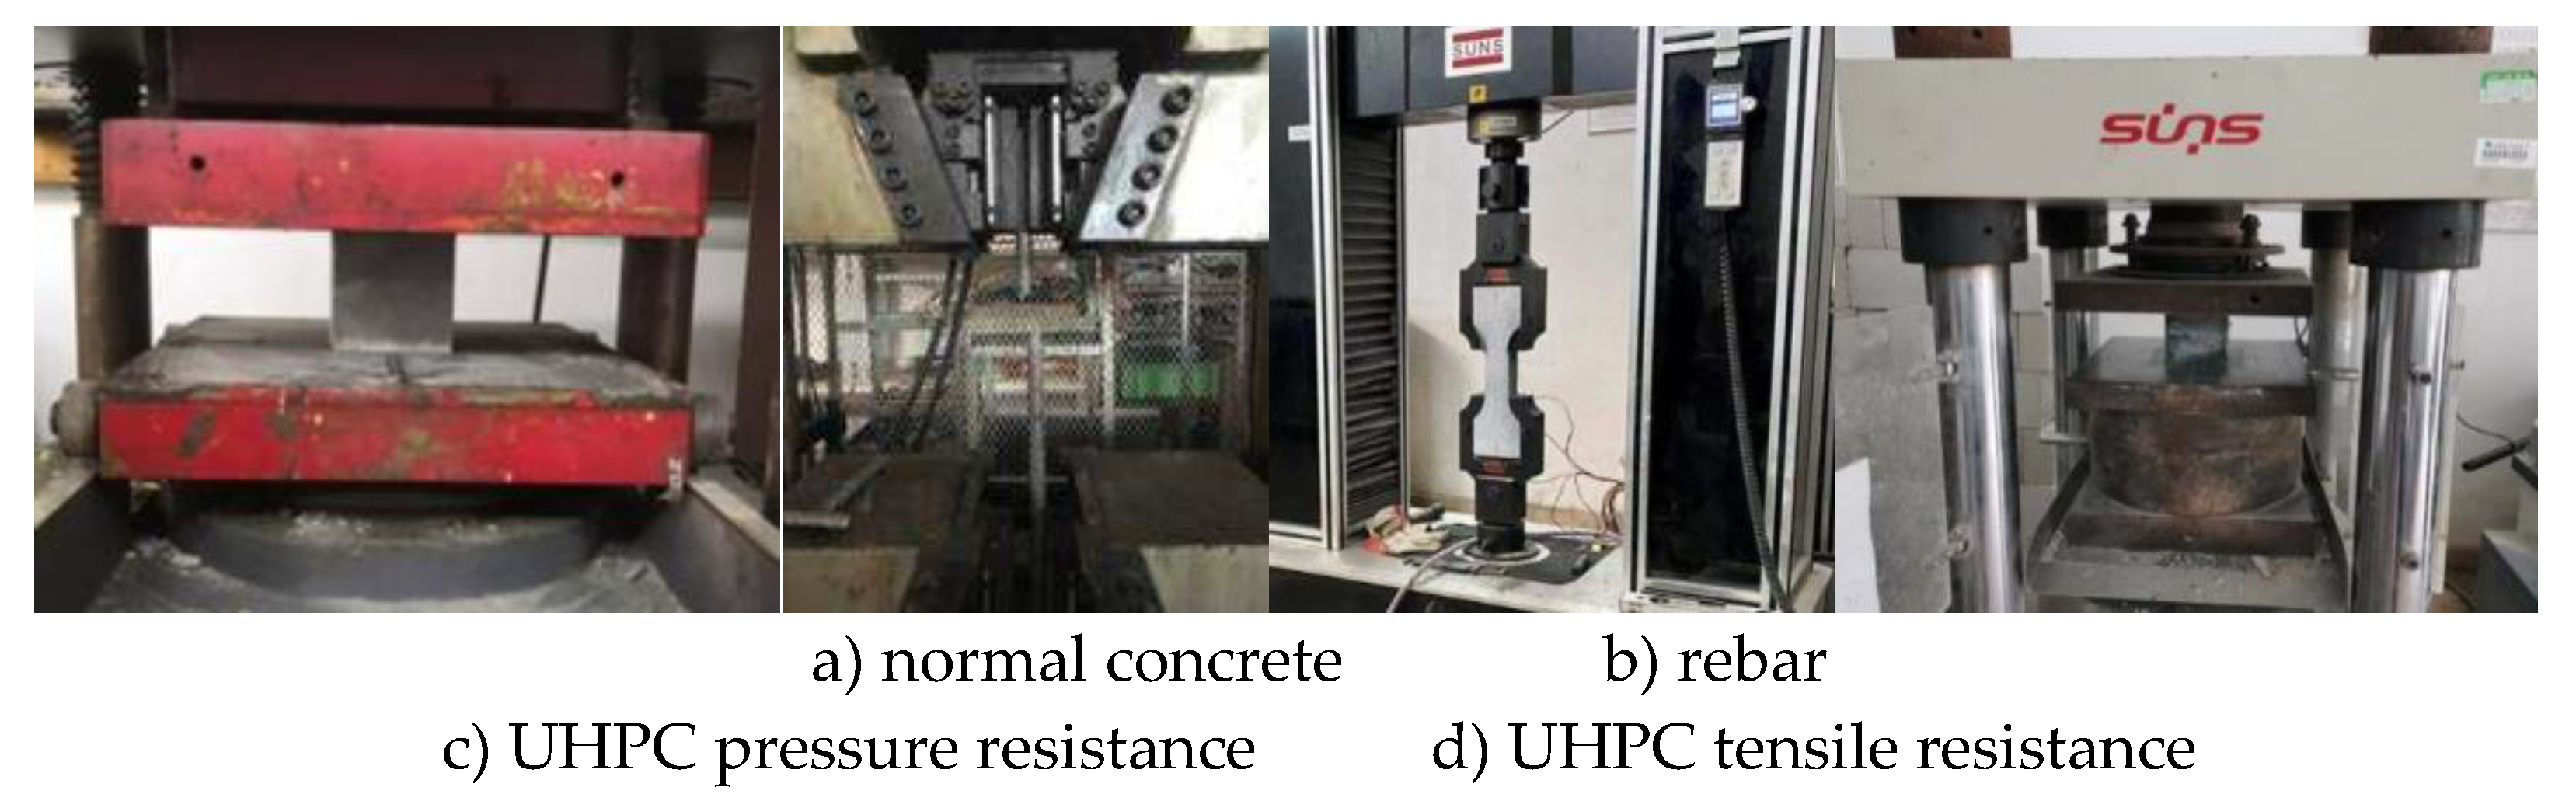
Figure 7.
Loading instrumentation diagram.
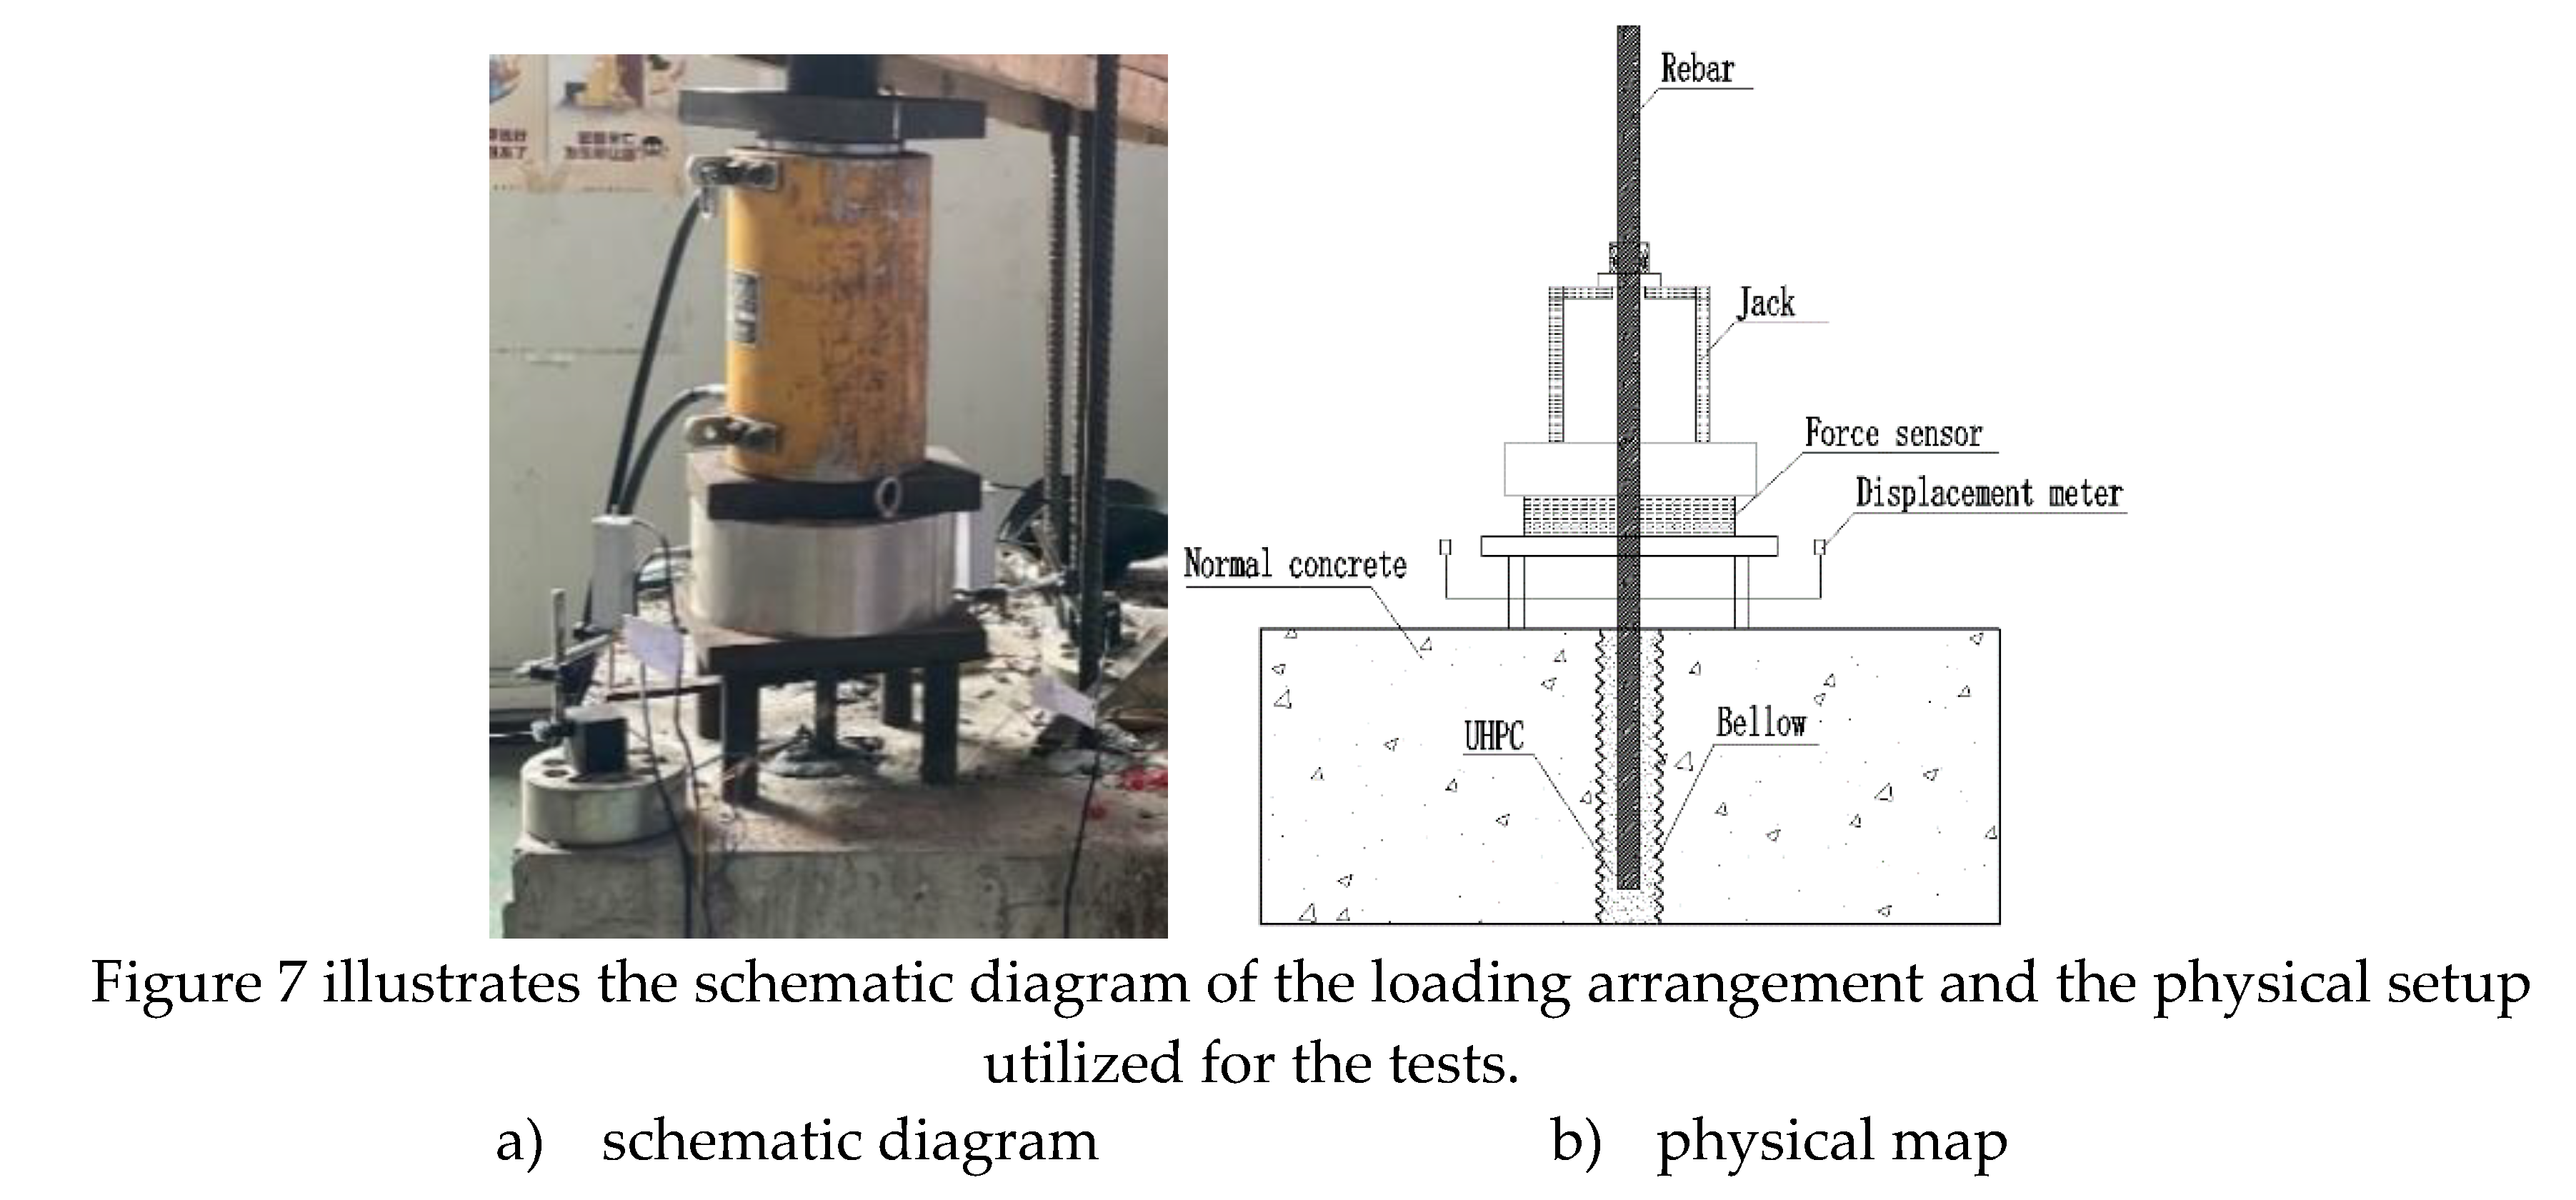
Figure 8.
Location of strain gauge.
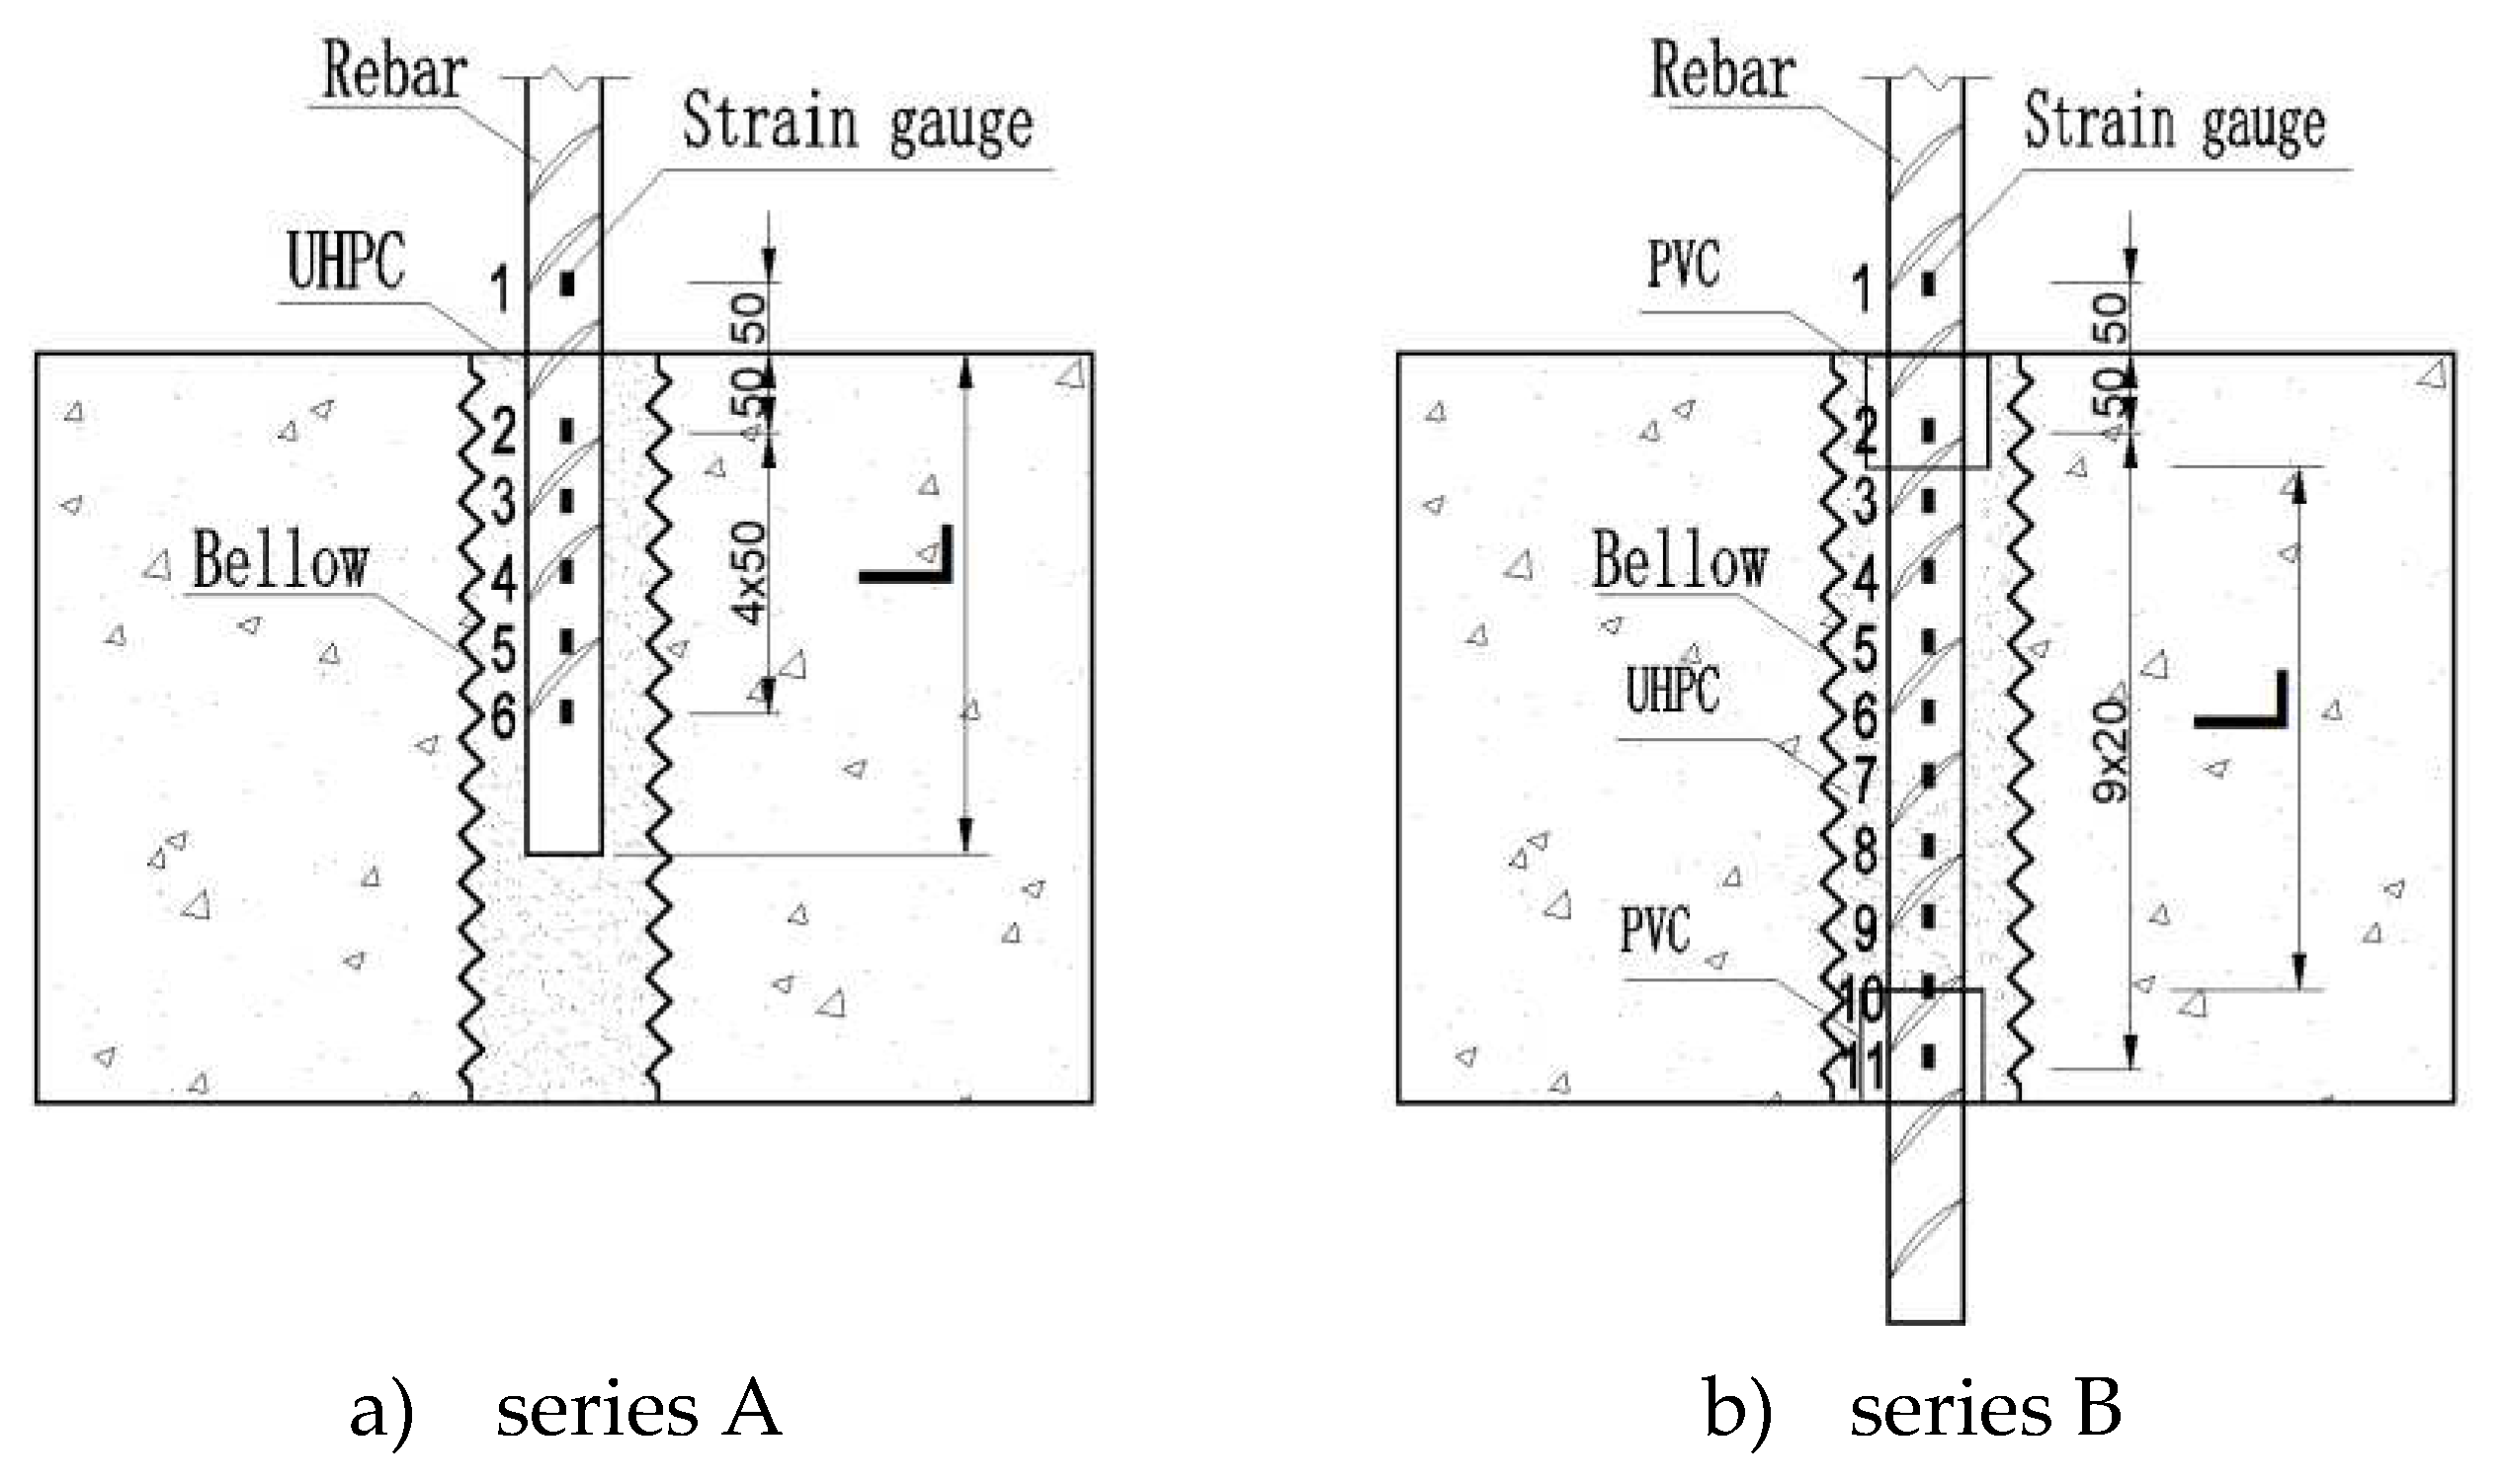
Figure 9.
failure mode.
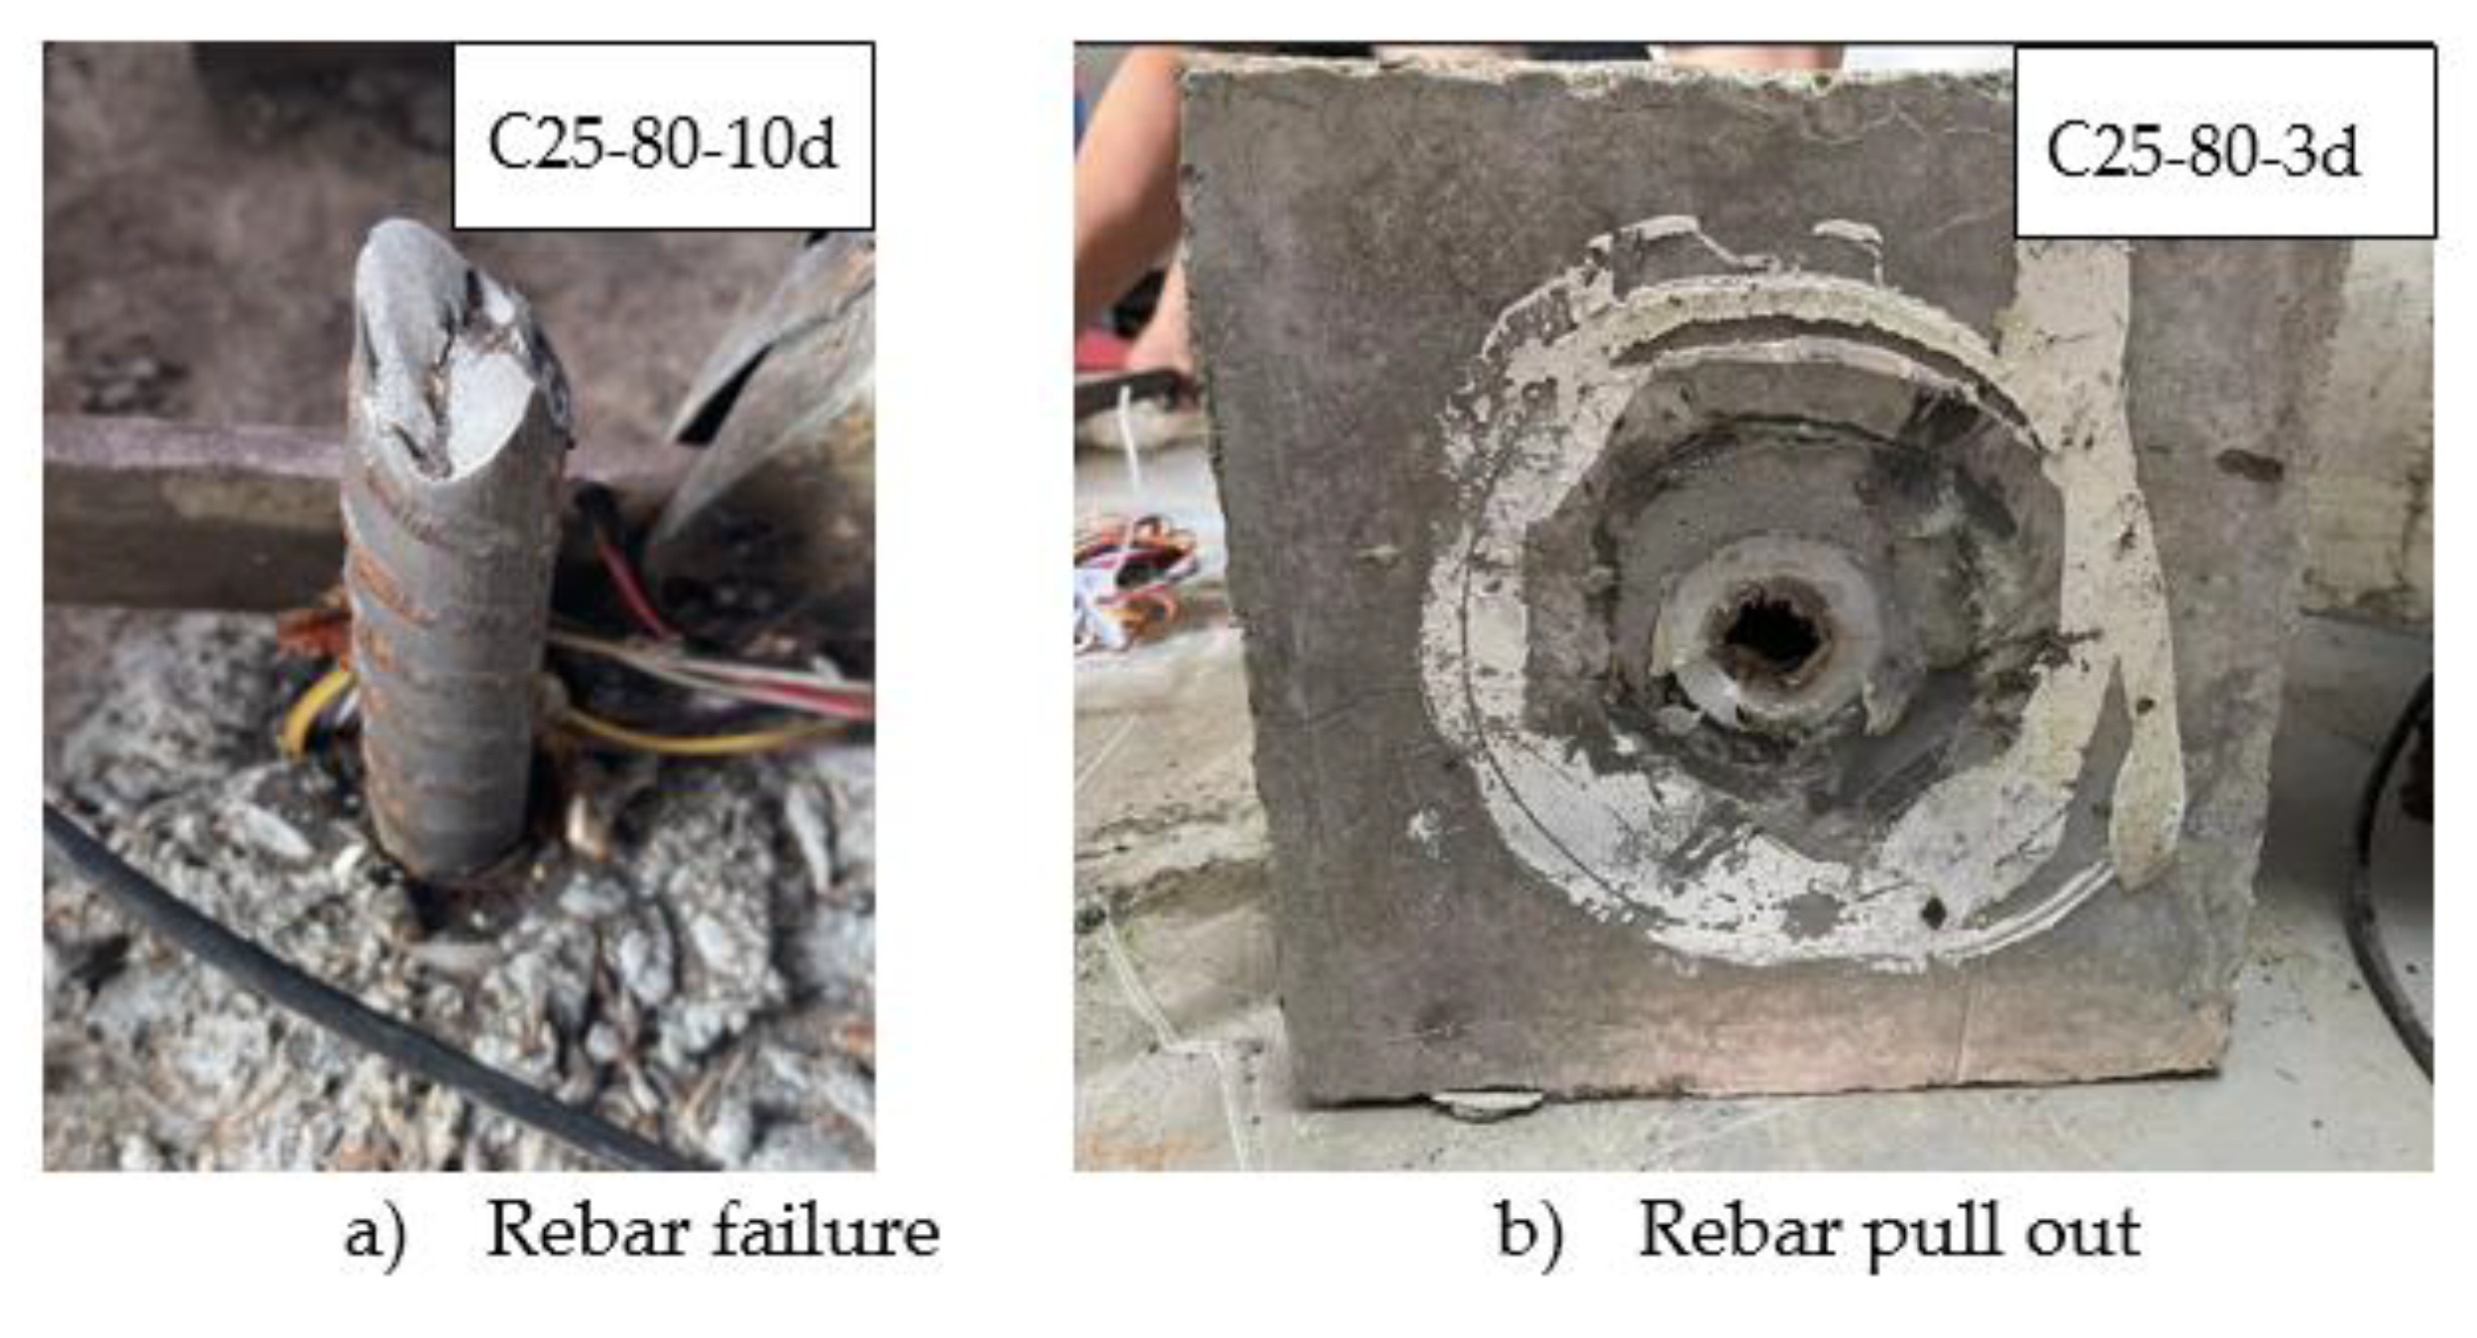
Figure 10.
Load versus deflection curves.
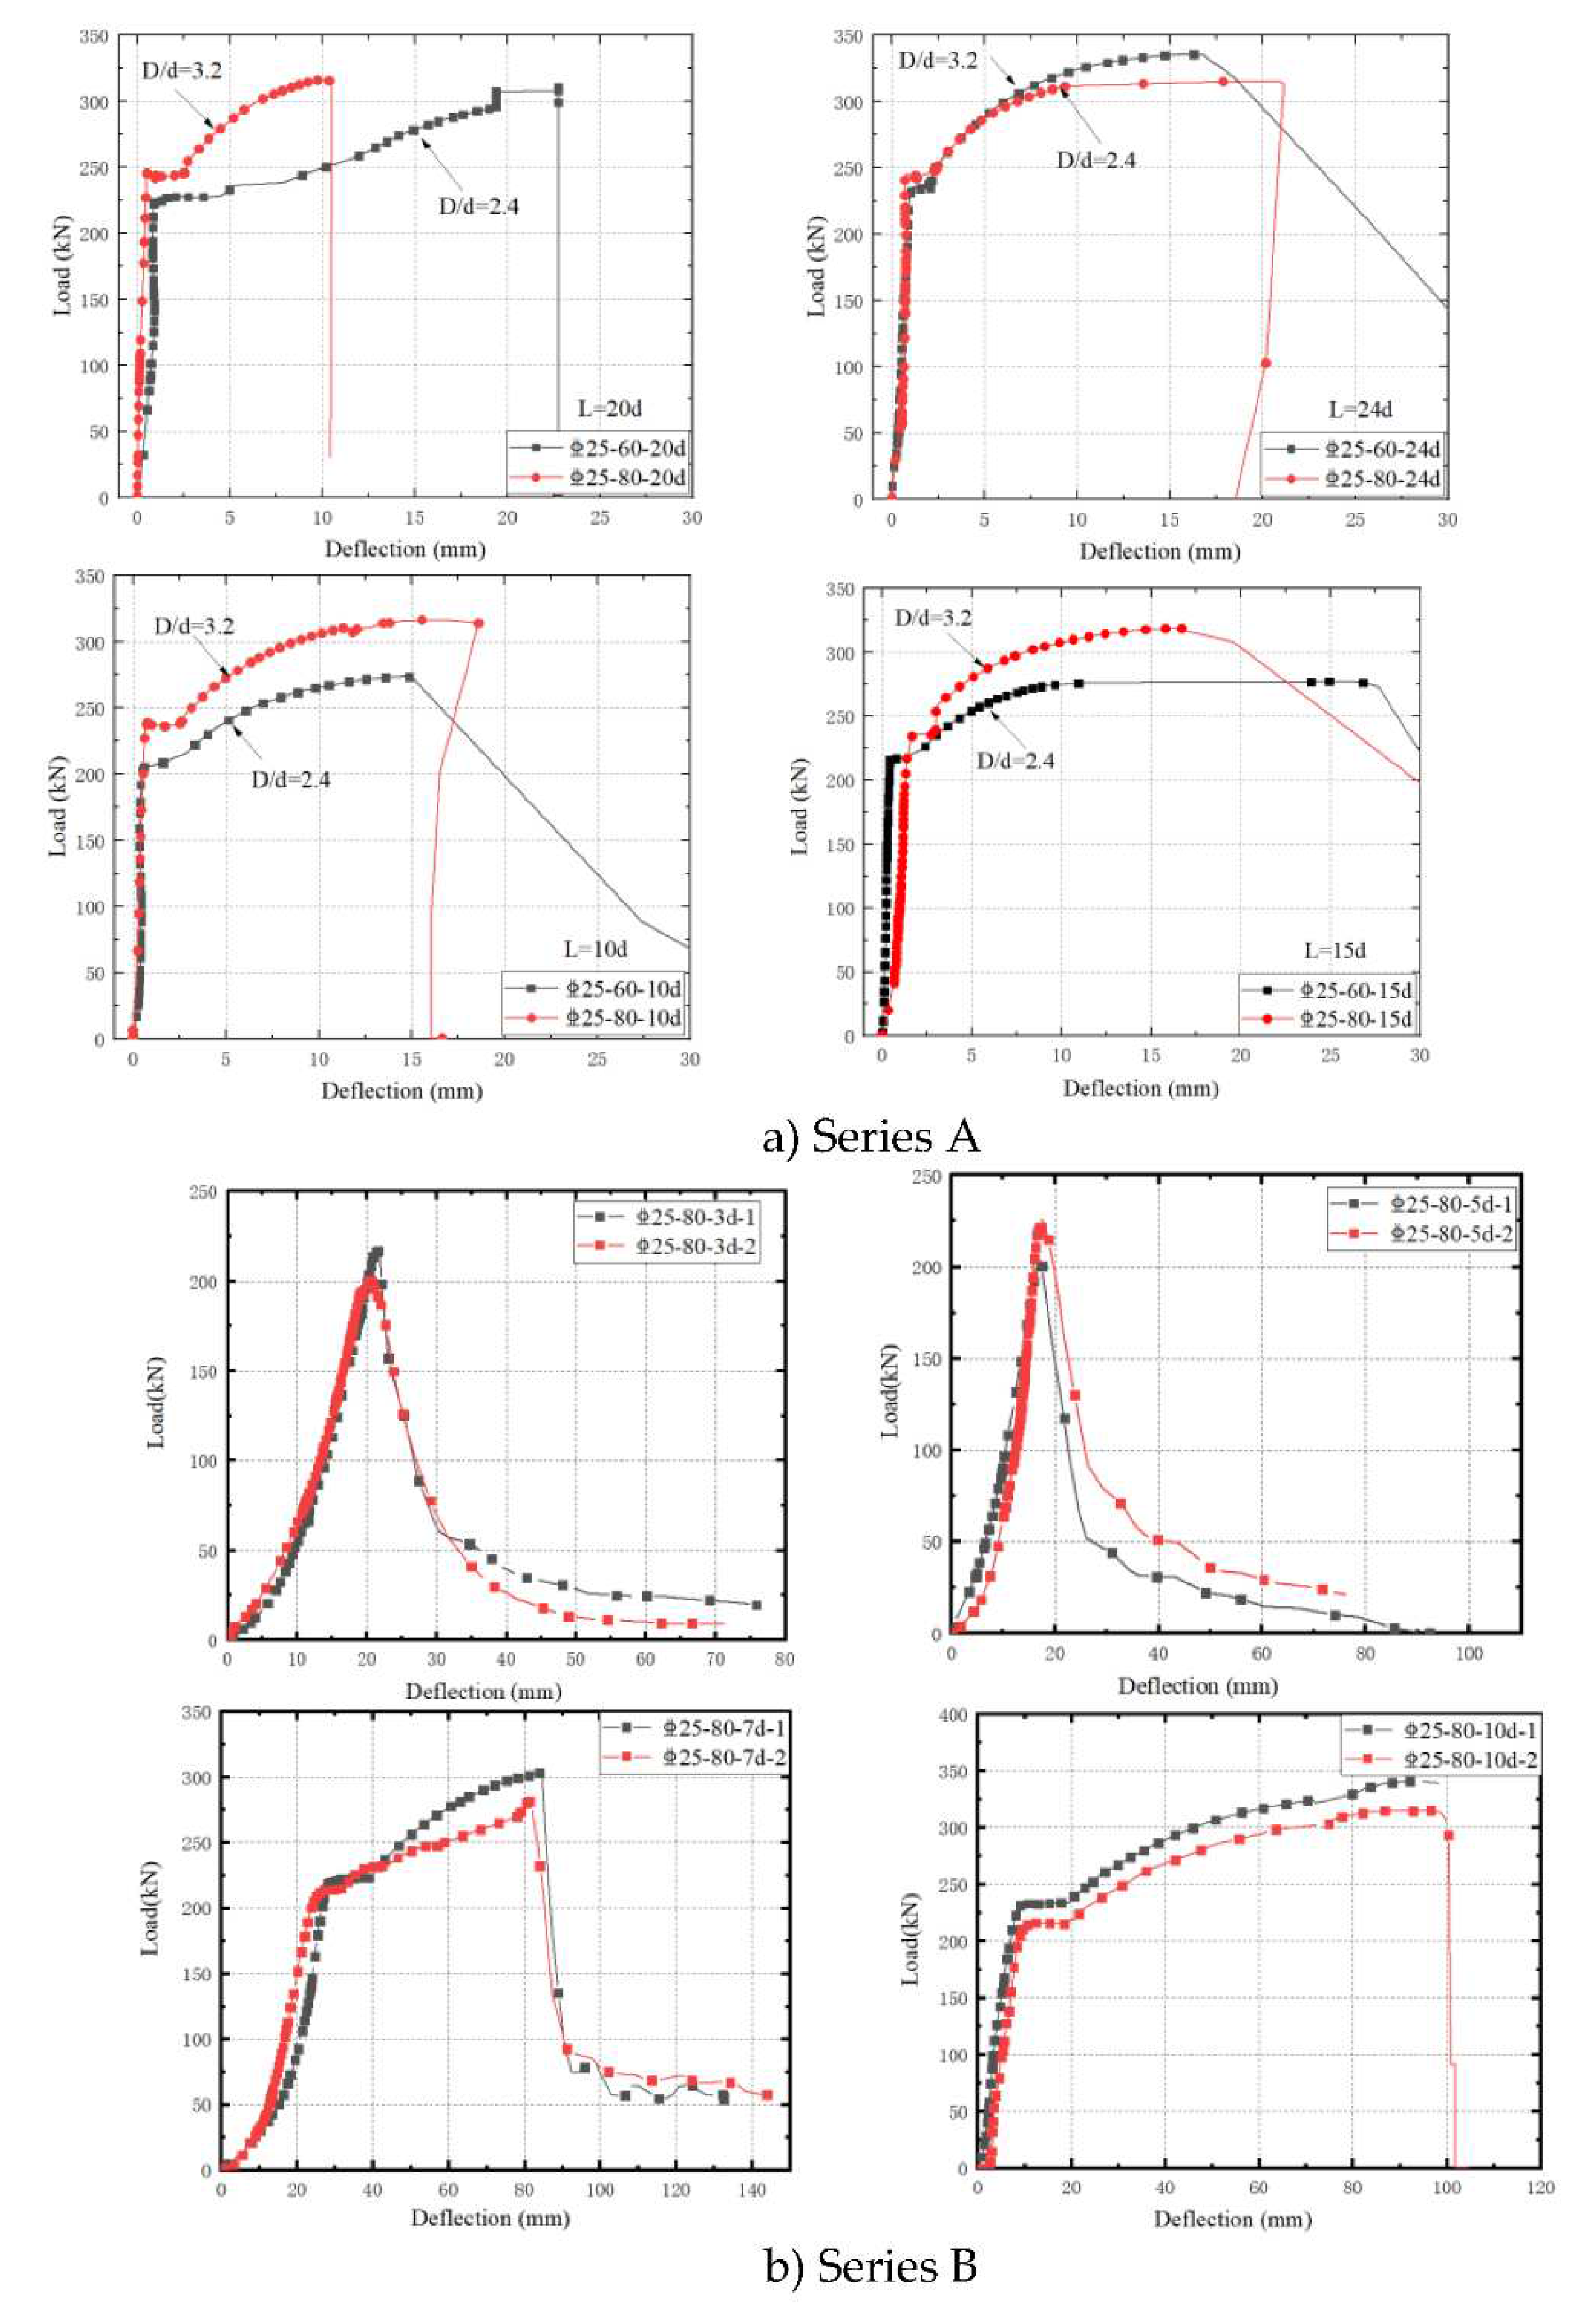
Figure 11.
Load versus deflection curves for specimens with different anchorage lengths L.
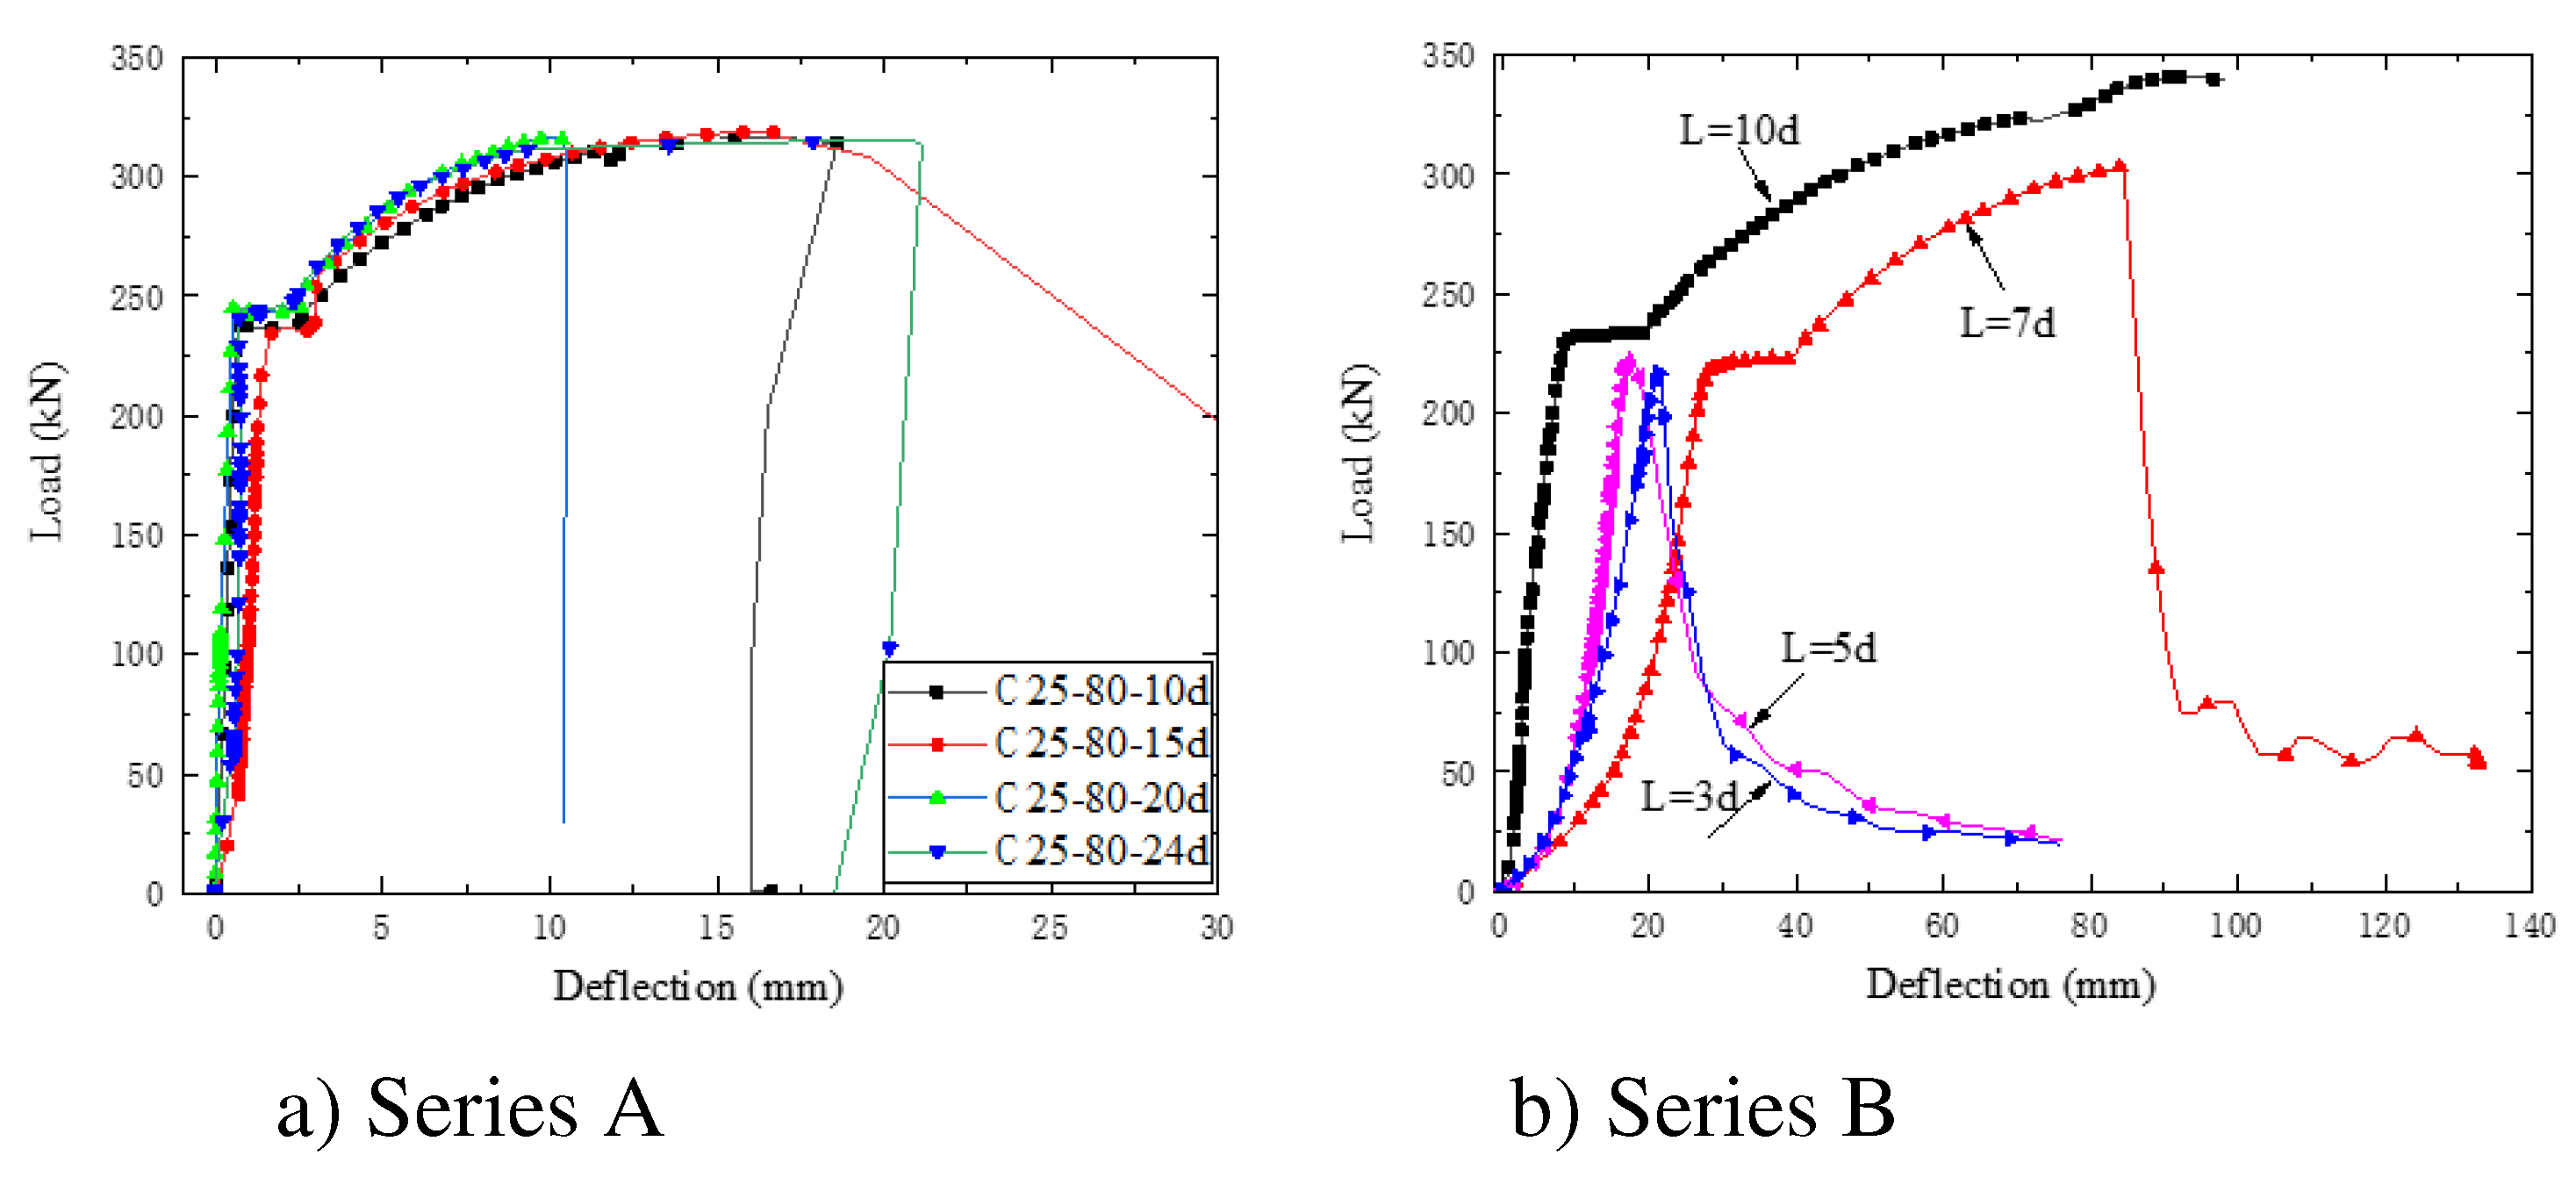
Figure 12.
Load-strain curve of specimens of series B.
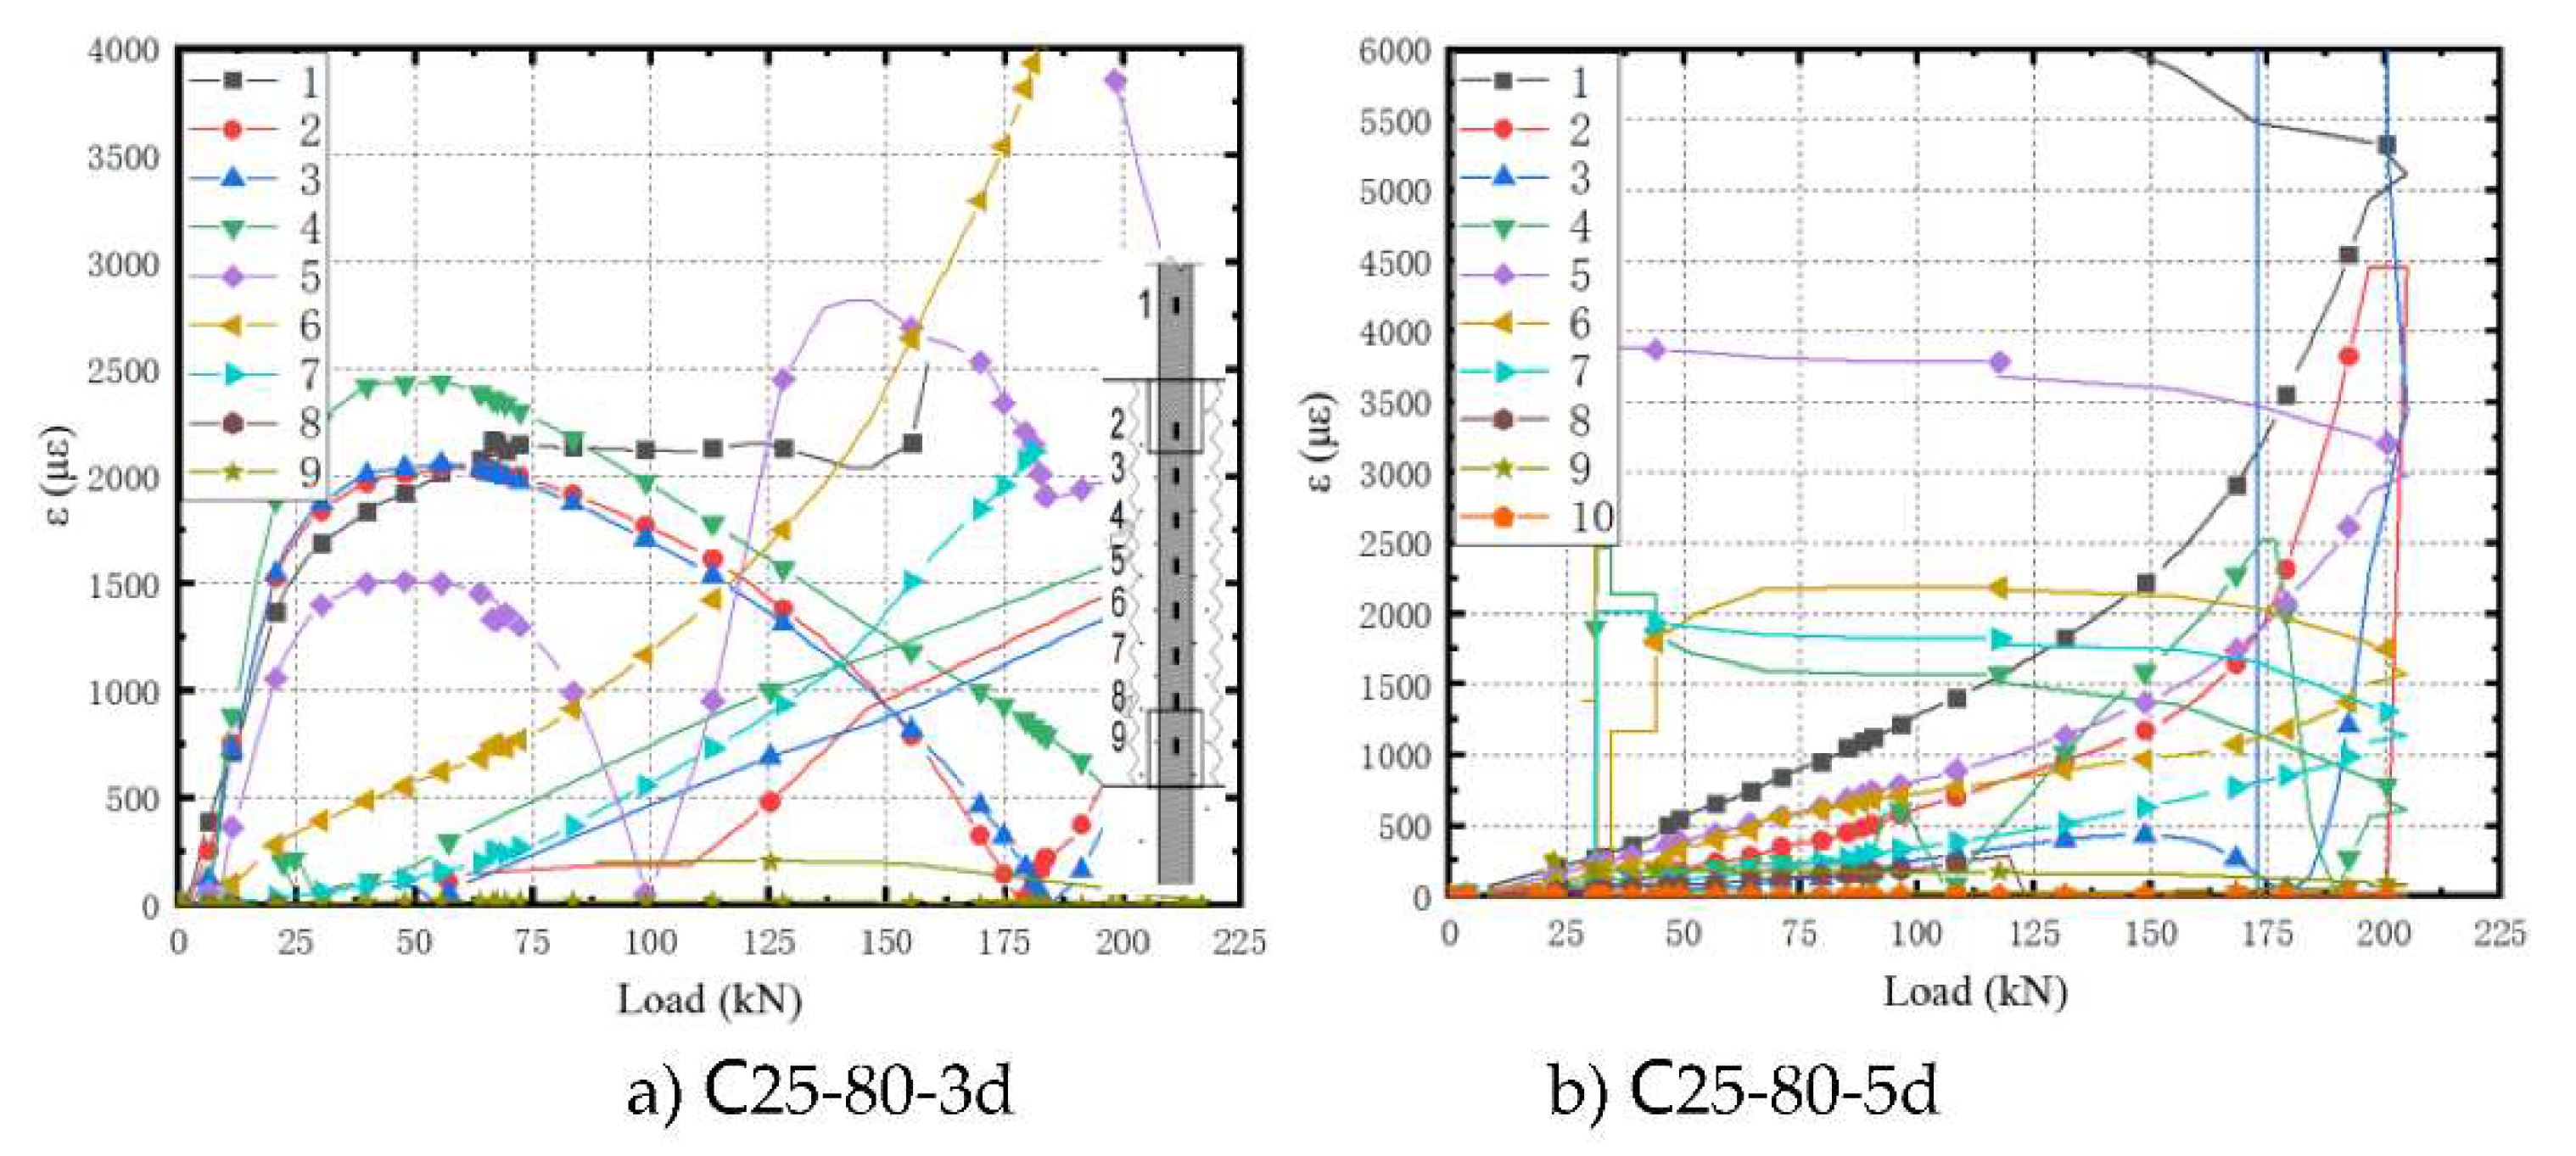
Figure 13.
Coordinate system diagram of anchorage positions.
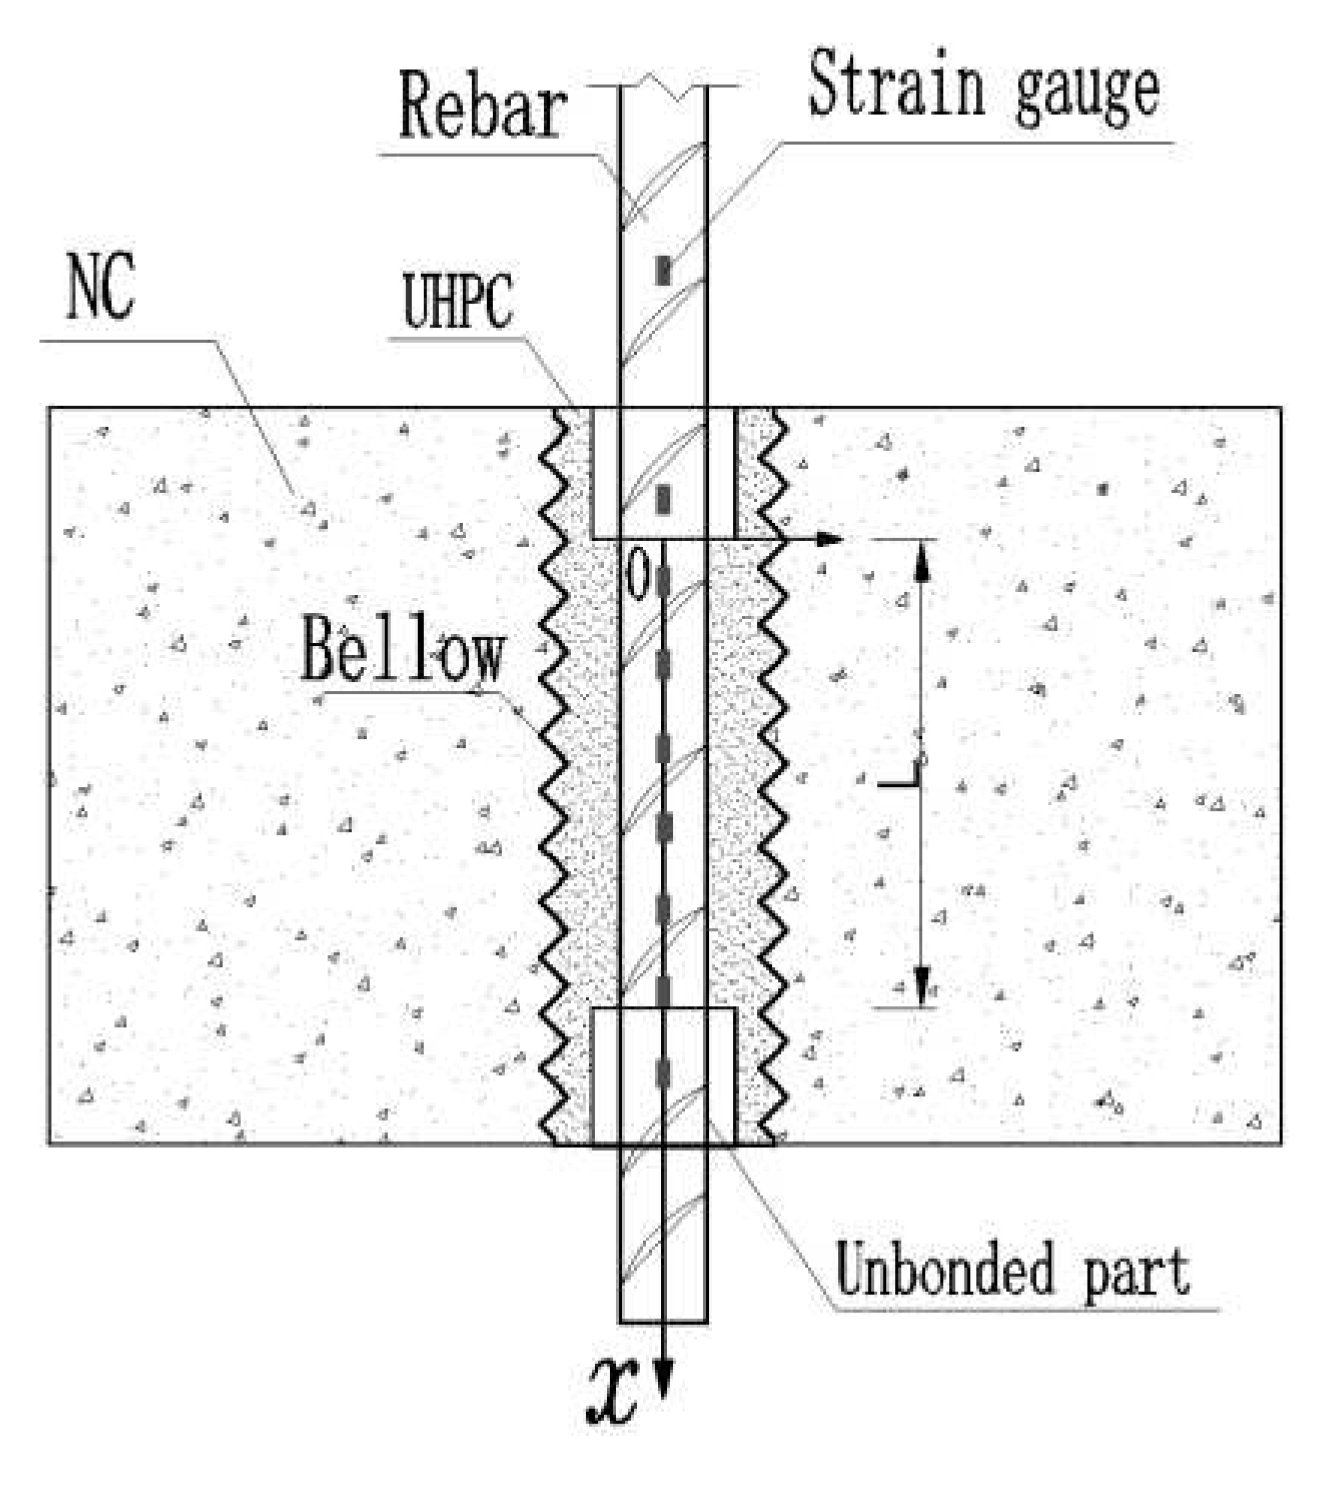
Figure 14.
Strain distribution curves under different loads.
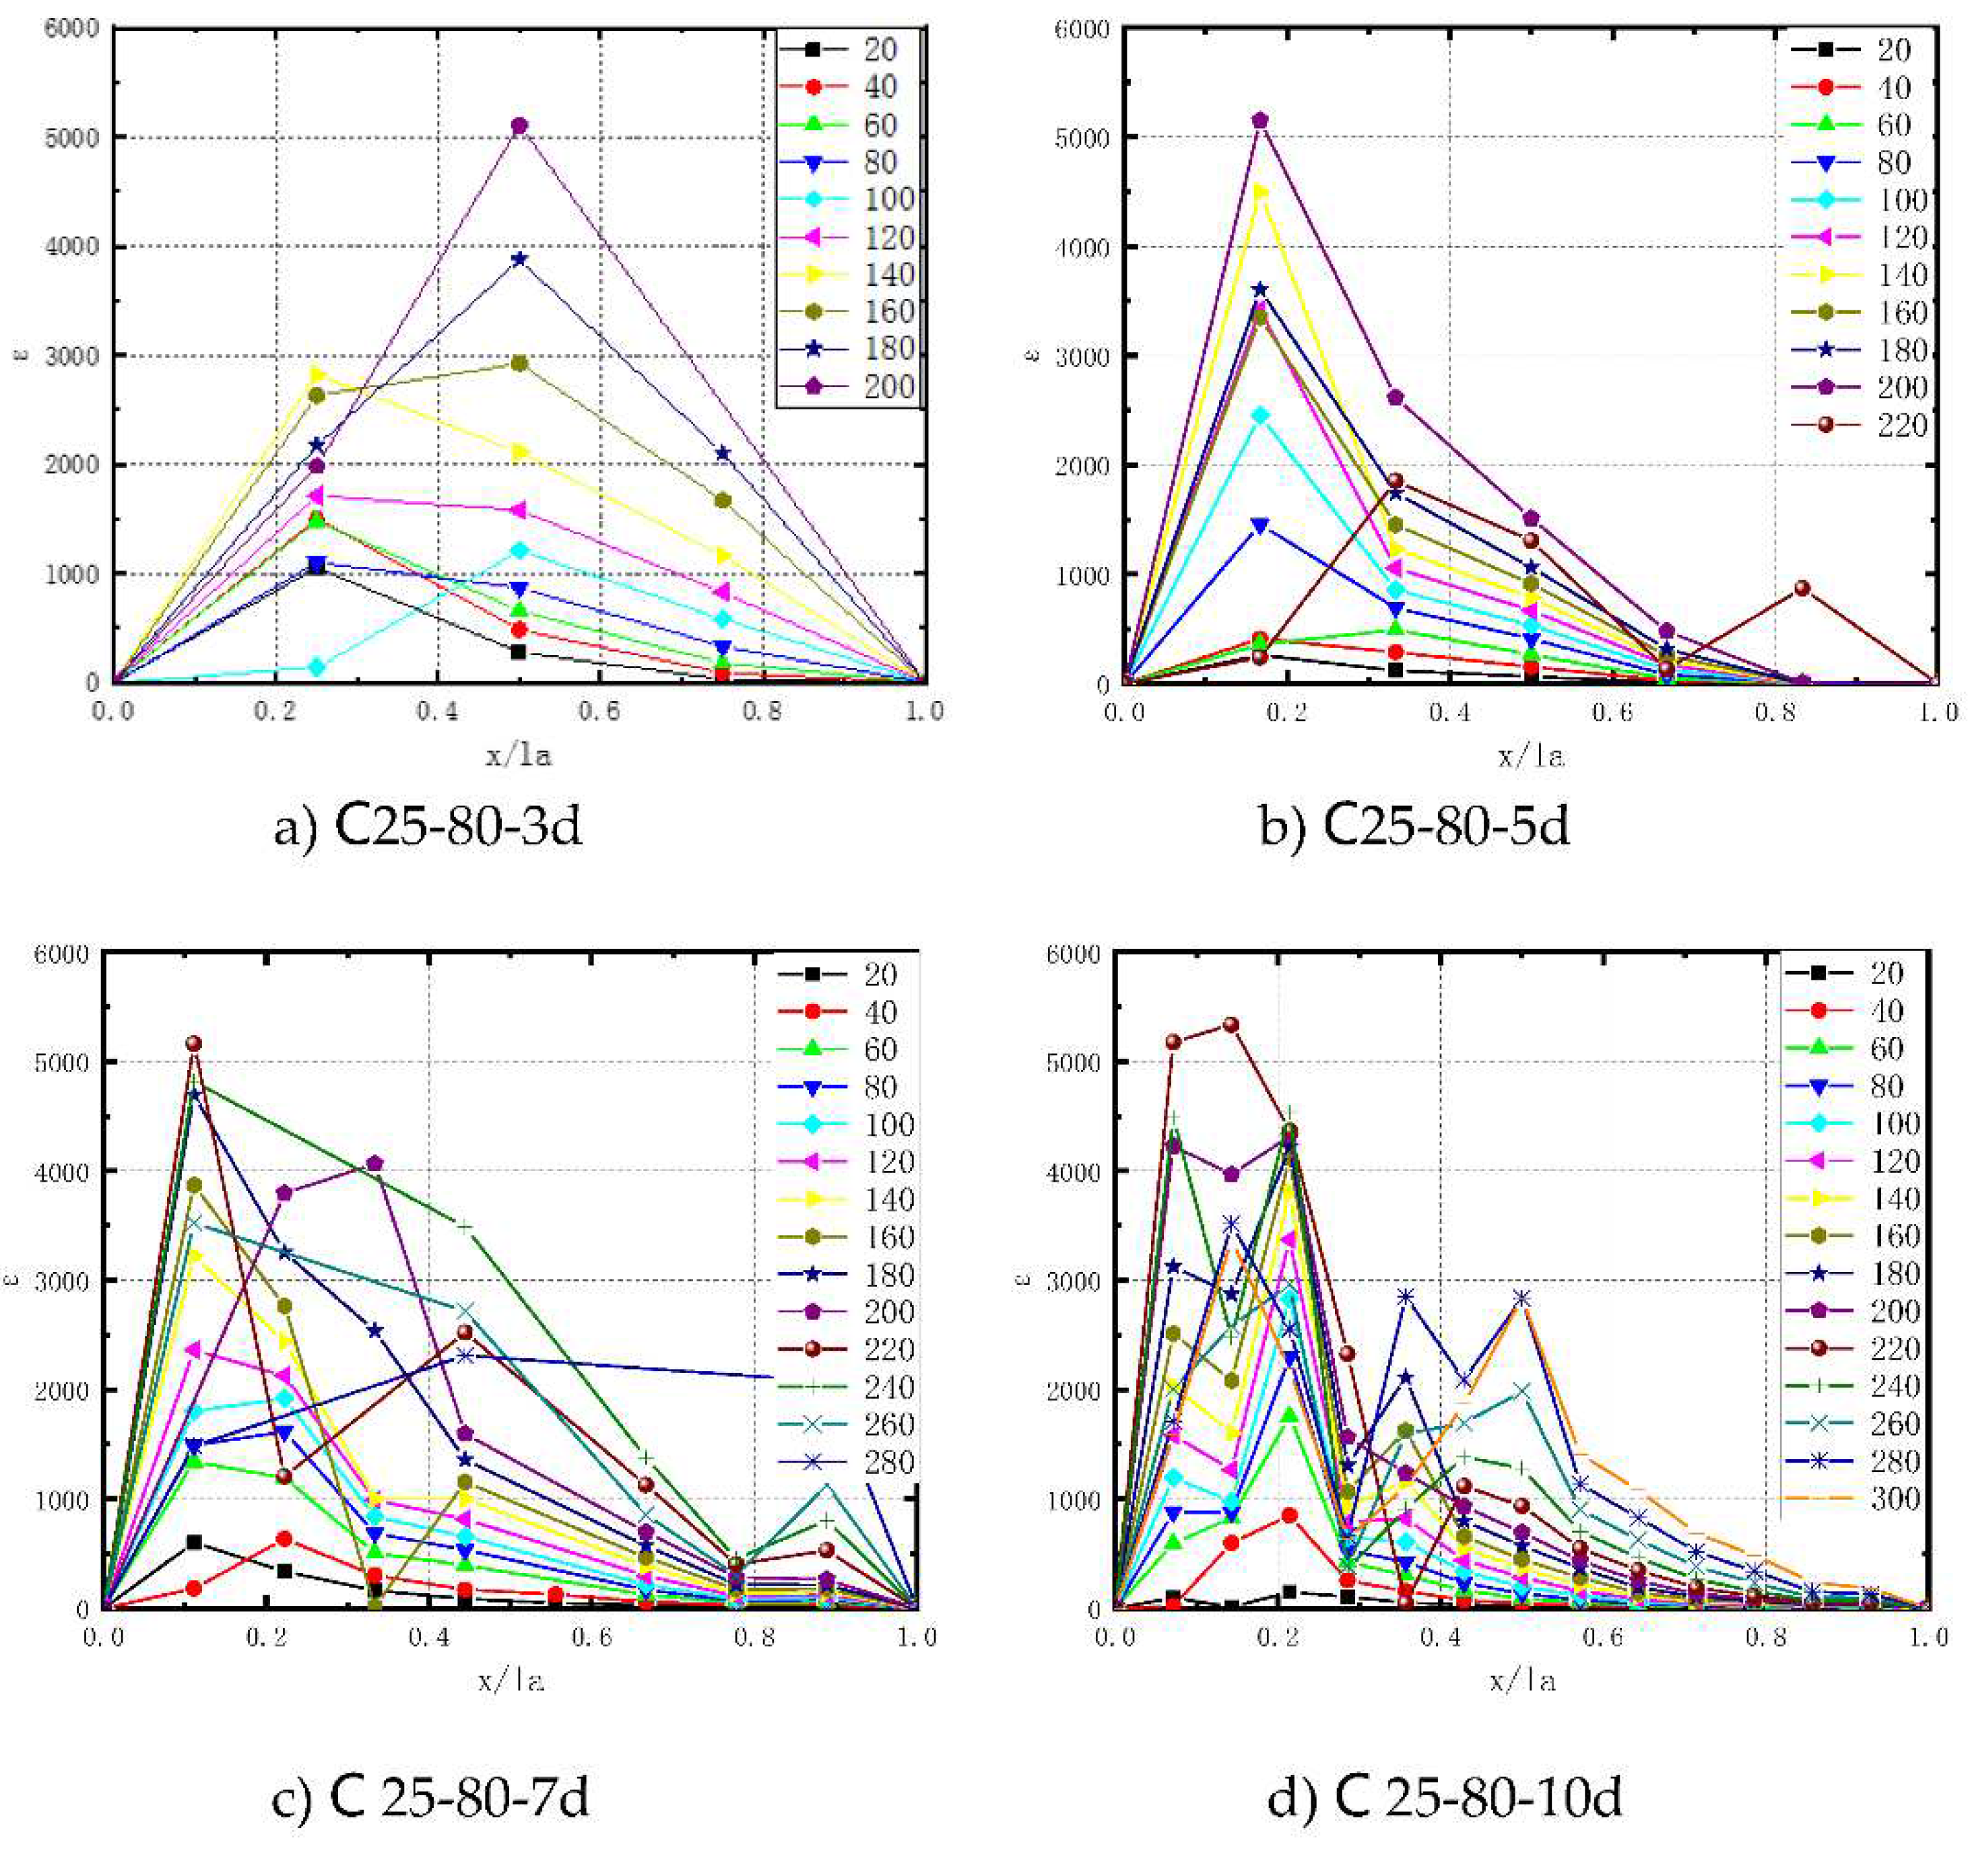
Figure 15.
Experimental curves of bond-slip.
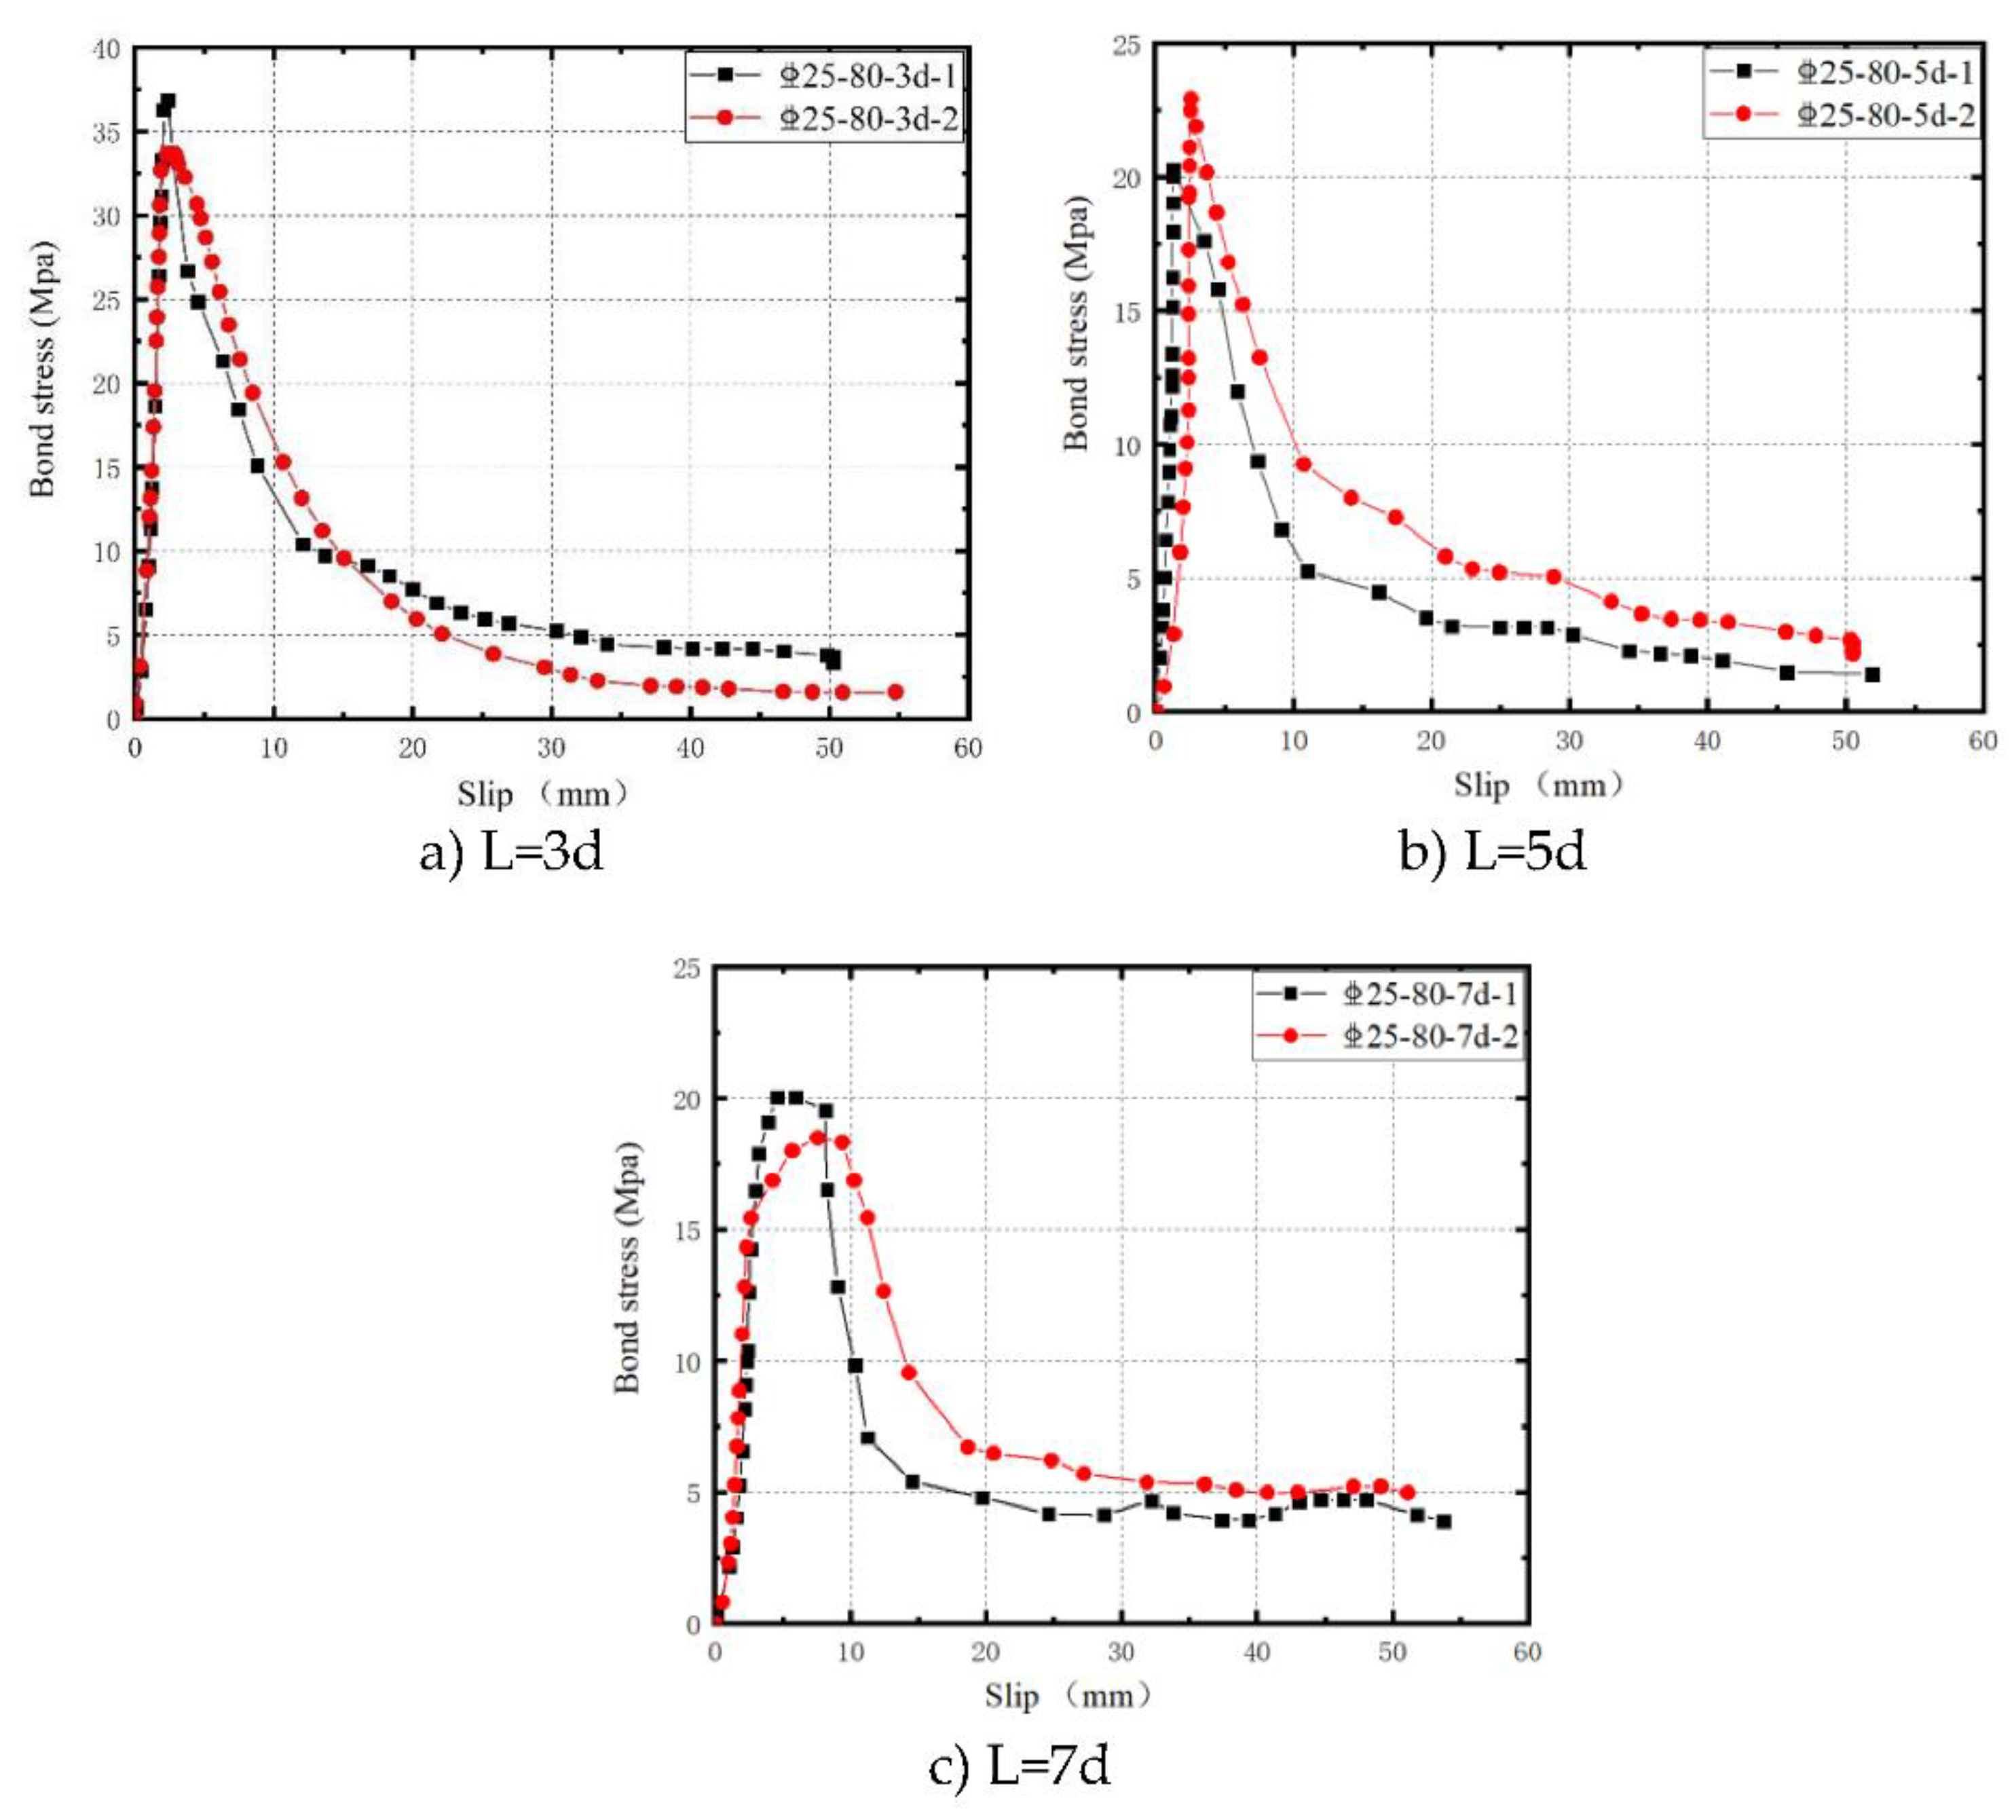
Figure 16.
τ-s curves after standardization.
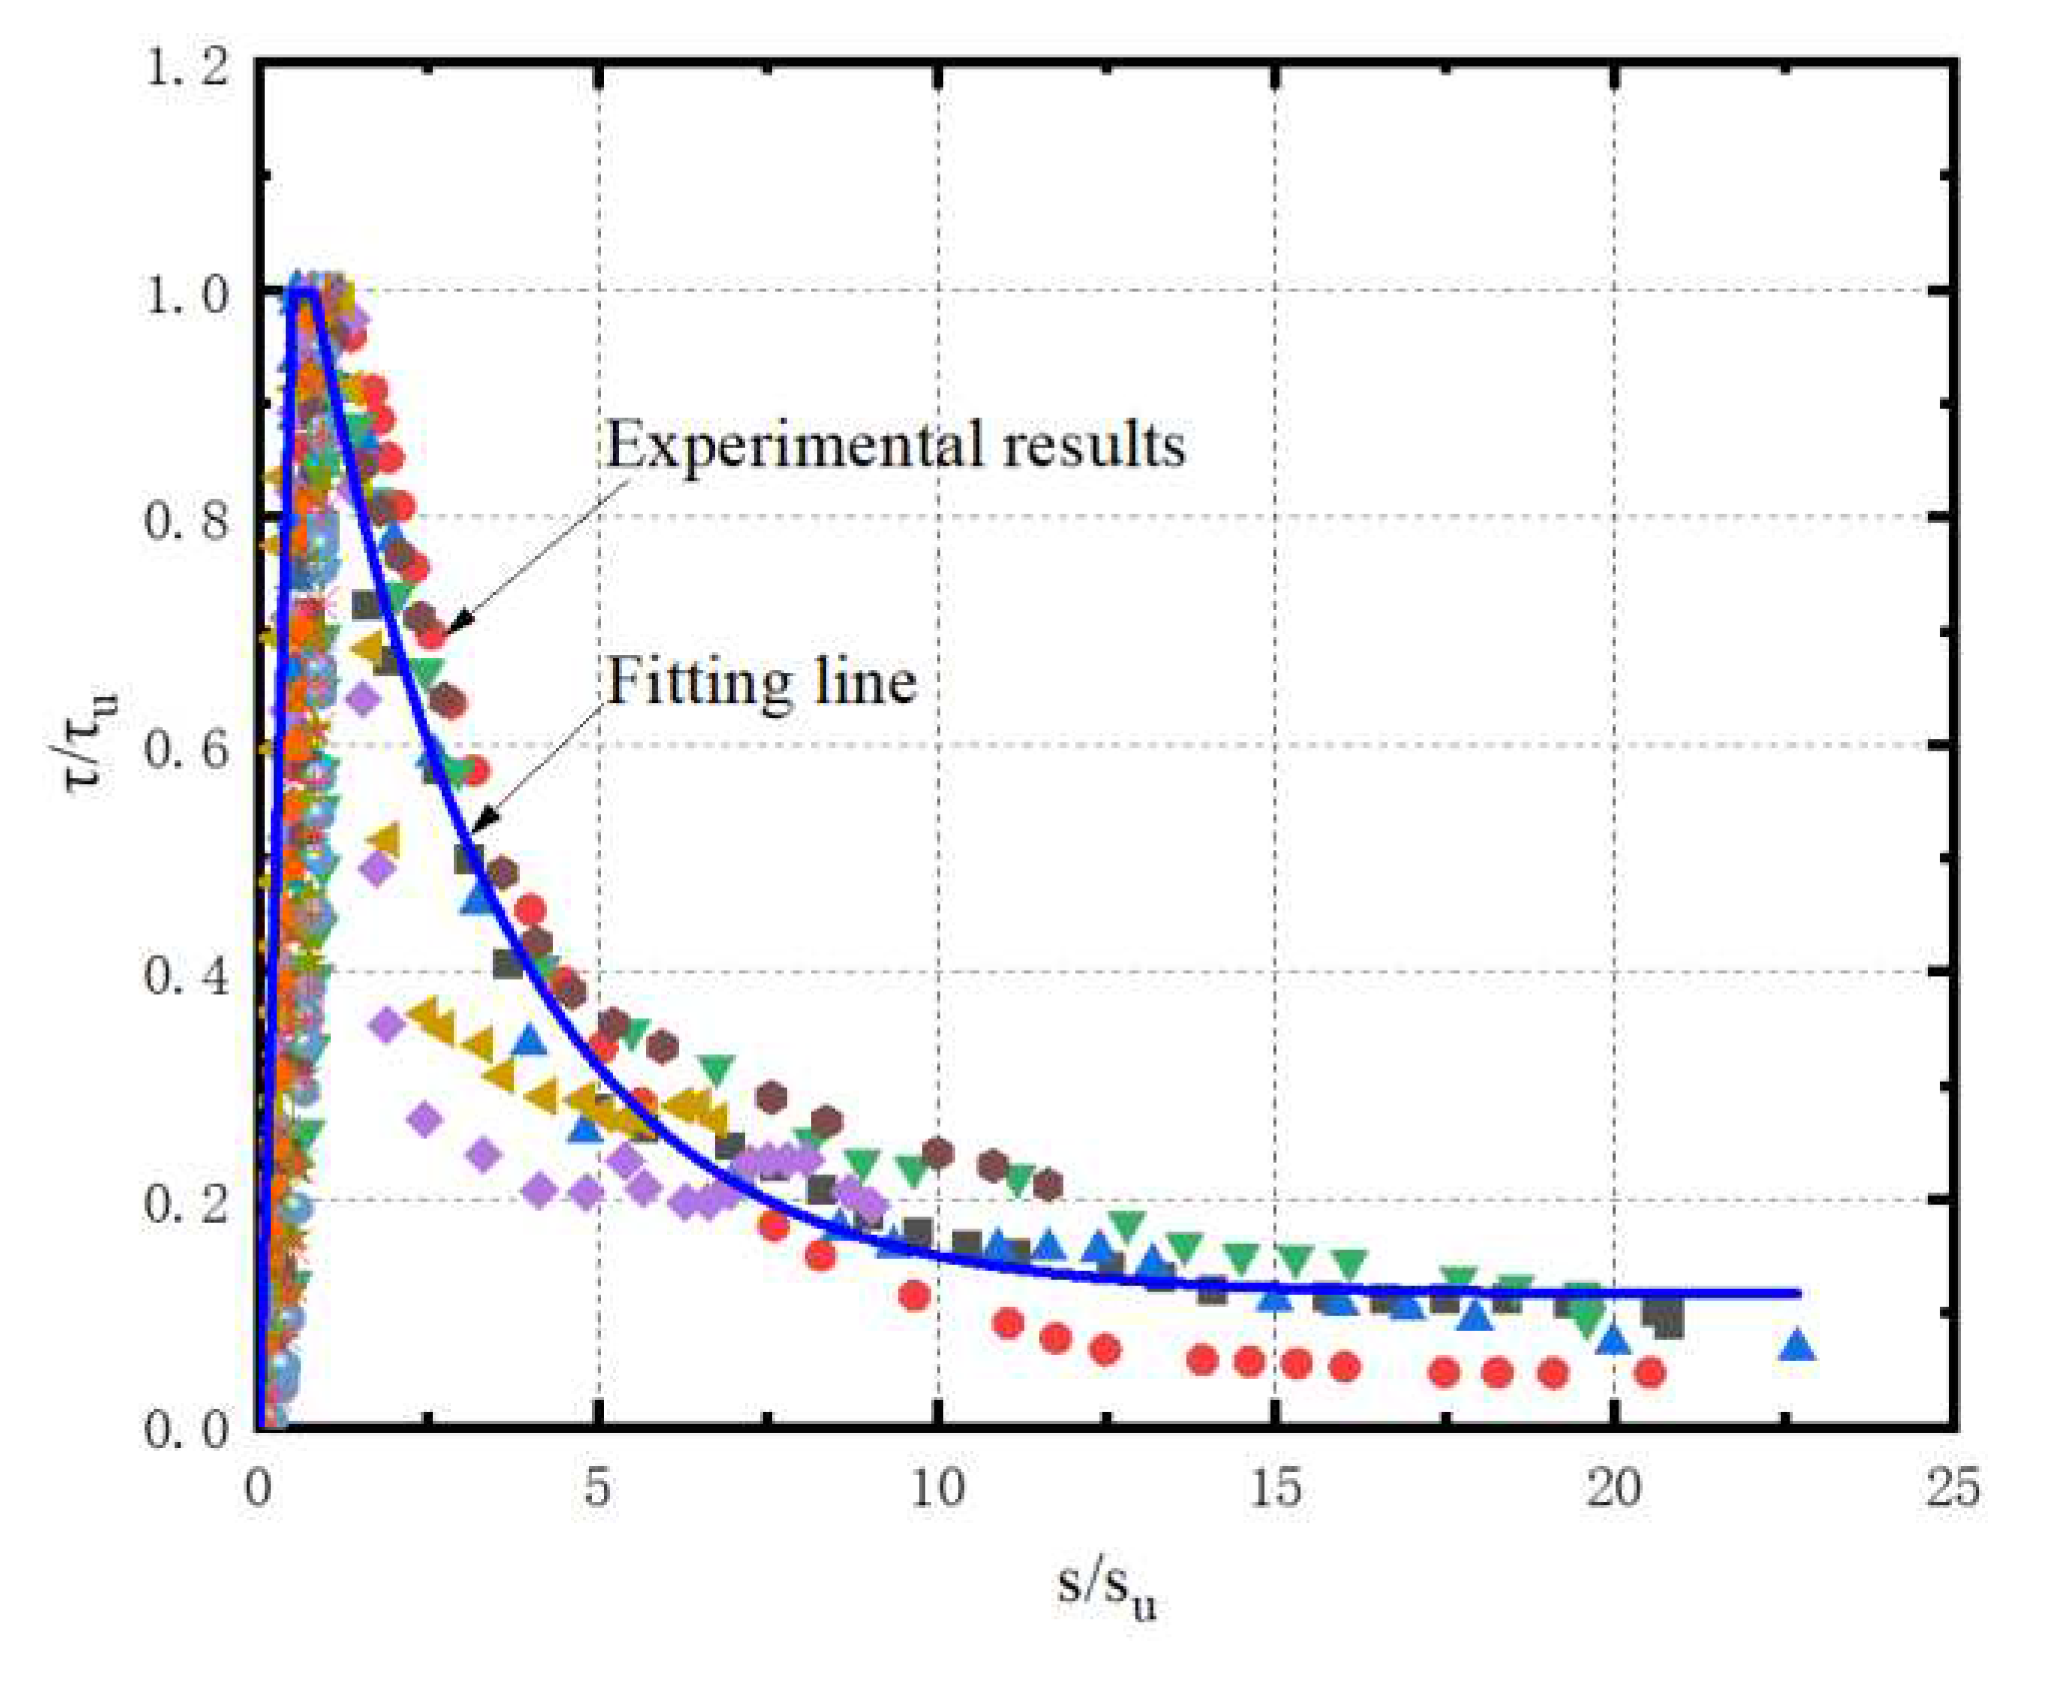

Table 1.
Grouping of central tensile tests for rebar-UHPC grouted bellows.
| Test matrix | Anchorage length L | Rebar diameter d | Bellows diameter D | D/d | Specimen number | The number of specimens |
|---|---|---|---|---|---|---|
| Series A | 24d | 25 | 60 | 2.4 | C25-60-24d | 1 |
| 25 | 80 | 3.2 | C25-80-24d | 1 | ||
| 20d | 25 | 60 | 2.4 | C 25-60-20d | 1 | |
| 25 | 80 | 3.2 | C 25-80-20d | 1 | ||
| 15d | 25 | 60 | 2.4 | C 25-60-15d | 1 | |
| 25 | 80 | 3.2 | C 25-80-15d | 1 | ||
| 10d | 25 | 60 | 2.4 | C 25-60-10d | 1 | |
| 25 | 80 | 3.2 | C 25-80-10d | 1 | ||
| Series B | 10d | 25 | 80 | 3.2 | C 25-80-10d | 2 |
| 7d | 25 | 80 | 3.2 | C 25-80-7d | 2 | |
| 5d | 25 | 80 | 3.2 | C 25-80-5d | 2 | |
| 3d | 25 | 80 | 3.2 | C 25-80-3d | 2 |
Table 2.
Specimen failure mode and characteristic load values.
| Series | Specimen No. | Failure mode | yield load (kN) |
yield strength (MPa) |
ultimate load (kN) |
Ultimate Strength (MPa) |
|---|---|---|---|---|---|---|
| A | C25-60-24d | Tensile failure or rebar | 234.79 | 478.55 | 335.58 | 683.98 |
| C25-80-24d | 245.19 | 499.75 | 315.24 | 642.53 | ||
| C25-60-20d | 223.55 | 455.66 | 309.57 | 630.97 | ||
| C25-80-20d | 245.36 | 500.10 | 315.69 | 643.44 | ||
| C25-60-15d | 215.02 | 438.26 | 275.69 | 561.92 | ||
| C25-80-15d | 234.15 | 477.25 | 318.72 | 649.62 | ||
| C25-60-10d | 205.05 | 417.94 | 273.65 | 557.76 | ||
| C25-80-10d | 236.85 | 482.75 | 316.41 | 644.91 | ||
| B | C25-80-10d | Tensile failure or rebar | 223.6 | 455.8 | 327.8 | 668.1 |
| C25-80-7d | Rebar pullout | 217.1 | 442.5 | 292.5 | 596.2 | |
| C25-80-5d | Rebar pullout | Not yielded | -- | 213.1 | -- | |
| C25-80-3d | Rebar pullout | Not yielded | -- | 208.7 | -- |
Disclaimer/Publisher’s Note: The statements, opinions and data contained in all publications are solely those of the individual author(s) and contributor(s) and not of MDPI and/or the editor(s). MDPI and/or the editor(s) disclaim responsibility for any injury to people or property resulting from any ideas, methods, instructions or products referred to in the content. |
© 2023 by the authors. Licensee MDPI, Basel, Switzerland. This article is an open access article distributed under the terms and conditions of the Creative Commons Attribution (CC BY) license (http://creativecommons.org/licenses/by/4.0/).
Copyright: This open access article is published under a Creative Commons CC BY 4.0 license, which permit the free download, distribution, and reuse, provided that the author and preprint are cited in any reuse.


