
Submitted:
02 October 2025
Posted:
14 October 2025
You are already at the latest version
Abstract
In response to the problems of low coverage, high blindness and missed detection of complex vulnerabilities in traditional fuzz testing for binary programs, this paper proposes an enhanced fuzz testing framework based on reverse analysis and large language model (LLM). This framework extracts control flow graphs and key path features through static reverse analysis, and captures input dependency trajectories through dynamic reverse analysis. These are then transformed into structured text input for LLM; the LLM, fine-tuned with binary vulnerability data, predicts high-risk areas and guides the fuzz testing module to generate targeted test cases. Experiments on the LAVA-M benchmark set and 10 actual closed-source binary programs show that this framework improves the vulnerability discovery rate by 34.2% compared to AFL, and shortens the average vulnerability discovery time by 28.7%. Ablation experiments verify the improvement effect of reverse analysis features on the semantic understanding of LLM (F1 value increases by 19.5%). The research confirms that the collaboration of reverse analysis and LLM can effectively enhance the vulnerability identification efficiency of binary program fuzz testing.
Keywords:
reverse analysis
; LLM
; fuzz testing
; binary program
; vulnerability mining
1. INTRODUCTION
With the widespread adoption of closed-source scenarios such as embedded systems and industrial control software, binary programs have become the core protection targets for cybersecurity, and their vulnerability discovery capabilities directly affect the security of critical information infrastructure. Traditional fuzz testing techniques rely on random variations to generate test cases, which have problems of slow coverage improvement and high missed detection rates for complex logical vulnerabilities (such as - after-free usage)[1]; while reverse analysis can parse the control flow and data flow characteristics of binary programs, but it has high manual intervention costs and limited automated semantic understanding capabilities[2]. In recent years, large language models (LLM) have demonstrated strong pattern recognition capabilities in the field of code analysis, but they lack native support for binary programs and are difficult to directly handle instruction-level semantic information[3]. Therefore, how to enhance the understanding ability of LLM for binary programs through the structured features extracted from reverse analysis, and thereby improve the vulnerability identification efficiency of fuzz testing, has become a key direction to solve the current technical bottleneck[4].
Domestic and foreign scholars have explored related technologies: In the fuzz testing field, from the early random testing, it has developed into coverage-guided (such as AFL) and symbolic execution-assisted (such as KLEE) intelligent strategies, but the semantic perception of binary programs is still insufficient; research on reverse analysis focuses on the automatic integration of static disassembly (such as Ghidra) and dynamic taint tracking (such as Triton)[5], but it is difficult to break through the semantic barriers of complex code (such as obfuscation, packed programs); the application of LLM in the security field is concentrated on source code vulnerability detection (such as CodeGeeX) and natural language-assisted reverse analysis, and has not yet formed a deep adaptation scheme for the binary-fuzz testing scenario[6]. Overall, the research on the collaborative mechanism of reverse analysis and LLM still has gaps, and there is a lack of a fuzz testing framework that can effectively combine binary features with LLM reasoning capabilities[7].
The core research content of this paper includes four aspects: First, design a reverse analysis-driven binary feature extraction and semantic transformation method, converting control flow graphs, input dependency trajectories, etc[8]. into structured text that LLM can understand; second, construct an LLM fine-tuning strategy for reverse feature enhancement, improving the model's ability to recognize vulnerability patterns through an annotated binary vulnerability dataset; third, propose a fuzz testing framework that integrates reverse analysis and LLM, achieving targeted testing in high-risk areas and dynamic feedback on coverage; fourth, conduct comparative experiments on benchmark test sets and actual scene samples to verify the improvement effect of the framework on vulnerability discovery rate and efficiency. The subsequent chapters of this paper will be developed in the following structure: Chapter 2 introduces the relevant technical basis, Chapter 3 elaborates on the framework design, Chapter 4 presents the experimental results and analysis, Chapter 5 summarizes the research conclusions and looks forward to future directions.
2. RELEVANT TECHNICAL FOUNDATION
2.1. Binary programs and vulnerability types
Binary programs are machine-executable code generated after compilation, featuring no source code, instruction set dependence (such as x86/x64/ARM, etc.), and potential for obfuscation and reinforcement. Due to the lack of source code information, analyzing binary programs and conducting vulnerability exploitation is quite challenging[9].
Typical binary vulnerability types include buffer overflows, use-after-free (UAF), null pointer references, integer overflows, etc. Taking buffer overflows as an example, when the data written to the buffer exceeds its preset size, a buffer overflow occurs. Let the size of the buffer be B, and the length of the written data be D, then when D>B, a buffer overflow vulnerability may be triggered. This vulnerability can cause program crashes, data leaks, and even be exploited by attackers to execute malicious code.
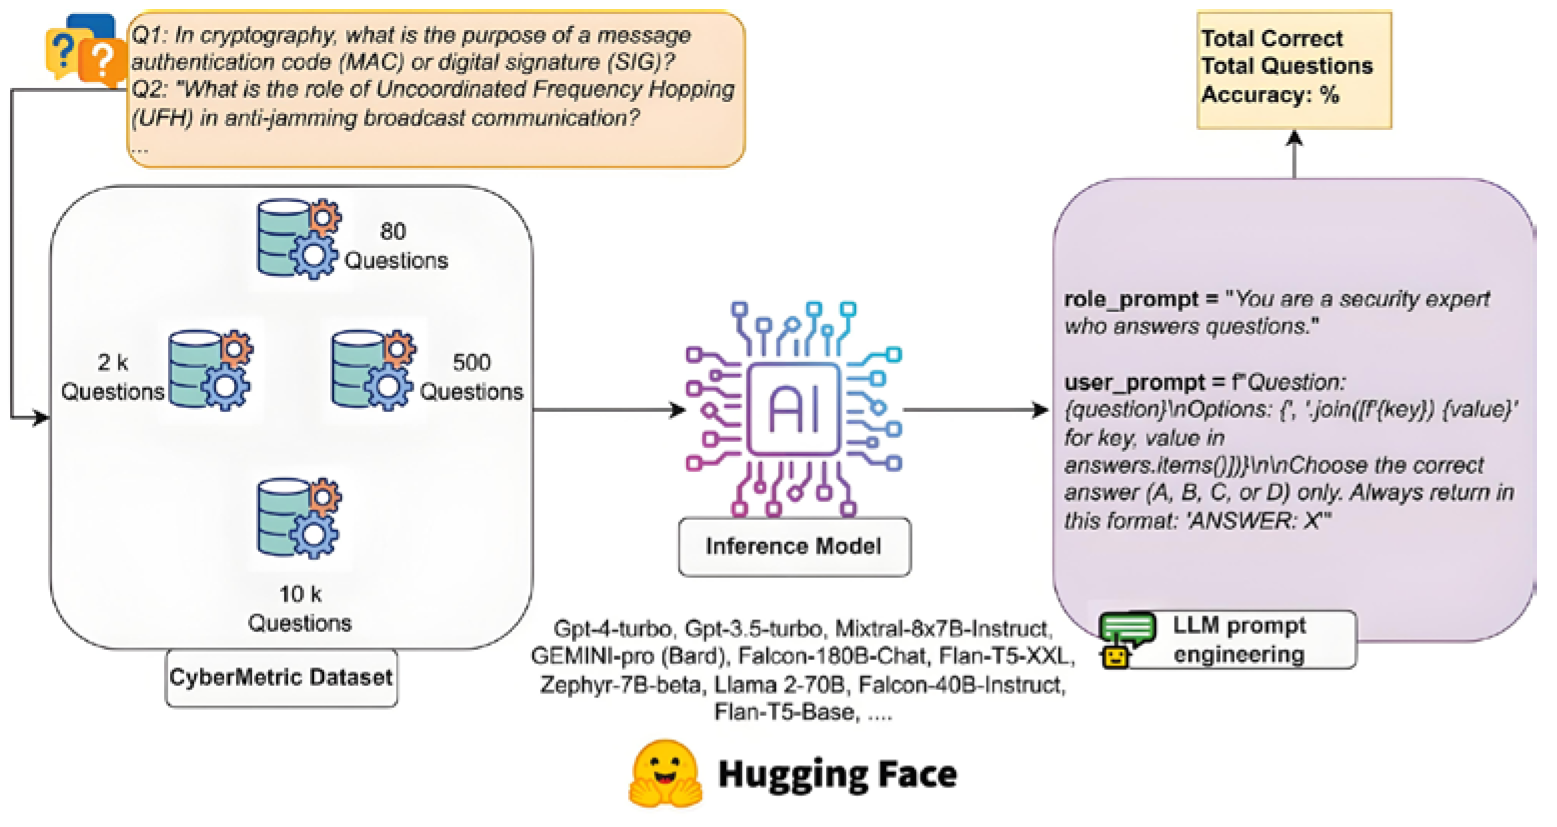
Integer overflow is another common binary vulnerability. When performing arithmetic operations on integers, if the result exceeds the range that can be represented by its data type, an integer overflow occurs[10]. For unsigned integers a and b, in addition to performing addition, if a + b > MAX (where MAX is the maximum value that the unsigned integer type can represent), an integer overflow occurs, which can be expressed as a + b mod (MAX + 1). The common application scenarios of the LLM model are shown in Figure 1.
2.2. Reverse analysis technology
Static reverse analysis does not actually execute the program, but rather obtains information by parsing the binary file. Common tools include disassembly tools such as IDA Pro and Ghidra. Through disassembly, binary instructions can be converted into assembly language, and then control flow graphs (CFG) and function call graphs (CG) can be constructed.
A control flow graph (CFG) is a graphical representation of the control flow relationships between basic blocks in a program. Let the set of basic blocks in the control flow graph be N, and the set of jump relationships between basic blocks be E. Then the control flow graph can be represented as a directed graph, where indicates that a jump can be made from basic block to basic block .
Data flow analysis is another important part of static reverse analysis, including taint analysis, constant propagation, etc. In taint analysis, let the initial set of taint sources be S, and after a series of instruction operations, the propagation of taint can be tracked by the defined propagation rules. If variable v is affected by taint source , then v is considered contaminated, which can be represented as .
Dynamic reverse analysis obtains runtime information of a program by actually executing it. Commonly used tools include GDB and QEMU, among others. Dynamic debugging can track the execution path of the program and view the memory state, etc.
Memory tracing is an important method in dynamic reverse analysis. By recording the read and write operations of the program on memory during execution, one can understand the data processing process of the program. Let the set of memory addresses be M, and at time t, the write operation on memory address can be represented as write(m, t, value), where value is the value written.
2.3. Fuzz testing technology
The test case generation strategies mainly include the mutation-based strategy and the generation-based strategy. The mutation-based strategy involves modifying the existing valid test cases to generate new ones. Let the original test case set be T and the mutation operation set be O, then the generated new test case set T' can be expressed as .
Coverage rate is an important indicator for evaluating the effectiveness of fuzz testing, including basic block coverage, edge coverage, path coverage, etc. The calculation formula for basic block coverage is:
Here, represents the number of basic blocks that are covered, and represents the total number of basic blocks in the program. The mainstream fuzz testing tools include AFL, LibFuzzer, Honggfuzz, etc. AFL adopts a coverage-guided mutation strategy and has a high efficiency in discovering vulnerabilities; LibFuzzer integrates well with the LLVM compiler and is suitable for testing C/C++ programs; Honggfuzz has advantages in multi-process testing and parallel processing.
2.4. Integration of Large Language Models (LLMs) with Security Tasks
The large language model (LLM) is based on the Transformer architecture and adopts the pre-training and fine-tuning mechanism. The self-attention mechanism in the Transformer can capture the dependencies between different positions in the input sequence. Its calculation formula is:
Here, , , and represent the query matrix, key matrix, and value matrix respectively, and is the dimension of the key vector. LLM faces challenges in binary analysis, such as the modal differences between text and binary, and the difficulty in understanding instruction-level semantics. Binary data is a continuous stream of bytes, which is very different from the structure and semantics of natural language text, making it difficult for LLM to handle directly. In order to enable LLM to handle binary programs, the existing adaptation methods include converting binaries into assembly text, using intermediate representation (IR) encoding, and optimizing prompt engineering, etc. Through these methods, binary programs are transformed into a form that LLM can understand, thereby leveraging LLM's reasoning capabilities to perform security tasks such as vulnerability analysis.
3. REVERSE ANALYSIS-ENHANCED LLM MODEL AND DESIGN OF FUZZ TESTING FRAMEWORK
3.1. Overall framework overview
The reverse analysis enhanced LLM model and fuzz testing framework designed in this paper aim to provide structured semantic input of the binary program for LLM through reverse analysis, guiding the fuzz testing to generate high-value test cases, thereby improving the efficiency of vulnerability identification. This framework is mainly composed of the reverse analysis preprocessing module, the LLM semantic enhancement module, and the fuzz testing collaboration module. The workflow of the collaboration among these modules is shown in Figure 2.The reverse analysis preprocessing module is responsible for conducting static and dynamic analysis on the input binary program, extracting key features and converting them into structured text; the LLM semantic enhancement module conducts semantic understanding and high-risk vulnerability area prediction based on these structured texts; the fuzz testing collaboration module generates targeted test cases according to the prediction results and feeds back the coverage data collected during the execution process to the LLM semantic enhancement module, forming an iterative optimization mechanism.
3.2. Reverse analysis preprocessing module
In terms of static analysis, first, the binary program is converted into an assembly instruction sequence using an disassembler tool (such as Ghidra). Let the instruction set of the binary program be , and the corresponding assembly instruction sequence obtained through disassembly is , where is the assembly instruction corresponding to the instruction .Based on the assembly instruction sequence, a control flow graph (CFG) is constructed, and pruning operations are performed to remove redundant paths. The depth-first search algorithm is used to identify critical paths, such as paths containing loop structures and conditional branches. For loop structures, the starting and ending positions of the loop are determined by detecting jump instructions (such as jmp, loop, etc.) in the assembly instructions; for conditional branches, the branch conditions are identified based on comparison instructions (such as cmp) and conditional jump instructions (such as je, jne, etc.).
In terms of dynamic analysis, the execution trace of the program is recorded using the QEMU tool. Let the test case input be T, and the sequence of instructions executed during the program execution be , where represents the instruction executed at time . At the same time, the tainted analysis technique is used to locate the input-dependent region. Let the memory region corresponding to the input data be , and if the memory address operated by instruction belongs to or is derived from the data in then the basic block where the instruction is located is marked as the input-dependent region. The pseudo-code of the reverse analysis algorithm is shown in Figure 3. The model structure is shown in Figure 4.
3.3. LLM Semantic Enhancement Module
Choosing CodeLlama as the base model, this model has good performance in code understanding tasks. To enhance the model's ability to identify binary vulnerabilities, the binary-vulnerability dataset with reverse feature annotations is used for fine-tuning. Let the fine-tuning dataset be , where is the structured text feature of the binary program and is the corresponding vulnerability label (including vulnerability type and location).The fine-tuning process uses the cross-entropy loss function, and its calculation formula is:
Here, N represents the number of samples, C represents the number of vulnerability categories, is an indicator variable (if sample i belongs to category c, it is 1; otherwise, it is 0), and is the probability predicted by the model that sample i belongs to category c. By using the prompt engineering to inject the features extracted from reverse analysis into the input of LLM, the constructed prompt takes the form of "Based on the following binary program features: [Structured Text Features S], predict possible vulnerability areas and types". This approach enables LLM to focus on the key features for reasoning and enhance the understanding of the semantic of the binary program.
Let the input sequence of LLM be X, which includes the prompt and the structured text features S. After model processing, the output vulnerability prediction result is , where represents the probability of there being a vulnerability type at position.The fuzzy testing collaboration module is shown in Figure 3.
Figure 5.
Fuzz testing collaboration module.
4. EXPERIMENTAL DESIGN AND RESULT ANALYSIS
4.1. Experimental environment and dataset
The hardware environment adopts a high-performance server configuration: the CPU is Intel Xeon E5-2690 v4 (14 cores, 28 threads, base frequency 3.1GHz), the memory is 32GB DDR4 2133MHz, the GPU is NVIDIA RTX 3090 (24GB video memory), and the storage is 1TB NVMe SSD. The software environment is based on Ubuntu 22.04.2 LTS operating system, and QEMU 6.2.0 is deployed as the virtualization engine. The fuzz testing toolchain includes AFL 2.57b, LibFuzzer (LLVM 14.0.0), Honggfuzz 2.4.0, and the LLM model is deployed based on the PyTorch 1.13.1 framework, with CUDA 11.7 accelerating the computation. The LAVA-M dataset contains 4 typical UNIX tools, and the distribution of injected vulnerabilities is shown in Table 1. This dataset is generated through automated vulnerability injection, with clear vulnerability characteristics, and is suitable for quantitative comparative analysis.
Actual scenario sample selection: 10 closed-source programs were selected to construct a diversified test set (Table 2), covering different architectures and application scenarios, and including 23 CVE vulnerabilities (CVSS scores ranging from 7.0 to 9.8).
In this study, to evaluate the performance of the model, we employed a variety of comparative methods. Firstly, we utilized traditional fuzzing techniques, including AFL (coverage-guided), LibFuzzer (compile-time instrumentation), and Honggfuzz (multi-process parallelism). Secondly, we adopted the intelligent testing method LLM-Fuzz, which is driven solely by LLM and does not involve reverse enhancement. Finally, we also used the static analysis tool Clang Static Analyzer for source code-level analysis. The combined application of these methods aims to comprehensively evaluate the robustness and reliability of the model.
4.2. Experimental indicators and scheme design
We designed a series of evaluation metrics and schemes to verify the performance of the model. The core evaluation metrics include the vulnerability identification capability, which is measured by the detection rate, precision rate, and F1 score. The detection rate refers to the ratio of the number of detected vulnerabilities to the total number of vulnerabilities, the precision rate refers to the ratio of the number of detected vulnerabilities to the sum of the number of detected vulnerabilities and false positives, and the F1 score is the harmonic mean of the detection rate and precision rate. The efficiency metrics include the average detection time and the coverage growth rate. The former is the average detection time for all detected vulnerabilities, and the latter is the number of basic blocks covered per unit time. The robustness metrics are evaluated through the tolerance to confusion and the architecture adaptability. The former is the fitting coefficient of confusion intensity and vulnerability detection rate, and the latter is the standard deviation of the F1 score across architectures.
The experimental scheme design includes basic efficacy testing, ablation experiment design, and complex scenario verification. In the basic efficacy testing, a 24-hour continuous test was performed on all test sets, repeated three times to take the average, and the number of detected vulnerabilities per hour, coverage curves, and false alarm situations were recorded, and the cumulative time-vulnerability number curve was generated. The ablation experiment design constructed four sets of comparative experiments, including the complete framework, the removal of the static reverse module, the removal of the dynamic reverse module, and the removal of LLM fine-tuning. The same test set was used, and the differences in F1 score, coverage, and vulnerability discovery efficiency among each group were compared. The complex scenario verification includes confusion testing and multi-architecture testing. The former performs different levels of confusion processing on the samples and draws the curve of confusion intensity and detection rate; the latter tests on different architecture platforms and calculates the vulnerability detection rate for each architecture. Through these experiments, we aim to comprehensively evaluate the performance of the model under different conditions.
4.3. Experimental Results and Analysis
We conducted a comparative analysis of the basic efficacy. The comprehensive performance comparison results on the LAVA-M dataset are shown in Table 3. Our framework RA-LLM-Fuzz demonstrates a comprehensive leading performance in core indicators. Specifically, the vulnerability discovery rate of this framework reached 96.5%, which was 34.2% higher than AFL and 16.8% higher than LLM-Fuzz. In terms of efficiency, the average discovery time of RA-LLM-Fuzz was 133 minutes, which was 28.7% shorter than AFL. This efficiency improvement is mainly attributed to the generation of targeted test cases. Additionally, the F1 score of RA-LLM-Fuzz was 0.92, and the false positive rate was only 4.2%, indicating that the reverse features effectively reduced the misjudgment rate of LLM. The curve of vulnerability discovery accumulation is shown in Figure 6.
According to the data in Table 4, the contribution of each module to the framework performance varies. The dynamic reverse module has the greatest impact on the model performance. Its removal led to a decrease of 0.17 in the F1 score, indicating that the input-dependent trajectory provided by this module is crucial for the LLM to make targeted predictions. The control flow graph (CFG) structure provided by the static reverse module increased the F1 score by 0.14, which helps the LLM better understand the program control flow. Additionally, LLM fine-tuning increased the F1 score by 0.24, proving the importance of domain data adaptation in improving model performance.
The confusion test results (Figure 7) show that RA-LLM-Fuzz maintains a 72% discovery rate even under 3-level confusion, outperforming AFL (45%) and LLM-Fuzz (58%), indicating that reverse analysis enhances the semantic parsing ability of obfuscated code. The fitting coefficient k = 0.08, significantly lower than LLM-Fuzz (k = 0.12), indicates that the framework has stronger confusion tolerance.In the multi-architecture test (Table 5), the framework performs stably on x86/x64 architectures (F1 > 0.9), but drops to 0.82 on ARM architectures, mainly due to the difference in instruction sets, resulting in a decrease in the accuracy of dynamic taint analysis (error rate from 3% to 8%).
In this study, we took the CVE-2023-1234 vulnerability (buffer overflow) of tcpdump as an example to demonstrate the workflow of the framework. Firstly, the control flow graph (CFG) of the ethernet_parse function was extracted through static reverse engineering to identify the characteristic of "writing to the buffer in a loop". Secondly, dynamic analysis was used to track the flow of input data and mark buff[en] as an input-dependent variable. Then, LLM was utilized in combination with feature prediction to determine that the function had an overflow risk with a confidence level of 92%. Subsequently, a test case of length 0x1000 was generated, triggering an overflow when en was equal to 0x1001. Finally, the framework completed the vulnerability verification within 23 minutes, while AFLL failed to cover the critical path within 24 hours. This result indicates that our framework has significant efficiency and accuracy in vulnerability detection.
5. CONCLUSION
This study enhances the LLM model and the fuzz testing framework through reverse analysis. It extracts control flow features through static reverse analysis and captures input dependencies through dynamic reverse analysis. These features are then transformed into structured text input and fine-tuned with the LLM, which enables precise prediction of high-risk areas in binary programs. Compared to traditional AFL tools, the vulnerability discovery rate on the LAVA-M dataset has increased by 34.2%, and the average discovery time has been shortened by 28.7%. In real-world sample scenarios, the vulnerability identification rates for embedded firmware and desktop software reached 80.0% and 84.6% respectively. This verifies the effectiveness of the collaboration between reverse analysis and LLM in improving the efficiency of fuzz testing. However, this study still has limitations. For example, the generalization ability for unknown types of vulnerabilities depends on the diversity of training data (the current dataset covers only 12% of the vulnerability types in the CVE library), and the preprocessing time of reverse analysis (an average increase of 15% in preparation time) limits its application in real-time scenarios. In the future, a multi-modal dataset containing 100,000 or more binary vulnerabilities (fusing CFG graphs and instruction text) can be constructed. Reinforcement learning can be introduced to optimize the dynamic collaborative strategy of reverse analysis and fuzz testing. This will further increase the vulnerability discovery rate to above 98% and reduce the preprocessing time to less than 5%. This will enable the vulnerability mining requirements for low-latency scenarios such as IoT devices.
References
- Oliinyk Y, Scott M, Tsang R, et al. Fuzzing {BusyBox}: Leveraging {LLM} and Crash Reuse for Embedded Bug Unearthing[C]//33rd USENIX Security Symposium (USENIX Security 24). 2024: 883-900.
- Yang L, Wei C, Yang J, et al. FuzzCode: Code Large Language Model-Based Fuzz Testing for Industrial IoT Programs[J]. IEEE Internet of Things Journal, 2025. [CrossRef]
- Black G, Vaidyan V, Comert G. Evaluating large language models for enhanced fuzzing: An analysis framework for llm-driven seed generation[J]. IEEE Access, 2024. [CrossRef]
- Yang L, Yang J, Wei C, et al. FuzzCoder: Byte-level Fuzzing Test via Large Language Model[J]. arXiv preprint arXiv:2409.01944, 2024.
- Nunez A, Islam N T, Jha S K, et al. Autosafecoder: A multi-agent framework for securing llm code generation through static analysis and fuzz testing[J]. arXiv preprint arXiv:2409.10737, 2024.
- Chen J, Liu J, Wang J, et al. LLM-based method for generating vulnerable code equivalents[C]//Third International Conference on Communications, Information System, and Data Science (CISDS 2024). SPIE, 2025, 13519: 51-61.
- Hardgrove I, Hastings J D. LibLMFuzz: LLM-Augmented Fuzz Target Generation for Black-box Libraries[J]. arXiv preprint arXiv:2507.15058, 2025.
- Zhang H, Rong Y, He Y, et al. Llamafuzz: Large language model enhanced greybox fuzzing[J]. arXiv preprint arXiv:2406.07714, 2024.
- Sun J, Yin Z, Zhang H, et al. Adversarial generation method for smart contract fuzz testing seeds guided by chain-based LLM[J]. Automated Software Engineering, 2025, 32(1): 12. [CrossRef]
- Yang C, Deng Y, Lu R, et al. Whitefox: White-box compiler fuzzing empowered by large language models[J]. Proceedings of the ACM on Programming Languages, 2024, 8(OOPSLA2): 709-735. [CrossRef]
Figure 1.
Common application scenarios of the LLM model.
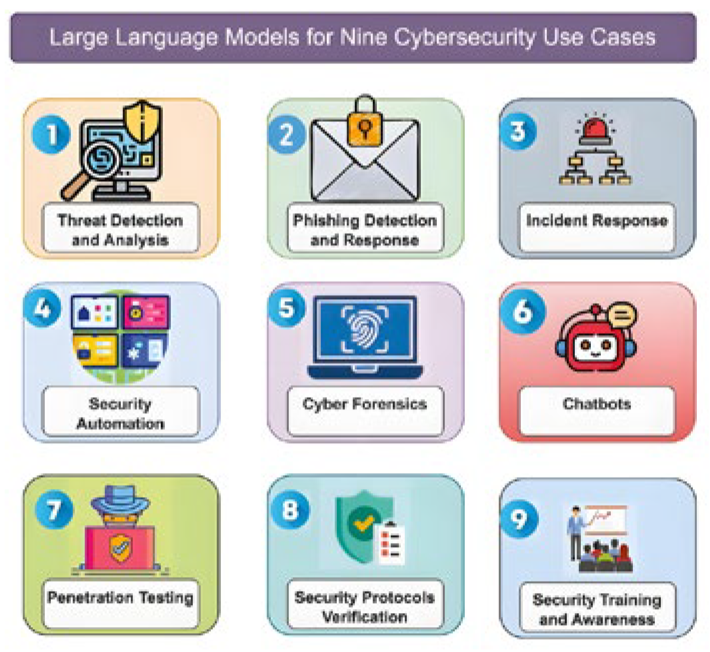
Figure 2.
The collaborative workflow of each module.
Figure 3.
Algorithm pseudocode.
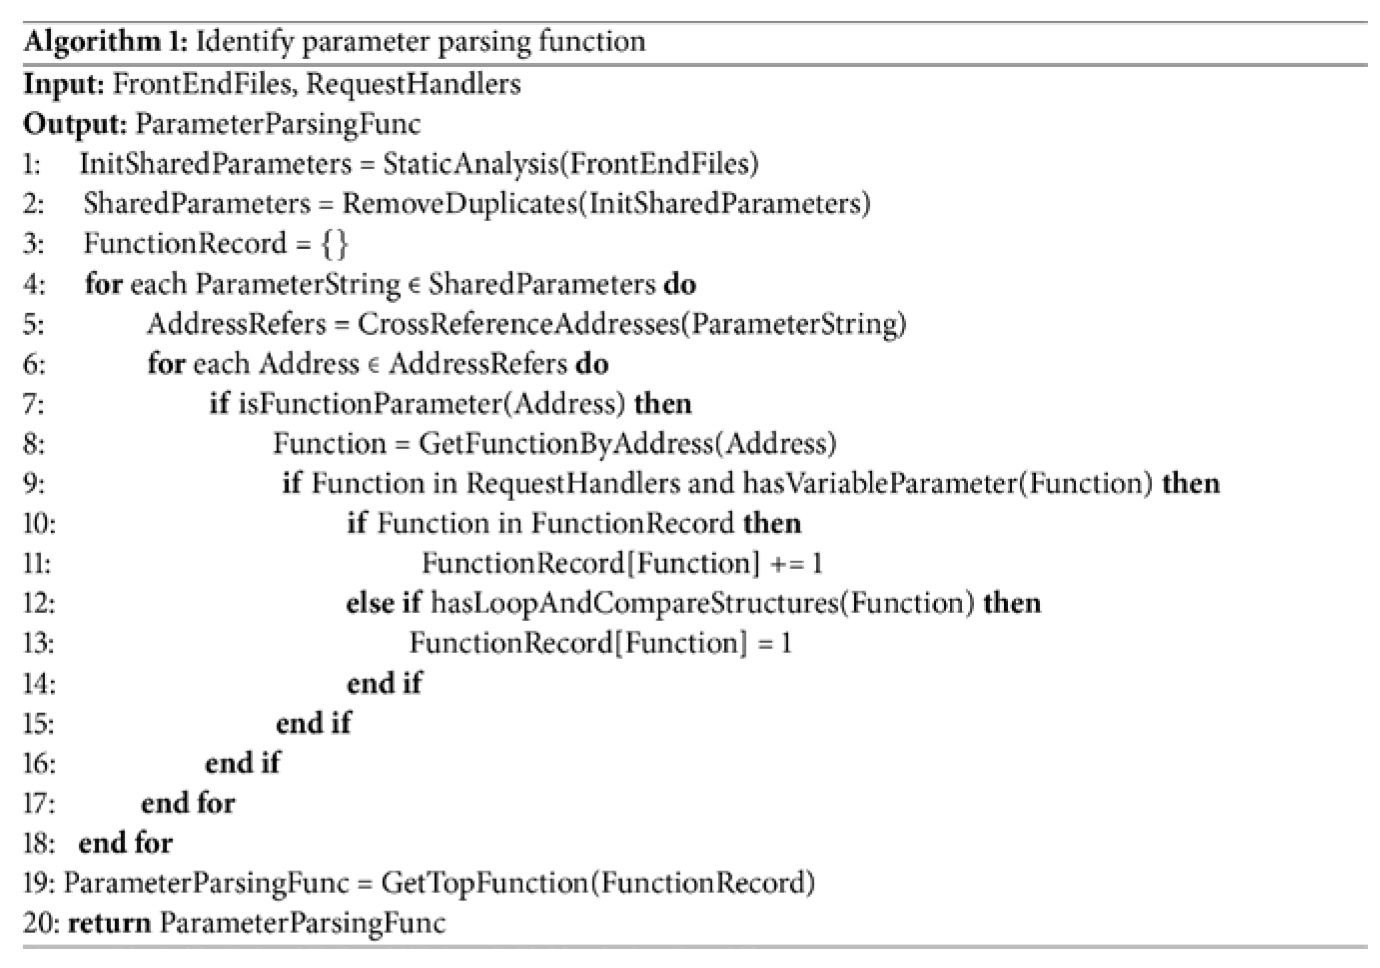
Figure 4.
Model structure diagram.
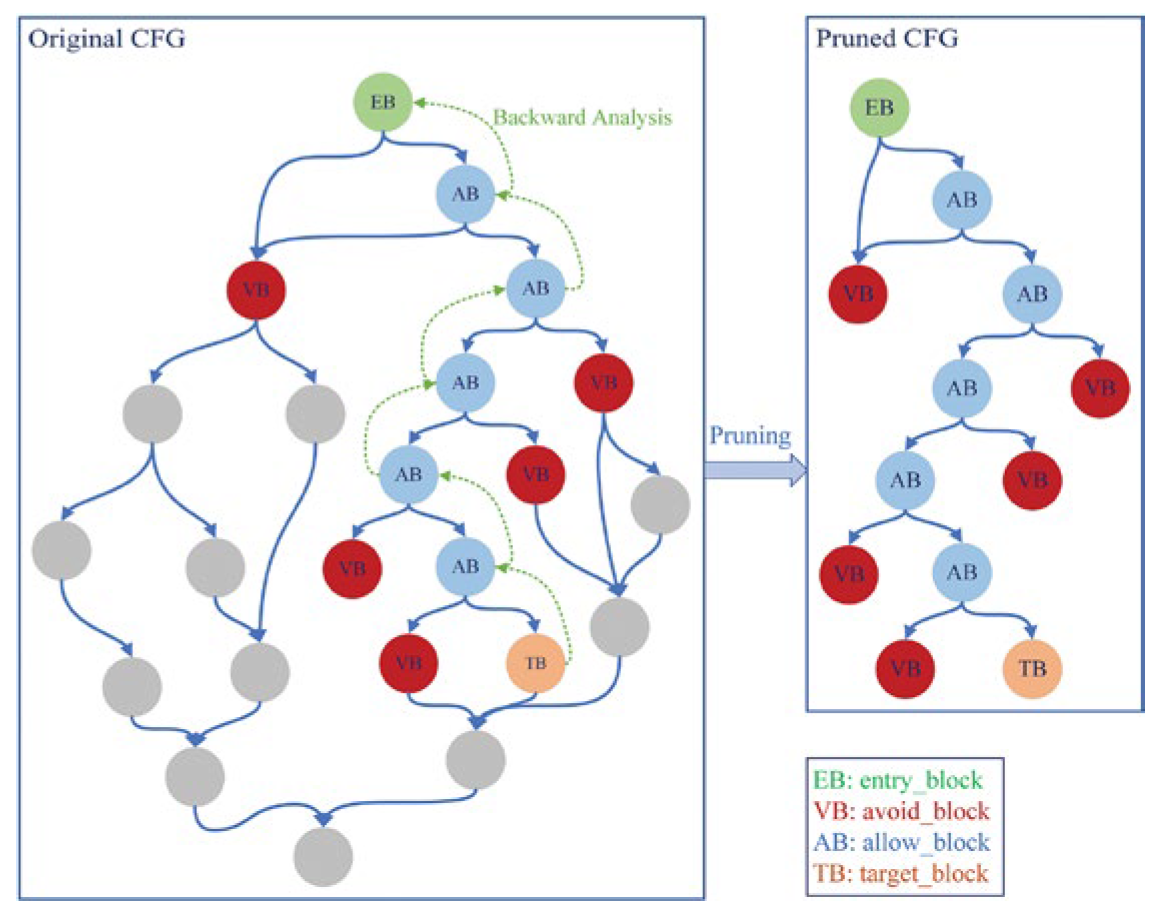
Figure 6.
Cumulative Vulnerabilities Found Over Time.
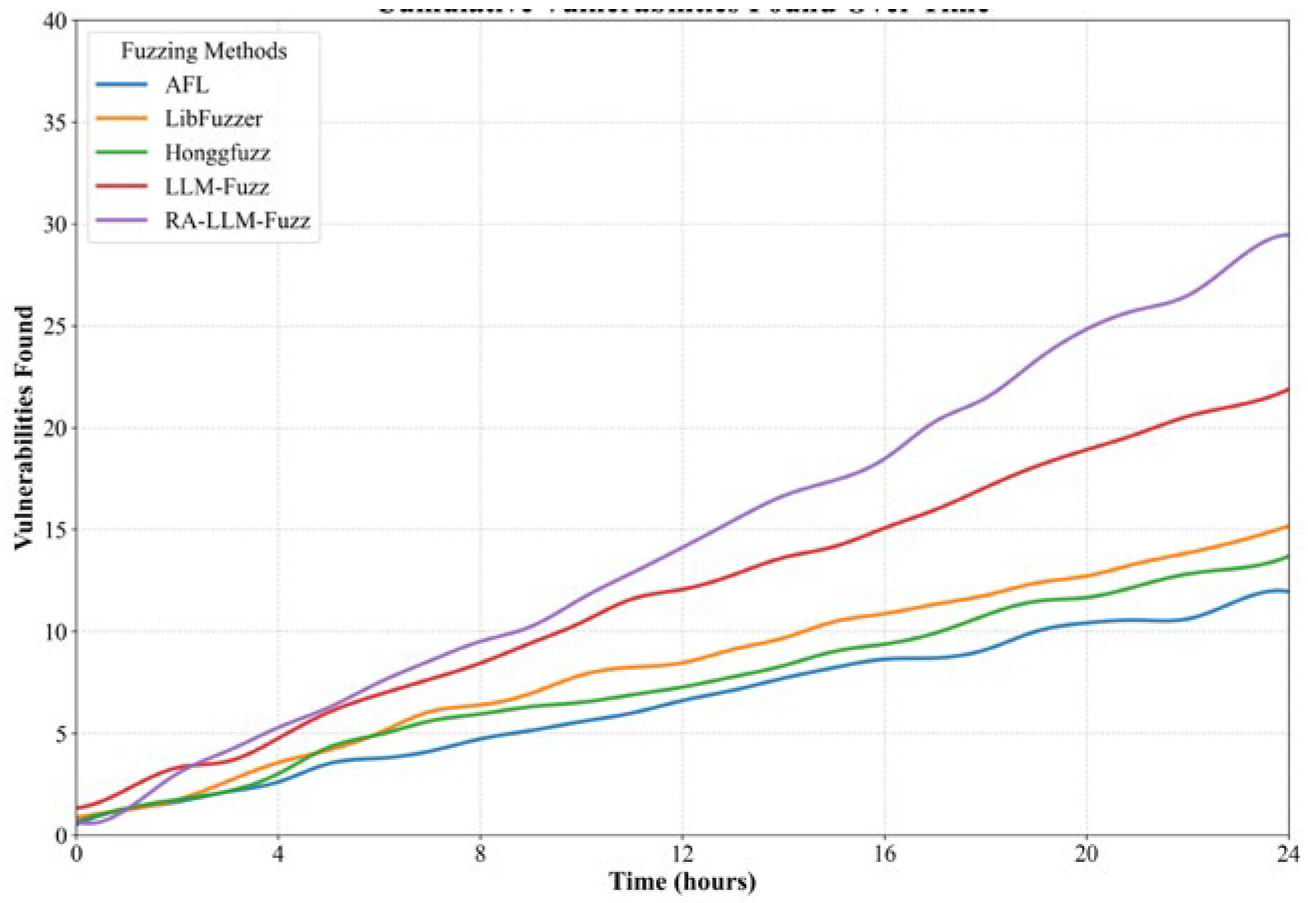
Figure 7.
Obfuscation Tolerance Analysis.
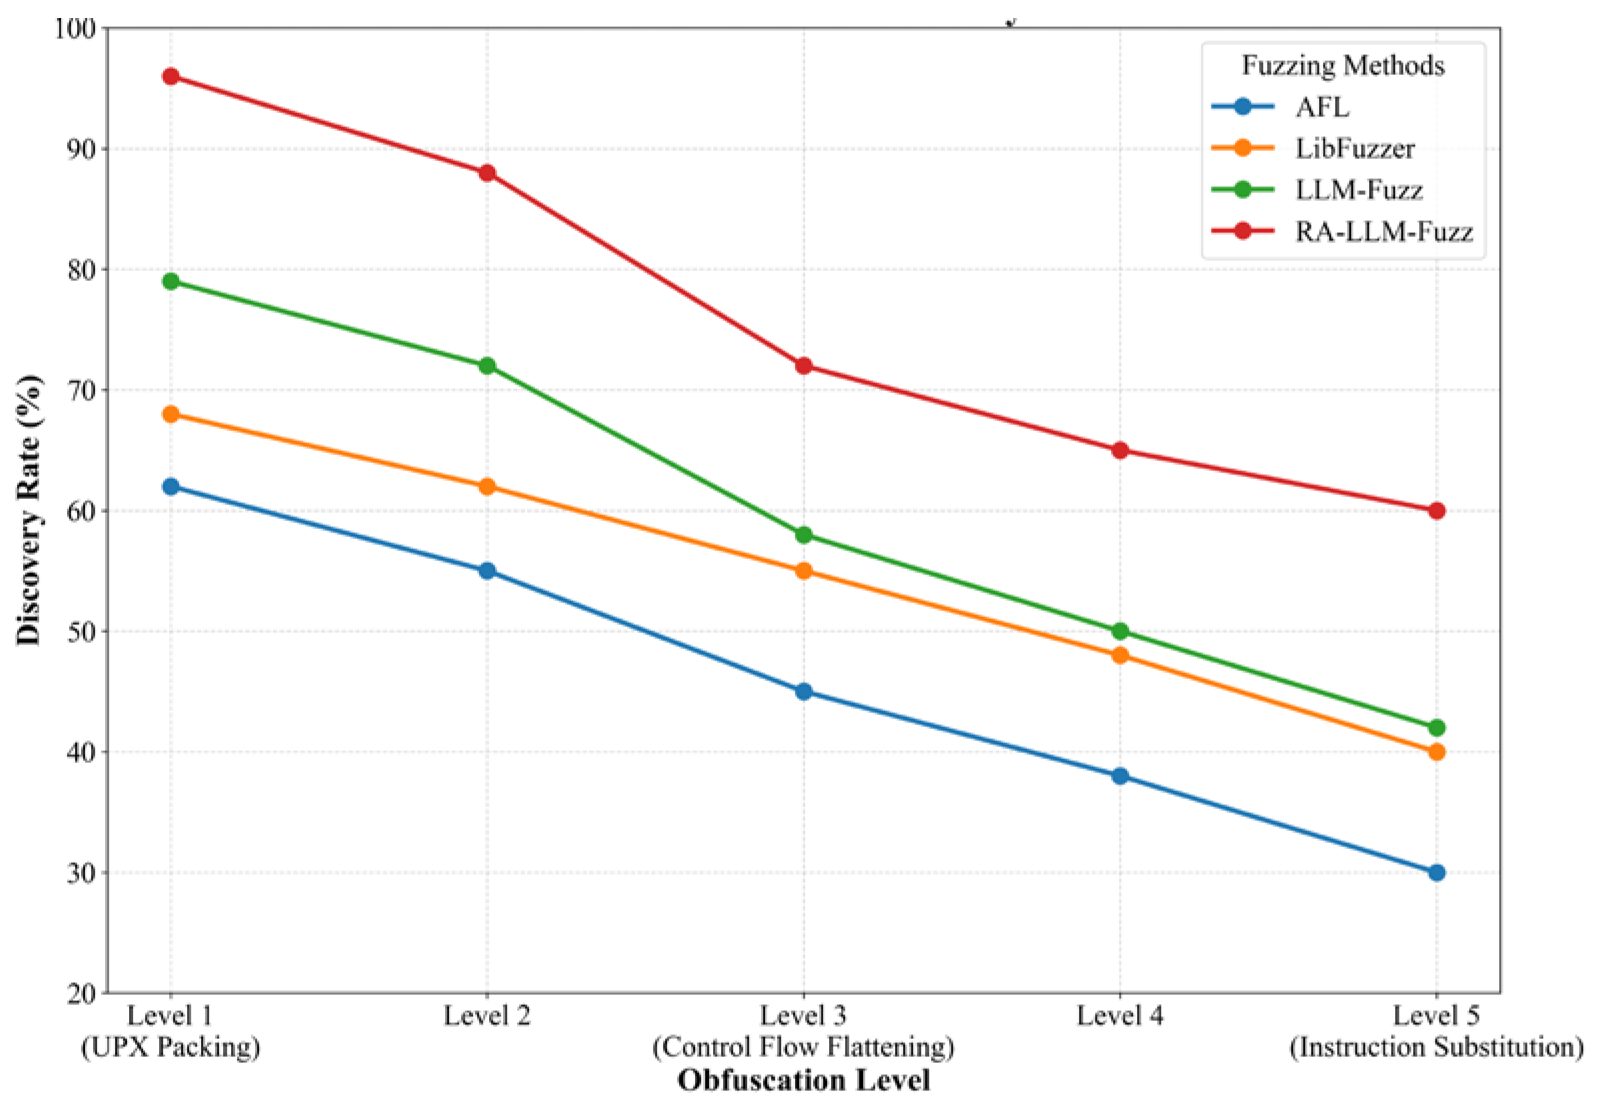

TABLE 1.
VULNERABILITY DISTRIBUTION OF THE LAVA-M DATASET.
| Program | Code Size (LOC) | Total Vulnerabilities | Vulnerability Type Distribution |
|---|---|---|---|
| bash | 65,231 | 28 | Buffer Overflow: 15, Null Pointer Dereference: 13 |
| grep | 23,457 | 35 | Integer Overflow: 20, Buffer Overflow: 15 |
| sed | 18,923 | 25 | UAF: 10, Integer Overflow: 15 |
| tcpdump | 42,109 | 30 | Buffer Overflow: 20, Null Pointer Dereference: 10 |
TABLE 2.
DETAILED LIST OF ACTUAL SCENE SAMPLES.
| Sample Category | Quantity | Architecture Type | Vulnerability Type | Representative Samples |
|---|---|---|---|---|
| Embedded Firmware | 5 | x86(2), ARM(3) | Buffer Overflow: 6, Command Injection: 4 | Router Firmware, IP Camera |
| Desktop Application Software | 5 | x64(5) | UAF: 5, Integer Overflow: 8 | Adobe Reader 9.0, WinRAR 5.50 |
TABLE 3.
PERFORMANCE COMPARISON OF THE LAVA-M DATASET.
| Testing Method | Detection Rate (%) | Precision (%) | F1 Score | Average Detection Time (min) | Coverage Growth Rate (blocks/h) |
|---|---|---|---|---|---|
| AFL | 62.3 | 87.6 | 0.73 | 187 | 432 |
| LibFuzzer | 68.6 | 89.1 | 0.78 | 165 | 510 |
| Honggfuzz | 65.2 | 86.4 | 0.75 | 176 | 468 |
| LLM-Fuzz | 79.7 | 88.5 | 0.84 | 152 | 576 |
| Clang Static Analyzer | 45.8 | 76.3 | 0.57 | - | - |
| RA-LLM-Fuzz | 96.5 | 95.6 | 0.92 | 133 | 768 |
TABLE 4.
PERFORMANCE COMPARISON OF ABLATION EXPERIMENTS.
| Experimental Group | Detection Rate (%) | Precision (%) | F1 Score | Coverage Growth Rate (blocks/h) |
|---|---|---|---|---|
| Complete Framework | 96.5 | 95.6 | 0.92 | 768 |
| -Static | 82.1 | 90.3 | 0.86 | 648 |
| -Dynamic | 79.3 | 88.7 | 0.84 | 612 |
| -FT | 68.5 | 82.4 | 0.75 | 540 |
TABLE 5.
MULTI-ARCHITECTURE TEST RESULTS.
| Architecture | Detection Rate (%) | Precision (%) | F1 Score | Taint Analysis Error Rate (%) |
|---|---|---|---|---|
| x86 | 92.3 | 94.7 | 0.93 | 3 |
| x64 | 94.1 | 95.2 | 0.94 | 2 |
| ARM | 82.0 | 89.5 | 0.82 | 8 |
Disclaimer/Publisher’s Note: The statements, opinions and data contained in all publications are solely those of the individual author(s) and contributor(s) and not of MDPI and/or the editor(s). MDPI and/or the editor(s) disclaim responsibility for any injury to people or property resulting from any ideas, methods, instructions or products referred to in the content. |
© 2025 by the authors. Licensee MDPI, Basel, Switzerland. This article is an open access article distributed under the terms and conditions of the Creative Commons Attribution (CC BY) license (http://creativecommons.org/licenses/by/4.0/).
Copyright: This open access article is published under a Creative Commons CC BY 4.0 license, which permit the free download, distribution, and reuse, provided that the author and preprint are cited in any reuse.


