
Submitted:
10 October 2025
Posted:
14 October 2025
You are already at the latest version
Abstract
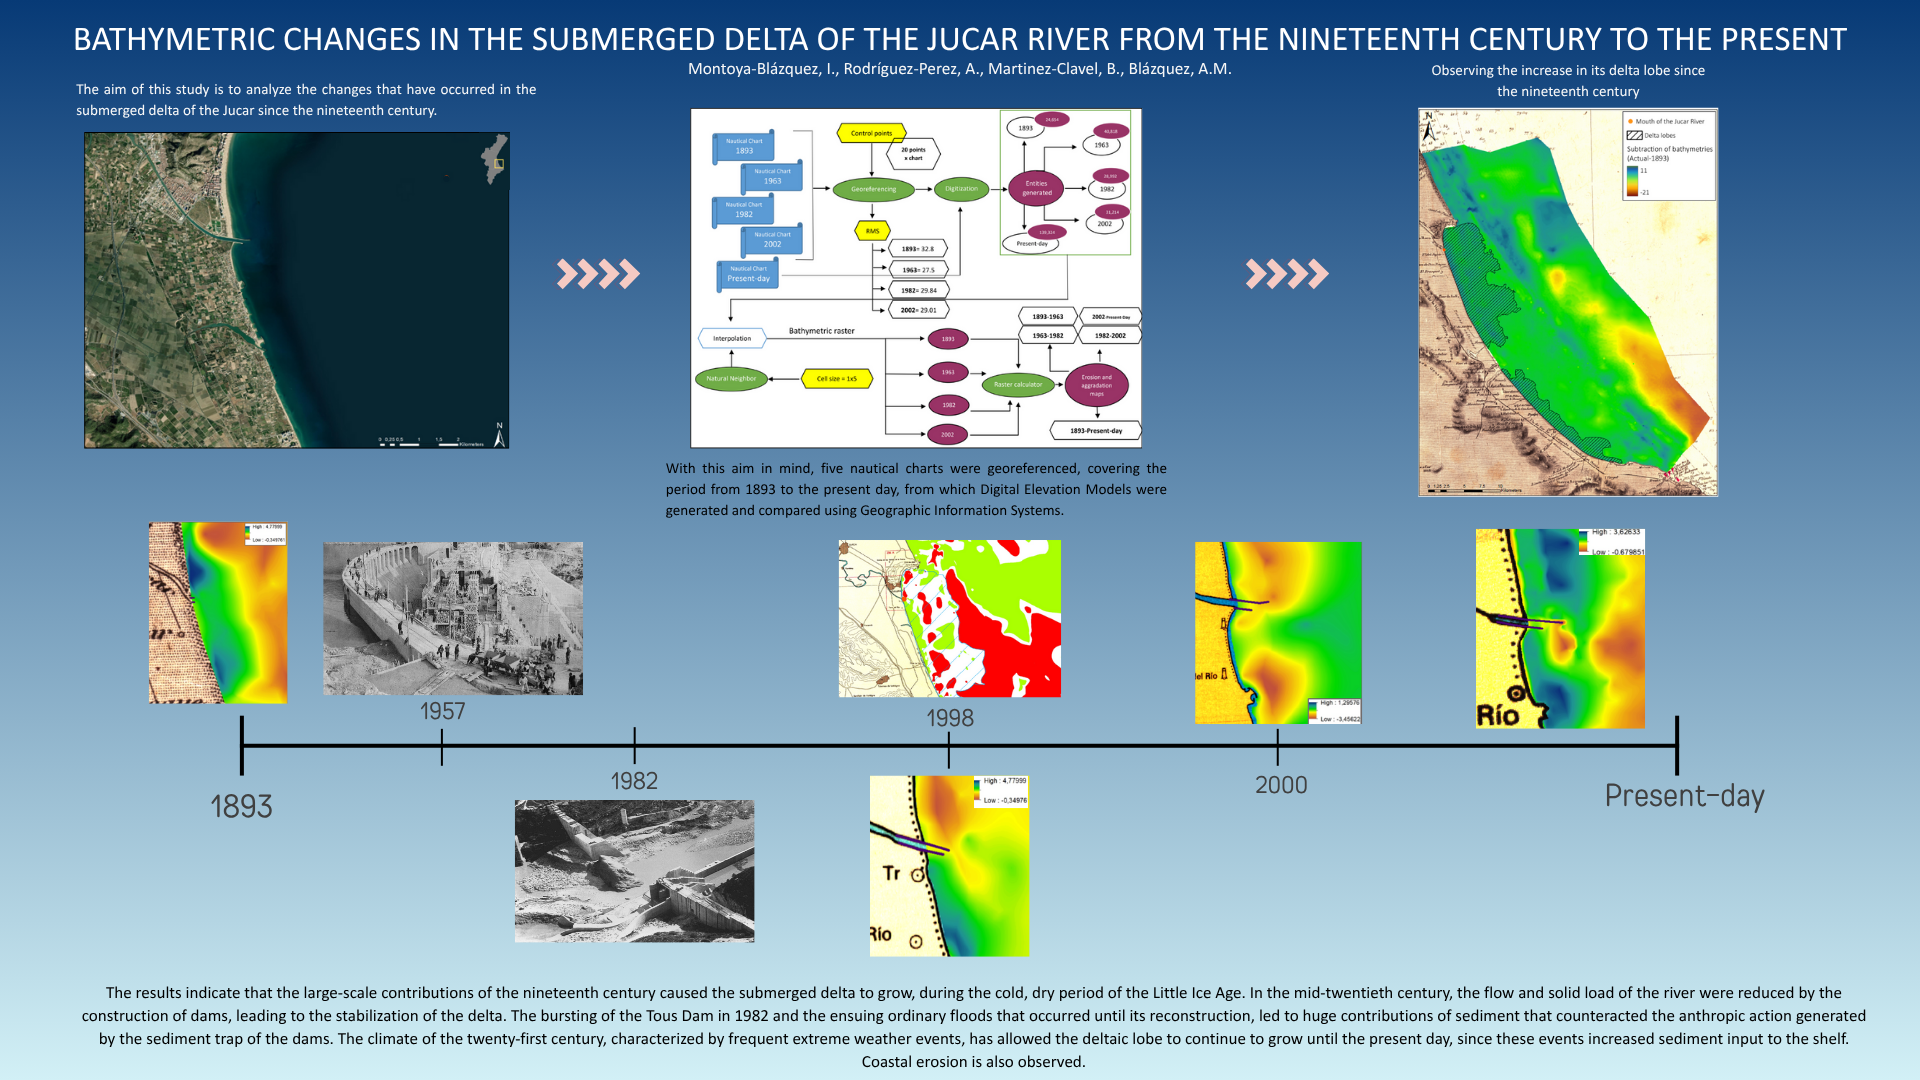
The Jucar is a perennial river with a high sedimentary load which has transferred sediment to the continental shelf in the form of a deltaic lobe since pre-historic times. The aim of this study is to analyze the changes that have occurred in the submerged delta of the Jucar since the nineteenth century. With this aim in mind, five nautical charts were georeferenced, covering the period from 1893 to the present day, from which Digital Elevation Models were generated and compared using Geographic In-formation Systems. The results indicate that the large-scale contributions of the nine-teenth century caused the submerged delta to grow, during the cold, dry period of the Little Ice Age. In the mid-twentieth century, the flow and solid load of the river were reduced by the construction of dams, leading to the stabilization of the delta. The bursting of the Tous Dam in 1982 and the ensuing ordinary floods that occurred until its reconstruction, led to huge contributions of sediment that counteracted the an-thropic action generated by the sediment trap of the dams. The climate of the twen-ty-first century, characterized by frequent extreme weather events, has allowed the deltaic lobe to continue to grow until the present day, since these events increased sediment input to the shelf. Coastal erosion is also observed.
Keywords:
submerged delta
; Geographic Information Systems (GIS)
; nautical charts
; Jucar river
1. Introduction
Deltas are convex structures that stand out on a coast in front of a river mouth and are created when sediment input exceeds redistribution by marine processes such as waves, currents and tides. The process of formation involves river currents carrying sediment which decelerate and expand as they enter large bodies of water, depositing much or all of their solid load. Grain sorting usually occurs, with the coarser sediments remaining at the mouth and the finer sediments in areas farther away [1].
Numerous studies have been carried out on deltas since the nineteenth century. One of the pioneers in the study of these morphologies was Gilbert [2,3] on whose work Coleman and Gagliano [4] based their definition of the different parts of deltas as they are known today, distinguishing between the emerged and submerged areas. Years later, several authors published definitions of the different types of deltas according to the load and density of the effluent [5,6], which are still accepted today. At the end of the twentieth century, Arche [1] presented an important in-depth study of the different types of flow and the deltas that are formed. Since then, a large number of scientific articles have been published on Mediterranean emerged deltas, reporting that most present-day deltas were built during the eustatic rise of the Marine Isotopic Stage 1 (MIS 1); examples are the Rhone [7,8], Tiber [9,10], Ombrone [11], Arno [12,13], Ebro [14], Turia-Jucar [15,16].
The study of the submerged parts of deltas is relatively recent, as novel research has revealed that it is the characteristics of these submerged areas that cause their fragility and, therefore, their potential vulnerability. Close to the study area to be analyzed here, the studies by Martínez-Clavel et al. [17] and Garcés et al. [18] focused on the deltas of the Ebro and the Turia.
As mentioned above, deltas are formed by two well-defined parts, a subaerial or deltaic plain and a submerged part, which is divided into the deltaic front, with a steep slope, and the prodelta, where the slope is much less pronounced [19] (Figure 1). They are mainly controlled by two types of processes: the discharge of the river that feeds them and the marine dynamics in the area of the mouth.
The most important factor determining river discharge is the area’s climate, as it controls the total discharge, the type of sediment contributed by the river, and the bottom load/suspended load ratio [1]. River discharge in the area of the mouth is determined by the concentration of the flow due to the volume of sediment transported [21] and also by the contrast in density between the effluent waters and the waters of the receiving basin. Because of this, the density of the river waters may be equal to, higher than, or lower than that of the receiving basin [22]. This creates different types of flow, which Bates [5] and Wright [6] defined as homopycnal, hyperpycnal and hypopycnal (Figure 2), terms which in turn were used to name the types of deltas they create. In homopycnal flows, later mixing is rapid and occurs close to the mouth, causing rapid sedimentation. This type of flow, dominated by inertial forces, occurs infrequently in nature, it happens in case of rivers with low solid load and steep slopes that enter deep lakes, and more rarely in case of rivers with open shores and steeply sloping platforms [6].
In hyperpycnal deltas, a dense current is formed that moves away from the mouth [22]. These flows occur when there is little or no difference in depth between the channel and the basin. In this situation, the forces of friction with the bottom are dominant and are combined with turbulent diffusion in the horizontal plane, forming subaqueous dikes on the sides [1]. There are few examples of deltaic systems dominated by hyperpycnal discharges [21,23] but among them are the lateral spill deposits of deltaic distributary channels, and what are known as “tidal deltas” at the mouths of lagoons [24,25,26,27,28].
Finally, in deltas formed by hypopycnal flows, sediment-laden waters of fluvial origin create a surface plume that moves over the waters of the receiving basin [1]. These occur when a freshwater body laden with greater or lesser amounts of sediment enters denser saltwater. This is the most frequent situation, in which buoyancy forces dominate [6]. When it reaches the sea the effluent forms a buoyant plume with a very high lateral expansion, causing a saline wedge to reach below the river channel. The freshwater-saltwater contact creates internal waves that accelerate mixing and cause the effluent to lose velocity, leading to the formation of a sediment bar beneath coarse materials, which moves forward as the deposits progress. Further downstream, this effect disappears and the plume continues to expand, still carrying most of the fine suspended load. Convergence within the bottom creates two subaqueous dikes that are not deflected as the delta progresses [1].
Marine dynamics in the Gulf of Valencia are also a very important factor that determine the shape and morphology of deltas, as they can modify and redistribute the sediments deposited by the river. Marine dynamics are formed due to wind, vertical structures (temperature, salinity and density), the attraction of the sun and the moon and the internal forces of the Earth. This gives rise to three types of movements in water masses: waves, tides and currents.
The present study explores the multi-scale changes in the submerged delta of the Jucar River, located in the western Mediterranean in the east of the Iberian Peninsula, with its mouth in the Gulf of Valencia. In order to understand the potential vulnerability of this delta, this study focuses on the submerged part. Similar research has been carried out previously in other nearby deltas.
The study area (Figure 3) is part of the territory of the Jucar Hydrographic Confederation and responds to a typical Mediterranean climate, with hot, dry summers and mild winters. The maximum temperatures are recorded in the months of July and August, coinciding with the dry season, and the average annual temperature is 17 °C. The most common preci pitation is in the form of torrential rain and the average annual rainfall in the study area is between 600-800 mm. These precipitations generally occur in autumn, with a relative minimum of precipitation in winter. A typical phenomenon of this climate is known as “DANA” (a Spanish acronym denoting Isolated High Level Depression) which is more frequent between the months of October and November. During this period, intense and short-lived periods of high precipitation can occur, with an extraordinary discharge of sediments that feed the coast and the deltaic system [29]. According to the Intergovernmental Panel on Climate Change (IPCC), since the end of the twentieth century there has been an increase in the energy and frequency of these extreme precipitation events in the coastal zone, derived from global warming [30]. As a consequence of the increase in temperatures, the hydrological cycle has accelerated and become more unpredictable.
A warmer atmosphere retains more humidity, which favors torrential rains [31]. The Gloria storm, in January 2020, stands out as the largest maritime event of the last twenty years. During these episodes of intense rainfall, ordinary and extraordinary river floods occur and the transfer of sediment to the marine environment reaches its maximum level. If they also coincide with dry periods, these events bring to the coast and the shelf large amounts of sediment, due to the lack of vegetation and the low level of protection of the soil. In Europe, the Little Ice Age spanned from the fourteenth to the mid-nineteenth century [32,33,34]; this period was characterized by being cold and dry, with a generalized decrease in temperatures of between 1 and 2 ⁰C below mean modern-day values [34,35].
Regarding the location, the initial point of the submerged delta of this study is located at coordinates 39o 09' 02” N 0o 14' 02” E, at the mouth of the Jucar River. This river is the most important in the Valencian Community and one of the longest in Spain, with a length of 534 km, crossing the provinces of Cuenca, Albacete and Valencia. Like the Tajo, Turia and Cabriel, it is born in the great hydrographic junction of Albarracín and has its nucleus in the Sierra de Tragacete, at an altitude of 700 meters, in Ojuelos de Valdeminguete, and along its course it receives water from dozens of tributaries, among which the Cabriel River stands out [36]. The Jucar River has supplied water to numerous towns and cities since ancient times and in order to regulate its flow and ensure its availability in times of drought, numerous reservoirs and dams began to be built along its course in the 1950s. Of note is the Alarcon Reservoir, which began operating in 1957, with a capacity of 1,112 hm3 [36] and a height of only 71 m, which regulates the headwaters of the Jucar. Also noteworthy is the Tous Dam, whichs pourpose was the lamination of floods, in addition to the regulation of the contributions of the Jucar River [37]. These dams are material traps, which translates into a lower sedimentary contribution to the sea and, therefore, could imply a decrease in the speed of delta growth and an increase in coastal erosion in the area of the mouth.
The Jucar River contributes around 1900 hm3 of sediment per year from its drainage basin (21,600 km2) to the sea, and has suffered several large-scale floods since the nineteenth century, the most notable being those of 1864 and 1982. The latter, caused by the bursting of the Tous Dam [38], resulted in an increase of 110 million cubic meters of load and flow in the river within a few hours; when the Tous Reservoir was emptied, most of this solid load reached the sea, a circumstance that modified the geomorphology of the delta [39].
Although these two floods were noted for their great intensity, events of this kind have occurred regularly in this region over the centuries, molding it and forming the alluvial plain of Valencia [15].
The Jucar floodplain is classified as medium to low energy (mean gradient of 1؉), with a meandering channel flowing along a prominent alluvial ridge. As for the geomorphology of the area, the texture of the Jucar's embedded valley fill varies longitudinally. The head of the plain is composed entirely of coarse materials such as pebbles, gravels and sand; in the intermediate section (Alzira) it presents a base of sands and gravels, followed by clays and silts and, at the top, clayey and sandy silts. Finally, in the last section of the Jucar valley, in the Ribera Baja region (Campanar-Sueca sector), fine sediments of dark brown and grayish tones predominate [38]. As this river rises in a mountain range and descends so steeply, most of the coarse materials are deposited at the foot of the Tragacete mountain range, and in its middle course the river only carries deposits of medium size in the sandy fraction. Upon reaching the mouth, in the sedimentation basin, the sediments have a silty-clay texture, reflecting the low energy of the medium [40].
As for the marine dynamics in the study area, several processes and agents should be mentioned, especially wind, waves, sea currents, and tides. To examine these processes, this study used data from Puertos del Estado, from the SIMAR node (2082110) located at coordinates 0.17o W 39.17o N, near the mouth of the Jucar (see Figure 3), for the period between 1958 (the oldest data available) and 2025.
Wind is one of the main phenomena affecting coastal dynamics, as it is the main generator of waves. The data obtained show that the most frequently occurring velocities (9-10%) are those between 3 and 3.5 m/s. As for the wind direction, the most predominant is westerly, at around 15%, followed by west-northwest, with a predominance of 10%, and then by north-northeast and east-southeast.
With regard to waves, the average wave height in the study area does not exceed 0.5 m, with a frequency of almost 60%. The predominant direction is east-northeast, that is, toward the coast, although with a certain degree of deviation that may be caused by coastal currents.
As for marine currents, their main causes in the Mediterranean are local winds or circulation conditioned by differences in temperature and salinity in the water masses themselves, in the process known as thermohaline circulation [41]. Currents can be divided into two main groups: general currents, which are produced at a distance from the coast thanks to the forces just mentioned, and coastal currents, which are generated practically on the shores and whose direction may coincide with, or be completely opposite to, that of the general current [42]. Among the general currents, according to data from Puertos del Estado, the predominant current, with a speed of more than 16 cm/s, is south-north, followed very closely by north-south. Among the coastal currents, the longitudinal current is the most important, parallel to the coast, and entirely dependent on coastal drift (sedimentary material displaced along the shore under the influence of waves and currents).
On the coasts of the Valencian oval, the coastal drift presents a net resultant in a North to South direction, in accordance with the wind regime and the wave climate [42].
Finally, one should mention the tides. Astronomical tides produce strong currents capable of modifying the local hydrodynamic conditions, especially in mouths. This typology is relatively unimportant in the Valencian coasts and is not usually taken into account since the Mediterranean is a microtidal sea and its effect does not exceed 30 cm of tidal range [43]. For their part, the meteorological tides that influence the underwater topography occur sporadically on the Valencian coasts [41] and, due to their occasional nature, have not been taken into account in the present study.
The main aim of this study is to analyze the bathymetric changes that have taken place at a multiscale level in the Jucar River Delta since the nineteenth century, using nautical charts and Geographic Information Systems. The study also has the following secondary aims:
- To obtain a Digital Elevation Model from the digitized bathymetry of each of the nautical charts.
- To evaluate the impact of the lamination of the Jucar since the 1950s on the submerged delta.
- To analyze the influence of the 1982 flood, the most important during the period covered by this study, on the submerged Jucar Delta.
- To understand how global warming and its extraordinary storms could influence the sedimentation of the Jucar River.
2. Materials and Methods
In this study, the bathymetric changes of the submerged delta of the Jucar River were assessed using five nautical charts (1893, 1963, 1998, 2002 and a present-day nautical chart). These charts were obtained from the Hemeroteca de la Universitat de València, with the exception of the most recent one which was obtained from Navionics (Table 1), an Italian company that manufactures electronic nautical charts. Each of them was used to create its own respective Digital Elevation Model.
The oldest one (1893) was obtained by using an old data collection technique called sounding lead, the most widely used until 1920. It consists of a weight attached to a graduated rope that is dropped to the bottom from the boat, at which time the depth is read from the rope. This process is repeated multiple times throughout the study area to determine the bathymetry of the ocean floor, although the accuracy achieved is low.
The rest of the charts were obtained using echo sounders, which began to function effectively in the early 1930s. A sound pulse is emitted from the ship, and returns to its point of origin reflected by the seabed or by solid bodies on the seabed. As the speed of propagation of sound waves through water is known, the time interval between the emission of sound and its reception immediately indicates the distance of the objects that reflect it in the form of an echo [44].
2.1. Georeferencing of Nautical Charts
The georeferencing process was performed on the 1893, 1963, 1998 and 2002 charts using ArcGis Desktop 10.8.2 software (the most recent nautical chart was already georeferenced).
To ensure correct georeferencing of the different nautical charts, the present-day nautical chart was used as a base, in addition to the base maps available in ArcGis. From these, reference points were introduced, always taking elements that do not disappear or may suffer displacement over time, such as chapels, lighthouses, castles, churches and road crossings.
As shown in Table 2, a minimum of 20 georeferencing points were established for each chart, and a maximum Root Mean Square error (RMS) of around 30 m, in order to obtain high accuracy.
2.2. Digitization of the Bathymetric Coordinates and Isobaths of the Nautical Charts
Once all the nautical charts were georeferenced in ArcGIS, the elevations and the isobaths were digitized. To do this, a common area was established for all the charts, since each one of them had a different extension. It was determined that this area would extend from l'Albufera de Valencia to the port of Denia, and up to isobath 100. This area is so large since the Jucar is a river with a high sediment load, and so the accumulation can extend to high depths of the shelf and up to many kilometers southward following the coast.
After this, two new layers were created for each chart. In one, points were drawn, one for each bathymetric elevation; in the other, polylines were drawn, one on each isobath. Next, the attribute tables were composed with double fields, adding the depth values in negative both for the isobath layers and for the bathymetric elevation layers. As for the digitization of the coordinates, their large number made the process difficult, especially in the present-day nautical chart, in which around 25,000 items were digitized by hand.
Finally, the isobaths were converted to points, introducing one every ten meters, thus increasing the final number of items (Table 3).
2.3. Rasterization and Interpolation
To obtain the respective Digital Elevation Models (DEM), several interpolation and rasterization tools were used:
First, a TIN (Triangulated Irregular Network) was created for each chart with the Create TIN tool, where the point layer was inserted and the double field of the attribute table where the depth values were indicated as “Height Field”. TIN is a way of storing continuous surfaces; it is vector-based and works in such a way that it connects known data points with straight lines to create triangles, often called facets, which are planes that have the same slope. Together, these hypothetical lines form a network that covers the entire surface [45]. After this, with the Edit TIN tool, triangles that were not needed or were misplaced (for instance, those that were inserted on land or those that interpolated points too far apart and were therefore inaccurate) were eliminated.
Once the TINs were clean, their respective rasters were created with the TIN to Raster tool. As explained by the Environmental Systems Research Institute [46], this method can be used to transform an irregular network of triangles into a raster by interpolation. Each cell in the output is assigned a height or a NoData value, depending on whether or not the center of the cell falls within the interpolation zone. The raster format is based on a grid formed by cells or grids (photographs, images, etc.), in which each grid (pixel) presents a spatial quality or property (color, altitude, among others). The main difference with respect to a vector file is that the raster file stores pixels while the vector file stores coordinates of the vertices of each geometric element [47].
Because these rasters were not sufficiently accurate, Natural Neighbor interpolation was used. This methodology employs an algorithm that finds the subset of input samples closest to the query point and applies a series of weights based on proportional areas to interpolate a value. This is a local interpolation, which does not generate peaks, troughs, ridges, or valleys that have not been represented by the samples provided [48]. As the raster obtained by this interpolation cannot be edited, the Extract By Mask tool was used, which extracts the cells of a raster that correspond to the areas defined by a mask, creating an output raster in which the data from the attribute table of the initial raster are preserved [46]. The respective TIN acts as a mask for each map, obtaining a clean and precise final raster, which is the final DEM.
2.4. Raster Processing Analysisand
Finally, the raster calculator was used to observe how the submerged delta has changed over the years. This tool allows a multitude of mathematical operations to be performed between raster files. Conditional, mathematical, trigonometric, logical operations can be performed and the results are written in a new raster layer. In order to meet the objectives, the following subtractions were performed:
- 1893-1963
- 1963-1992
- 1992-2002
- 2002-Present-day
From the results obtained, two maps were extracted for each chart: a quantitative one, which is expressed by a color scale, and a qualitative one which indicates the areas where there is erosion (<-0.5), stability (-0.5-0.5) or aggradation (>0.5) with the passage of time.
To determine whether the subtractions were done correctly, two bathymetries (1893 and present-day) were entered into AutoClean, a bathymetric and LiDAR data cleaning program.
One of the layers was entered as reference grid, and the difference model was created with the tool “Diff Mean”. This was the same as its respective model in ArcMap, therefore, it was concluded that the subtractions were correct. The methodology used [49] is summarized in the following chart (Figure 4):
3. Results and Discussion
The results obtained in this study are contained in the quantitative and qualitative subtraction maps. In order to respond to the study’s aims, the comparative analysis carried out between the different maps obtained is detailed. In addition, based on the study of the river mouth area, the delta is characterized according to the classification of Wright and Bates.
3.1. Bathymetric Analysis of the Delta from the 19th Century to the Present
Between 1893 and 1963 (Figure 5) the qualitative map (Figure 6) shows an aggradation of the entire continental shelf over the course of these 70 years. The quantitative analysis (Figure 7) shows that at the mouth of the Jucar there is a large contribution of sediment that feeds the deltaic lobe, as seen in more detail in Figure 5. As the lamination of the rivers through the construction of the dams on the Valencian coasts did not occur until the 1950s [36] this subtraction map can act as the reference for the contribution of sediment in the river’s natural regime. Although the shelf shows this trend, the high availability of sediments on the coast during the nineteenth century (a consequence of extreme flooding events after the dry and cold periods at the end of the Little Ice Age in the Gulf of Valencia [32]) may explain the sedimentary aggradation and progradation at this time [18].
As mentioned above, in the 1950s, multiple reservoirs and dams were built on the Jucar, in particular the Alarcon Reservoir [36], which came into service in 1957, and the Tous Dam, built in 1972 [37]. These dams are material traps which reduce the amount of sediment reaching the sea and which may therefore slow the growth of the submerged delta and increase the coastal erosion in the area of the mouth. In 1982, the largest flood of the Jucar in the twentieth century was caused by the bursting of the Tous Dam [38], triggering the transport of the solid load retained in the reservoir seaward and modifying the geomorphology of the delta [39].
In order to understand the impact of the dams built on the Jucar on the river’s contributions to the continental shelf, we compare the period 1893-1963, when the influence of the reservoirs was not yet reflected on the shelf, with the period 1963-1998, almost 40 years after the construction of the Alarcon Reservoir.
These maps show how the continental shelf received a much lower sedimentary input between 1963 and 1998, since the qualitative map (Figure 8) shows a decrease in sediment on the shelf. The exception is the river mouths, where there is still sedimentary input, though far less than in the nineteenth century.
In the Jucar Delta, the quantitative map (Figure 9) shows that between these years the deltaic lobe at the mouth did not grow, indicating a lower contribution of sediment. A wide area of stability is also observed near the Jucar River (Figure 10).
These two situations are reflected in the fact that, from the 1950s onwards and after its lamination, the Jucar River contributed much less sediment than during the nineteenth century [50]. However, the flood of 1982 and the subsequent ordinary floods of the river until the dam was repaired in 1996, together with the sediment produced in the lower basin of the river located after the reservoirs, counteracted this effect. In addition, it can be observed how the sediments of the Jucar expand both to the north of the mouth and to the south, perhaps because the general currents in the study area are predominantly in a south-north direction, followed very closely by the north-south, according to data from Puertos del Estado (State Ports).
This morphology of the stability lobe can also be explained by the behavior of the Jucar River during large-scale floods, when it reaches the sea with so much flow and such a huge volume of sediment that it changes the marine dynamics. An example is shown in Figure 11, which depicts the mouth of the Jucar during the DANA in 2024.
Figure 12 shows that, although the sediment from the 1982 flood and ordinary floods up to 1996 spread over the shelf, most of it accumulated south of the mouth of the Jucar and on the coast, as reflected in the extent of the green scale. This may be due to the effect of the new breakwater on the inputs and the predominant net direction of the general currents and the coastal longitudinal current, which according to Sanjaume (1985) is in a N-S direction.
The latter effect can be seen in the quantitative map, which shows that since the construction of the Jucar breakwater sediments transported by this current have begun to accumulate to the north of this structure (Figure 12).
Between 1998 and 2002 there was a certain degree of stability and few changes in the continental shelf in the area (see the qualitative map in Figure 13) The accumulation of sediment on the coast and on the shelf was also lower than in previous years. From the quantitative point of view (Figure 14) three findings can be observed: (a) with respect to the situation prior to the construction of the dams, the Jucar still does not contribute a sufficient amount of sediment to counteract erosion, (b) the northern breakwater has been extended seaward and the accumulation of sediments retained to the north of this structure has increased, due to the effect of the drag of the coastal longitudinal current (Figure 12); and (c) erosion to the south of the breakwater, reflecting the negative influence of artificial structures on the coasts on the sediment balance [42].
Since 2002, the platform has received significant contributions of sediment, especially near the coast, as shown in the qualitative map (Figure 15). The quantitative map (Figure 16) shows that the sediments come from the Jucar and other rivers in the area.
At its mouth, as shown in Figure 17, there was a large contribution of sediment during these years, which is also reflected in the growth of the deltaic lobe; near the mouth, accumulations of up to 3 m in 20 years have been calculated. Figure 17, marked with arrows, shows that the beaches near the mouth have suffered erosion, a phenomenon that contrasts with the progressive accumulation of sediment since the 1960s to the north of the breakwater after its construction.
These processes may be due to the increase in the energy and frequency of extreme events on the Valencian coasts during the twenty-first century. An example of this is the Gloria storm, with winds of up to 36 m/s, a sea level rise of more than 0.6 m, currents with maximum values above 0.8 m/s and extreme waves with a maximum significant height around 0.8 m/s [52]. These high-energy episodes cause two effects: first, they are responsible for large floods that drag huge contributions of sediment to the platform, since the intense rainfall causes floods in rivers and streams and, as a result, extraordinary discharges of sediment [52]. Second, they also erode the coasts [53,54,55], due to the magnitude of wave and wind parameters during multiple storms, and this process exacerbates the loss of sediment associated with anthropogenic action (that is, river lamination and the construction of dikes and coastal breakwaters).
Recent research carried out by the Geoenvironmental Cartography and Remote Sensing Group of the Polytechnic University of Valencia reduces the time frame by half; this research group argues that erosion on these beaches began in 2015, as shown in the layer of the Valencian Cartographic Institute (ICV) viewer [56]. In this layer (showing average rates of change of beach width) it can be seen how the beaches near the mouth of the Jucar, especially the northern one, show a high erosive trend from 2015 onwards.
On the Valencian coasts, the Gloria event (2020) caused the flooding of multiple rivers, including the Jucar and surrounding areas, which would explain the accumulation of sediment during this period (Figure 15).
Finally, the difference in the bathymetric models between 1893 and the present day represents, from both a qualitative (Figure 18) and a quantitative point of view (Figure 19), the deltaic lobe of the Jucar River and, therefore, the high level of sediment that has accumulated on the continental shelf from this river over this period. This feature of the delta spans an area of 5.6 km from the river mouth and 18.5 km along the coast, with a final area of 96.3 km2.
In these maps (see Figure 18 and Figure 19) the deltaic lobe of the Jucar is marked, as well as the lobe formed by the southern rivers. Comparison of the two deltas reveals the large amount of sediment transported by the Jucar River since the nineteenth century and the sediment availability of the riverbeds due to the action of the Little Ice Age [32]. Despite the retaining action of the dams since the mid-twentieth century, the Jucar lobe continues to grow; the changes in climate of the twenty-first century and the frequency of high-energy events [30] have triggered a large contribution of sediment to the shelf, as well as (and in contrast to) erosion on the coast [52].
3.2. Determination of Delta Type
Based on the results of this study (Figure 19) and its comparison with the different types of deltaic systems described by Wright [6] and Bates [5], the submerged delta of the Jucar River is defined as hypopycnal (type C in Figure 2) and, therefore, buoyancy is the dominant feature.
The transverse and longitudinal profiles of the Jucar Delta share morphology with the type profiles of a hypopycnal delta, as can be seen by contrasting Figure 20 and Figure 21, where the different parts of the Jucar Delta can be distinguished:
The transverse profile (C in Figure 21) of the Jucar Delta indicates the channel and the accumulation on the sides forming dikes, although they are not as pronounced as in the type profile described by Wright [6].
The longitudinal profile (A in Figure 21) shows the crest of the bar and how the volume of the accumulation decreases as the deposits progress; a grain-selection [1] is evident, with the coarsest (sands) near the mouth, forming the crest, and the predominance of the finer ones as they move away from it. The bar crest has a width of 287 m, when measured transverse to the mouth, reflecting the sand load carried by this river, and its distance from the mouth of the effluent is almost five times the width of the channel. It is followed by the bar front with a width of 165 m that moves forward as the deposits progress; the distal part with a width of 57 m is the narrowest, measured transverse to the shore.
From the distal part of the delta, prodelta clays dominate, a type of sediment formed by clays and silts, which make up almost the entire deltaic lobe [40]. The deltaic lobe is much larger than suggested in Figure 21 (see Figure 18). This can be corroborated with the nautical charts of both 1963 and 1998 in which the bottom type is described, since the area determined to be a deltaic lobe is represented as “Mud”. This part of the delta (by far the largest) measures 4.4 km longitudinally, and 18 km parallel to the coast; its size indicates the tendency of this river to transport silt-clay textured material [40].
This distribution is also observed in the delta plan (B in Figure 21), where the subaqueous dikes described by Wright (1977) can also be seen.
5. Conclusions
The use of nautical charts has allowed a reconstruction of ancient submerged geomorphologies and an analysis of the bathymetric changes in the seabed in the area of the mouth of the Jucar. This information, the only source of data available, has been crucial for the study of the changes in the submerged delta of the Jucar from the nineteenth century to the present day.
The submerged delta of the Jucar and its natural regime have been described on the basis of information extracted from the 1893 nautical chart. The conclusion is that during the nineteenth century this river transported large amounts of sediment to the sea, leading to an increase in the size of the submerged delta. This is due to the large-scale availability of sediments as a consequence of the dry climate characteristic of the Little Ice Age.
From the 1950s onwards, the contributions of sediment from the Jucar and the speed of growth of its submerged delta both decreased due to the lamination of the Jucar River. The DEMs analyzed show how the flood of 1982, as well as the subsequent ordinary floods of the Jucar River until the reconstruction of the Tous Dam, counteracted this shortage of sediments, which is reflected in the stability of the deltaic lobe.
Despite the retaining action of the dams, the lobe continues to grow today, due to the increased frequency of high-energy events responsible for the large sediment input during the twenty-first century in the context of climate change. In contrast to this sediment accumulation in the marine environment, beaches suffer erosional processes.
Finally, the Jucar Delta is classified as hypopycnal and, therefore, dominated by buoyancy forces. It is 5.6 km wide at the mouth of the river and 18.5 km along the coast, with a final area of 96.3 km2, and its parts are well defined according to the model that characterizes this type of delta.
Funding
This research received no external funding
Acknowledgements
This paper has been partially supported by Ingenio Program UCV/2024-153-902 (Catholic University of Valencia).
Conflicts of Interest
The authors declare no conflicts of interest
Abbreviations
The following abbreviations are used in this manuscript:
| GIS | Geographic Information System |
| MIS 1 | Marine Isotopic Stage 1 |
| CHJ | Jucar Hydrographic Confederation |
| “DANA” | Isolated High Level Depression |
| IPCC | Intergubernamental Panel on Climate Change |
| RMS | Root Mean Square error |
| DEM | Digital Elevation Model |
| TIN | Triangulated Irregular Network |
| ESRI | Environmental Systems Research Institute |
| ICV | Valencian Cartographic Institute |
References
- Arche, A. Deltas. In Sedimentología; Arche, A., Ed.; Consejo Superior de Investigaciones Científicas: Madrid, Spain, 1992; Volume 1, pp. 397–454. [Google Scholar]
- Gilbert, G.K. The topographic features of lake shores. U.S. Geol. Surv. 1885, 5, 75–123. [Google Scholar]
- Gilbert, G.K. Lake Bonneville. U.S. Geol. Surv. 1890, Monography 1, 1–148. [Google Scholar]
- Coleman, J.M.; Gagliano, S.M. Sedimentary Structures: Mississippi River Deltaic Plain. In Primary Sedimentary Structures and Their Hydrodynamic Interpretation; Middleton, G.V., Ed.; Society for Sedimentary Geology: Oklahoma, OK, USA, 1965. [Google Scholar]
- Bates, C. Rational theory of delta formation. AAPG Bull. 1953, 37, 2119–2162. [Google Scholar] [CrossRef]
- Wright, L.D. Sediment transport and deposition at river mouths: A synthesis. Geol. Soc. Am. Bull. 1977, 88, 857–868. [Google Scholar] [CrossRef]
- Boyer, J.; Duvail, C.; Le Strat, P.; Gensous, B. High resolution stratigraphy and evolution of the Rhône delta plain during Postglacial time, from subsurface drilling data bank. Mar. Geol. 2005, 222–223, 267–298. [Google Scholar] [CrossRef]
- Bruneton, H.; Arnaud-Fassetta, G.; Provansal, M.; Sistach, D. Geomorphological evidence for fluvial change during the Roman period in the lower Rhone valley (southern France). Catena 2001, 45, 287–312. [Google Scholar] [CrossRef]
- Bellotti, P.; Caputo, C.; Davoli, L.; Evangelista, S.; Garzanti, E.; Pugliese, F.; Valeria, P. Morpho-sedimentary characteristics and Holocene evolution of the emergent part of the Ombrone River delta (southern Tuscany). Geomorphology 2004, 61, 71–90. [Google Scholar] [CrossRef]
- Amorosi, A.; Milli, S. Late Quaternary depositional architecture of Po and Tevere river deltas (Italy) and worldwide comparison with coeval deltaic successions. Sediment. Geol. 2001, 144, 357–375. [Google Scholar] [CrossRef]
- Bellotti, P.; Caputo, C.; Davoli, L.; Evangelista, S.; Garzanti, E.; Pugliese, F.; Valeria, P. Morpho-sedimentary characteristics and Holocene evolution of the emergent part of the Ombrone River delta (southern Tuscany). Geomorphology 2004, 61, 71–90. [Google Scholar] [CrossRef]
- Amorosi, A.; Giovanni, S.; Rossi, V.; Fontana, V. Anatomy and sequence stratigraphy of the late Quaternary Arno valley fill (Tuscany, Italy). In Advances in Application of Sequence Stratigraphy in Italy; Amorosi, A., Haq, B.U., Sabato, L., Eds.; University of Bologna: Bologna, Italy, 2008; pp. 117–128. [Google Scholar]
- Rossi, V.; Amorosi, A.; Sarti, G.; Romagnoli, R. New stratigraphic evidence for the mid-late Holocene fluvial evolution of the Arno coastal plain (Tuscany, Italy). Géomorphol. Relief Processus Environ. 2012, 2, 201–214. [Google Scholar] [CrossRef]
- Cearreta, A.; Benito, X.; Ibáñez, C.; Trobajo, R.; Giosan, L. Holocene palaeoenvironmental evolution of the Ebro Delta (Western Mediterranean Sea): Evidence for an early construction based on the benthic foraminiferal record. Holocene 2016, 26, 1438–1456. [Google Scholar] [CrossRef]
- Carmona, P.; Ruiz, J.M. Las inundaciones de los ríos Júcar y Turia. Ser. Geogr. 2000, 9, 49–69. Available online: http://hdl.handle.net/10017/1093 (accessed on 19 April 2025).
- Carmona, P.; Ruiz, J.M. Historical morphogenesis of the Turia River coastal flood plain in the Mediterranean litoral of Spain. Catena 2011, 86, 139–149. [Google Scholar] [CrossRef]
- Martínez-Clavel, B.; Segura, F.; Pardo-Pascual, J.E.; Guillén, J. Análisis de los cambios morfológicos en el delta sumergido del Ebro (1880–1992). In Comprendiendo el relieve: del pasado al futuro. Actas de la XIV Reunión Nacional de Geomorfología; Durán Valsero, J.J., Montes Santiago, M., Robador Moreno, A., Salazar Rincón, Á., Eds.; Instituto Geológico y Minero de España: Málaga, Spain, 2016; pp. 531–537. [Google Scholar]
- Garcés, R.; Roca, M.; Martínez-Clavel, B.; Blázquez, A.M. Long-term bathymetric changes in the submerged delta of the Turia river since the nineteenth century (Western Mediterranean) and their drivers. Sci. Total Environ. 2023, 905, 167296. [Google Scholar] [CrossRef] [PubMed]
- Navarrete, E. Apuntes de geología histórica, 1st ed.; Escuela Superior Politécnica del Litoral (ESPOL): Guayaquil, Ecuador, 2017. [Google Scholar]
- Alzaga, D.; Solórzano, D. Deltas. Available online: https://usuarios.geofisica.unam.mx/cecilia/CT-SeEs/Deltas_13-2.pdf (accessed on 29 September 2025).
- Canale, N.; Ponce, J.J.; Carmona, N.B.; Parada, M.N.; Drittani, D.I. Sedimentología de un delta fluvio-dominado, Formación Lajas (Jurásico Medio), cuenca Neuquina, Argentina. Andes. Geol. 2020, 47, 179–206. [Google Scholar] [CrossRef]
- Zavala, C. Los deltas litorales hiperpícnicos de la formación Mulichinco (Valanginiano), Cuenca Neuquina. In Actas del XXI Congreso Geológico Argentino, Puerto Madryn, Argentina, 2022.
- Buatois, L.A.; Saccavino, L.L.; Zavala, C. Ichnologic signatures of hyperpycnal flow deposits in Cretaceous river-dominated deltas, Austral Basin, southern Argentina. In Sediment Transfer from Shelf to Deep Water—Revisiting the Delivery System; Slatt, R.M., Zavala, C., Eds.; AAPG Studies in Geology; American Association of Petroleum Geologists: Tulsa, OK, USA, 2011; Volume 61, pp. 153–170. [Google Scholar]
- Coleman, J.M.; Gagliano, S.M. Cyclic Sedimentation in the Mississippi River Deltaic Plain. Gulf Coast Assoc. Geol. Soc. Trans. 1964, 14, 67–80. [Google Scholar]
- Arndorfer, D.J. Discharge patterns in two crevasses of the Mississippi River Delta. Mar. Geol. 1973, 15, 269–287. [Google Scholar] [CrossRef]
- Wright, L.D.; Coleman, J.M. Mississippi River Mouth Processes: Effluent Dynamics and Morphologic Development. J. Geol. 1974, 82, 751–777. [Google Scholar] [CrossRef]
- Roberts, H.H.; Adams, R.D.; Cunningham, H.W. Evolution of sand-dominant subaerial phase, Atchafalaya Delta, Louisiana. AAPG Bull. 1980, 64, 264–279. [Google Scholar] [CrossRef]
- Van-Heerden, I.L. Deltaic sedimentation in eastern Atchafalaya Bay, Louisiana. Ph.D. Thesis, Louisiana State University and Agricultural & Mechanical College, Baton Rouge, LA, USA, 1983. [Google Scholar]
- Confederación Hidrográfica del Júcar. Memoria 2023. Available online: https://www.chj.es/es-es/Organismo/Memoriasdeactuaciones/Paginas/Memoria2023.aspx (accessed on 28 May 2025).
- Intergovernmental Panel on Climate Change. Managing the Risks of Extreme Events and Disasters to Advance Climate Change Adaptation; Cambridge University Press: New York, NY, USA, 2012. [Google Scholar]
- World Meteorological Organization. State of the Global Climate 2023; WMO: Geneva, Switzerland, 2023. [Google Scholar]
- Ruiz, J.M.; Carmona, P. Turia river delta and coastal barrier-lagoon of Valencia (Mediterranean coast of Spain): Geomorphological processes and global climate fluctuations since Iberian-Roman times. Quat. Sci. Rev. 2019, 219, 84–101. [Google Scholar] [CrossRef]
- Fagan, B. El Gran Calentamiento: Cómo Influyó el Cambio Climático en el Apogeo de las Civilizaciones; Gedisa: Barcelona, Spain, 2008. [Google Scholar]
- Acosta, M.L. La Pequeña Edad de Hielo en el Golfo de València: procesos de deltas y sistemas de restinga-albufera. La desestabilización reciente. Ph.D. Thesis, Universitat de València, Valencia, Spain, 2023. [Google Scholar]
- Oliva, M.; Žebre, M.; Guglielmin, M.; Hughes, P.D.; Çiner, A.; Vieira, G.; Bodin, X.; Andrés, N.; Colucci, R.R.; García-Hernández, C.; et al. Permafrost conditions in the Mediterranean region since the Last Glaciation. Earth-Sci. Rev. 2018, 185, 397–436. [Google Scholar] [CrossRef]
- Gil, A. Regímenes natural y artificial del río Júcar. Investig. Geogr. 2006, 40. [Google Scholar] [CrossRef]
- Marco, J.B. Los proyectos de regulación de los ríos Júcar y Turia (1928–1964). Una nueva lectura. Cuad. Geogr. Univ. València 2012, 91–92, 73–94. [Google Scholar] [CrossRef]
- Ruiz, J.M.; Carmona, P. La llanura deltaica de los ríos Júcar y Turia la Albufera de Valencia. In Geomorfologia i Quaternari Litoral; Sanjaume, E., Mateu, J., Eds.; Universitat de València: Valencia, Spain, 2005; pp. 399–419. [Google Scholar]
- Fumanal, M.P.; Calvo, A. Repercusiones geomorfológicas de las lluvias torrenciales de octubre de 1982 en la cuenca media del río Júcar. Cuad. Geogr. Univ. València 1983, 32–33, 101–120. [Google Scholar] [CrossRef]
- Carmona, P.; Fumanal, M.A. Estudio sedimentológico de los depósitos de inundación en la Ribera del Xúquer (Valencia), en octubre de 1982. Cuad. Investig. Geogr. 1985, 11, 65–74. [Google Scholar] [CrossRef]
- Esteban, V. Dinámica litoral y sedimentación en las costas valencianas. In Geoarqueología Quaternari Litoral; Fumanal García, M.P., Ed.; Universitat de València, Departament de Geografía: Valencia, Spain, 1999; pp. 331–342. [Google Scholar]
- Sanjaume, E. Las costas valencianas. Sedimentología y morfología. Ph.D. Thesis, Universitat de València, Valencia, Spain, 1985. [Google Scholar]
- Roig Echegaray, V.; Gracia García, V.; Sánchez-Arcilla Conejo, A. Dinámica de desembocaduras en ambientes micromareales. Bachelor’s Thesis, Universitat Politècnica de Catalunya, Barcelona, Spain, 2018. [Google Scholar]
- Linares, J. Los Principios Básicos de la Ecosonda; Ministerio de Pesquerías: Lima, Peru, 1972. [Google Scholar]
- Lim, J.; Pilesjö, P. Triangulated Irregular Network (TIN) Models. In The Geographic Information Science & Technology Body of Knowledge; Wilson, J.P., Ed.; Association of American Geographers: Washington, DC, USA, 2022. [Google Scholar]
- Environmental Systems Research Institute. ArcGIS Desktop. Available online: https://desktop.arcgis.com/es/arcmap/latest/tools/spatial-analyst-toolbox/extract-by-mask.htm (accessed on 29 April 2025).
- Pérez-Guerra, G.A.; Sosa-Franco, I.; Machado-García, N.; Ruiz-Pérez, M.E. Herramientas SIG, revisión de sus fundamentos, tipos y relación con las bases de datos espaciales. Rev. Cienc. Téc. Agropecu. 2023, 32, 3, Available online: https://repositorio.ucm.edu.co/handle/10839/3288. [Google Scholar]
- Pérez Atehortúa, D.A.; Alzate Álvarez, Á.M.; López Naranjo, Ó. Diseño de mapas de información de radiación solar en el departamento de Caldas a través de métodos de interpolación y herramientas de SIG. Bachelor’s Thesis, Universidad Católica de Manizales, Manizales, Colombia, 2021. [Google Scholar]
- Montoya, I.; Martínez-Clavel, B.; Rodríguez-Pérez, A.; Blázquez, A.M. Cambios batimétricos en el delta sumergido del río Júcar desde el siglo XIX hasta la actualidad. In Coast2Coast’2025: II Jornada de Jóvenes Investigador@s en Morfodinámica de Costas—Book of Abstracts; Calvete, D., Cáceres, I., Mösso, C., Fernández-Mora, À., Eds.; SOCIB: Barcelona, Spain, 2025; p. 7. [Google Scholar]
- De Antonio, R.; Almorox, J.; Saa, A.; Rueda, J.P. Erosión y aterramiento de embalses. Agric. Rev. Agropecu. 1995, 64, 151–154. Available online: https://www.researchgate.net/publication/28272869_Erosion_y_aterramiento_de_embalses (accessed on 30 May 2025).
- National Geographic. La catástrofe de la DANA en Valencia vista desde el espacio. Available online: https://www.nationalgeographic.com.es/medio-ambiente/asi-se-ve-catastrofe-dana-valencia-espacio_23574 (accessed on 29 September 2025).
- Guillén, J. Impacto sobre la franja litoral. In Resumen sobre la Formación y Consecuencias de la Borrasca Gloria; Berdalet, E., Marrasé, C., Pelegrí, J.L., Eds.; Institut de Ciències del Mar, CSIC: Barcelona, Spain, 2020; pp. 15–24. [Google Scholar]
- Rangel-Buitrago, N. Efectos de temporales marítimos en sistemas litorales de la provincia de Cádiz. Ph.D. Thesis, Universidad de Cádiz, Cádiz, Spain, 2013. [Google Scholar]
- Carmona, P.; Ruiz, J.M.; Ibáñez, M. Erosión costera y cambio ambiental en el humedal de Cabanes-Torreblanca (Castelló). Datos para una gestión sostenible. Bol. Asoc. Geóg. Esp. 2014, 66, 161–180.
- Toledo, I. Estudio de los factores causantes de la erosión costera en las playas de Benidorm y Guardamar del Segura. Ph.D. Thesis, Universidad de Alicante, Alicante, Spain, 2024. [Google Scholar]
- Institut Cartogràfic Valencià. Visor de Cartografia. Available online: https://visor.gva.es/visor/ (accessed on 15 May 2025).
Figure 1.
Parts of a delta [20].
Figure 1.
Parts of a delta [20].
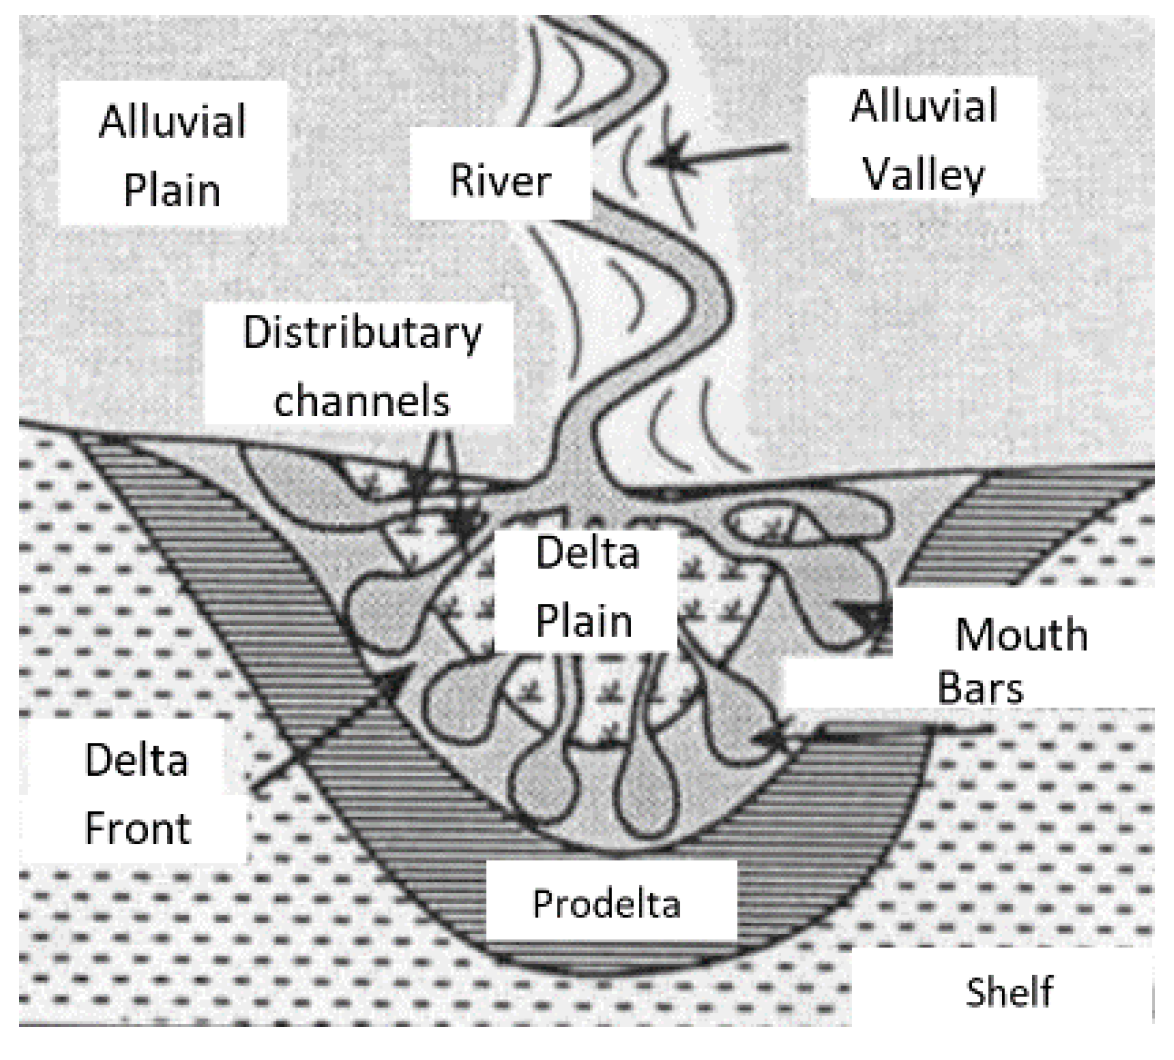
Figure 2.
Possibilities of interaction between the effluent waters and those of the receiving basin: A, homopycnal flow; B, hyperpycnal flow; C, hipopycnal flow.
Figure 2.
Possibilities of interaction between the effluent waters and those of the receiving basin: A, homopycnal flow; B, hyperpycnal flow; C, hipopycnal flow.
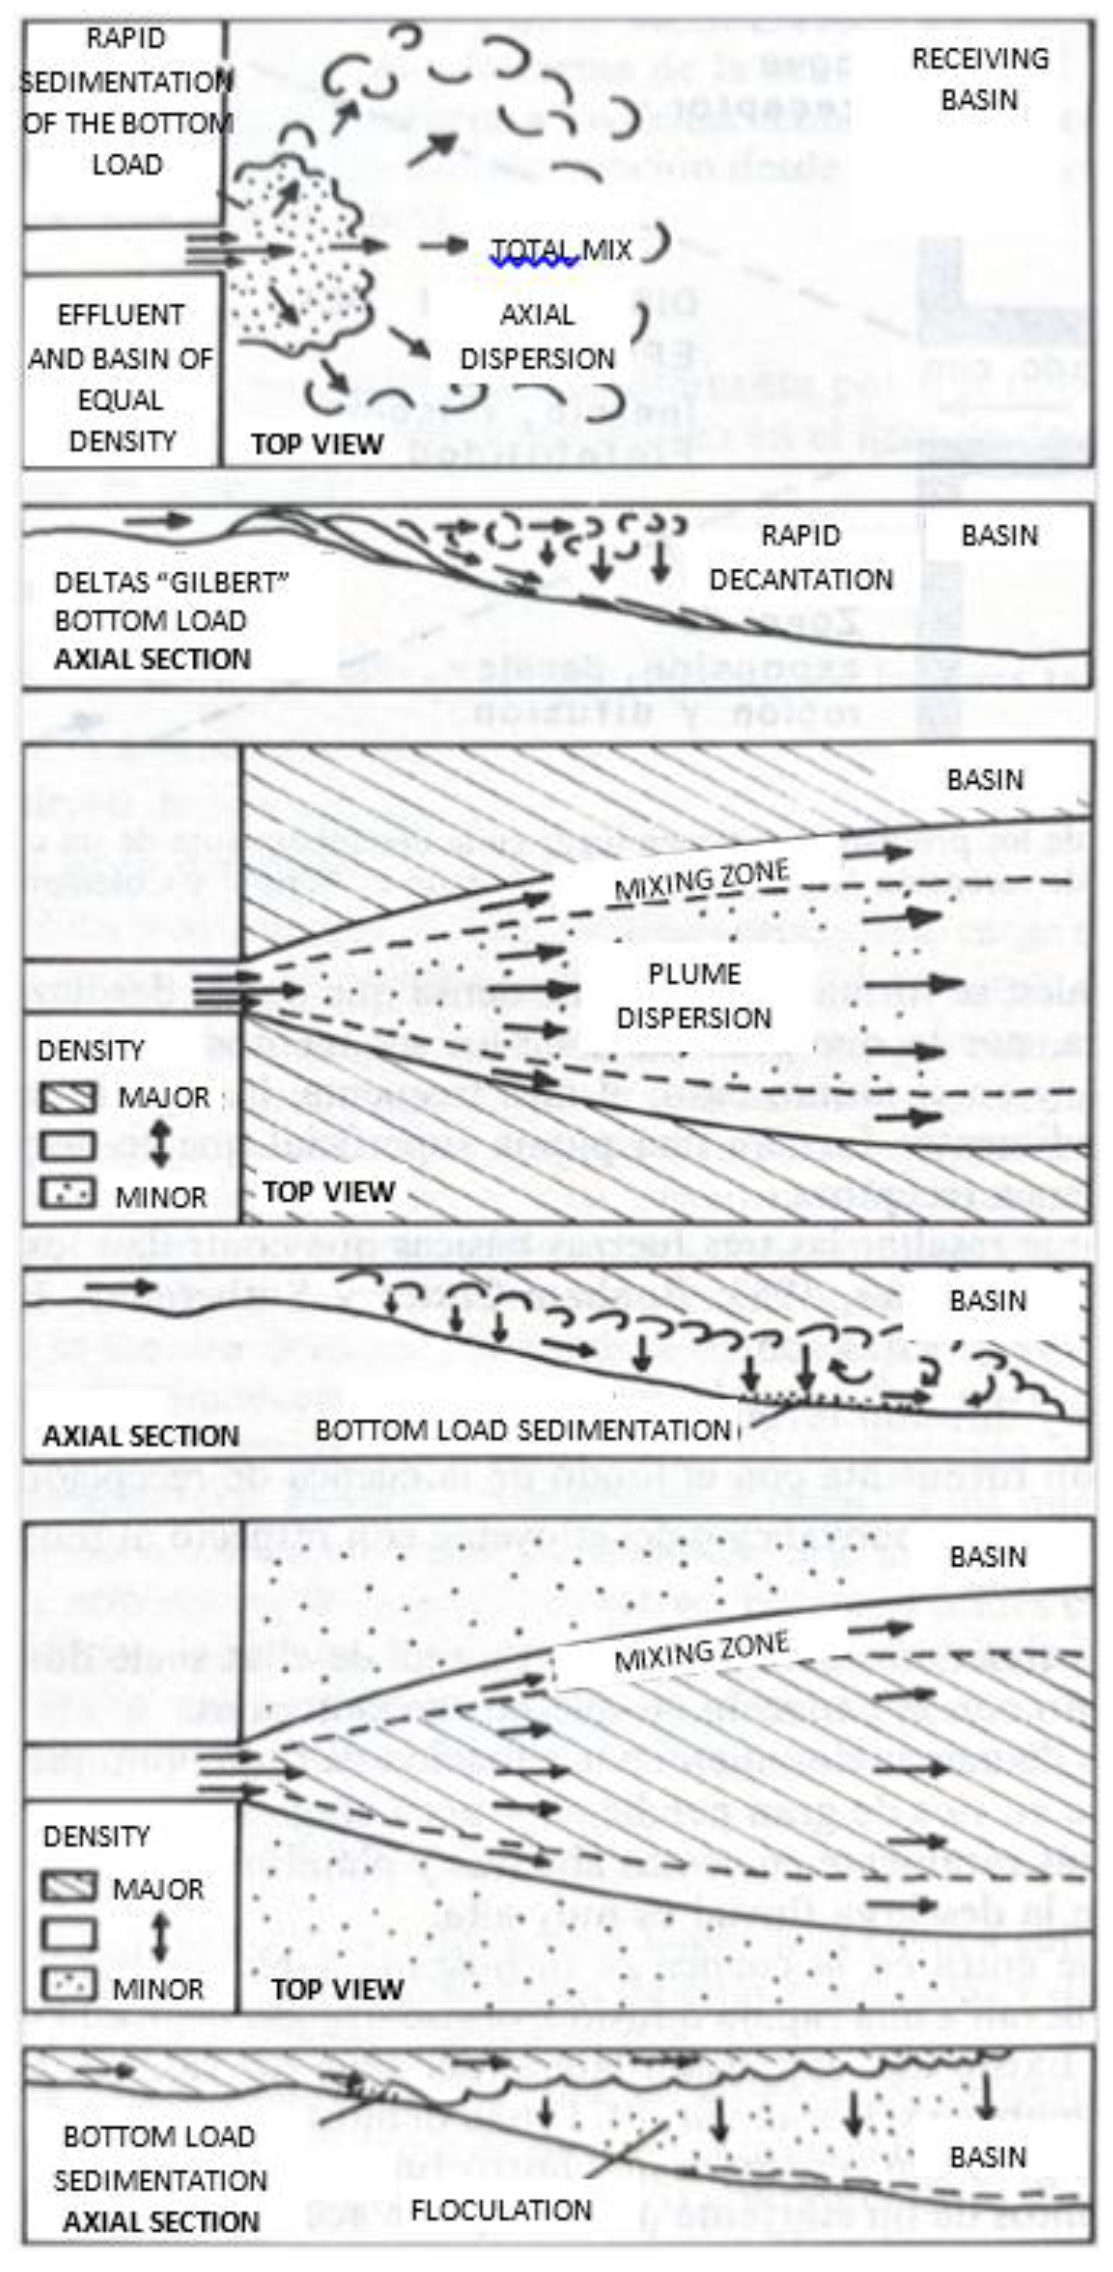
Figure 3.
Study Area.
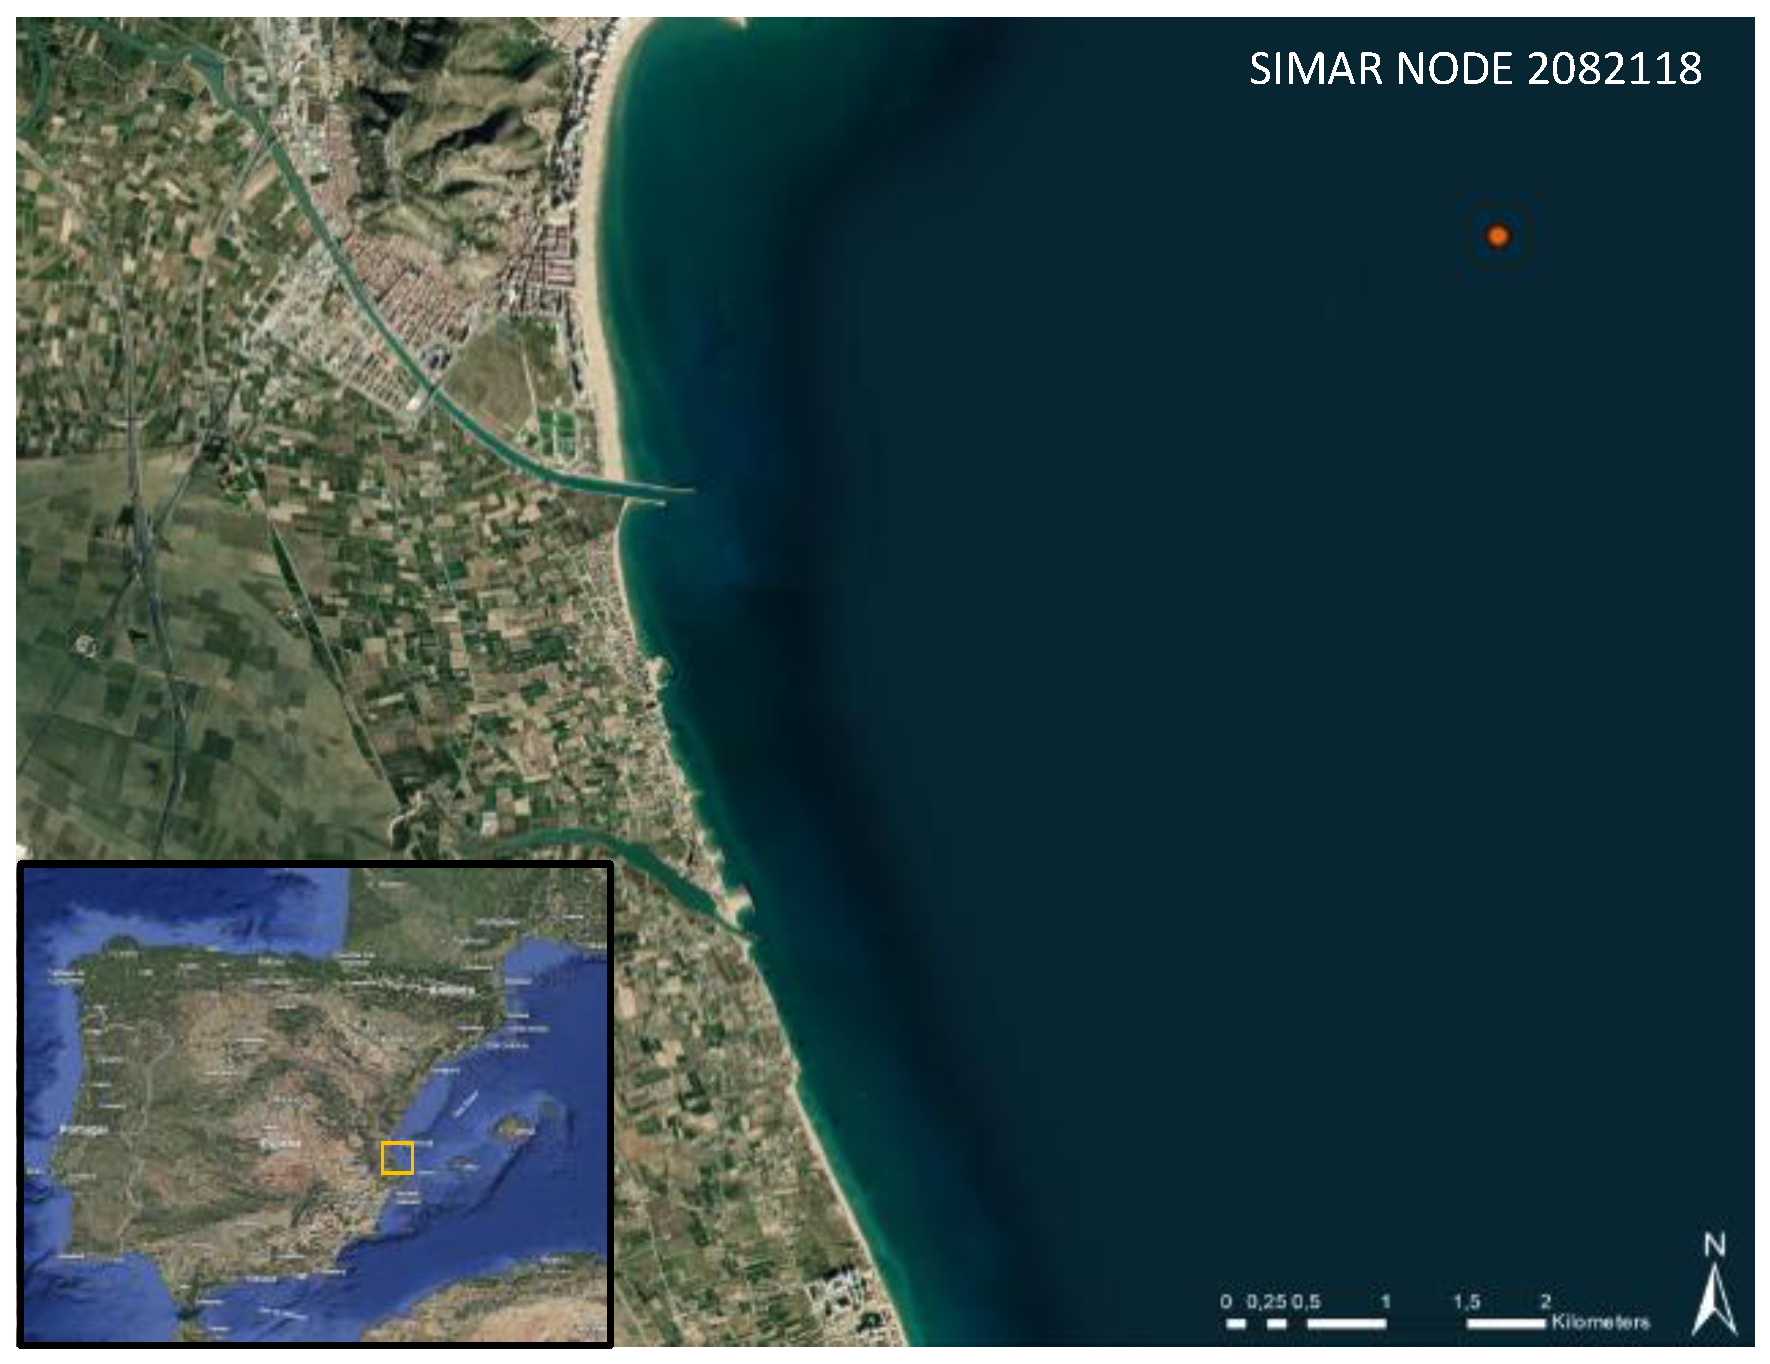
Figure 4.
Outline of the methodology carried out.
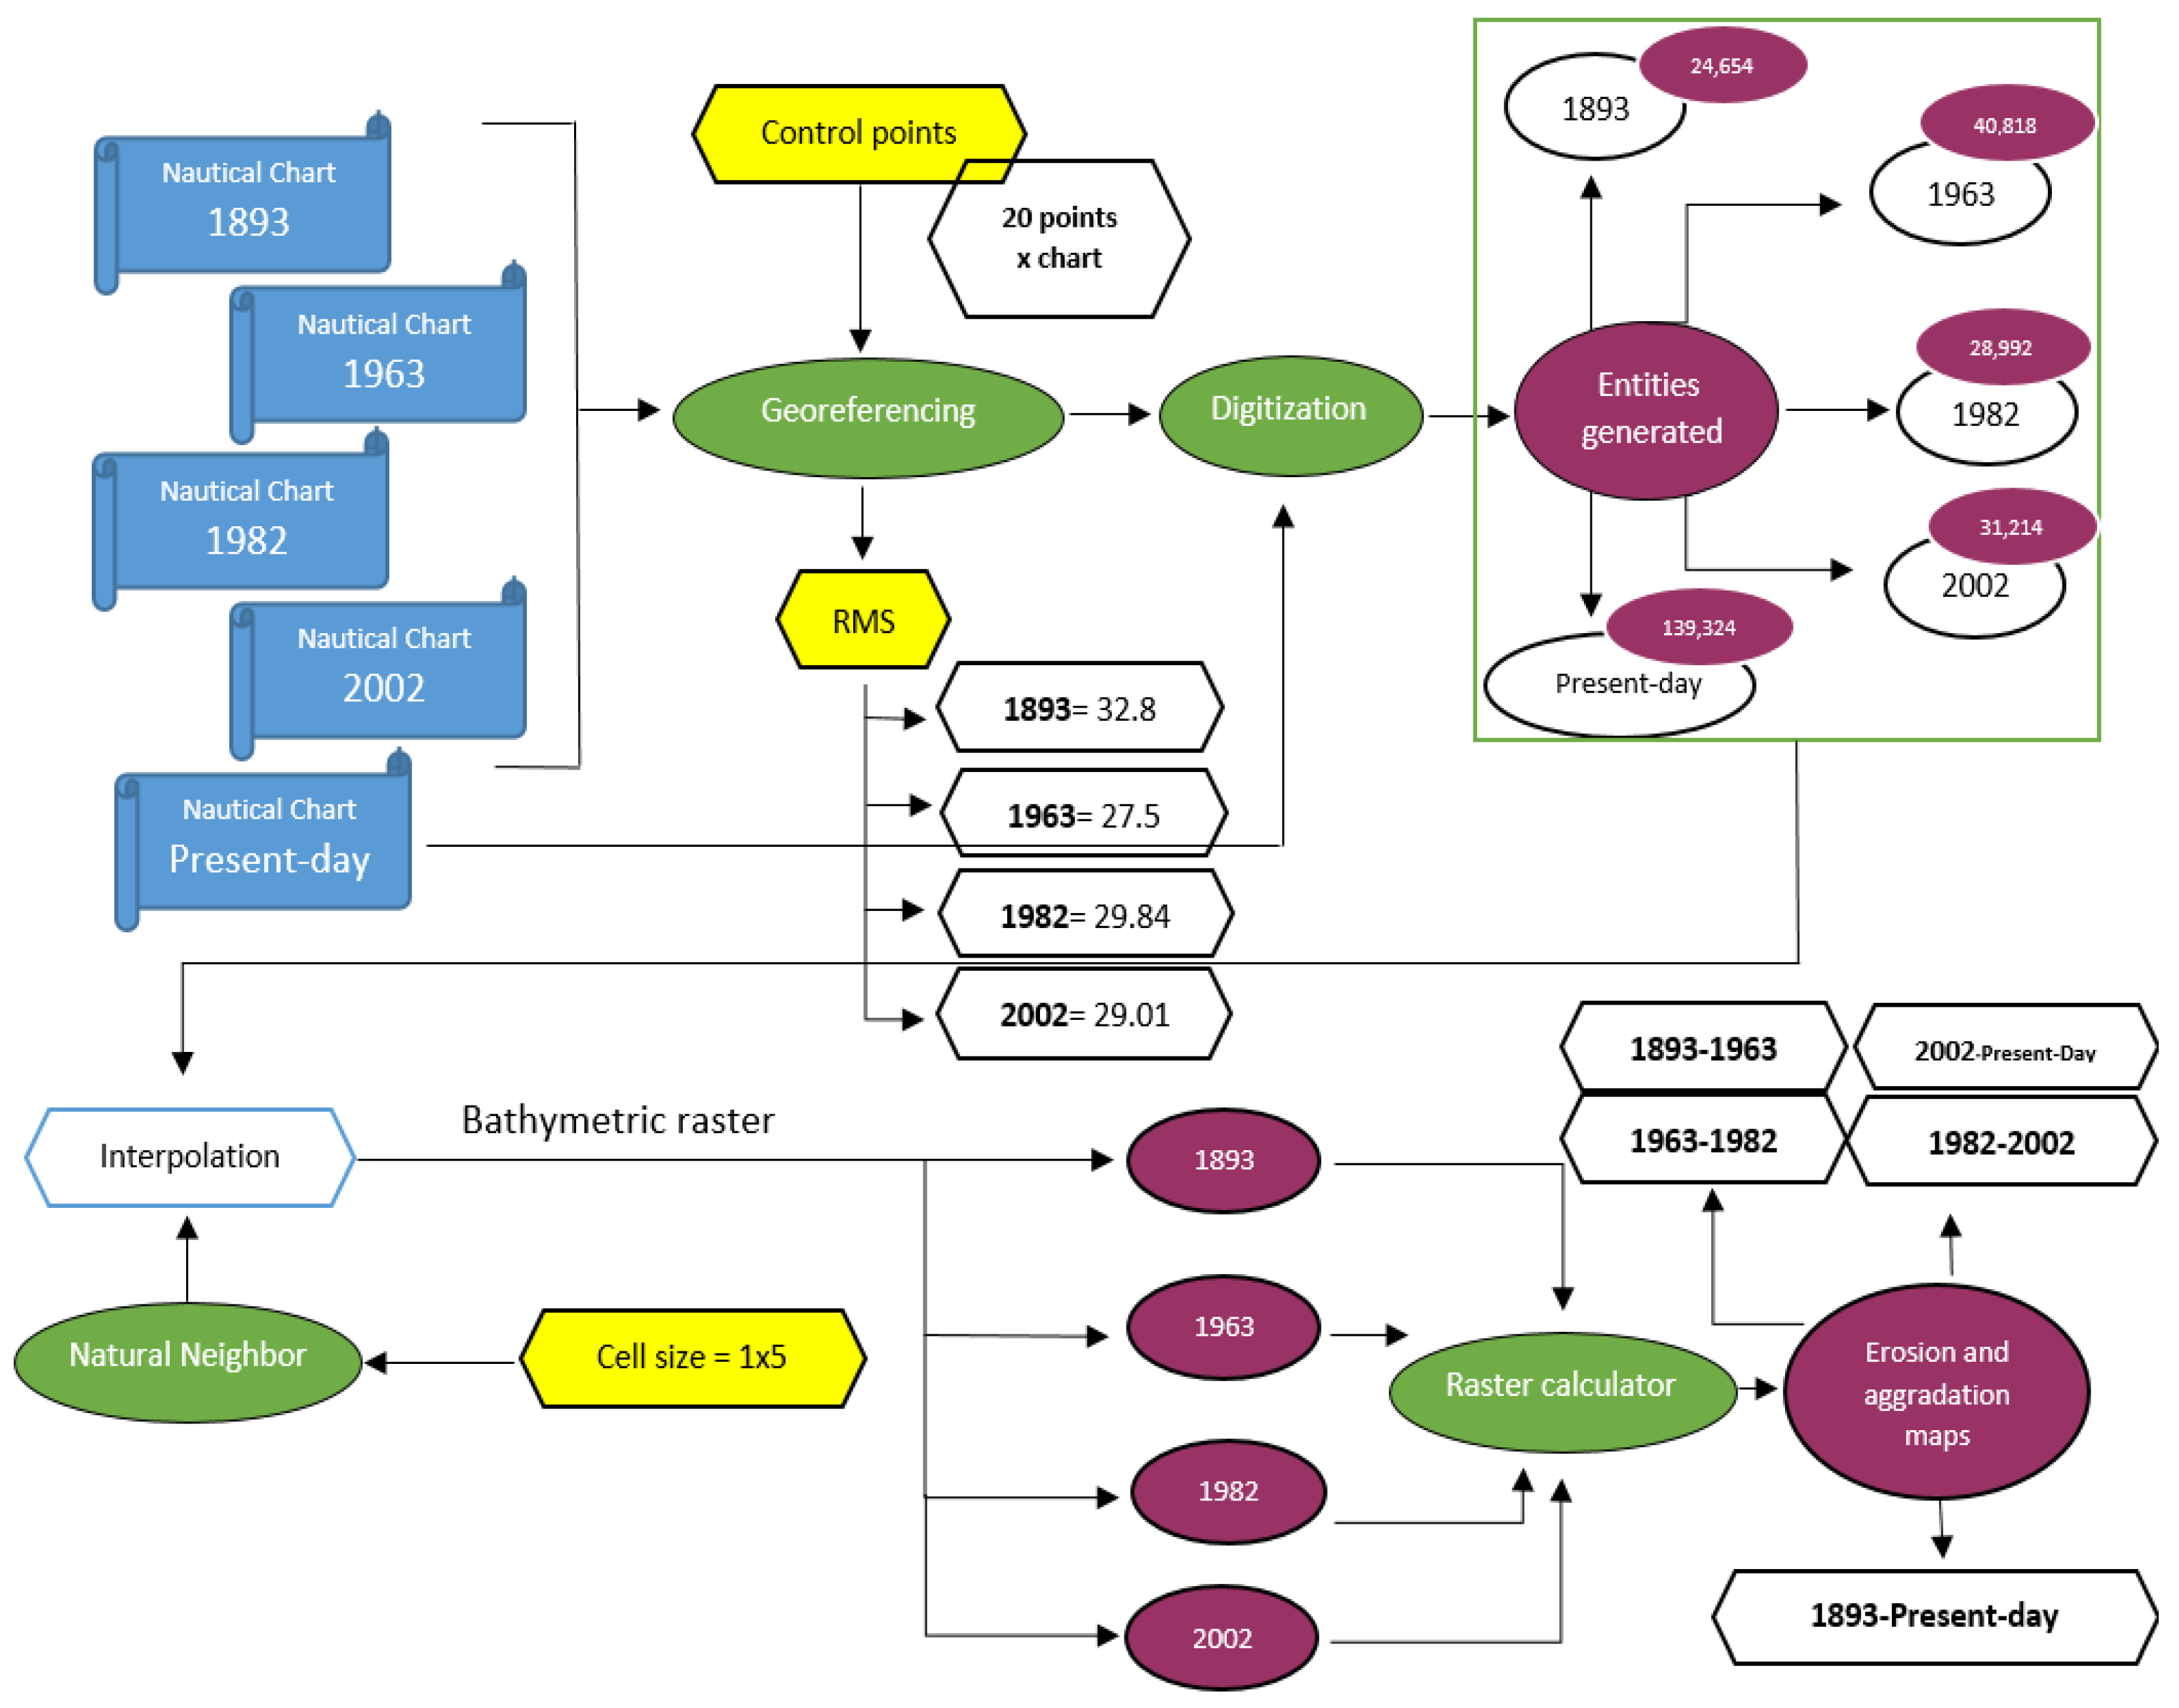
Figure 5.
Mouth of the Jucar (1963-1893).
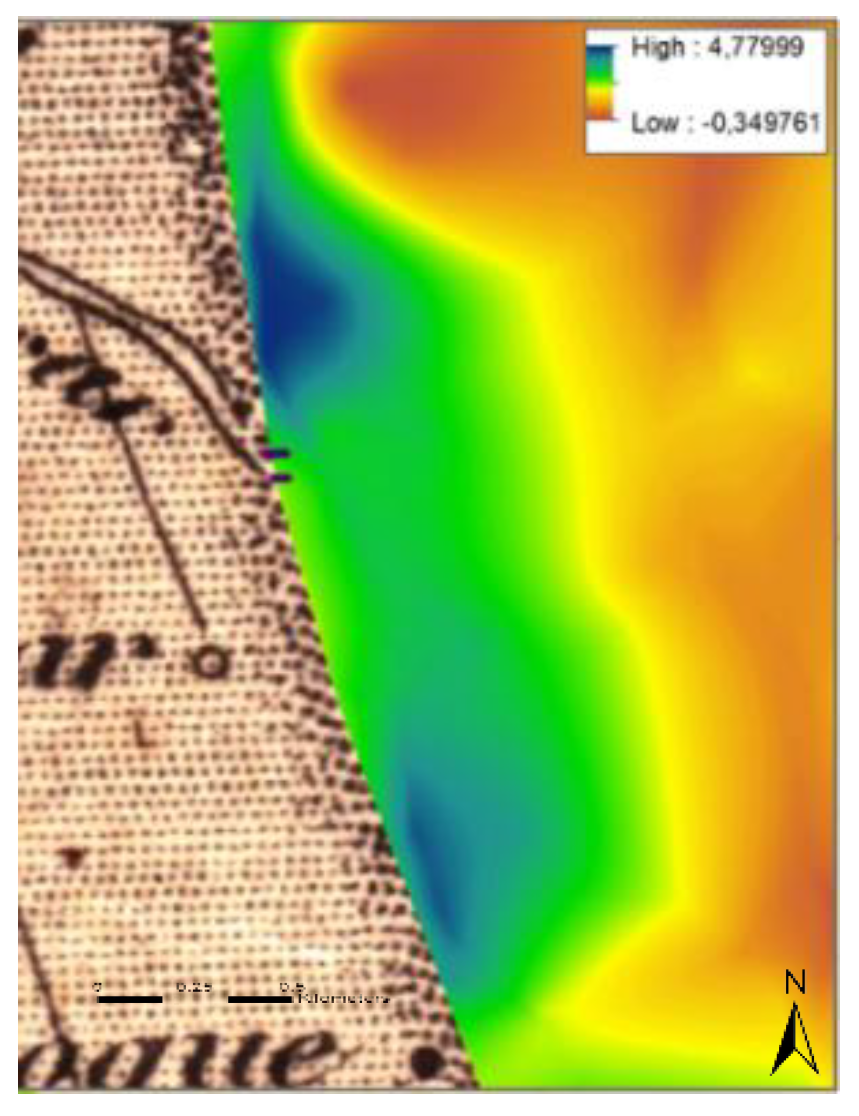
Figure 6.
Qualitative map (1963-1893).
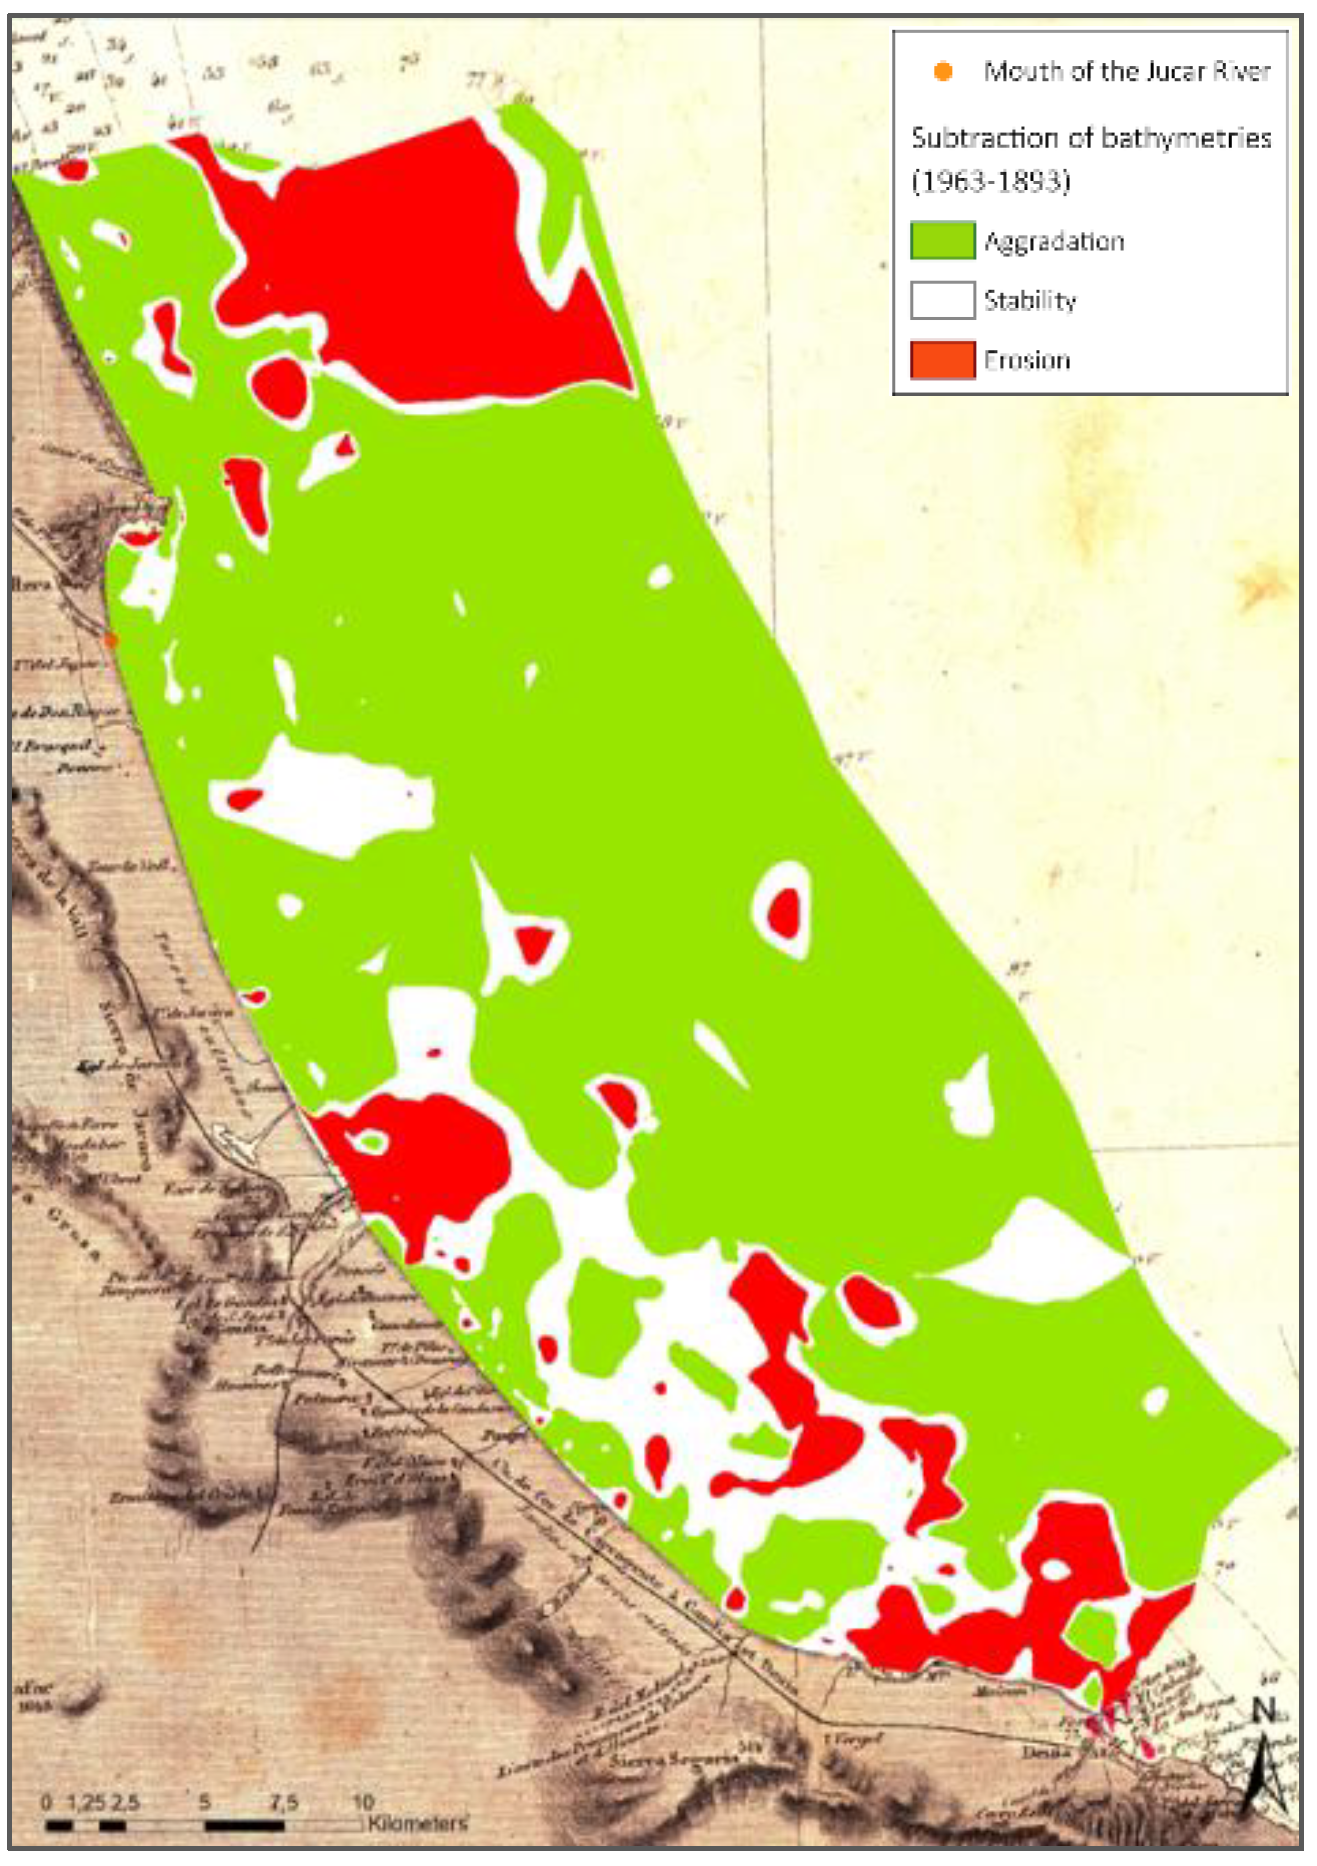
Figure 7.
Quantitative map (1963-1893).
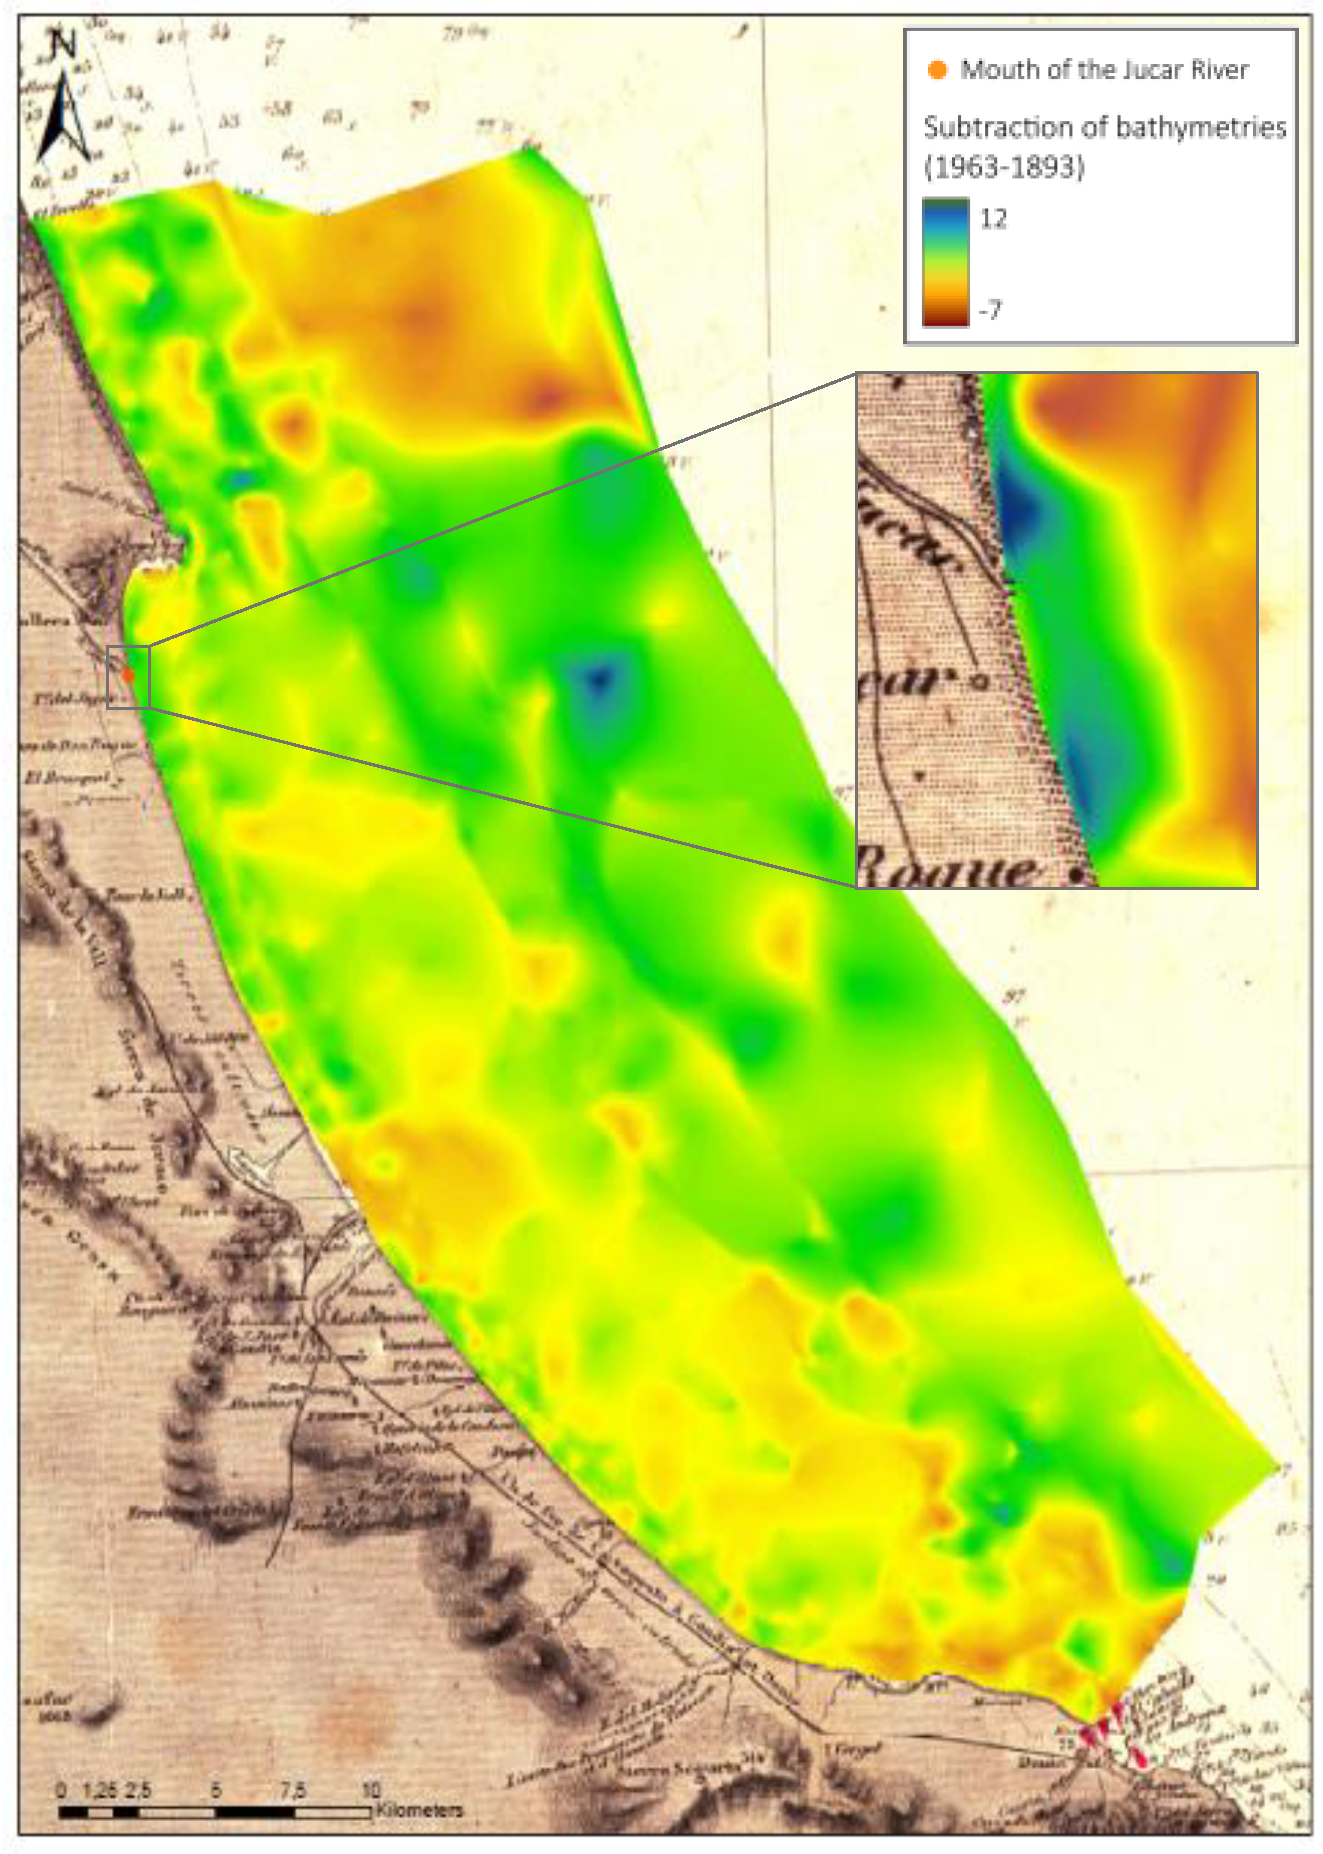
Figure 8.
Qualitative map (1998-1963).
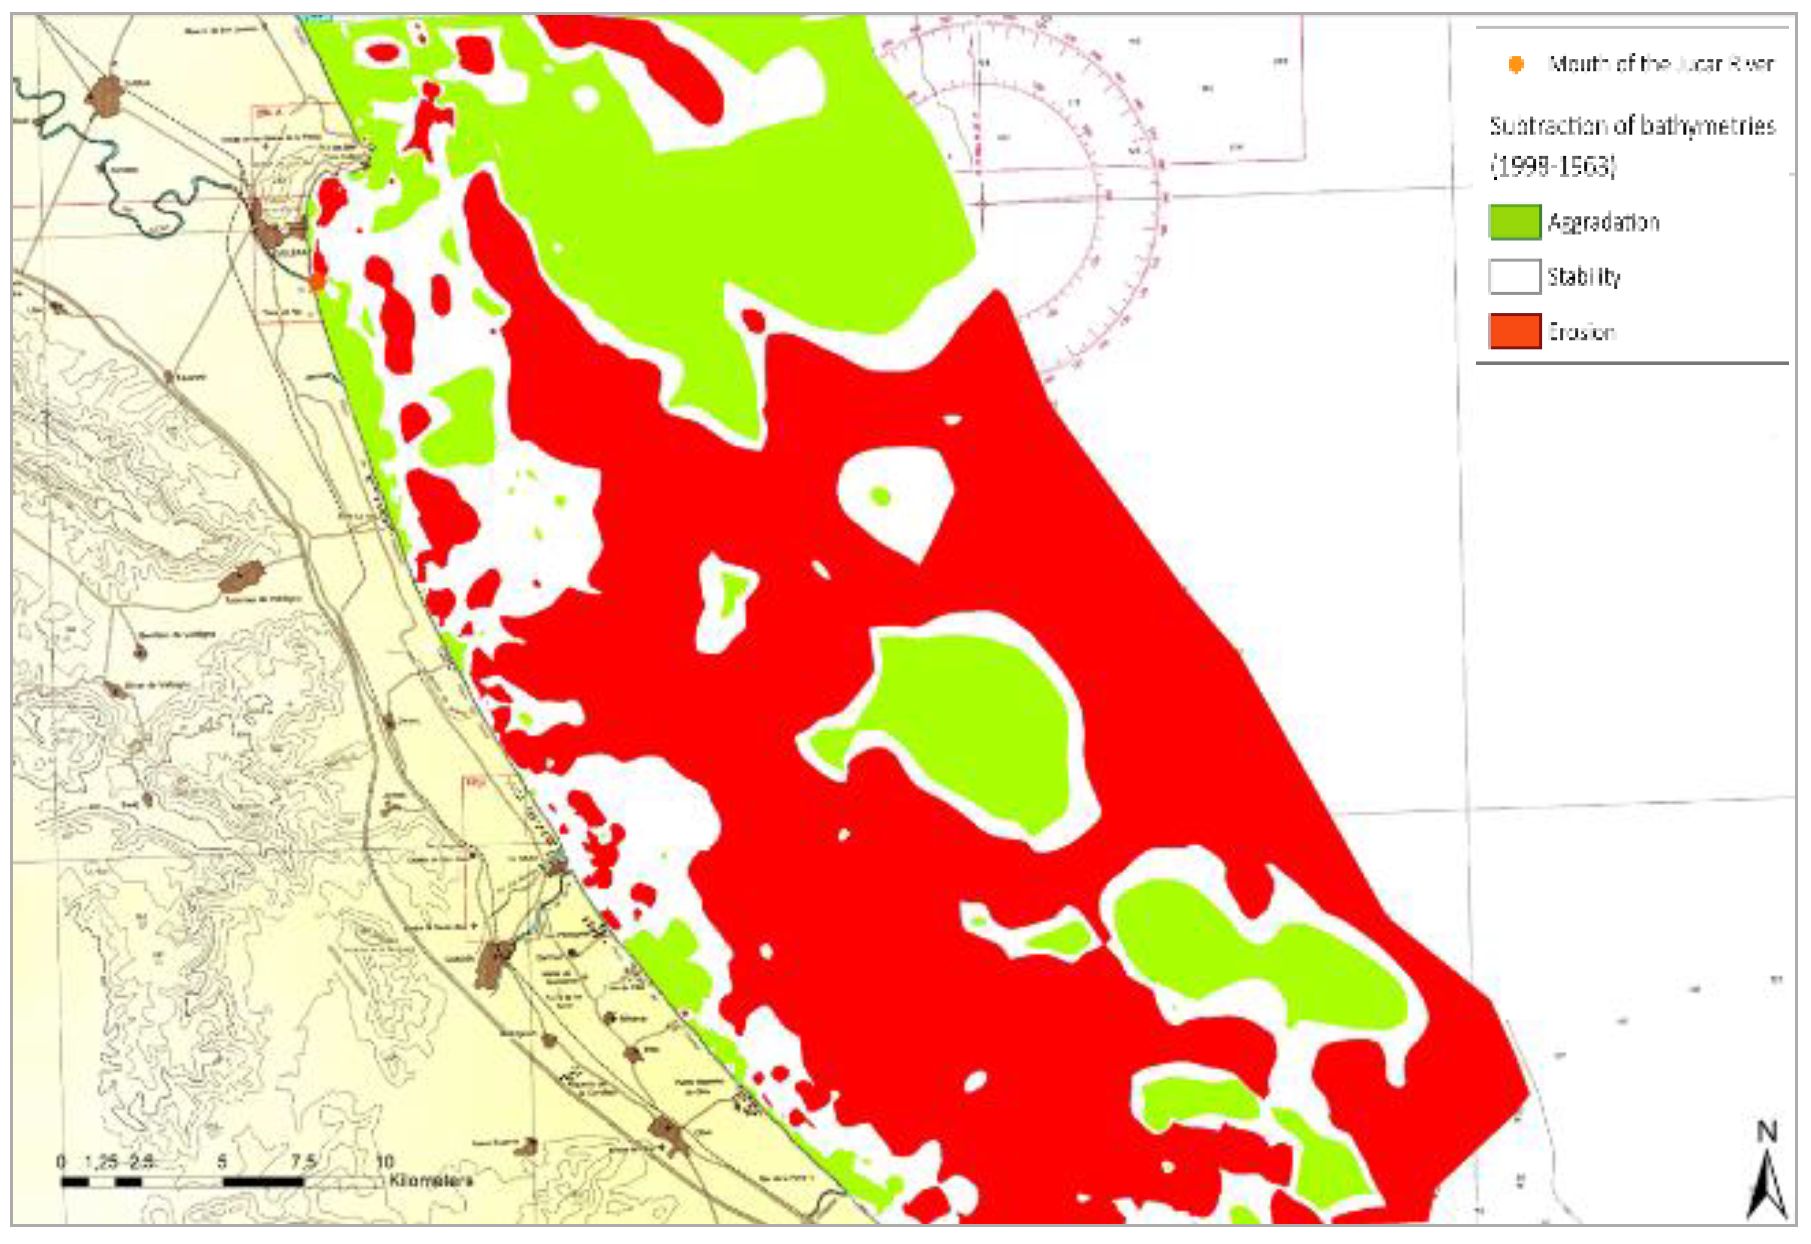
Figure 9.
Quantitative map (1998-1963).
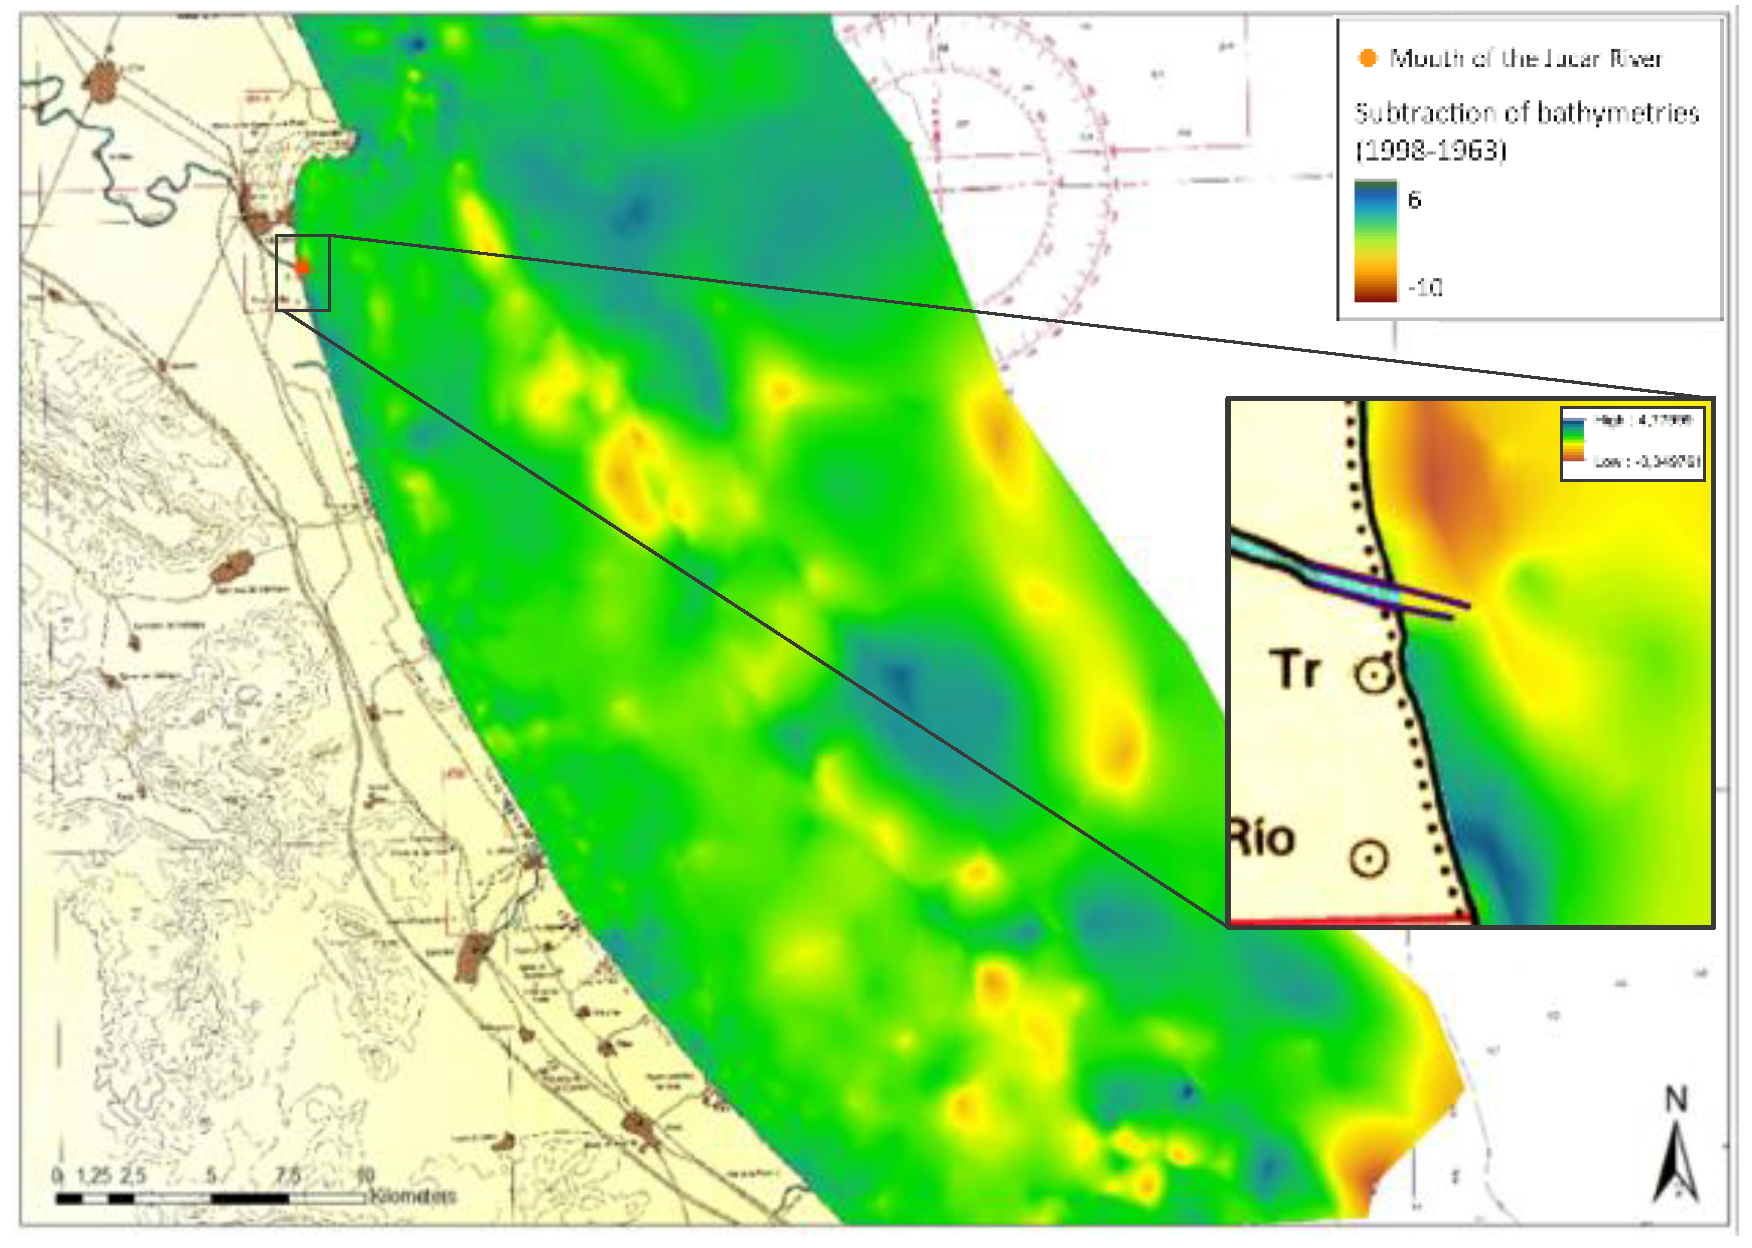
Figure 10.
Stability lobe (1998-1963).
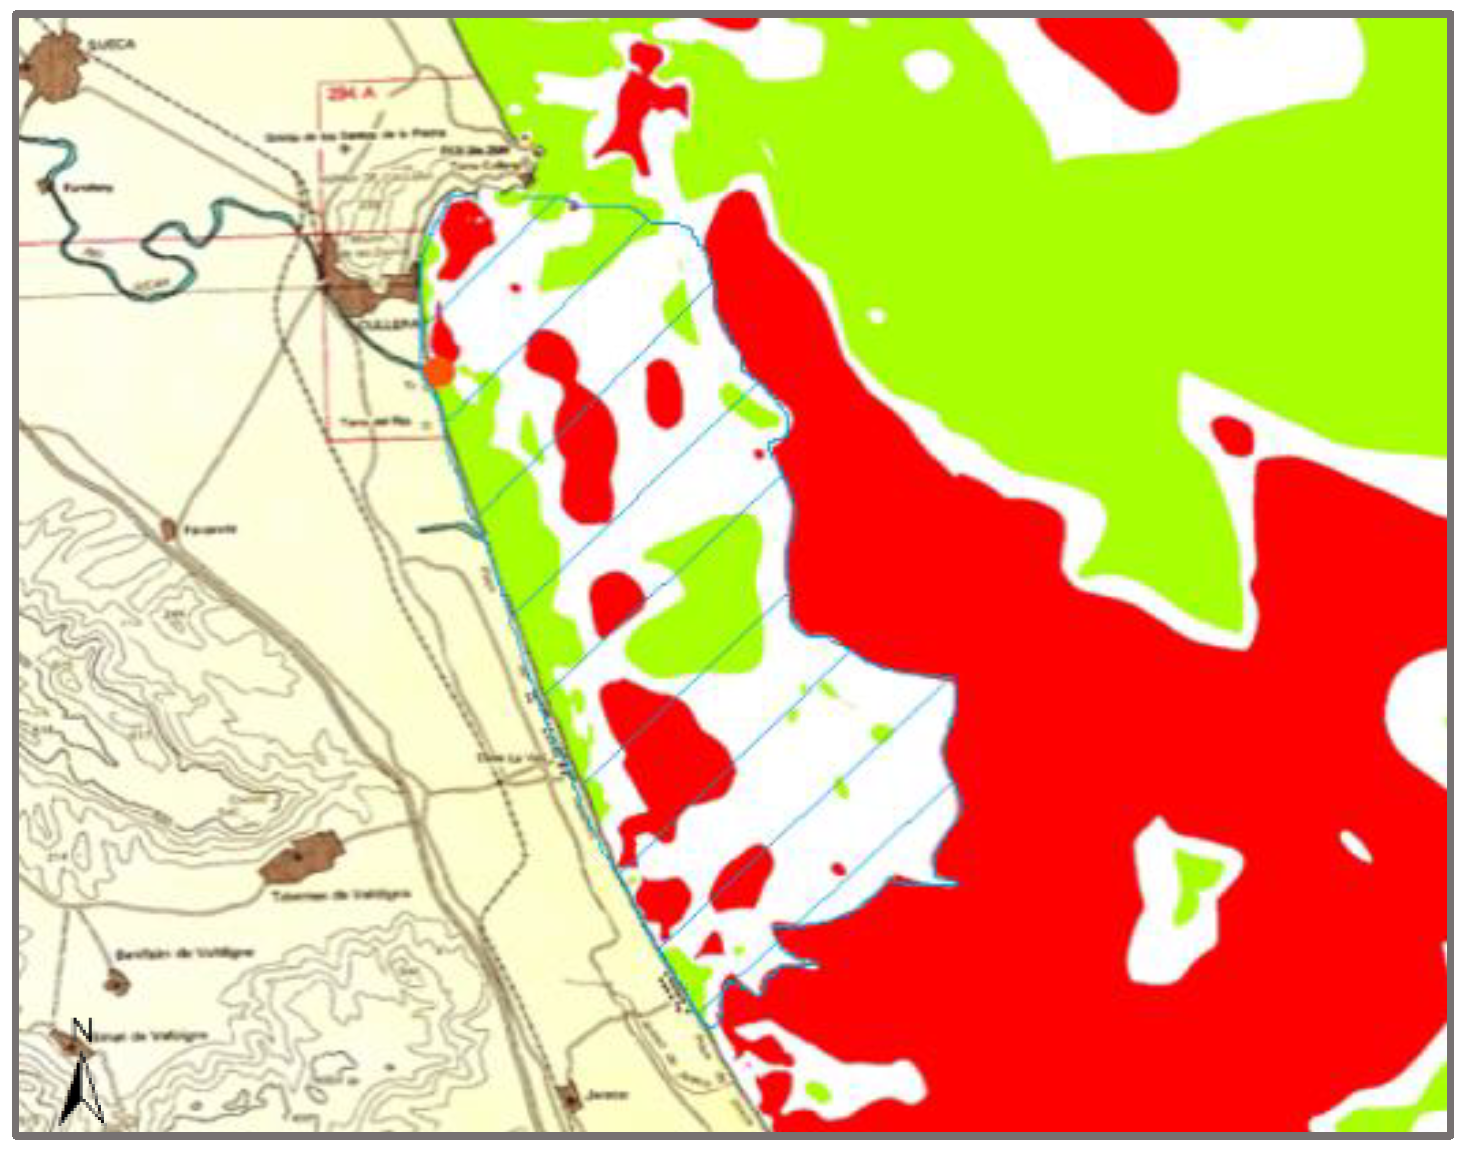
Figure 11.
Mouth of the Jucar during the 2024 DANA. [51].
Figure 11.
Mouth of the Jucar during the 2024 DANA. [51].
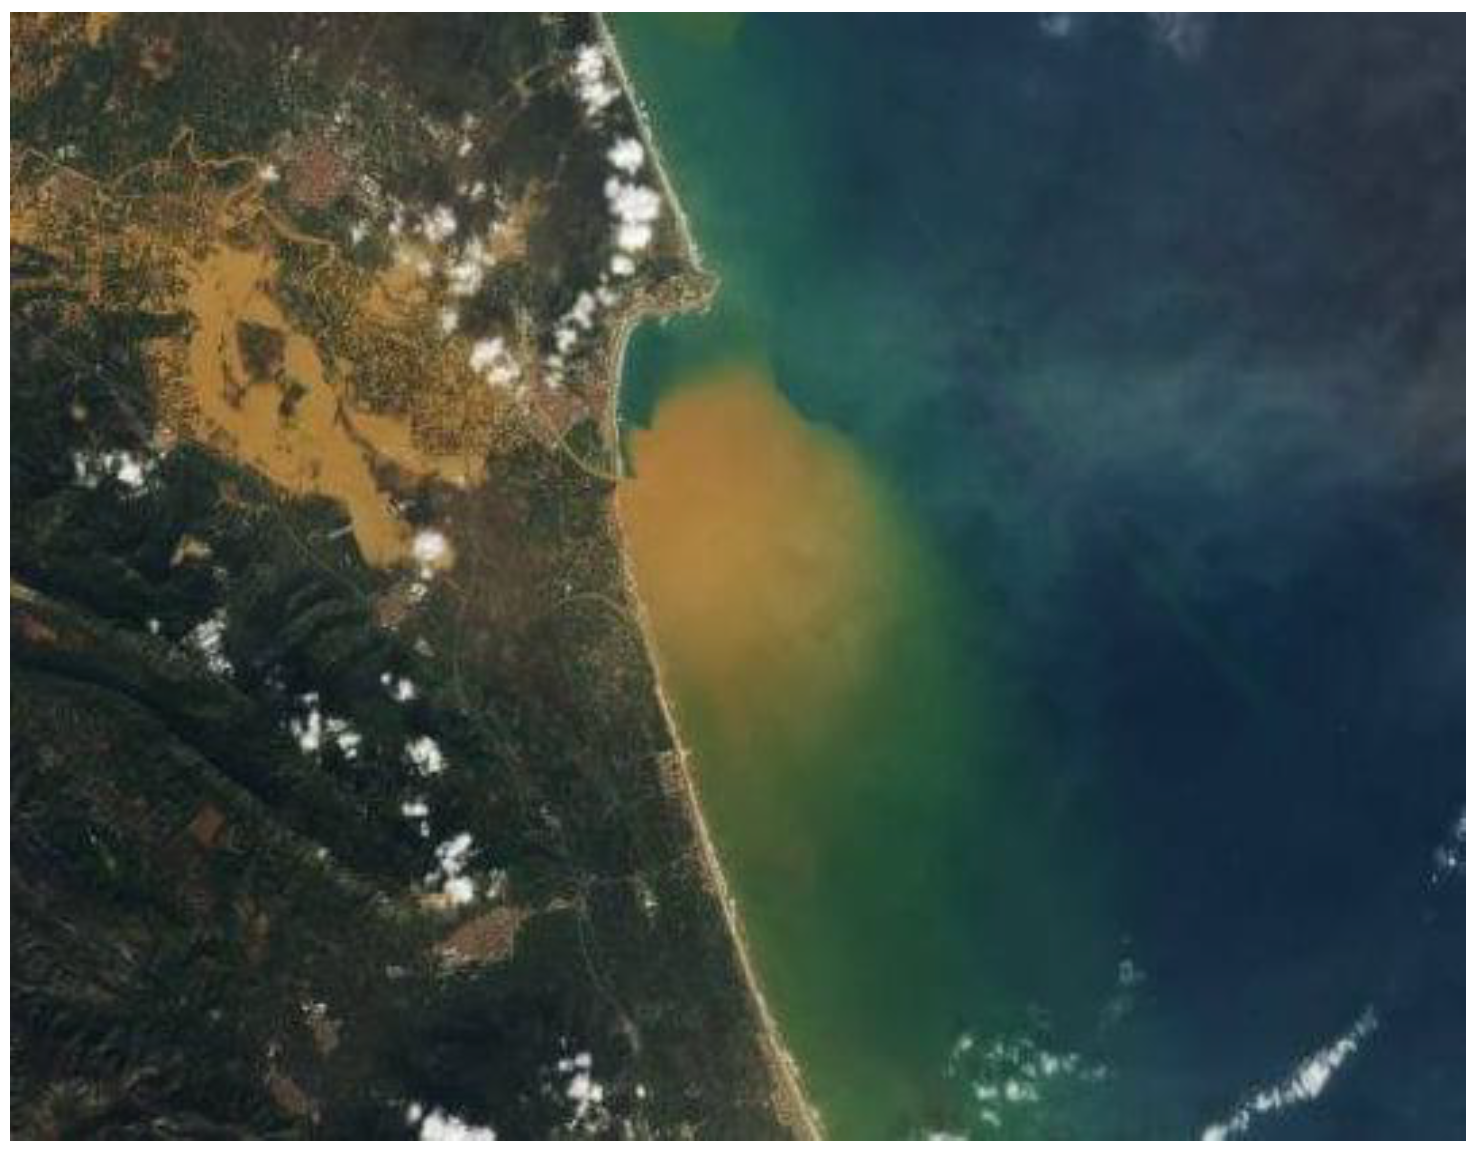
Figure 12.
Mouth of the Jucar (1998-1963).
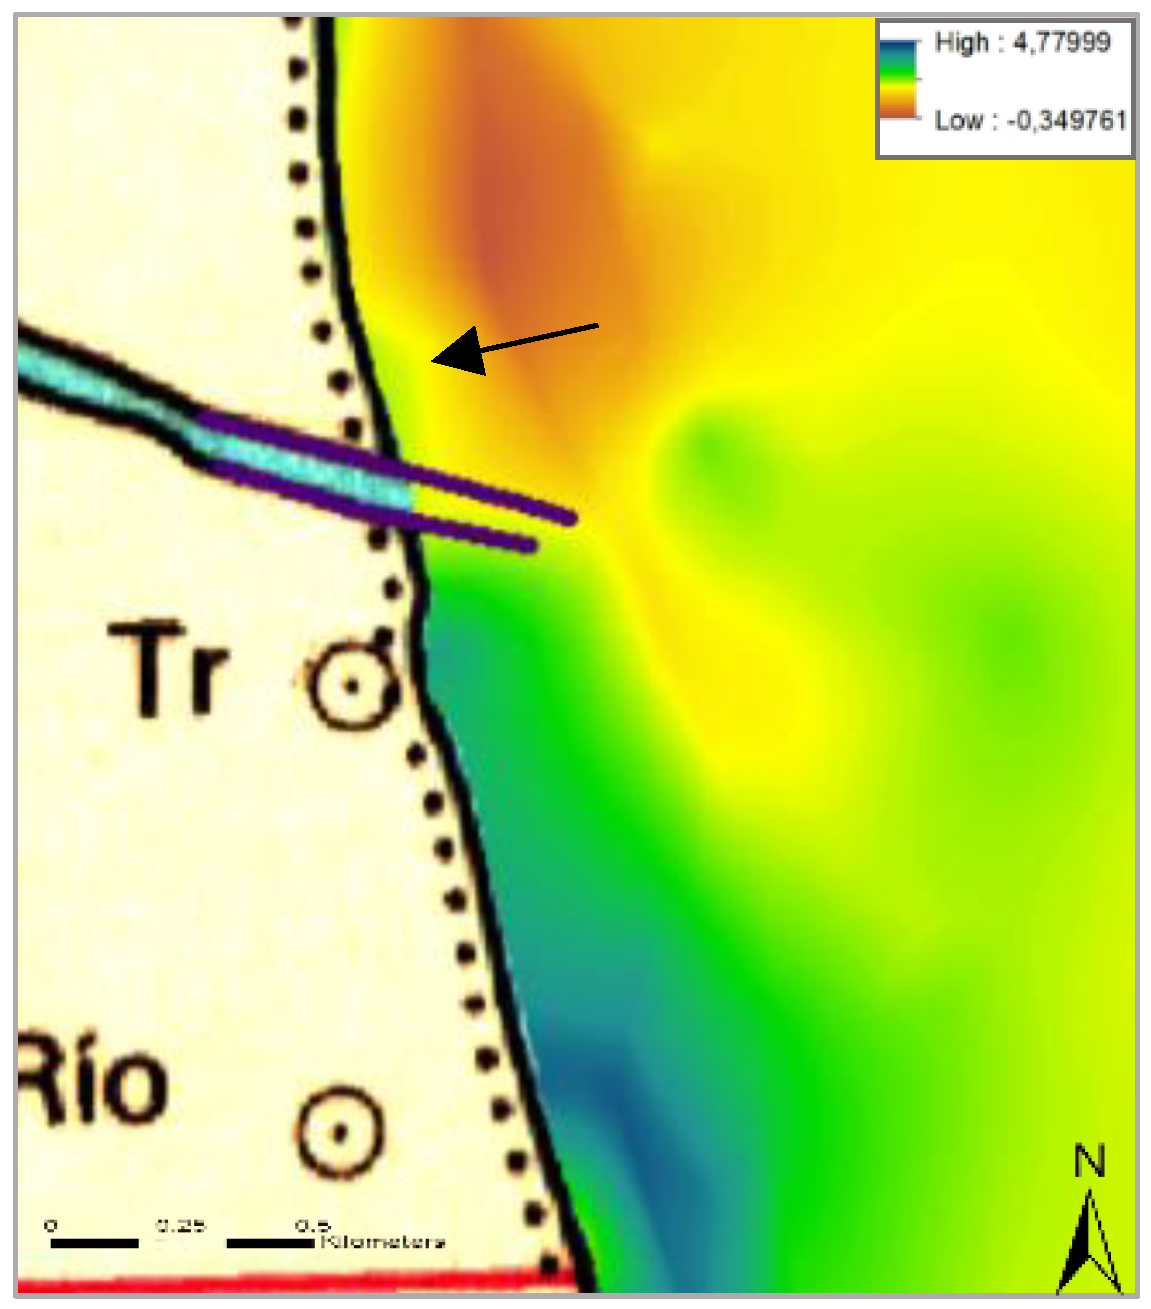
Figure 13.
Qualitative map (2002-1998).
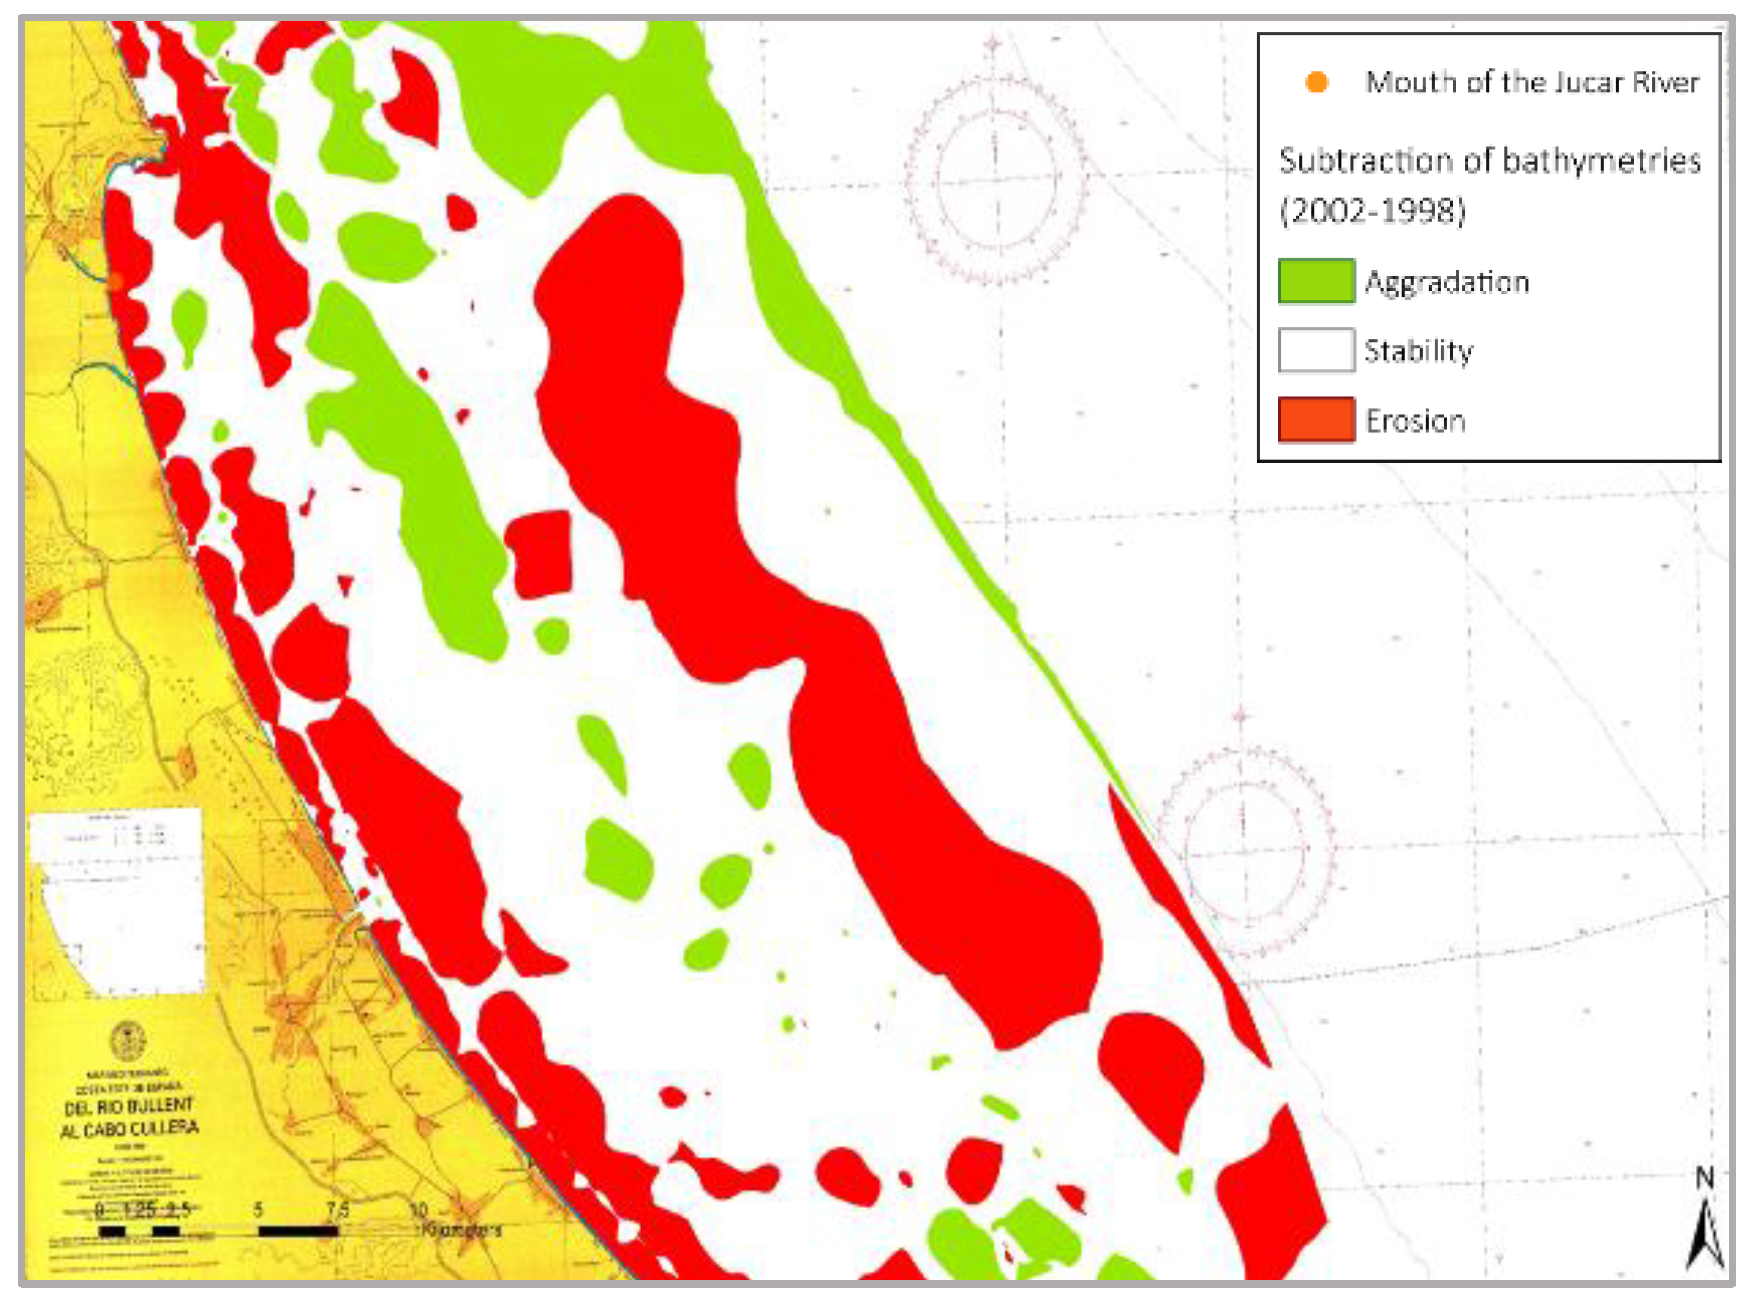
Figure 14.
Quantitative map (2002-1998).
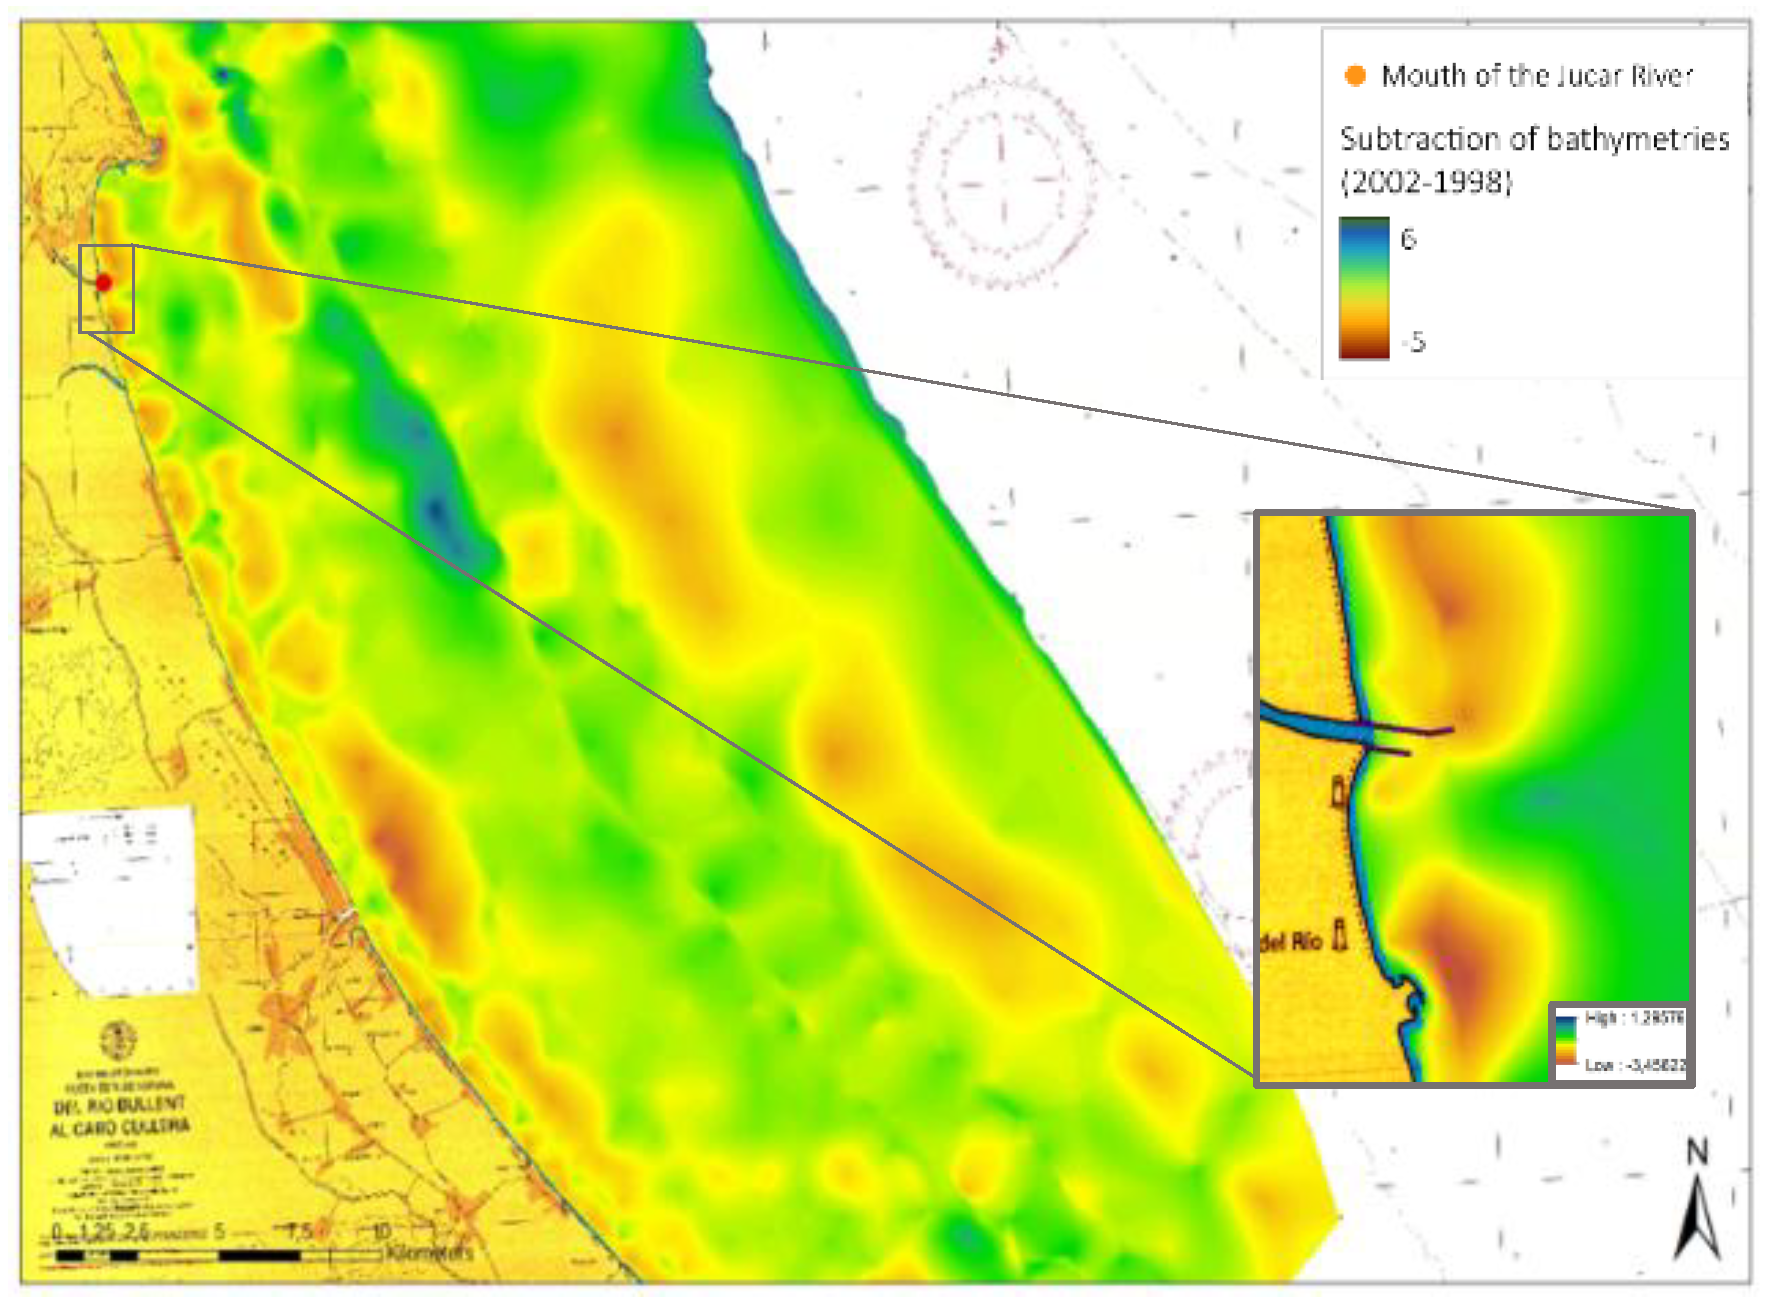
Figure 15.
Qualitative map (Present-day -2002).
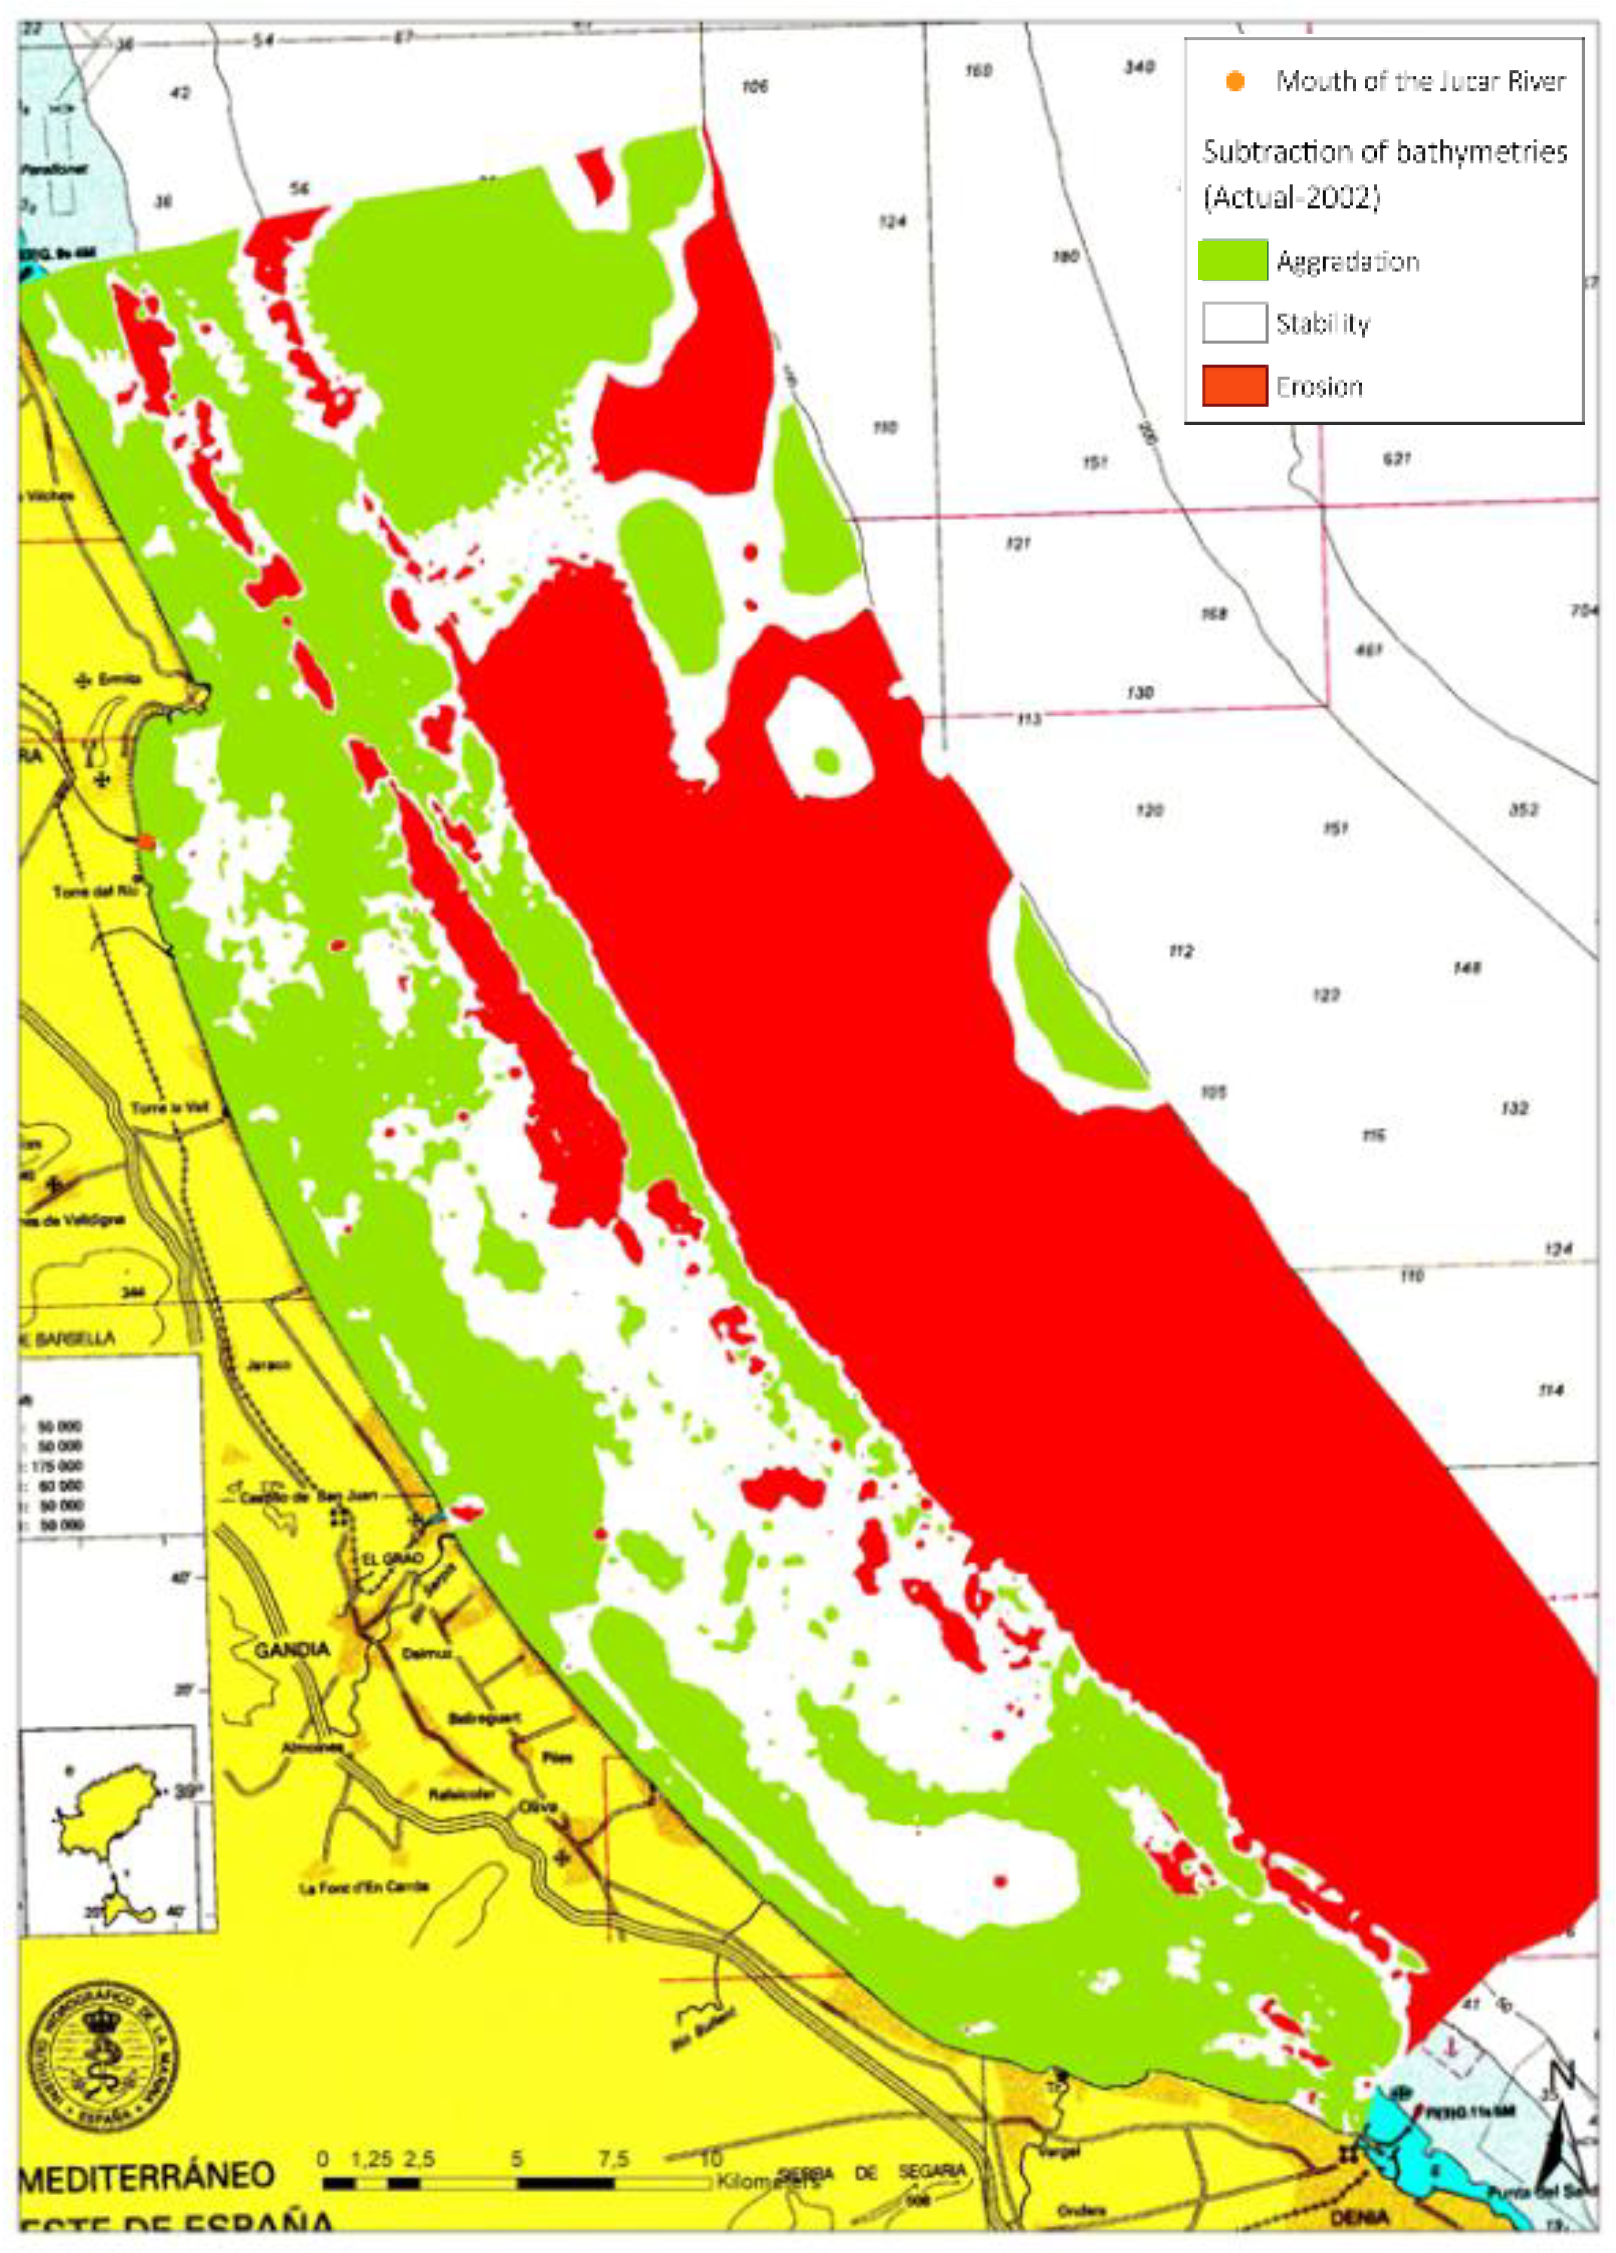
Figure 16.
Quantitative map (Present-day -2002).
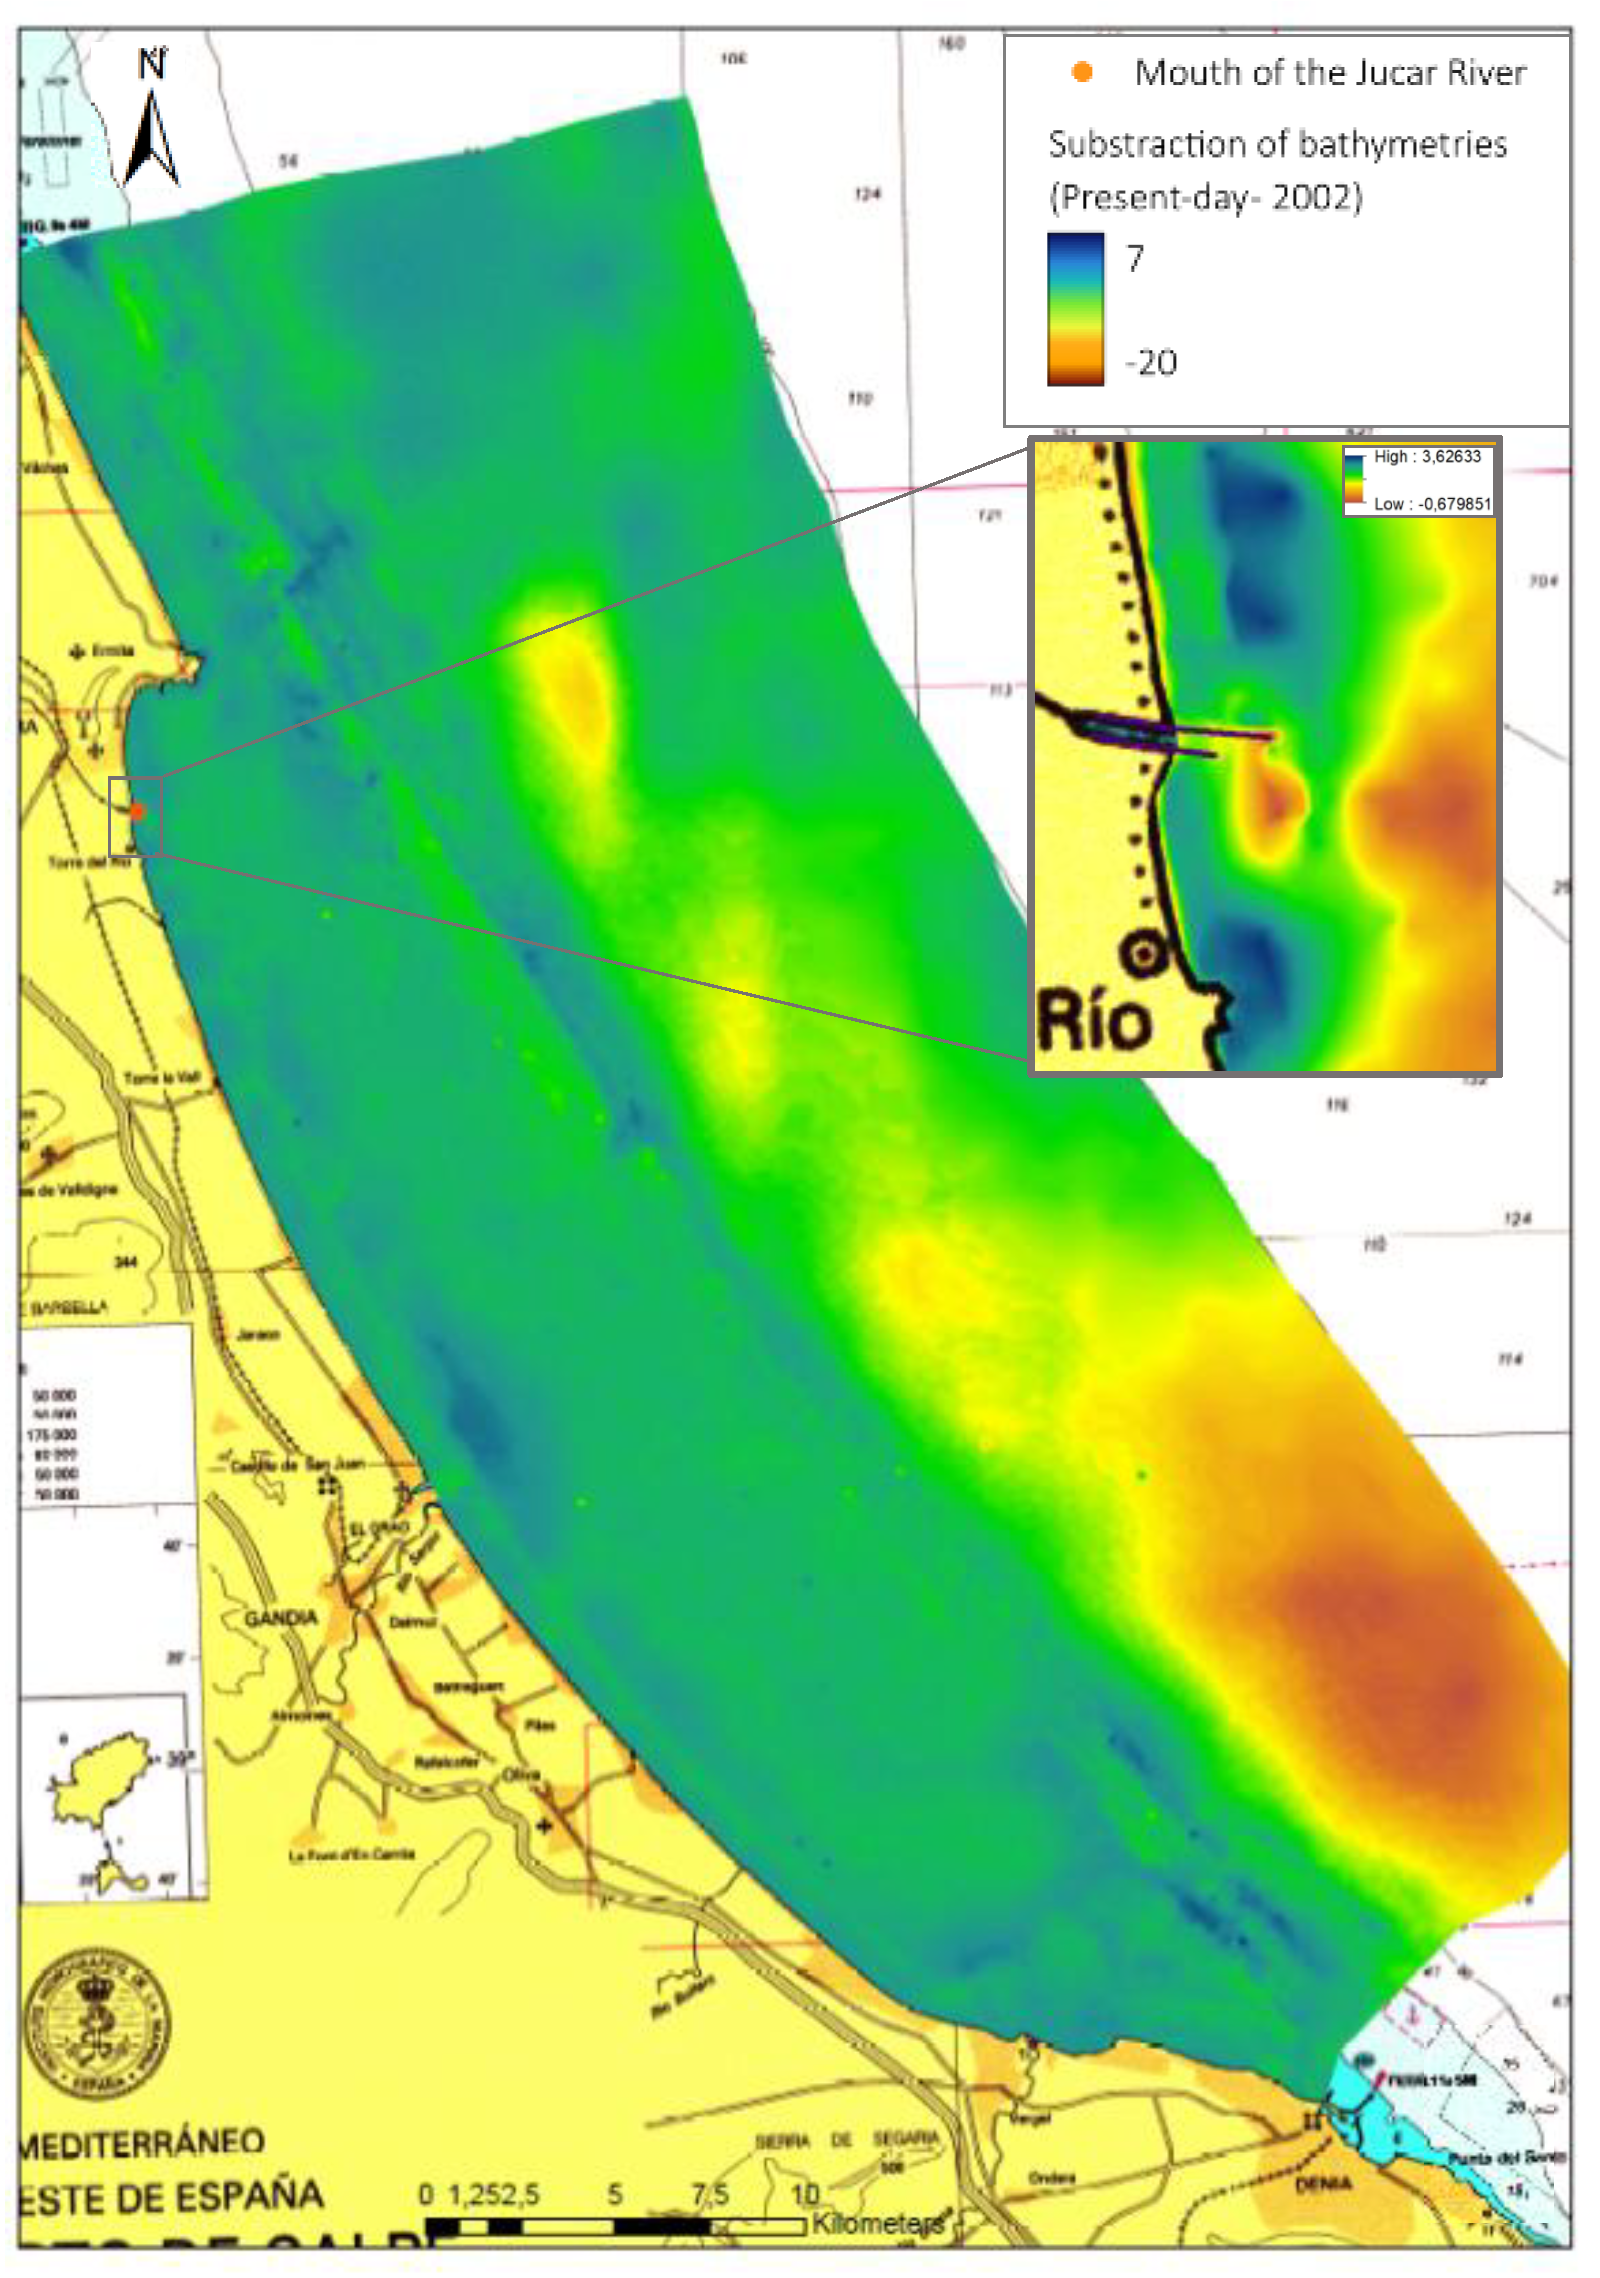
Figure 17.
Mouth of the Jucar (Present-day -2002).
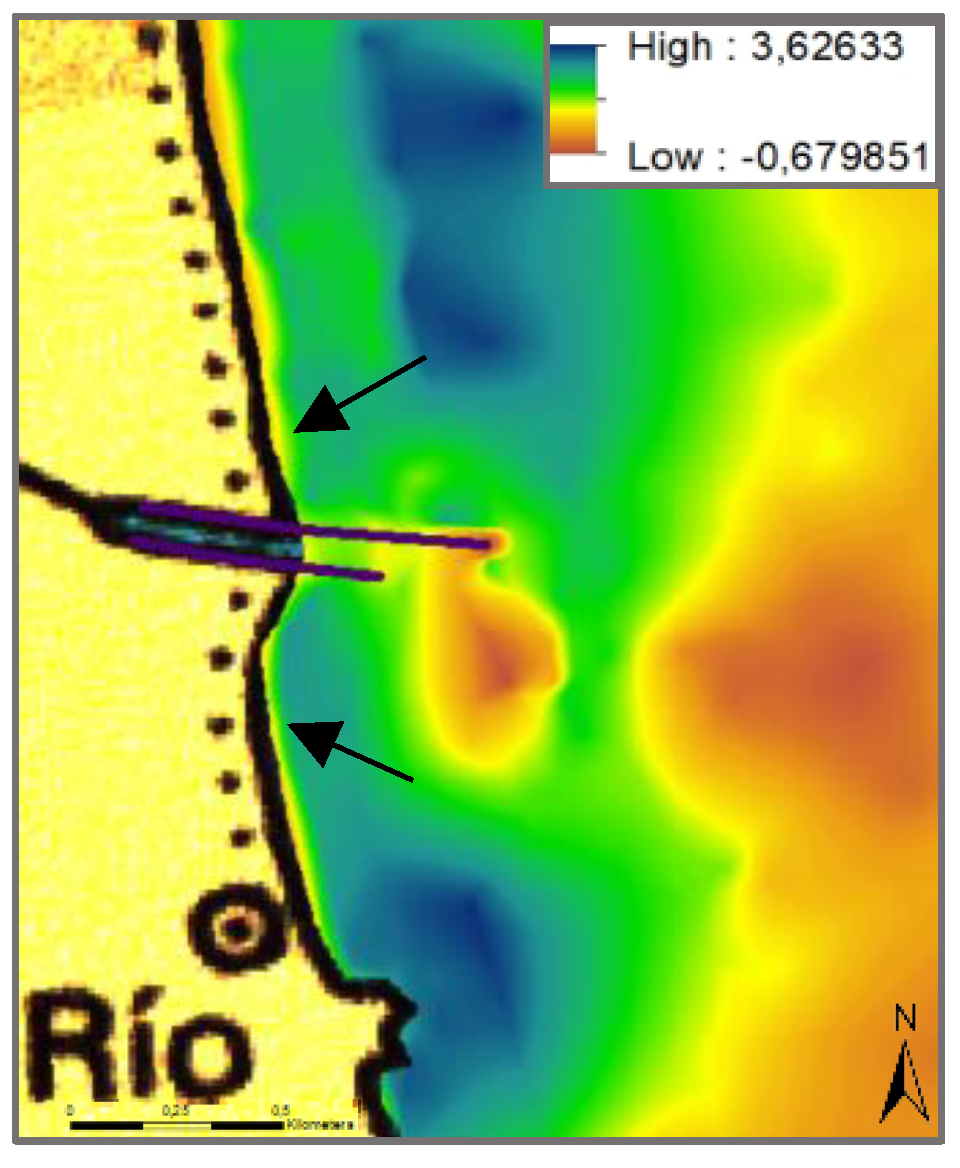
Figure 18.
Qualitative map (Present-day -1893).
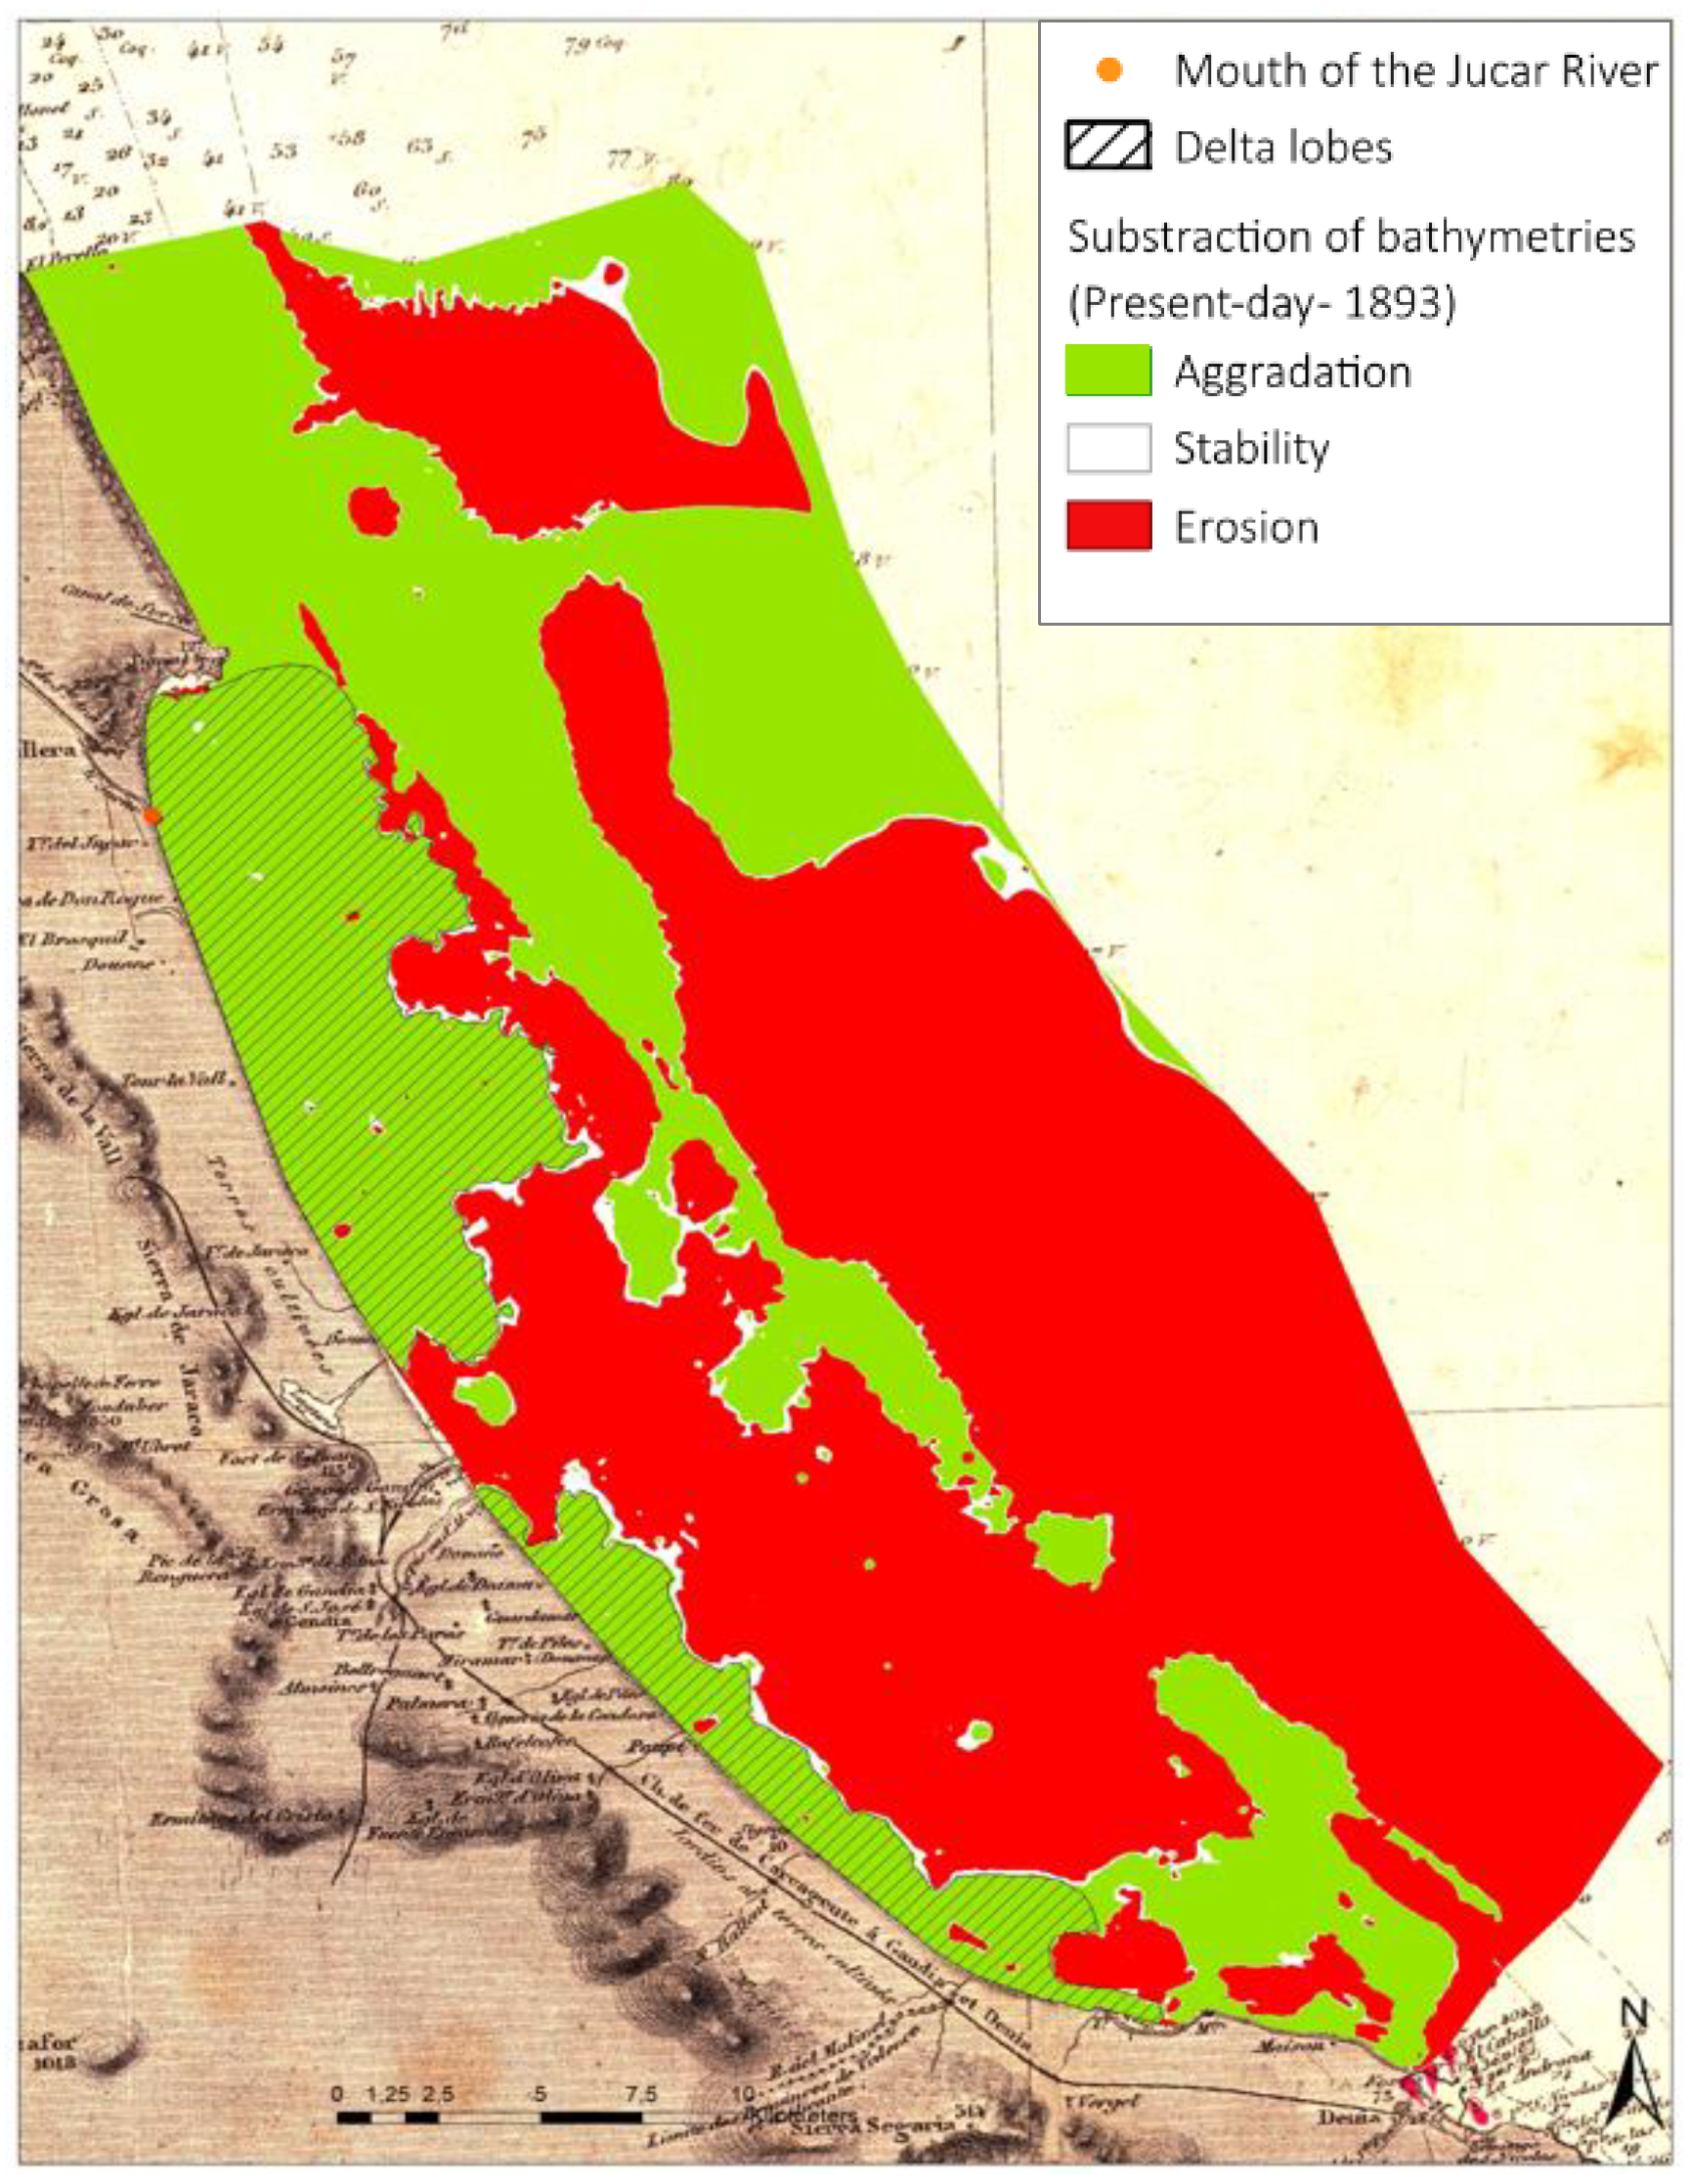
Figure 19.
Quantitative map (Present-day -1893).
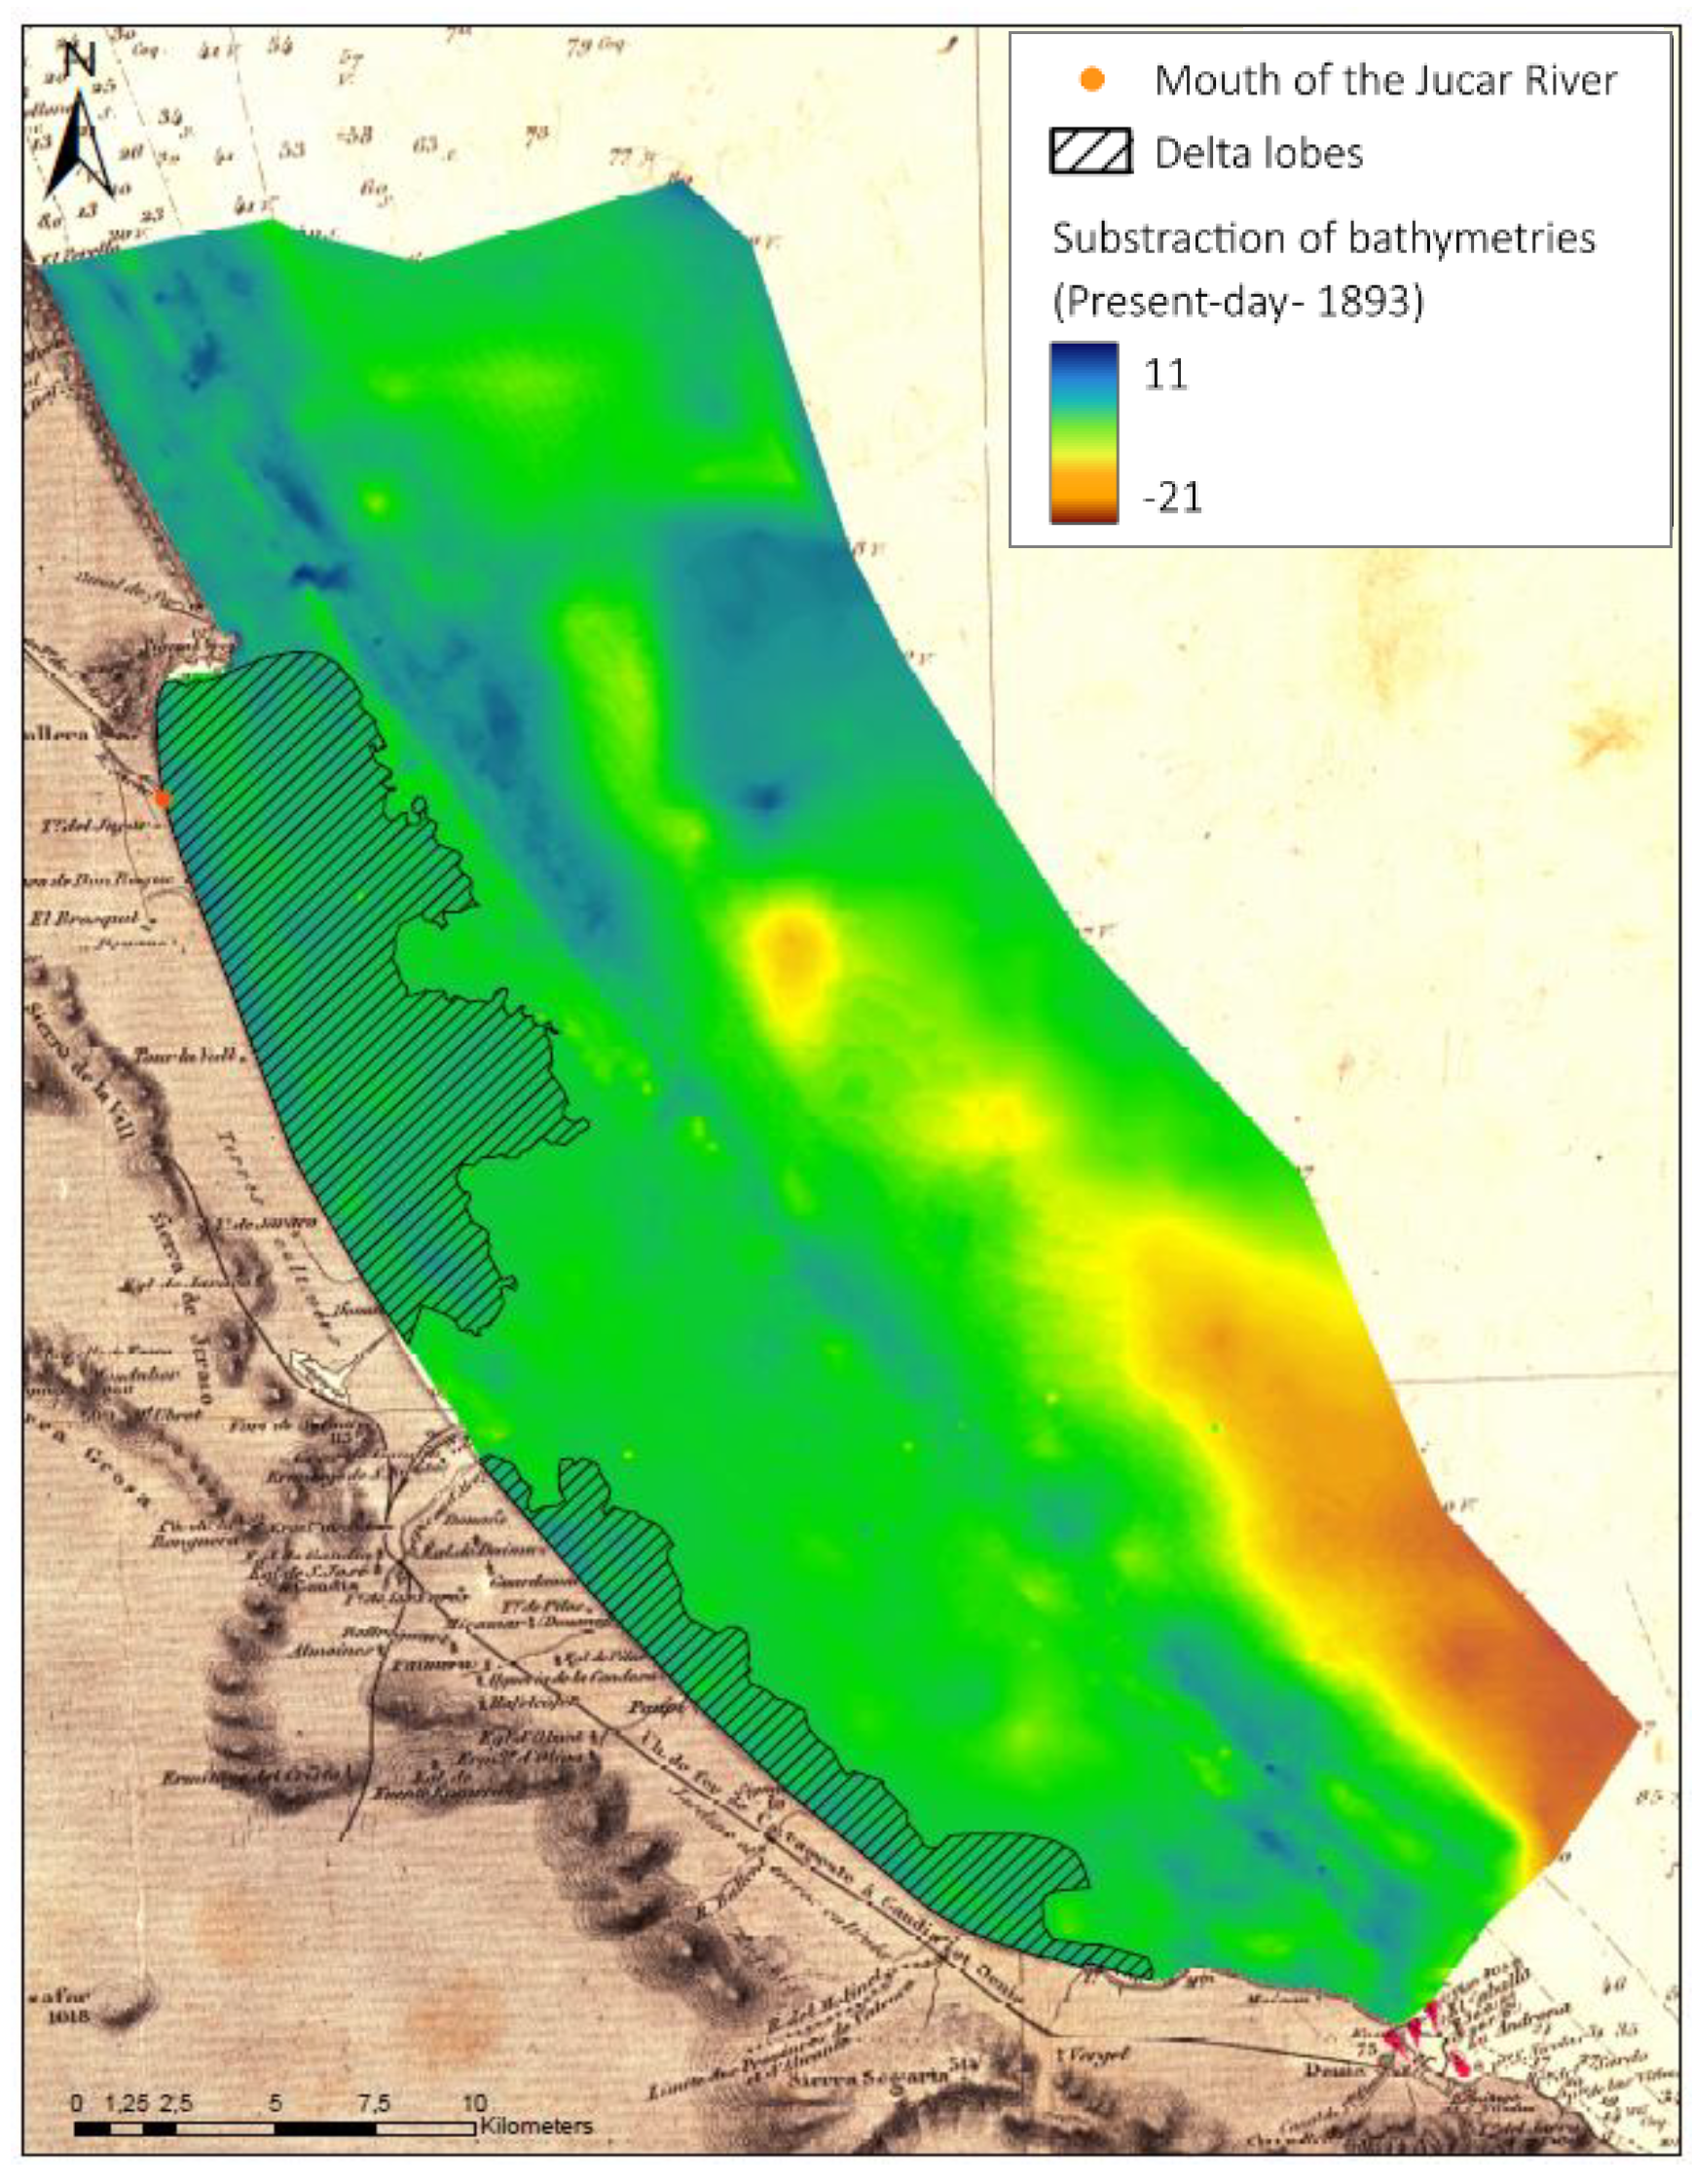
Figure 20.
Theoretical sedimentation at the mouth of a buoyancy-dominated effluent (after Wright, 1977) [1].
Figure 20.
Theoretical sedimentation at the mouth of a buoyancy-dominated effluent (after Wright, 1977) [1].
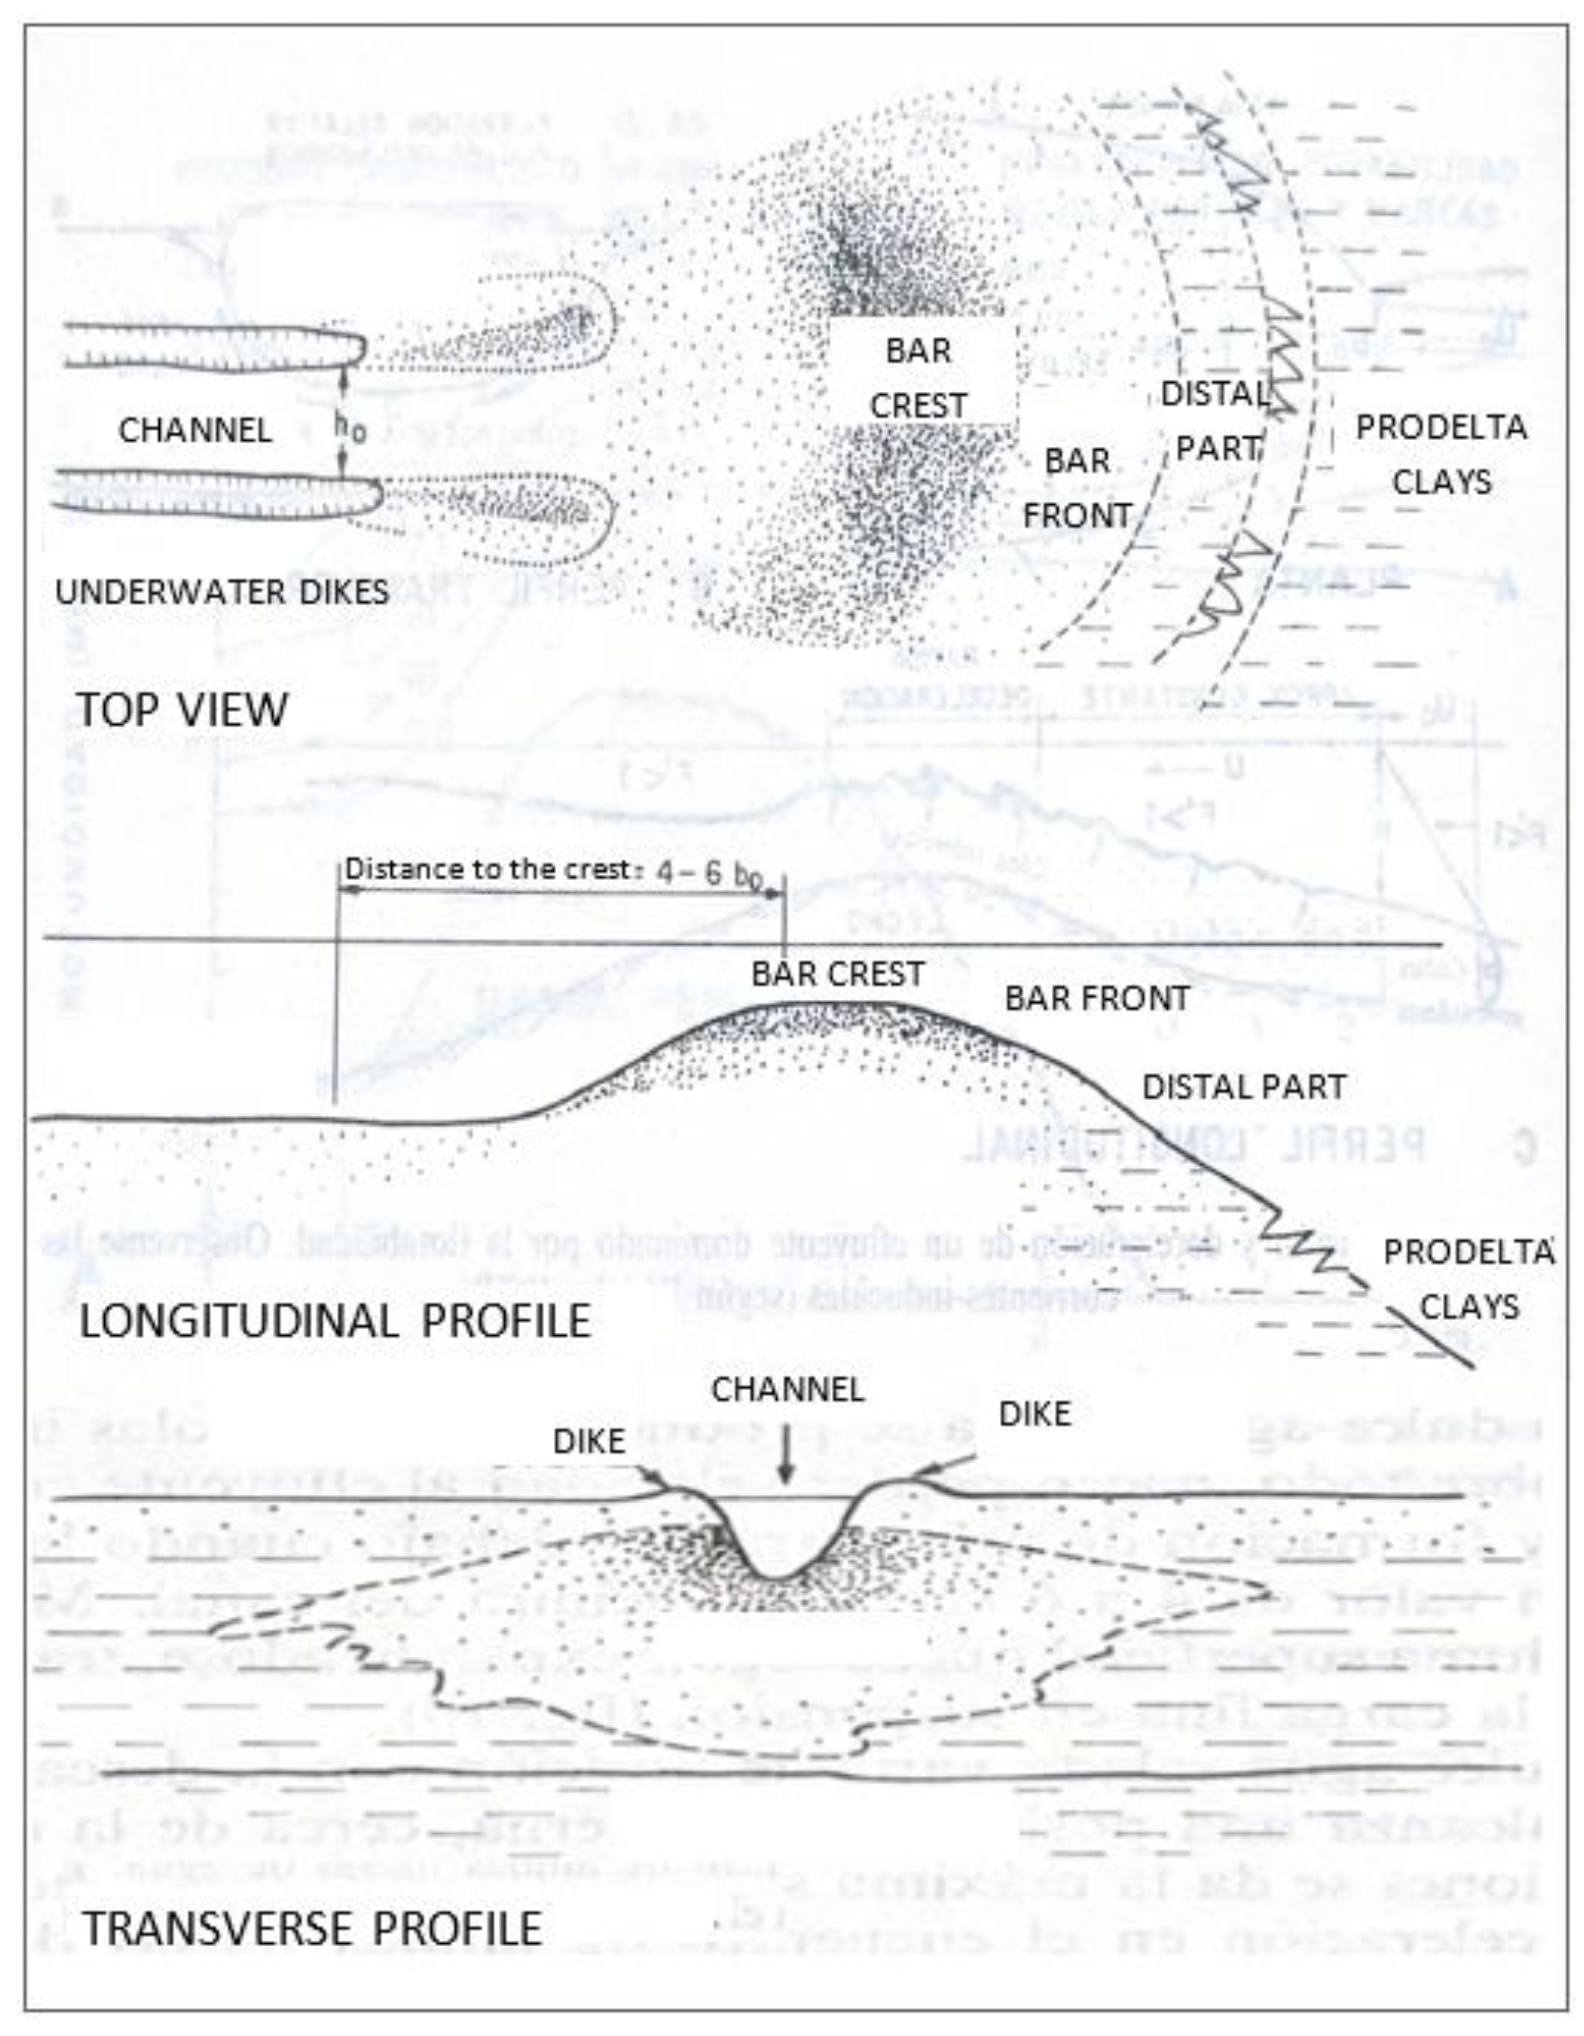
Figure 21.
Sedimentation in the mouth of Jucar River: A. Top View; B. Longitudinal Profile; C. Transverse Profile.
Figure 21.
Sedimentation in the mouth of Jucar River: A. Top View; B. Longitudinal Profile; C. Transverse Profile.
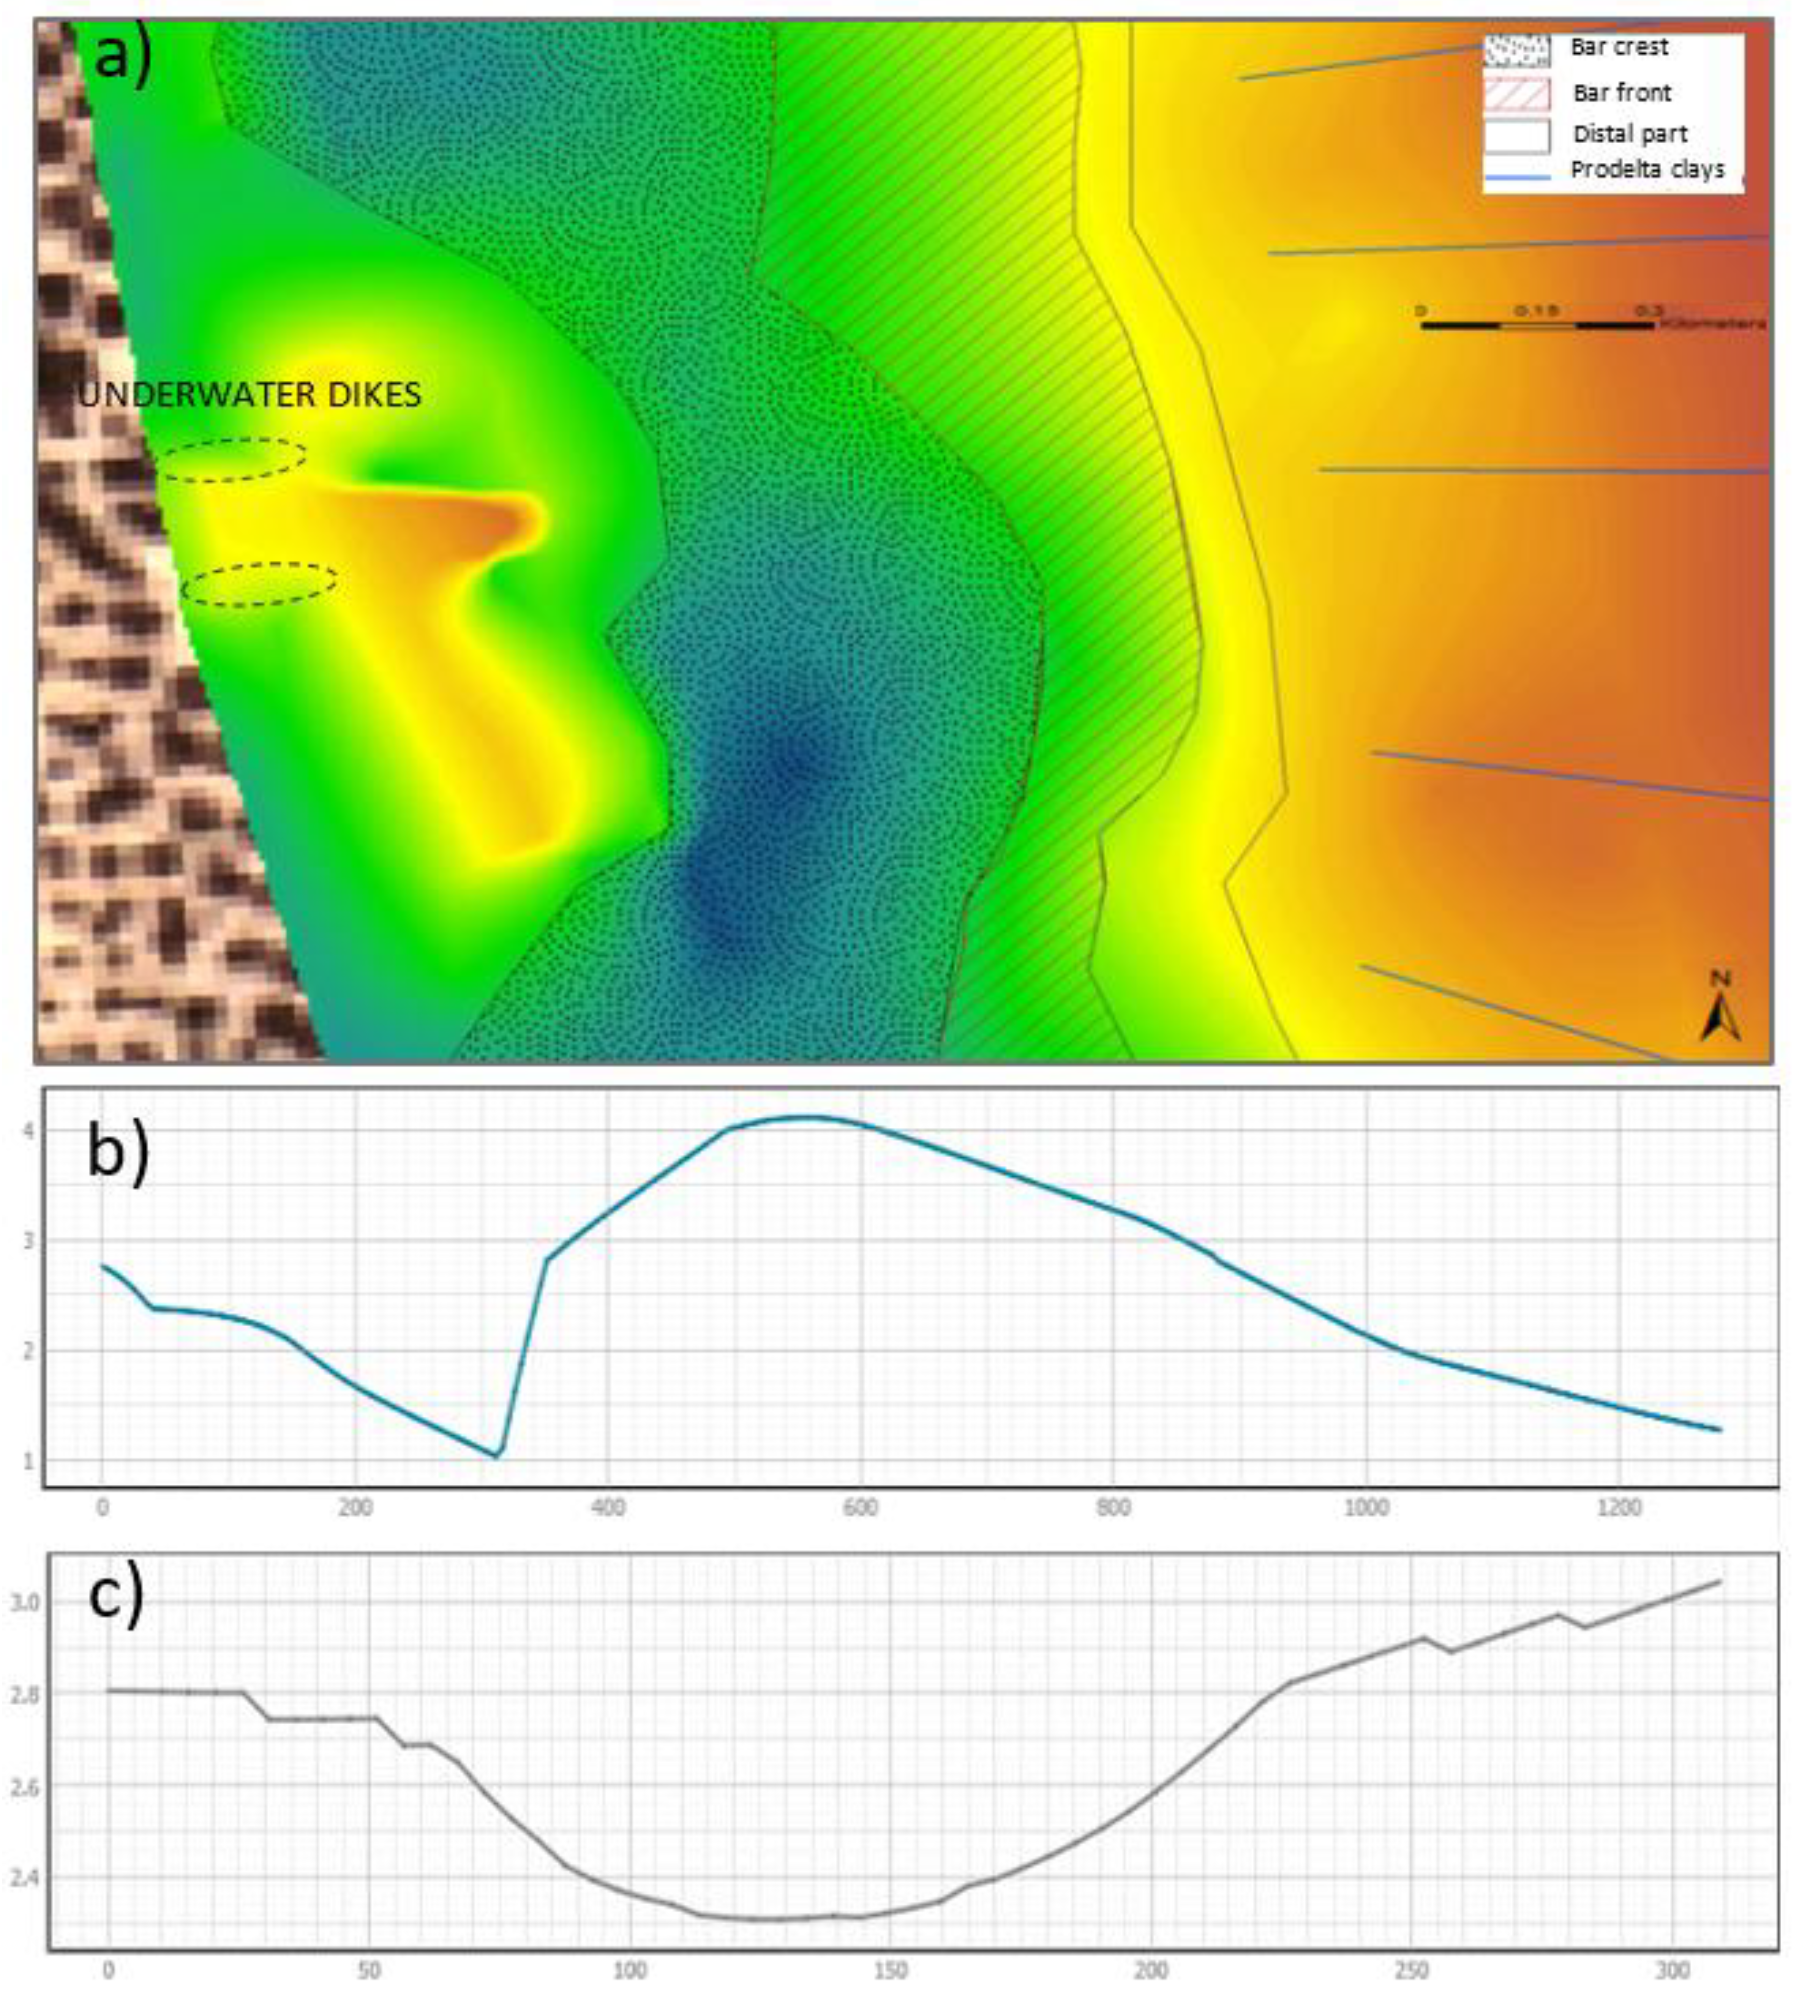

Table 1.
Nautical chart information used.
| Date | Zone | Scale | Source |
|---|---|---|---|
| 1893 | From Cartagena to Valencia. | 1:242,320 | Newspaper archive of Valencia |
| 1963 | From Cabo de San Antonio to Albufera de Valencia. | 1:97,800 | Newspaper archive of Valencia |
| 1998 | From Rio Bullent to Cabo Cullera. | 1:50,000 | Newspaper archive of Valencia |
| 2002 | From Puerto de Calpe to Puerto de Sagunto. | 1:175,000 | Newspaper archive of Valencia |
| Present-day | From Albufera of Valencia to Gandia. | 1:120,605 | Navionics |
Table 2.
Information on the georeferencing of the charts.
| Nautical Chart | Number of geo-referencing point | RMS |
|---|---|---|
| 1893 | 20 | 32.9799 m |
| 1963 | 20 | 27.5031 m |
| 1998 | 20 | 29.8384 m |
| 2002 | 20 | 29.0119 m |
Table 3.
Number of items used for the digitization of nautical charts.
| Nautical Chart | Number of digitized items |
|---|---|
| 1893 | 24,654 |
| 1963 | 40,818 |
| 1998 | 28,992 |
| 2002 | 31,214 |
| Present-day | 139,324 |
Disclaimer/Publisher’s Note: The statements, opinions and data contained in all publications are solely those of the individual author(s) and contributor(s) and not of MDPI and/or the editor(s). MDPI and/or the editor(s) disclaim responsibility for any injury to people or property resulting from any ideas, methods, instructions or products referred to in the content. |
© 2025 by the authors. Licensee MDPI, Basel, Switzerland. This article is an open access article distributed under the terms and conditions of the Creative Commons Attribution (CC BY) license (http://creativecommons.org/licenses/by/4.0/).
Copyright: This open access article is published under a Creative Commons CC BY 4.0 license, which permit the free download, distribution, and reuse, provided that the author and preprint are cited in any reuse.


