1. Introduction
Hematopoietic stem cells (HSCs) possess capacity for self-renewal and to produce progenitors committed to differentiation into diverse blood cell lineages, including erythrocytes, leukocytes, lymphocytes, and platelets, and their proliferation and differentiation within hematopoietic tissue is regulated by the bone marrow microenvironment (1-3). Stromal cells are distinct from hematopoietic ones and are an essential component of this microenvironment. These cells are necessary for the long-term maintenance of HSCs in vitro (4-6). Several studies showed that the bone marrow stromal cells regulate the HSC proliferation and differentiation by producing growth factors, extracellular matrix, and physical cell–cell interactions through adhesion molecules and gap junction-mediated cell communication (1, 6-12). Furthermore, the physiological function of the stromal cells requires an anatomically appropriate three-dimensional (3D) orientation to determine the HSC’s fate, which is linked to a normal and/or dysfunctional hematopoietic system (10, 13-16). The action of the marrow stromal cells to the leukemic cell proliferation, as well as that of the normal hematopoietic cells, has been reported. The growth of multiple myeloma cells is also strongly related to the stromal cells in their growth (17). In addition, the stromal cells likely protect the leukemic cells from the effects of cytotoxic anticancer agents (18, 19). However, the mechanism of the stromal cells for regulating the HSC proliferation and differentiation was not well known. Furthermore, the growth regulatory and protective action for the leukemic cells by the stromal cells was not elucidated at all.
We recently developed novel polymer particles with grafted epoxy polymer chains to support cell immobilization in a new 3D cell cultivation system (20-22). The base polymer particles were synthesized by the suspension polymerization of acrylic monomer and 2,2′-azobis[N-(2-propenyl)-2-methylpropionamide]. The epoxy polymer chain was extended from the particle surface through graft polymerization. An advantage of these particles is that their particle size, length and number of chains, and base polymer composition can be easily manipulated. Normal hematopoiesis is maintained in our 3D culture system, including the prolongation of the hematopoietic stem cell proliferation and differentiation (20). In addition, the bone marrow stromal cells in the 3D culture alter the growth of the leukemic cells and protect them from the cytocidal action of anticancer agents (23).
In this study, two different 3D culture systems were constructed using two different stromal cells, namely, MS-5 and Tst-4, to examine their peculiar functions. The Tst-4 cells promote the B-cell differentiation (24, 25); and the MS-5 cells support murine and human HSC proliferation and differentiation and regulate the growth of leukemic cells in vitro (20, 26, 27). The MM1.S cells derived from a patient with multiple myeloma were used as the target hematopoietic cell (28). The MM1.S cells were cocultured with MS-5 or Tst-4 stromal cells in a 3D or two-dimensional (2D) culture to assess their action on MM1.S cell proliferation. The mouse-origin MS-5 and Tst-4 cells and human-origin MM1.S cells were identified using a specific antibody for human and murine specific cell surface marker from the pool of 3D and 2D cocultured cells (23).
A novel proteasome inhibitor, bortezomib, has been developed as an anticancer agent and widely used against multiple myeloma (29, 30). However, in these patients, the curative effect of bortezomib is limited to in vivo and in vitro settings (31-34), whereas the reason for treatment resistance in them remains unclear. This study examined the effect of bortezomib on MM1.S cells using a 3D coculture approach with stromal cells. The rationale of this study, primarily, was to unravel the effect of MS-5 and Tst-4 stromal cells’ presence on the growth of MM1.S cells with or without bortezomib treatment, and secondly, to determine whether or not it could reproduce an in vivo drug effect, by employing a 3D in vitro coculture system.
2. Results
2.1. Growth Patterns of MM1.S Cells Cocultured with MS-5 and Tst-4 in 2D and 3D Culture Constructs
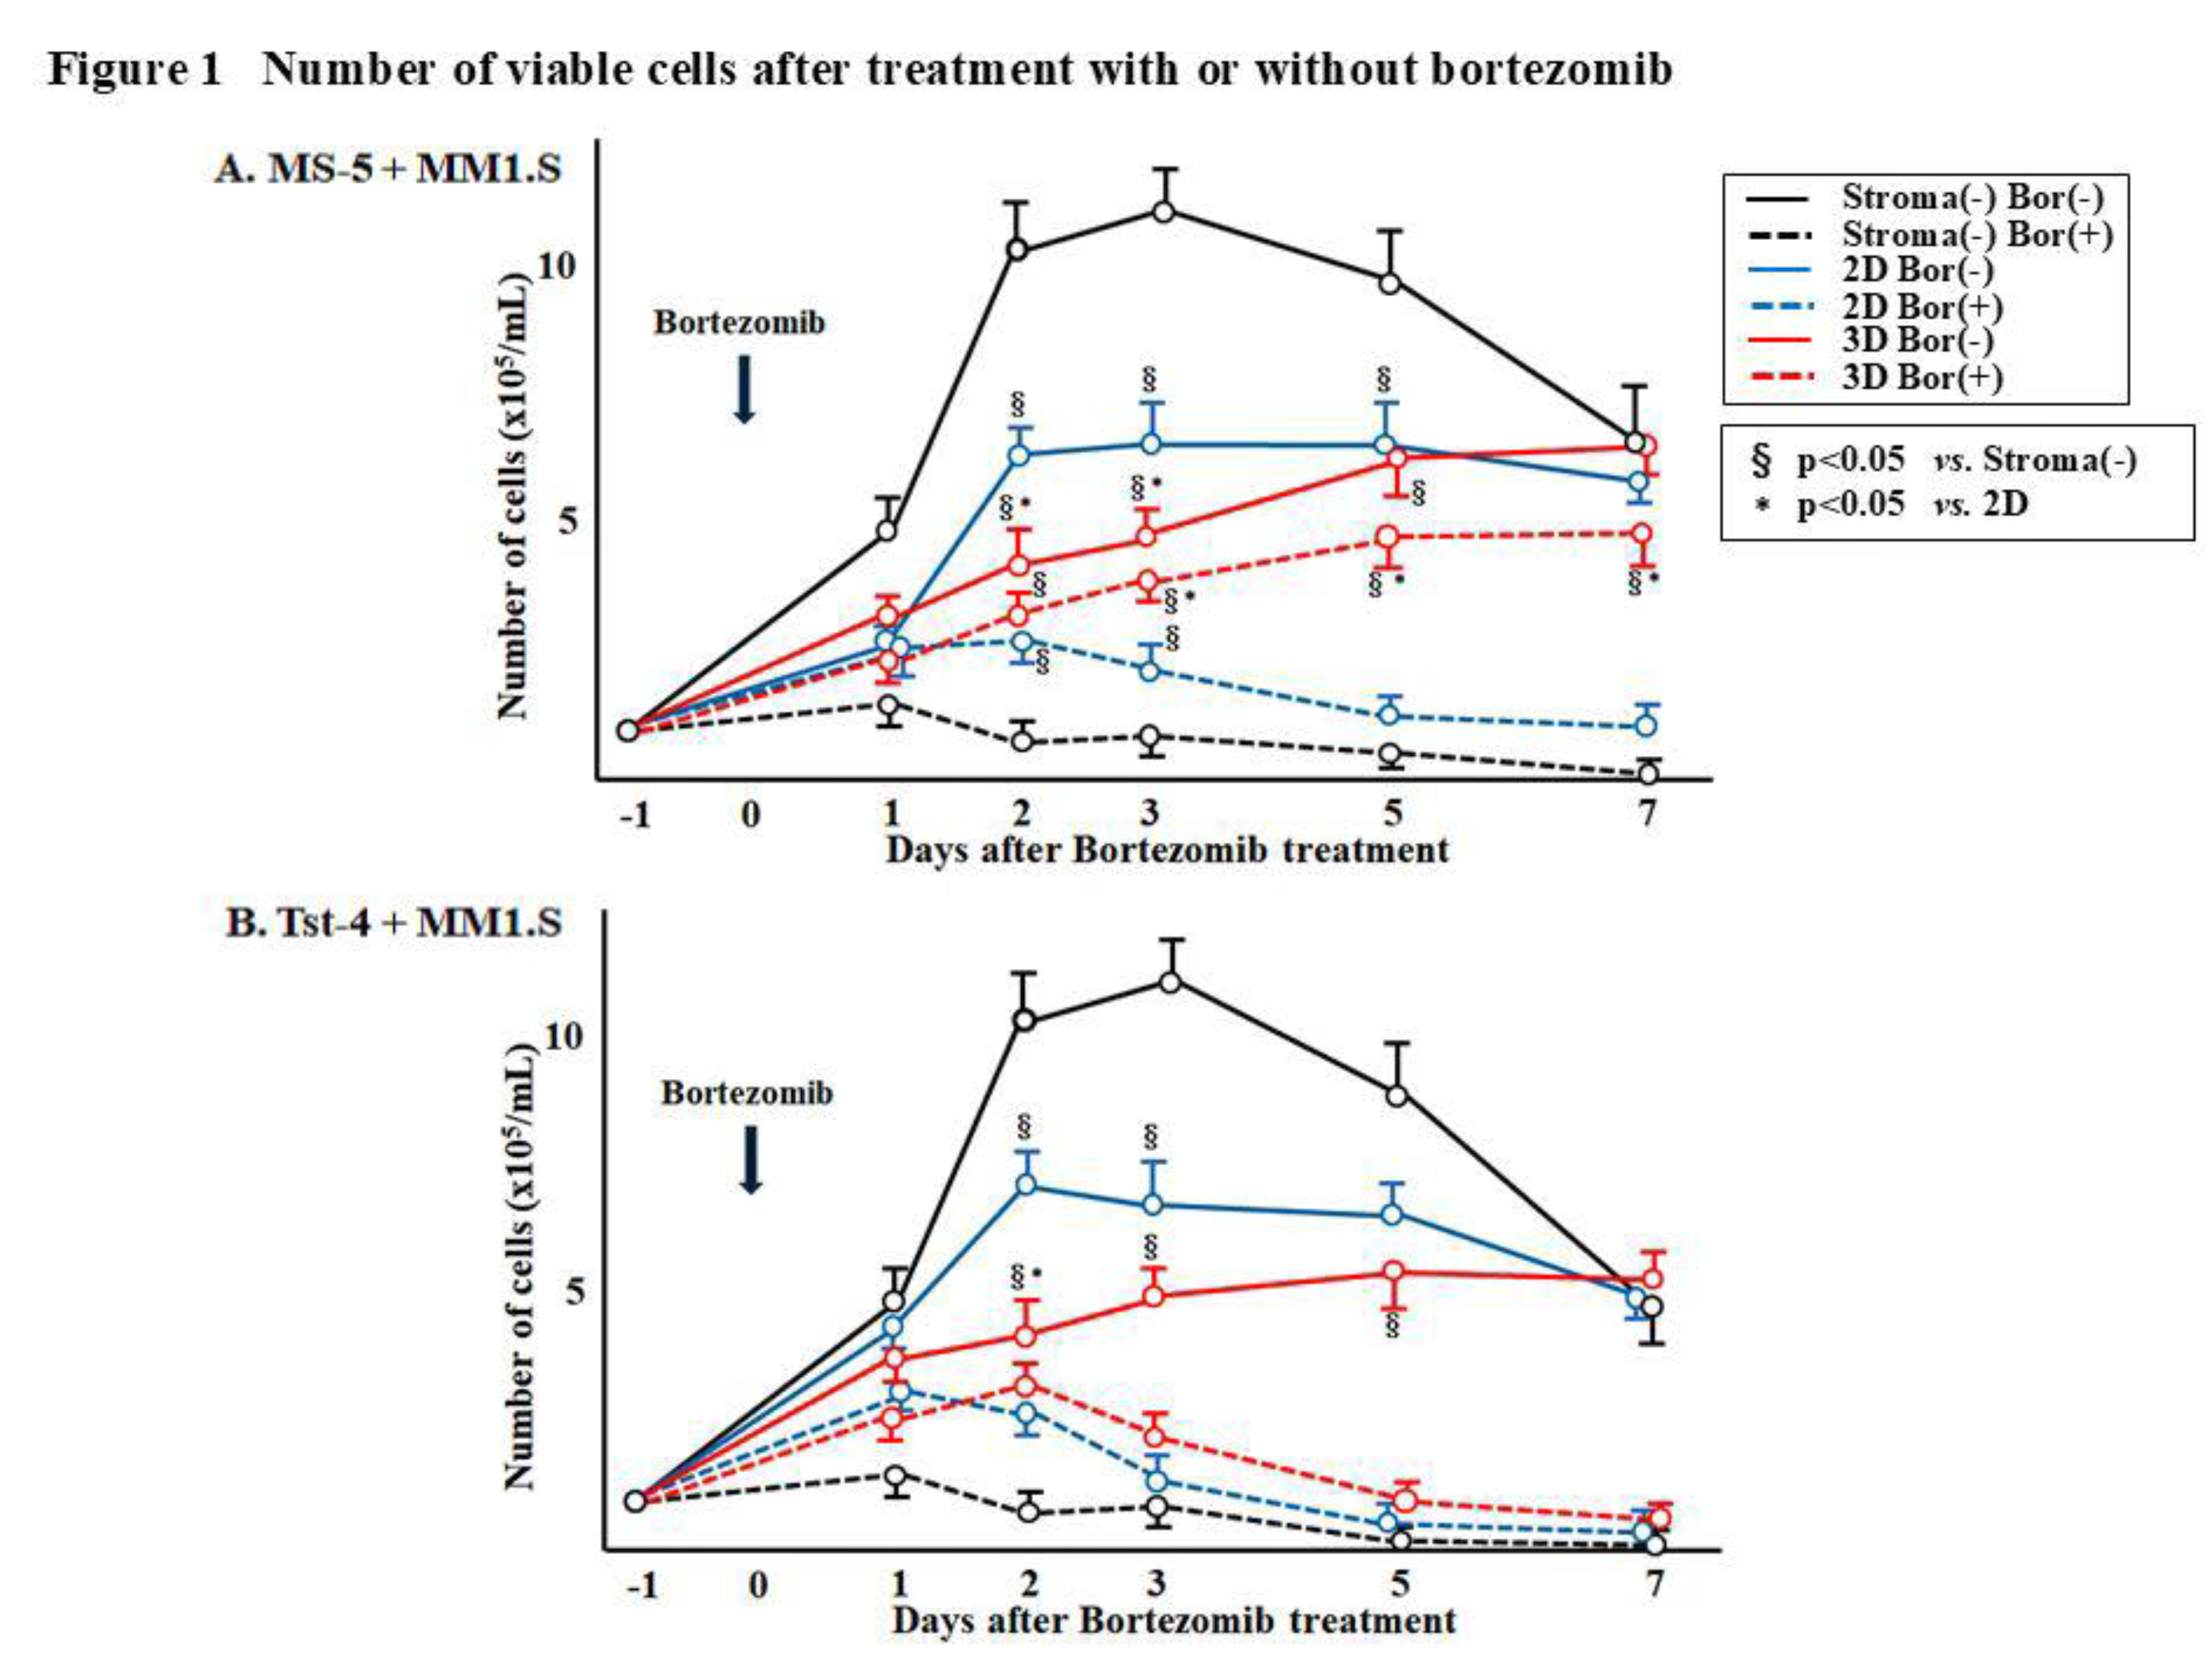
Figure 1 shows inconsistency in the number of viable MM1.S cells in both 2D and 3D culture systems. Approximately, 1 × 10
5/mL of MM1.S cells were cocultured with either MS-5 or Tst-4 stromal cells, in 2D and 3D culture constructs. The MM1.S cells cultured without stromal cells initially demonstrated high proliferation; however, they achieved a plateau by day 2 (4 days after cultivation), followed by a gradual decrease due to the limiting nutritional environment (black line). The MM1.S cell line has a doubling time of approximately 72 h (28). MM1.S cells upon coculturing with the MS-5 cells, showed slower growth rate (
Figure 1A, solid blue and red line), especially in the 3D culture, where the viable cells kept proliferating until day 7 (solid red line). A similar growth pattern of MM1.S cells was observed when cocultured with Tst-4 (
Figure 1B). The MM1.S cell proliferation in the 2D culture was faster than that observed in the 3D culture (solid blue line).
Table 0. with respect to stroma cell free culture.*: Significant difference (p < 0.05) with respect to 2D culture.
2.2. Growth Patterns of MM1.S Cells Cocultured with MS-5 and Tst-4 Cells in 2D and 3D Culture Constructs Along with Bortezomib Treatment
This experiment examined the influence of the anticancer agent, bortezomib, which is a proteasome inhibitor, on the MM1.S growth. First, to evaluate bortezomib cytotoxicity, it was introduced to the 2D and 3D cultures constructed with the MS-5 or Tst-4 cells. Trypan blue dye exclusion assay showed that 85.7 % and 79.5 % of MS-5 in the 2D and 3D cultures and 85.7 % and 80.4% of the Tst-4 cells in the 2D and 3D cultures, respectively, survived after 10 nM bortezomib treatment for 5 days (date not shown). Next, 1 × 10
5/mL of the MM1.S cells were cocultured with the MS-5 or Tst-4 stromal cells onto the 2D and 3D cultures constructs. Next day (day 0), when the MM1.S cells adhered to the stromal cells, 10 nM of bortezomib was introduced into each culture. The MM1.S cells were collected and assayed.
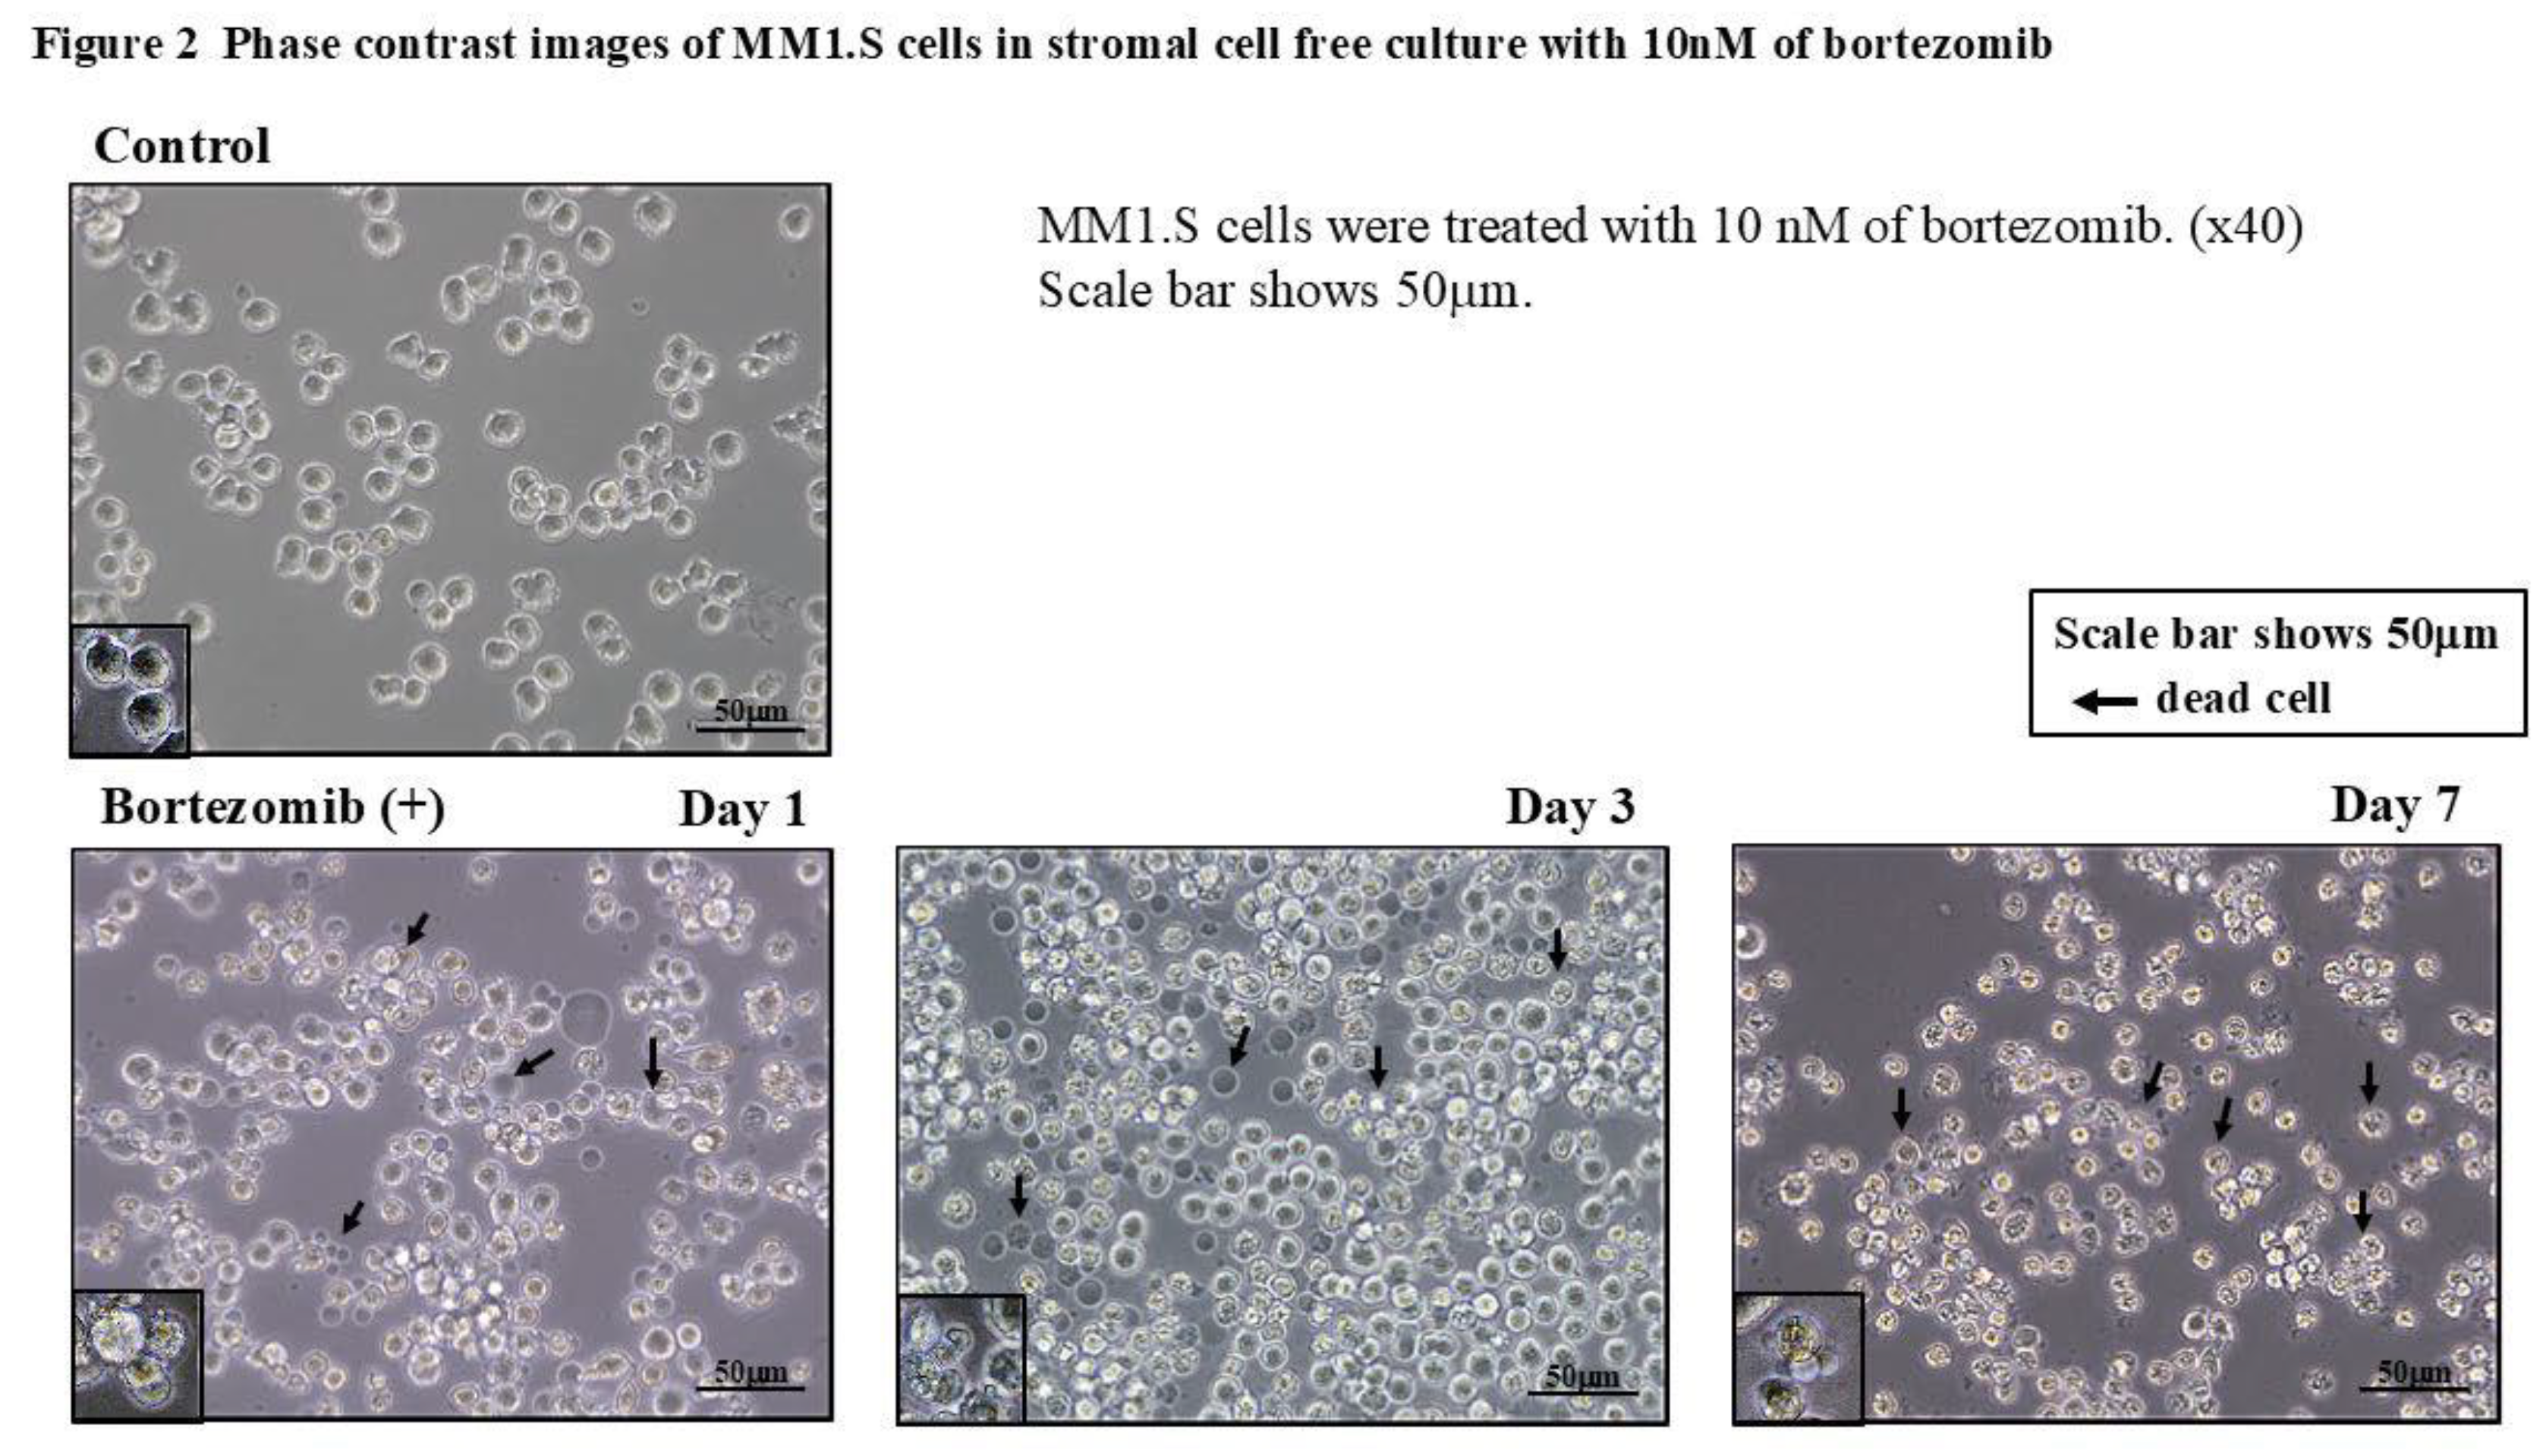
Figure 2 shows the phase contrast images of the MM1.S cells in the stromal cell-free culture with bortezomib after 1, 3, and 7 days. The MM1.S cells appeared irregular in shape with a slight reduction in their size. The trypan blue dye exclusion assay revealed that most of the deformed cells were dead ones.
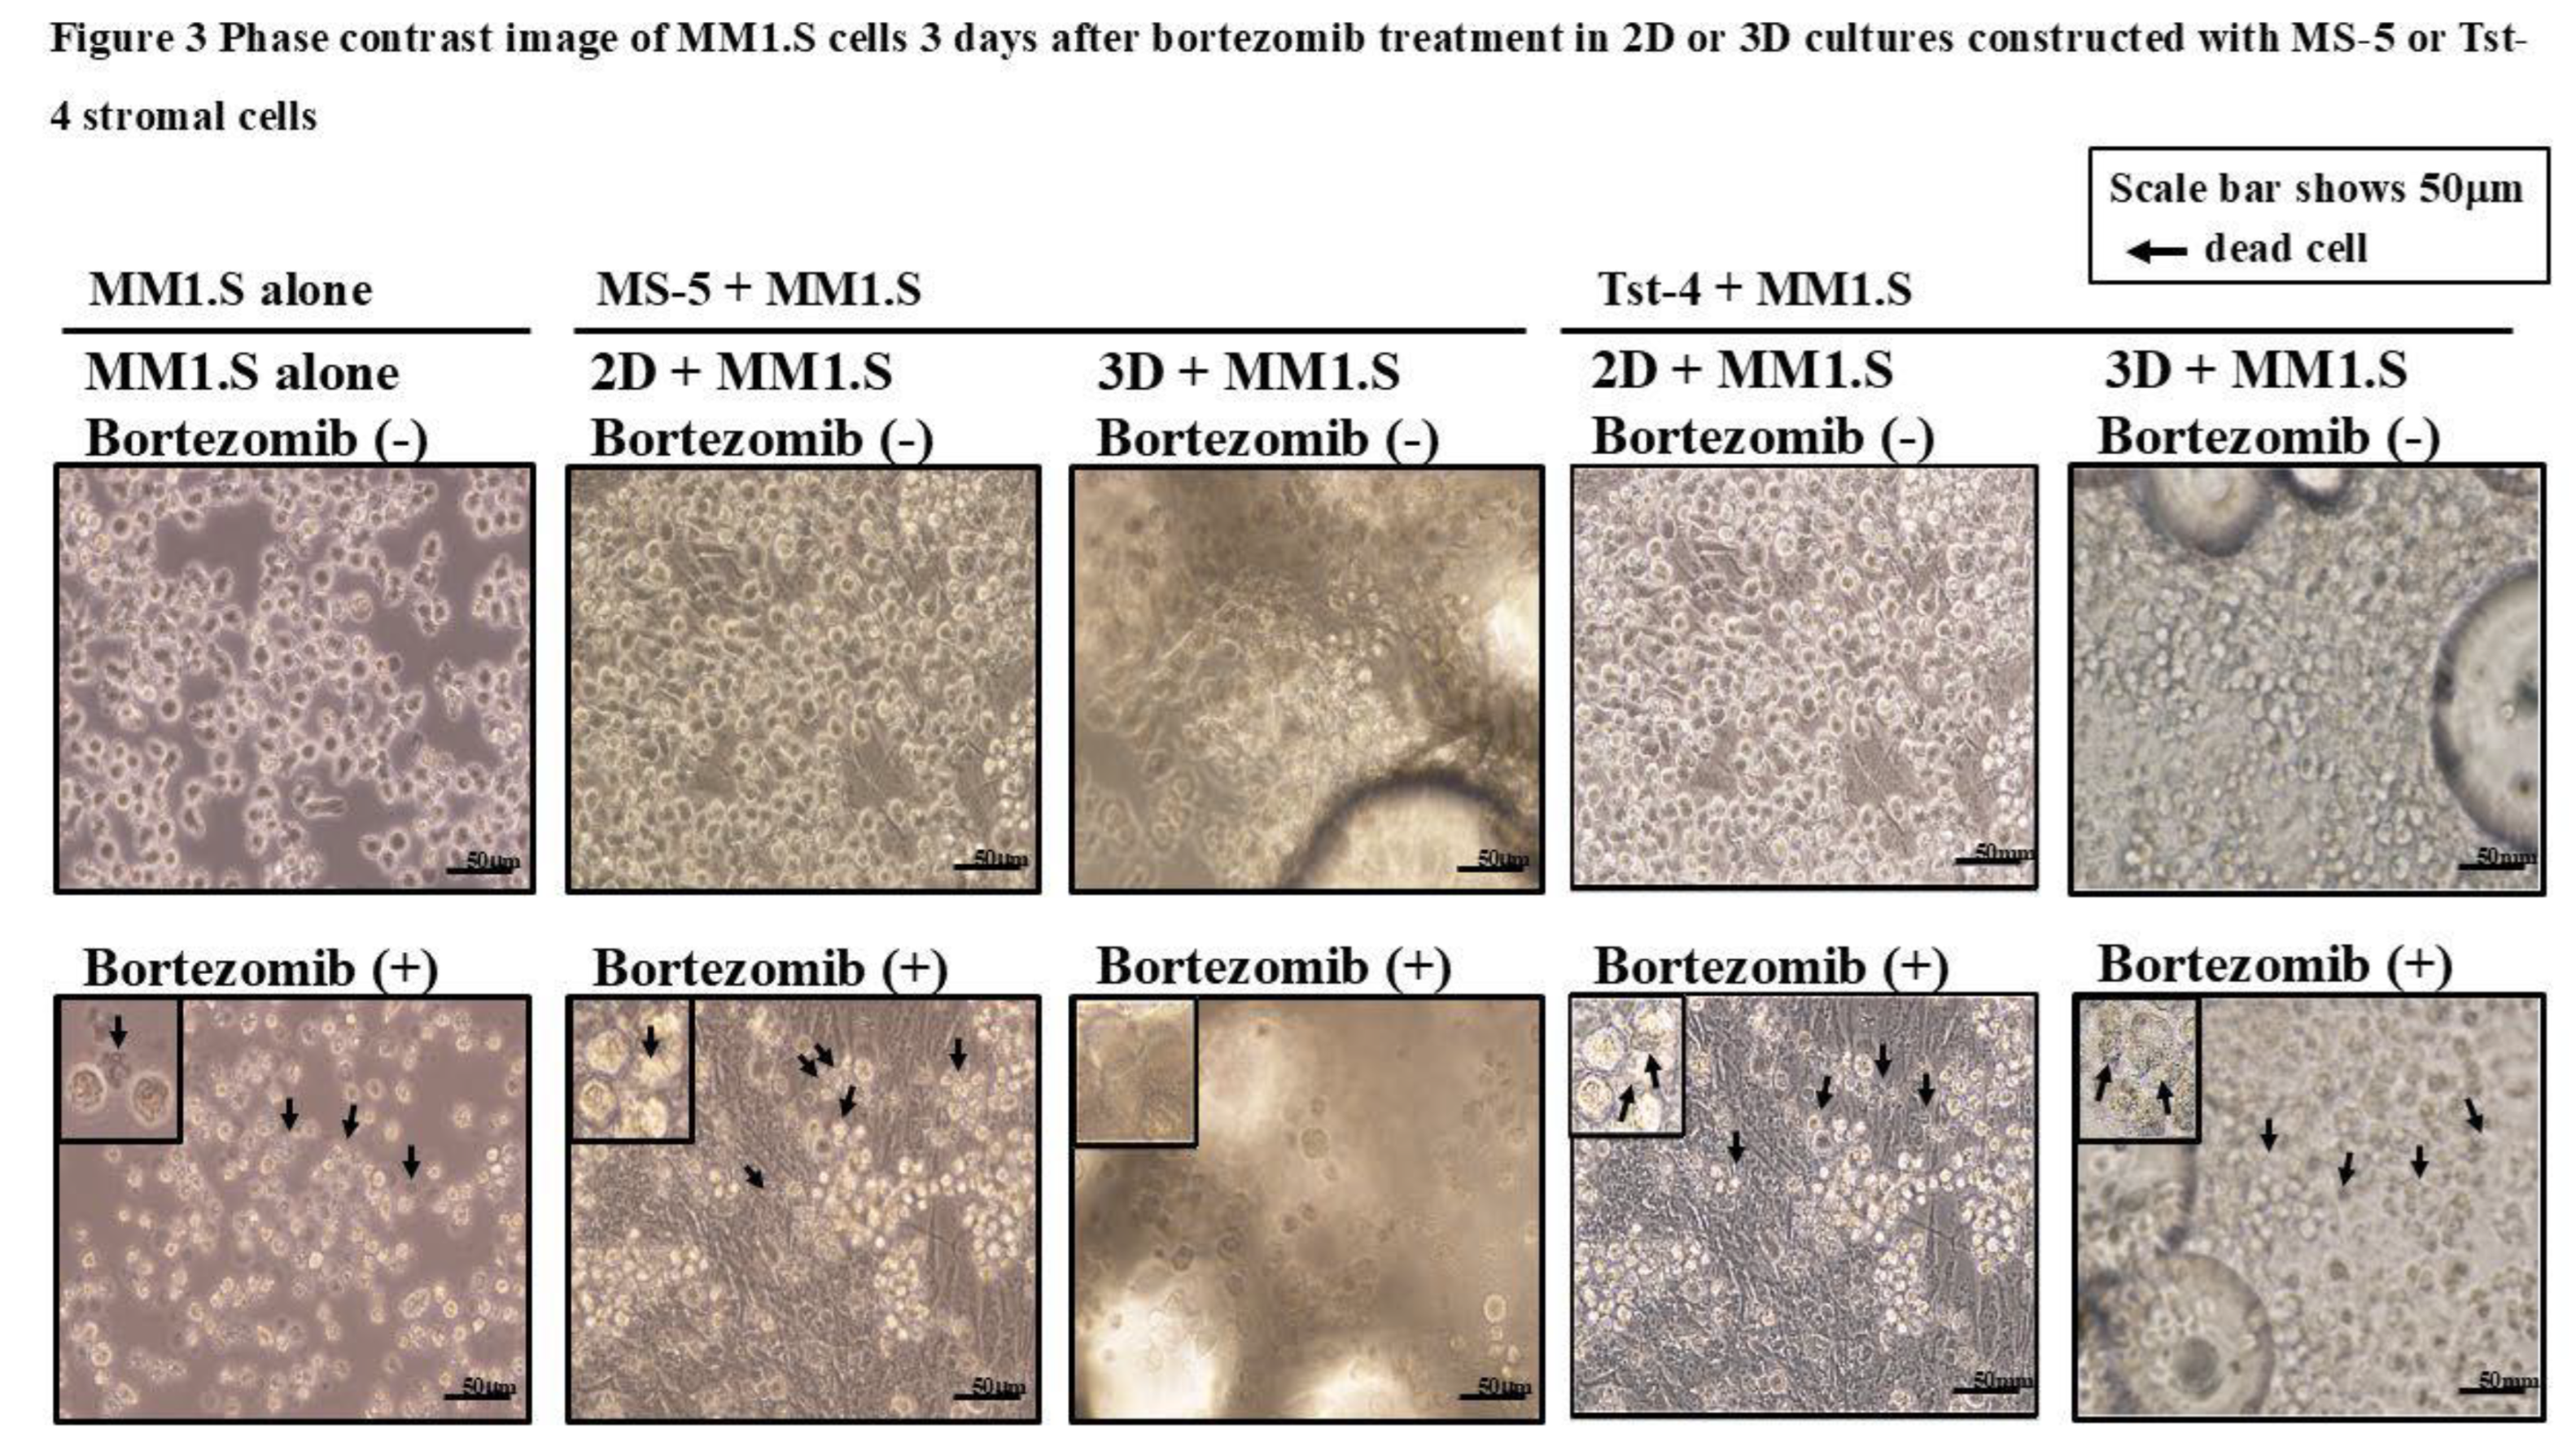
Figure 3 depicts the phase contrast image of the MM1.S cells cocultured with the MS-5 or Tst-4 stromal cells, 3 days after the bortezomib treatment in the 2D or 3D culture constructs. The MM1.S cells remained adherent to the MS-5 stromal cells in the 3D culture and maintained a rounded shape. In contrast, the MM1.S cells in the 2D culture with MS-5, and MM1.S cells in both the 2D and 3D culture constructed with the Tst-4 cells showed morphological change with an irregular shape and small size, as seen in the stromal cell-free culture with bortezomib treatment.
Figure 1 displays the alterations in the viable MM1.S cell numbers after bortezomib treatment. The MM1.S cell numbers in the stromal cell-free culture were rapidly reduced after bortezomib treatment (dotted black line). The number of viable MM1.S cells in the 3D coculture with MS-5 cells was significantly higher (p<0.05) than that in the culture without stromal cells, and in the 2D culture with MS-5 cells, and gradually increased until day 7, post-treatment (dotted red line). Contrarily, the number of viable MM1.S cells cocultured in 3D with Tst-4 stromal cells, significantly reduced (p<0.05) within 3 days after bortezomib treatment (
Figure 1B).
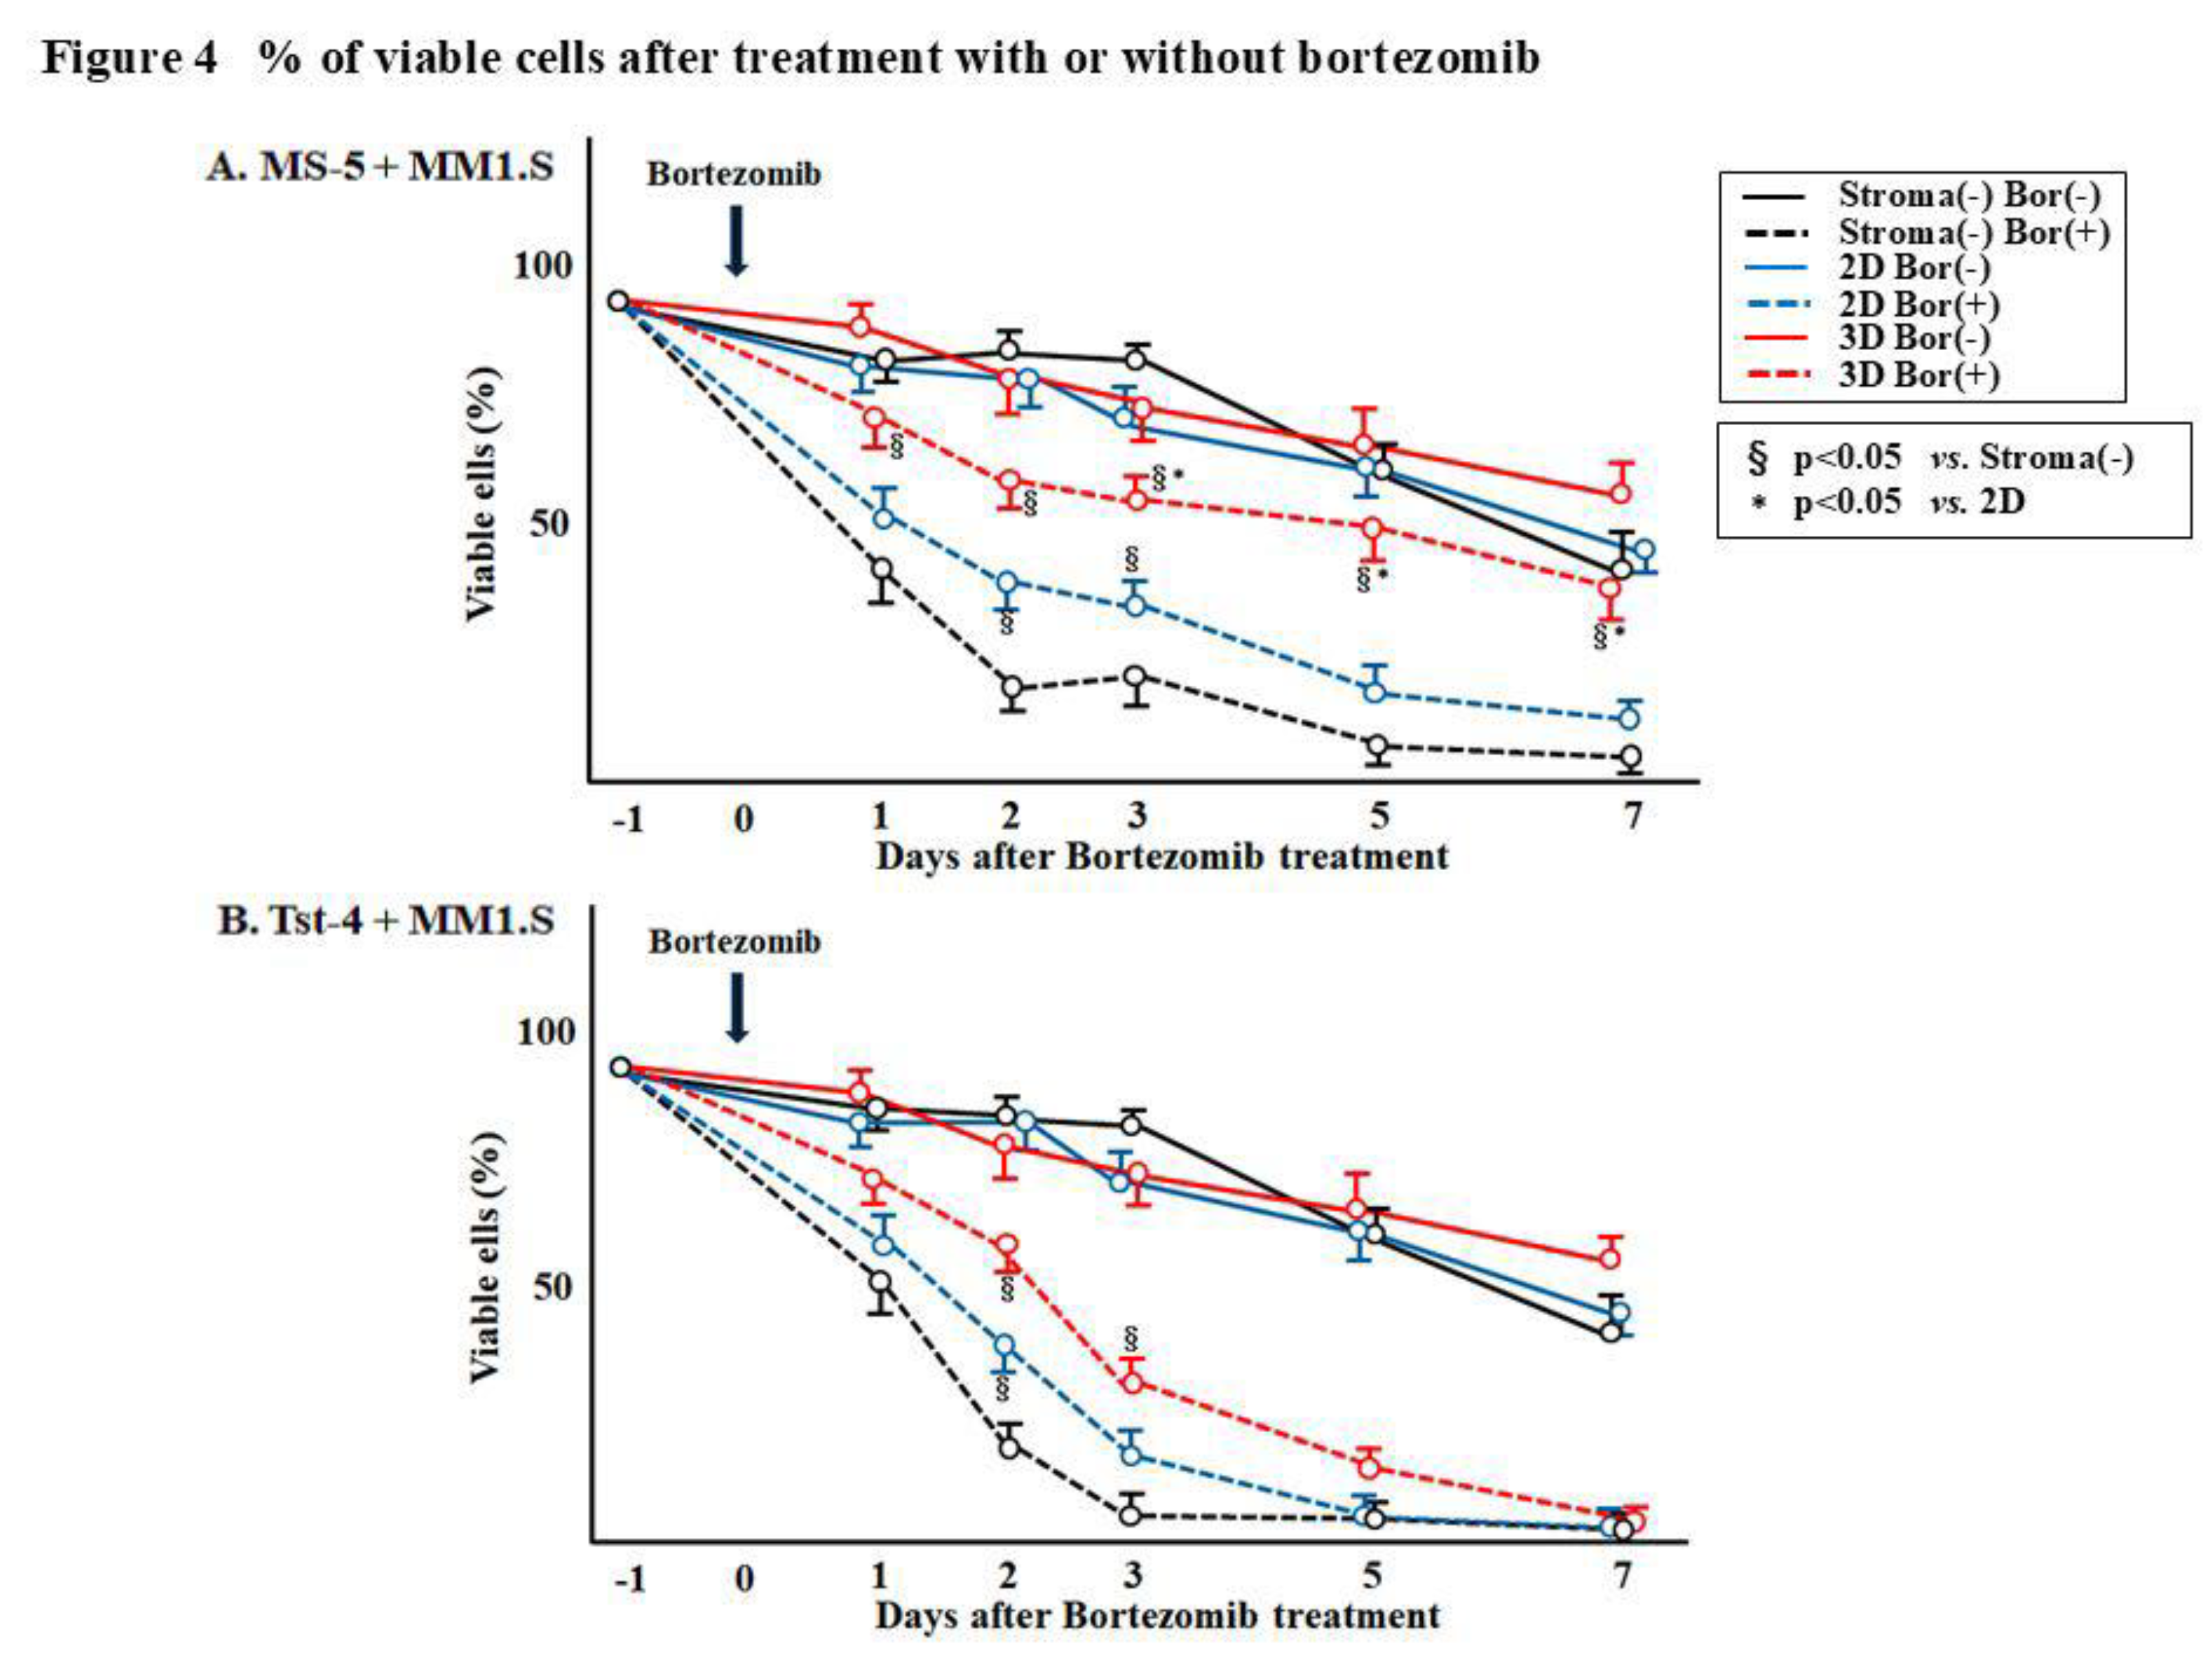
Figure 4. shows the percentage of viable MM1.S cells after bortezomib treatment, and it was
found to be reduced in the culture without stromal cells and in the 2D and 3D cocultures with Tst-4
cells (
Figure 4B). On the contrary, the percentage of viable MM1.S cells in the 3D coculture with MS-5
stromal cells was significantly higher (p<0.05) compared to that observed in culture without stromal
cells and in the 2D and 3D cocultures with Tst-4 (
Figure 4A). More than 40% cells were viable in the 3D
coculture with MS-5, whereas 10.3% in 2D coculture with MS-5 and 2.6% in 3D coculture with Tst-4
cells.
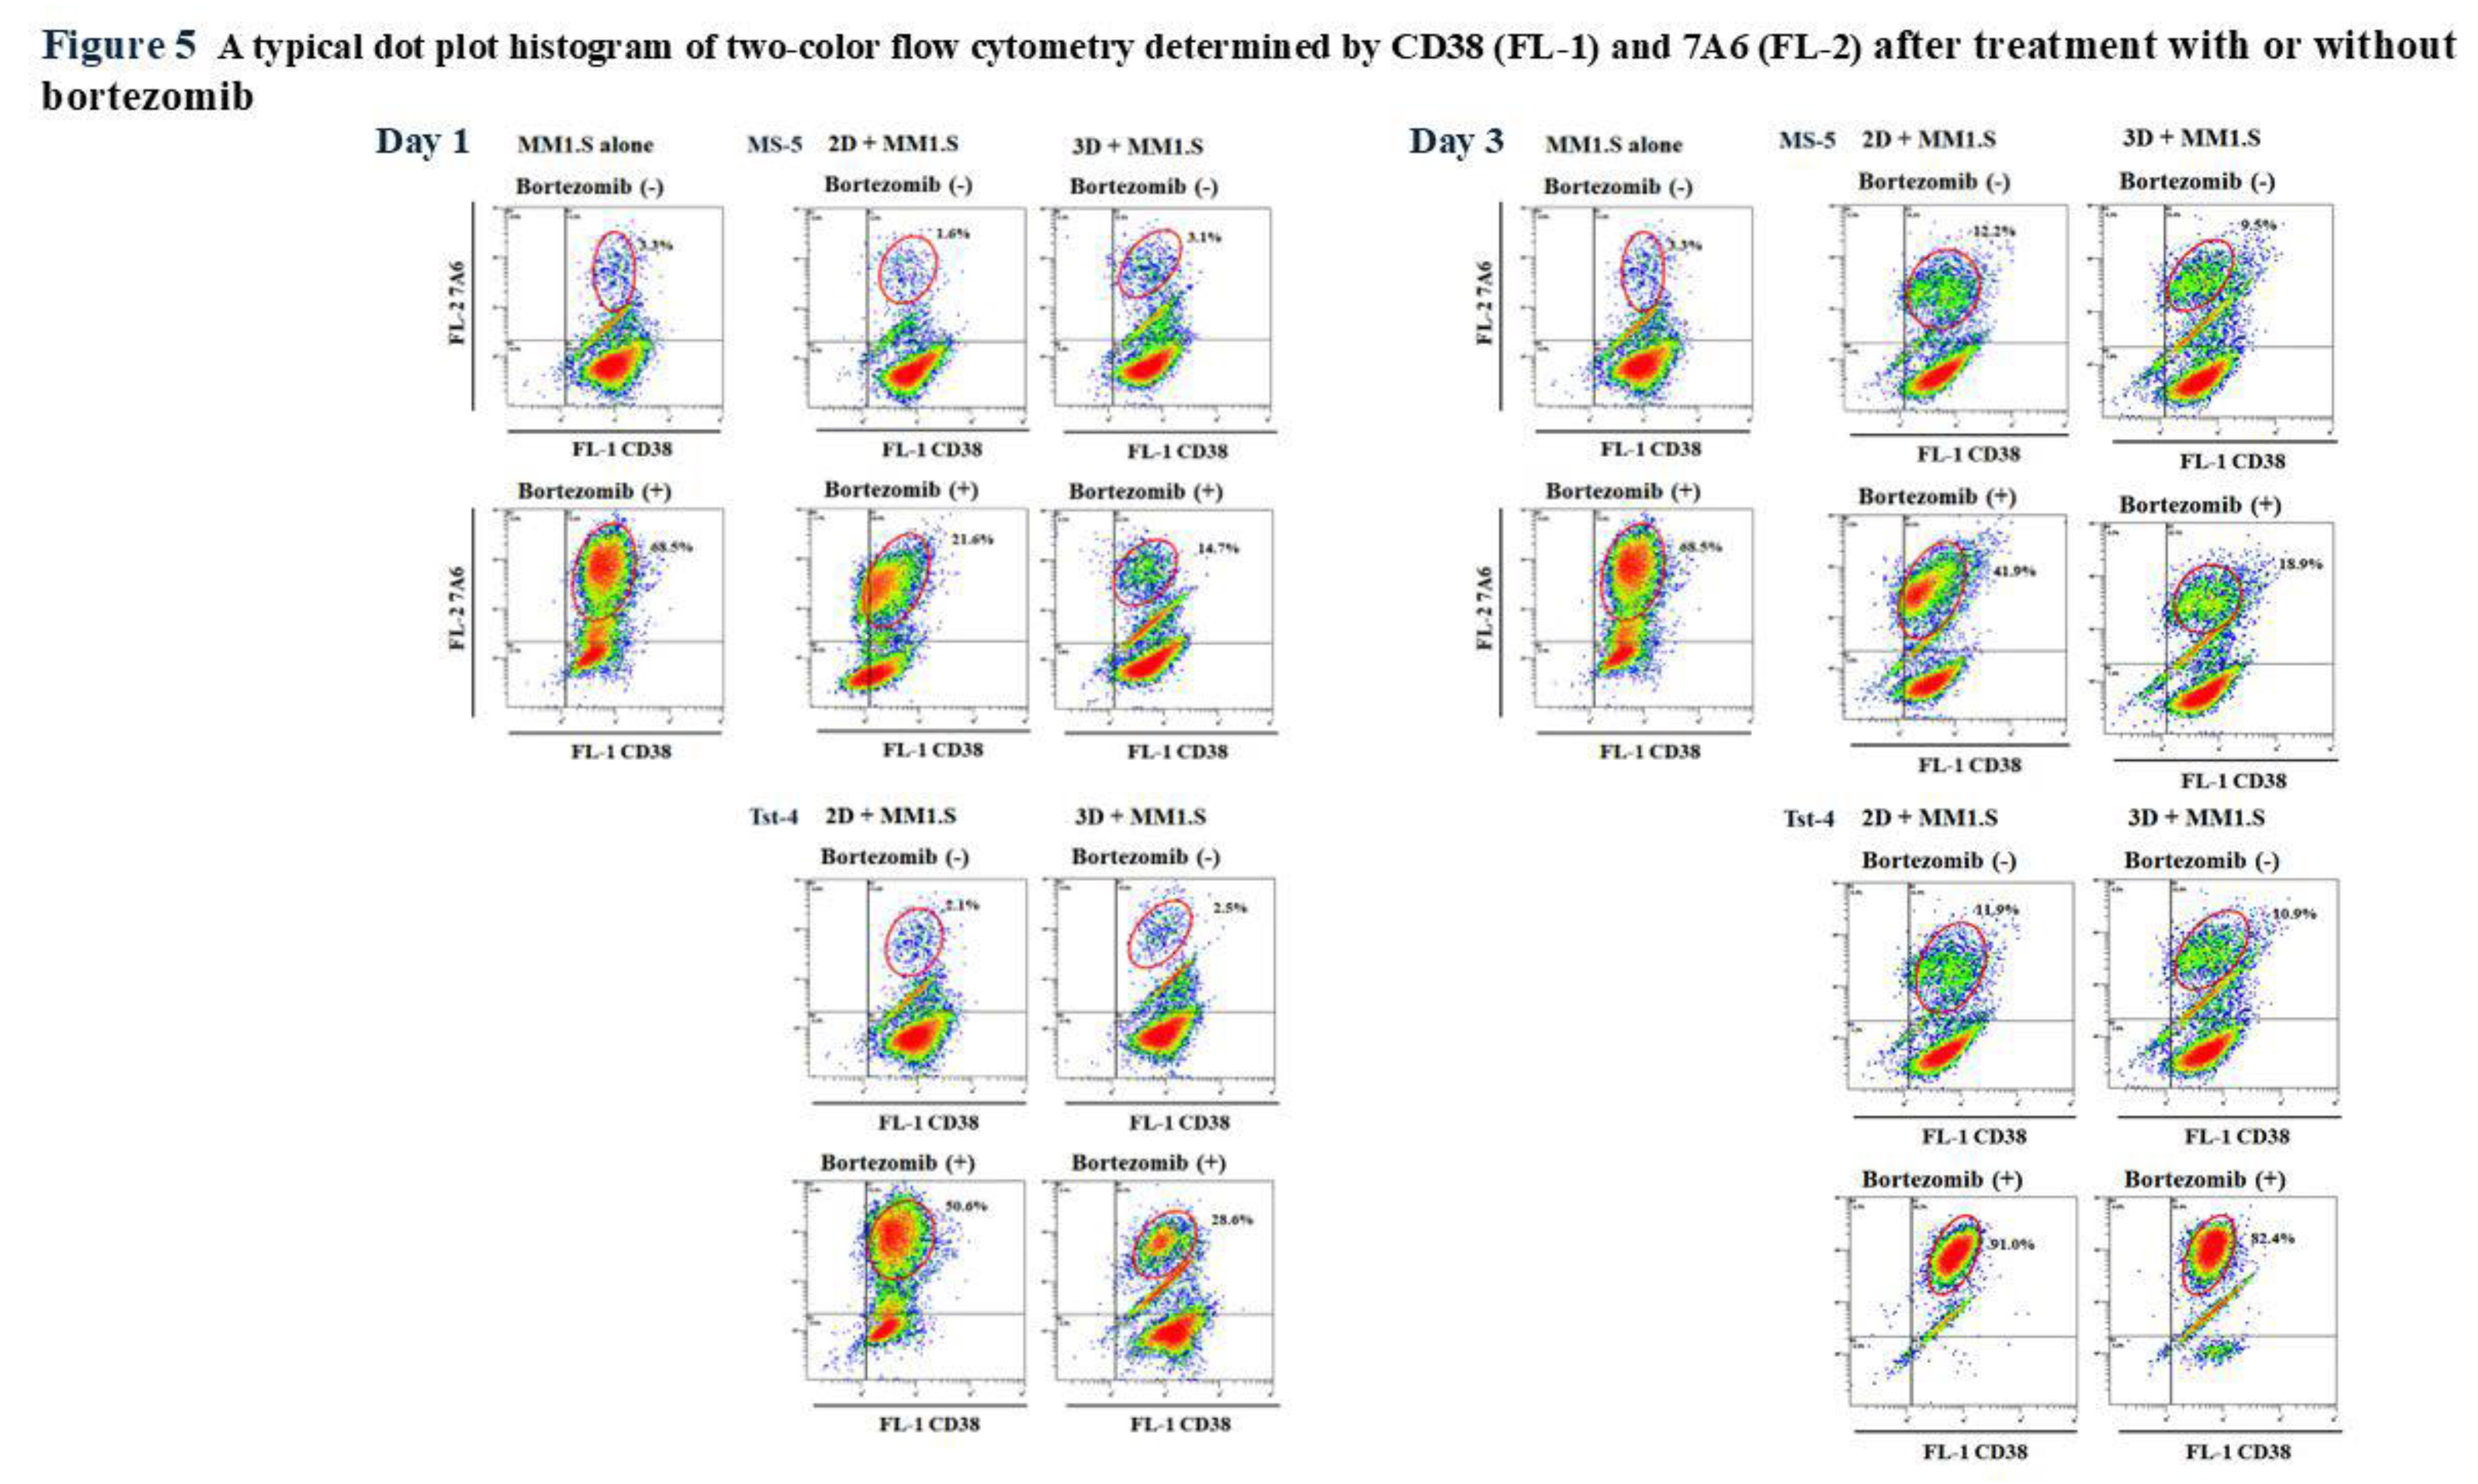
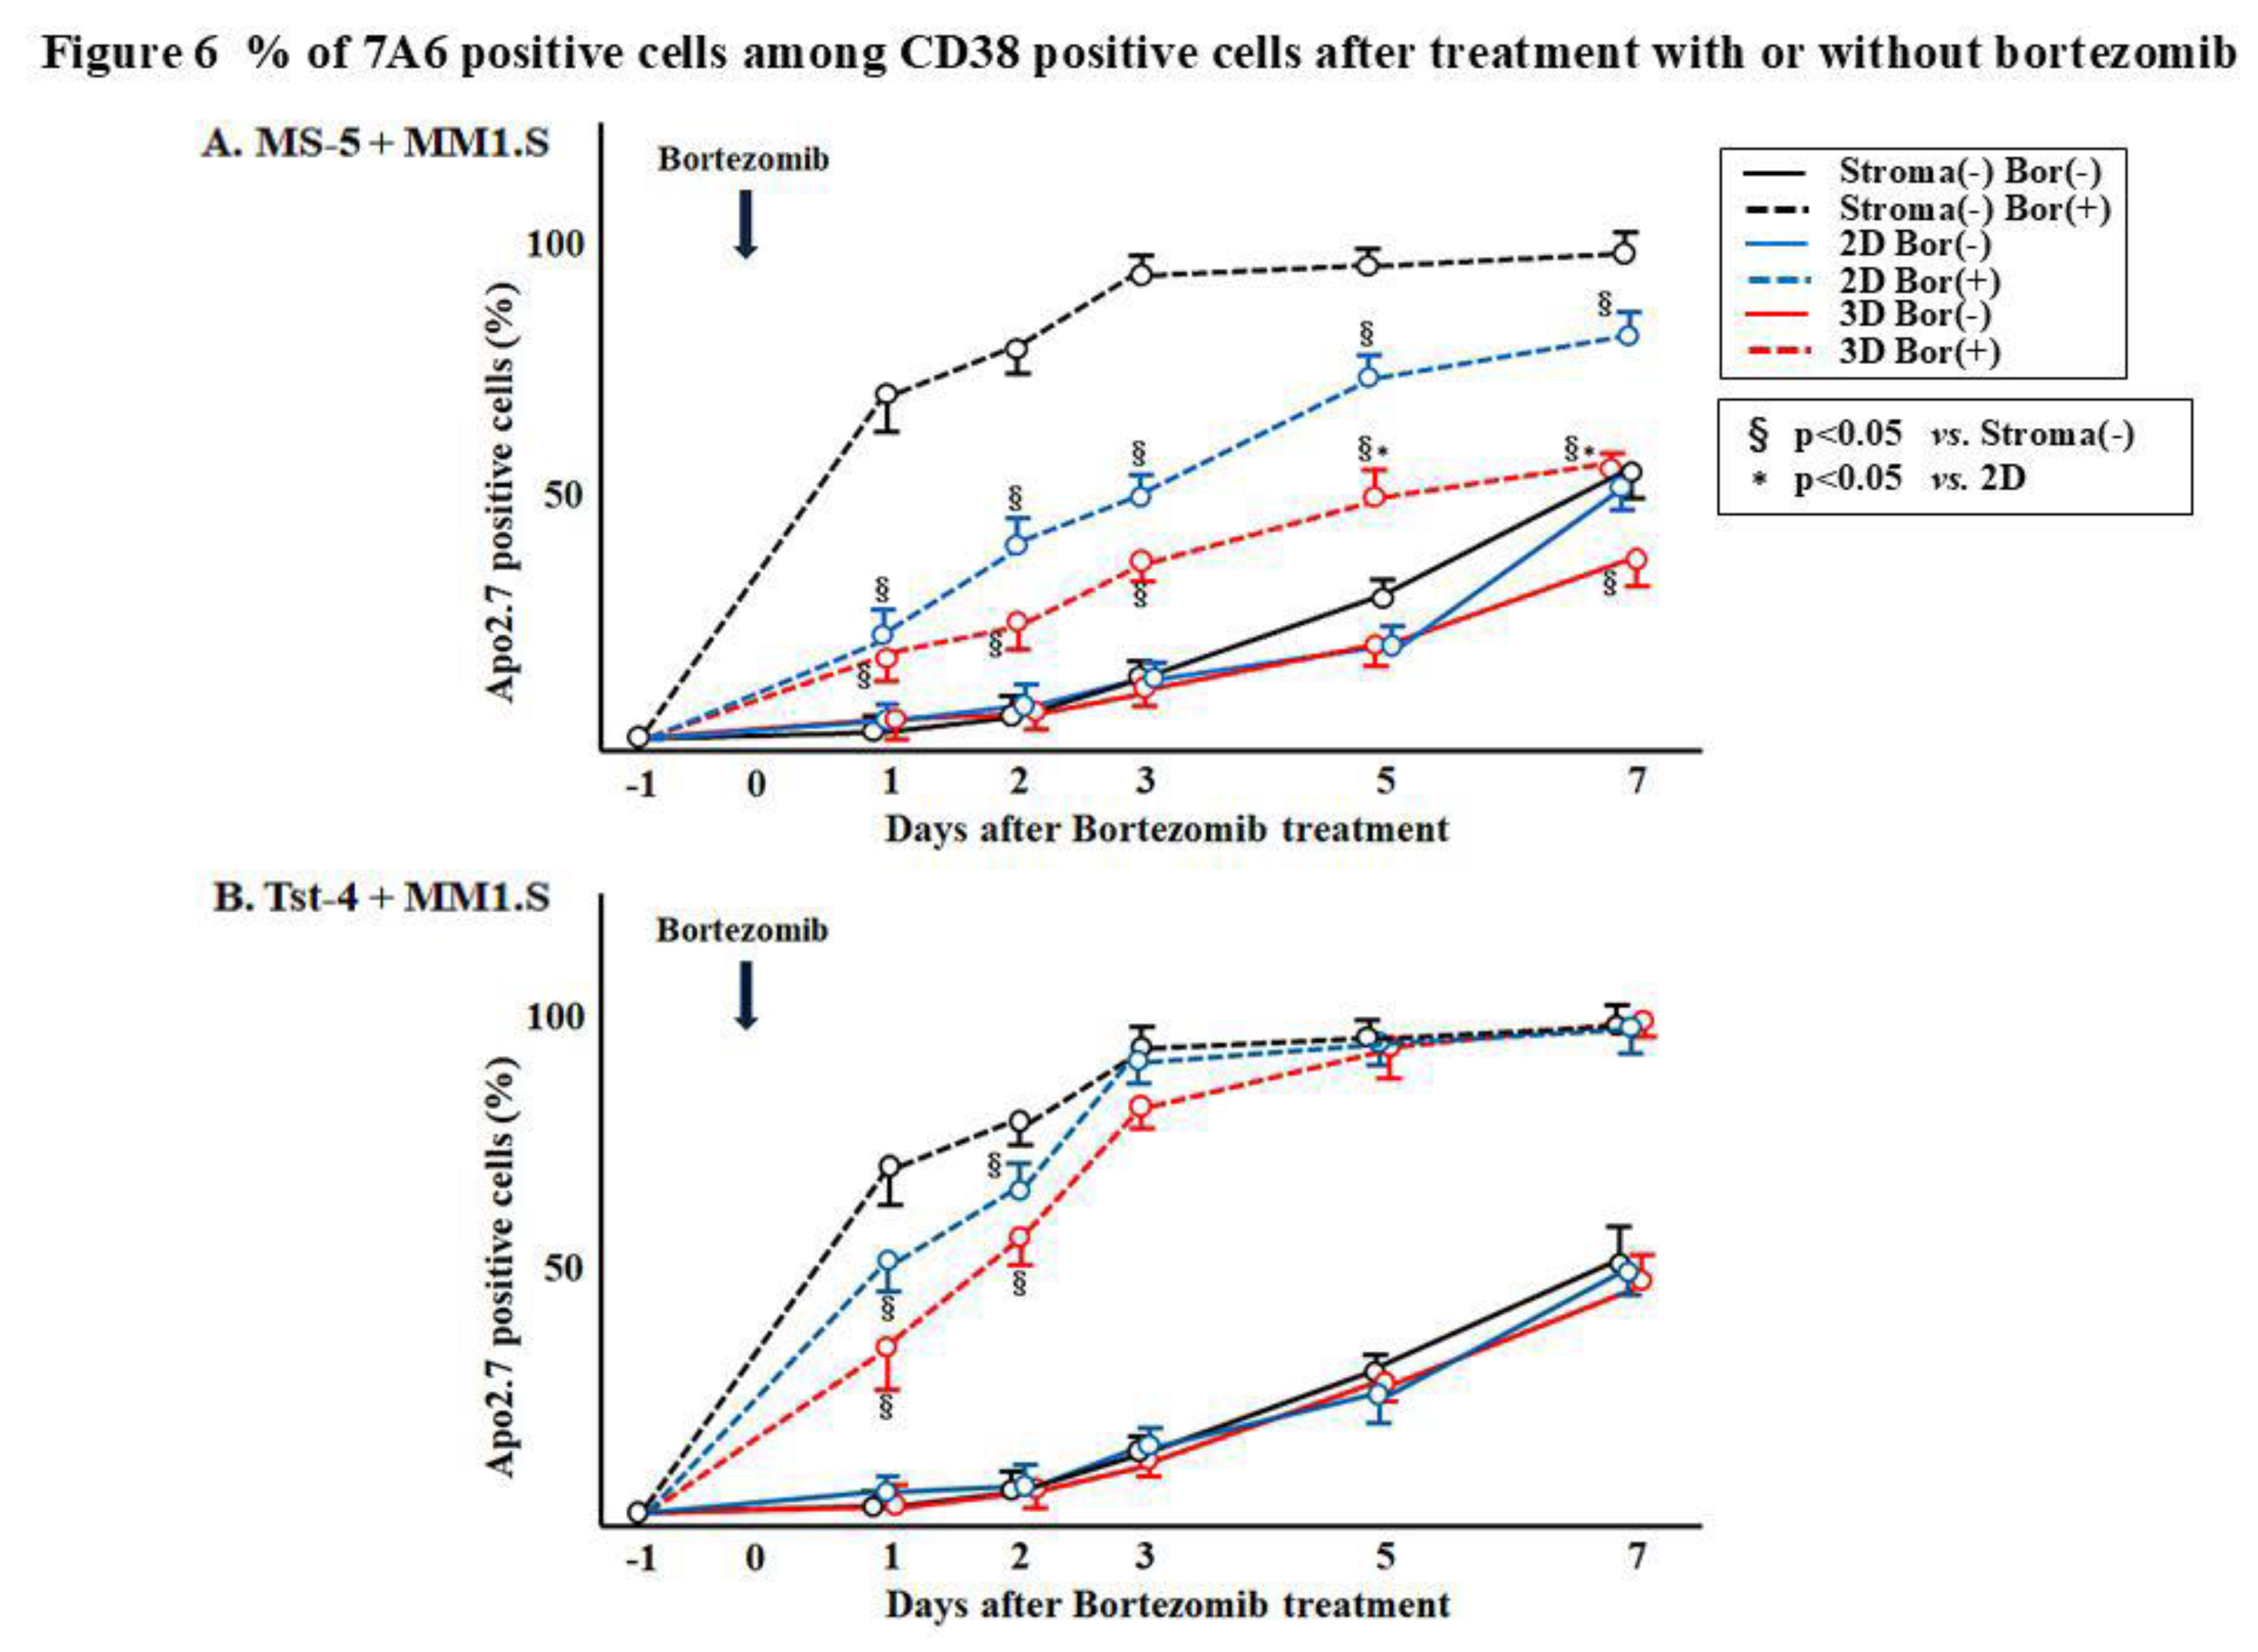
2.3. Expression of the Apoptotic Maker 7A6 Antigen on the MM1.S Cells After Bortezomib Treatment
We addressed the mechanisms underlying the reductions in the MM1.S cell numbers in response to bortezomib treatment by examining the 7A6 (apoptosis antigen) expression. A cell aliquot was collected from each culture 1, 2, 3, 5, and 7 days after treatment and double-stained with anti-CD38 and anti-7A6 antibodies (APO2.7) (
Figure 5, and
Figure 6). The human leukemic MM1.S cells were positive for CD38 (28, 34), whereas the murine MS-5 and Tst-4 cells were negative for it; hence, the MM1.S and MS-5 or Tst-4 cells were easy to distinguish.
Figure 5 shows a typical dot plot histogram of the two-color cytometry determined by CD38 (FL-1) and APO2.7 (FL-2) of the MM1.S cells 1 and 3 days after bortezomib treatment.
Figure 6 summarizes the results. Significantly (p<0.05) higher numbers of APO2.7 positive cells were observed in the culture without stromal cells and in the 2D and 3D cultures with Tst-4, suggesting that apoptosis was induced by bortezomib under these conditions. These findings suggest that bortezomib induces apoptosis in MM1.S myeloma-derived cells. However, the MS-5 cells in the 3D culture may protect the MM1.S cells from the apoptosis induced by bortezomib treatment.
3. Discussion
Hematopoiesis occurs in the bone marrow and distinctive stromal cells associate HSC proliferation and differentiation (1-3). Schofield proposed the concept of a “niche” as a specialized microenvironment housing the HSCs (35). Several in vitro experiments, coculturing hematopoietic cells with stromal cells, demonstrated that both stromal cell function and niche anatomy, regulates stem cell quiescence, self-renewability, and differentiation (13-16). Abnormal clones originating from hematopoietic cells, including leukemic clones, arise within the niche, indicating that the stromal cells regulate proliferation of not only normal hematopoietic cells but also of abnormal clones (18, 36). However, not all stromal cells derived from hematopoietic tissue support hematopoiesis and leukemogenesis. In some stromal cells, the inhibitory action to the growth of hematopoietic as well as abnormally cloned cells has actually been reported (37).
Herein, we developed a novel 3D culture system using polymer particles grafted with epoxy polymer chains for cell immobilization. In this system, HSCs and cloned leukemic cells grows better as compared to that observed in the traditional 2D culture system (20, 22). In 3D culture, stromal cells regulate the HSC and cloned leukemic cell growth by regulating the cell cycle (23). Two types of stromal cells, namely, MS-5 and Tst-4 cells, were cocultured with multiple myeloma-derived cloned MM1.S cells to compare their specific functions in 3D culture. Coculturing the MM1.S cells with MS-5 and Tst-4 cells in the 2D culture, showed a comparable proliferation pattern (
Figure 1 and
Figure 4). However, in 3D coculture, MM1.S cells grew slower with MS-5 cells compared to that observed with Tst-4 cells. Interestingly, the relaxed growth pattern of the MM1.S cells with MS-5 cells in 3D coculture was comparable to that observed in 2D coculture. Altogether, these findings indicate that the MM1.S cell growth varies according to stromal cell type along with the dimensions of the culture systems.
Bortezomib, a proteasome inhibitor, was developed to treat multiple myeloma and achieve a splendid effect (29, 32). Various studies have reported the mechanisms of the cytotoxic effects of bortezomib’s cytotoxic effects, such as, inducing canonical nuclear factor-kappa B (NF-κB) activation in multiple myeloma cells (30, 38), inducing apoptosis by the oxidative and ER stresses (31, 39, 40), and overcoming the cell adhesion-mediated drug resistance by downregulating the VLA-4 expression (41). Zhou et al. showed that bortezomib suppresses the self-renewability of leukemic cells by promoting NF-κB-dependent CDK6 inhibition (42). Previously, we reported that the MS-5 stromal cells in 3D coculture influenced the proliferation and differentiation of the hematopoietic cells by regulating their cell cycle; wherein, more than 50% of the cells failed to enter the S phase (23). Indeed, a reduced apoptotic change (7A6 antigen expression) was observed in MM1.S, cocultured with MS-5 cells in 3D system. The protective effect of MS-5, but not of Tst-4 stromal cells, against the cytocidal treatment of bortezomib, may be related to the regulation of MM1.S cell cycle period influenced by the MS-5 cells in a 3D microenvironment. However, understanding the intricacies of these cellular cross-talks is imperative and needs further investigation. Our results revealed that the stromal MS-5 and Tst-4 cells in the 2D coculture partially protected the MM1.S cells from bortezomib-induced apoptosis. Higher protection was observed only in the 3D system with the MS-5 cells. Thus, the anatomical niche structure constructed with the MS-5 cells, but not the Tst-4 stroma cells, is important for regulating the target hematopoietic cells. The possibility that the change in characteristics and functions of the MS-5 cells in different culture conditions (2D or 3D), remain to be investigated. However, this is the first report to demonstrate the stromal cell potential in mediating the resistance of multiple myeloma cells against bortezomib, is dependent on the culture system (2D or 3D) and type of stromal cells (MS-5 or Tst-4).
Further studies are necessary to investigate the mechanisms that regulate the hematopoietic or leukemic, including multiple myeloma, cell homing to the stromal niche and also the role of stromal cells in maintaining these cells in a stable condition. Comparative studies using both 2D and 3D culture systems with various stromal cells may aid in unraveling these questions.
4. Materials and Methods
4.1. Materials
2,2′-Azobis (isobutyronitrile), 2,2′-azobis[N-(2-propenyl)-2-methylpropionamide], dipotassium hydrogen phosphate, glutaraldehyde aqueous solution (25% w/v), glycidyl methacrylate, hydrochloric acid, methacrylic acid, methanol, methyl methacrylate, paraformaldehyde aqueous solution (36% w/v), saccharose, sodium dihydrogen phosphate, and trypan blue were purchased from Wako Pure Chemical Industries, Ltd. (Osaka, Japan). Cresol red, poly (vinylpyrolidone) K-90, sodium hydroxide, and toluene were purchased from Nacalai Tesque (Kyoto, Japan). Pentaerythritol triacrylate was purchased from Sigma-Aldrich Co. (St. Louis, MO, USA).
Bortezomib was purchased from Selleck Biotechnology Co. (Yokohama, Japan), dissolved in dimethyl sulfoxide (DMSO; Sigma-Aldrich Co. (St. Louis, MO, USA)) to prepare a 5 μM solution, and then mixed with Iscove’s modified Dulbecco’s medium (IMDM) for use. A previous study showed that the half-maximal effective concentration (EC50) of bortezomib for the U266 myeloma cells was 2.45 nM (34). In the present study, bortezomib was used at 10 nM concentrations.
4.2. Preparation of Cell Support with Grafted Polymer Chains
Polymer particles with grafted epoxy polymer chains were prepared as previously described (21). For graft polymerization, glycidyl methacrylate and methacrylic acid were used at a ratio of 4:1 (w/w). The resulting particles were washed in a funnel with a 40× volume of distilled water and methanol. These polymer particles, herein, are referred as G-02 polymer particles.
The distribution of particle diameter was measured using the laser particle diameter analyzer, Microtrac FRA (Microtrac, Inc., Montgomery, PA, USA). Accordingly, 150-200 μm particles were used in this study. The amount of epoxy group in the polymer particles was measured using the hydrochloric acid–dioxane method. Particles with more than 1.03 × 10⁻³ μmol/g-particle of the epoxy group were selected (20, 21).
4.3. Culturing of MS-5 and Tst-4 Stromal Cells and MM1.S Cells
The murine stromal cell lines, MS-5 and Tst-4, were cultured using 7 mL IMDM supplemented with 10% fetal calf serum (FCS; Hyclone, Logan, UT, USA), penicillin (50 U/mL; Gibco BRL), and streptomycin (100 μg/mL; Gibco BRL) in 25-cm2 flasks (Falcon 3013; One Riverfront Plaza, NY, USA). The cells were maintained in a humidified incubator at 37°C with 5% CO2, subcultured at a split ratio of 1:4 every 7 days using 0.25% trypsin plus 0.02% EDTA in phosphate-buffered saline (PBS).
Human myeloma-derived MM1.S cells (28) were cultured using 7 mL IMDM supplemented with 10% FCS, penicillin (50 U/mL), and streptomycin (100 μg/mL) in 25-cm2 flasks. The cells were maintained in a humidified incubator at 37°C and 5% CO2, and then subcultured at a split ratio of 1:10 every 5 days. For all experiments, the cells were used in their logarithmic growth phase.
4.4. 3D Coculture System
The MS-5 and Tst-4 cells (5–10 × 105) were added to 5 mL IMDM supplemented with 10% FCS in the presence of 1–5 × 10⁴ G-02 polymer particles in a 14-mL round-bottomed polypropylene tube (Falcon 352059). The mixture was incubated in a humidified incubator at 37°C and 5% CO2 for 24 h and transferred to 35-mm plastic dishes (Falcon 353046). and incubated. Once cells were immobilized on the particle surface, they proliferated, and formed bridges between the particles. The supernatant was replaced with fresh growth medium every 7 days. After 2–3 weeks, when the MS-5 and Tst-4 stromal cells had grown and formed a 3D layer in the culture dish, the MM1.S cells (1 × 10⁵/mL) suspended in 5-mL growth medium were layered over stromal cells. The control cultures included the MS-5 and Tst-4 cells grown in dishes without G-02 particles, and the MM1.S cells were inoculated over stromal cells in traditional 2D cultures.
4.5. Bortezomib Treatment
The MM1.S cells were inoculated into the culture one day before bortezomib treatment at 1 × 10⁵/mL cell density. The cultured MM1.S cells were collected at various intervals for analysis. The adherent MM1.S cells could be dislodged from the MS-5 and Tst-4 stromal cells in both 2D and 3D cultures without trypsin treatment and were harvested by repeated pipetting. The harvested cells were counted using a hemocytometer. The viable cells were identified using trypan blue dye exclusion method. The MM1.S and stromal cells could easily be distinguished by size and shape with microscopic observation. A cell aliquot was assayed for CD38 and APO2.7 surface antigen expressions by flow cytometry.
4.6. Cell Surface Antigen Analysis
The harvested cells were washed with PBS containing 2% FCS and passed through a 35-μm filter (Cell Strainer; Falcon 352235) to remove the polymer particles and aggregated cells, most of which were stromal MS-5 and Tst-4 cells. Cells (2 × 10⁵) were suspended in 0.5 mL PBS containing 2% FCS and 0.02% NaN3 and incubated with one or both of the following monoclonal antibodies (mAbs) for 30 min at 4°C: phycoerythrin (PE)-conjugated APO2.7 mAb (clone 2.7 A6A3) for the detection of the 7A6 antigen expressed by apoptotic cells (Becton Dickinson, San Jose, CA, USA) (23) and the fluorescein isothiocynate (FITC)-conjugated anti-human CD38 (clone HIT2, Becton Dickinson) for the detection of the MM1.S cells. The MM1.S cells express CD38 antigen, whereas the MS-5 and Tst-4 stromal cells do not. The cells were washed thrice with PBS and assessed by flow cytometry on Cytomix FC500 (Beckman Coulter, Brea, CA, USA).
4.7. Statistical Analysis
The data are expressed as mean ± standard deviation (SD) of triplicate experiments. The differences between the means were determined through the analysis of variance with Bonferroni. P<0.05 was considered significant.
5. Conclusion
The MS-5 cells, but not the Tst-4 stromal cells, in our 3D coculture system were found to regulate the multiple myeloma cell proliferation when compared with those in the 2D coculture. In 3D coculture with the MS-5 cells, most of the MM1.S cells were maintained in a stabilized state. Moreover, the cytocidal activity of bortezomib was reduced compared with the cells grown in the 2D culture. Although further studies are required to investigate the mechanisms underlying the cell cycle regulatory activity of MS-5 cells in 3D culture, the results indicate that this system could serve as a valuable tool for investigating the stromal–leukemic interactions, including those involving multiple myeloma cells, in vitro.
Author Contributions
All authors participated in the design, interpretation of the studies, analysis of the data, and review of the manuscript. SA, MY, TK, YH, SH, KM and MY conducted the experiments, MY made polymer particles, and SA, MY and IT wrote the manuscript.
Conflicts of interest
The authors declare no conflicts of interest.
References
- Greenberger, JS. The hematopoietic microenvironment. Crit Rev Oncol Hematol 1991, 11, 65–84. [Google Scholar] [CrossRef] [PubMed]
- Mayani H, Guilbert LJ, Janowska-Wieczorek A. Biology of the hemopoietic microenvironment. Eur J Haematol 1992, 49, 225–233. [Google Scholar] [CrossRef] [PubMed]
- Wolf NS, Trentin JJ. Hemopoietic colony studies. V. Effect of hemopoietic organ stroma on differentiation of pluripotent stem cells. J Exp Med 1968, 127, 205–208. [Google Scholar]
- Dexter TM, Allen TD, Lajtha LG. Conditions controlling the proliferation of haematopoietic stem cells in vitro. J Cell Physiol 1977, 91, 335–344. [Google Scholar] [CrossRef]
- Mori KJ, Fujitake H, Okubo H, Dexter TM, Ito Y. Quantitative development of adherent cell colonies in bone marrow cell culture in vitro. Exp Hematol 1979, 7, 171–176. [Google Scholar]
- Aizawa S, Yaguchi M, Nakano M, Toyama K, Inokuchi S, Imai T, Yasuda M, Nabeshima R, Handa H. Hemopoietic supportive function of human bone marrow stromal cell lines established by a recombinant SV40-adenovirus vector. Exp Hematol 1994, 22, 482–487. [Google Scholar]
- Bodo M, Baroni T, Tabilio A. Haemopoietic and stromal stem cell regulation by extracellular matrix components and growth factors. J Stem Cells: 2009, 4, 57–69. [Google Scholar]
- Dormady SP, Bashayan O, Dougherty R, Zhang XM, Basch RS. Immortalized multipotential mesenchymal cells and the hematopoietic microenvironment. J Hematother Stem Cell Res 2001, 10, 125–140. [Google Scholar] [CrossRef]
- Durig J, Rosenthal C, Halfmeyer K, Wiemann M, Novotny J, Bingmann D, Duhrsen U, Schirrmacher K. Intercellular communication between bone marrow stromal cells and CD34+ haematopoietic progenitor cells is mediated by connexin 43-type gap junctions. Br J Haematol 2000, 111, 416–425. [Google Scholar]
- Garrett RW, Emerson SG. The role of parathyroid hormone and insulin-like growth factors in hematopoietic niches: physiology and pharmacology. Mol Cell Endocrinol 2008, 288, 6–10. [Google Scholar] [CrossRef]
- Heard J, Fichekson S, Varet B. Role of colony-stimulating activity in murine long-term bone marrow cultures: Evidence for its production and consumption by the adherent cells. Blood 1982, 59, 761–767. [Google Scholar] [CrossRef]
- Wagner W, Roderburg C, Wein F, Diehlmann A, Frankhauser M, Schubert R, Eckstein V, Ho AD. Molecular and secretory profiles of human mesenchymal stromal cells and their abilities to maintain primitive hematopoietic progenitors. Stem Cells 2007, 25, 2638–2647. [Google Scholar] [CrossRef]
- Can, A. Haematopoietic stem cells niches: interrelations between structure and function. Transfus Apher Sci 2008, 38, 261–268. [Google Scholar] [CrossRef] [PubMed]
- Himburg HA, Harris JR, Ito T, Daher P, Russell JL, Quarmyne M, Doan PL, Helms K, Nakamura M, Fixsen E, Herradon G, Reya T, Chao NJ, Harroch S, Chute JP. Pleiotrophin regulates the retention and self-renewal of hematopoietic stem cells in the bone marrow vascular niche. Cell Rep 2012, 25, 964–975. [Google Scholar]
- Nagasawa T, Omatsu Y, Sugiyama T. Control of hematopoietic stem cells by the bone marrow stromal niche: the role of reticular cells. Trends Immunol 2011, 32, 315–320. [Google Scholar] [CrossRef]
- Renström J, Kröger M, Peschel C, Oostendorp RA. How the niche regulates hematopoietic stem cells. Chem Biol Interact 2010, 184, 7–15. [Google Scholar] [CrossRef] [PubMed]
- Maruyama D, Watanabe T, Heike Y1, Nagase K, Takahashi N, Yamasaki S, Waki F, Yokoyama H, Kim SW, Kobayashi Y, Aizawa S, Tobinai K. Stromal cells in bone marrow play important roles in pro-inflammatory cytokine secretion causing fever following bortezomib administration in patients with multiple myeloma. Int J Hematol 2008, 88, 396–402. [Google Scholar] [CrossRef]
- Li ZW, Dalton WS. Tumor microenvironment and drug resistance in hematologic malignancies. Blood Rev 2006, 20, 333–42. [Google Scholar] [CrossRef]
- Konopleva M, Konoplev S, Hu W, Zaritskey AY, Afanasiev BV, Andreeff M. Stromal cells prevent apoptosis of AML cells by up-regulation of anti-apoptotic proteins. Leukemia. 2002, 16, 1713–24. [Google Scholar] [CrossRef]
- Hirabayashi Y, Hatta Y, Takeuchi J, Tsuboi I, Harada T, Ono K, Glomm WR, Yasuda M, Aizawa S. Novel three-dimensional long-term bone marrow culture system using polymer particles with grafted epoxy-polymer-chains supports the proliferation and differentiation of hematopoietic stem cells. Exp Biol Med 2011, 236, 1342–1350. [Google Scholar] [CrossRef]
- Yasuda M, Kunieda H, Ono K, Ogino H, Iwasaki T, Hiramoto M, Glomm WR, Hirabayashi Y, Aizawa S. Adhesive cell cultivation on polymer particles having grafted epoxy polymer chain. Tissue Cell 2011, 43, 115–124. [Google Scholar] [CrossRef]
- Harada T, Hirabayashi Y, Hatta Y, Tsuboi I, Glomn WR, Yasuda M, Aizawa S. Kinetics of hematopoietic stem cells and supportive activities of stromal cells in a three-dimensional bone marrow culture system. Growth Factors 2015, 33, 347–355. [Google Scholar] [CrossRef]
- Harada, T. , Tsuboi I., Utsunomiya M., Yasuda M., Aizawa S. Kinetics of leukemic cells in 3D culture with stromal cells and with arginine deprivation stress. J Biosci Bioeng 2020, 130, 650–658. [Google Scholar] [CrossRef] [PubMed]
- Ohmura K, Kawamoto H, Fujimoto S, Ozaki S, Nakao K, Katsura Y. Emergence of T, B, and myeloid lineage-committed as well as multipotent hemopoietic progenitors in the aorta-gonad-mesonephros region of day 10 fetuses of the mouse. J Immunol 1999, 163, 4788–95. [Google Scholar] [CrossRef]
- Watanabe Y, Mazda O, Aiba Y, Iwai K, Gyotoku J, IdeyamaS, Miyazaki J, Katsura Y. A murine thymic stromal cell line which may support the differentiation of CD4-8- thymocytes into CD4+CD8- alpha beta T cell receptor positive T cells. Cell Immunol 1992, 142, 385–397. [Google Scholar] [CrossRef] [PubMed]
- Itoh K, Tezuka H, Sakoda H, Konno M, Nagata K, Uchiyama T, Uchino H, Mori KJ. Reproducible establishment of hemopoietic supportive stromal cell lines from murine bone marrow. Exp Hematol 1989, 17, 145–53. [Google Scholar]
- Aizawa S, Hiramoto M, Hoshi H, Toyama K, Shima D, Handa H. Establishment of a stromal cell line from a MDS RA patient which induced an apoptotic change in hematopoietic and leukemic cells in vitro. Exp Hematol 2000, 28, 148–155. [Google Scholar] [CrossRef]
- Goldman-Leikin RE, Salwen HR, Herst CW, Variakojis D, Bian ML, Le Beau MM, Selvanayagan P, Marder R, Anderson R, Weitzman S, Rosen ST. Characterization of a novel myeloma cell line, MM.1S. J. Lab. Clin. Med. 1989, 113, 335–345. [Google Scholar] [CrossRef]
- Chauhan D, Catley L, Li G, Podar K, Hideshima T, Velankar M, Mitsiades C, Mitsiades N, Yasui H, Letai A, Ovaa H, Berkers C, Nicholson B, Chao TH, Neuteboom STC, Richardson P, Palladino MA, Anderson KC. A novel orally active proteasome inhibitor induces apoptosis in multiple myeloma cells with mechanisms distinct from Bortezomib. Cancer Cell 2005, 8, 407–19. [Google Scholar] [CrossRef]
- Hideshima T, Ikeda H, Chauhan D, Okawa Y, Raje N, Podar K, Mitsiades C, Munshi NC, Richardson PG, Carrasco RD, Anderson KC. Bortezomib induces canonical nuclear factor-kappaB activation in multiple myeloma cells. Blood 2009, 30, 1046–52. [Google Scholar] [CrossRef]
- Ri M, Iida S, Nakashima T, Miyazaki H, Mori F, Ito A, Inagaki A, Kusumoto S, Ishida T, Komatsu H, Shiotsu Y, Ueda R. Bortezomib-resistant myeloma cell lines: a role for mutated PSMB5 in preventing the accumulation of unfolded proteins and fatal ER stress. Leukemia 2010, 24, 1506–12. [Google Scholar] [CrossRef]
- Ito, S. Proteasome Inhibitors for the Treatment of Multiple Myeloma. Cancers (Basel) 2020, 22, 265. [Google Scholar] [CrossRef] [PubMed]
- Zhu Y, Zhao X, Zhu X, Wu G, Li Y, Ma Y, Yuan Y, Yang J, Hu Y, Ai L, Gao Q. Design, synthesis, biological evaluation, and structure-activity relationship (SAR) discussion of dipeptidyl boronate proteasome inhibitors, part I: comprehensive understanding of the SAR of alpha-amino acid boronates. J Med Chem 2009, 52, 4192–9. [Google Scholar] [CrossRef] [PubMed]
- Greenstein S, Krett NL, Kurosawa Y, Ma, Chauhan D, Hideshima T, Anderson KCM, Rosen ST. Model system to elucidate the characteristics, behavior, and signaling of steroid-sensitive and -resistant MM cells. Exp Hematol 2003, 31, 271–282. [Google Scholar] [CrossRef]
- Schofield, R. The relationship between the spleen colony-forming cell and the hematopoietic stem cell. Blood Cells 1978, 4, 7–25. [Google Scholar]
- Paraguassu-Braga FH, Borojevic R, Bouzas LF, Barcinski MA, Bonomo A. Bone marrow stroma inhibits proliferation and apoptosis in leukemic cells through gap junction-mediated cell communication. Cell Death Diffe 2003, 10, 1101–1108. [Google Scholar] [CrossRef]
- Aizawa, S. , Hiramoto M., Hoshi H., Nakano M., Iwase O., Yaguchi M., Nabeshima R., Shima D., Handa H., Toyama K. Bone marrow stroma from refractory anemia of myelodysplastic syndrome is defective in its ability to support normal CD34 positive cell growth in vitro. Leukemia Res 1999, 23, 239–246. [Google Scholar] [CrossRef]
- Hideshima T, Chauhan D, Richardson P, Mitsiades C, Mitsiades N, Hayashi T, Munshi N, Dang L, Castro A, Palombella V, Adams J, Anderson AC. NF-kappa B as a therapeutic target in multiple myeloma. J Biol Chem. 2002, 277, 16639–47. [Google Scholar] [CrossRef]
- Nunes A, Annunziata CM. Proteasome inhibitors: structure and function. Semin Oncol 2017, 44, 377–380. [Google Scholar] [CrossRef]
- Fink EE, Mannava S, Bagati A, Bianchi-Smiraglia A, Nair JR, Moparthy K, Lipchick BC, Drokov M, Utley A, Ross J, Mendeleeva LP, Savchenko VG, Lee KP, Nikiforov MA. Mitochondrial thioredoxin reductase regulates major cytotoxicity pathways of proteasome inhibitors in multiple myeloma cells. Leukemia 2015, 30, 104–11. [Google Scholar] [CrossRef]
- Noborio-Hatano K, Kikuchi J, Takatoku M, Shimizu R, Wada T, Ueda M, Nobuyoshi M, Oh I, Sato K, Suzuki T, Ozaki K, Mori M, Nagai T, MuroiK, Kano Y, Furukawa Y, Ozawa K. Bortezomib overcomes cell-adhesion-mediated drug resistance through downregulation of VLA-4 expression in multiple myeloma. Oncogene 2009, 28, 231–42. [Google Scholar] [CrossRef]
- Zhou B, Qin Y, Zhou J, Ruan J, Xiong F, Dong J, Huang X, Yu Z, Gao S. Bortezomib suppresses self-renewal and leukemogenesis of leukemia stem cell by NF-ĸB-dependent inhibition of CDK6 in MLL-rearranged myeloid leukemia. J Cell Mol Med 2021, 25, 3124–3135. [Google Scholar] [CrossRef]
|
Disclaimer/Publisher’s Note: The statements, opinions and data contained in all publications are solely those of the individual author(s) and contributor(s) and not of MDPI and/or the editor(s). MDPI and/or the editor(s) disclaim responsibility for any injury to people or property resulting from any ideas, methods, instructions or products referred to in the content. |
© 2025 by the authors. Licensee MDPI, Basel, Switzerland. This article is an open access article distributed under the terms and conditions of the Creative Commons Attribution (CC BY) license (http://creativecommons.org/licenses/by/4.0/).