
Submitted:
10 October 2025
Posted:
15 October 2025
You are already at the latest version
Abstract
Background: The practice of discontinuing mechanical ventilation during cardiopulmonary bypass (CPB) has been widely adopted in various cardiac surgery centers. Nonetheless, concerns have emerged regarding its possible adverse effects on postoperative pulmonary function. This study aimed to evaluate the effects of discontinued mechanical ventilation during CPB on postoperative gas exchange, X-ray results, ICU stay, mortality, reintubation, re-exploration, and bleeding. Methods: A prospective observational study was performed involving adult patients scheduled for elective cardiac surgery requiring CPB. Participants were divided into two groups according to their intraoperative ventilation strategy: one group had ventilation halted for a period required to perform surgical intervention (non-ventilated group), while the other maintained it (ventilated group) throughout CPB. Postoperative arterial carbon dioxide levels (PaCO2), arterial partial pressure of oxygen (PaO2), PaO2/FiO2 ratio (P/F ratio), arterial oxygen saturation (SaO2), and the ratio of PaCO2 to minute ventilation (PaCO2/MV) were measured at induction, postoperatively (in the ICU), and in a 24 h postoperative period. Chest X-ray data, mechanical ventilation time, LOS in ICU, re-exploration, reintubation, and bleeding parameters were documented. Analyses were also conducted across seven distinct age categories: <30, 30–40, 40–50, 50–60, 60–70, 70–80, and >80 years. Results: Individuals in the non-ventilated group exhibited elevated postoperative PaCO2 and PaCO2/MV ratios and lower postoperative P/F ratios. The difference in gas exchange leveled off within 24 h. There was no difference in the incidence of atelectasis (postoperatively in a 24 h period), in mechanical ventilation time, LOS in ICU, or mortality. Interestingly, postoperative PaCO2/MV peaked in the 40–50-year age group. Conclusions: Continued mechanical ventilation during CPB correlates with better postoperative gas exchange and better CO2 clearance. These results imply that maintaining low tidal volume ventilation during CPB may provide benefits, especially for patients aged 40–60 years.
Keywords:
mechanical ventilation
; cardiopulmonary bypass CPB
; cardiac surgery
1. Introduction
The optimal strategy for intraoperative mechanical ventilation during cardiopulmonary bypass (CPB) remains an unresolved issue in cardiac anesthesia and perioperative medicine. While some centers implement a “resting lung” approach, completely ceasing ventilation during CPB, others advocate for continued low tidal volume ventilation to prevent pulmonary atelectasis and maintain alveolar recruitment.
Some randomized controlled trials (RCTs) have investigated whether maintaining ventilation during CPB brings clinical benefits. The largest trial in this field, the MECANO trial, revealed no significant differences in overall postoperative complications between ventilated and non-ventilated groups. Of note, in this study, continuation of low tidal volume ventilation in coronary artery bypass grafting (CABG) demonstrated potential benefit in terms of the lower incidence of early respiratory failure and need for prolonged ventilation or reintubation [1,2].
The study conducted by Davoudi et al. (2010) compared two cohorts of patients with continued or ceased ventilation during CPB and revealed that oxygenation status immediately postoperatively was better by 10 mmHg, and postoperative parameters of lung functionality such as forced expiratory volume and forced vital capacity were better in the ventilated group [3]. Moreover, the ventilated group demonstrated an earlier extubation time, leading the authors to conclude that protective continued ventilation during CPB yields superior pulmonary outcome improvements without increasing intraoperative risks.
Other studies have highlighted potential secondary benefits such as decreased atelectasis incidence [4] and less fluid accumulation in extravascular pulmonary spaces in patients with maintained ventilation [5]. Several animal studies demonstrated that continued ventilation preserves the physiological structure of lung parenchyma, leading to more effective gas exchange and less inflammation during histopathologic lung analysis [6,7]. One recent retrospective study including around 101 non-ventilated and 398 ventilated patients during CPB reported no discrepancies in the rate of postoperative pulmonary complications such as extended mechanical ventilation time, greater pleural effusion, and higher incidence of pneumonia [8].
Different hospitals apply varying ventilation protocols during cardiac surgeries involving extracorporeal circuits [9]. The differences between studies may be because of the absence of a universal ventilation protocol and the high inter-institutional variability in surgical practices. The heterogeneity in ventilation protocols may include variations in tidal volume, respiratory rate, PEEP, FiO2, application of recruitment maneuvers, and timing of ventilation cessation. In addition, attention should focus both on short- and long-term postoperative pulmonary outcomes. A recent study performed by Rogers et al. demonstrated that preserving ventilation during mitral and aortic valve surgeries resulted in an improved lung function test at the 6–8-week follow-up and a better 6 min performance test at discharge [10].
In this context, the present study aimed to compare the effects of continued versus discontinued mechanical ventilation during CPB, focusing on blood gas parameters in the immediate and 24 h postoperative period, X-ray findings, and other clinical data such as length of stay (LOS) in ICU, reintubation, mechanical ventilation time, incidence of re-exploration, mortality, and bleeding.
2. Materials and Methods
2.1. Study Design
This prospective, single-center observational study was conducted at the UMC Heart Center (Astana, Kazakhstan). The study protocol received approval from the institutional Local Bioethics Commission of the National Scientific Cardiac Surgery Center (Approval Number: 2022/01-137/CI dated 20 October 2022), and written informed consent was obtained from all participants prior to enrollment in accordance with the principles outlined in the Declaration of Helsinki.
2.2. Patient Population
The study included adult patients scheduled for elective cardiac surgery requiring cardiopulmonary bypass (CPB) between 1 January 2023 and 1 June 2024. Patients were eligible for inclusion if they met the following criteria:
- Age ≥18 years;
- Elective coronary artery bypass grafting (CABG) and/or valve surgery;
- Intraoperative requirement for CPB.
Patients were excluded based on the following criteria:
- Reoperation;
- Severe chronic pulmonary disease (GOLD stage III–IV);
- Preoperative mechanical ventilation or the presence of a tracheostomy;
- Refusal to provide informed consent.
Participants were divided into two groups according to the intraoperative ventilation strategy employed during CPB:
- The ventilated group included 59 patients who received low tidal volume mechanical ventilation throughout CPB.
- The non-ventilated group included 64 patients in whom mechanical ventilation was temporarily discontinued upon initiation of CPB, as determined by a surgeon, when low tidal volume ventilation interfered with certain surgical steps.
2.3. Anesthesia, Intraoperative, and Postoperative Ventilation Management
All patients underwent general anesthesia with induction achieved using propofol, fentanyl, and rocuronium. Anesthesia was maintained with sevoflurane and a continuous propofol infusion of 4–6 mg/kg/h according to the department’s protocol.
In the non-ventilated group, mechanical ventilation was stopped after CPB initiation for a period required by the surgeon to implement certain surgical interventions. The stop ventilation time lasted from 1 to 187 min. In the ventilated group, a lung-protective ventilation strategy according to the department’s protocol was maintained during CPB in PCV/VCV mode with the following settings: tidal volume, 2–3 mL/kg ideal body weight; FiO2, 0.5; respiratory rate, 6–8 breaths/min; positive end-expiratory pressure (PEEP), +5 cmH2O. CPB was conducted under standardized conditions using non-pulsatile flow (2.4 L/min/m2), spontaneous normothermia, and alpha-stat pH management. In the ICU, patients were supported with ventilation in BiPAP mode.
2.4. Data Collection
Arterial blood gas (ABG) samples were collected at three time points according to the department’s protocol: before induction of anesthesia, postoperatively within 5–10 min after transportation to the ICU, and in a 24 h postoperative period. The following gas exchange parameters were measured: arterial partial pressure of carbon dioxide (PaCO2, mmHg), arterial partial pressure of oxygen (PaO2, mmHg), PaO2/FiO2 ratio (P/F ratio), and arterial oxygen saturation (SaO2). Additional perioperative variables were recorded, including duration of CPB; aortic cross-clamp time; mechanical ventilation (MV) time; stop ventilation time; X-ray results immediately after surgery in ICU (5–10 min) and in a 24 h postoperative period; days in ICU; and baseline demographics, including gender, age, and BMI.
2.5. Study Outcomes
The primary outcome of the study was the comparison of PaCO2, PaO2, and the P/F (PaO2/FiO2) ratio between the ventilated and non-ventilated groups. Secondary outcomes included the assessment of PaCO2/MV (PaCO2/minute ventilation, mmHg/L/min) index, X-ray findings, ICU stay, mortality, reintubation, re-exploration, and bleeding. The PaCO2/MV index is a surrogate for ventilatory efficiency and dynamically assesses how effectively the lungs eliminate CO2 per unit ventilation. A sample size assessment was performed assuming a medium effect size (Cohen’s d = 0.5) for the difference in the primary outcome parameters, a two-sided α = 0.05, and power = 0.80.
2.6. Statistical Analysis
Statistical analysis was performed using the open-access R environment. Continuous variables are expressed as mean ± standard deviation (SD) or median with interquartile range [IQR], depending on the distribution. Categorical data are presented as absolute numbers and percentages. The Student’s t-test or Mann–Whitney U test was used for continuous variables. The Kruskal–Wallis test was applied to continuous variables comparing more than two groups. Pearson and Spearman correlations were also calculated. A p-value of <0.05 was considered statistically significant.
3. Results
Table 1 shows the demographic data for the ventilated and non-ventilated groups. Age, height, weight, and BMI were consistent between groups. There were 21 females and 43 males (n = 64) in the non-ventilated group, and 18 females and 41 males (n = 59) in the ventilated group. A statistically significant difference in sex distribution was not observed between groups (chi-square, p = 0.936).
Following detailed data analysis, the two groups of cardiac surgery patients were compared during the perioperative period. Careful comparison revealed statistically significant differences in gas exchange immediately after surgery in patients admitted within 5–10 min to the ICU. All patients in the ICU were supported with BiPAP ventilatory support. The non-ventilation group exhibited higher arterial PaCO2 levels in the ICU (mean 44.38 mmHg) compared with the ventilated group (mean 40.56 mmHg; p = 0.0262). Similarly, postoperative PaO2 values were lower in the non-ventilated group (mean 127.8 mmHg) than in the ventilated group (mean 144.3 mmHg; p = 0.0436). The P/F ratio, a marker of oxygenation efficiency, was reduced by 14% in the non-ventilated group (291.7) compared with the ventilated group (339.2; p = 0.0276). Table 2 represents the means of statistically different parameters between groups.
However, at the 24 h postoperative mark, these differences were largely resolved. PaCO2 levels remained slightly higher in the stop ventilation group (44.0 vs. 42.1 mmHg; p = 0.054), but PaO2, SaO2, and P/F ratios were comparable between groups (all p > 0.1). Postoperative gas exchange parameters analyzed in the ICU after 24 h are represented in Table 3. A 24 h postoperative gas exchange check point was registered according to the department’s protocol in postoperative patient management.
Further comparison of the P/F ratio at three perioperative time points showed statistically significant changes in the parameter within each group. Perioperative time points were registered per the department’s protocol in perioperative patient management. At the initiation of anesthesia, both groups exhibited similar P/F ratio values. However, immediately following surgery, the group with continued ventilation demonstrated significantly higher oxygenation, as evidenced by a statistically significant difference in P/F ratios. After 24 h, the P/F values converged again, showing no significant difference between groups. Table 4 and Figure 1 below illustrate the distribution of P/F values across the three perioperative time points for both the ventilated and non-ventilated groups.
Minute ventilation (MV) values were comparable between the ventilated and non-ventilated groups at induction and by the completion of the surgery (5.71 vs. 5.75, 6.17 vs. 6.04). Minute ventilation at the end of the surgery was registered in the ICU within 5–10 min after transportation from the surgery unit. In the ventilated group, MV values were higher at surgery completion, indicating the need for more ventilatory support (6.17 vs. 5.71, p = 0.012). The situation was similar in the non-ventilated group, although the increase in postoperative ventilatory support was borderline significant (5.75 vs. 6.04, p = 0.057). Table 5 demonstrates the abovementioned parameters.
Next, the PaCO2/MV index, used as an indicator of ventilatory efficiency, showed no significant difference before CPB in non-ventilated and ventilated groups respectively (7.95 vs. 7.13; p = 0.439), but was slightly elevated after CPB in the non-ventilated group (7.44 vs. 6.79; p = 0.059), suggesting a trend towards reduced CO2 elimination efficiency.
This borderline p-value may suggest that statistical significance could be achieved with a larger sample size. Figure 2 and Figure 3 compare the PaCO2/MV index before and after CPB and the PaCO2/MV index in the ICU after the surgery for each group, respectively.
The distribution of the PaCO2/MV index across age groups showed considerable overlap between the non-ventilated and ventilated groups, suggesting similar patterns. In both groups, an upward trend was observed, with values increasing from younger ages towards 40–50 years, especially in the non-ventilated group, then stabilizing or slightly decreasing towards the older age groups. Figure 4 demonstrates these trends.
The distribution of the PaCO2/MV index across age groups showed considerable overlap between the non-ventilated and ventilated groups, suggesting similar patterns. In both groups, an upward trend was observed, with values increasing from younger ages towards 40–50 years, especially in the non-ventilated group, then stabilizing or slightly decreasing towards the older age groups. Figure 4 demonstrates these trends.
The Kruskal–Wallis test showed that median PaCO2/MV values differed significantly across age groups (<30, 30–40, 40–50, 50–60, 60–70, 70–80, >80 years; p = 0.033). Table 6 shows the number of patients in each age group for the ventilated and non-ventilated groups.
Because the mode of ventilation did not result in statistically significant differences in PCO2/MV in the ICU, we combined the data to explore the correlation pattern between age and PCO2/MV. The combined data showed a U-shaped or curved relationship with PCO2/MV after surgery, with higher values observed in middle-aged patients and lower values towards extremes.
A quadratic regression model showed a linear correlation between age and PCO2/MV by 50 years of age (≈49.7 years), with a predicted peak maximum value of 7.5 (β = +0.20, p = 0.046). At older ages, the slope became negative, creating a curved decline (β = −0.002, p = 0.028). Although the linear terms of the curved correlation trend are statistically significant, the overall fitness of the model explains only 5% of the variation in PCO2/MV (R2 ≈ 0.051), representing a weak correlation. Figure 5 demonstrates this quadratic regression.
Postoperative PaCO2/MV also showed a slight correlation with patient BMI—the higher the BMI, the higher the index (Figure 6)—correlating with theoretical expectations of an increase in atelectasis formation with greater weight. Correlation analysis between BMI and PCO2/MV showed a positive correlation coefficient of r = 0.296, p = 0.023 in the ventilation group. Although the correlation coefficient remained positive (r = 0.203; p = 0.107) in the non-ventilated group, it was not statistically significant.
Post-extubation chest X-rays revealed no statistically significant difference in atelectasis incidence: eight cases in the non-ventilated group vs. seven cases in the ventilated group. At 24 h, three new cases of atelectasis were detected in the stop ventilation group, while the no stop ventilation group had none, although this difference was not statistically significant. Table 7 represents the X-ray findings at both postoperative periods. X-ray findings in the ICU (postoperatively, during 5–10 min) and at a 24 h postoperative mark were captured according to the department’s protocol of postoperative patient management.
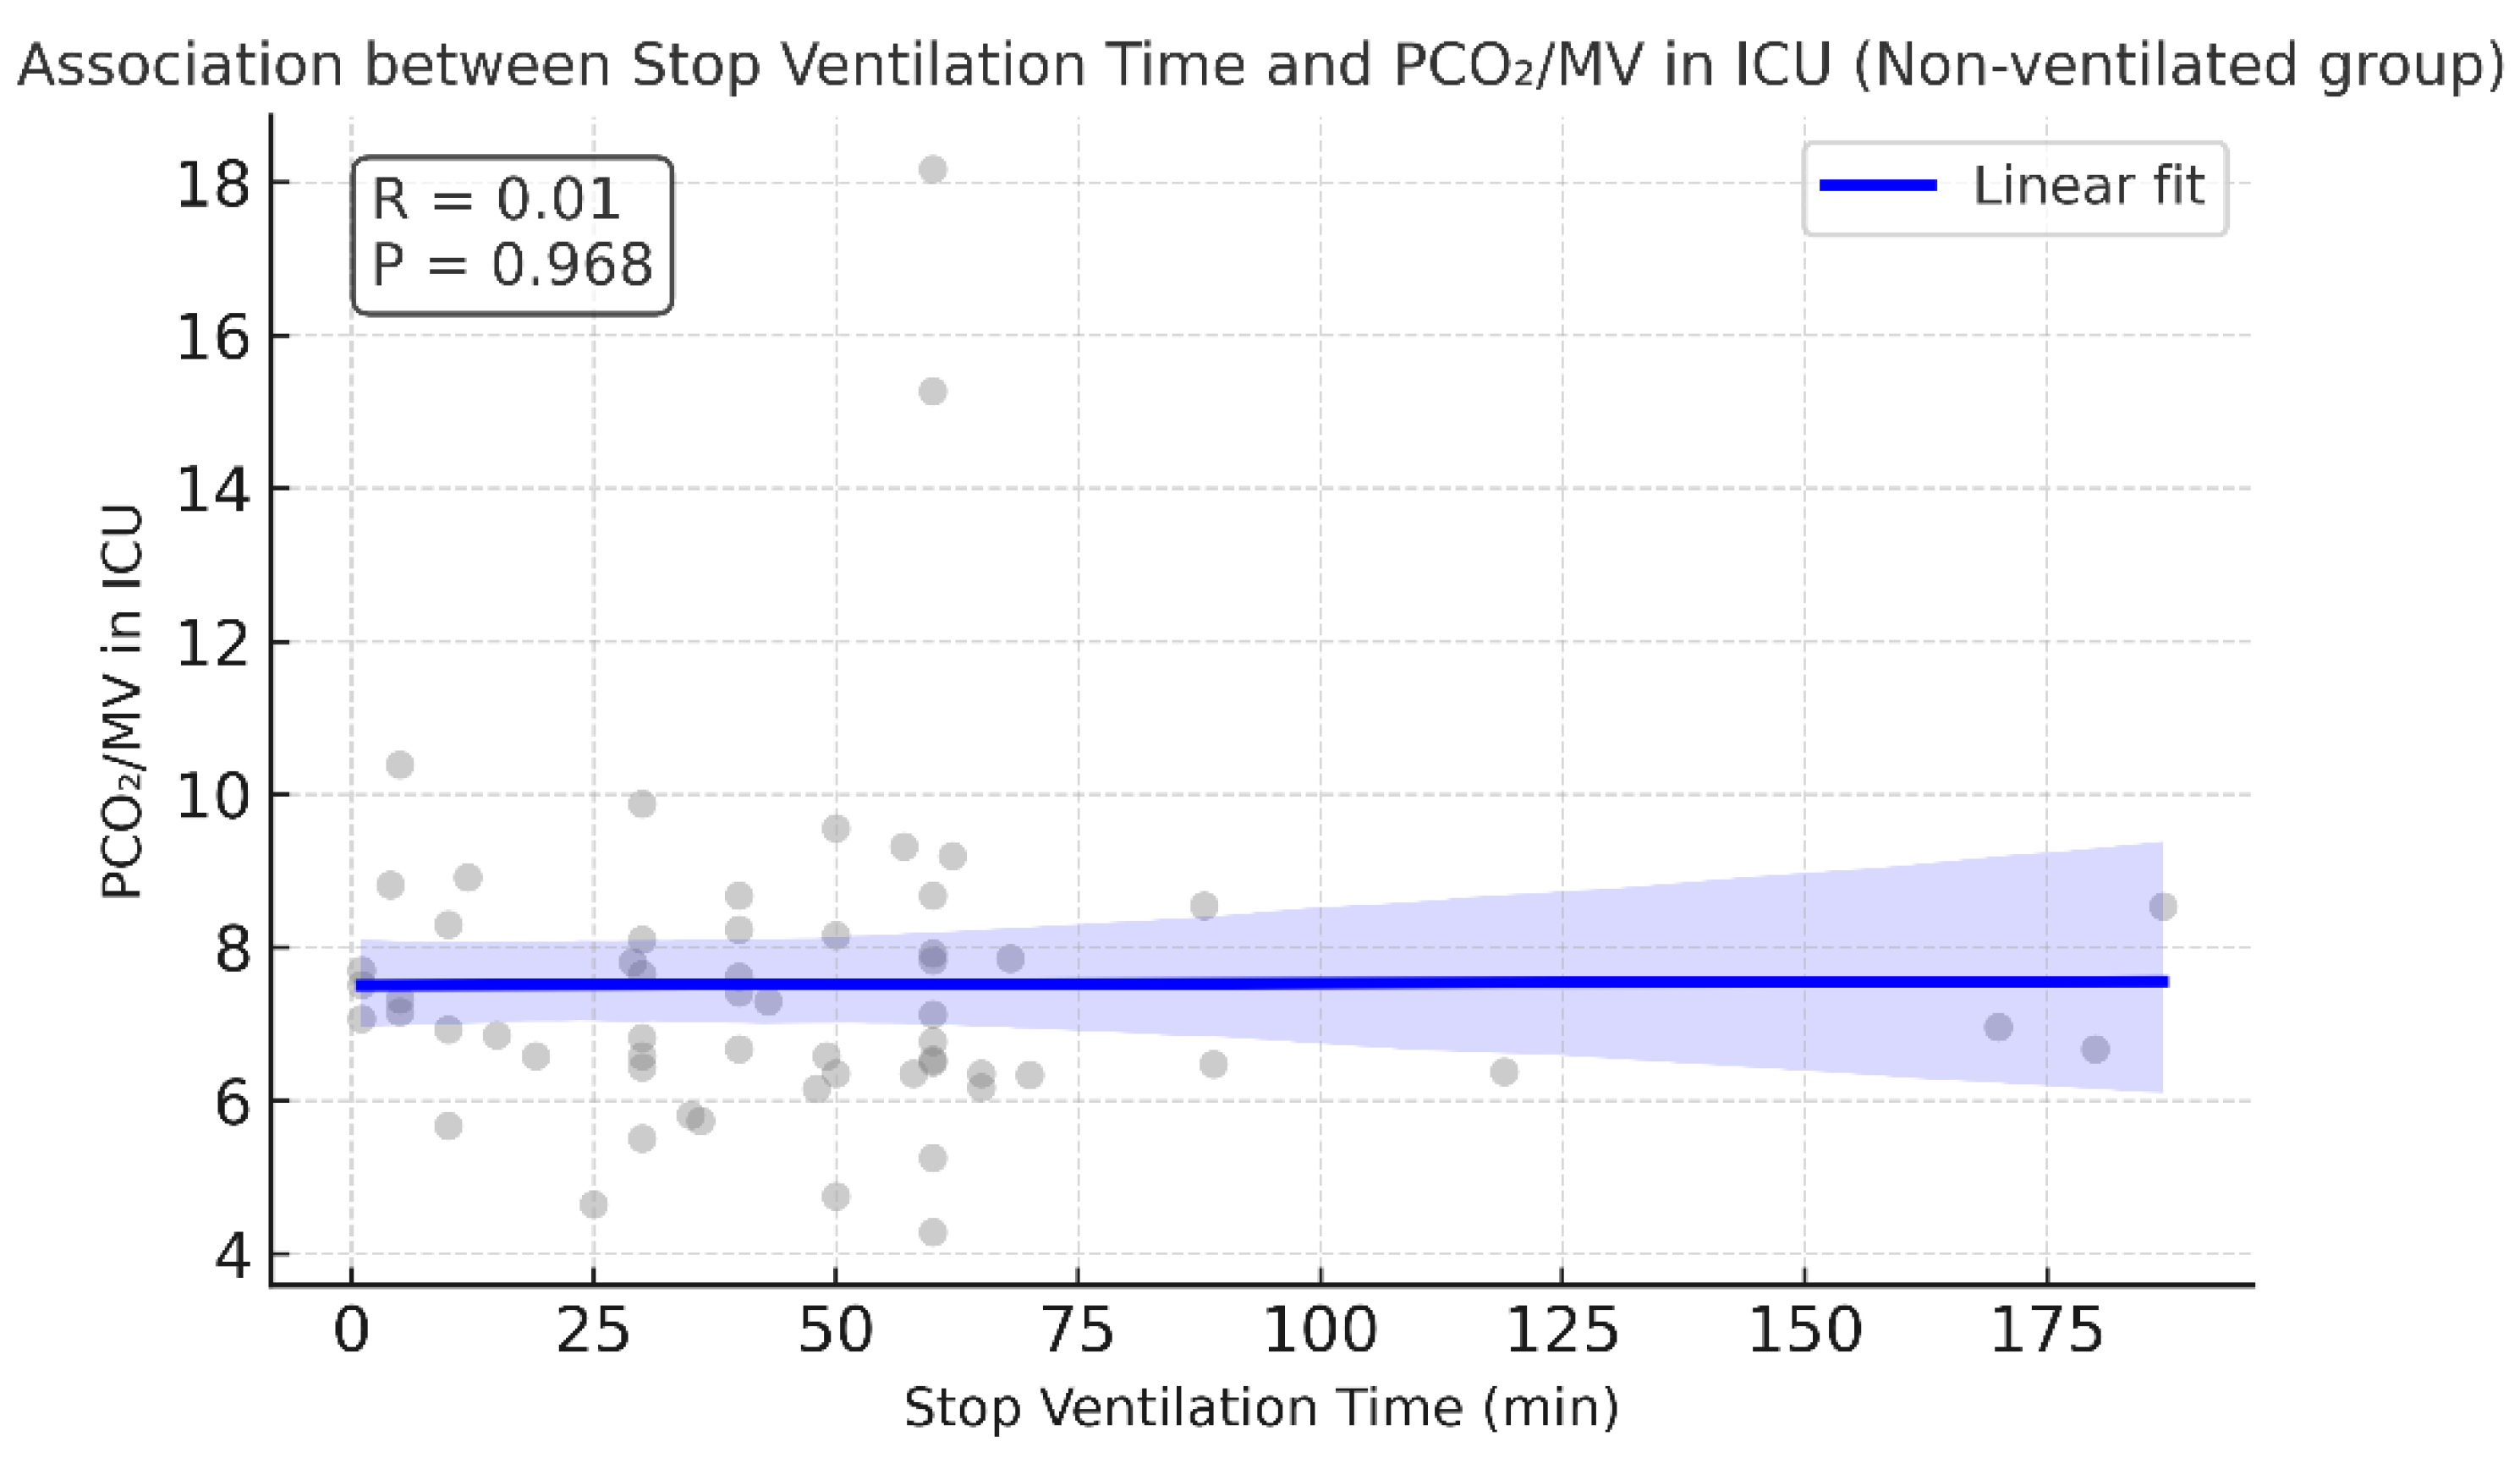
The mean value of the stop ventilation time observed in the non-ventilated group was 48.52 ± 38.81 min. Correlation analyses showed that the stop ventilation time in the non-ventilated group was moderately associated with longer cross-clamp and CPB times (r ≈ 0.47 and 0.41, respectively). Interestingly, CPB time in the non-ventilated group was higher compared with the ventilated group (108.89 vs. 90.05 min, p = 0.033). Table 8 contains the CPB and cross-clamp times for both groups. No correlation was found between stop ventilation time and LOS in the ICU, incidence of postoperative pulmonary complications, or PaCO2/MV in the ICU.
Figure 7.
No correlation observed between PaCO2/MV in ICU and stop ventilation time in non-ventilated group. Pearson correlation, r = 0.005, p = 0.968. The regression line is almost flat, supporting the absence of an association.
Figure 7.
No correlation observed between PaCO2/MV in ICU and stop ventilation time in non-ventilated group. Pearson correlation, r = 0.005, p = 0.968. The regression line is almost flat, supporting the absence of an association.
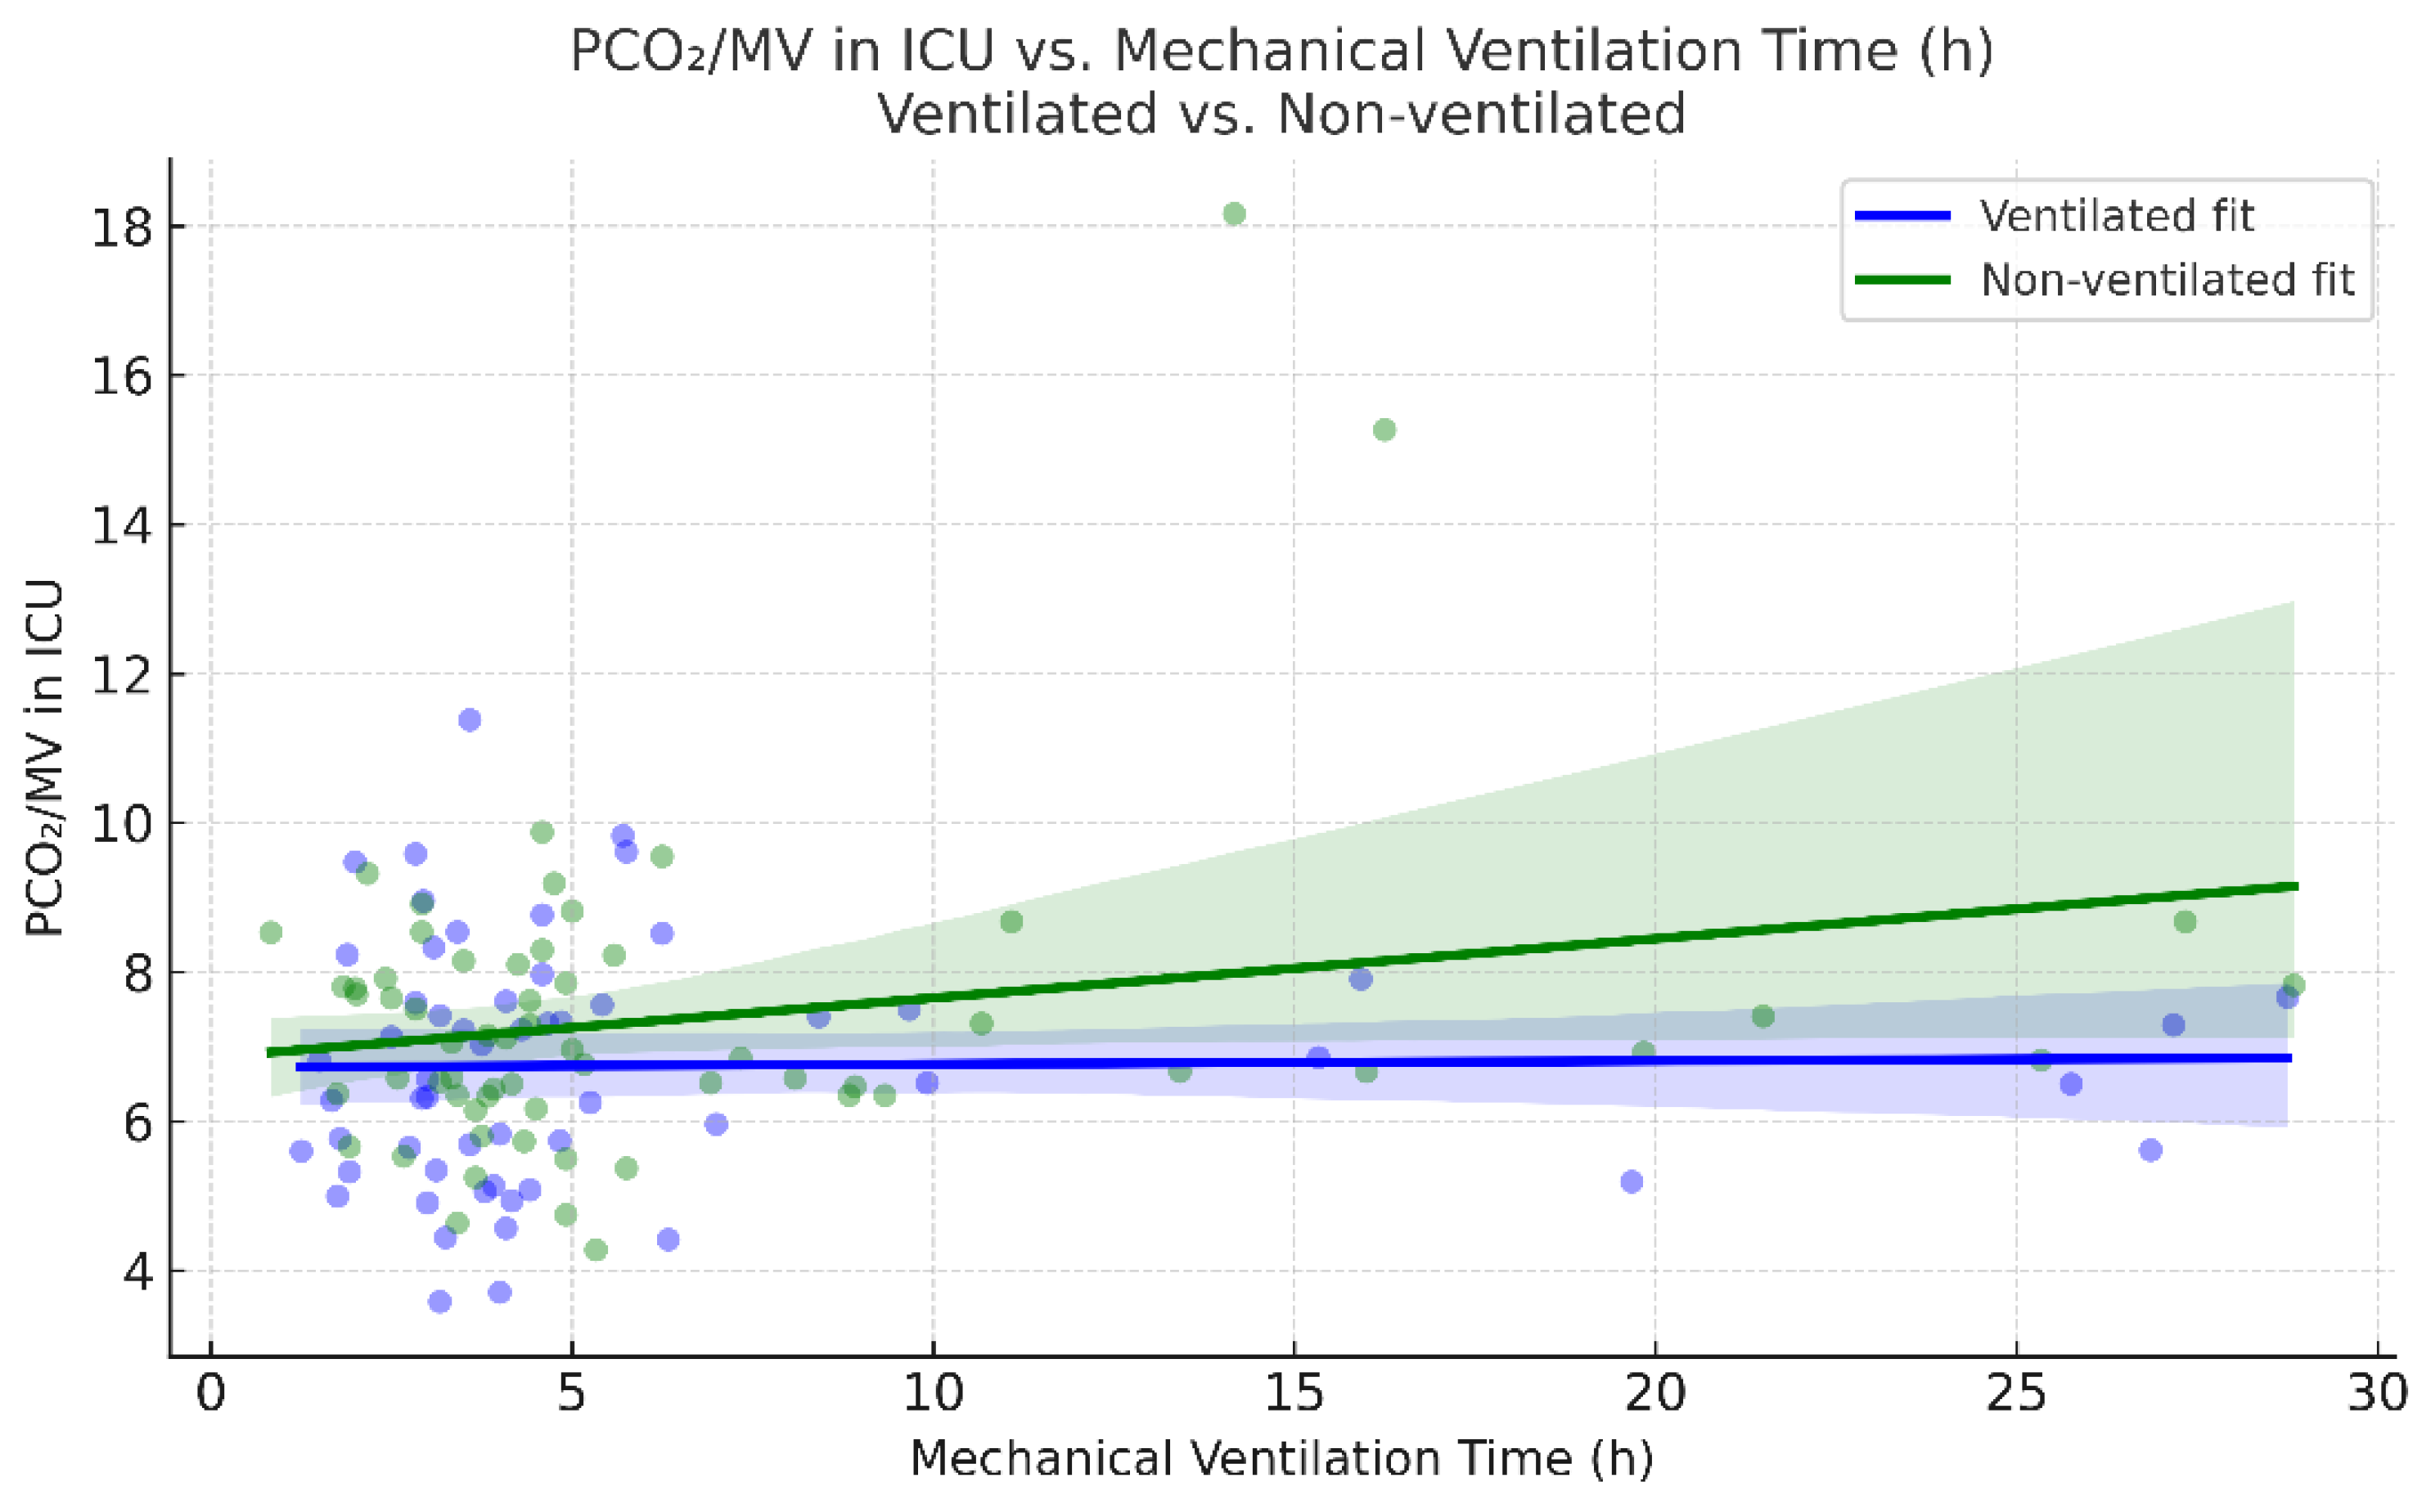
Mechanical ventilation time was counted from arrival in the ICU until extubation. Mechanical ventilation time was comparable between the ventilated and non-ventilated groups (6.25 vs. 6.75, p = 0.677). In the non-ventilated group, mechanical ventilation time showed a weak and possibly borderline significant association with PaCO2/MV after surgery (Pearson r = 0.24, p = 0.061). No such association was noted for the ventilated group.
Figure 8.
Mechanical ventilation time and PaCO2/MV in ICU association across ventilation mode.
Other parameters that were compared between the ventilated and non-ventilated groups did not show substantial discrepancies. There were no significant differences in LOS in the ICU (mean 2.8 days vs. 2.33 days p = 0.345), mortality (mean 0.017 vs. 0.019, p = 0.96), or postoperative (mean 1.93 vs. 1.95, p = 0.967) and 24 h lactate levels (mean 1.76 vs. 1.88, p = 0.564527). Table 8 demonstrates the values of the compared parameters.
4. Discussion
The present prospective observational study evaluated the effects of intraoperative ventilation discontinuation during cardiopulmonary bypass (CPB) on postoperative gas exchange and lung function in adult cardiac surgery patients. Our findings demonstrate that temporary cessation of mechanical ventilation is associated with a transient but statistically significant increase in PaCO2 (44.38 vs. 40.56, p = 0.0262) and a reduction in the extent of oxygenation (P/F 291.70 vs. 339.18, p = 0.0276) during the immediate postoperative period between non-ventilated and ventilated patients. This suggests that the interruption of ventilation may reduce CO2 elimination and disturb efficient oxygenation in the early recovery phase. Importantly, these gaseous discrepancies were resolved in a 24 h postoperative period, indicating a transient nature of the effect.
Our observations coincide with previous studies demonstrating that better ventilation and oxygenation status were observed in patients with continued low tidal volume ventilation during the immediate postoperative period. Davoudi et al., in a randomized controlled study with 50 patients in each group, demonstrated better post-CPB PaO2 values in patients who remained on low tidal volume ventilation mode compared with patients who had ceased ventilation (85 vs. 75, p < 0.05) [3]. Similar animal experiments demonstrated that low-frequency ventilation retained during CPB resulted in better PaO2 and less histological lung damage compared with patients where ventilation was not provided or only PEEP of + 5 cm H2O was supported [7].
A previously conducted meta-analysis of randomized controlled trials supported the evidence of better oxygenation status in patients on continuous ventilation during the immediate postoperative period, although a beneficial reduction in pulmonary complications was not observed [11]. The largest RCT, the MECANO trial, demonstrated that stop ventilation strategy was not inferior to continued ventilation in terms of the mechanical ventilation time, mortality, postoperative respiratory failure, and incidence of reintubation [1]. Considering other pulmonary complications, a recent study concluded that cessation of ventilation during CPB does not reduce the incidence of infection during the postoperative recovery period [12]. However, in patients undergoing mitral and aortic valve surgeries, preserved ventilation was associated with better forced vital capacity and the ratio of forced expiratory volume after 1 second over forced vital capacity by 0.19 and 0.135 L, respectively, in the postoperative period and 5% better in 6–8-week postoperative follow-up [10]. Moreover, this study demonstrated that the soluble receptor for advanced glycation end products (sRage) was significantly higher in the preserved ventilation group, although the ventilation mode was low frequency rather than low tidal volume ventilation. In addition, the 6-minute walk test performed upon discharge showed better performance by 63.2 m in the group with continued ventilation [10]. This may suggest that continuing ventilation during CPB may result in better lung function parameters that could influence long-term patient recovery.
Ventilation management was standardized at induction and resulted in almost identical values between the ventilated and non-ventilated groups (5.71 vs. 5.75, p = 0.836). Postoperative minute ventilation values measured in the ICU demonstrated a slight increase in minute ventilation demand in both ventilated and non-ventilated groups (6.17 vs. 6.04 L/min, p = 0.433). From a ventilatory support perspective, cessation of ventilation during CPB did not require more ventilatory support: although the increase in postoperative ventilatory support was statistically significant in the ventilated group (from 5.71 ± 1.33 to 6.17 ± 1.00 L/min, p = 0.012), the statistical difference was borderline in the non-ventilated group (from 5.75 ± 1.05 to 6.04 ± 0.77 L/min, p = 0.057), inferring the need of a larger patient sample. The results may also imply that changes in lung mechanics triggered by anesthesia and CPB may require greater postoperative ventilatory support.
Considering that the minute ventilation values were comparable between groups, the PaCO2/MV parameter was used as a measure of ventilatory efficiency regarding CO2 clearance. In the non-ventilated group, the higher PaCO2/MV index in the stop ventilation group suggested a trend towards less efficient CO2 elimination, although this did not reach statistical significance (p = 0.059). Quadratic regression analysis revealed an age-dependent U-shaped relationship, with PaCO2/MV reaching a peak at around 50 years. This indicates that middle-aged patients may be more susceptible to impaired ventilatory efficiency postoperatively, independent of ventilation strategy. The U-shaped correlation agrees with the findings of a previous study that assessed atelectasis formation in 243 patients by comparing CT atelectasis before and after anaesthesia induction [13]. The study revealed that after anesthesia induction, atelectasis formation increased up to 50 years of age and then declined with older age. Similarly, higher BMI correlated positively with PaCO2/MV in ventilated patients, supporting the hypothesis that obesity predisposes patients to reduced lung compliance and greater risk of postoperative atelectasis. In contrast, no significant association was observed in non-ventilated patients.
Radiographic evidence of atelectasis was not significantly different between groups, yet new cases detected only in the non-ventilated group suggested that subtle effects on lung recruitment may not be fully captured by chest X-ray alone. However, a study conducted on 60 randomly distributed patients showed that low tidal volume ventilation (3 mL/kg, RR 6/min, and PEEP +5 cm H2O) demonstrated a lower incidence of postoperative atelectasis of 10% compared with 36.6% (p < 0.05) in the group in which only PEEP of +5 cm H2O (CPAP mode of ventilation) was preserved during CPB [4]. Others suggest that lung ultrasound can be easily implemented and is a sensitive bedside evaluation of postoperative atelectasis [14]. In our results, while radiographic atelectasis was slightly more frequent in the stop ventilation group at the 24 h postoperative mark, this did not reach statistical significance. Whilst decreased or absent lung ventilation and a relaxed diaphragm could contribute to atelectasis formation during anesthesia, the CT results of one study showed that a 32% increase in postoperative heart mass by 32% led to the increased incidence of formed atelectasis in the subjacent lung area in patients after CABG [15]. Thus, the effect of increased cardiac muscle should be considered in future studies.
Stop ventilation time correlated moderately with cross-clamp and CPB durations, but showed no association with ICU stay, PaCO2/MV, or other pulmonary complications. Mechanical ventilation time demonstrated only a weak and borderline association with PaCO2/MV in the non-ventilated group, suggesting limited predictive value. Interestingly, we also observed higher re-exploration rates and more frequent moderate bleeding in the stop ventilation group. No incidence of intraoperative transfusions in either group was observed. In contrast, Rodriguez-Blanco et al. (2016) reported higher incidences of coagulopathy and mediastinal re-exploration in the group with preserved lung ventilation and perfusion via the shunt to the pulmonary artery [16]. Although this could be coincidental and require a larger sample size, it raises the possibility that stopping ventilation may influence coagulation dynamics, warranting further investigation.
Although the observed physiological changes were transient and did not impact the ICU stay or need for reintubation, they may be clinically relevant in vulnerable populations, such as patients with pre-existing lung disease, obesity, or advanced age. During CPB, pulmonary circulation is significantly decreased or avoided. Longer CPB times may exacerbate ischemia–reperfusion lung injury, further disturbing delicate lung parenchyma and subsequently ventilation and oxygenation status in postoperative recovery. An animal study showed that pigs on preserved lung perfusion and ventilation had higher P/F ratios (90 min after CPB start: 244 ± 57 vs. 126 ± 64 mmHg, p < 0.001), fewer polymorphonuclear cells during pulmonary histopathologic analysis, and less thickening of alveoli septa, which is vital for gas exchange, compared with standard CPB without preservation of lung perfusion and ventilation [6]. Another human observational study demonstrated that ventilation preservation during CPB resulted in reduced extravascular pulmonary fluid (530 vs. 672, p= 0.028) and faster extubation time (3.6 vs. 4.8) in cardiac surgery patients undergoing CABG [5], highlighting the benefits of continued lung ventilation.
Overall, our findings support the physiological rationale for continued ventilation during CPB to reduce immediate postoperative derangements in gas exchange. However, the transient nature of these differences raises questions regarding the clinical significance of this practice in the long term. However, animal histological examinations [6,7] have demonstrated that continued ventilation during CPB reduced distortion in lung parenchyma. The present study assessed long-term effects in patients after mitral and aortic valve surgeries, demonstrating better lung functionality and 6-minute walking test at follow-up. In addition, the overexpression of sRafe biomarkers in the ventilated group may play a role in ischemia–reperfusion injury caused by CPB and could inform clinical decisions concerning the optimal ventilation strategy during CPB.
Larger multicenter randomized trials are needed to determine whether maintaining ventilation during CPB translates into improved long-term outcomes in lung functional capacity and patient physical fitness. Furthermore, the application of sRage and its clinical implications is of particular interest. It would also be interesting to examine how lung functional capacity may change across age groups.
Strengths and Limitations
The strength of this study is the granular perioperative dataset with repeated gas exchange measurements (immediately post-op and at 24 h period), allowing us to separate early from transient effects. We also examined complementary PaCO2/MV, age- and BMI-dependencies, and radiographic outcomes, providing a multidimensional view of pulmonary physiology after CPB.
Limitations include its single-center design and modest sample size, which may have contributed to the borderline p-values. There was also reduced power for subgroup analyses in extreme age strata. Management heterogeneity, including recruitment maneuvers after CPB or immediately after ICU arrival and further ventilator setting adjustments, was not documented and may have confounded immediate ICU and at 24 h gas exchange differences. We also did not document changes in extravascular liquid accumulation in lungs, which could have been performed by ultrasound during the postoperative period. Finally, chest X-ray assessment could have been complemented by ultrasound-guided bedside assessment of lung atelectasis in the ICU immediately after surgery; however, the number of physicians performing such an assessment was limited.
5. Conclusions
Intraoperative cessation of ventilation during CPB leads to transient impairment in gas exchange, consistent with prior literature. Although these changes are resolved within 24 h, the findings support consideration of individualized ventilation strategies, particularly for patients with a compromised pulmonary reserve.
Author Contributions
Conceptualization I.W., T.L. and A.Z.; methodology I.W., A.Z. and T.L.; validation, formal analysis, A. Z. and T.L; investigation, P.B., I.N., B. Z.. And D.A; resources T.K. and A.K, data curation A. Z., and A.K, writing—original draft preparation, A.Z. and T.L.; writing—review and editing, A.Z., T.L., A.M., R. S., and T.A.; visualization A.Z. and T.L., supervision, T.A.; project administration, A.K. and I.W. All authors have read and agreed to the published version of the manuscript.
Funding
This research is funded by the Science Committee of the Ministry of Science and Higher Education of the Republic of Kazakhstan (АР19677596).
Informed Consent Statement
Informed consent was obtained from all subjects involved in the study.
Data Availability Statement
The original contributions presented in this study are included in the article. Further inquiries can be directed to the corresponding author.
Conflicts of Interest
“The authors declare no conflicts of interest.” “The funders had no role in the design of the study; in the collection, analyses, or interpretation of data; in the writing of the manuscript; or in the decision to publish the results”.
References
- Nguyen, L. S., Estagnasie, P., Merzoug, M., Brusset, A., Law Koune, J. D., Aubert, S., Waldmann, T., Naudin, C., Grinda, J. M., Gibert, H., & Squara, P. (2021). Low Tidal Volume Mechanical Ventilation Against No Ventilation During Cardiopulmonary Bypass in Heart Surgery (MECANO): A Randomized Controlled Trial. Chest, 159(5). [CrossRef]
- Boussion, K., Tremey, B., Gibert, H., Koune, J. D. L., Aubert, S., Balcon, L., & Nguyen, L. S. (2023). Efficacy of maintaining low-tidal volume mechanical ventilation as compared to resting lung strategy during coronary artery bypass graft cardiopulmonary bypass surgery: A post-hoc analysis of the MECANO trial. Journal of Clinical Anesthesia, 84. [CrossRef]
- Davoudi, M., Farhanchi, A., Moradi, A., Bakhshaei, M. H., & Safarpour, G. (2010). The Effect of Low Tidal Volume Ventilation during Cardiopulmonary Bypass on Postoperative Pulmonary Function. The Journal of Tehran Heart Center, 5(3), 128–131.
- Kirillov, A. Y., Yavorovskiy, A. G., Vyzhigina, M. A., Komarov, R. N., Nogtev, P. v., Bagdasarov, P. S., Khalikova, E. Y., Yavorovskaya, D. A., & No, I. I. (2021). Respiratory tactics during cardiopulmonary bypass in cardiac surgery. Messenger of Anesthesiology and Resuscitation, 18(2). [CrossRef]
- John, L. C. H., & Ervine, I. M. (2008). Work in progress report - Cardiopulmonary bypass: A study assessing the potential benefit of continued ventilation during cardiopulmonary bypass. Interactive Cardiovascular and Thoracic Surgery, 7(1). [CrossRef]
- da Costa Freitas, C. R., Sa Malbouisson, L. M., Benicio, A., Negri, E. M., Bini, F. M., Massoco, C. O., Otsuki, D. A., Melo, M. F. V., & Carmona, M. J. C. (2016). Lung perfusion and ventilation during cardiopulmonary bypass reduces early structural damage to pulmonary parenchyma. Anesthesia and Analgesia, 122(4). [CrossRef]
- Imura, H., Caputo, M., Lim, K., Ochi, M., Suleiman, M. S., Shimizu, K., & Angelini, G. D. (2009). Pulmonary injury after cardiopulmonary bypass: Beneficial effects of low-frequency mechanical ventilation. Journal of Thoracic and Cardiovascular Surgery, 137(6). [CrossRef]
- Zdravkovic, R., Tatic, M., Golubovic, M., Preveden, M., Klinovski, M., & Vickovic, S. (2023). Effects of mechanical ventilation during cardiopulmonary bypass on postoperative pulmonary complications. Medicinski Pregled, 76(1–2). [CrossRef]
- Bignami, E., di Lullo, A., Saglietti, F., Guarnieri, M., Pota, V., Scolletta, S., Volta, C. A., Vetrugno, L., Cavaliere, F., & Tritapepe, L. (2019). Routine practice in mechanical ventilation in cardiac surgery in Italy. Journal of Thoracic Disease, 11(4). [CrossRef]
- Rogers, C. A., Mazza, G., Maishman, R., Thirard, R., Evans, J., de Jesus, S., Beard, C., Angelini, G., Millar, A., Jarad, N., Tomkins, S., Hillier, J., Suleiman, M.-S., & Ascione, R. (2024). Low Frequency Ventilation During Cardiopulmonary Bypass to Protect Postoperative Lung Function in Cardiac Valvular Surgery: The PROTECTION Phase II Randomized Trial. Journal of the American Heart Association, 13(19), e035011. [CrossRef]
- Chi, D., Chen, C., Shi, Y., Wang, W., Ma, Y., Zhou, R., Yu, H., & Liu, B. (2017). Ventilation during cardiopulmonary bypass for prevention of respiratory insufficiency: A meta-analysis of randomized controlled trials. In Medicine (United States) (Vol. 96, Issue 12). [CrossRef]
- Tadié, J.-M., Ouattara, A., Laviolle, B., Lesouhaitier, M., Esvan, M., Rousseau, C., Grégoire, M., Gaudriot, B., Nesseler, N., Labaste, F., Sanchez, P., Marcheix, B., Beurton, A., Dureau, P., Demondion, P., Fouquet, O., Rineau, E., Amour, J., Verhoye, J., … Flecher, E. (2025). Maintaining ventilation with very low tidal volume and positive-end expiratory pressure versus no ventilation during cardiopulmonary bypass for cardiac surgery in adults: a randomized clinical trial. Intensive Care Medicine, 51(5), 849–860. [CrossRef]
- Hedenstierna, G., Tokics, L., Reinius, H., Rothen, H. U., Östberg, E., & Öhrvik, J. (2020). Higher age and obesity limit atelectasis formation during anaesthesia: an analysis of computed tomography data in 243 subjects. British Journal of Anaesthesia, 124(3). [CrossRef]
- Tusman, G., Acosta, C. M., & Costantini, M. (2016). Ultrasonography for the assessment of lung recruitment maneuvers. In Critical Ultrasound Journal (Vol. 8, Issue 1). [CrossRef]
- Neves, F. H., Carmona, M. J., Auler, J. O. C., Rodrigues, R. R., Rouby, J. J., & Malbouisson, L. M. S. (2013b). Cardiac compression of lung lower lobes after coronary artery bypass graft with cardiopulmonary bypass. PLoS ONE, 8(11). [CrossRef]
- Rodriguez-Blanco, Y. F., Gologorsky, A., Salerno, T. A., Lo, K., & Gologorsky, E. (2016). Pulmonary Perfusion and Ventilation during Cardiopulmonary Bypass Are Not Associated with Improved Postoperative Outcomes after Cardiac Surgery. Frontiers in Cardiovascular Medicine, 3. [CrossRef]
Figure 1.
P/F ratio at three time points. There is a significant drop in the P/F ratio by the end of the surgery (measured in ICU within 5–10 min after transportation, on BiPAP mode of ventilation) in each group (398 → 339, p < 0.001 for ventilated group, and 428 → 292, p < 0.001 for non-ventilated group). In the ventilated group, the P/F ratio values in ICU and after the 24 h postoperative mark are very close (339 → 325, p = 0.42), reflecting almost no change in oxygenation. Conversely, in the non-ventilated group, oxygenation improved after 24 h compared with the P/F ratio values in the ICU (292 → 326, p = 0.045).
Figure 2.
PCO2/MV index before and after CPB between the ventilated and non-ventilated groups.
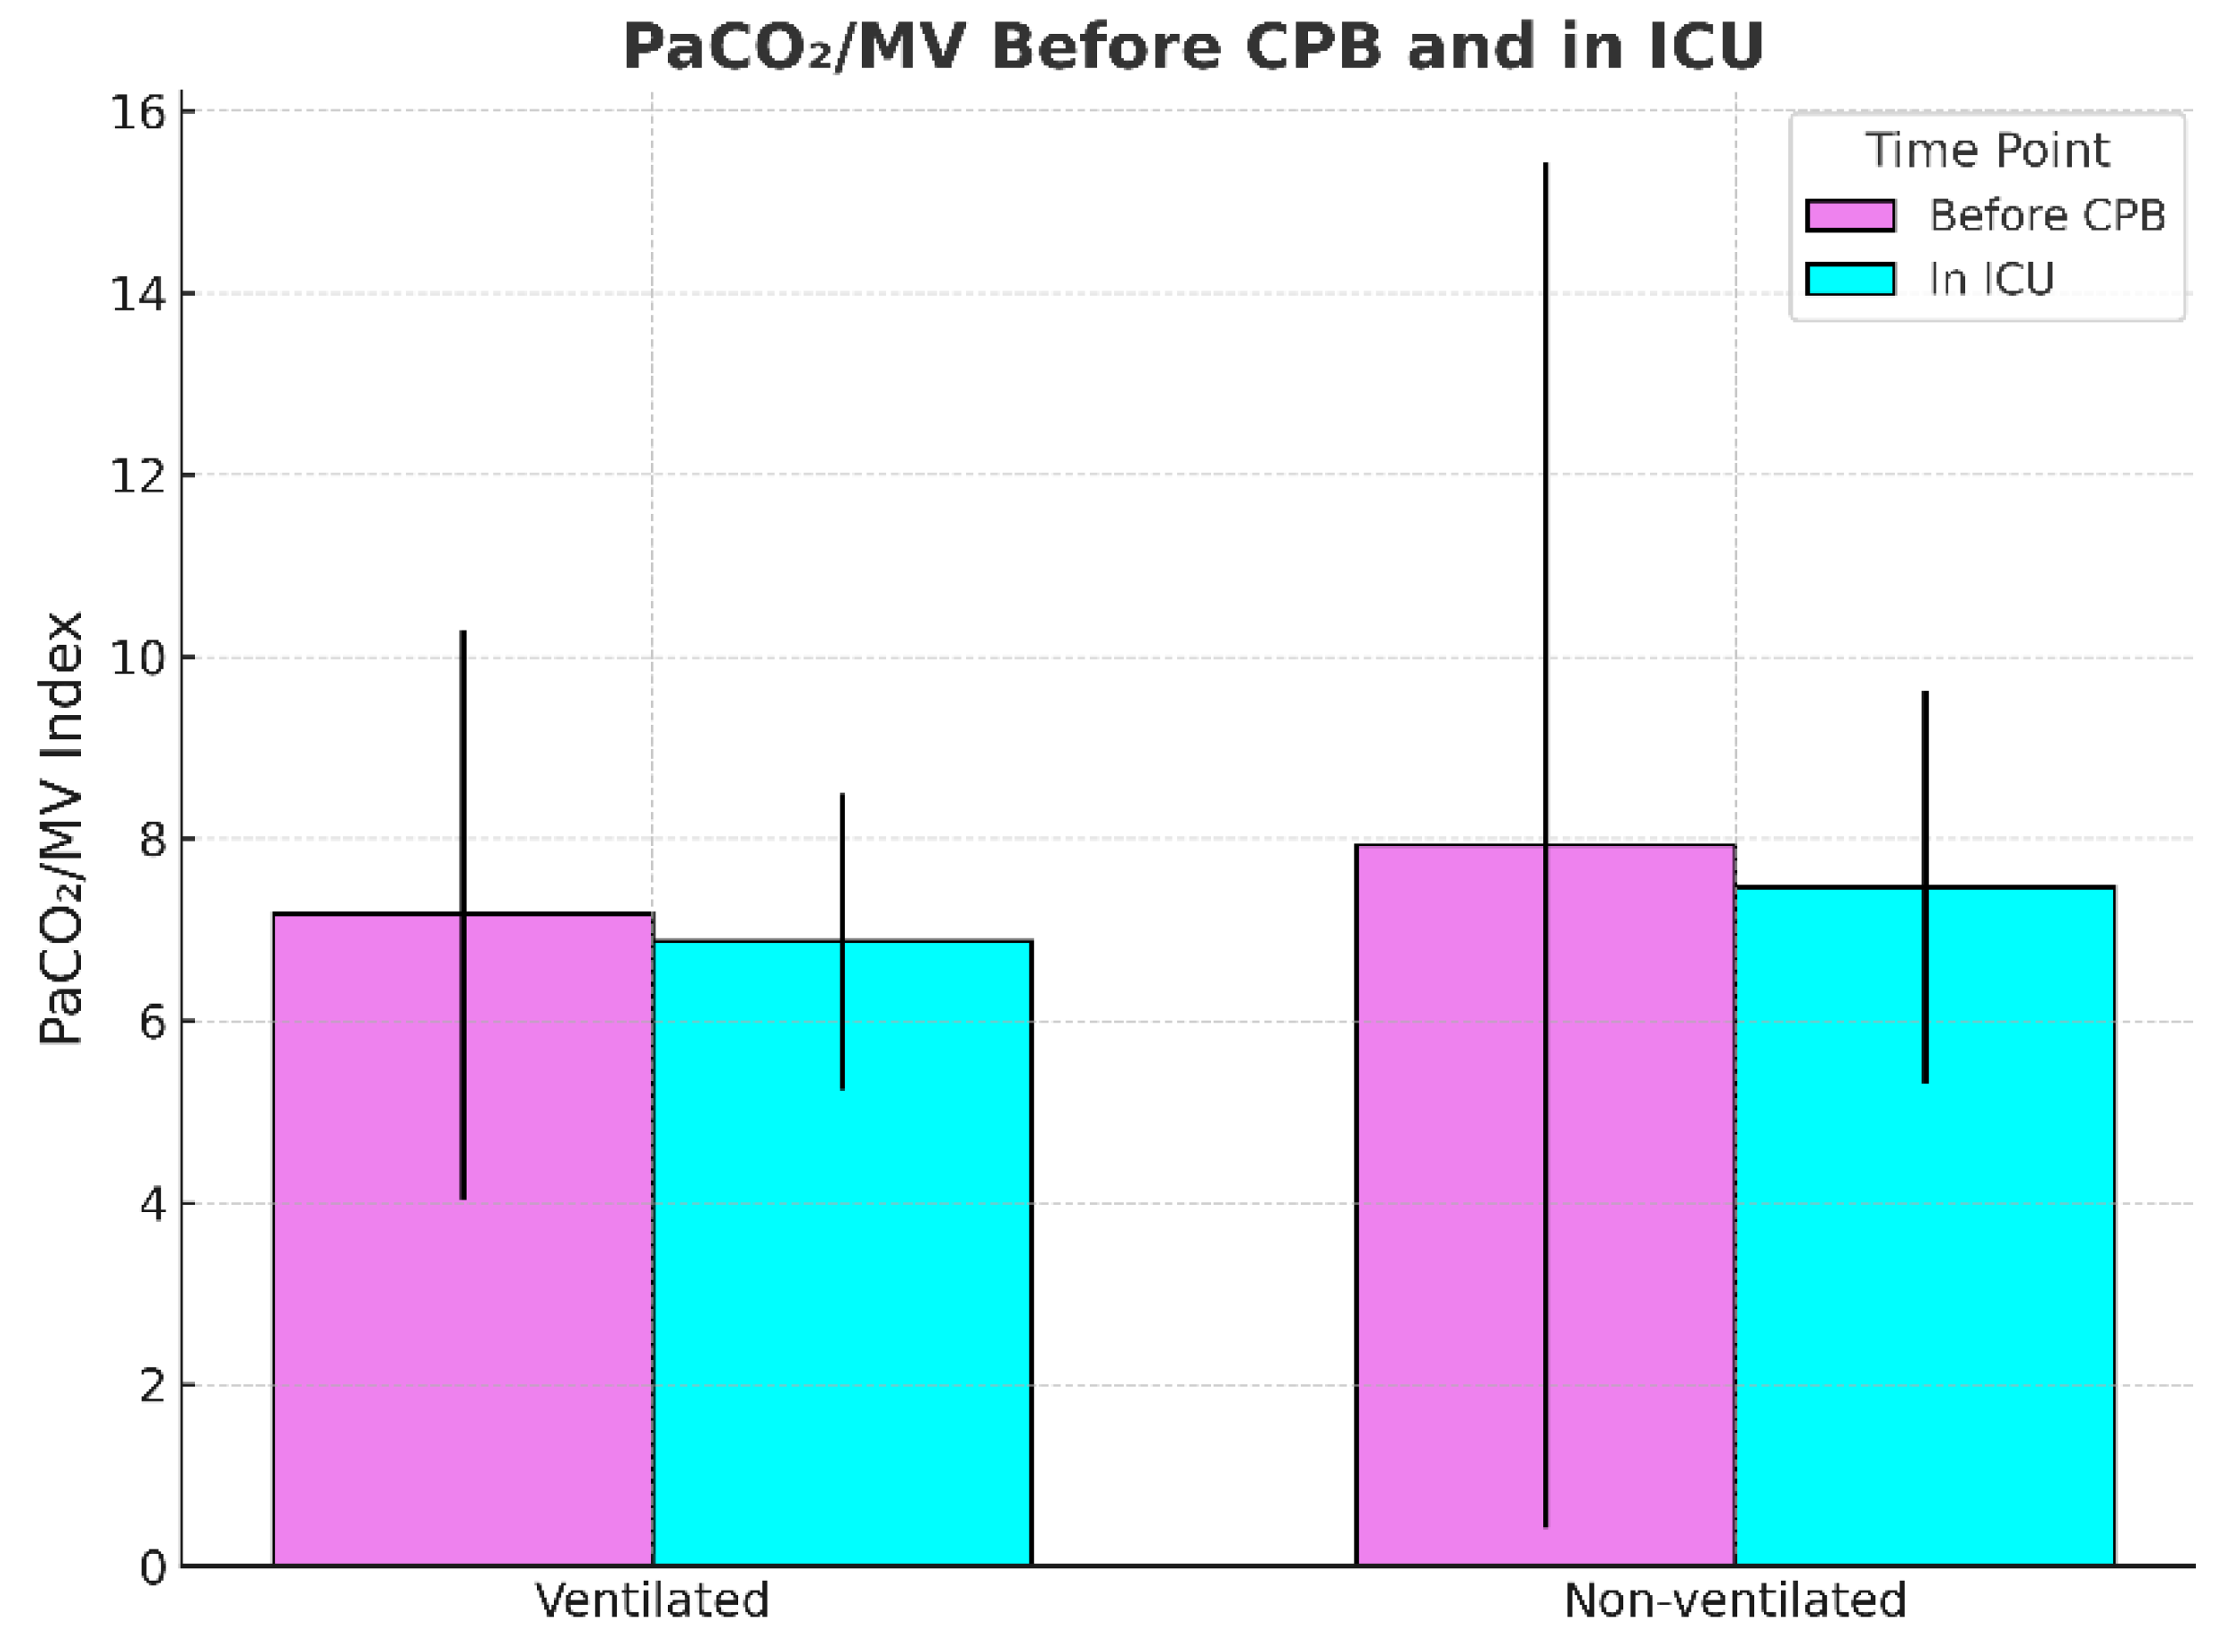
Figure 3.
Comparison of PaCO2/MV in ICU between ventilated and non-ventilated groups, measured within 5–10 min after transportation to the ICU from a surgery unit.
Figure 3.
Comparison of PaCO2/MV in ICU between ventilated and non-ventilated groups, measured within 5–10 min after transportation to the ICU from a surgery unit.
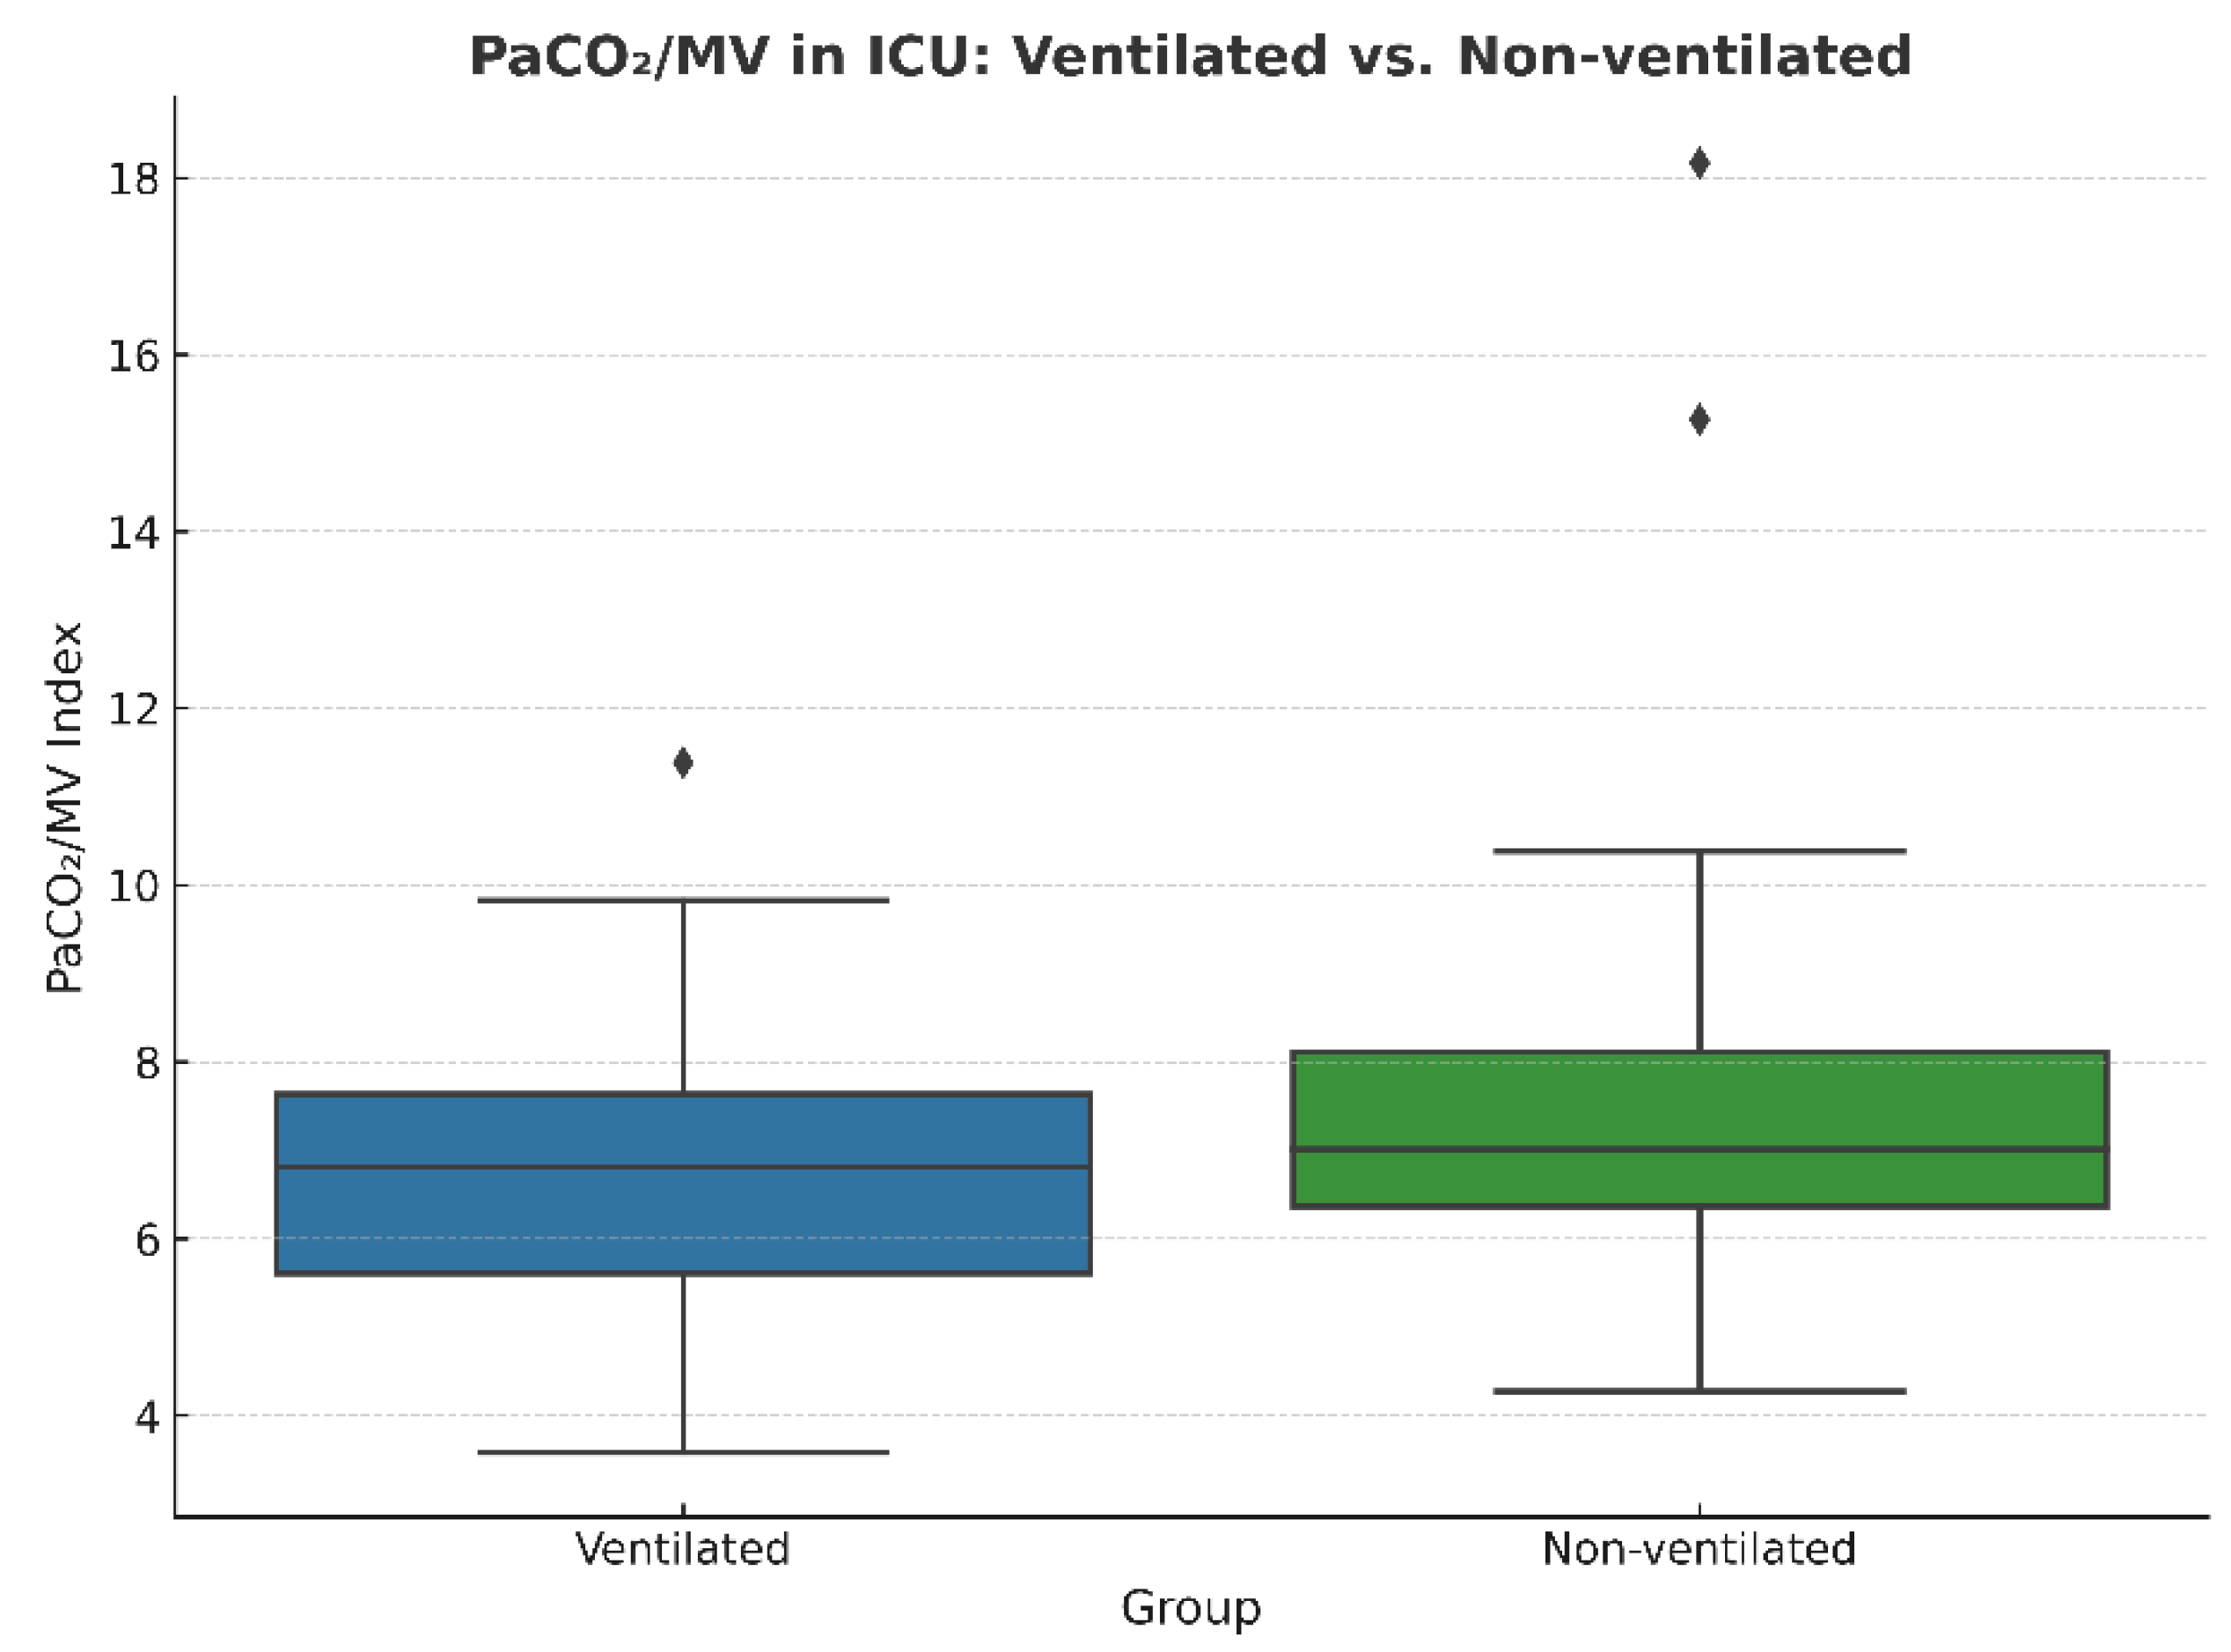
Figure 4.
PaCO2/MV in ICU across age groups between ventilated and non-ventilated groups.
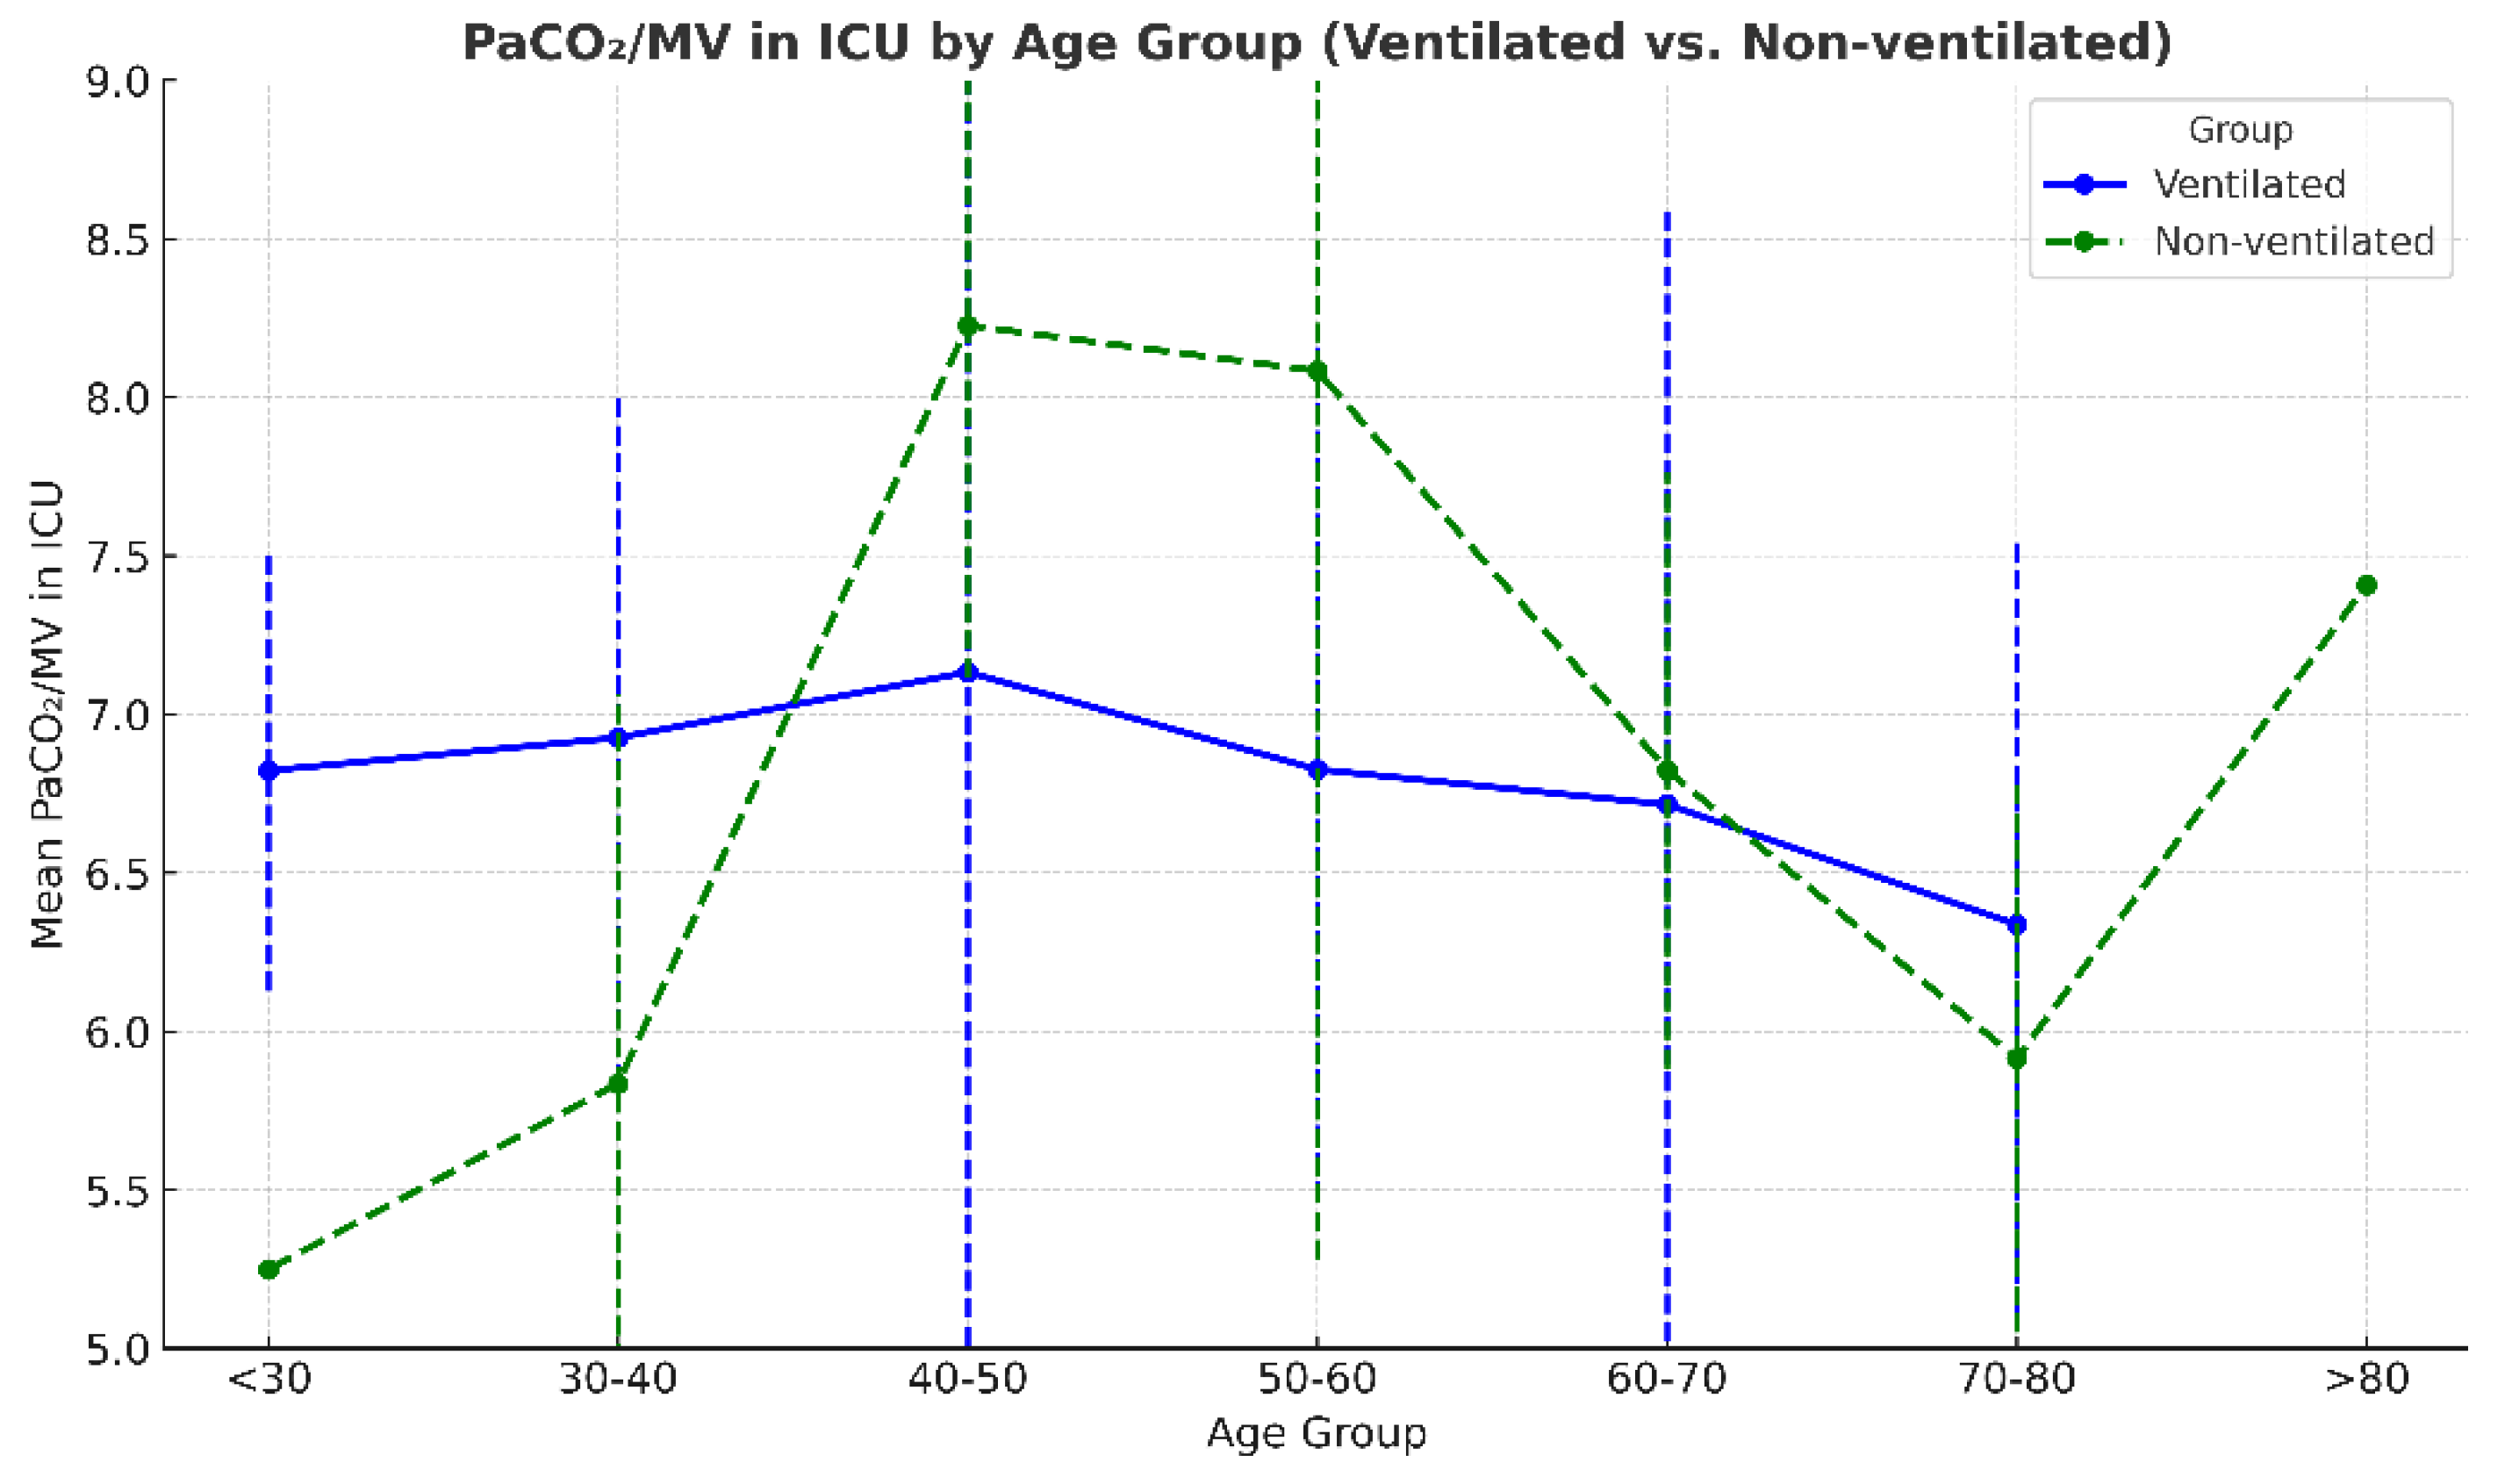
Figure 5.
PaCO2/MV index in ICU (postoperatively) across age: ventilated and non-ventilated groups combined.
Figure 5.
PaCO2/MV index in ICU (postoperatively) across age: ventilated and non-ventilated groups combined.
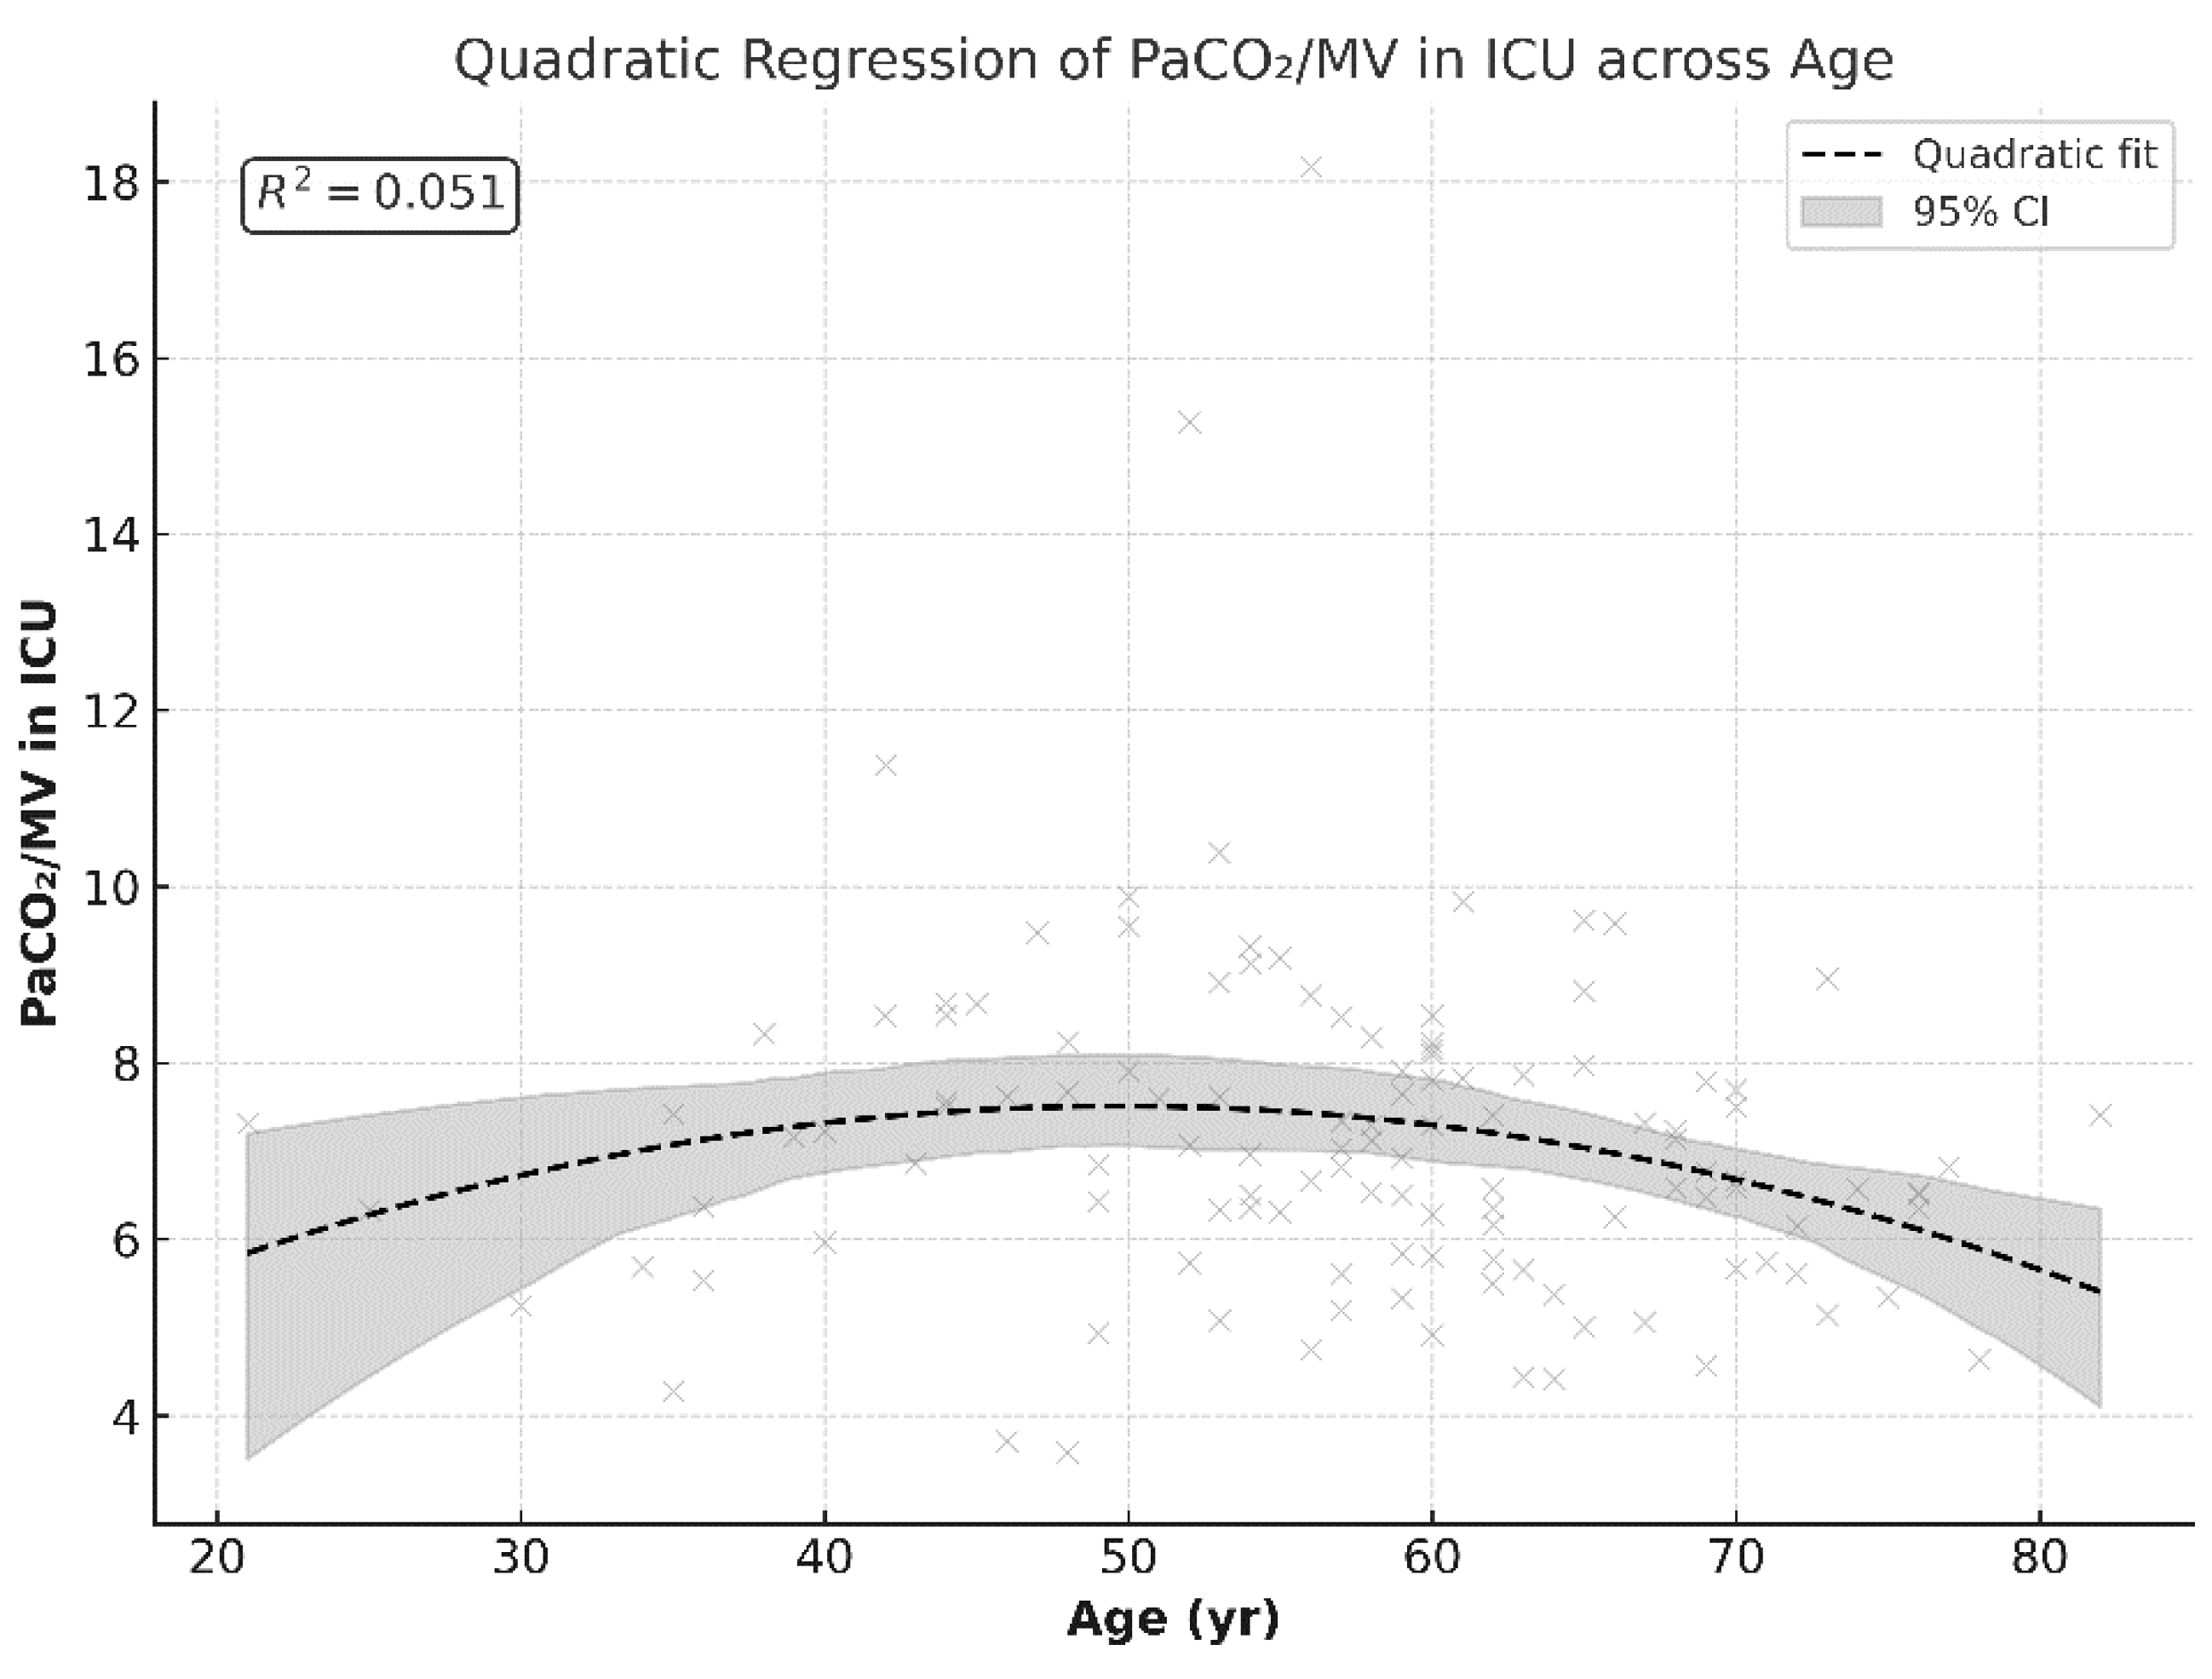
Figure 6.
Correlation between BMI and PCO2/MV across ventilated and non-ventilated groups.
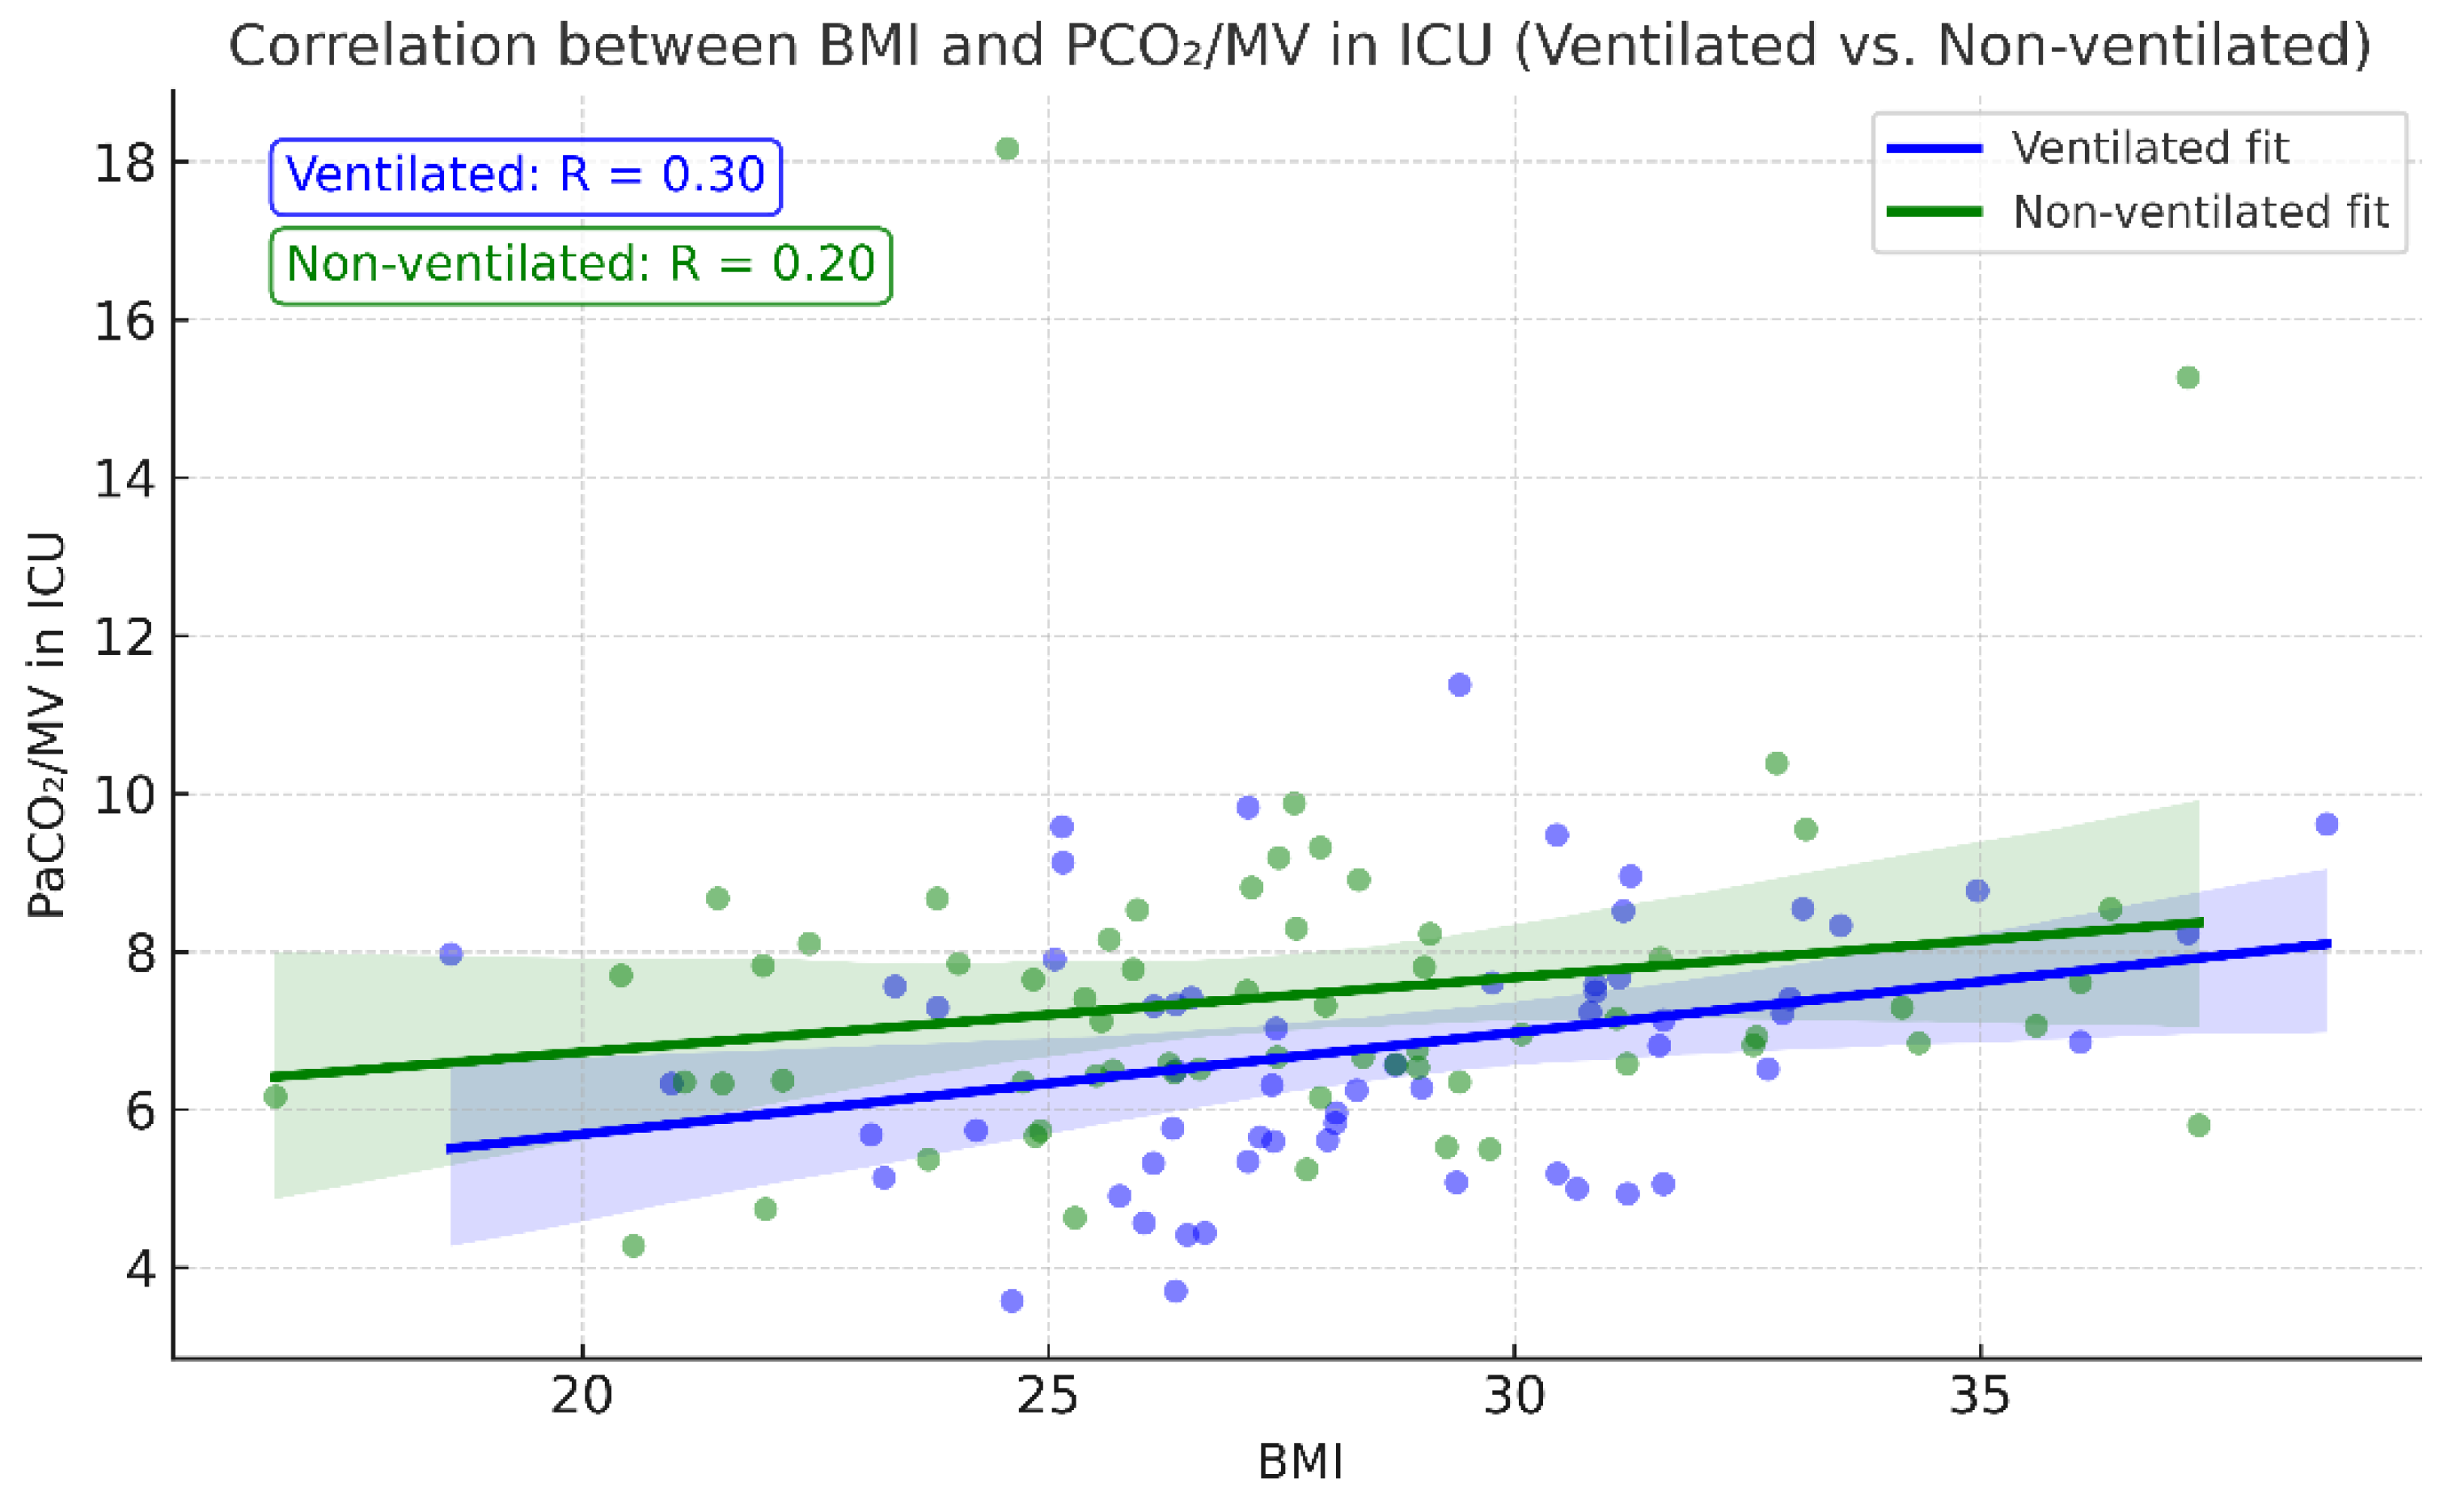

Table 1.
Demographic data between the ventilated and non-ventilated groups.
| Ventilated Group,Mean | Non-ventilated Group, Mean | p-Value | |
| Age | 56.77966 | 57.39063 | 0.7739 |
| Height | 166.322 | 165.8281 | 0.738707 |
| Weight | 78.91525 | 76.04688 | 0.243105 |
| BMI | 28.55303 | 27.531 | 0.174556 |
Table 2.
Gas exchange parameters in the postoperative period between ventilated and non-ventilated groups. Postoperative values were registered within 5–10 min of transportation to the ICU from a surgery unit.
Table 2.
Gas exchange parameters in the postoperative period between ventilated and non-ventilated groups. Postoperative values were registered within 5–10 min of transportation to the ICU from a surgery unit.
| Parameter | Ventilated, Mean | Non-ventilated, Mean | p-Value |
| PaCO2 in ICU | 40.56 | 44.38 | 0.0262 |
| P/F in ICU | 339.18 | 291.70 | 0.0276 |
| PaO2 in ICU | 147.3475 | 127.8484 | 0.0436 |
Table 3.
Ventilation and oxygenation parameters at the 24 h postoperative mark.
| Parameter | Ventilated, Mean | Non-ventilated, Mean | p-Value |
| P/F at 24 h | 325.5 mmHg | 326.1 mmHg | 0.974 |
| PaO2 at 24 h | 105.7 mmHg | 97.8 mmHg | 0.134 |
| PaCO2 at 24 h | 42.1 mmHg | 44.0 mmHg | 0.054 |
| SaO2 at 24 h | 95.8% | 96.2% | 0.742 |
Table 4.
P/F ratio at three perioperative time points.
| Parameter | Ventilated, Mean | Non-ventilated, Mean | p-Value |
| P/F before intubation | 398 | 428 | 0.215 |
| P/F in ICU | 339 | 292 | 0.028 |
| P/F at 24 h | 325 | 326 | 0.974 |
Table 5.
Minute ventilation values at induction of anesthesia and postoperatively between ventilated and non-ventilated groups.
Table 5.
Minute ventilation values at induction of anesthesia and postoperatively between ventilated and non-ventilated groups.
| Minute Ventilation | Ventilated, Mean (L/min) | Non-ventilated, Mean (L/min) | p-Value |
| Surgery Start | 5.71 | 5.75 | 0.836 |
| ICU | 6.17 | 6.04 | 0.433 |
Table 6.
Number of patients in each age group for the ventilated and non-ventilated groups.
| Group | Age Group | Median PaCO2/MV in ICU | N |
| Non-ventilated | <30 | 5.248485 | 1 |
| Non-ventilated | 30–40 | 5.950886 | 4 |
| Non-ventilated | 40–50 | 8.5375 | 10 |
| Non-ventilated | 50–60 | 7.291667 | 27 |
| Non-ventilated | 60–70 | 6.583333 | 17 |
| Non-ventilated | 70–80 | 6.250361 | 4 |
| Non-ventilated | >80 | 7.407407 | 1 |
| Ventilated | <30 | 6.821527 | 2 |
| Ventilated | 30–40 | 7.222222 | 5 |
| Ventilated | 40–50 | 7.614198 | 10 |
| Ventilated | 50–60 | 6.765889 | 18 |
| Ventilated | 60–70 | 6.692881 | 16 |
| Ventilated | 70–80 | 6.127573 | 8 |
| Ventilated | >80 | 0 |
Table 7.
ICU X-ray after extubation and in a 24 h period.
| No Stop Ventilation | Stop Ventilation | |
| Normal | 52 | 56 |
| Atelectasis | 7 | 8 |
| In 24 h | ||
| Atelectasis | 0 | 3 |
| Normal | 59 | 61 |
Table 8.
Other parameters are compared between the stop ventilation group and no stop ventilation group.
Table 8.
Other parameters are compared between the stop ventilation group and no stop ventilation group.
| Parameter | Ventilated, Mean | Non-ventilated, Mean | p-Value |
| Cross-clamp time (min) | 56.98 | 56.84 | 0.983 |
| CPB time (min) | 90.05 | 108.89 | 0.033 |
| Mechanical vent time (hours) | 6.251254 | 6.744709 | 0.677 |
| Intra-op crystalloids (ml) | 1185.714 | 1070.313 | 0.133 |
| Lactate in ICU | 1.933898 | 1.946875 | 0.970 |
| Lactate at 24 h | 1.757627 | 1.875 | 0.565 |
| Post-OP Fibrinogen (in ICU) g/L | 2.467273 | 2.534407 | 0.795 |
| LOS in ICU | 2.796296 | 2.328125 | 0.345 |
| Death | 0.017241 | 0.018519 | 0.960 |
Table 9.
Re-exploration incidence in 24 h.
| No Stop Ventilation | Stop Ventilation | |
| No | 58 | 60 |
| Yes | 1 | 4 |
Table 10.
Bleeding estimation at 24 h period: massive > 1000 mL; moderate > 500 mL, mild < 500 mL.
| No Stop Ventilation | Stop Ventilation | |
| Massive: >1000 mL | 1 | 1 |
| Moderate: >500 mL | 3 | 9 |
| Mild: <500 mL | 27 | 37 |
| No | 28 | 17 |
Disclaimer/Publisher’s Note: The statements, opinions and data contained in all publications are solely those of the individual author(s) and contributor(s) and not of MDPI and/or the editor(s). MDPI and/or the editor(s) disclaim responsibility for any injury to people or property resulting from any ideas, methods, instructions or products referred to in the content. |
© 2025 by the authors. Licensee MDPI, Basel, Switzerland. This article is an open access article distributed under the terms and conditions of the Creative Commons Attribution (CC BY) license (http://creativecommons.org/licenses/by/4.0/).
Copyright: This open access article is published under a Creative Commons CC BY 4.0 license, which permit the free download, distribution, and reuse, provided that the author and preprint are cited in any reuse.


