Submitted:
04 October 2025
Posted:
14 October 2025
You are already at the latest version
Abstract
Support Vector Machines (SVM) is a popular kernel-based method for data classifica- 2 tion that have demonstrated high efficiency across a wide range of practical applications. 3 However, SVM suffers from several limitations, including the potential failure of the opti- 4 mization process,especially in high-dimensional spaces, the inherently high computational 5 cost, the lack of a systematic approach to multiclass classification, difficulties in handling 6 imbalanced classes, and the prohibitive cost of real-time or dynamic classification. This 7 paper proposes an alternative method, referred to as Kernel-based Optimal Subspaces 8 (KOS). The method achieves performance comparable to SVM while addressing the afore- 9 mentioned weaknesses. It is based on computing a minimum distance to optimal feature 10 subspaces of the mapped data. No optimization process is required, which makes the 11 method robust, fast, and easy to implement. The optimal subspaces are constructed inde- 12 pendently, enabling high parallelizability and making the approach well-suited for dynamic 13 classification and real-time applications. Furthermore, the issue of imbalanced classes is 14 naturally handled by subdividing large classes into smaller sub-classes, thereby creating 15 appropriately sized sub-subspaces within the feature space.
Keywords:
Classification
; Machine learning
; SVM
; kernel theory
; POD
1. Introduction
Machine Learning (ML), a branch of Artificial Intelligence (AI), is the science of designing algorithms that can automatically improve by learning from data (see, for instance, [1]). This multidisciplinary field has a wide range of applications, including handwriting recognition, automated disease detection, robotics, and others.
Among the core problems in AI is data classification, which relies heavily on ML techniques. Kernel methods are one of the most popular subsets of data classifiers, with the Support Vector Machine (SVM) being among the most widely used. The SVM algorithm is grounded in statistical learning theory, originating from Vapnik’s work on the Structural Risk Minimization principle [2,3,4].
The fundamental idea of kernel methods is to map the original data,referred to as attributes, into a higher-dimensional space, known as the feature space, where the data can be more easily separated. While SVM was originally designed for linear separation, this mapping enables it to handle data that is non-linearly separable in the original space by achieving linear separation in the feature space. Note that, the mapping function is not explicitly defined, which is a tedious task, instead a suitable kernel function is used, as long as all operations can be expressed using dot products. The existence of such kernels is guaranteed under certain conditions by Mercer’s theorem [4,5].
SVM is widely recognized for its high performance (see [6,7,8,9,10,11,12,13] for recent improvements). However, despite significant advancements, it still has several limitations:
- As an optimization problem, SVM may fail, particularly in high-dimension, even though the cost function is convex (quadratic).
- Extending SVM to multiclass classification is not straightforward and becomes computationally expensive in high dimensions or when the number of classes is large. For instance, a common approach combining one-against-one and one-against-all strategies requires computing a total of separating hyperplanes (i.e., solving n optimization problems), where n is the number of classes.
- Imbalanced classes poses another challenge. A popular approach to addressing this involves adding synthetic attributes to underrepresented classes. While effective, the process is not straightforward, and can alter the structure of the original class data.
- In dynamic classification, where classes may be added or removed, all separating hyperplanes must be recalculated, which can be prohibitively expensive for real-time applications.
To address these issues, a preliminary version of a novel method,proposed as an alternative to Support Vector Machines (SVMs), was introduced in a recent conference paper [30], along with basic initial results. In this extended journal version, we provide the complete formulation of the method for centered data, which offers more efficiency, along with a thorough theoretical analysis and corresponding proofs. Furthermore, we propose an effective strategy to tackle the inherent imbalanced classes problem. Extensive experiments are conducted on large, multi-class datasets for a thorough evaluation evaluation of the method’s performance. In addition, a detailed analysis of time efficiency is included. Finally, when using the radial basis function (RBF) kernel, we introduce a robust learning procedure for selecting the parameter .
In this work, the new method is referred to as Kernel-based Optimal Subspaces (KOS). The approach relies on computing a minimum distance between an unseen feature vector and a set of optimal subspaces, in a sense that will be defined, in the feature space. It will be shown that subspaces constructed using Proper Orthogonal Decomposition (POD) are optimal.
For classification, the method projects an unseen feature vector onto each feature subspace, claculate the distnace, and then assigns the attribute vector to the class achieving a minimum distance. Fundamentally, this requires only the computation of the eigenpairs of the Mercer kernel matrix for each training class independently, and no optimization is involved, making the method simple to implement, significantly faster than SVM (with linear complexity), and robust.
KOS is highly parallelizable and well-suited for dynamic and real-time classification, as only the eigenpairs for new classes need to be computed. If a class is removed, no further computation is required.
The issue of imbalanced classes is handled naturally by splitting large attribute classes into balanced subclasses, then labeling all corresponding feature subspaces as belonging to a single class. An unseen feature vector is classified into a given class if it is close to any of the subspaces generated by that class’s subclasses.
The performance of the proposed method is demonstrated through both 2D and high-dimensional, multi-class test cases. The results are compared against those of the Support Vector Machine (SVM), using the popular LIBSVM software package [21]. The findings show that KOS performs comparably to SVM, while offering several significant advantages as discussed earlier, making it a strong alternative to SVM.
The experiments use the Radial Basis Function (RBF) kernel, which, as is well known in the context of SVM, involves tuning two key parameters: the standard deviation (in the Gaussian form) or (in the RBF form), and the penalty parameter C. The most widely used method for selecting these parameters is cross-validation-based grid search, as described in [14,15,16,17,18], including both automated and manual search approaches.
In contrast, the KOS method does not require the penalty parameter C. Only one parameter, or , needs to be learned. Through a class-wise re-scaling process, this parameter is learned in a robust and effective manner, contributing to the overall performance of the method.
2. KOS: Kernel-Based Optimal Subspaces Method
Before detailing the proposed method, we first present a brief overview of the proper orthogonal decomposition technique, which is a crucial component of the new approach.
2.1. Proper Orthogonal Decomposition (POD): Overview
Proper Orthogonal Decomposition (POD) [19], known as well as Karhunen-Loeve’s expansion (KLE) [19], popular in data analysis field, is a technique that aims to represent a big amount of data by a reduced number of basis elements built from the data. More precisely, if the data are stored in a matrix A with N being a large number, is it possible to represent the N columns of A by a p orthonormal vectors with p very small compared to N. The mathematical formulation can be summarized as follows, let , the problem is to find an orthonormal set of p vectors that better represent the N columns A in the following sense,
satisfying the optimization problem,
⋮
The vectors are the eigenvectors of . A simplified proof is provided in Appendix (A) for self-content. For more details, see [19].
2.1.1. POD Basis System
The POD basis system is built as follows:
- (1)
- : if , let M be the correlation matrix where is any inner product. Let V the matrix of eigenvectors of M, then the basis functions , called modes, are given by:where are the components of the eigenvector of M
- (2)
- : if , the POD basis is defined by the eigenvectors of the matrix
This paper will use the first definition since the original data will be mapped into an infinite dimension vector space.
Now calculate the inner product
This shows that the functions are orthogonal if and only the eigenvectors are, which is generally the case. For we get the norm , which shows that the norm of each mode represents part of the energy of the system. In conclusion, modes with low energy (small eigenvalues) can be neglected, reducing the POD basis to only modes with significant energy. Practically, the ratio of the modeled to the total energy contained in the system given by:
is calculated to decide if l modes are enough to describe the system.
This is an example of a quote.
2.2. KOS: Global Description and Some Theoretical Aspects
Similar to SVM, the first step in KOS is to map the original data (attributes) into a higher-dimensional feature space using a kernel function. For each class in the feature space, an optimal subspace, defined as the smallest and best fit subspace that contains the feature vectors of that class, is then constructed. The main difference
To classify an unseen attribute vector, its corresponding feature vector is projected onto each class subspace, and the class is determined based on the minimum distance to these subspaces. The fundamental difference from SVM is that the hyperplanes, responsible for many of the issues encountered with SVM, are removed and replaced by optimal subspaces that contain the feature data, as illustrated in Figure 1.
Note that, in some cases, different classes may be mapped to the same feature subspace, leading to a misclassification. Therefore, it is desirable for the subspaces to be as distinct as possible to reduce this risk. In theory, as proved later in the paper, it is always possible to construct subspaces that are even completely disjoint. However, in practice, this is cannot be guaranteed or controlled. For optimal performance, the kernel should be chosen such that the resulting feature space is of infinite dimension, which increases the likelihood of separability between class subspaces. It is well established, for example, that the RBF kernel meets this requirement.
Theorem 1.
There exist Mercer kernels such that the attribute classes can be mapped into disjoint feature subspaces.
Proof.
For simplicity, the proof is given for the two-class case; the result can then be extended recursively to the multiclass case. Let denote the attribute (original) space and let be the feature space obtained through a mapping associated with a Mercer kernel . Suppose that is such that is of infinite-dimensional.
Let and be two classes, and let and be two finite-dimensional subspaces of the feature space such that and . Let denote the orthogonal complement of in . Since is infinite-dimensional and is finite-dimensional, is also infinite-dimensional.
Let be any subspace with the same dimension as . Then there exist a one-to-one mapping .
Now,define a new mapping as follows:
We have and with E and G orthogonal then disjoint. The kernel defined by is a Mercer kernel by construction and satisfies the theorem, which ends the proof. □
2.3. POD Feature Subspaces
The POD technique is proposed to build the optimal subspaces in the feature vector space. Note that similar techniques, such as PCA (Principal Component Analysis), are commonly used in kernel theory for data classification, typically as a pre-processing step for feature extraction and enhancement [22]. The optimality of the POD feature subspaces will be discussed later.
Assume a suitable kernel is given, and let be the associated mapping function. It is important to note that choosing a kernel such that the feature space is of infinite dimension is highly recommended, as it helps map data into subspaces with minimal or no overlap.. Let denote the P attributes classes. Denote by the element of class and by its corresponding mapped feature vector. To construct the POD feature subspaces, we only need to build the POD basis, also known as the modes, as described in Section 2.1.
In general, it is well established that centering the data is recommended when applying the POD method. Therefore, we provide formulations of the POD basis for both non-centered centered and centered data.
To lighten the notations, the superscript l , which refers to a specific class, is omitted and will be reintroduced as needed. In the following, we use to denote the Mercer’ kernel K matrix, namely , and when X or Y does not belong to the training dataset.
- 1.
-
None-Centered data formulation: In this case, the data in the feature space are used without centering. Let be the mapped data points of a selected class of size N. First, we construct the correlation matrix:where denotes the kernel function evaluated at and . As seen, the POD correlation matrix is equivalent to the kernel matrix derived from the mapping.The normalized POD modes are then given by:where is the eigenvector of the kernel matrix M and the associated eigenvalue.
- 2.
-
Centered data formulation: In this case, the feature vectors are centered. Let be the mean vector, and be the centered data. The correlation matrix is then given by:Each of the inner products can be expressed in terms of the kernel function:Substituting back into the expression for , the centered correlation matrix becomes:As in the non-centered case, the correlation matrix can be entirely expressed using the kernel matrix.The normalized POD modes for centered data are then given by:where is the eigenvector of the correlation matrix M defined by 14 and the associated eigenvalue
Note that for calculating the minimum distance in classification (as will be shown later), it is not necessary to explicitly compute the feature vectors or the POD modes.
2.4. Optimality of the POD Feature Subspaces
The optimality of the feature subspaces is considered from both geometric and algebraic perspectives.
From a geometric standpoint, the basis elements of the subspace should be as close as possible to the original feature vectors. This ensures maximum representativeness and preserves the structure of the data within the feature space.
From an algebraic standpoint, the feature subspace should be of minimal dimension while still containing the feature vectors. This dimensional compactness guarantees maximum discrimination between different feature subspaces and, consequently, between the associated attribute classes.
In essence, the POD method provides a set of orthonormal basis functions that span the most "informative" subspace, allowing for an efficient and discriminative representation of each class in the feature space.
-
Geometrical Optimality of POD Feature Spaces:As shown in [19], if is the POD basis matrix constructed to represent the columns of a matrix , and is any other basis of a same size constructed for the same purpose, then the following inequality holds:where is the Frobenius norm, defined by:This result demonstrates the geometric optimality of the POD basis: among all possible orthonormal bases of the same dimension, the POD basis provides the best approximation (in the least-squares sense) of the original data matrix A. Therefore, the POD basis vectors are the closest possible representatives of the original feature vectors, ensuring maximum fidelity in capturing the data structure.
-
Algebraic Optimality of POD Feature Spaces:Lemma: The POD subspace is algebraically optimal; it is the smallest subspace containing the mapped data.Proof: The proof is straightforward. To show that the POD subspace is the smallest subspace containing the mapped (feature) data, it is sufficient to show that any subspace containing the feature data must also contain the POD subspace.Let F be a subspace that contains the given feature data. To prove that F also contains the POD subspace, it suffices to show that F ontains the POD modes (i.e., the basis of the POD subspace). Since the POD modes are linear combinations of the feature data, and F s a subspace (i.e., closed under linear combinations), the modes necessarily lie in F. Hence, the POD subspace is contained in a ny subspace that contains the mapped data, proving its algebraic optimality.
2.5. Decision Criterion
The decision criterion for an unseen element , as introduced at the beginning of this section, is based on the minimum distance of the feature vector to the POD feature subspaces.To achieve this, the POD coordinates of within each subspace are computed. The details for both non-centered and centered data are provided.
- 1.
-
None-Centered data formulation: The coordinates are given by the projection of the element on the POD modeswithThenUsing the Pythagoras rule, the distance of to the POD subspace F, is given byWith
- 2.
-
Centered data formulation: For the centered case, and are replaced by and respectively. That is,withThenSubstituting we obtain
Then
With
The unseen attribute vector is assigned to the class that corresponds to the minimum distance calculated above.
2.6. Imbalanced Classes
The issue of imbalanced classes is commonly encountered in many classifiers, including SVM. Several techniques address this problem, with the two most popular being weight adjustment between large and small classes (as used in LIBSVM) and the SMOTE (Synthetic Minority Over-Sampling Technique) algorithm [20], which generates synthetic data to augment smaller classes. Both methods yield acceptable results; however, there is no systematic approach for defining the weight distribution or the positioning of synthetic vectors, which may alter the data structure.
The proposed KOS method naturally handles this problem by subdividing large attribute classes into smaller subclasses of similar sizes. These subclasses will share the same class label. Specifically, a reference size is defined, which can be the size of the smallest class in the attribute space. Any class with a size at least double the reference size can be split into subsets, each roughly equal in size to the reference class. For the classification decision, if the minimum distance is obtained from one of the POD subspaces of a subdivided class, the unseen element is assigned to that class. This strategy is schematized in Figure 2 and will be validated in the test section.
2.7. RBF Parameter Learning
As previously mentioned, when using the RBF kernel, only the parameter (equivalently ) must be learned, as in the case of hard-margin SVM. There is need to the penality parameter. We propose a strategy to learn that significantly reduces the range of values to be tested. The key idea is to scale according to the size of each attribute class.
The RBF kernel (also known as the Gaussian kernel) is widely used in multi-scale image analysis, where small values correspond to fine image details, and larger values capture more global structures. This makes it natural to scale according to the size of the input set. We decompose as follows:
where D is the diameter of the set, computed as the maximum distance between any two elements in the set. The scaling factor is then varied from to 1 in steps of . This approach significantly reduces the complexity of the parameter search. For comparison, in standard SVM, approximately grid searches are typically required to determine the optimal pair , where C is the penalty parameter.
2.8. Summary of the Algorithm
Let , denote P attributes sets representing P different classes used during the learning stage. Let , denote the corresponding mapped sets in the feature space. The KOS classification procedure is as follows:
- 1.
- Check whether the classes are imbalanced. If so, split the larger classes into smaller subclasses according to procedure described in Section 2.6.
- 2.
- Select a Mercer kernel K, then compute the kernel matrices for each feature class (of feature subclasses if applicable).
- 3.
- 4.
- Compute the eigenvalues and eigenvectors of each matrix .
- 5.
- 6.
- 7.
- Decision: Assign to the class corresponding to the minimum computed distance.
3. Results: Validation and Discussion
The proposed KOS method is verified and validated using the RBF kernel. Initial tests are conducted on 2D cases to visually assess its ability to handle non-linear classification. Subsequently, KOS is tested on selected real-world datasets from the LIBSVM repository [21], and the results are compared against those obtained using SVM implemented in the widely used LIBSVM software.
It is important to note that no specific preprocessing is applied to the data for KOS, apart from rescaling the input features to the interval .
3.1. 2D Test Cases
To evaluate KOS’s capability in separating non-linearly separable data, three increasingly challenging scenarios are tested: (i) connected sets, (ii) non-connected sets, and (iii) a spiral configuration. Figure 3, Figure 4 and Figure 5 demonstrate that KOS successfully separates the data in all cases. A fixed kernel parameter value of is used for all three tests.
3.2. Higher-Dimension Test Cases
Two-classes and multi-class test cases are selected from the database [21]. The proposed KOS and SVM (using LIBSVM software) are then tested, and their performances compared. Note that for KOS, there is no penalty parameter C; only the standard deviation is learned. This is done by splitting the training set into two parts: for building the KOS model (eigenpairs of the correlation matrices) and for validation. The value of is varied from , to in increments of . Once the optimal is found, the entire training set is used to build the KOS model. The tests are briefly described in Table 1, and Table 2. Table 3 compares the performance of KOS and SVM. Overall, the table shows that KOS performs comparably to SVM, while offering significant advantages outlined in the next subsection.
The effectiveness of the proposed imbalanced strategy is demonstrated, for instance, in the Leukemia and Shuffle tests, which contain the most imbalanced classes. Specifically, the performance without splitting the classes was and , respectively. After applying the splitting strategy, these scores improved to and , respectively.
3.3. KOS main Advantages Compared to SVM
As shown by the tests, KOS is performing similarly to SVM, with many significant advantages that can be listed as:
- 1.
- 2.
- Robustness: KOS algorithm is robust and faster; No optimization process is required that can slow down the algorithm in high dimensions and can fail even if the cost function is quadratic because of rounding-off errors as in the case of SVM.
- 3.
- Complexity: SVM complexity grows quadratically with the number of classes (requiring hyperplanes), while KOS scales linearly, needing only n sets of eigenpairs.
- 4.
- Time efficiency: As a result of the two previous proprieties, KOS is significantly faster than SVM, up to more than 60 times faster in certain tests as shown in Table 4.
- 5.
- Parallelization: KOS is highly parallelizable since all subspaces are independent..
- 6.
- Dynamic classification: In the case of class creation or cancellation, SVM requires recalculating all feature-space hyperplanes. By contrast, KOS only requires computing eigenpairs of the Mercer kernel matrix for the new class, with no update needed for canceled classes.
- 7.
- Imbalanced classes: In KOS, this issue is naturally handled by subdividing large classes into smaller, balanced subclasses (Section 2.6). This avoids the need for artificial attributes, which may distort the data structure, or the use of balancing weights, which often lack a clear and systematic procedure.
4. Conclusions
In this paper, a novel classification method is proposed, referred to as KOS (kernel-based optimal subspaces). The approach involves constructing optimal subspaces in the feature space, and classifying an unseen attribute vector based on its minimum distance to these subspaces. Some theoretical foundations are discussed, and proofs provided. The POD subspaces are proved to be optimal in the sense of being the smallest subspaces containing the feature classes, and the basis systems being the best features data representatives. All necessary formulations for practical implementation were derived.
The issue of imbalanced classes is addtressed a simple and intuitive mechanism, eliminating the need for additional preprocessing or resampling techniques. Experimental results on both 2D and high-dimensional multiclass datasets drawn from real-world scenarios show that KOS achieves performance comparable to optimized SVMs using LIBSVM. Beyond accuracy, KOS offers several practical advantages: it is easier to implement, significantly faster, more robust, imbalanced classes issue is systematically handled, suitable for dynamic classification tasks, and highly parallelizable. These strengths make KOS a promising alternative to traditional kernel-based classifiers in a variety of applications.
Data Availability Statement
All used data are public and available at: https://www.csie.ntu.edu.tw/~cjlin/libsvmtools/datasets/
Acknowledgments
This research is supported by Alfaisal University grant IRG with reference IRG20411.
Conflicts of Interest
The author declare no conflicts of interest.
Appendix A. Proof of the POD Best Representatives
Let be the columns of the matrix A, the upper index is used here instead of lower index, which will be used to refer to the columns components. satisfies the optimization problem,
This constrained optimization problem can be solved using Lagrange multipliers:
and the solution is obtained by nullifying the gradient
Differentiating L with respect of V
Then
and then, by setting and
This shows that is the eigenvector of the matrix and is the associated eigenvalue. Now evaluate the maximum by substituting ,
We seek to be the second best representative with perpendicular to . We seek in the orthogonal space to the one spanned by . This can be formulated as follows:
Note the matrix is symmetric, positive semi-definite, then it has m eigenvalues and m corresponding eigenvectors that can be chosen to be orthonormal, that is,
Since we look for a V orthogonal to , it can be expended as
Now estimate the quantity to maximize at an arbitrary V,
We can check by expending in terms of components that,
and by orthogonality
therefore
References
- Alpaydin, E. Introduction to Machine Learning (Fourth ed.). MIT. pp. xix, 1–3, 13–18. (2020). ISBN 978-0262043793.
- Vapnik, V. The Nature of Statistical Learning Theory. Springer-Verlag, NY, USA, 1995.
- Vapnik, V. Statistical Learning Theory. Wiley, NY, USA, 1998.
- Cortes, C.; Vapnik, V. Support vector networks, Machine Learning, 20. 20:1–25, 1995.
- Mercer, J. Functions of positive and negative type and their connection with the theory of integral equations. Philosophical Transactions of the Royal Society, A(209):415–446, 1909.
- Wang, H.; Li, G.; Wang, Z. Fast SVM classifier for large-scale classification problems. Information Sciences, Volume 642, September 2023.
- Shao, Y.H.; Lv, X.J.; Huang, L.W.; Bai Wang, L. Twin SVM for conditional probability estimation in binary and multiclass classification. Pattern Recognition, Volume 136, April 2023.
- Wang, H.; Shao, Y. Fast generalized ramp loss support vector machine for pattern classification. Pattern Recognition, Volume 146, February 2024.
- Wang, B.Q.; Guan, X.P.; Zhu, J.W.; Gu, C.C.; Wu, K.J.; Xu, J.J. SVMs multi-class loss feedback based discriminative dictionary learning for image classification. Pattern Recognition, Volume 112, April 2021.
- Borah, P.; Gupta, D. UFunctional iterative approaches for solving support vector classification problems based on generalized Huber loss. Neural Computing and Applications, vol. 32, no. 1, pp. 1135–1139, 2020.
- Gaye, B.; Zhang, D.; Wulamu, A. Improvement of Support Vector Machine Algorithm in Big Data Background. Hindawi Mathematical Problems in Engineering, Volume 2021,June 2021, Article ID 5594899, 9 pages. [CrossRef]
- Tian, Y.; Shi, Y.; Liu, X. Advances on support vector machines research. Technological and Economic development of economy. iSSN 2029-4913 print/iSSN 2029-4921 online, 2012 Volume 18(1): 5–33. [CrossRef]
- Ayat, N.E.; Cheriet, M.; Remaki, L.; Suen, C.Y. KMOD-A New Support Vector Machine Kernel With Moderate Decreasing for Pattern Recognition. Application to Digit Image Recognition. Proceedings of Sixth International Conference on Document Analysis and Recognition, pp.1215-1219, 2001.
- Lin, S.W.; Ying, K. C; Chen, S.C.; Lee, ZJ. Particle swarm optimization for parameter determination and feature selection of support vector machines. Expert Systems with Applications, 2008; 35: 1817-1824.
- Syarif, I.; Prugel-Bennett, A.; Wills, G. SVM Parameter Optimization Using Grid Search and Genetic Algorithm to Improve Classification Performance. TELKOMNIKA, Vol.14, No.4, December 2016, pp. 1502-1509 ISSN: 1693-6930. [CrossRef]
- Shekar, B.H. ;G. Dagnew, G. Grid Search-Based Hyperparameter Tuning and Classification of Microarray Cancer Data. Second International Conference on Advanced Computational and Communication Paradigms, (ICACCP)2019.
- Hinton, E.; Osindero, S.; Teh, Y. A fast learning algorithm for deep belief nets. Neural Computation, 18:1527–1554, 2006.
- Bergstra, J.; Bengio, Y. Random Search for Hyper-Parameter Optimization. Journal of Machine Learning Research, 13 (2012) 281-305.
- Volkwein, S. Proper orthogonal decomposition: Theory and reduced-order modelling Lecture Notes, University of Konstanz, 2013, 4.
- Chawla, N.V.; Bowyer, K.W.; Hall, L.O.; Kegelmeyer, W.P. Smote: Synthetic minority over-sampling technique. Journal of Artificial Intelligence Research, 16, 321–357 (2002).
- Chang, C.C.; Lin, C.J. LIBSVM : a library for support vector machines. ACM Transactions on Intelligent Systems and Technology, 2:27:1–27:27, 2011. Software available at https://www.csie.ntu.edu.tw/ cjlin/libsvm/.
- Wang, W.; Zhang, M.; Wang, D.; Jiang, Y. Kernel PCA feature extraction and the SVM classification algorithm for multiple-status, through-wall, human being detection. EURASIP Journal of wireless communication and Networking, (2017) 2017:151.
- Golub, T.R.; Slonim, D.K.; Tamayo, P.; Huard, C.; Gaasenbeek, M.; Mesirov, J.P.; Coller, H.; Loh, M.L.; Downing, J.R.; Caligiuri, M.A.; Bloomfield, C.D.; Lander, E.S. Molecular classification of cancer: class discovery and class prediction by gene expression monitoring. Science, 286(5439):531, 1999.
- Hsu, C.W.; Chang, C. C,; C.J Lin. A practical guide to support vector classification. Technical report, Department of Computer Science, National Taiwan University, 2003. [Google Scholar]
- Available online:http://archive.ics.uci.edu/ml/index.php.
- Available online: https://www.csie.ntu.edu.tw/ cjlin/libsvmtools/datasets/.
- Guyon, I.; Gunn, S.; Ben Hur, A.; Dror, G. Result analysis of the NIPS 2003 feature selection challenge. Advances in Neural Information Processing Systems, volume 17. 2005.
- Hsu, C.W.; Lin, C.J. A comparison of methods for multi-class support vector machines. IEEE Transactions on Neural Networks, 13(2):415–425, 2002.
- Hull, J.J. A database for handwritten text recognition research. IEEE Transactions on Pattern Analysis and Machine Intelligence, 16(5):550–554, May 1994.
- Remaki, L. Efficient Alternative to SVM Method in Machine Learning. In: Arai, K. (eds) Intelligent Computing. 2025. Lecture Notes in Networks and Systems, vol 1426. Springer, Cham.
Figure 1.
SVM vs KOS explanatory illustration.
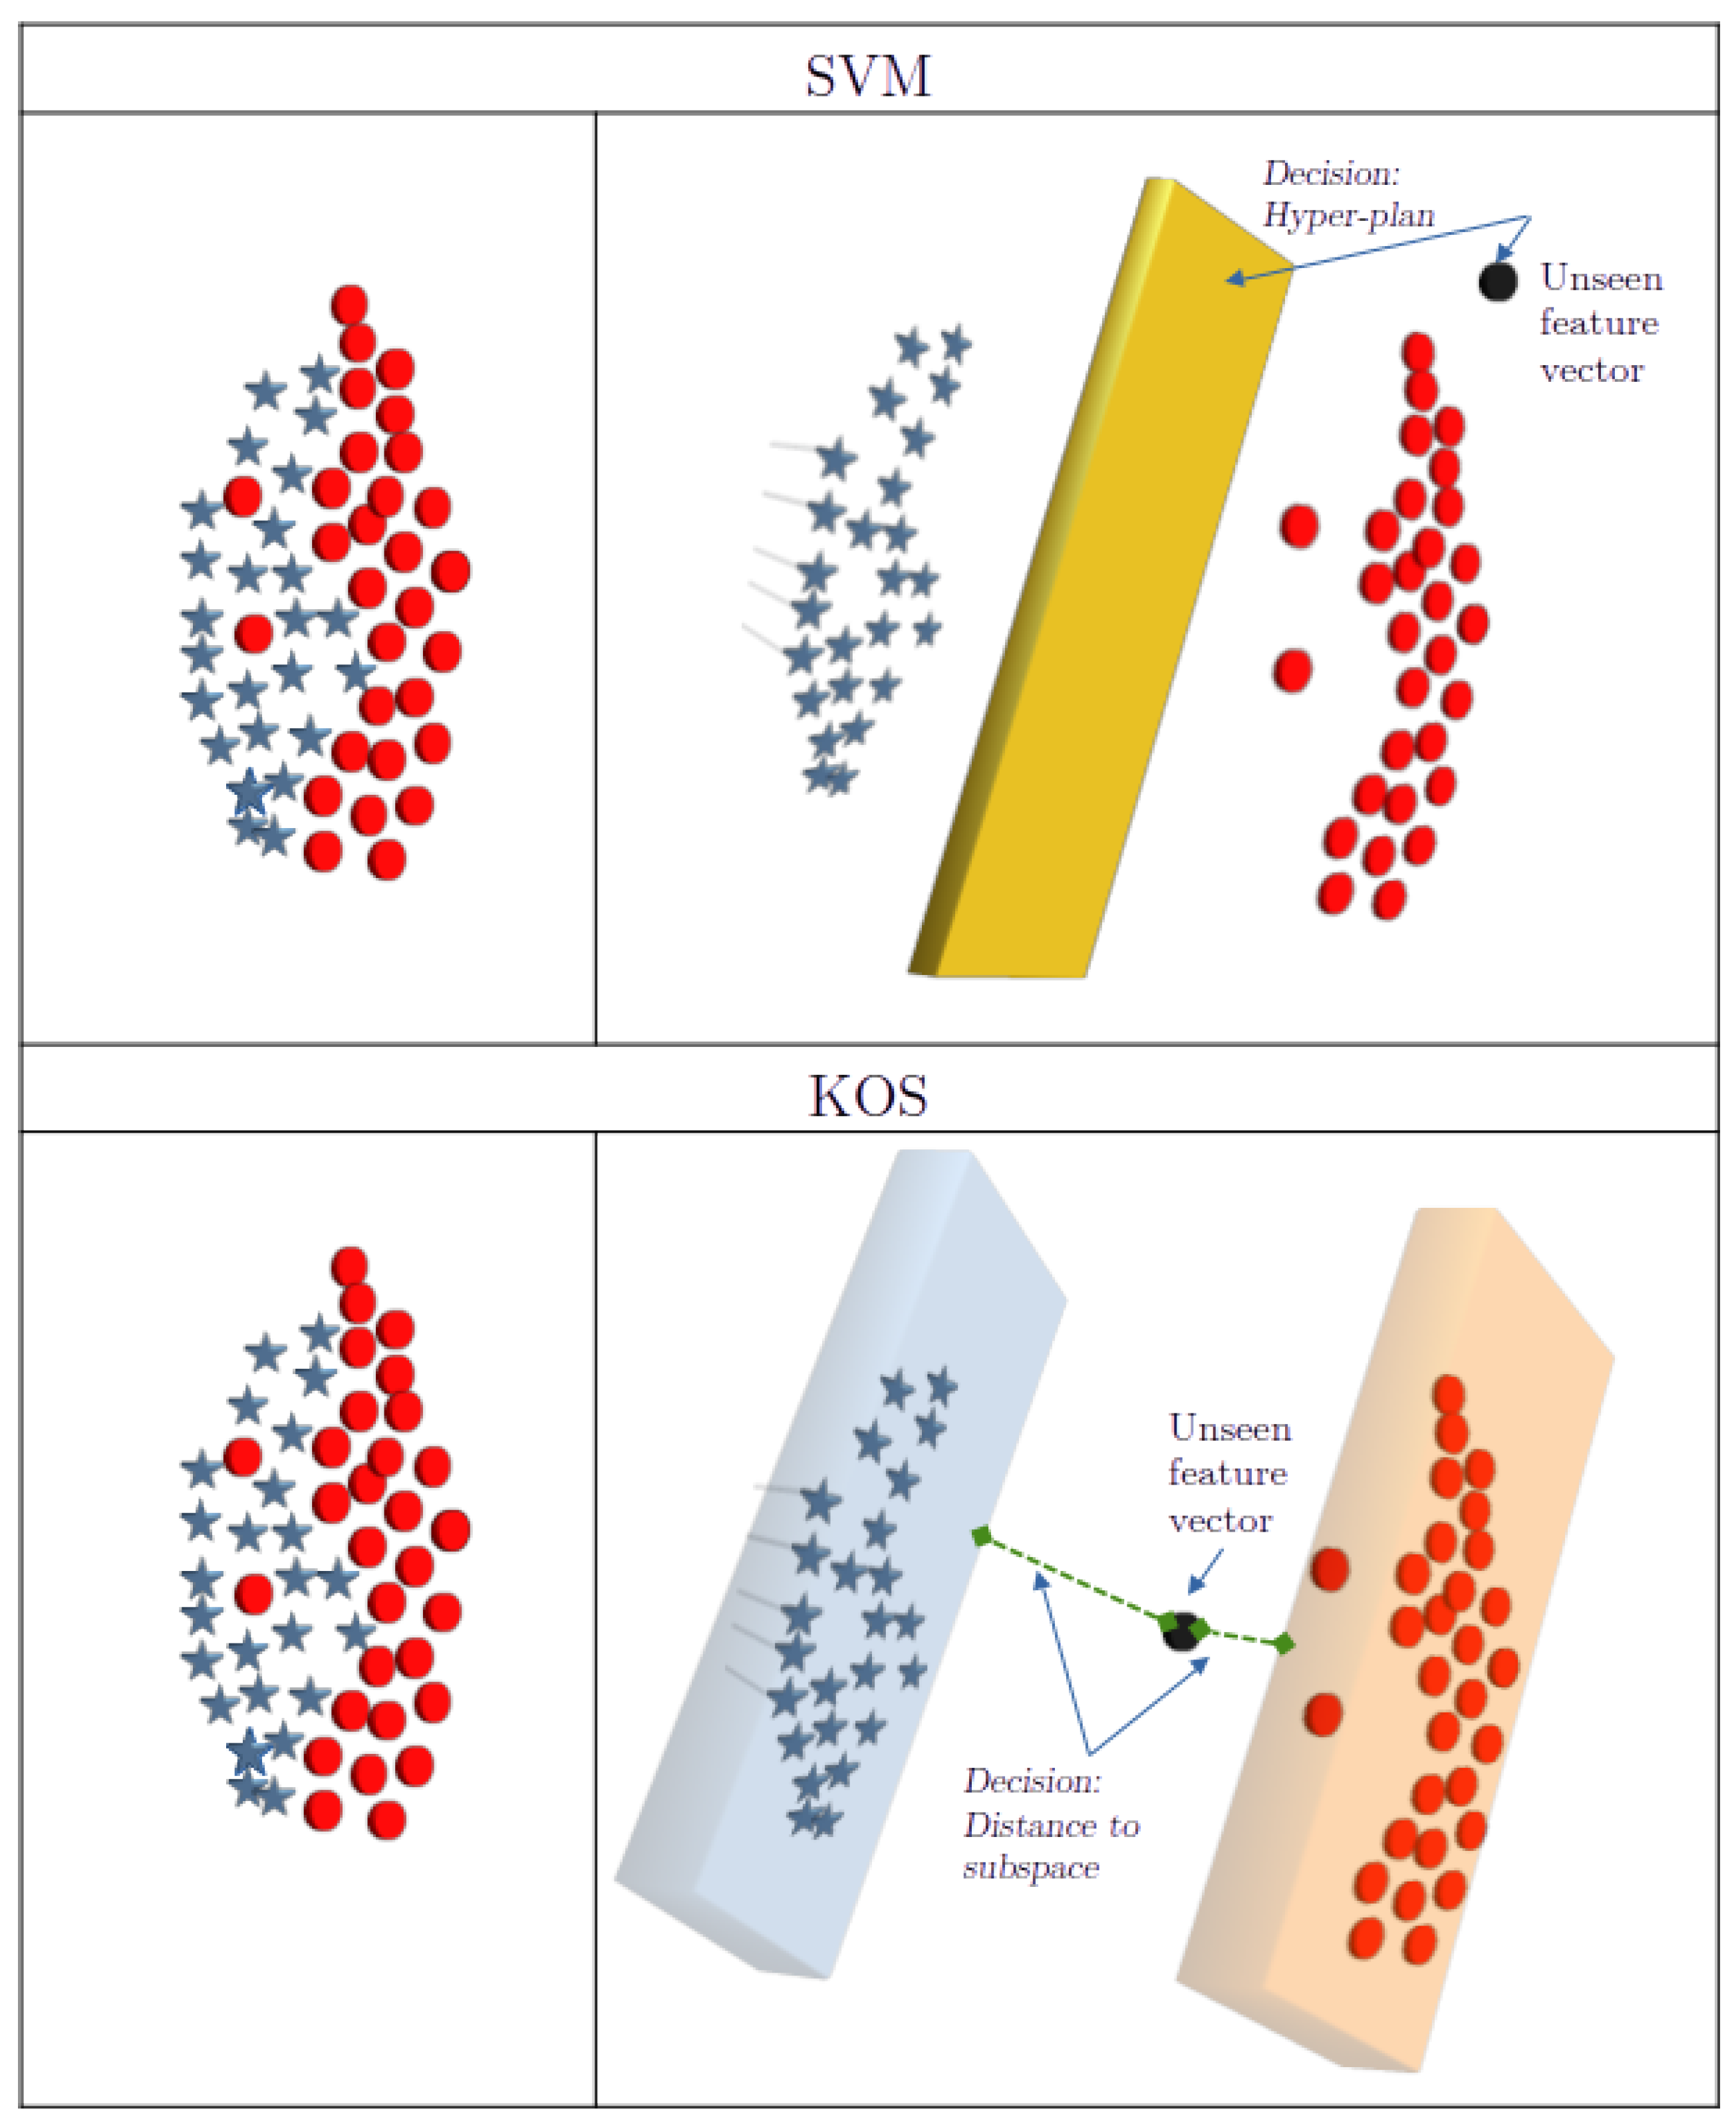
Figure 2.
Imbalanced classes strategy.
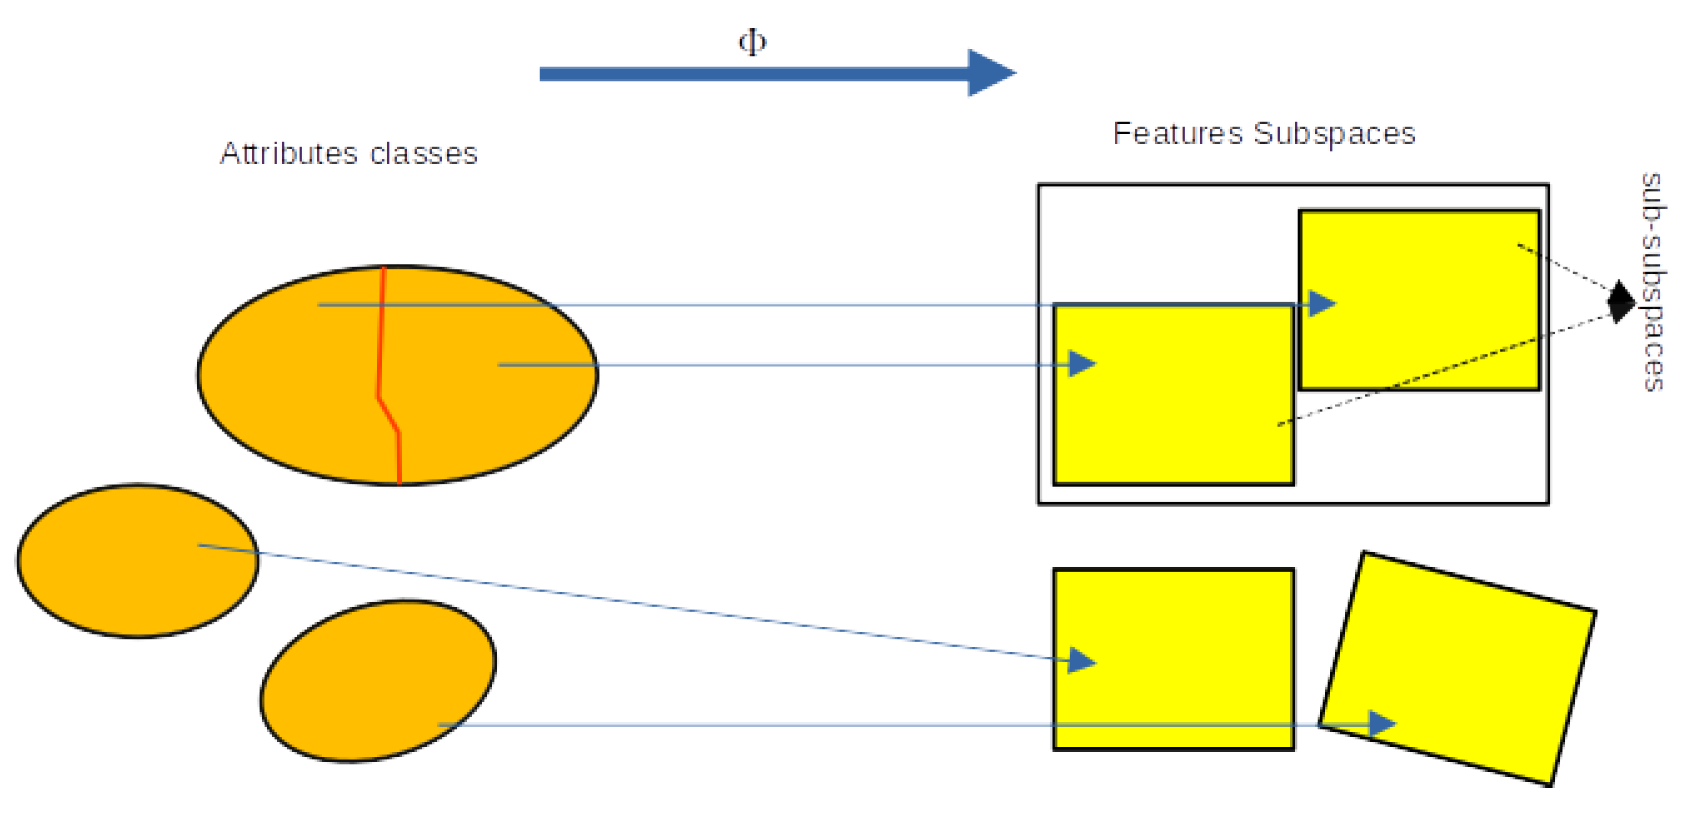
Figure 3.
Connected sets case.
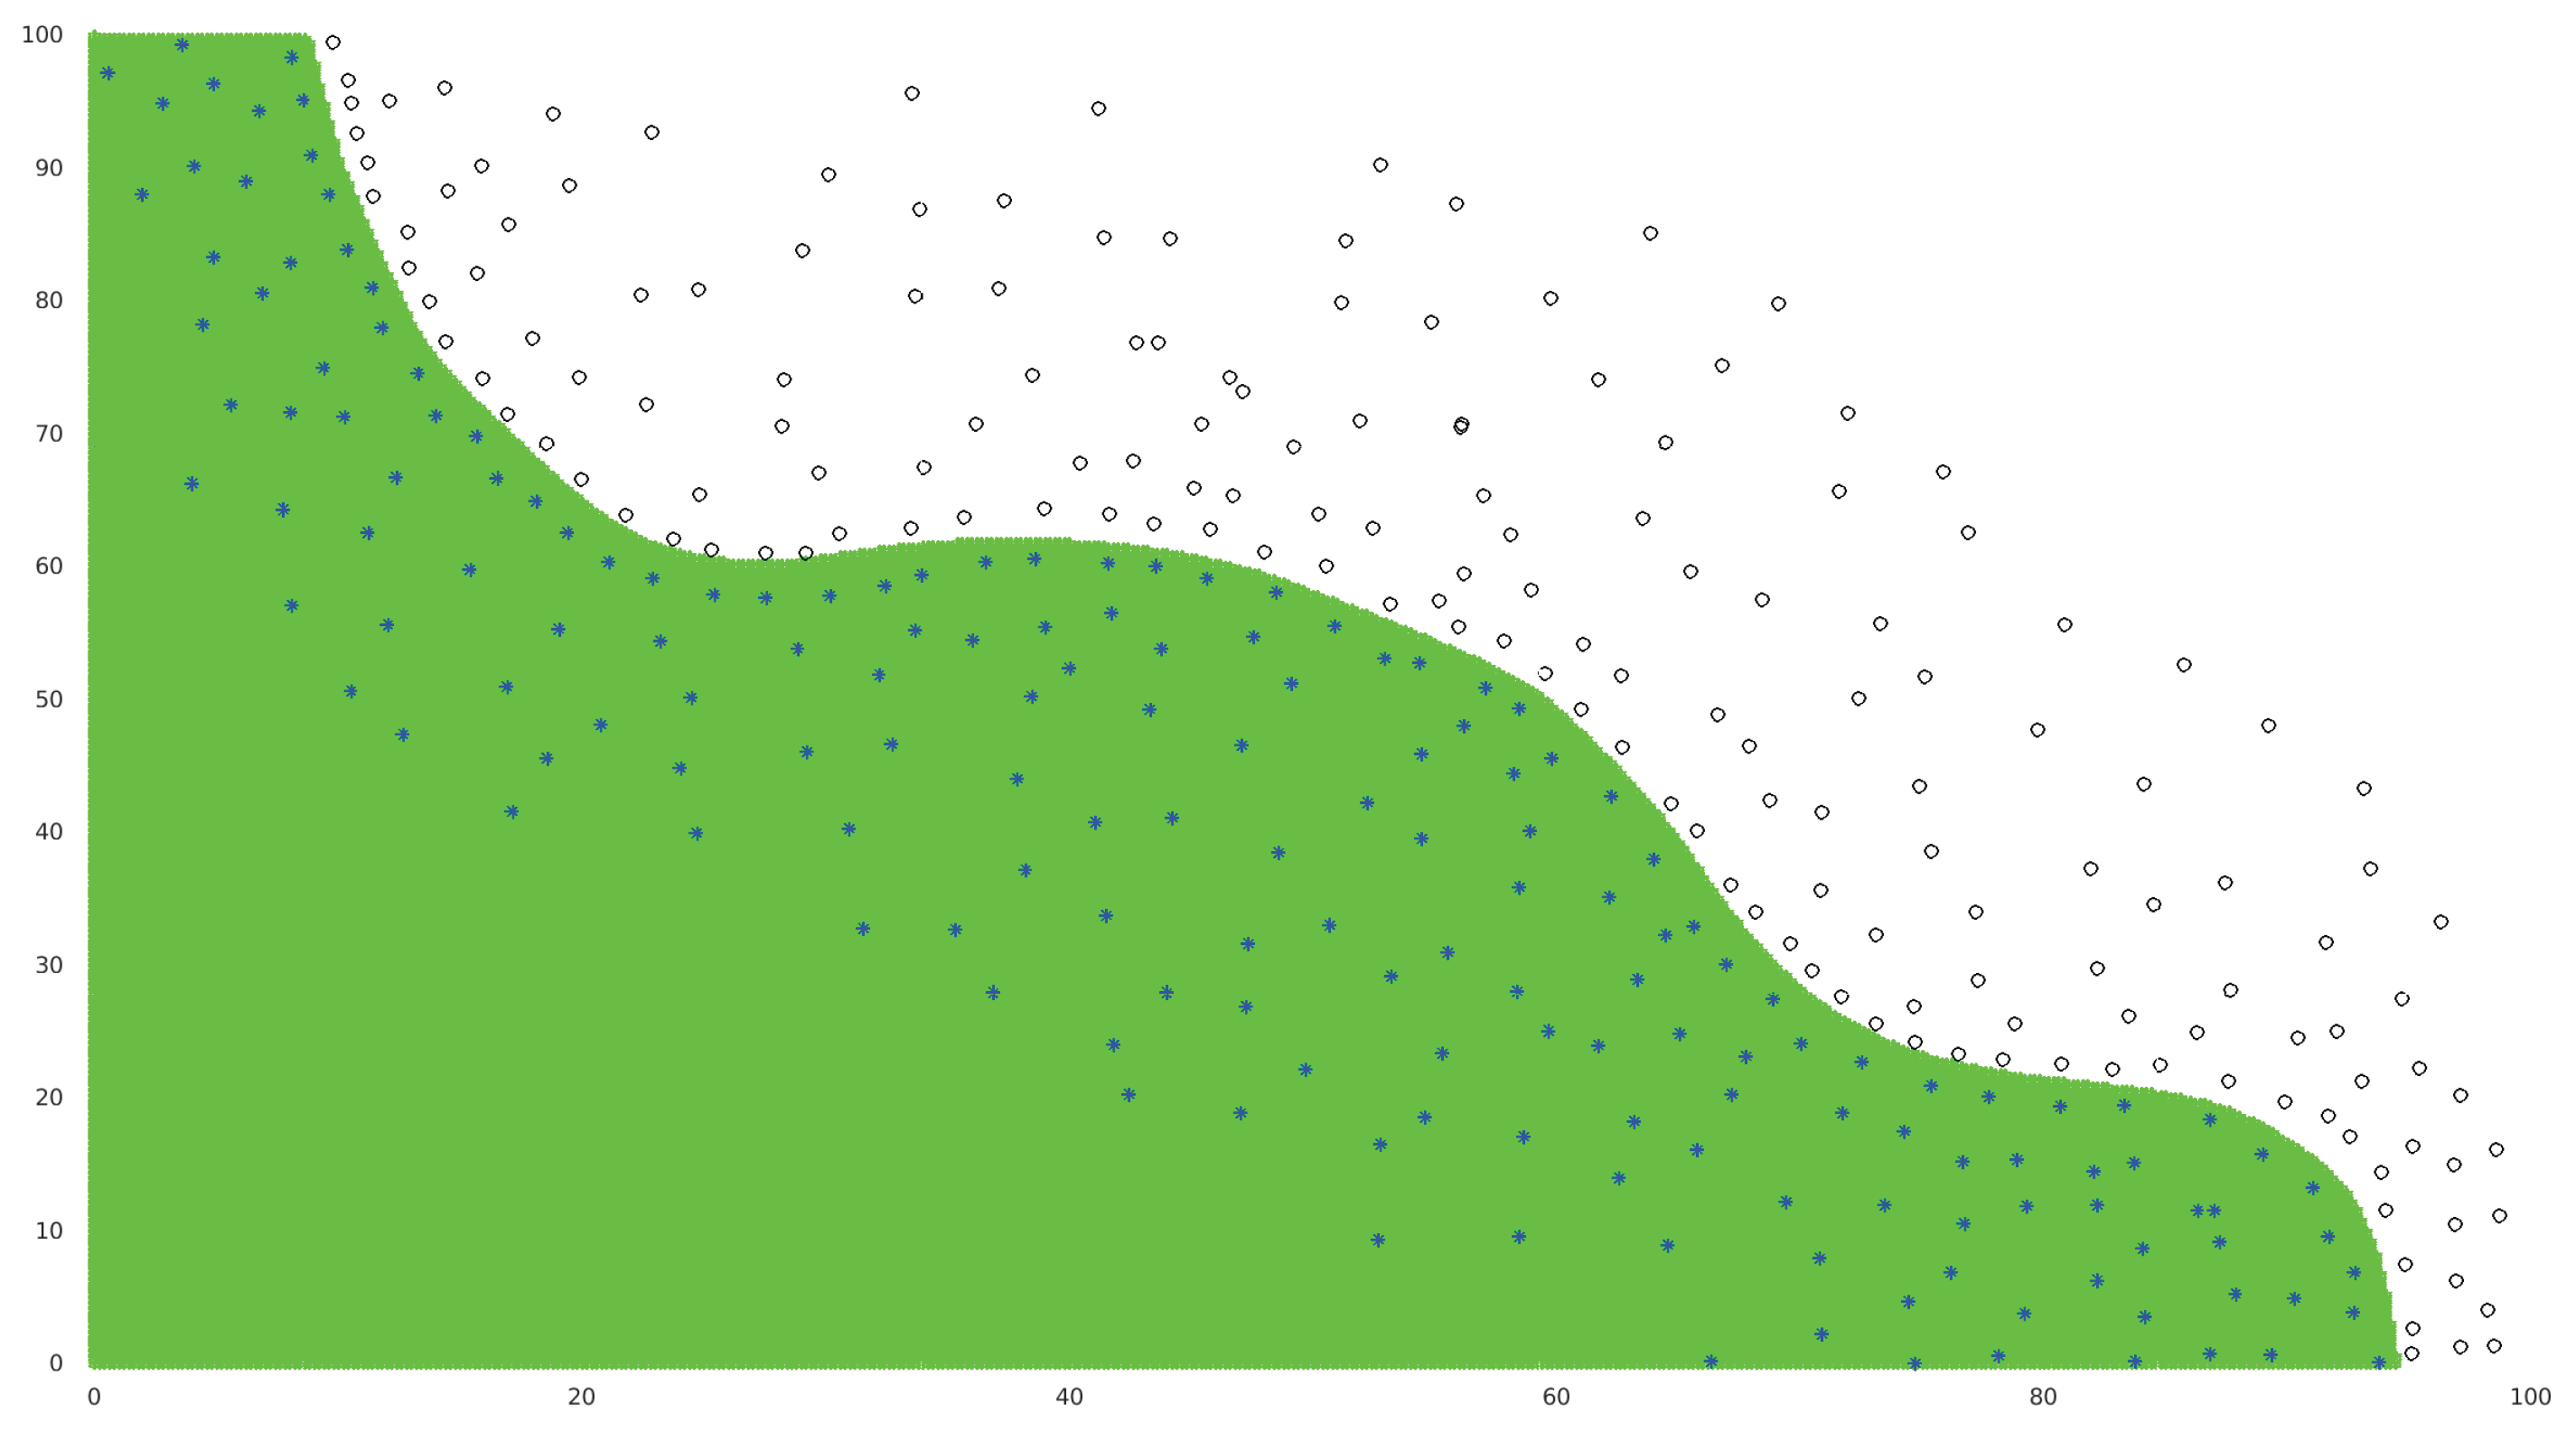
Figure 4.
Non-connected sets case.
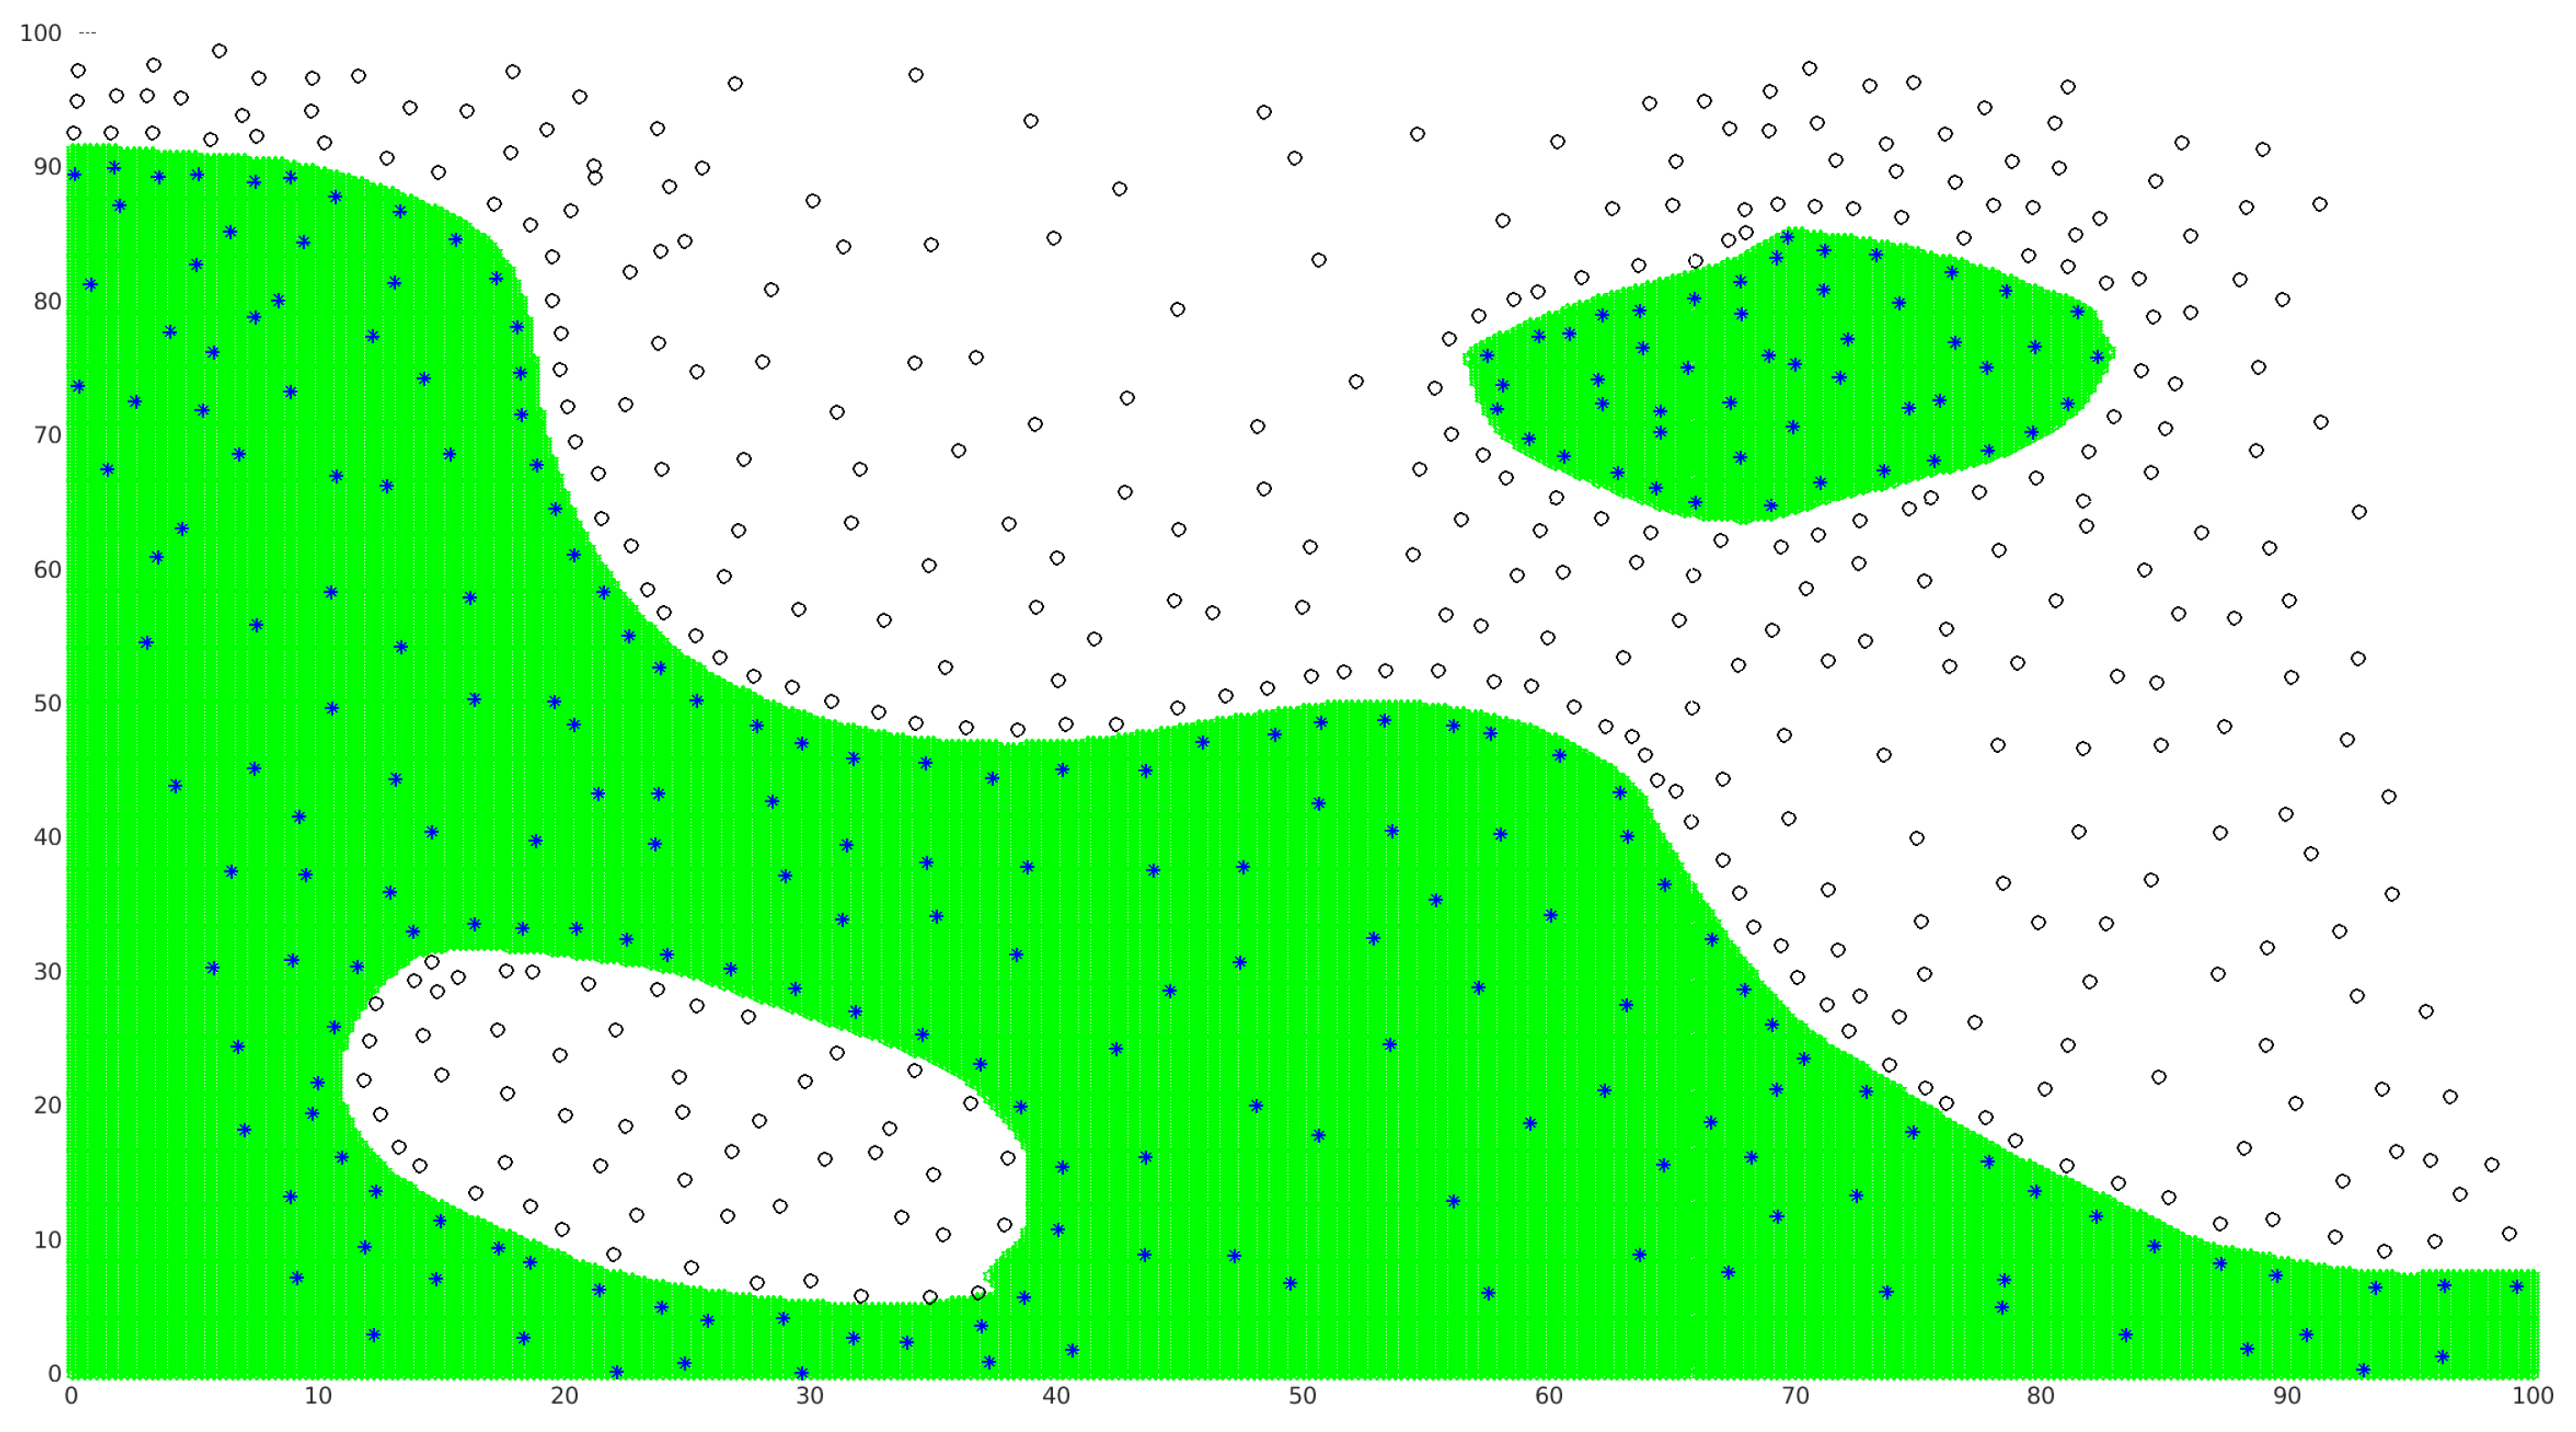
Figure 5.
Spiral case.
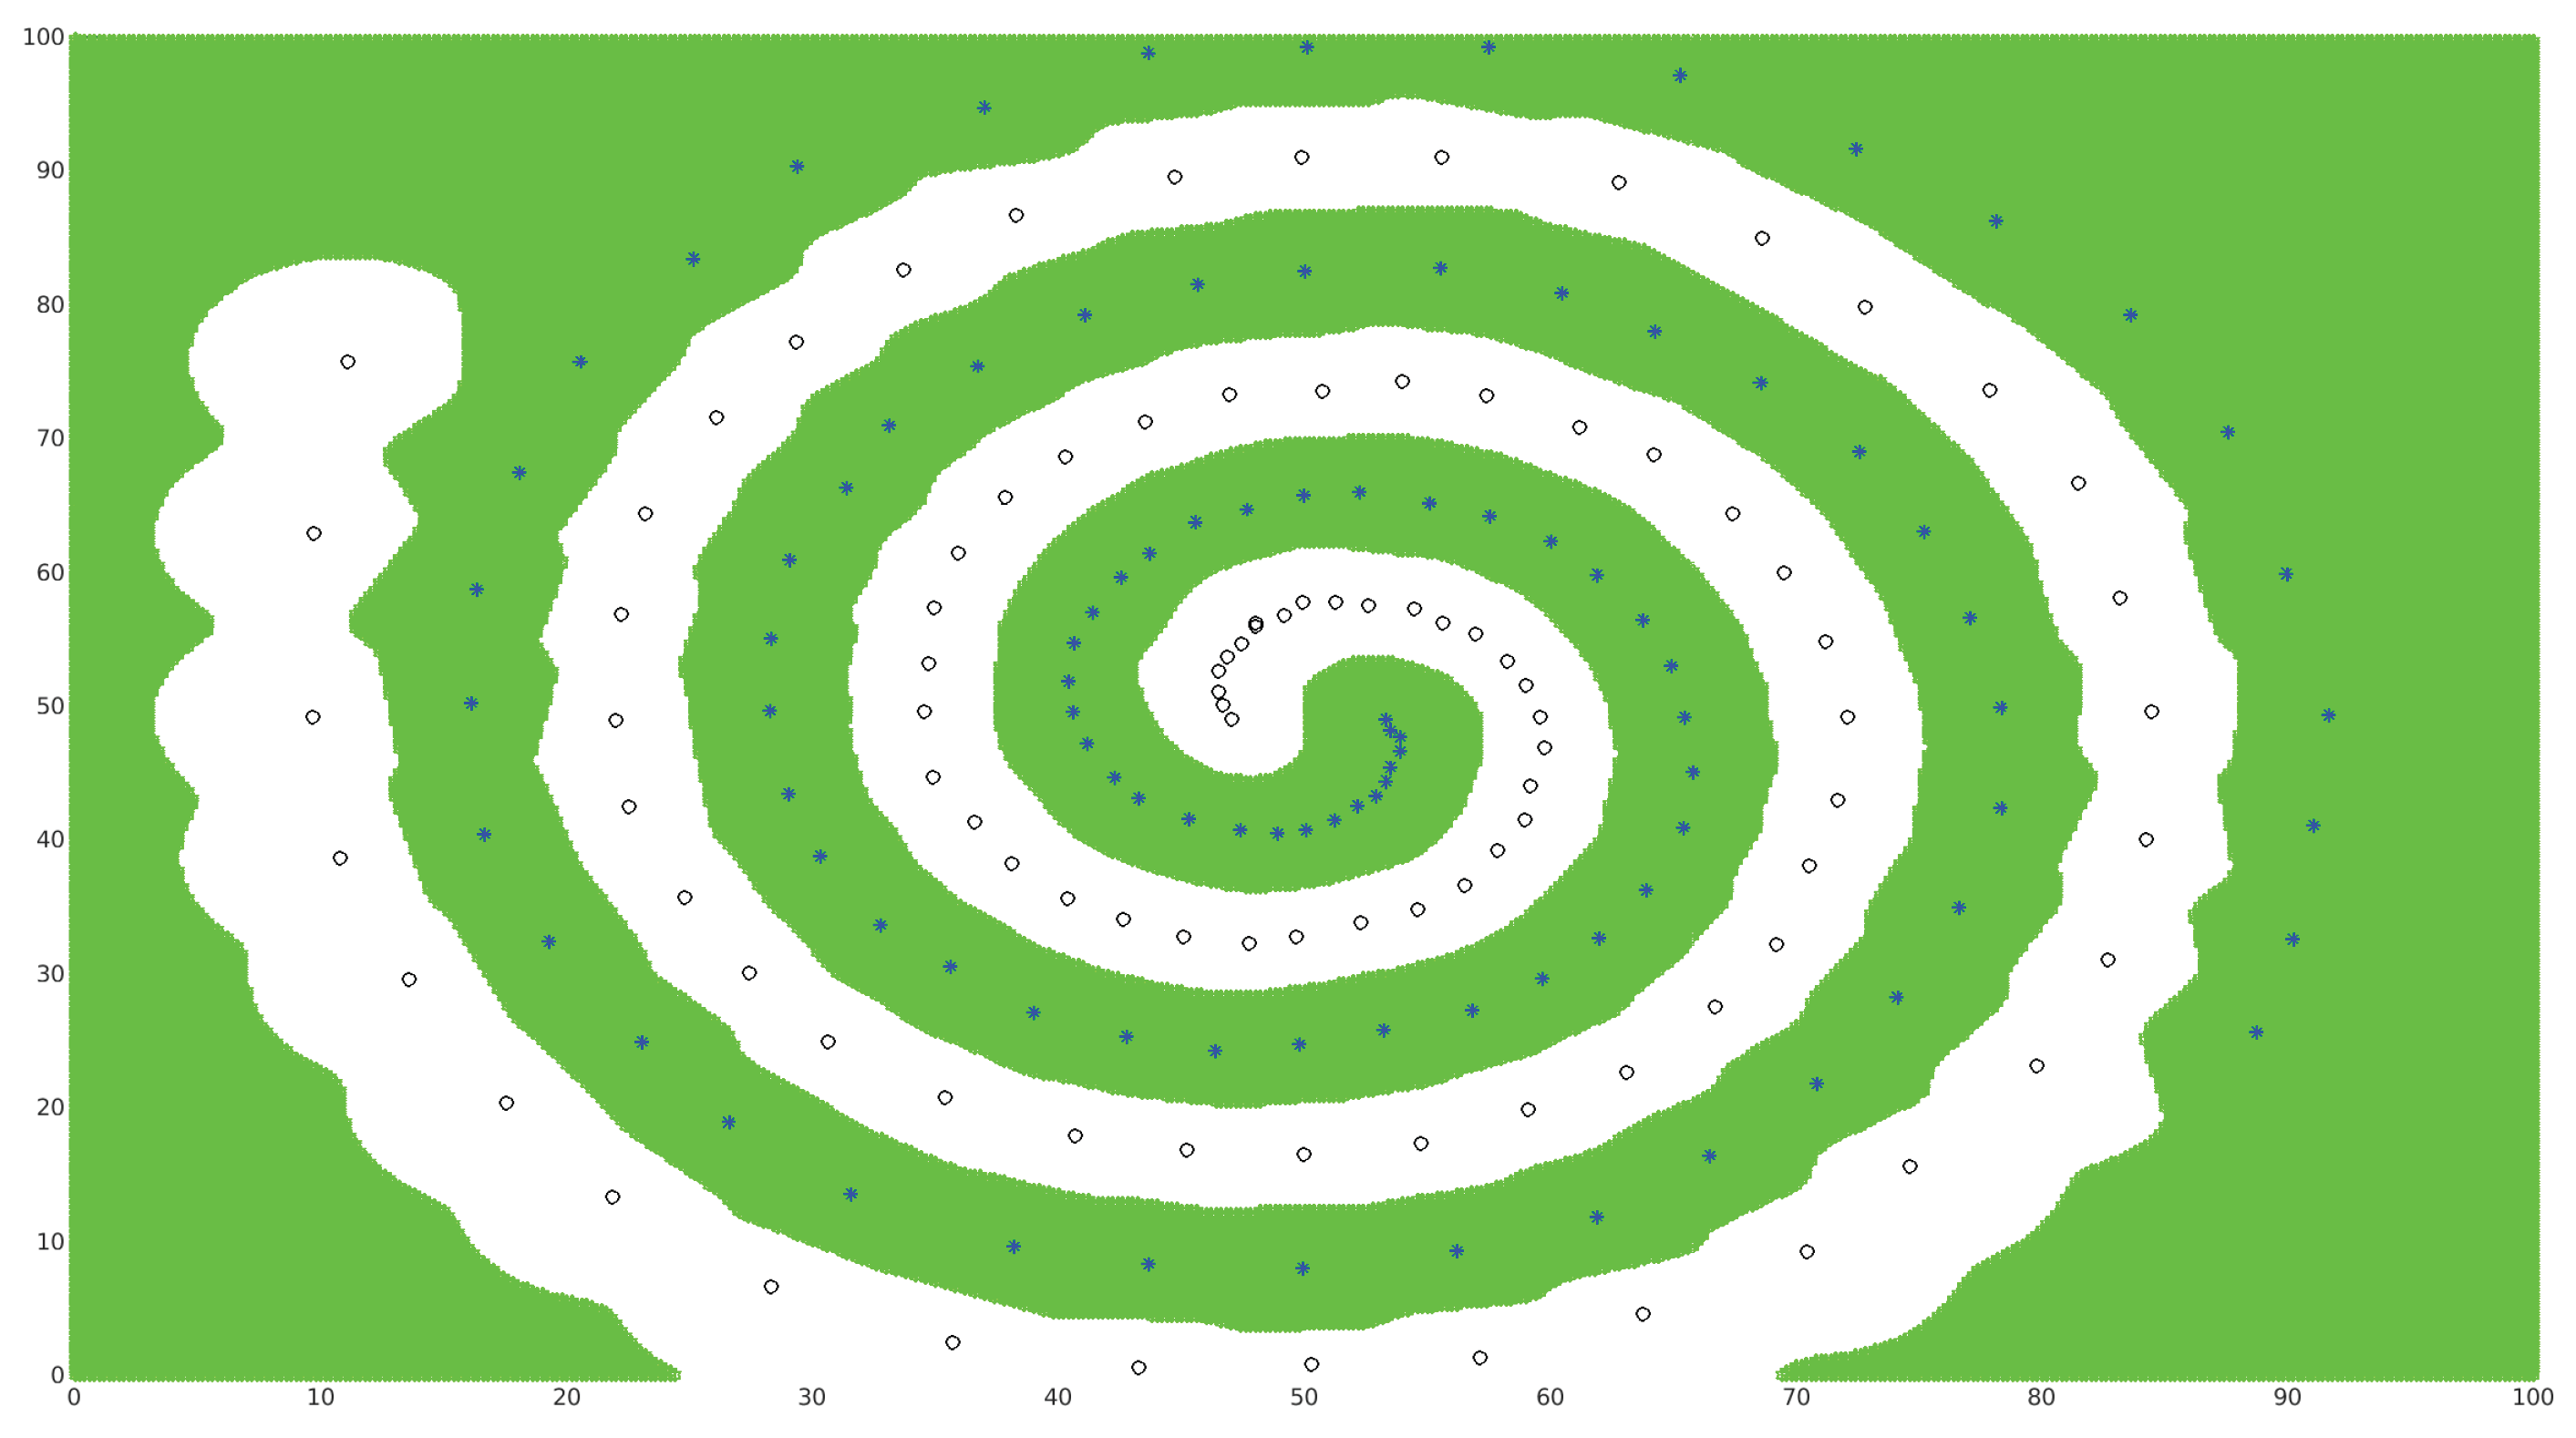

Table 1.
Tests Information (two classes).
| Test name | NB of Classes | Description/Reference | Training set size/ Class sizes |
Testing set size/ Feature vector size |
|---|---|---|---|---|
| Leukemia | 2 | Molecular classification of cancer [23] |
|
7129 |
| svmguide1 | 2 | Astroparticle application [24] |
|
4 |
| splice | 2 | Splice junctions in a DNA sequence [25] |
|
60 |
| austrian | 2 | Credit Approval dataset [26] |
|
14 |
| madelon 2 | Analysis of the NIPS 2003 [27] |
|
14 |
Table 2.
Tests Information (multiple classes).
| Test name | NB of Classes | Description/Reference | Training set size/ Class sizes |
Testing set size/ Feature vector size |
|---|---|---|---|---|
| DNA | 3 | DNA [28] |
|
180 |
| Satimage | 6 | Satelit images [28] | 4435 |
2000 36 |
| USPS | 10 | handwritten text recognition dataset [29] |
|
256 |
| letter | 26 | letter recognition dataset [29] |
|
16 |
| shuttle | 7 | space shuttle’ sensors [29] |
|
9 |
Table 3.
KOS-SVM performance comparison.
| name/ Classes | Test size | SVM-rate of success |
KOS-rate of success |
|---|---|---|---|
| Leukemia/2 | Test. # 34 | ||
| svmguide1/2 | Test. # 4000 | ||
| splice/2 | Test. # 2175 | ||
| austrian/2 | Test. # 341 | ||
| madelon/2 | Test. # 600 | ||
| DNA/3 | Test. # 1186 | ||
| Satimage/6 | Test. # 200 | ||
| USPS/10 | Test. # 2007 | ||
| letter/26 | Test. # 5000 | ||
| shuttle/7 | Test. # 14,500 |
Table 4.
KOS-SVM processing time comparison.
| name/ Classes | Test size | SVM processing time |
KOS processing time |
|---|---|---|---|
| Leukemia/2 | Test. # 34 | ||
| svmguide1/2 | Test. # 4000 | ||
| splice/2 | Test. # 2175 | ||
| austrian/2 | Test. # 341 | ||
| madelon/2 | Test. # 600 | ||
| DNA/3 | Test. # 1186 | ||
| Satimage/6 | Test. # 200 | ||
| USPS/10 | Test. # 2007 | ||
| letter/26 | Test. # 5000 | ||
| shuttle/7 | Test. # 14,500 |
Disclaimer/Publisher’s Note: The statements, opinions and data contained in all publications are solely those of the individual author(s) and contributor(s) and not of MDPI and/or the editor(s). MDPI and/or the editor(s) disclaim responsibility for any injury to people or property resulting from any ideas, methods, instructions or products referred to in the content. |
© 2025 by the authors. Licensee MDPI, Basel, Switzerland. This article is an open access article distributed under the terms and conditions of the Creative Commons Attribution (CC BY) license (http://creativecommons.org/licenses/by/4.0/).
Copyright: This open access article is published under a Creative Commons CC BY 4.0 license, which permit the free download, distribution, and reuse, provided that the author and preprint are cited in any reuse.


