
Submitted:
13 October 2025
Posted:
13 October 2025
You are already at the latest version
Abstract
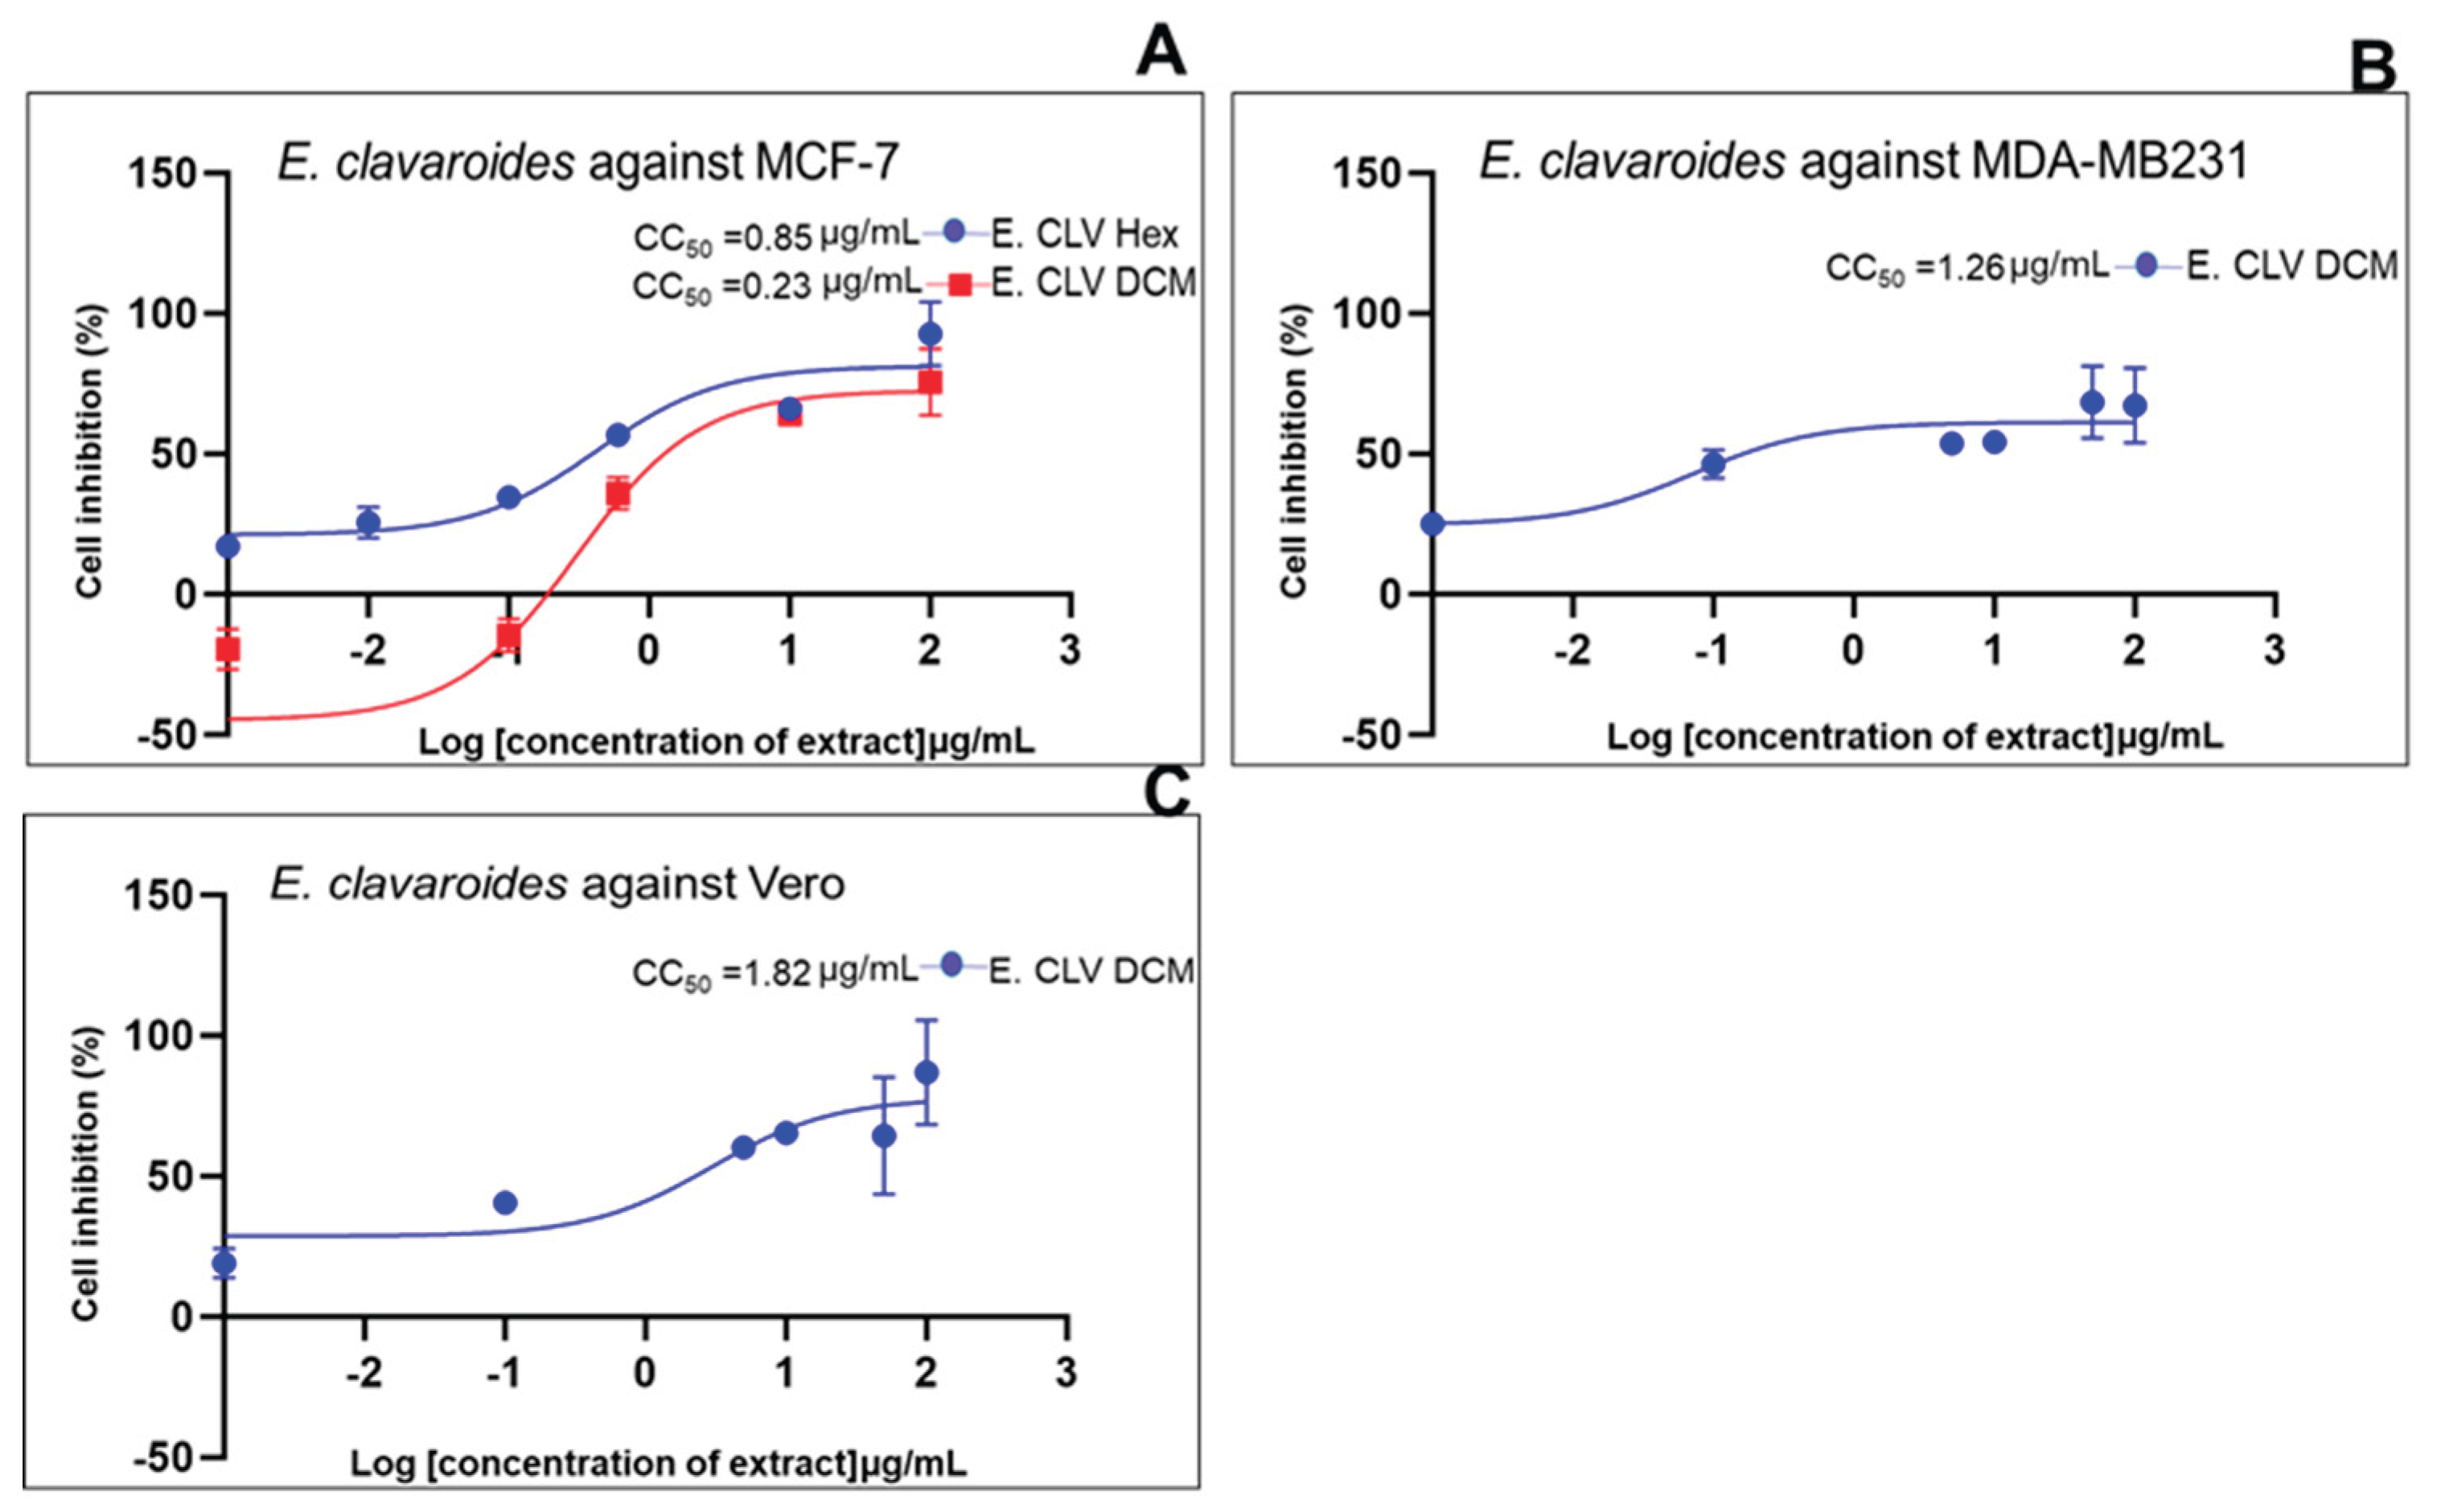
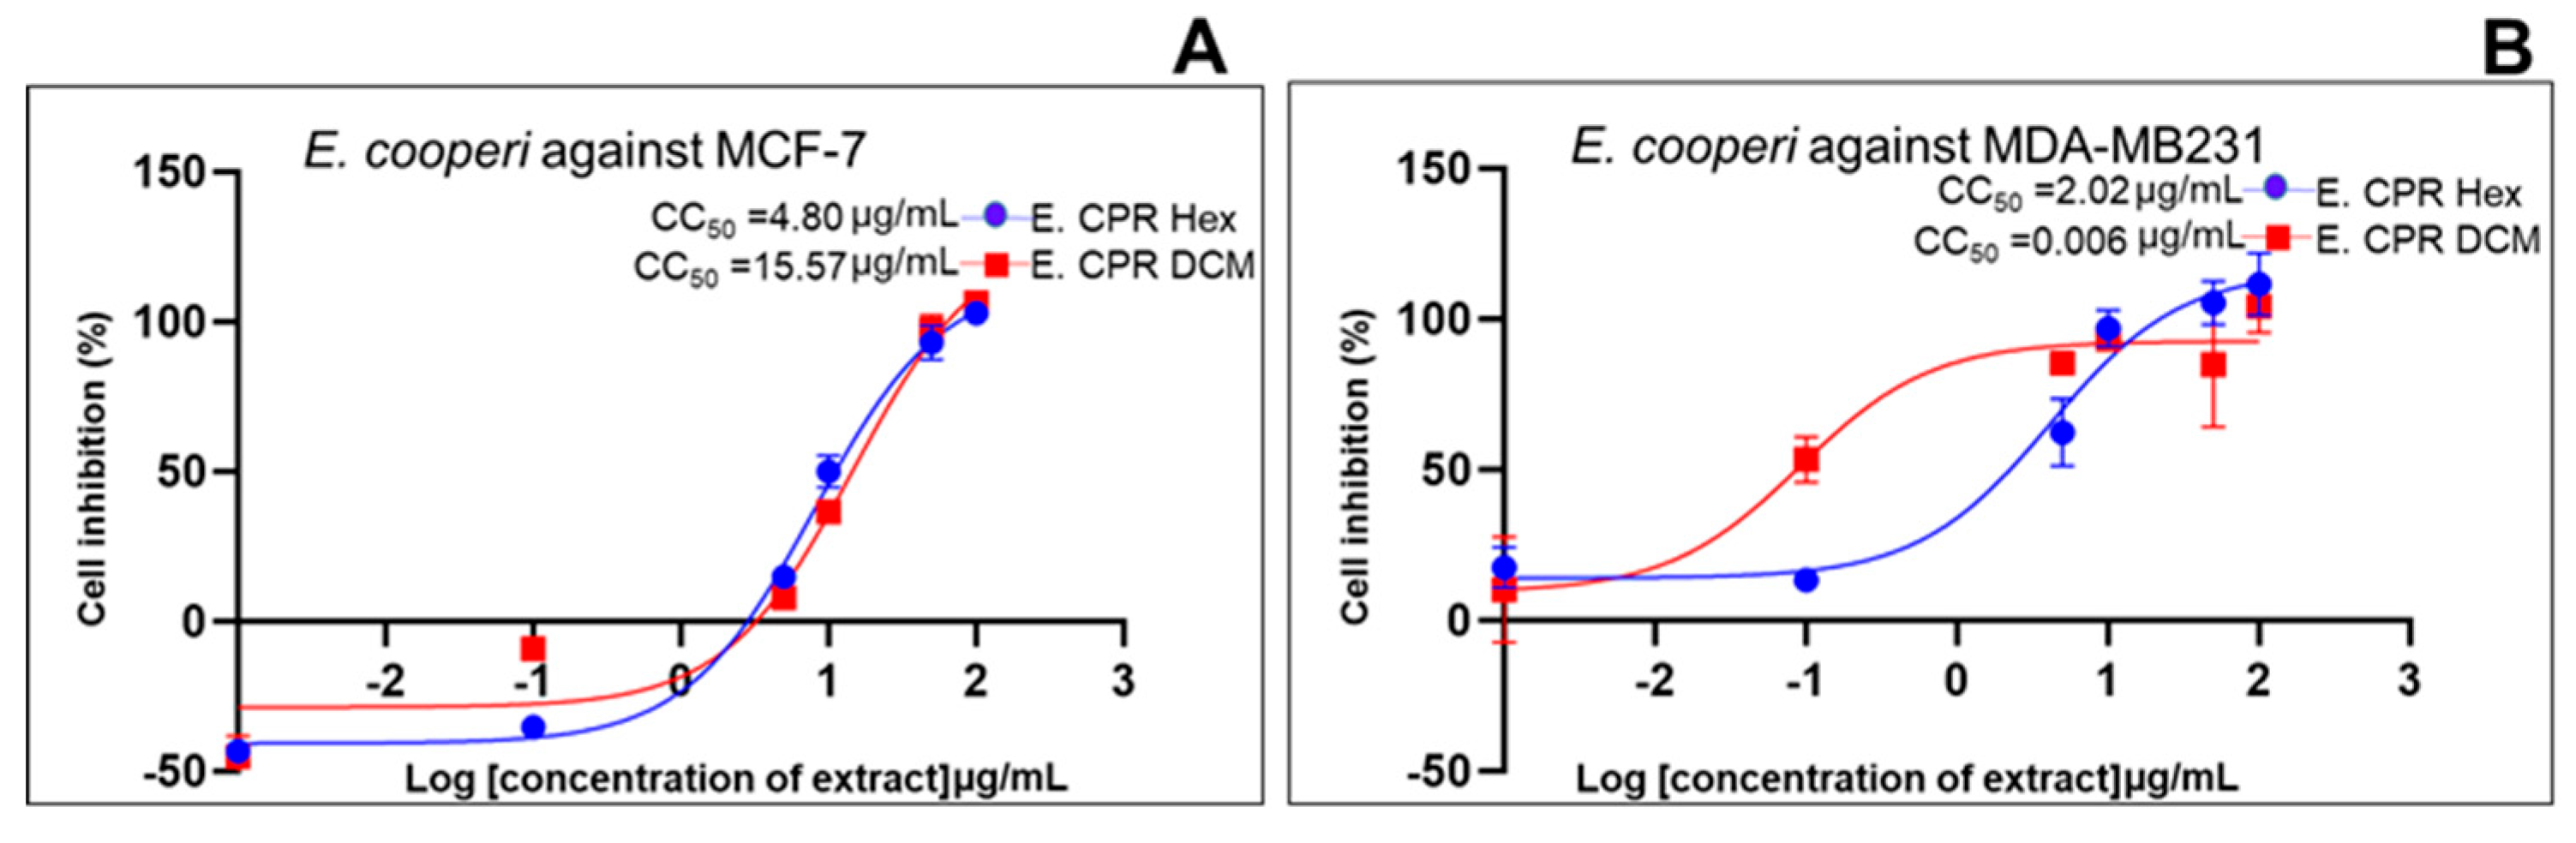
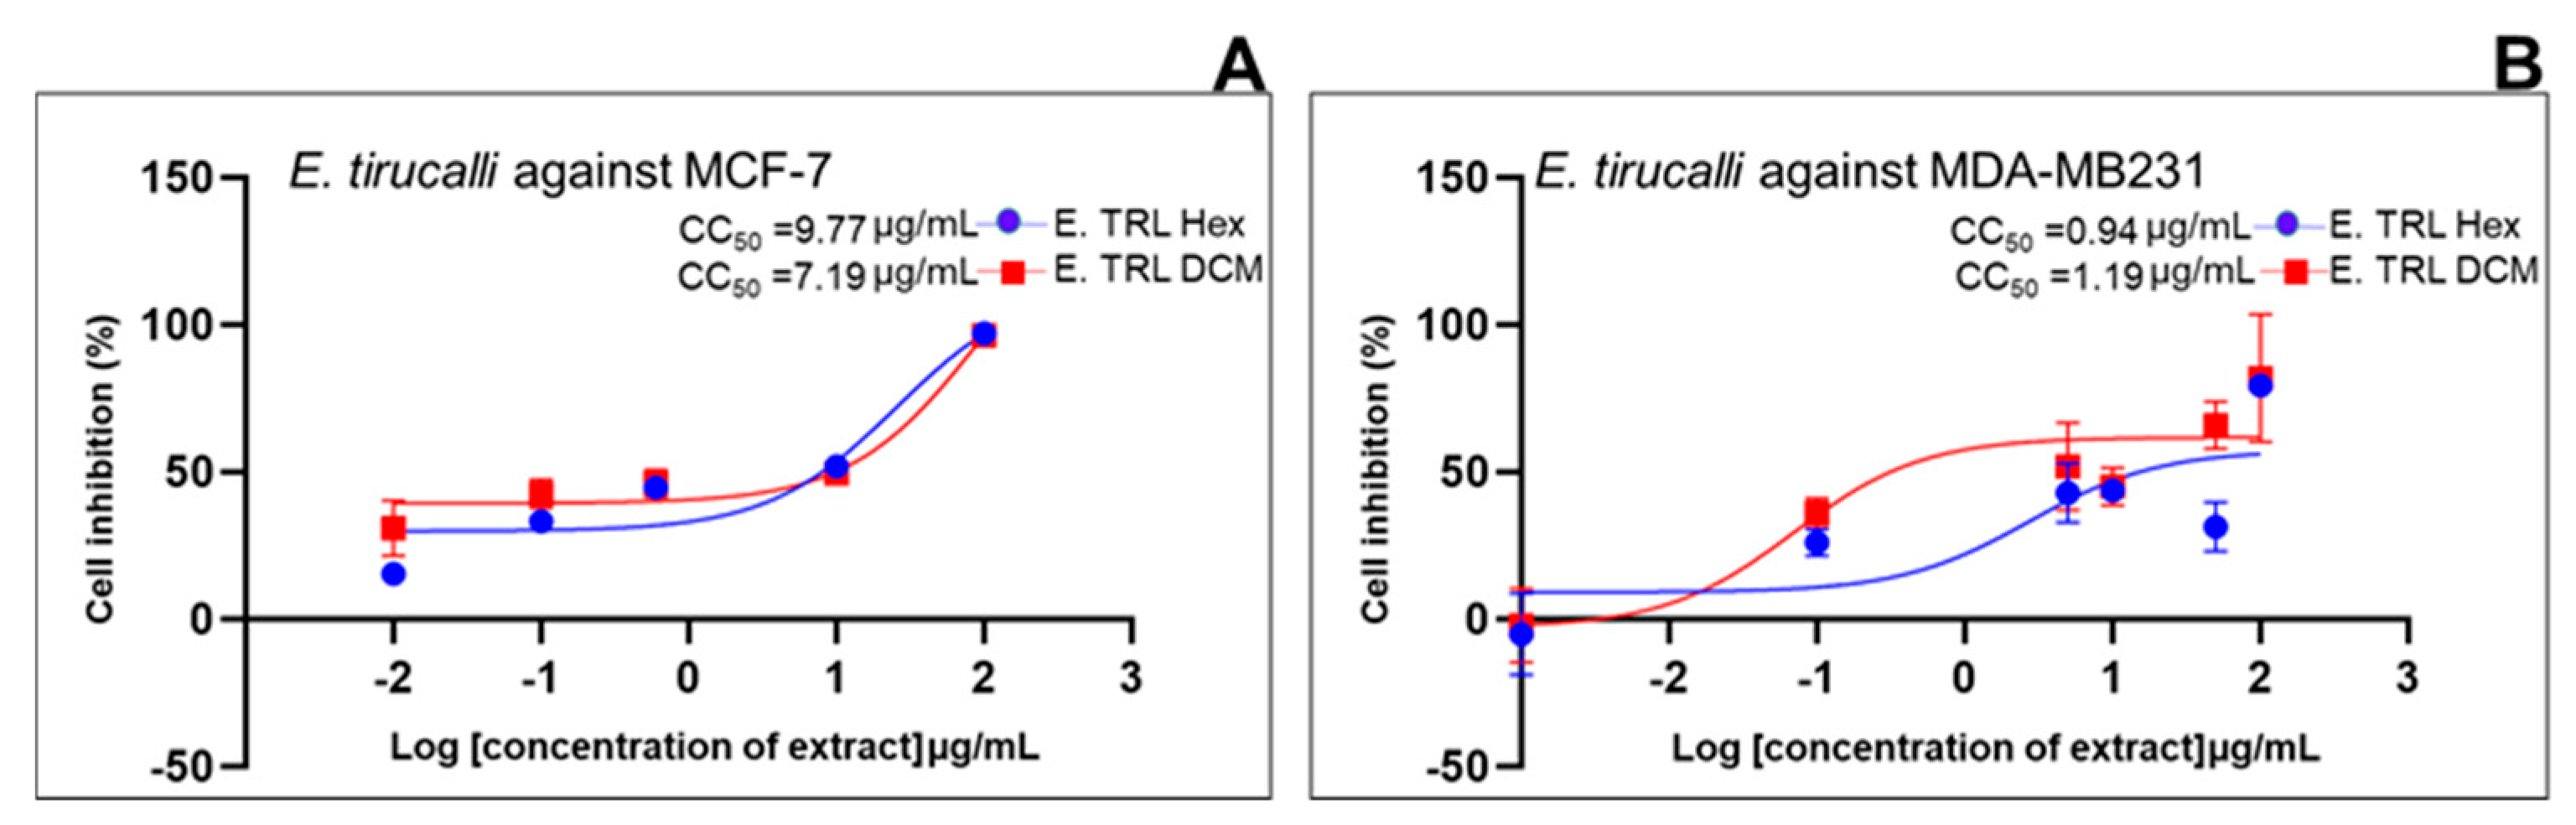
The use of medicinal plants in traditional healthcare systems has a long history, particularly in regions with limited access to modern medical facilities. In South Africa, indigenous knowledge of plant-based remedies has been preserved through oral traditions, making these plants vital resources for local communities. This study investigates sixteen unexplored Euphorbia species for their potential in inhibiting breast cancer cell growth. Due to the small size of the plants, the entire plant was used for each species. A systematic approach was employed, including plant selection, sequential extraction using organic solvents, phytochemical screening, and in vitro cytotoxicity testing using the 3-(4,5-dimethylthiazol-2-yl)-2,5-diphenyl tetrazolium bromide (MTT) assay. High-performance liquid chromatography (HPLC) was used to identify primary metabolites. All sixteen species contained glycosides and triterpenoids. The ethyl acetate (EtOAc) extract of Euphorbia ledienii, dichloromethane (DCM) extract of Euphorbia cooperi, and DCM extract of Euphorbia clavarioides exhibited the highest inhibitory effects on Michigan Cancer Foundation-7 (MCF-7), and M.D. Anderson-Metastatic Breast-231 (MDA-MB-231) cell lines, with cytotoxic concentration (CC₅₀) values of 0.06 μg/mL, 0.07 μg/mL, and 0.23 μg/mL, respectively. Euphorbia tirucalli (DCM extract) and Euphorbia cooperi (hexane extract) displayed selectivity for MDA-MB231 cells, with selectivity index (SI) values of 49.40 and 84.03, respectively. Euphorbia trigona, Euphorbia gorgonis, Euphorbia ledienii, and Euphorbia arabica had similar distribution of secondary metabolites based on HPLC analysis. These findings suggest that certain Euphorbia species exhibit selective cytotoxicity against breast cancer cells while sparing normal cells, highlighting their potential for breast cancer therapy.
Keywords:
1. Introduction
2. Results
2.1. Phytochemical Investigation

| Phytoconstituents | Euphorbia sp. | |||||||||||||||
|---|---|---|---|---|---|---|---|---|---|---|---|---|---|---|---|---|
| E. ferox | E. bupleurifolia | E. tirucalli | E. ammak | E. enopla | E. cooperi | E. gorgonis | E. arabica | E. trigona | E. horrida Var | E.horrida indigenous | E. polygona | E. coerulescens | E. ledienii | E. stellata | E. clavaroides | |
| Phytosterols | + | + | - | + | + | + | + | + | + | + | + | + | + | + | + | + |
| Pentose | + | + | - | - | + | + | + | - | + | + | + | - | + | - | - | - |
| Tannins | - | + | + | - | + | + | - | + | - | + | + | + | + | + | - | + |
| Glycosides | + | + | + | + | + | + | + | + | + | + | + | + | + | + | + | + |
| Triterpenoids | + | + | + | + | + | + | + | + | + | + | + | + | + | + | + | + |
| Anthraquinones | + | - | - | + | + | + | - | + | + | + | + | - | - | - | - | + |
| Saponins | - | + | + | - | + | - | + | - | - | + | + | + | + | - | - | - |
| Flavonoids | + | + | - | + | + | + | + | + | + | + | + | + | + | + | + | + |
| Alkaloids | + | + | - | + | - | + | + | - | + | + | - | + | + | + | - | + |
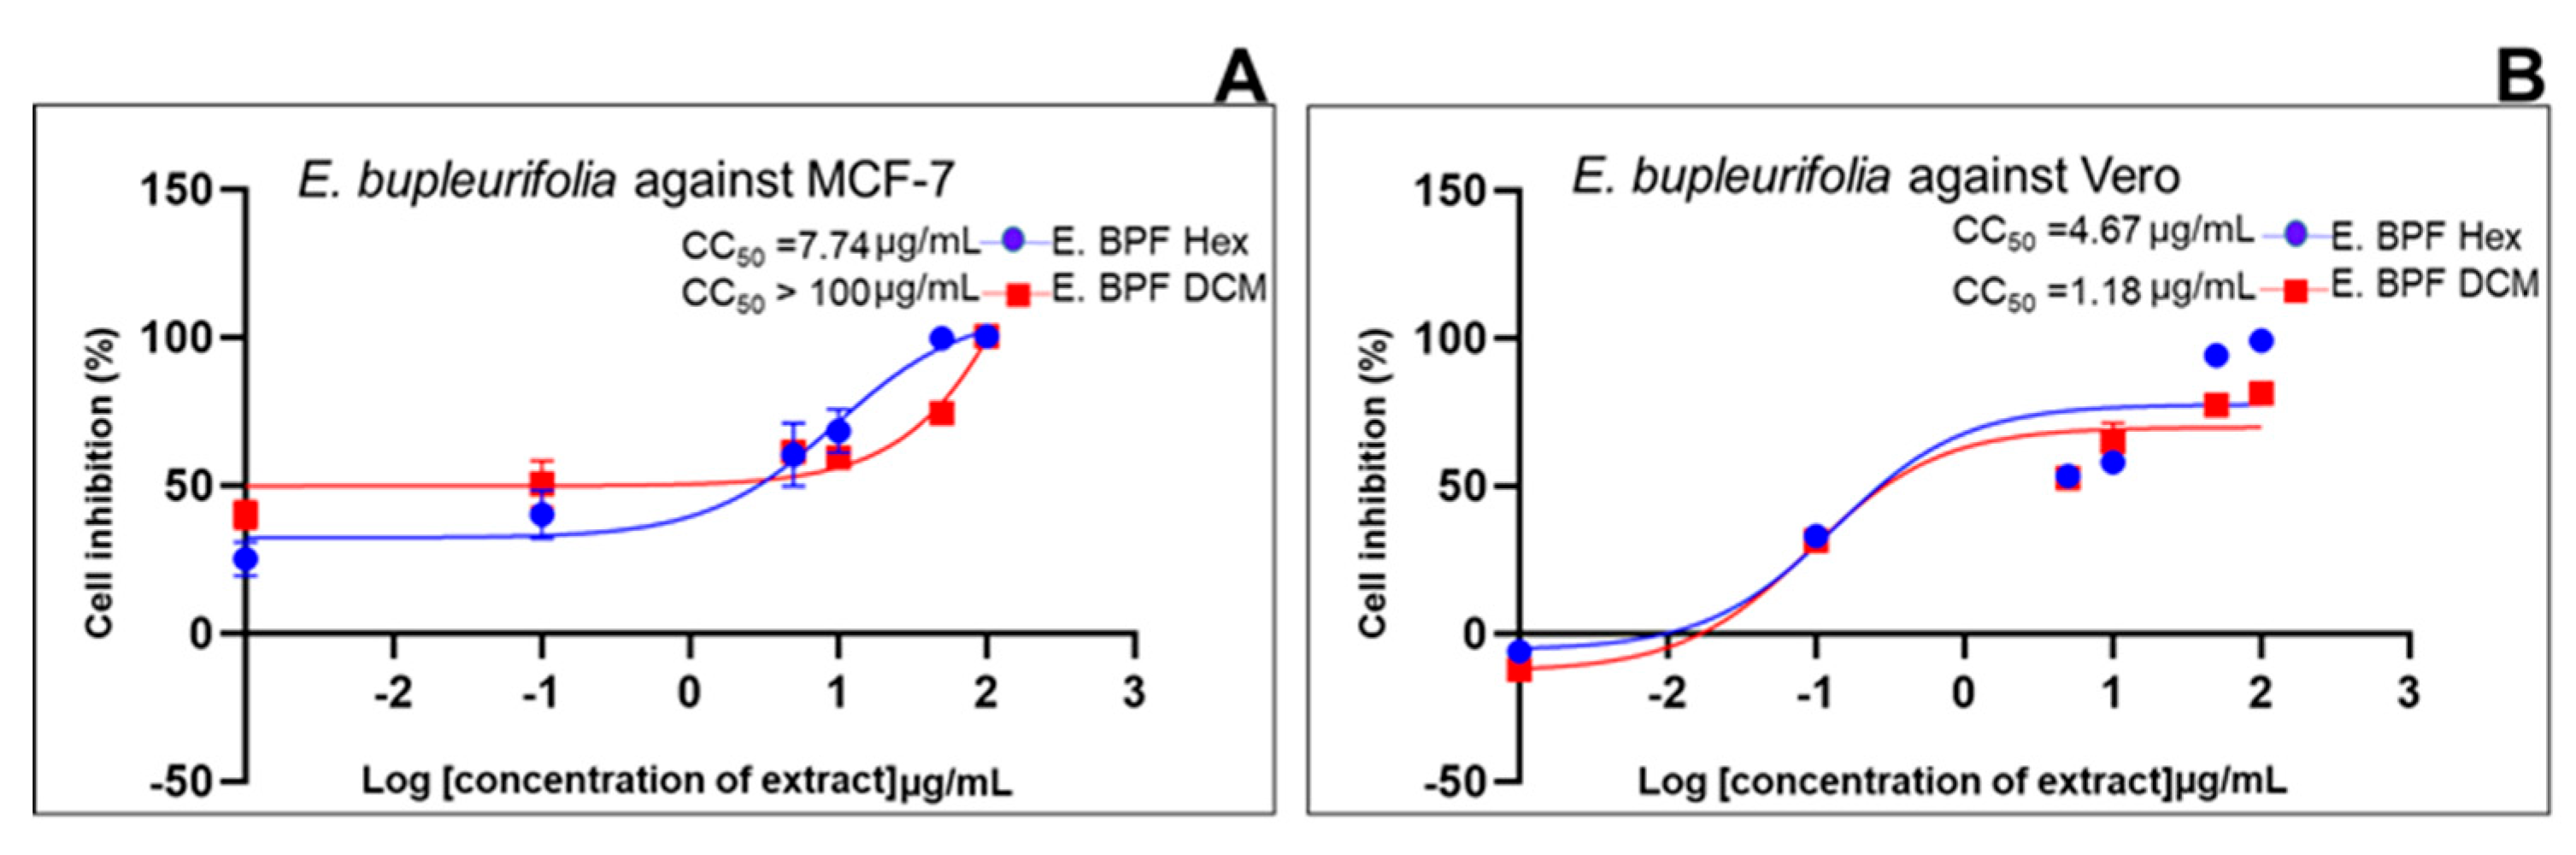
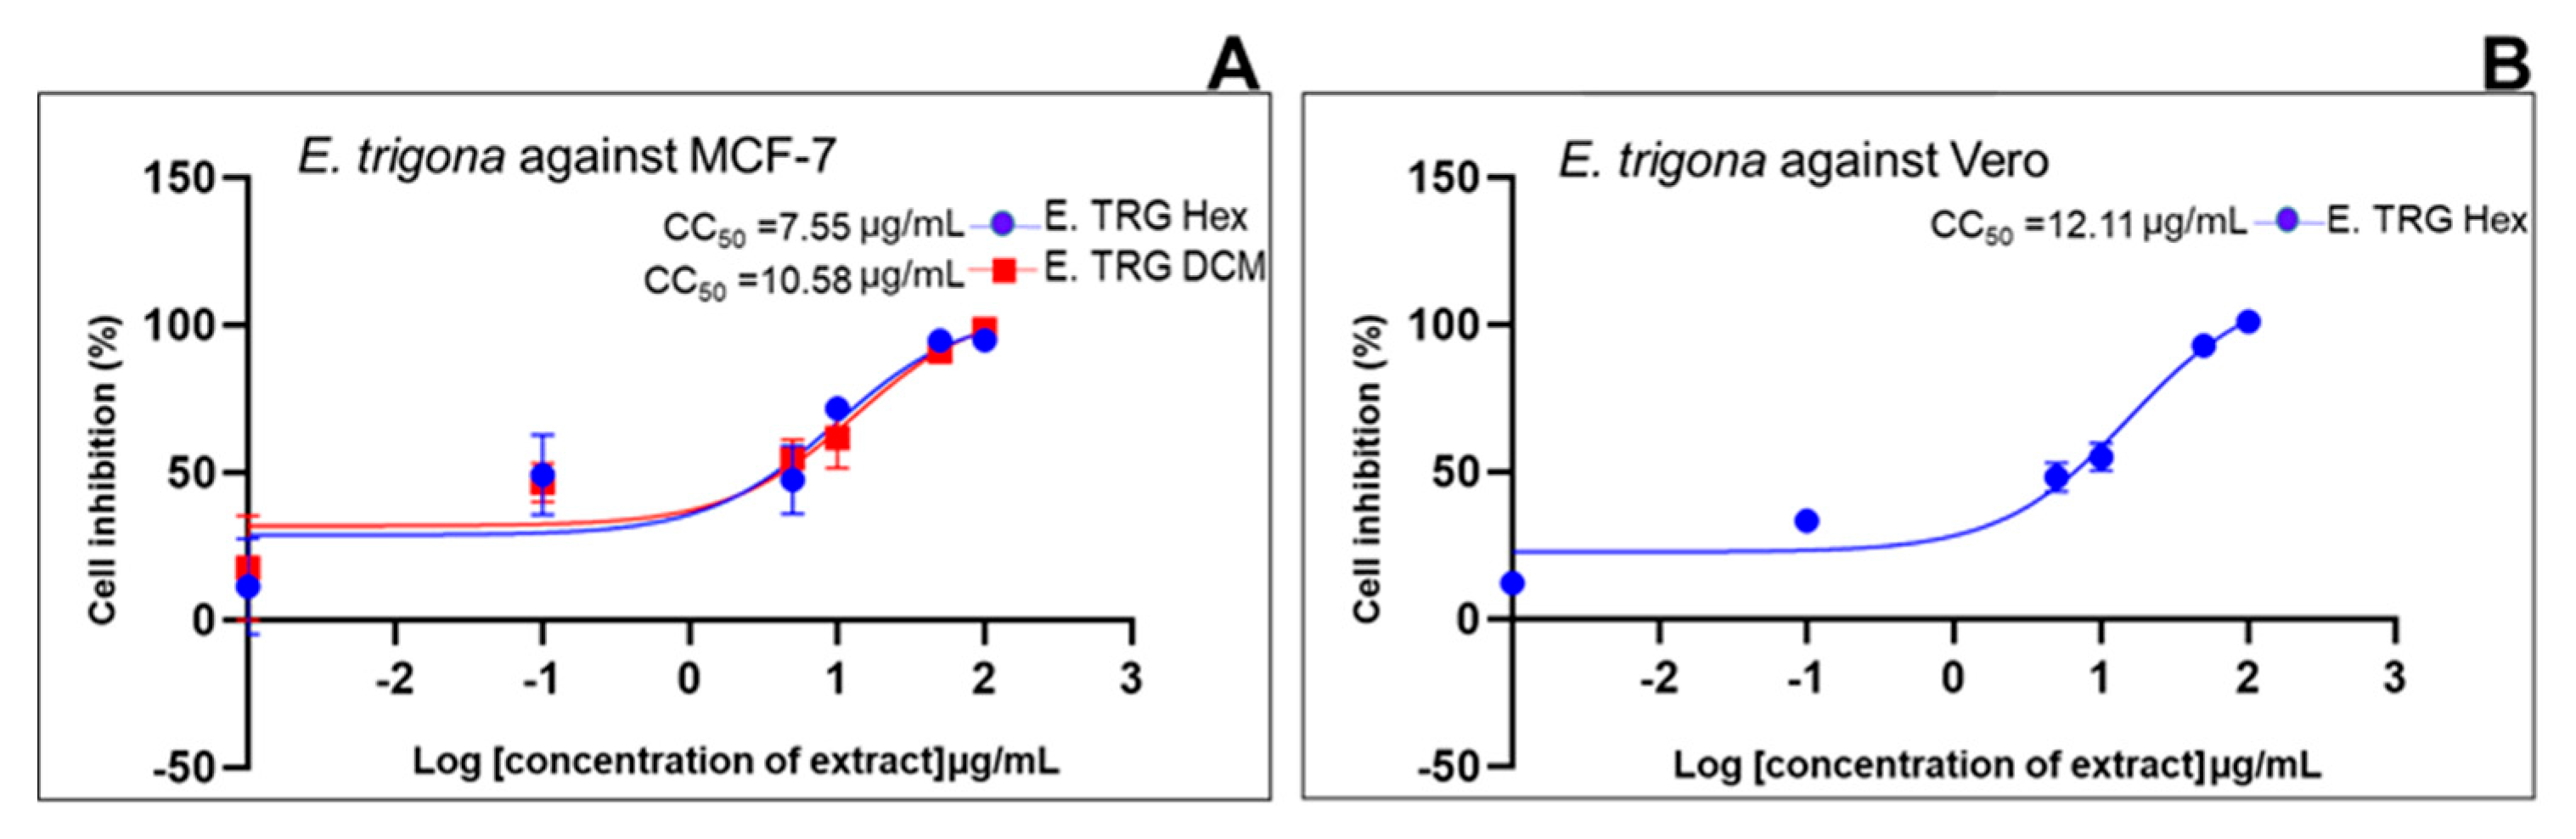
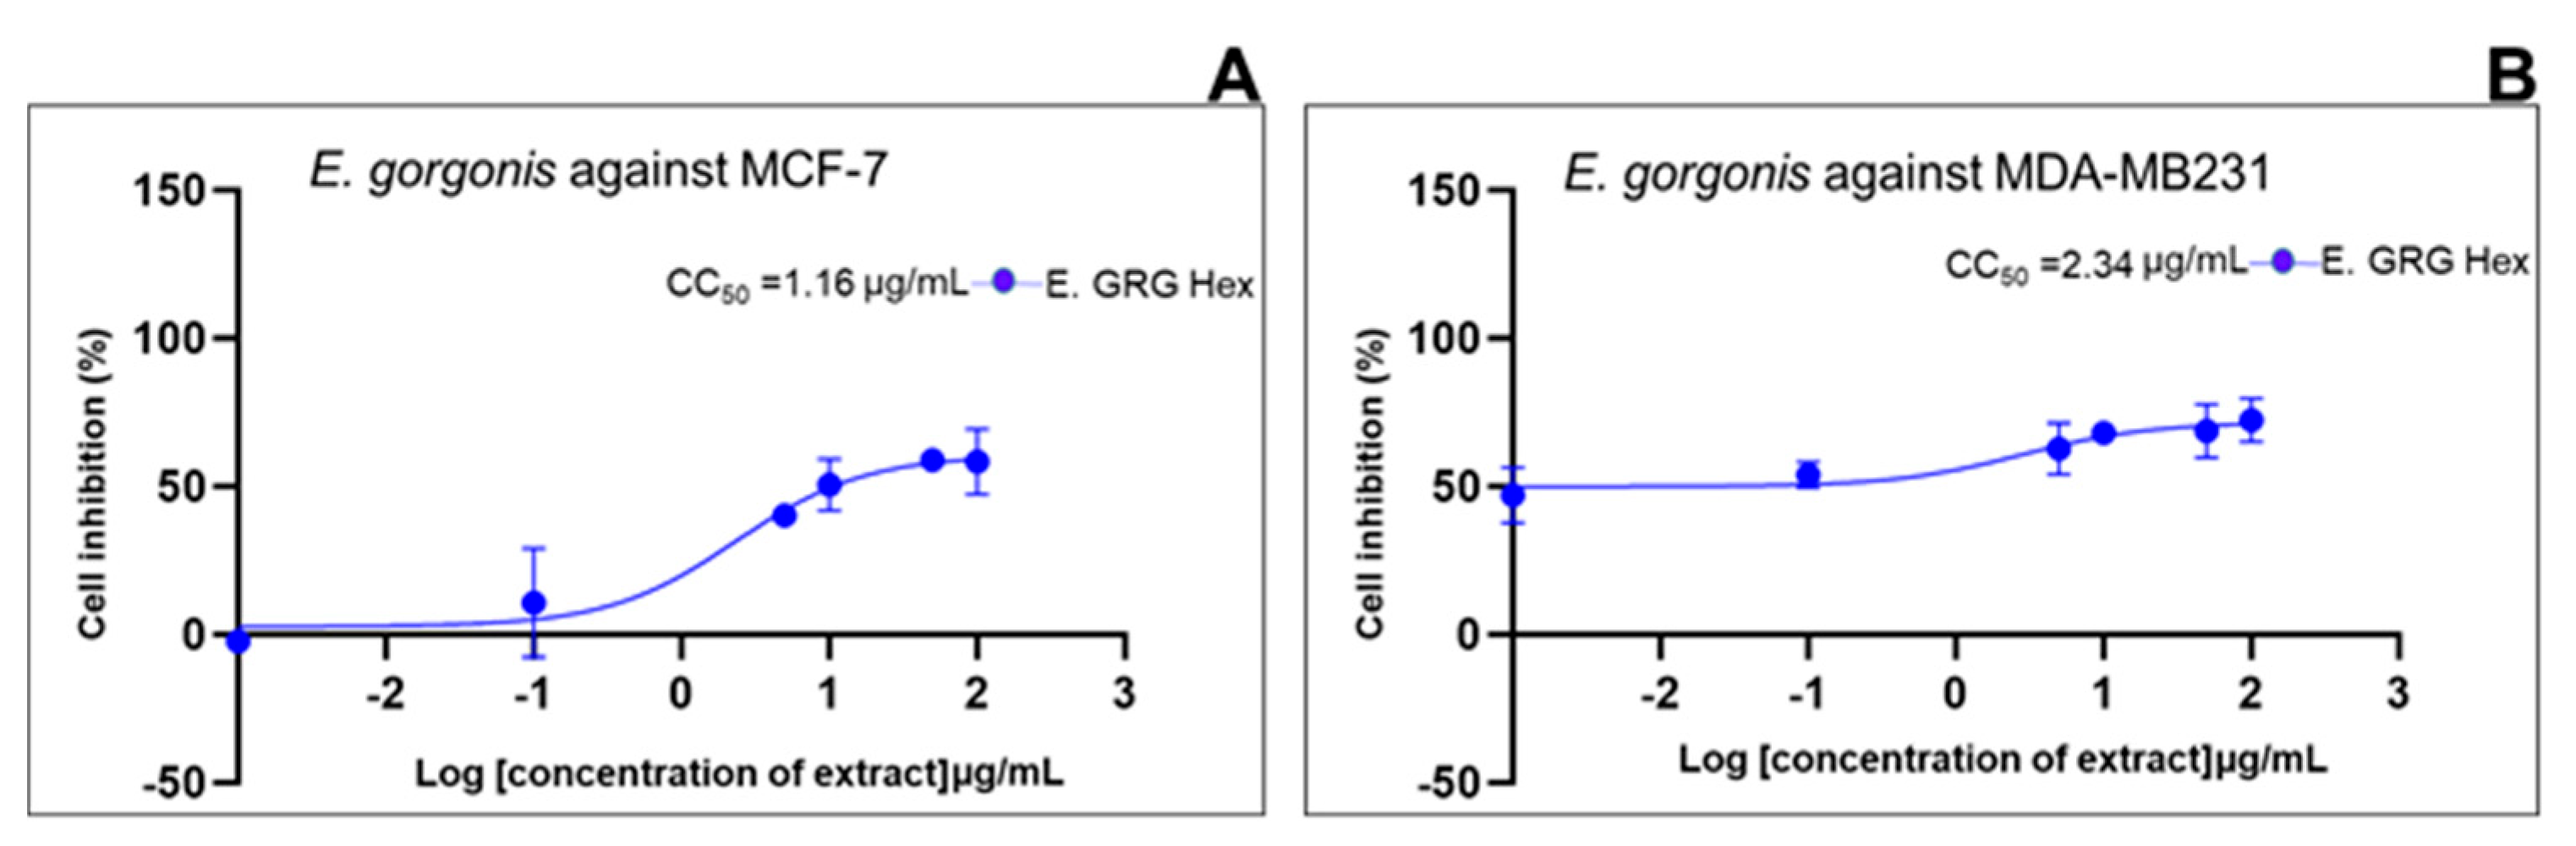
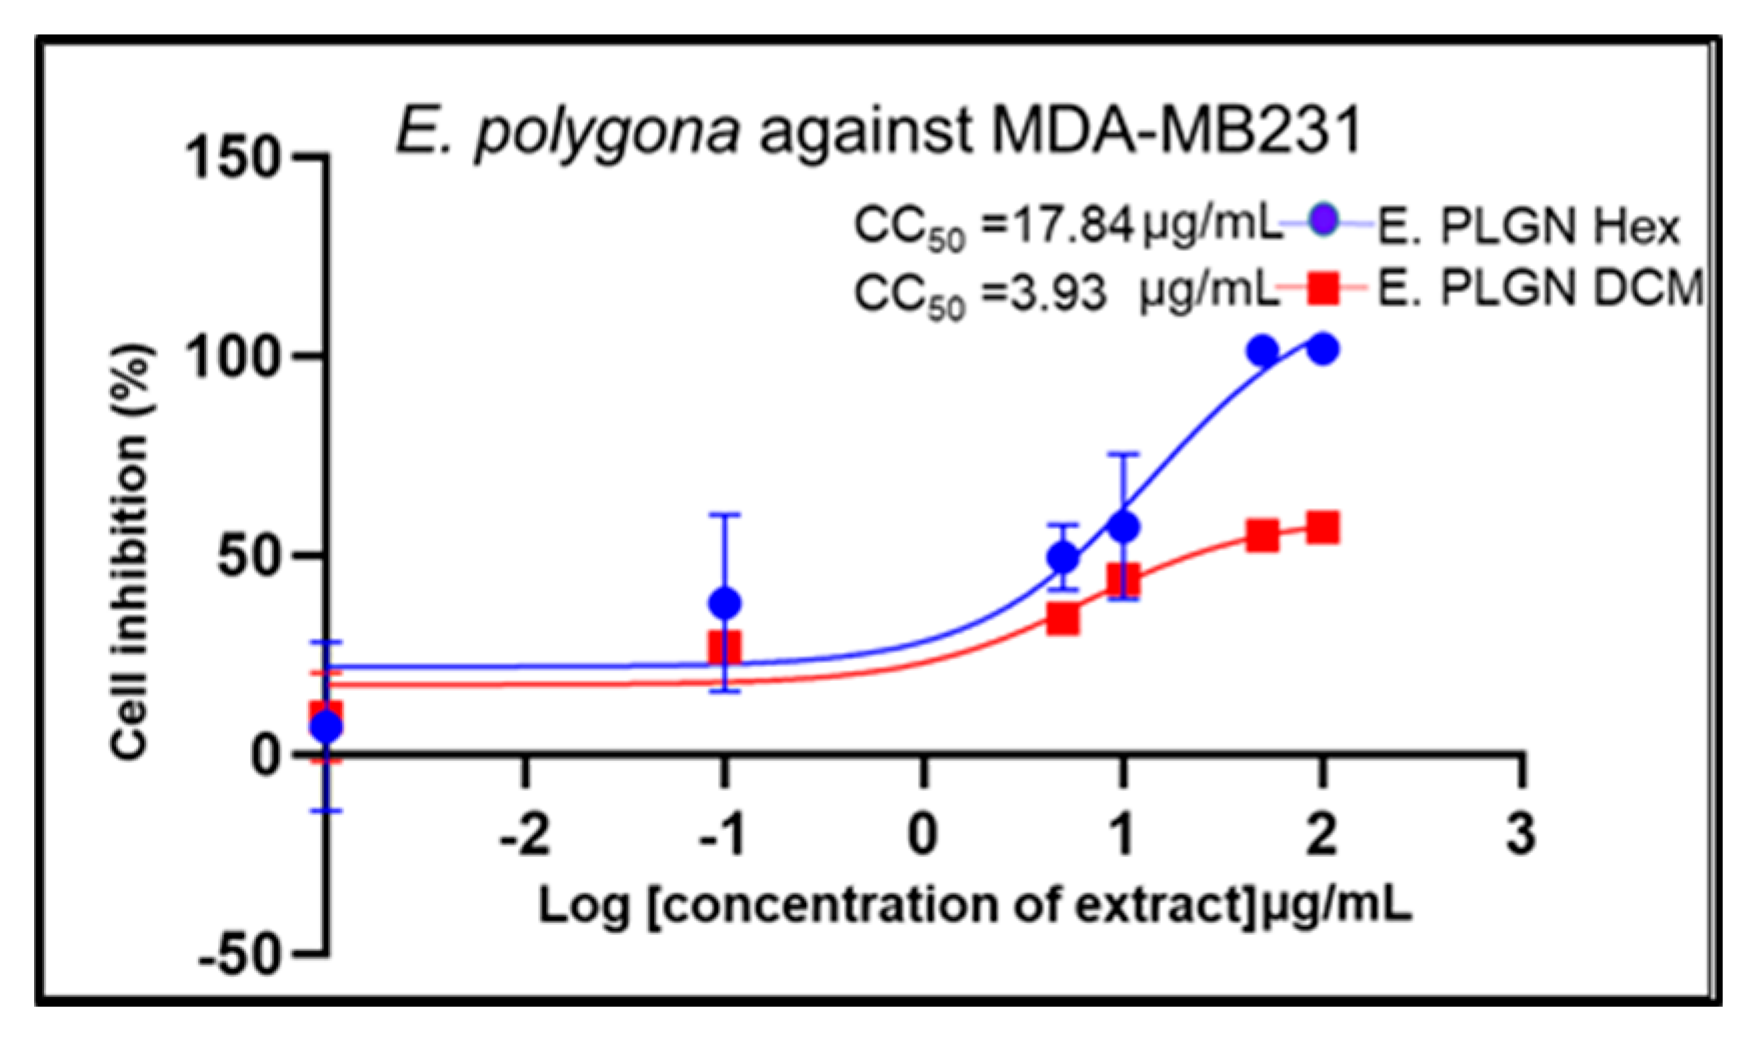
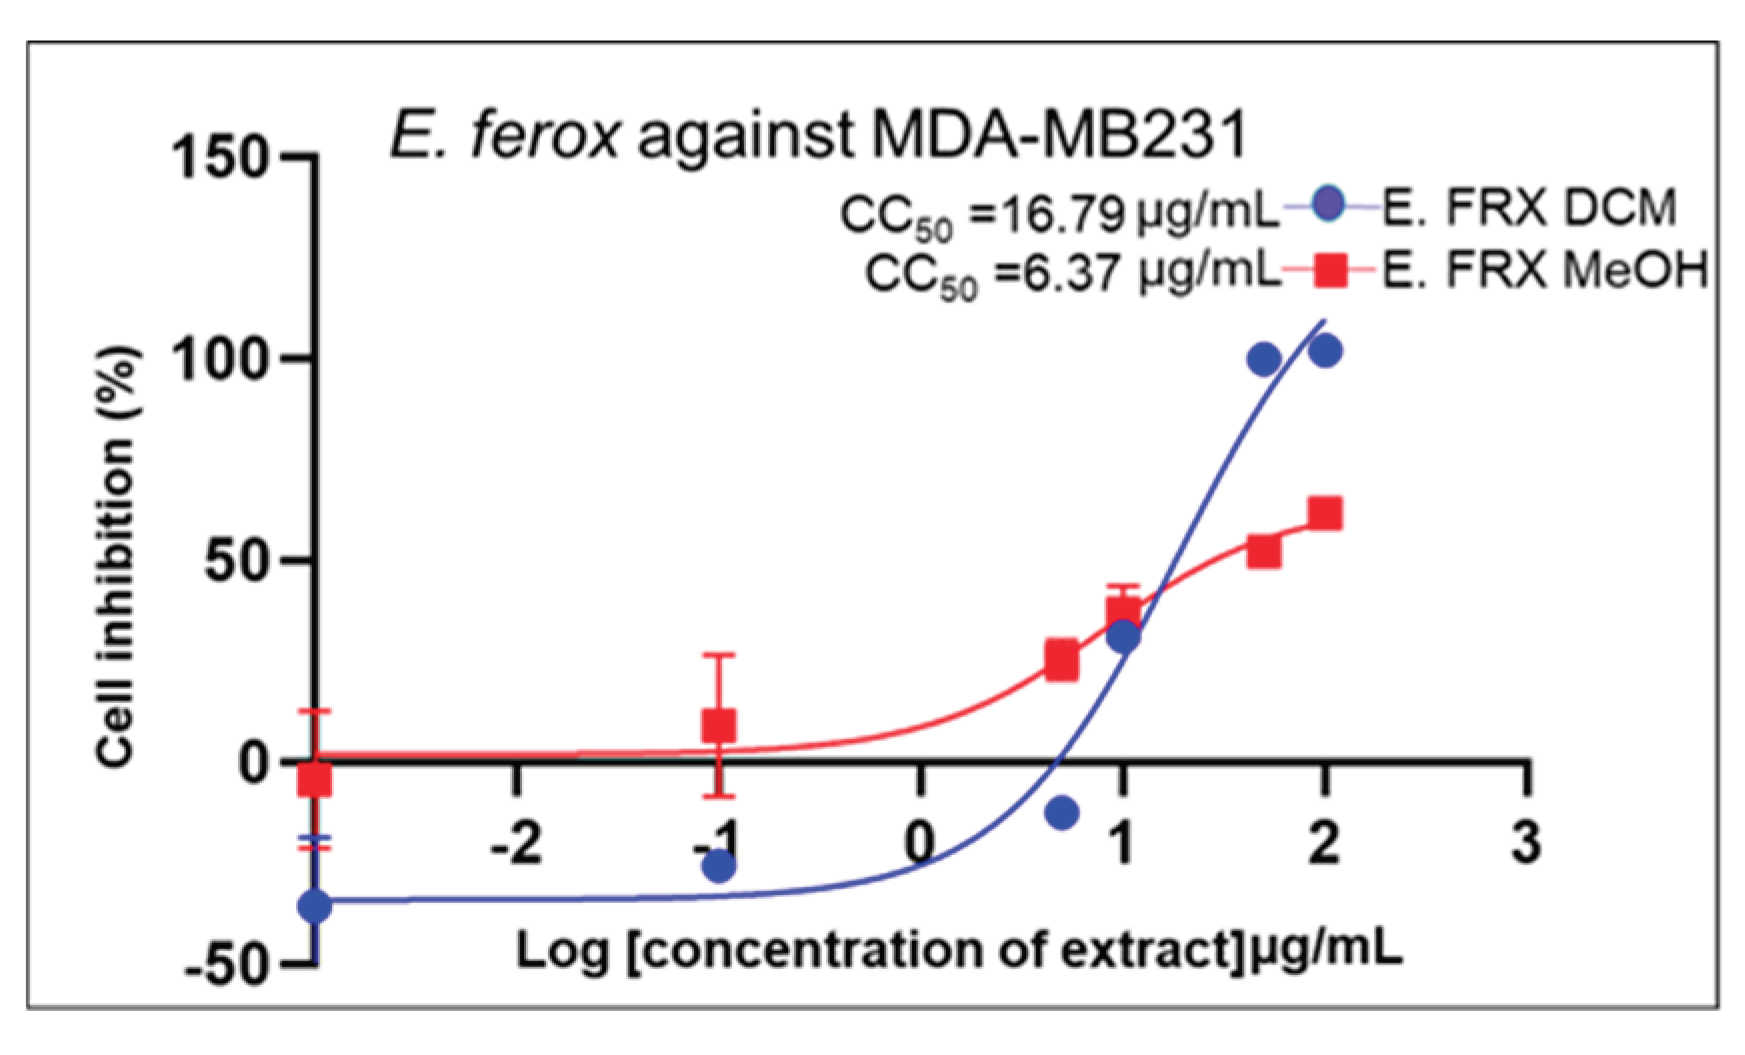
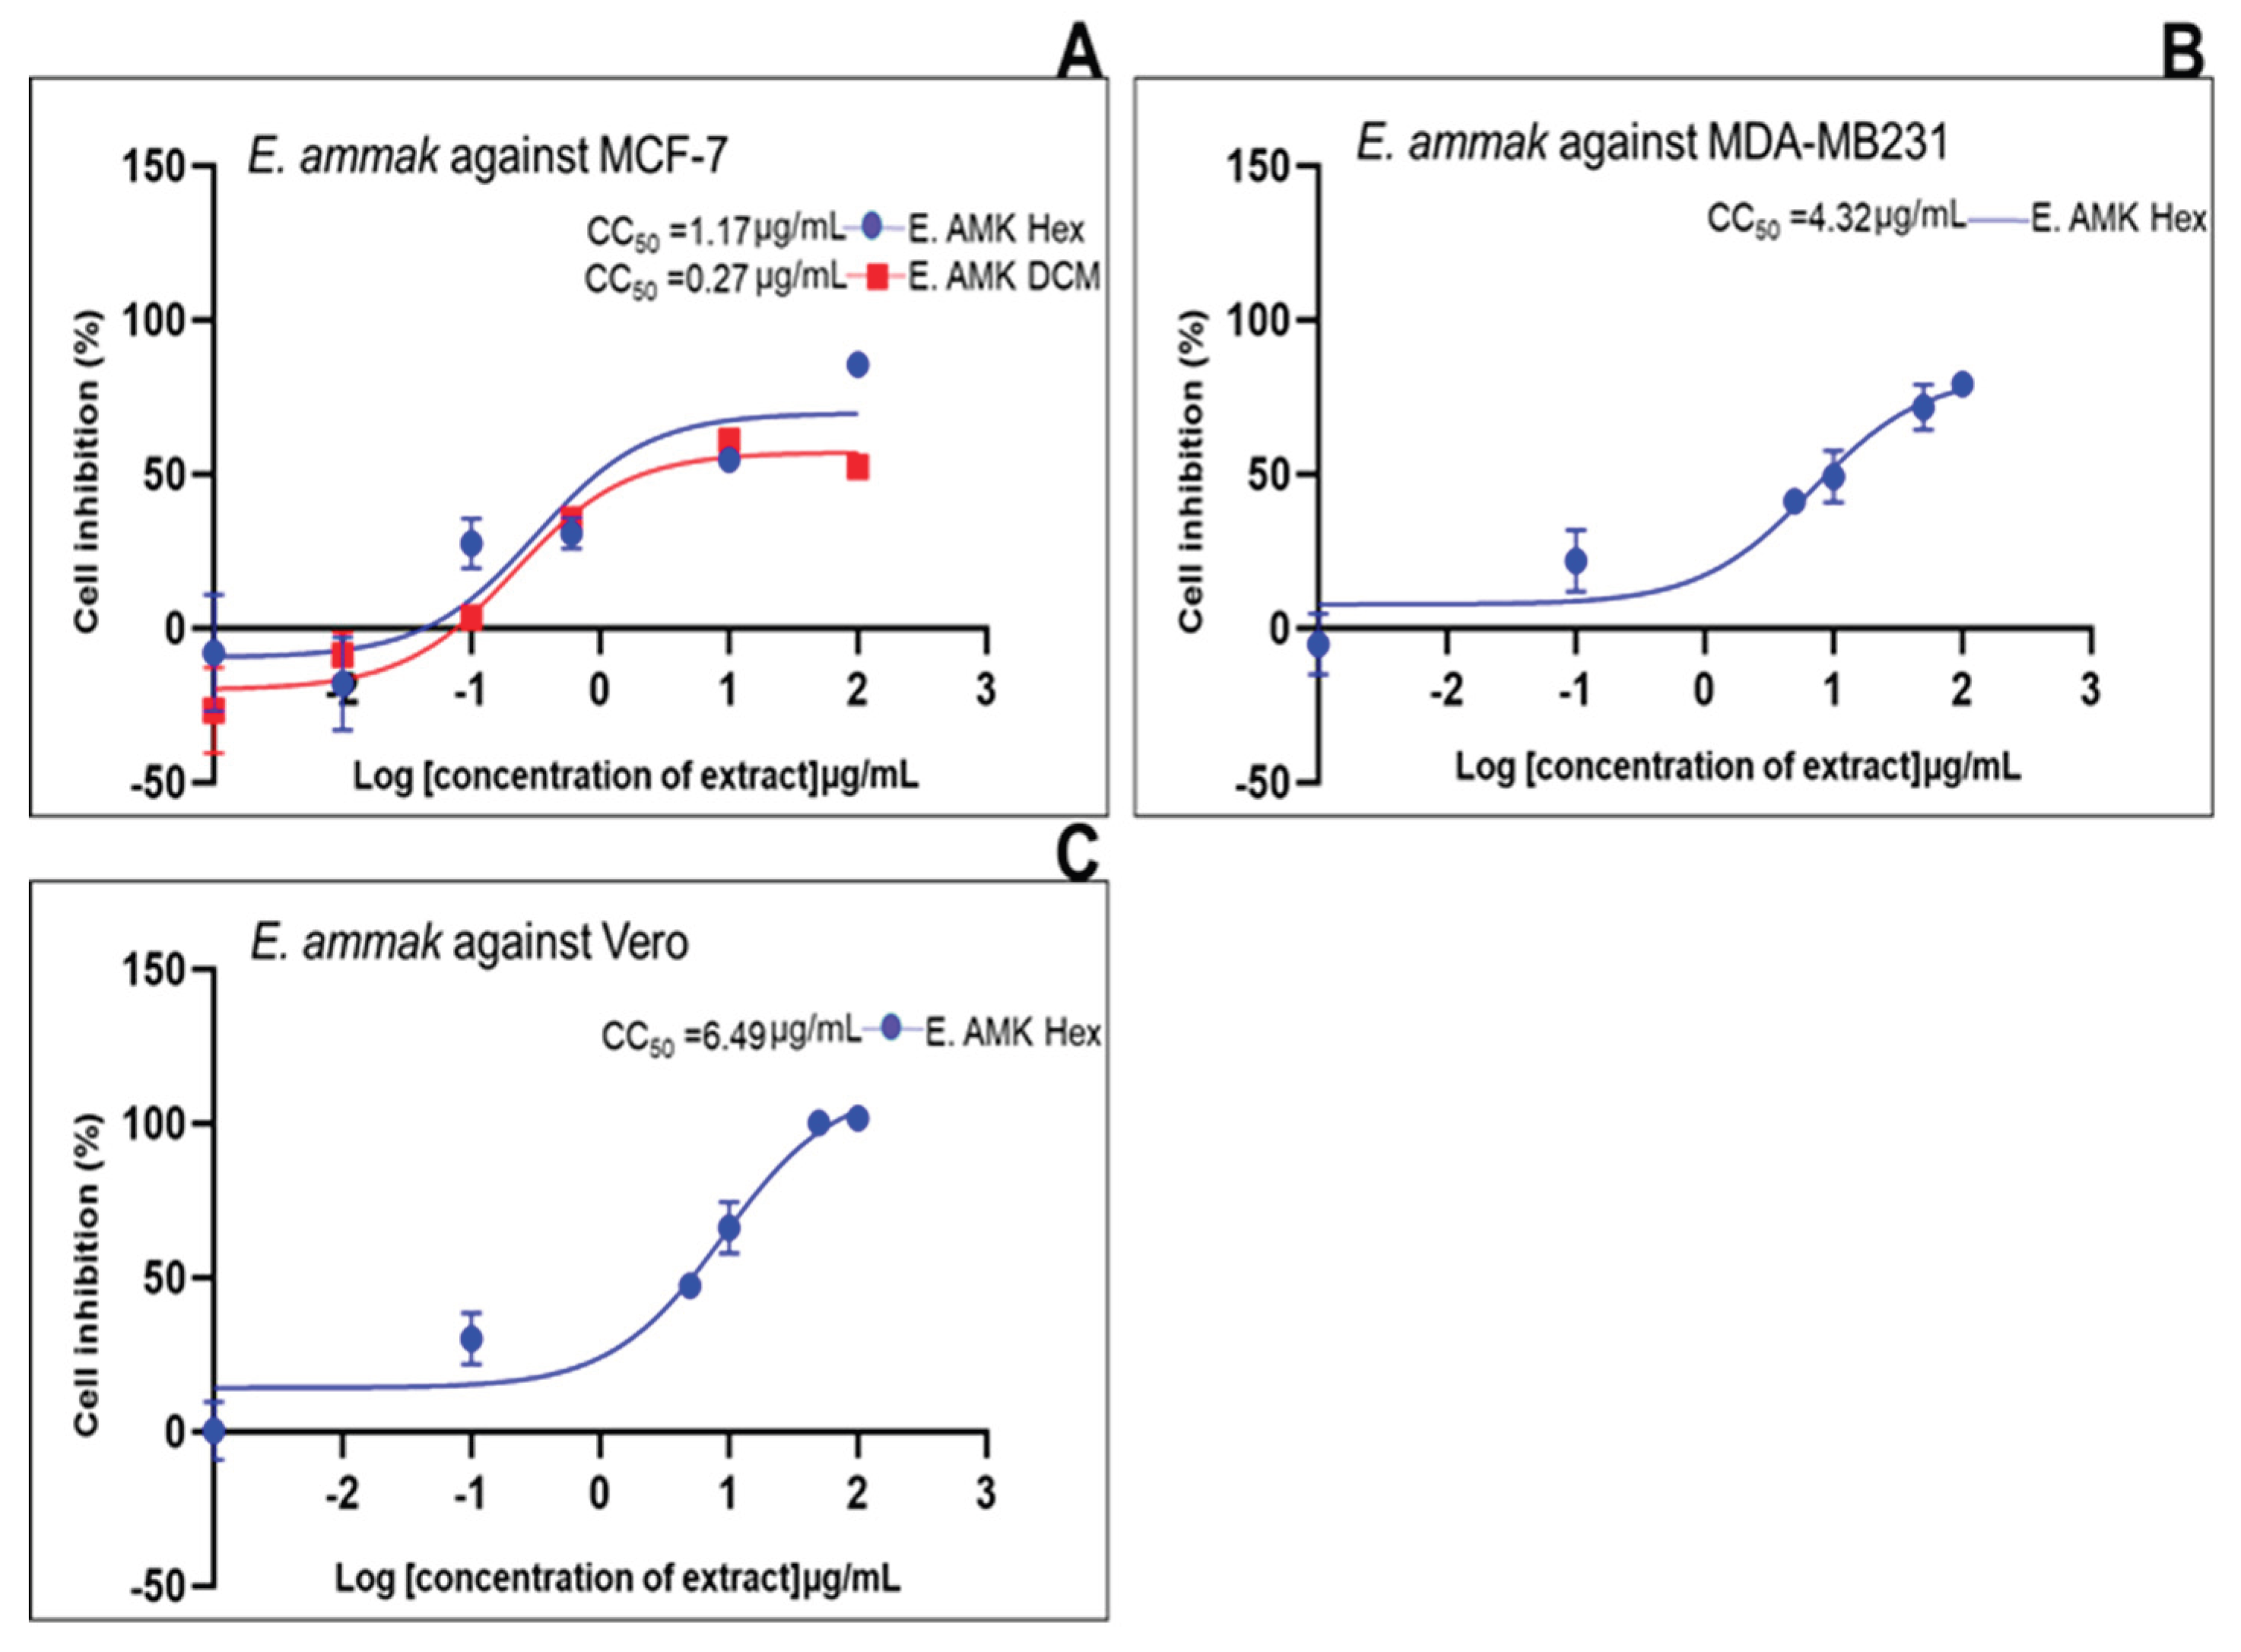
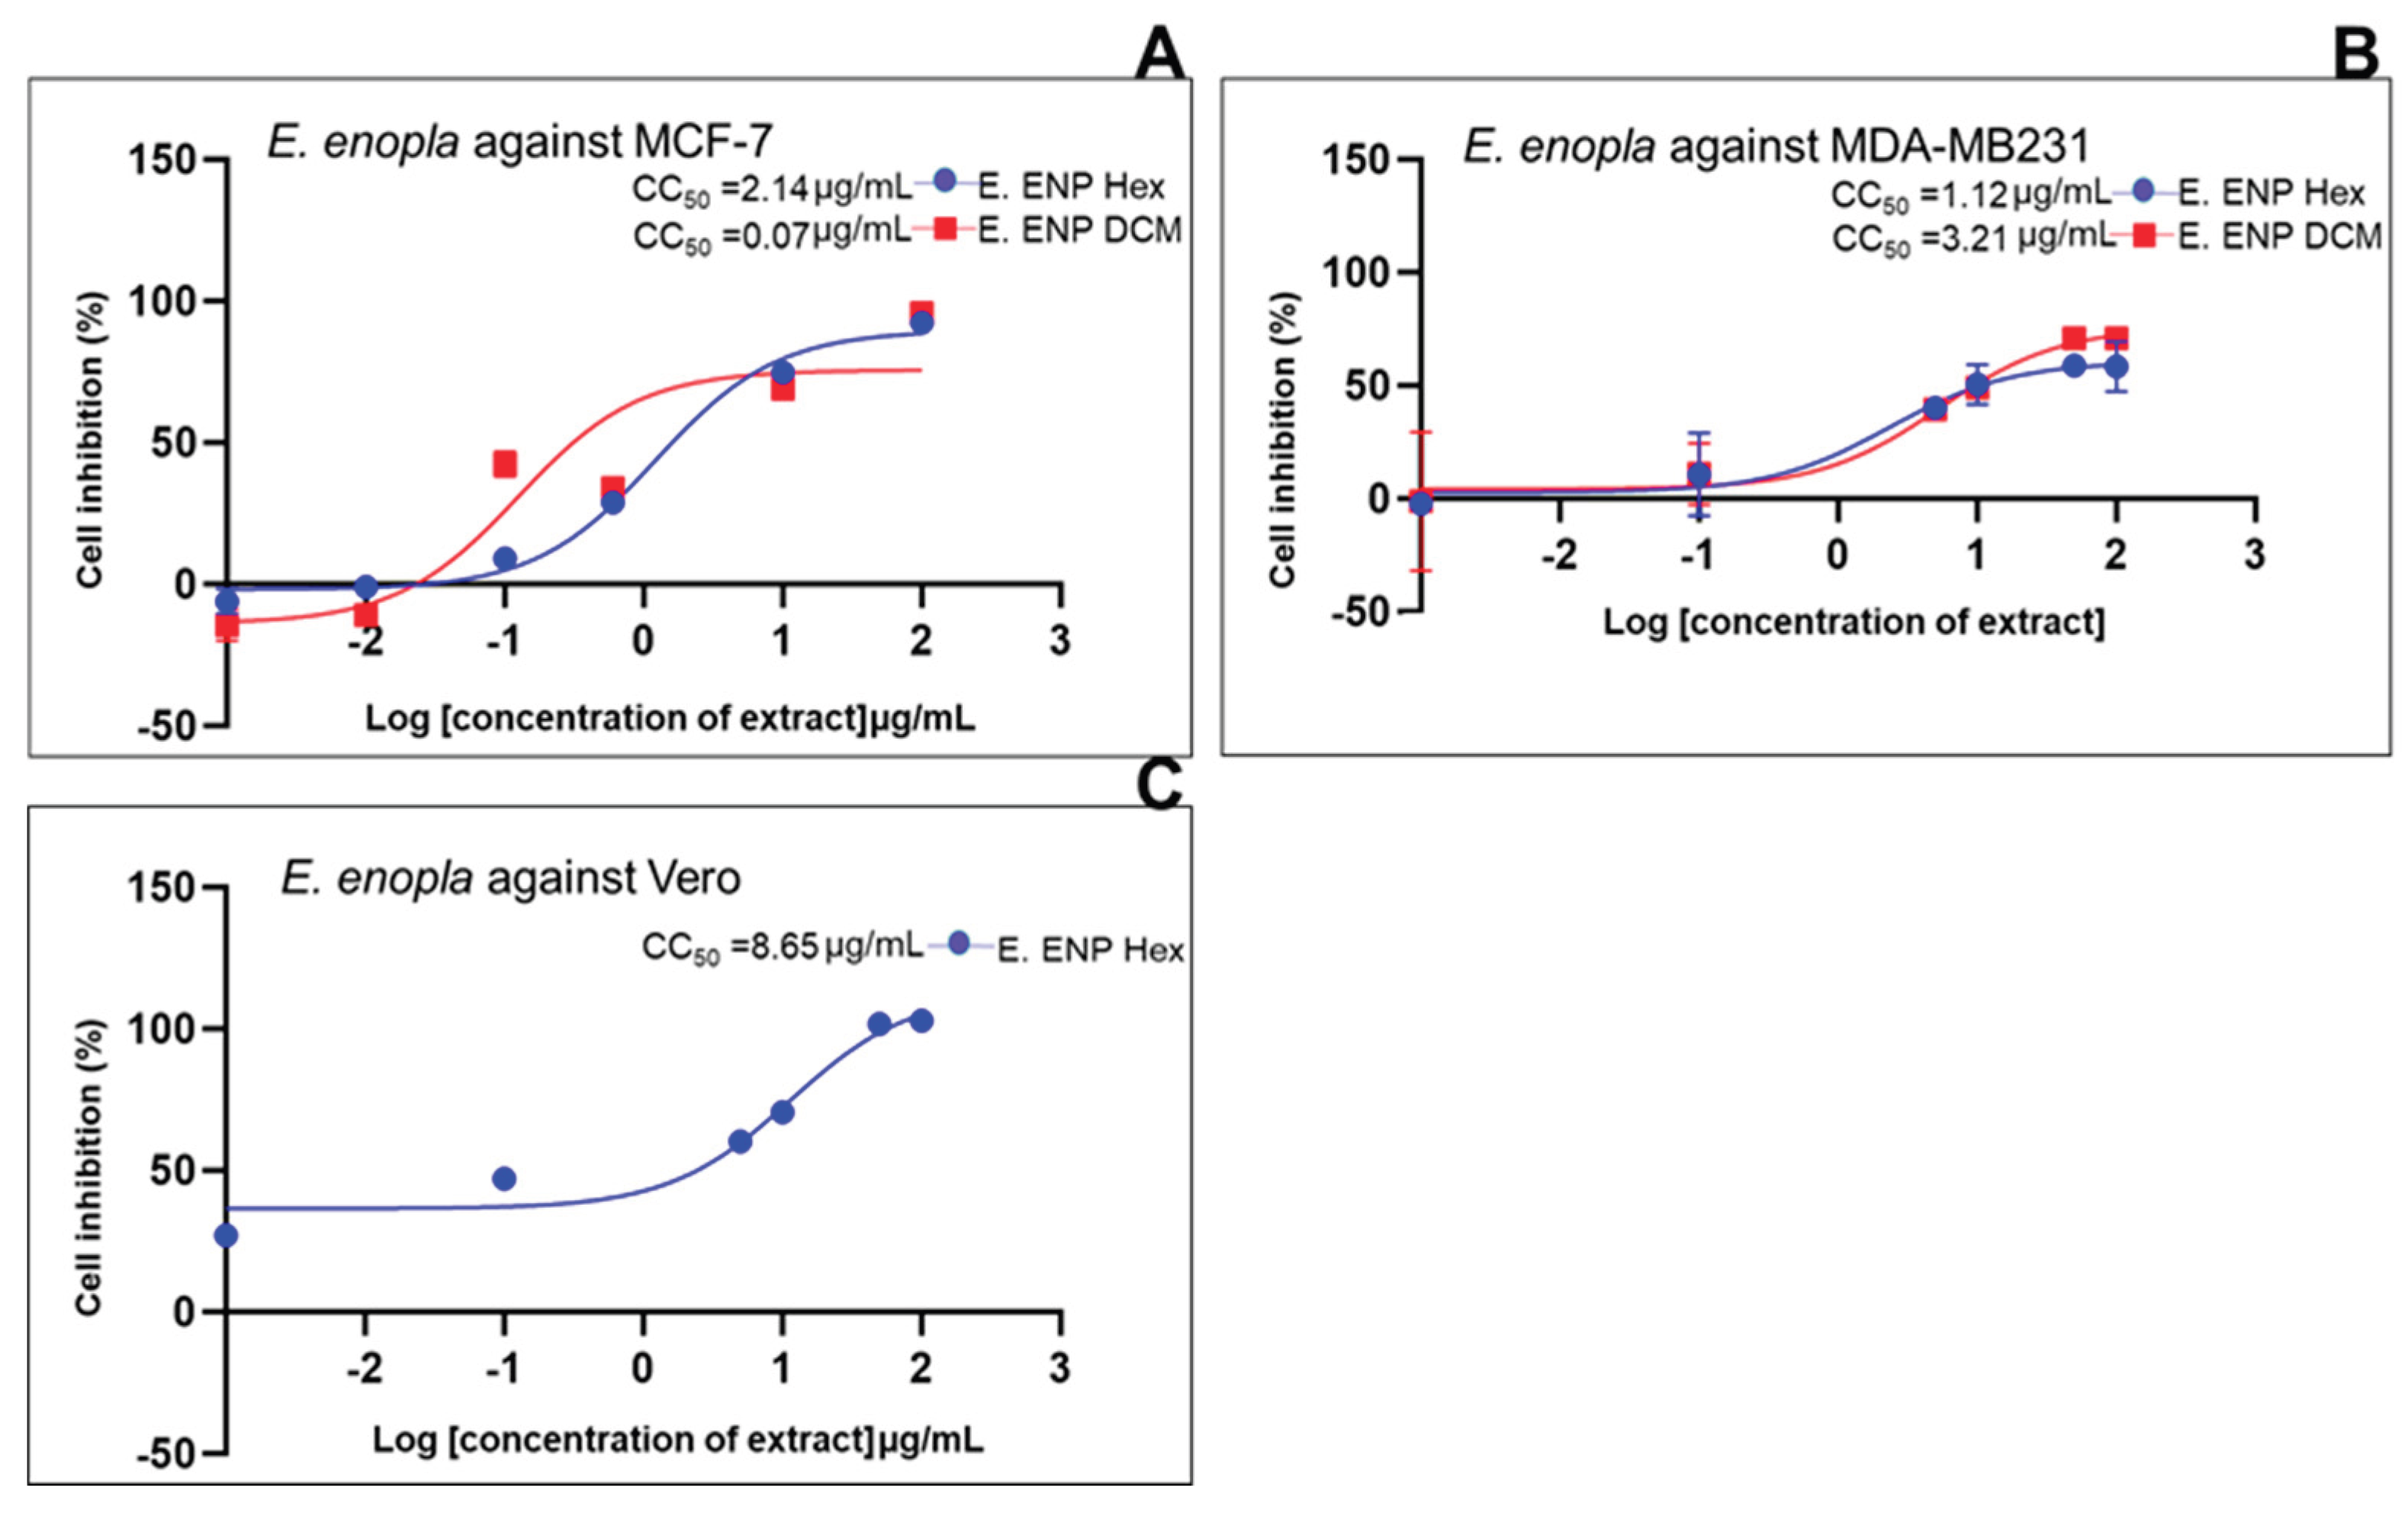
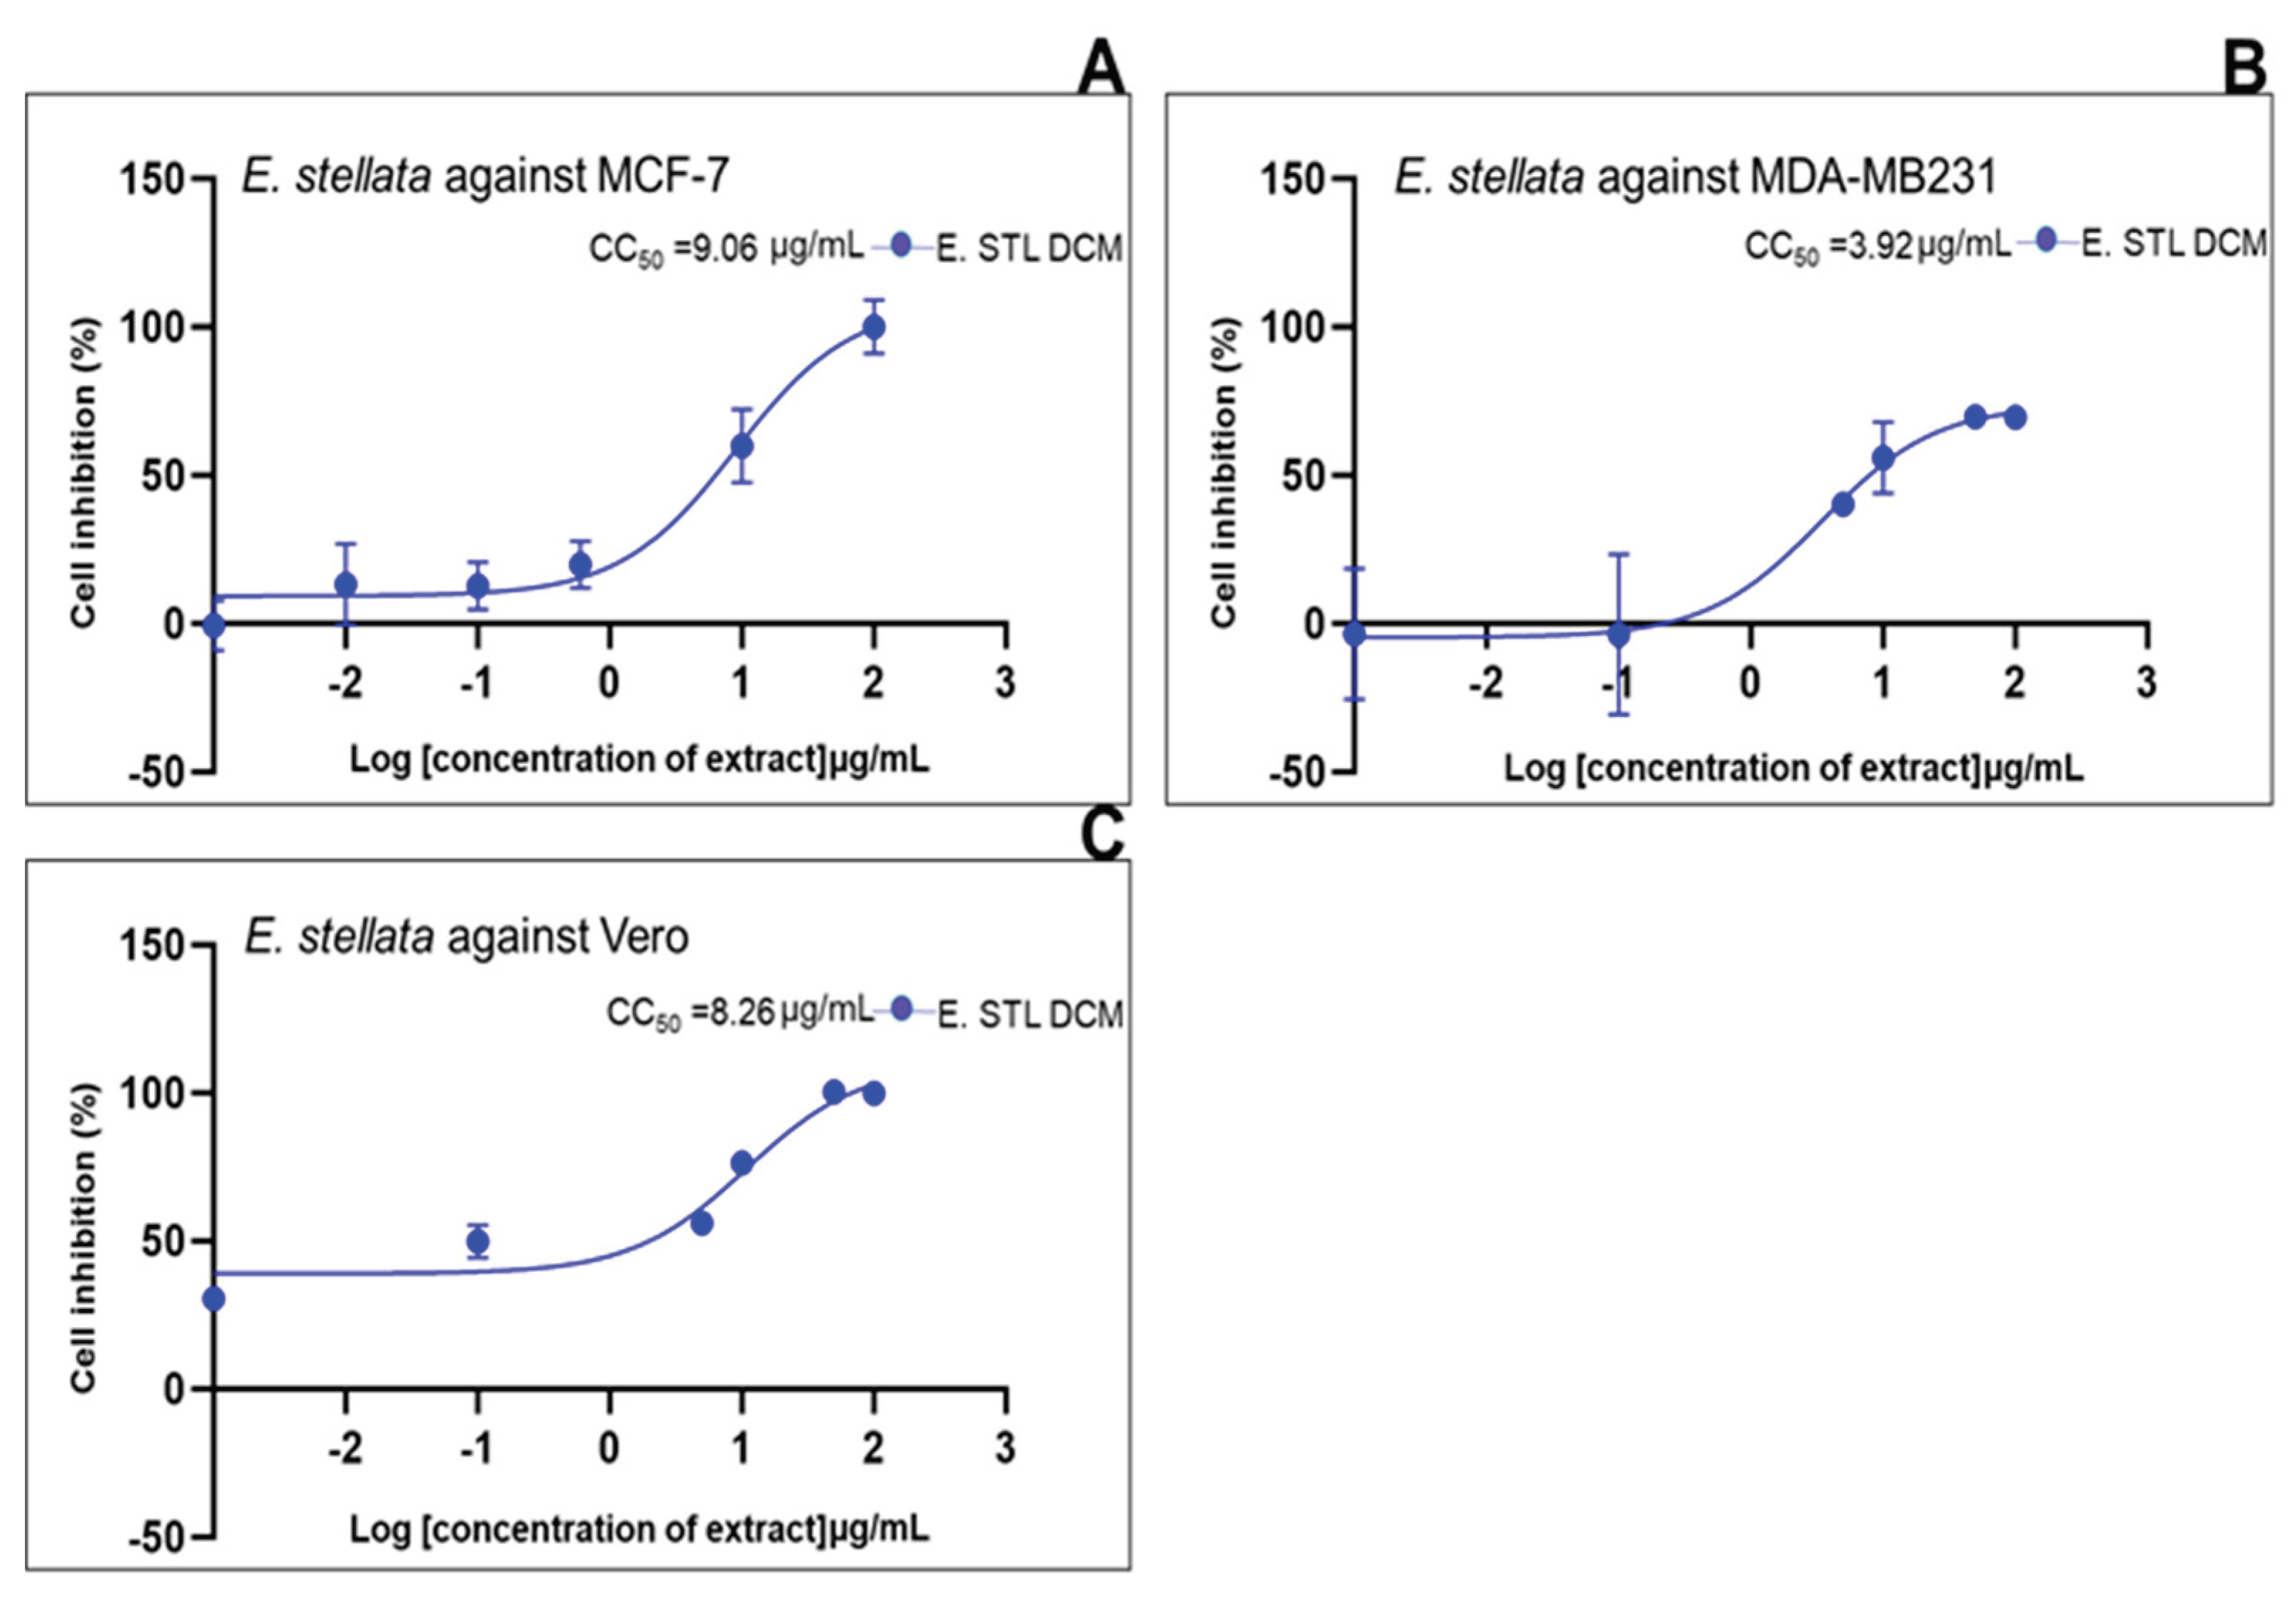
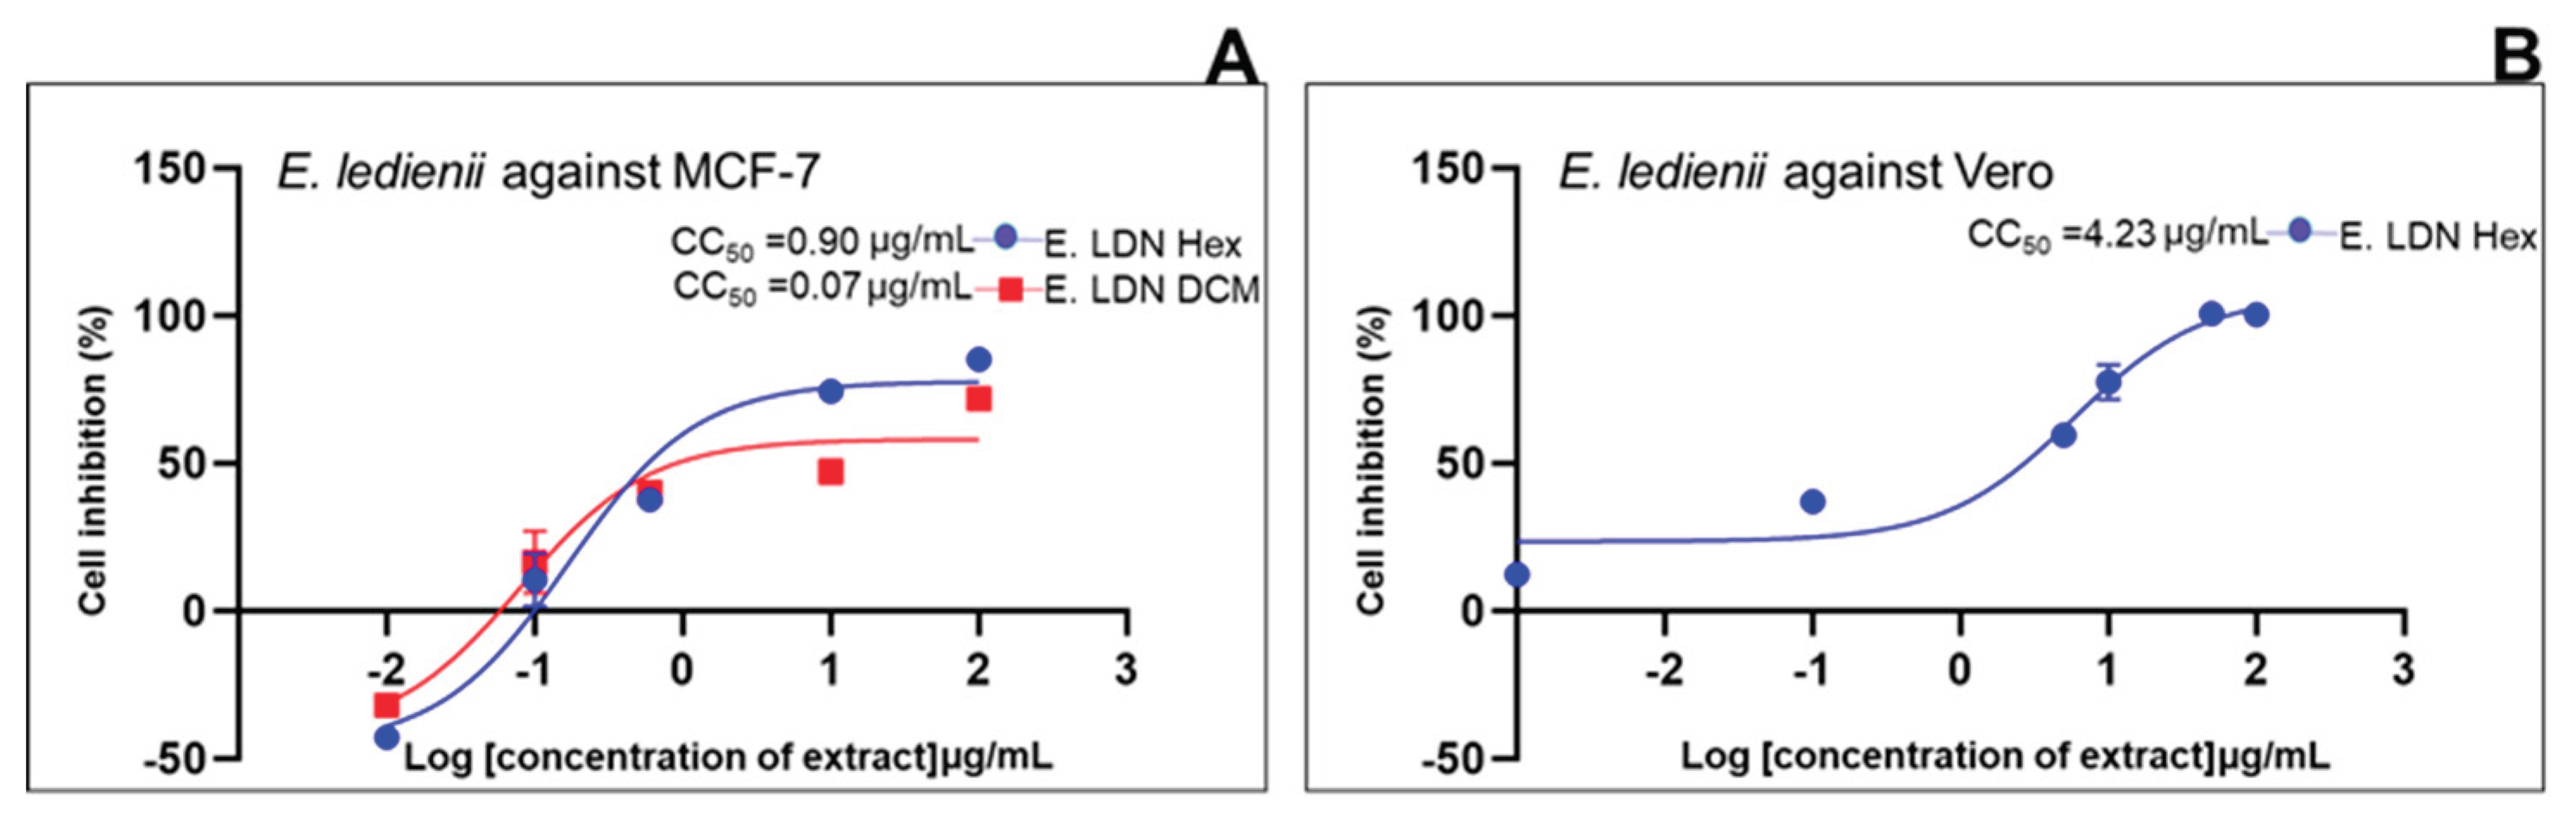
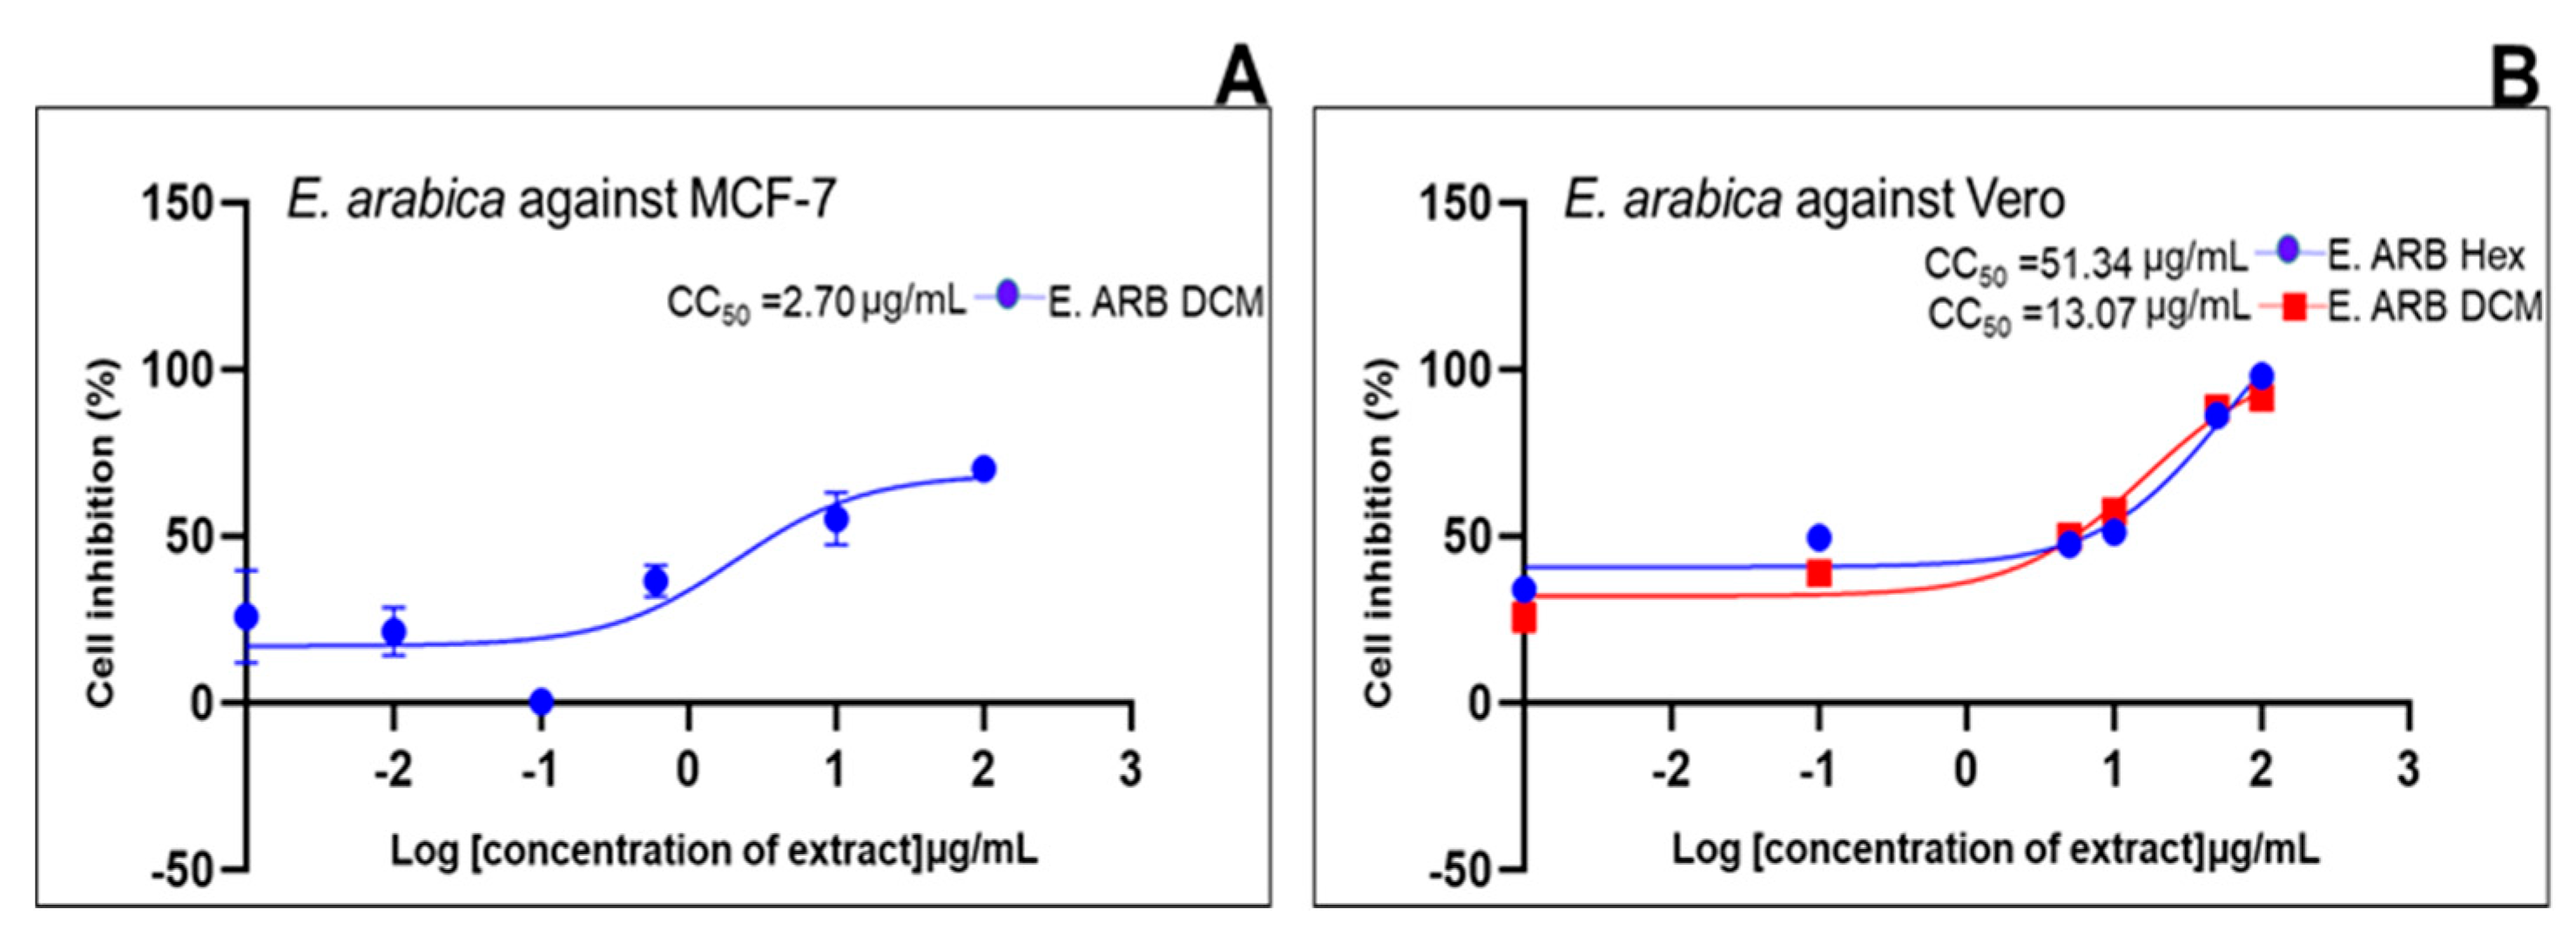
2.2. Cell Growth Inhibition
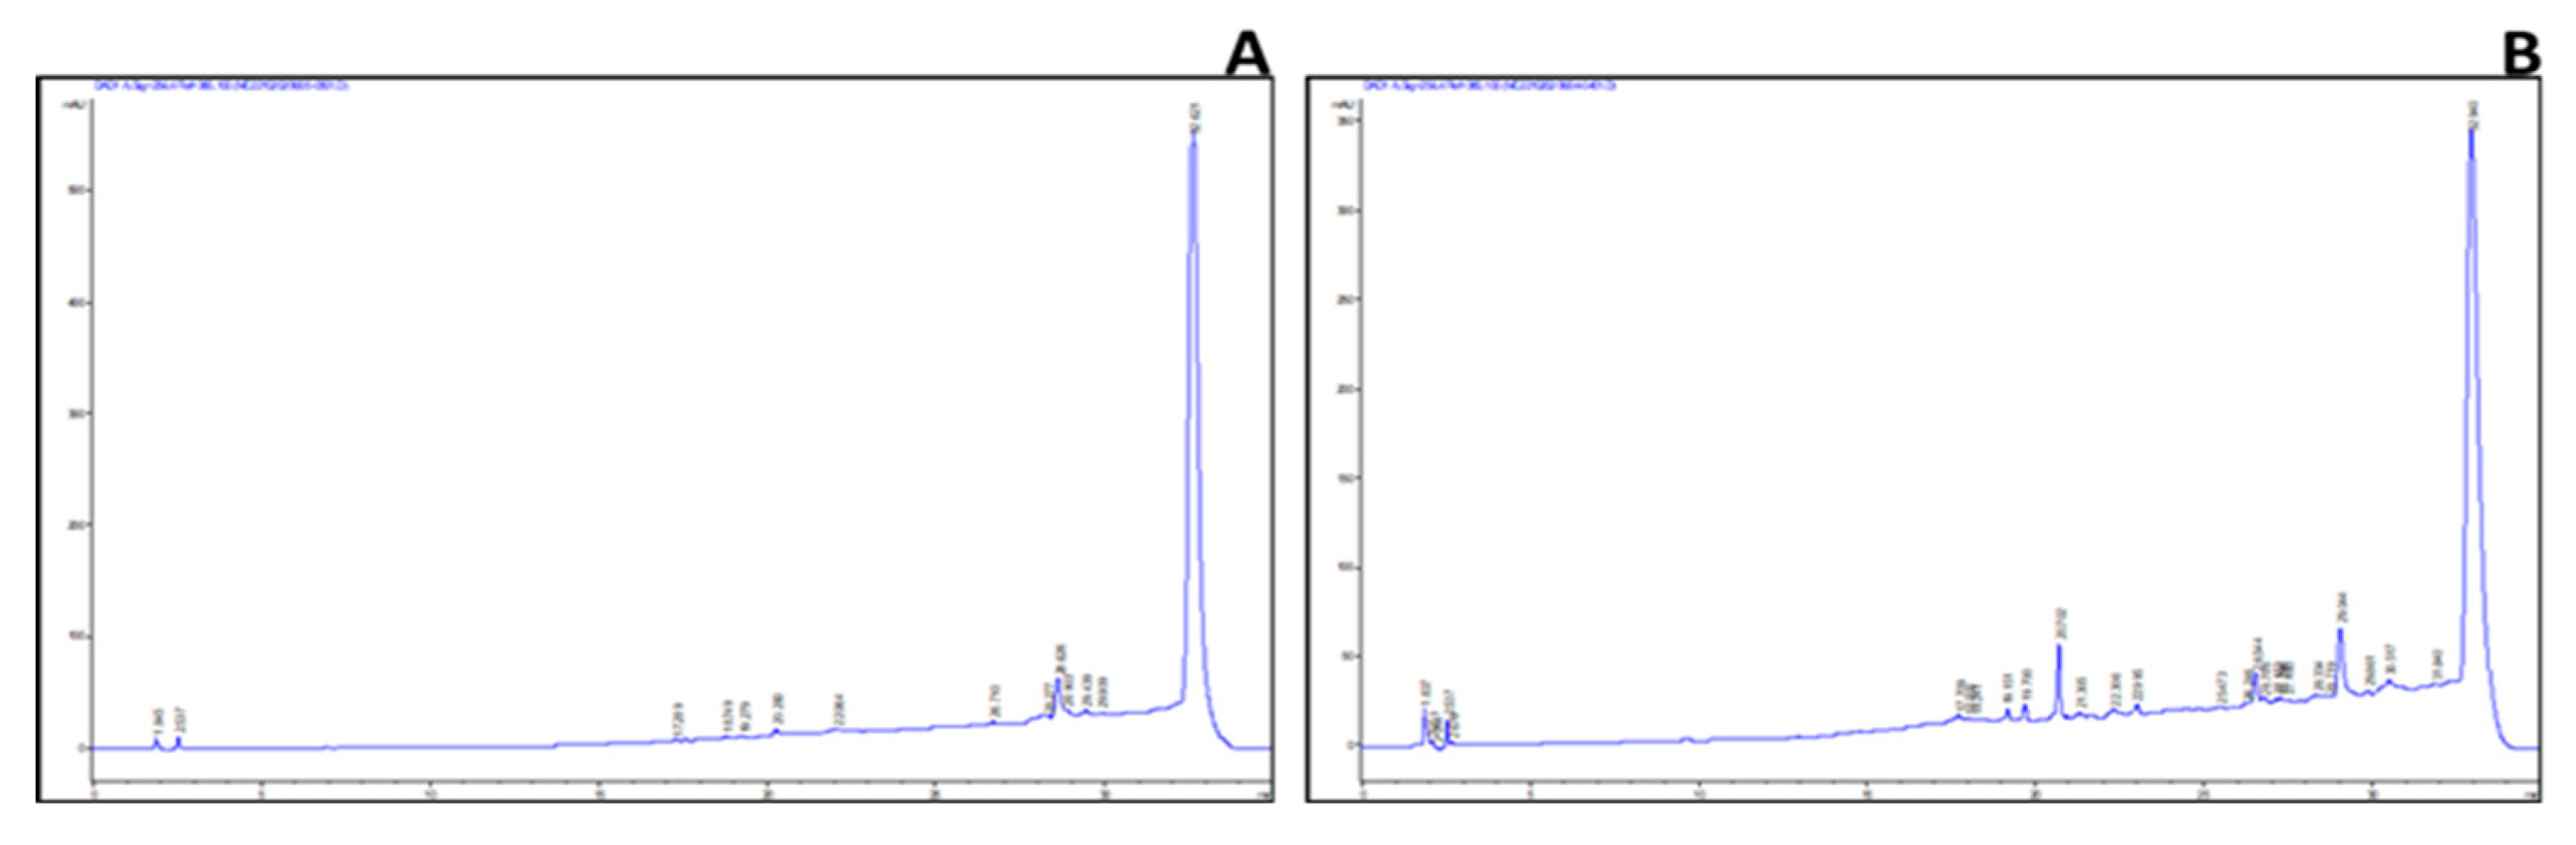
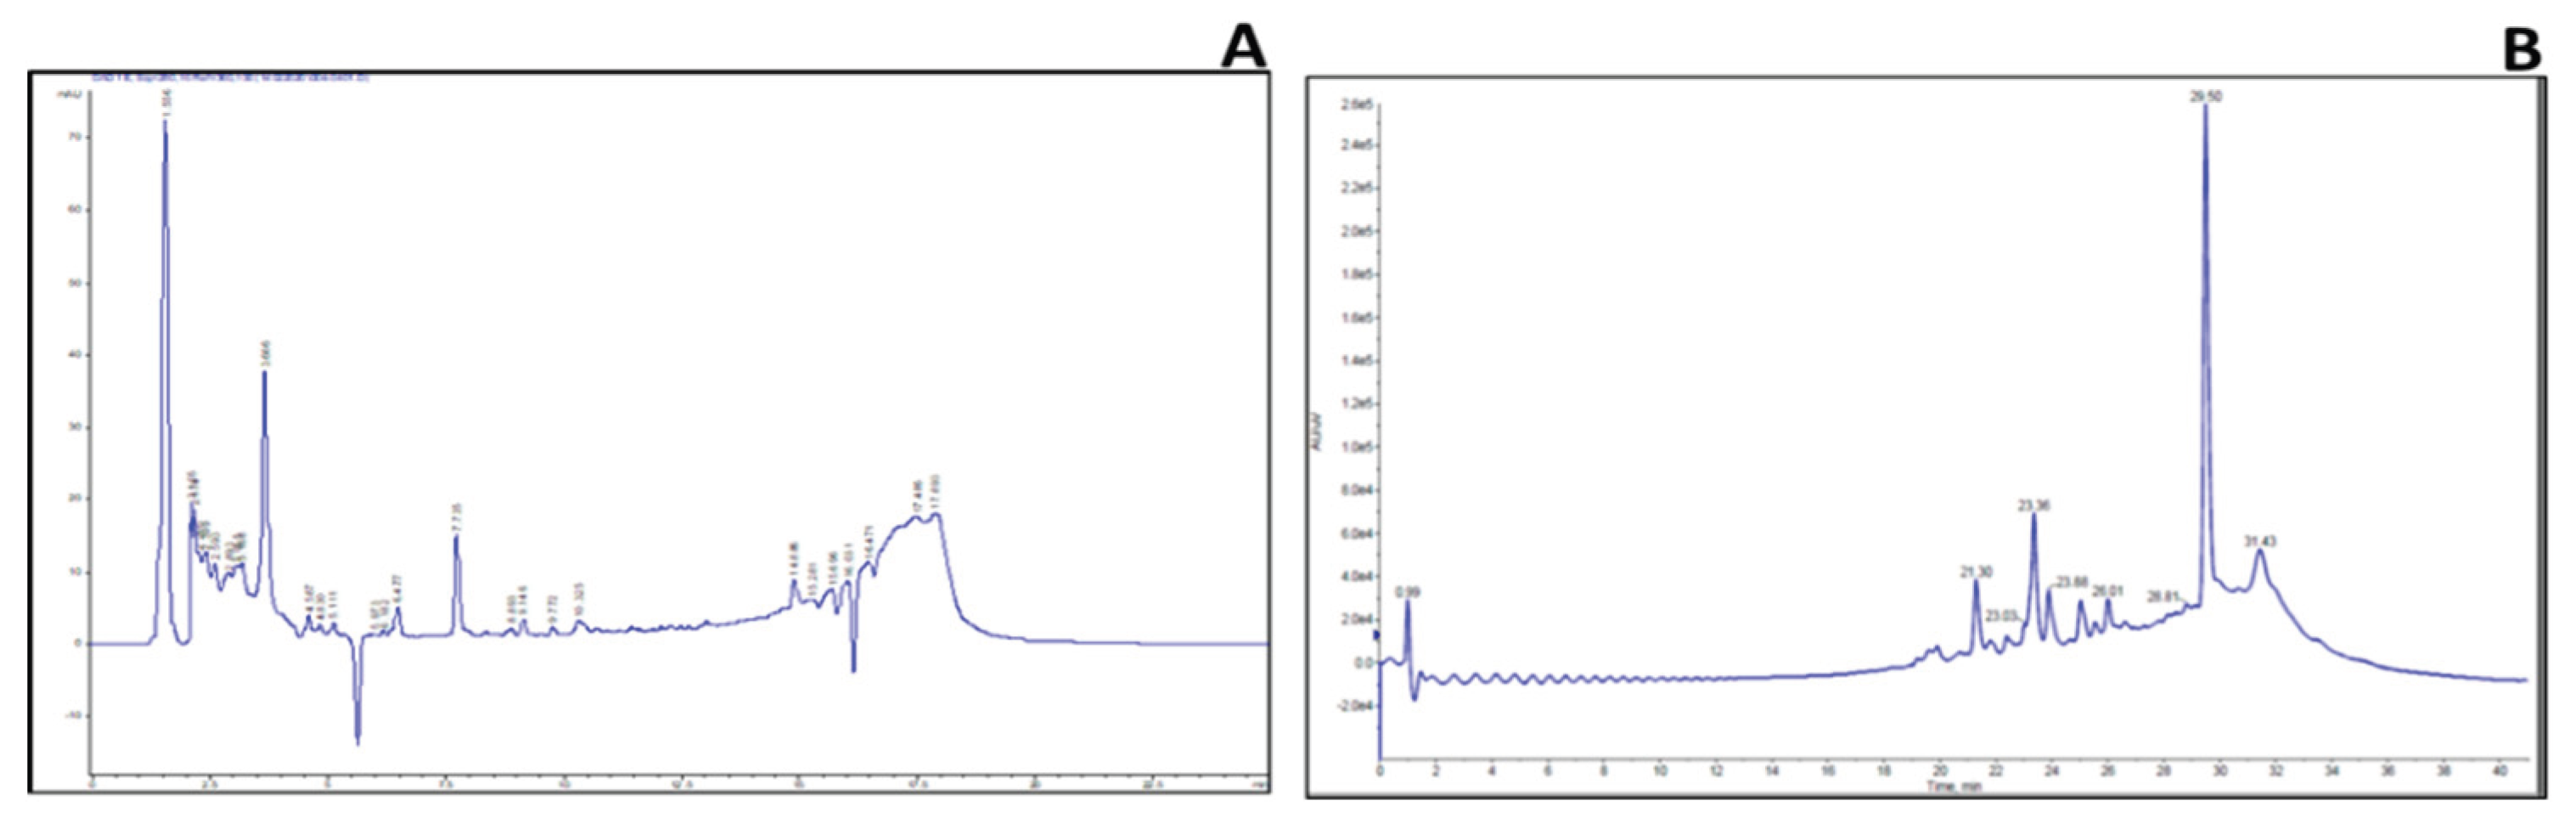
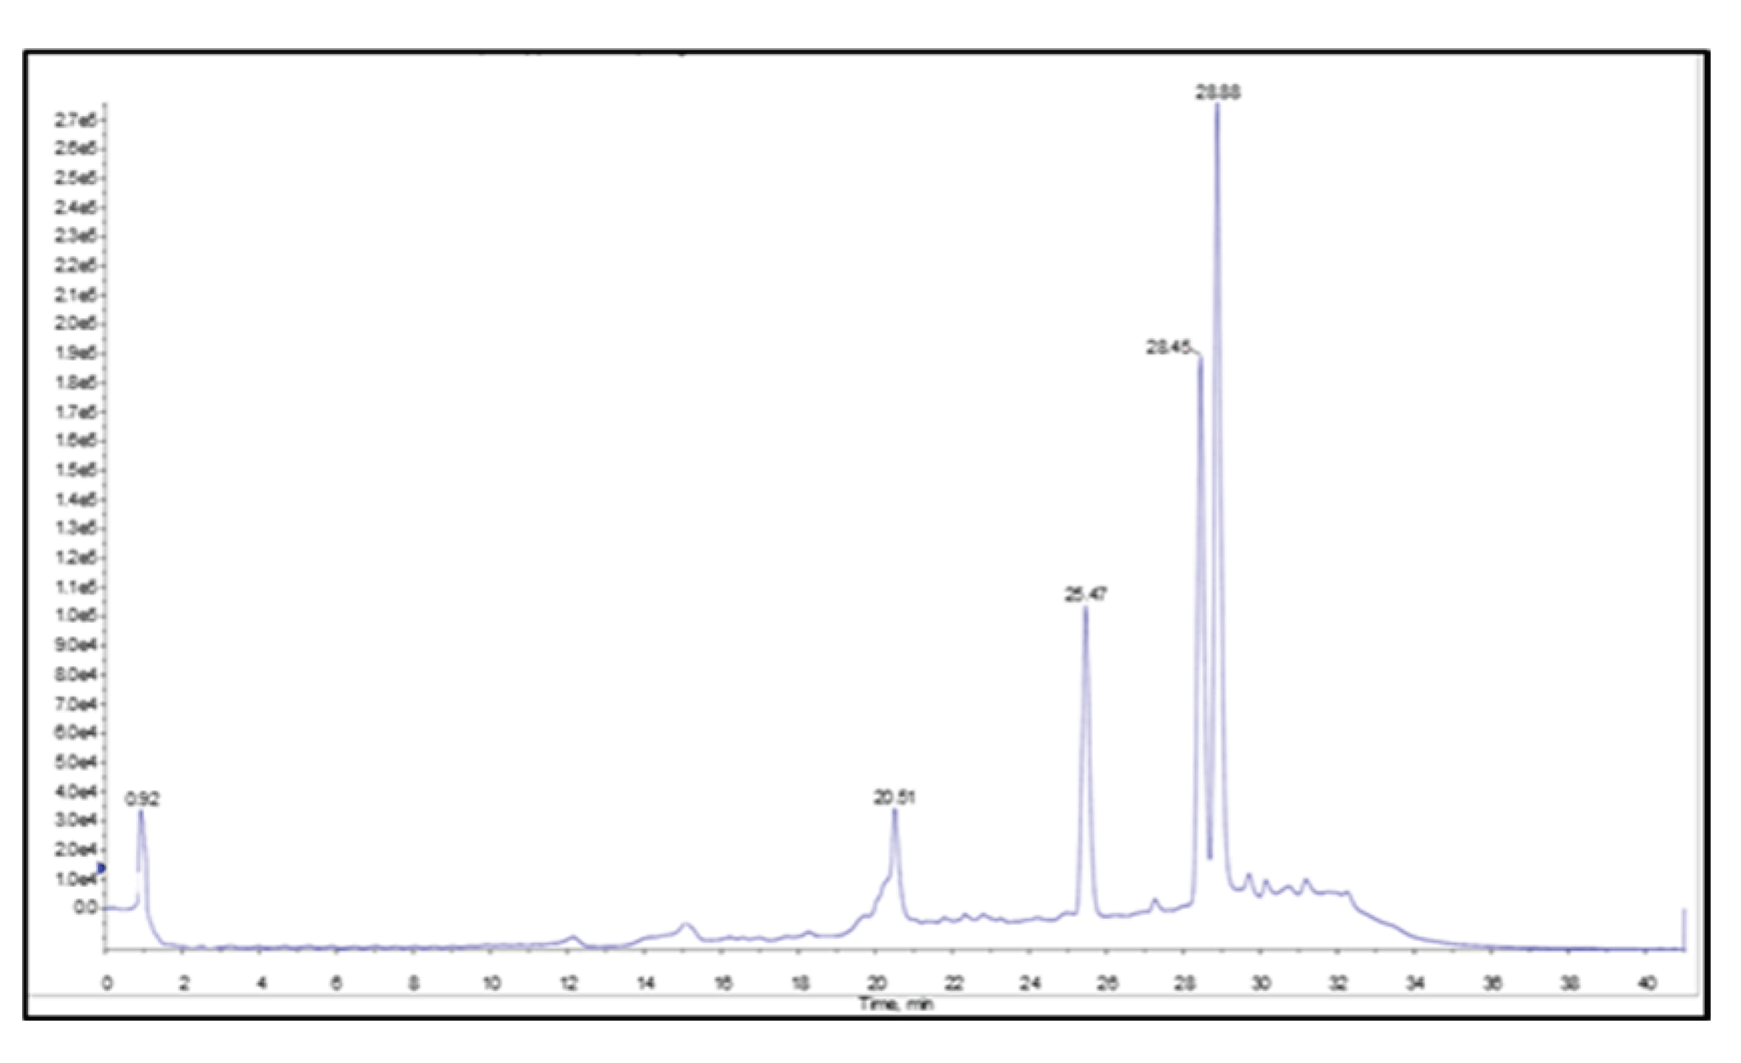
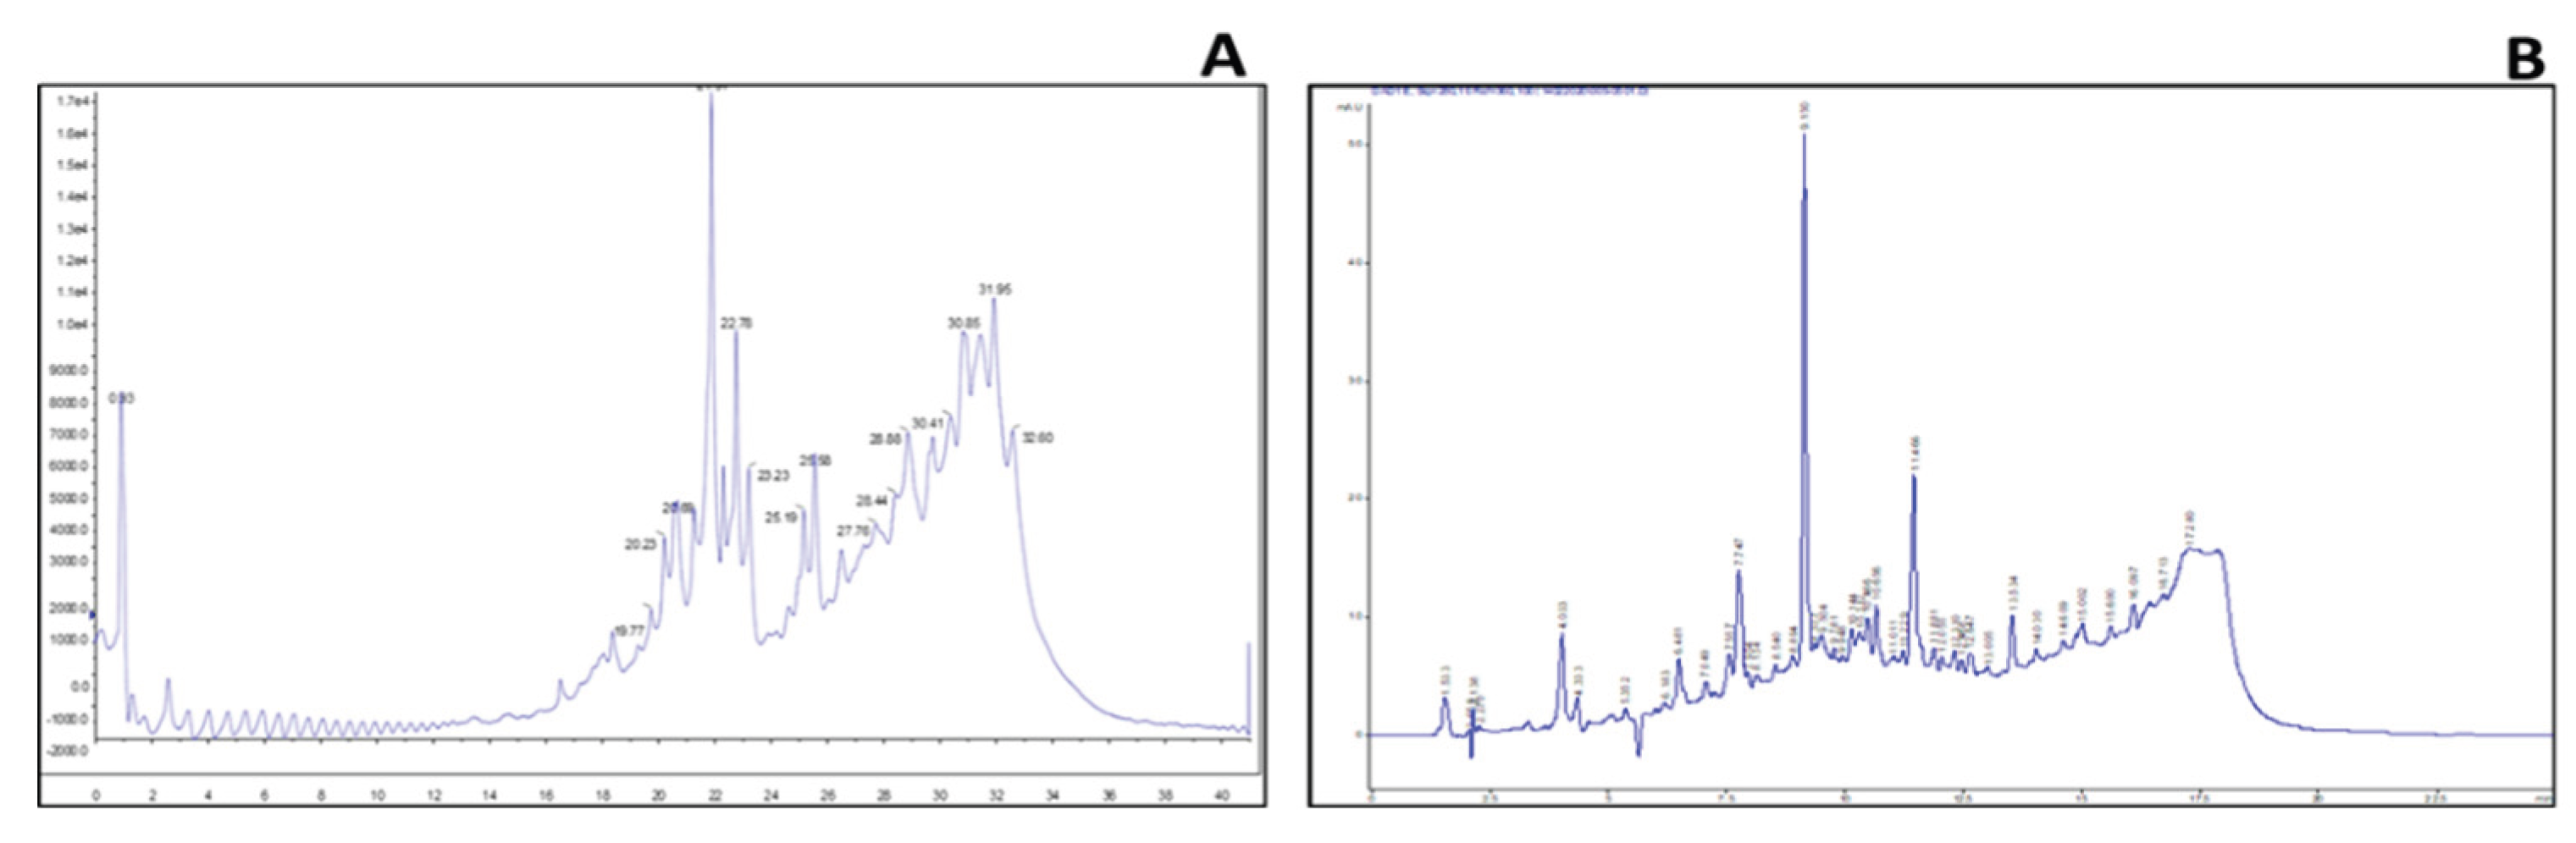
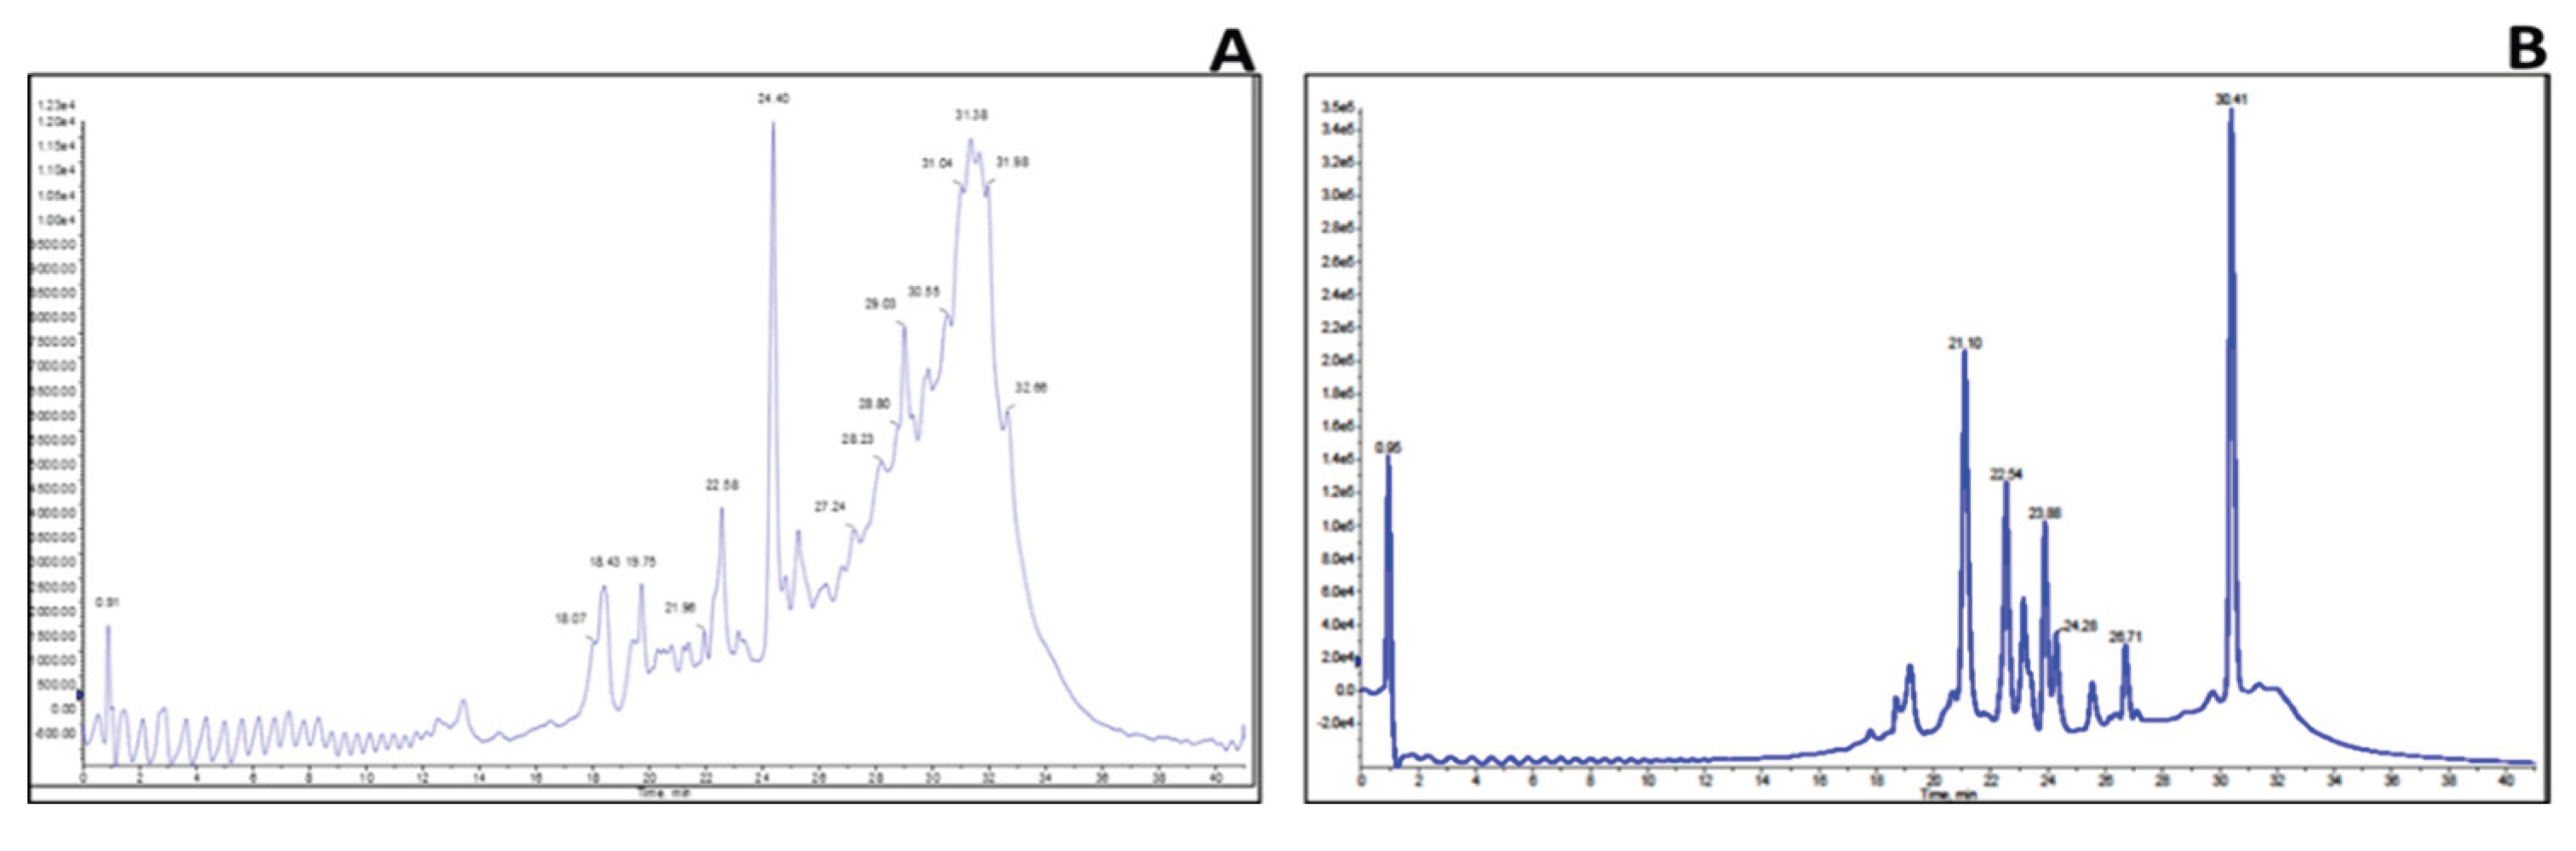
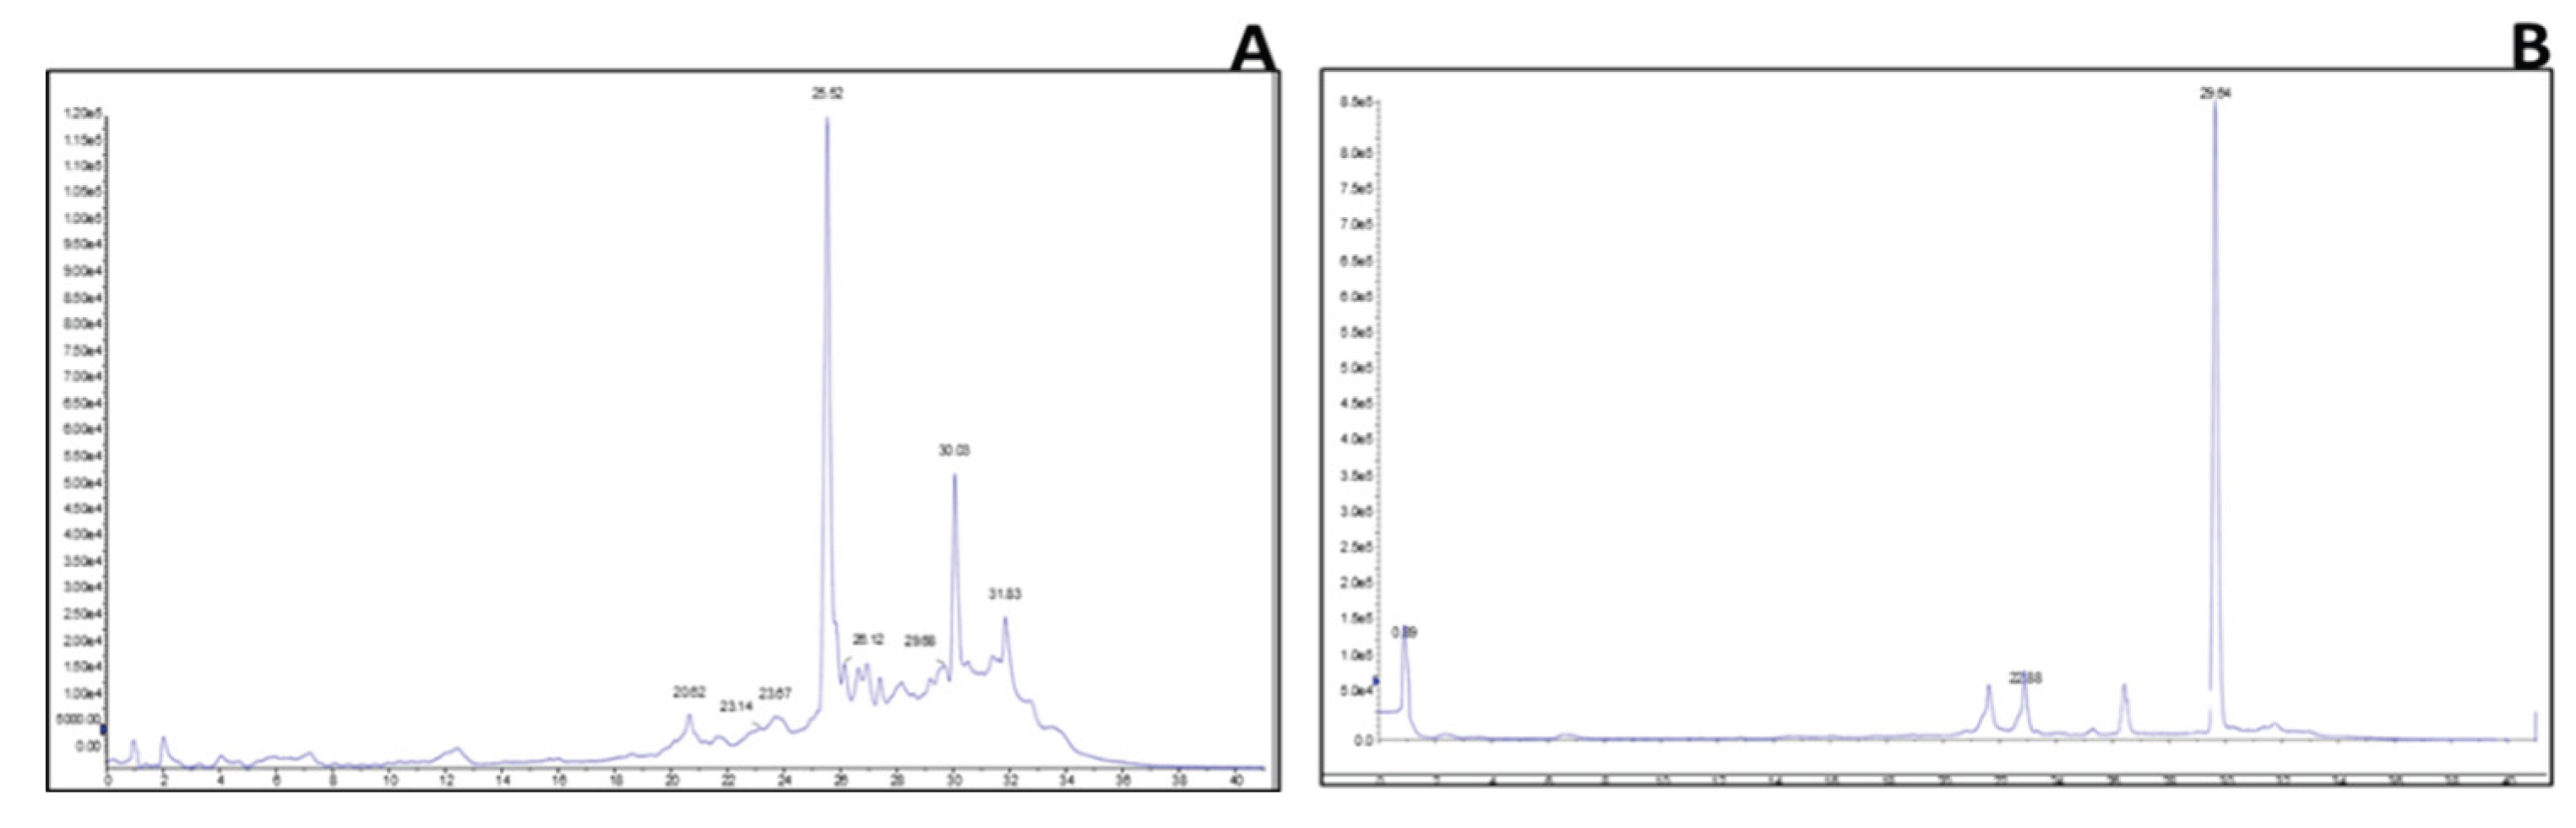
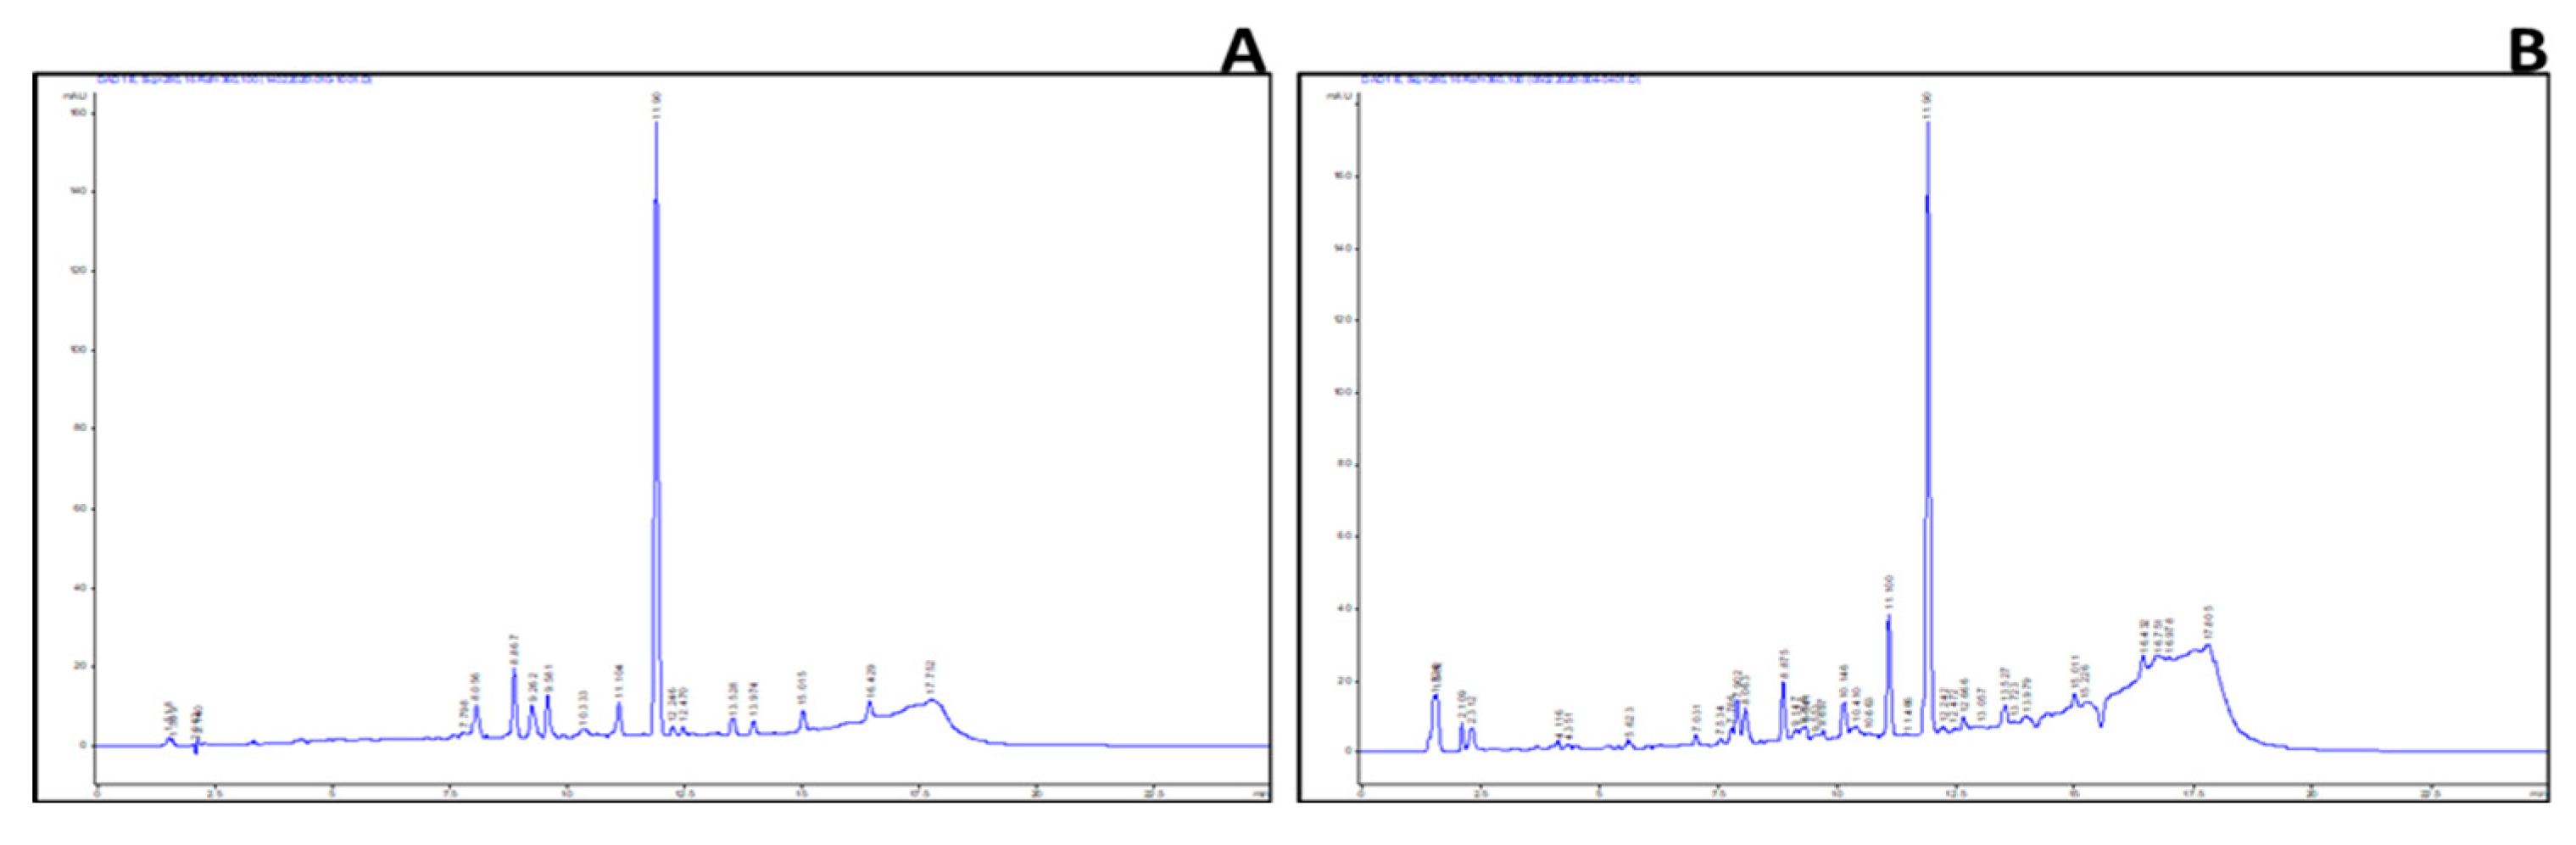
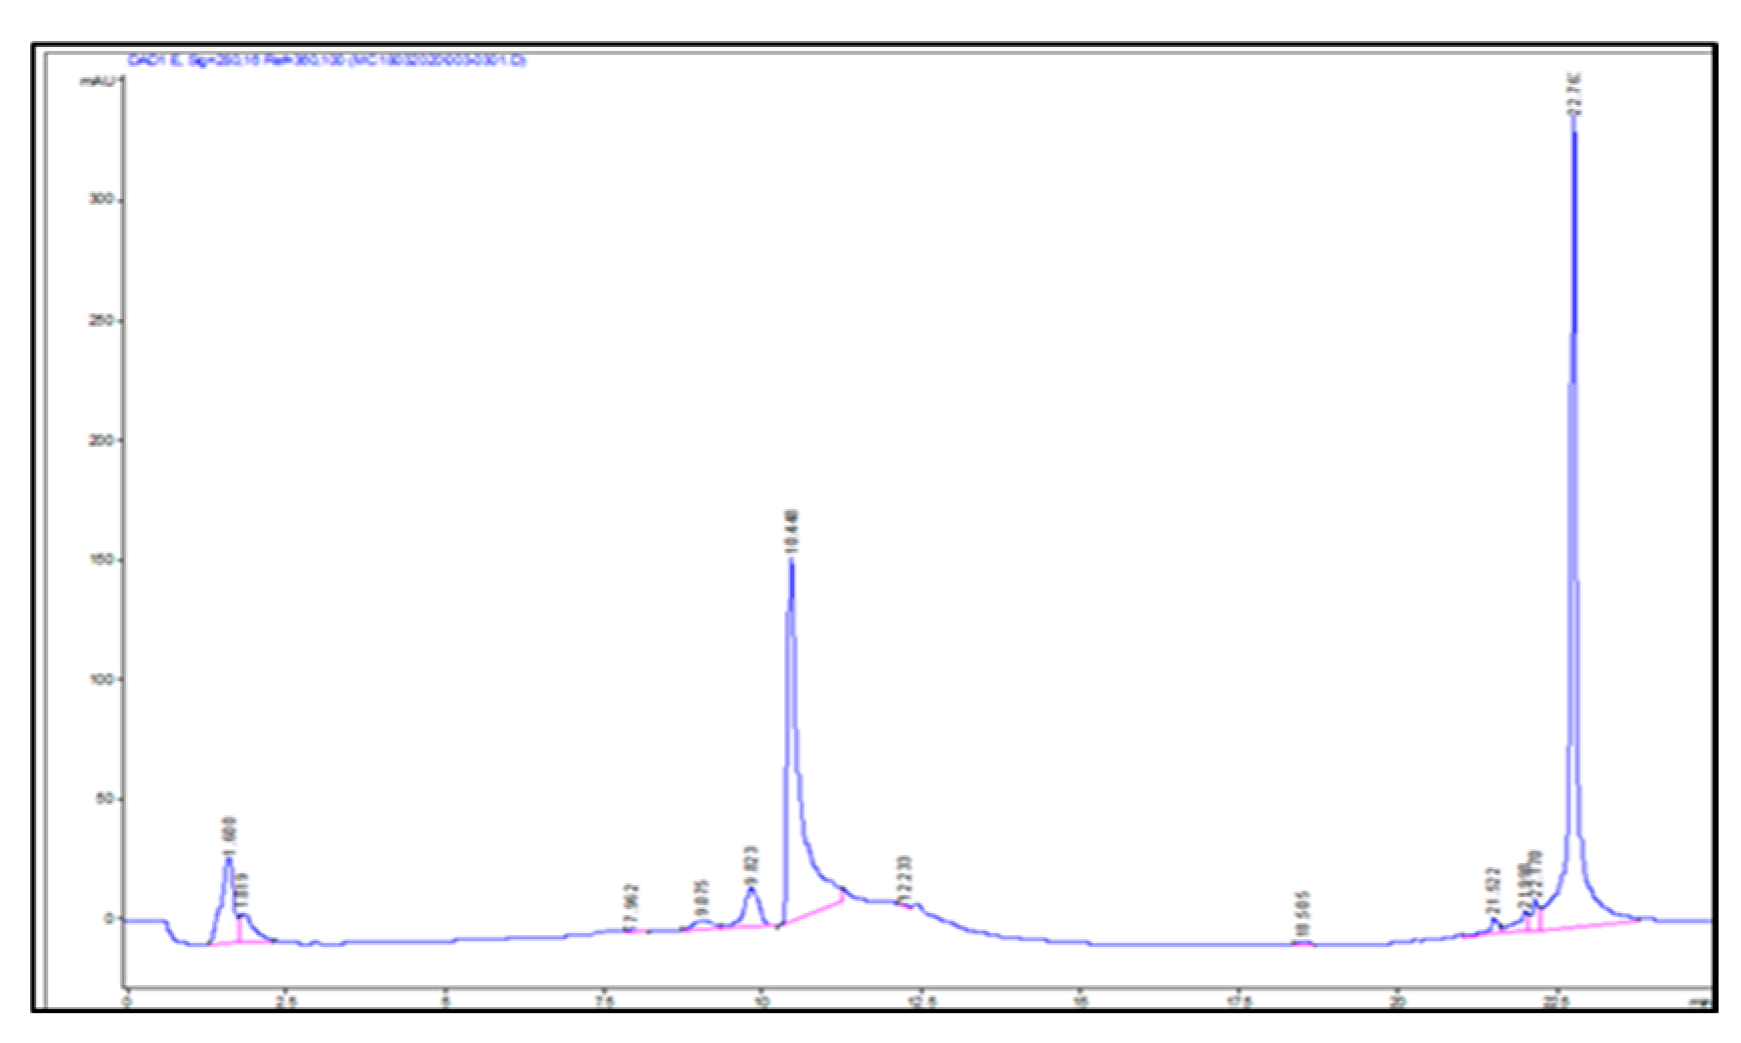
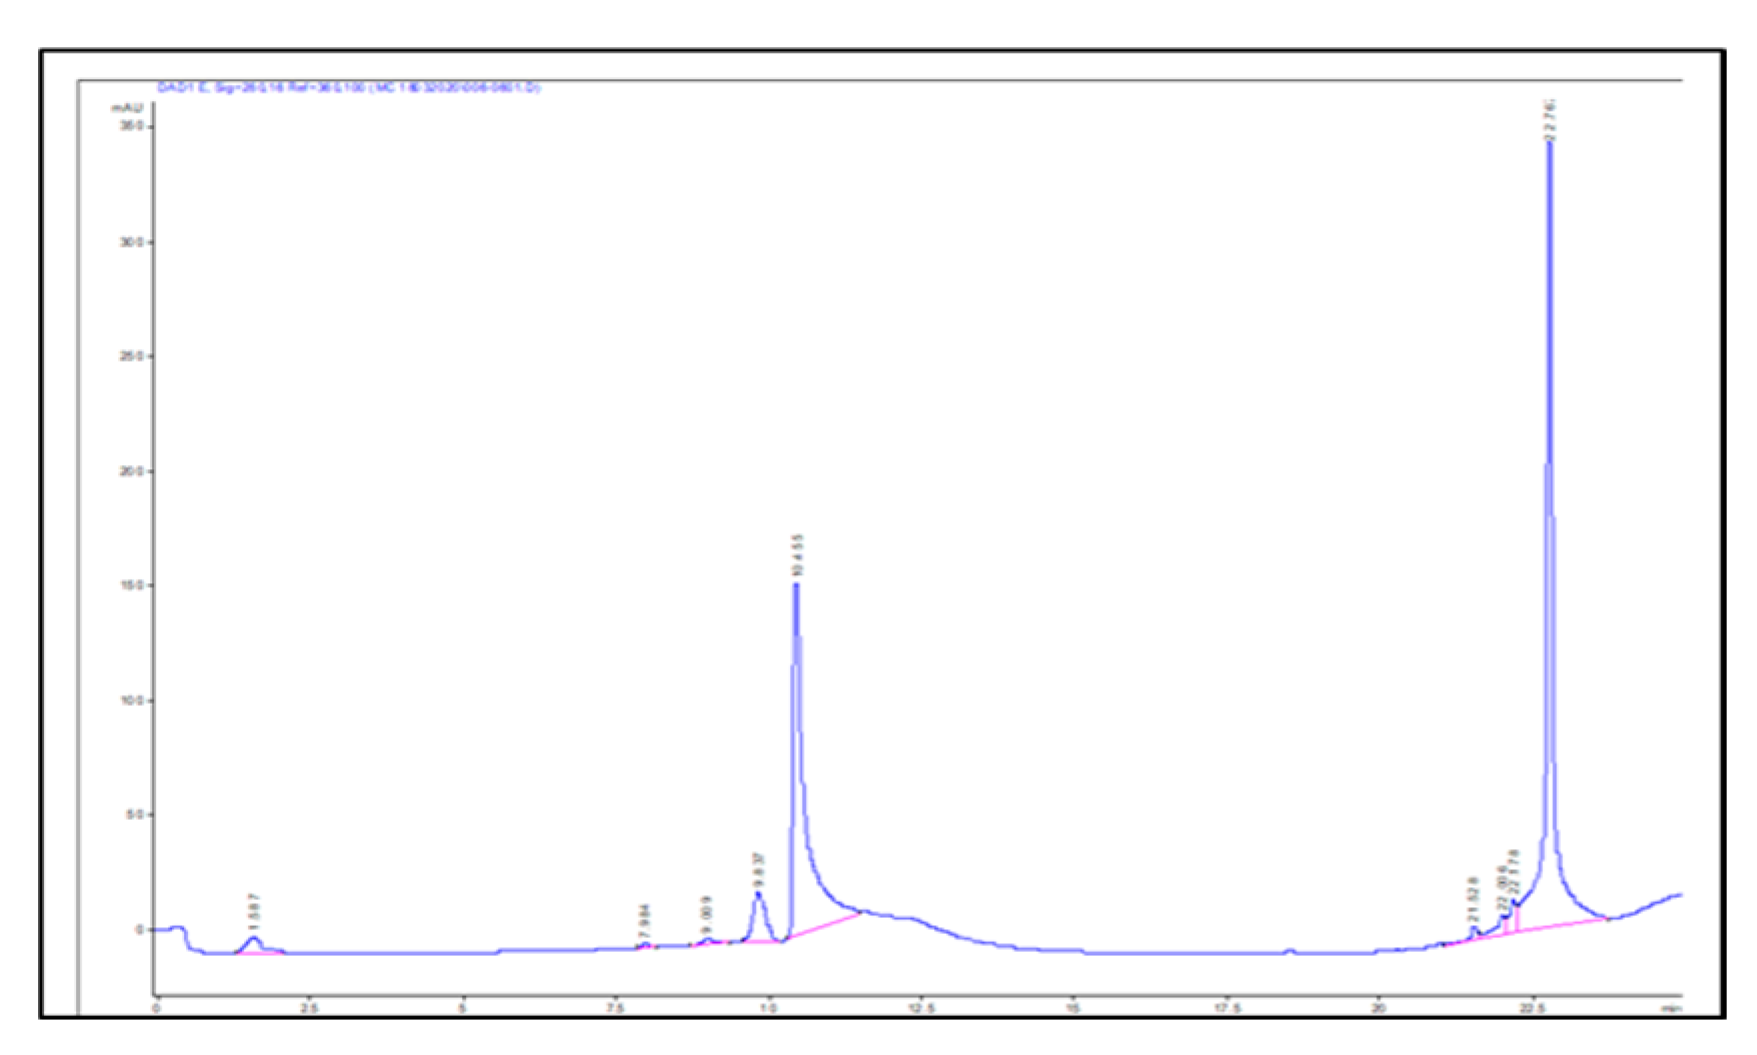
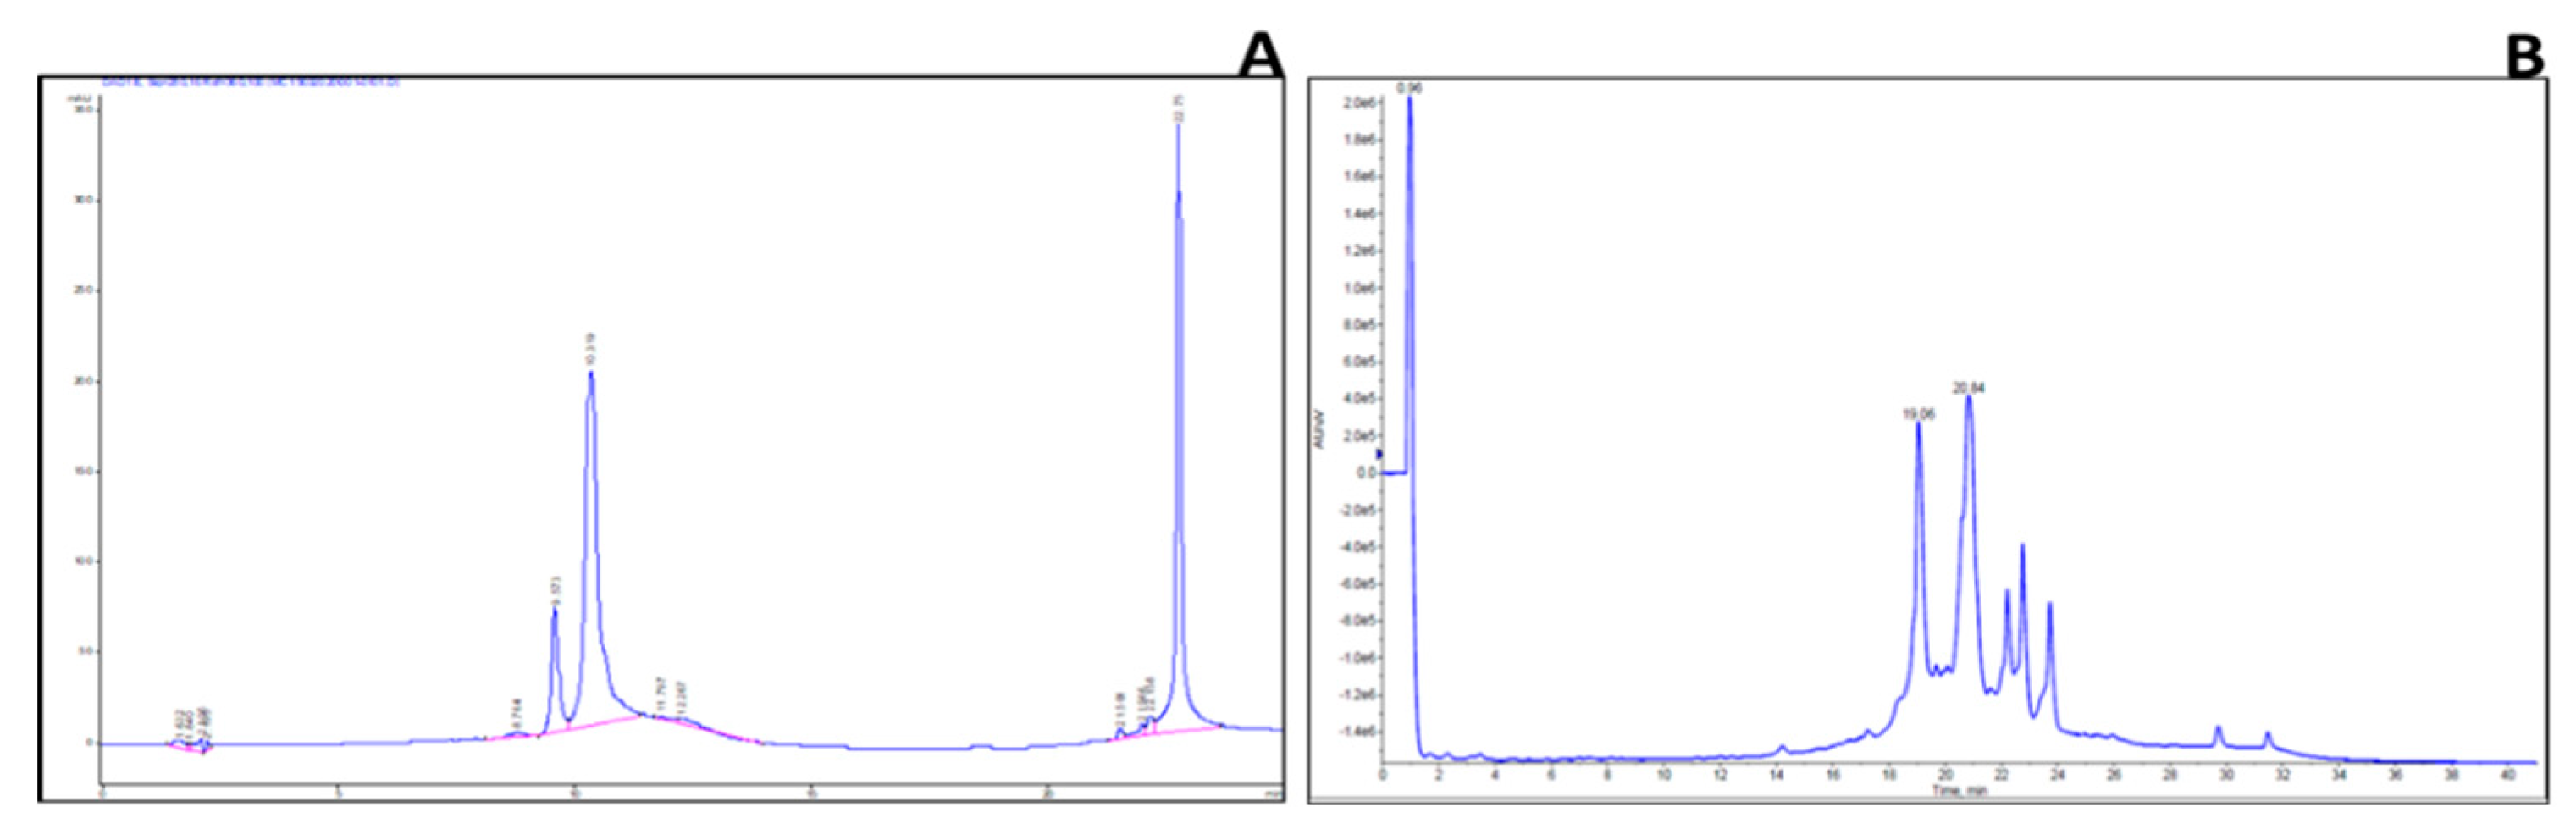
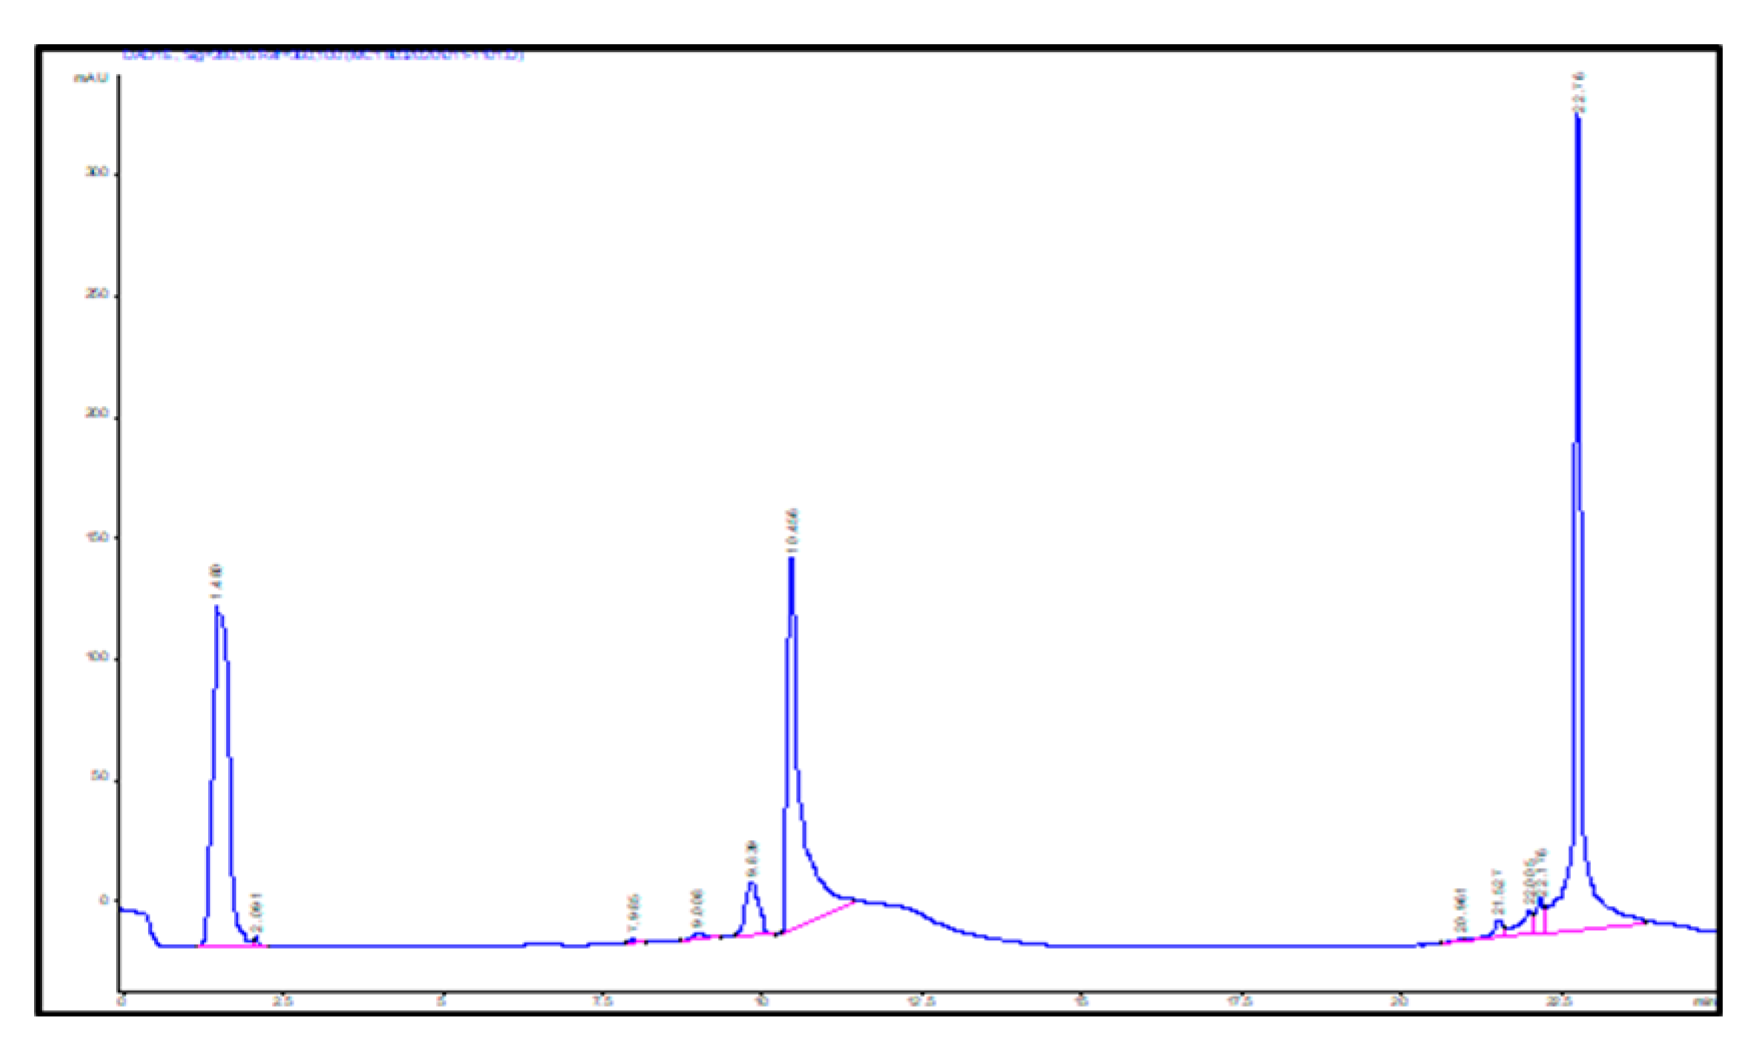
2.3. Identification of Key Metabolites from Eleven Selective Euphorbia Extracts
3. Discussion
4. Materials and Methods
4.1. Materials
4.2. Plant Collection and Processing
4.3. Phytochemical Analysis
4.4. Antiproliferation and Cytotoxic Screening of Euphorbia Extracts
4.4.1. Cell Culture
4.4.2. MTT Assay
4.4.3. CC50 Determination
4.4.4. Selectivity Index
4.4.5. High-Performance Liquid Chromatography (HPLC)
4.4.6. Statistical Analysis
5. Conclusions
Supplementary Materials
Author Contributions
Funding
Data Availability Statement
Acknowledgments
Conflicts of Interest
Abbreviations
| 3-(4,5-dimethylthiazol-2-yl)-2,5-diphenyl tetrazolium bromide | (MTT) assay |
| High-performance liquid chromatography | HPLC |
| Ethyl acetate | EtOAc |
| Dichloromethane | DCM |
| Hexane | Hex |
| cytotoxic concentration | CC50 |
| selectivity index | SI |
| Euphorbia bupleurifolia | E. bupleurifolia |
| Euphorbia trigona | E. trigona |
| Euphorbia gorgonis | E. gorgonis |
| Euphorbia cooperi | E. cooperi |
| Euphorbia horrida Var | E. horrida Var |
| Euphorbia horrida Indigenous | E. horrida Indigenous |
| Euphorbia polygona | E. polygona |
| Euphorbia enopla | E. enopla |
| Euphorbia arabica | E. arabica |
| Euphorbia ammak | E. ammak |
| Euphorbia stellate | E. stellata |
| Euphorbia ferox | E. ferox |
| Euphorbia clavarioides | E. clavarioides |
| Euphorbia coerulescens | E. coerulescens |
| Euphorbia tirucalli | E. tirucalli |
| Euphorbia ledienii | E. ledienii |
| E. bupleurifolia dichloromethane | E.BPF DCM |
| E. trigona hexane | E. TRG Hex |
| E. trigona dichloromethane -E. TRG DCM | |
| E. gorgonis hexane | E. TRG Hex |
| E. polygona hexane | E. PLGN Hex |
| E. polygona dichloromethane | E. PLGN DCM |
| E. ferox dichloromethane | E. FRX DCM |
| E. clavarioides hexane | E. CLV Hex |
| E. clavarioides dichloromethane | E. CLV DCM |
| E. ammak dichloromethane | E. AMK DCM |
| E. ammak hexane | E. AMK Hex |
| E. ferox methanol | E. FRX MeOH |
| E. enopla hexane | E. ENP Hex |
| E. enopla dichloromethane | E. ENP DCM |
| E. ledienii hexane | E. LDN Hex |
| E. stellata dichloromethane | E. STL DCM |
| E. ledienii dichloromethane | E. LDN DCM |
| E. arabica hexane | E. ARB Hex |
| E. arabica dichloromethane | E. ARB DCM |
| E. cooperi hexane | E. CPR Hex |
| E. cooperi dichloromethane | E. CPR DCM |
| E. tirucalli hexane | E. TRL Hex |
| E. tirucalli dichloromethane | E. TRL DCM |
| E. bupleurifolia hexane | E. BPF Hex |
| Triple-negative breast cancer | TNBC |
| Reactive oxygen species | ROS |
| Dulbecco's modified Eagle's medium | DMEM |
| Fetal bovine serum | FBS |
| Standard deviation | SD |
| Doxorubicin | DOX |
References
- Arnold, M.; Morgan, E.; Rumgay, H.; Mafra, A.; Singh, D.; Laversanne, M.; Vignat, J.; Gralow, J. R.; Cardoso, F.; Siesling, S.; Soerjomataram, I. Current and Future Burden of Breast Cancer: Global Statistics for 2020 and 2040. The Breast 2022, 66 (66). [CrossRef]
- Giuliano, A. E.; Connolly, J. L.; Edge, S. B.; Mittendorf, E. A.; Rugo, H. S.; Solin, L. J.; Weaver, D. L.; Winchester, D. J.; Hortobagyi, G. N. Breast Cancer-Major Changes in the American Joint Committee on Cancer Eighth Edition Cancer Staging Manual. CA: A Cancer Journal for Clinicians 2017, 67 (4), 290–303. [CrossRef]
- Done, S. ed. "Breast cancer: recent advances in biology, imaging and therapeutics." (2011). Toroto, Canada. pp. 190-196.
- Siegel, R. L.; Miller, K. D.; Jemal, A. Cancer Statistics, 2019. CA: a Cancer Journal for Clinicians 2019, 69 (1), 7–34. [CrossRef]
- Conte, C. Core-shell sustained release nanosystems for the intravenous delivery of anticancer drugs. Ph.D Thesis, University of Naples Federico II, Italy,2013. core.ac.uk.
- Yuan, Y.; Cai, T.; Xia, X.; Zhang, R.; Chiba, P.; Cai, Y. Nanoparticle Delivery of Anticancer Drugs Overcomes Multidrug Resistance in Breast Cancer. Drug Delivery 2016, 23(9), 3350–3357. [Google Scholar] [CrossRef]
- Senapati, S.; Mahanta, A. K.; Kumar, S.; Maiti, P. Controlled Drug Delivery Vehicles for Cancer Treatment and Their Performance. Signal Transduction and Targeted Therapy 2018, 3 (1). [CrossRef]
- Choudhari, A. S.; Mandave, P. C.; Deshpande, M.; Ranjekar, P.; Prakash, O. Phytochemicals in Cancer Treatment: From Preclinical Studies to Clinical Practice. Frontiers in Pharmacology 2020, 10. [Google Scholar] [CrossRef]
- Ugboko, H. U.; Nwinyi, O. C.; Oranusi, S. U.; Fatoki, T. H.; Omonhinmin, C. A. Antimicrobial Importance of Medicinal Plants in Nigeria. The Scientific World Journal 2020, 2020, 1–10. [Google Scholar] [CrossRef] [PubMed]
- Tewari, D.; Anu Priya; Anupam Bishayee; Anupam Bishayee. Targeting Transforming Growth Factor-ß Signalling for Cancer Prevention and Intervention: Recent Advances in Developing Small Molecules of Natural Origin. 2022, 12 (4). [CrossRef]
- Ismail, N. Z.; Md Saad, S.; Adebayo, I. A.; Md Toha, Z.; Abas, R.; Mohamad Zain, N. N.; Arsad, H. The Antiproliferative and Apoptotic Potential of Clinacanthus Nutans against Human Breast Cancer Cells through Targeted Apoptosis Pathway. Environmental Science and Pollution Research 2022. [Google Scholar] [CrossRef]
- George, B. P.; Chandran, R.; Abrahamse, H. Role of Phytochemicals in Cancer Chemoprevention: Insights. Antioxidants 2021, 10(9), 1455. [Google Scholar] [CrossRef] [PubMed]
- Huang, M.; Lu, J.-J.; Huang, M.-Q.; Bao, J.-L.; Chen, X.-P.; Wang, Y.-T. Terpenoids: Natural Products for Cancer Therapy. Expert Opinion on Investigational Drugs 2012, 21(12), 1801–1818. [Google Scholar] [CrossRef]
- Kgosiemang, I. K. R.; Lefojane, R.; Adegoke, A. M.; Ogunyemi, O.; Mashele, S. S.; Sekhoacha, M. P. Pharmacological Significance, Medicinal Use, and Toxicity of Extracted and Isolated Compounds from Euphorbia Species Found in Southern Africa: A Review. Plants 2025, 14(3), 469. [Google Scholar] [CrossRef]
- Mwine, J.; Van Damme, P. Why Do Euphorbiaceae Tick as Medicinal Plants? A Review of ] Family and Its Medicinal Features. Journal of Medicinal Plants Research 2011, 5(5), 652–662. [Google Scholar] [CrossRef]
- Shi, Q.-W.; Su, X.-H.; Kiyota, H. Chemical and Pharmacological Research of the Plants in Genus Euphorbia. Chemical Reviews 2008, 108(10), 4295–4327. [Google Scholar] [CrossRef]
- Vogg, G. Tumor Promoting Diterpenes from Euphorbia Leuconeura L. Phytochemistry 1999, 51 (2), 289–295. [CrossRef]
- Villanueva, J.; Quirós, L. M.; Castañón, S. Purification and Partial Characterization of a Ribosome-Inactivating Protein from the Latex of Euphorbia Trigona Miller with Cytotoxic Activity toward Human Cancer Cell Lines. Phytomedicine 2015, 22 (7-8), 689–695. [CrossRef]
- Hanson, J. R. The classes of natural products and their isolation. Natural products: the secondary metabolites. Royal Society of Chemistry, UK, 2003; pp. 1-21.
- Berdy, J. Bioactive microbial metabolites. The Journal of antibiotics 2005, 58(1), 1–26. [Google Scholar] [CrossRef]
- Iavicoli, I.; Fontana, L.; Leso, V.; Calabrese, E.J. Hormetic dose–responses in nanotechnology studies. Science of The Total Environment 2014, 487, 361–374. [Google Scholar] [CrossRef]
- Hago, S.; Lu, T.; Abdelgadir, A. A.; Yassin, S.; Ahmed, E. M.; Xu, H. Phytochemical Constituents and In-Vitro Anticancer Activity of Some Medicinal Plant Extracts Against MCF-7 and MDA-MB-435 Human Breast Cancer Cell Lines. Trop. J. Nat. Prod. Res. 2023, 7(3), 1771. [Google Scholar] [CrossRef]
- Liu, Q.; Tang, J.; Hu, M.; Liu, J.; Chen, H.; Gao, H.; Wang, G.; Li, S.-L.; Hao, X.-J.; Zhang, X.; Yao, X.-S. Antiproliferative Cardiac Glycosides from the Latex of Antiaris Toxicaria. Journal of Natural Products 2013, 76(9), 1771–1780. [Google Scholar] [CrossRef] [PubMed]
- Langenheim, J. H. Higher Plant Terpenoids: A Phytocentric Overview of Their Ecological Roles. Journal of Chemical Ecology 1994, 20(6), 1223–1280. [Google Scholar] [CrossRef] [PubMed]
- Dudareva, N.; Pichersky, E.; Gershenzon, J. Biochemistry of Plant Volatiles. Plant Physiology 2004, 135(4), 1893–1902. [Google Scholar] [CrossRef]
- Si, L.; Meng, K.; Tian, Z.-Y.; Sun, J.; Li, H.; Zhang, Z.; Soloveva, V.; Li, H.; Fu, G.; Xia, Q.; Xiao, S.; Zhang, L.; Zhou, D. Triterpenoids Manipulate a Broad Range of Virus-Host Fusion via Wrapping the HR2 Domain Prevalent in Viral Envelopes. Science Advances 2018, 4 (11). [CrossRef]
- Sema, Y. A. and Waktola, T. A. Anti-malarial plants in Ethiopia and their activities on drug-resistant malaria 2022. FEMS microbes, 3, xtac001. [CrossRef]
- Munro, B.; Vuong, Q.; Chalmers, A.; Goldsmith, C.; Bowyer, M.; Scarlett, C. Phytochemical, Antioxidant and Anti-Cancer Properties of Euphorbia Tirucalli Methanolic and Aqueous Extracts. Antioxidants 2015, 4(4), 647–661. [Google Scholar] [CrossRef]
- Hu, J.; Zhang, H.; Li, J.; Jiang, X.; Zhang, Y.; Wu, Q.; Shen, liwen; Shi, J.; Gao, N. ROCK1 Activation-Mediated Mitochondrial Translocation of Drp1 and Cofilin Are Required for Arnidiol-Induced Mitochondrial Fission and Apoptosis. Journal of Experimental & Clinical Cancer Research 2020, 39 (1). [CrossRef]
- Paul, S.; Sengupta, S.; Bandyopadhyay, T. K.; Bhattacharyya, A. Stevioside Induced ROS-Mediated Apoptosis through Mitochondrial Pathway in Human Breast Cancer Cell Line MCF-7. Nutrition and Cancer 2012, 64(7), 1087–1094. [Google Scholar] [CrossRef]
- Cowan, M. M. Plant Products as Antimicrobial Agents. Clinical Microbiology Reviews 1999, 12(4), 564–582. [Google Scholar] [CrossRef] [PubMed]
- Tapas, A.; Sakarkar, D.; Kakde, R. Flavonoids as Nutraceuticals: A Review. Tropical Journal of Pharmaceutical Research 2008, 7 (3). [CrossRef]
- Abdel-Hameed, E.-S. S.; Bazaid, S. A.; Salman, M. S. Characterization of the Phytochemical Constituents of Taif Rose and Its Antioxidant and Anticancer Activities. BioMed Research International 2013, 2013, 1–13. [Google Scholar] [CrossRef]
- Mai, Z.-P.; Ni, G.; Liu, Y.; Li, L.; Shi, G.-R.; Wang, X.; Li, J.; Yu, D.-Q. Heliosterpenoids a and B, Two Novel Jatrophane-Derived Diterpenoids with a 5/6/4/6 Ring System from Euphorbia Helioscopia. Scientific Reports 2017, 7 (1). [CrossRef]
- Zhu, L.; Xue, L. Kaempferol Suppresses Proliferation and Induces Cell Cycle Arrest, Apoptosis, and DNA Damage in Breast Cancer Cells. Oncology Research Featuring Preclinical and Clinical Cancer Therapeutics 2018. [CrossRef]
- Zhang, H.-W.; Hu, J.-J.; Fu, R.-Q.; Liu, X.; Zhang, Y.-H.; Li, J.; Liu, L.; Li, Y.-N.; Deng, Q.; Luo, Q.-S.; Ouyang, Q.; Gao, N. Flavonoids Inhibit Cell Proliferation and Induce Apoptosis and Autophagy through Downregulation of PI3Kγ Mediated PI3K/AKT/MTOR/P70S6K/ULK Signaling Pathway in Human Breast Cancer Cells. Scientific Reports 2018, 8(1), 1–13. [Google Scholar] [CrossRef]
- Vilahur, G.; Ben-Aicha, S.; Diaz-Riera, E.; Badimon, L.; Padró, T. Phytosterols and Inflammation. Current Medicinal Chemistry 2019, 26(37), 6724–6734. [Google Scholar] [CrossRef]
- Vezza, T.; Canet, F.; de Marañón, A. M.; Bañuls, C.; Rocha, M.; Víctor, V. M. Phytosterols: Nutritional Health Players in the Management of Obesity and Its Related Disorders. Antioxidants 2020, 9(12), 1266. [Google Scholar] [CrossRef]
- Kazłowska, K.; Lin, H.-T. V.; Chang, S.-H.; Tsai, G.-J. In Vitroandin VivoAnticancer Effects of Sterol Fraction from Red AlgaePorphyra Dentata. Evidence-Based Complementary and Alternative Medicine 2013, 2013, 1–10. [Google Scholar] [CrossRef]
- Kangsamaksin, T.; Chaithongyot, S.; Wootthichairangsan, C.; Hanchaina, R.; Tangshewinsirikul, C.; Svasti, J. Lupeol and Stigmasterol Suppress Tumor Angiogenesis and Inhibit Cholangiocarcinoma Growth in Mice via Downregulation of Tumor Necrosis Factor-α. PLOS ONE 2017, 12(12), e0189628. [Google Scholar] [CrossRef]
- Kapingu1, M. C.; Mbwambo, Z. H.; M, M. J.; Magadula, J. J. Brine Shrimp Lethality of a Glutarimide Alkaloid from Croton Sylvaticus Hochst. The East and Central African Journal of Pharmaceutical Sciences 2005, 8 (1), 3–5. http://uonjournals.uonbi.ac.ke/ojs/index.php/ecajps/article/view/19.
- Tarek, B.; Hichem, L.; Khalfallah, A.; Kabouche, A.; Zahia Kabouche; Brouard, I.; Bermejo, J.; Bruneau, C. A New Alkaloid and Flavonoids from the Aerial Parts of Euphorbia Guyoniana. Natural Product Communications 2010, 5 (1), 1934578X1000500–1934578X1000500. [CrossRef]
- Ndam, L. M.; Mih, A. M.; Tening, A. S.; Fongod, A. G. N.; Temenu, N. A.; Fujii, Y. Phytochemical Analysis, Antimicrobial and Antioxidant Activities of Euphorbia Golondrina L.C. Wheeler (Euphorbiaceae Juss.): An Unexplored Medicinal Herb Reported from Cameroon. SpringerPlus 2016, 5 (1). [CrossRef]
- Al-Saraireh, Y. M.; Youssef, A. M. M.; Za’al Alsarayreh, A.; Al Hujran, T. A.; Al-Sarayreh, S.; Al-Shuneigat, J. M.; Alrawashdeh, H. M. Phytochemical and Anti-Cancer Properties of Euphorbia Hierosolymitana Boiss. Crude Extracts. Journal of Pharmacy & Pharmacognosy Research 2021, 9 (1), 13–23. [CrossRef]
- Demirkapu, M. J. and Yananli, H. R. Opium Alkaloids. Bioactive Compounds in Nutraceutical and Functional Food for Good Human Health; Sharma. K.; Mishra. K.; Senapati. K.K.;Ed.; Intechopen limited.: London, UK, 2020; pp. 203-214. https://scholar.google.com/scholar?hl=en&as_sdt=0%2C5&q=42.%09Demirkapu%2C+M.+J.%2C+%26+Yananli%2C+H.+R.+%282020%29.+Opium+Alkaloids.+Bioactive+Compounds+in+Nutraceutical+and+Functional+Food+for+Good+Human+Health.&btnG=.
- Mfengwana, P.M.A.H. Evaluation of Pharmacological Properties of Traditional Medicinal Plants Used for the Treatment of Cancer by South African and Lesotho Communities. Ph.D. Thesis, Central University of Technology, Free State, South Africa, 2019. [Google Scholar]
- Molyneux, R. J.; Nash, R. J. and Asano, N. Alkaloids: Chemical and Biological Perspectives; Pelletier. S.W.; Ed.; Pergamon, Oxford,1996; pp. 155-299.
- Kurek, J. Introductory chapter. Alkaloids-their importance in nature and for human life; Intechopen limited.: London, UK, 2019; pp. 1–15, 2019. [Google Scholar] [CrossRef]
- Zhao, Y.; Jing, Z.; Lv, J.; Zhang, Z.; Lin, J.; Cao, X.; Zhao, Z.; Liu, P.; Mao, W. Berberine Activates Caspase-9/Cytochrome c -Mediated Apoptosis to Suppress Triple-Negative Breast Cancer Cells in Vitro and in Vivo. Biomedicine & Pharmacotherapy 2017, 95, 18–24. [Google Scholar] [CrossRef]
- Bhagya, N.; Chandrashekar, K. R.; Prabhu, A.; Rekha, P. D. Tetrandrine Isolated from Cyclea Peltata Induces Cytotoxicity and Apoptosis through ROS and Caspase Pathways in Breast and Pancreatic Cancer Cells. In Vitro Cellular & Developmental Biology – Animal 2019, 55 (5), 331–340. [CrossRef]
- Aleksandrov, M.; Maksimova, V.; Koleva Gudeva, L. Review of the Anticancer and Cytotoxic Activity of Some Species from Genus Euphorbia. Agriculturae Conspectus Scientificus 2019, 84 (1), 1–5. https://hrcak.srce.hr/218527.
- Fraga-Corral, M.; Otero, P.; Cassani, L.; Echave, J.; Garcia-Oliveira, P.; Carpena, M.; Chamorro, F.; Lourenço-Lopes, C.; Prieto, M. A.; Simal-Gandara, J. Traditional Applications of Tannin Rich Extracts Supported by Scientific Data: Chemical Composition, Bioavailability and Bioaccessibility. Foods 2021, 10(2), 251. [Google Scholar] [CrossRef]
- Chung, K.-T.; Wong, T. Y.; Wei, C.-I.; Huang, Y.-W.; Lin, Y. Tannins and Human Health: A Review. Critical Reviews in Food Science and Nutrition 1998, 38(6), 421–464. [Google Scholar] [CrossRef] [PubMed]
- Amarowicz, R.; Troszynska, A.; Barylko-pikielna, N.; Shahidi, F. polyphenolics extracts from legume seeds: correlations between total antioxidant activity, total phenolics content, tannins content and astringency. Journal of Food Lipids 2004, 11(4), 278–286. [Google Scholar] [CrossRef]
- Ho, P. L. Increasing Resistance of Streptococcus Pneumoniae to Fluoroquinolones: Results of a Hong Kong Multicentre Study in 2000. Journal of Antimicrobial Chemotherapy 2001, 48(5), 659–665. [Google Scholar] [CrossRef] [PubMed]
- Buzzini, P.; Arapitsas, P.; Goretti, M.; Branda, E.; Turchetti, B.; Pinelli, P.; Ieri, F.; Romani, A. Antimicrobial and Antiviral Activity of Hydrolysable Tannins. Mini-Reviews in Medicinal Chemistry 2008, 8 (12), 1179–1187. [CrossRef]
- Koleckar, V.; Kubikova, K.; Rehakova, Z.; Kuca, K.; Jun, D.; Jahodar, L.; Opletal, L. Condensed and Hydrolysable Tannins as Antioxidants Influencing the Health. Mini-Reviews in Medicinal Chemistry 2008, 8 (5), 436–447. [CrossRef]
- Bigoniya, P.; Rana, A. Radioprotective and In-Vitro Cytotoxic Sapogenin from Euphorbia Neriifolia (Euphorbiaceae) Leaf. Tropical Journal of Pharmaceutical Research 2010, 8 (6). [CrossRef]
- Jannet, S. B.; Hymery, N.; Bourgou, S.; Jdey, A.; Lachaal, M.; Magné, C. and. Ksouri, R. Antioxidant and Selective Anticancer Activities of Two Euphorbia Species in Human Acute Myeloid Leukemia. Biomedicine & Pharmacotherapy 2017, 90, 375–385. [CrossRef]
- Glauert, A. M.; Dingle, J. T.; Lucy, J. A. Action of Saponin on Biological Cell Membranes. Nature 1962, 196(4858), 953–955. [Google Scholar] [CrossRef]
- El Izzi, A.; Benie, T.; Thieulant, M. L.; Le Men-Olivier, L.; & Duval, J. Stimulation of LH Release from Cultured Pituitary Cells by Saponins OfPetersianthus Macrocarpus: A Permeabilizing Effect. Planta Medica 1992, 58(03), 229–233. [CrossRef]
- Francis, G.; Kerem, Z.; Makkar, H. P. S.; Becker, K. The Biological Action of Saponins in Animal Systems: A Review. British Journal of Nutrition 2002, 88(6), 587–605. [Google Scholar] [CrossRef] [PubMed]
- Fuchs, H.; Bachran, D.; Panjideh, H.; Schellmann, N.; Weng, A.; Melzig, M.; Sutherland, M.; Bachran, C. Saponins as Tool for Improved Targeted Tumor Therapies. Current Drug Targets 2009, 10(2), 140–151. [Google Scholar] [CrossRef] [PubMed]
- Gaidi, G.; Correia, M.; Chauffert, B.; Beltramo, J.-L.; Wagner, H.; Marie-Aleth Lacaille-Dubois. Saponins-Mediated Potentiation of Cisplatin Accumulation and Cytotoxicity in Human Colon Cancer Cells. Planta Medica 2002. [CrossRef]
- Jia, W. W.-G.; Bu, X.; Philips, D.; Yan, H.; Liu, G.; Chen, X.; Bush, J. A.; Li, G. Rh2, a Compound Extracted from Ginseng, Hypersensitizes Multidrug-Resistant Tumor Cells to Chemotherapy. Canadian Journal of Physiology and Pharmacology 2004, 82(7), 431–437. [Google Scholar] [CrossRef]
- Choene, M.; Motadi, L. Validation of the Antiproliferative Effects of Euphorbia Tirucalli Extracts in Breast Cancer Cell Lines. Molecular Biology 2016, 50(1), 98–110. [Google Scholar] [CrossRef]
- El-Hawary, S. S.; Mohammed, R.; Tawfike, A.; Lithy, N. M.; Sameh AbouZid; Amin, M. N.; Usama Ramadan Abdelmohsen; Amin, E. Cytotoxic Activity and Metabolic Profiling of Fifteen Euphorbia Species. Metabolites 2020, 11 (1), 15–15. [CrossRef]
- Yadav, R.N. and Agarwala, M. Phytochemical analysis of some medicinal plants. Journal of Phytology 2011, 3(12),10-14. http://journal-phytology.com/.
- Indrayanto, G.; Putra, G.S.; Suhud, F. 2021. Validation of in-vitro bioassay methods: Application in herbal drug research. Profiles of Drug Substances, Excipients and Related Methodology 2021, 46, 273–307. [Google Scholar] [CrossRef]
- Mahavorasirikul, W.; Viyanant, V.; Chaijaroenkul, W.; Itharat, A.; Na-Bangchang, K. Cytotoxic Activity of Thai Medicinal Plants against Human Cholangiocarcinoma, Laryngeal and Hepatocarcinoma Cells in Vitro. BMC Complementary and Alternative Medicine 2010, 10 (1). [CrossRef]
| Standard drug | IC50 (μg/mL) (μg/mL, n=5/6) |
||||||||
|---|---|---|---|---|---|---|---|---|---|
| IC50 | SD | R2 | IC50 | SD | R2 | IC50 | SD | R2 | |
| MCF-7 | MDA-MB-231 | Vero | |||||||
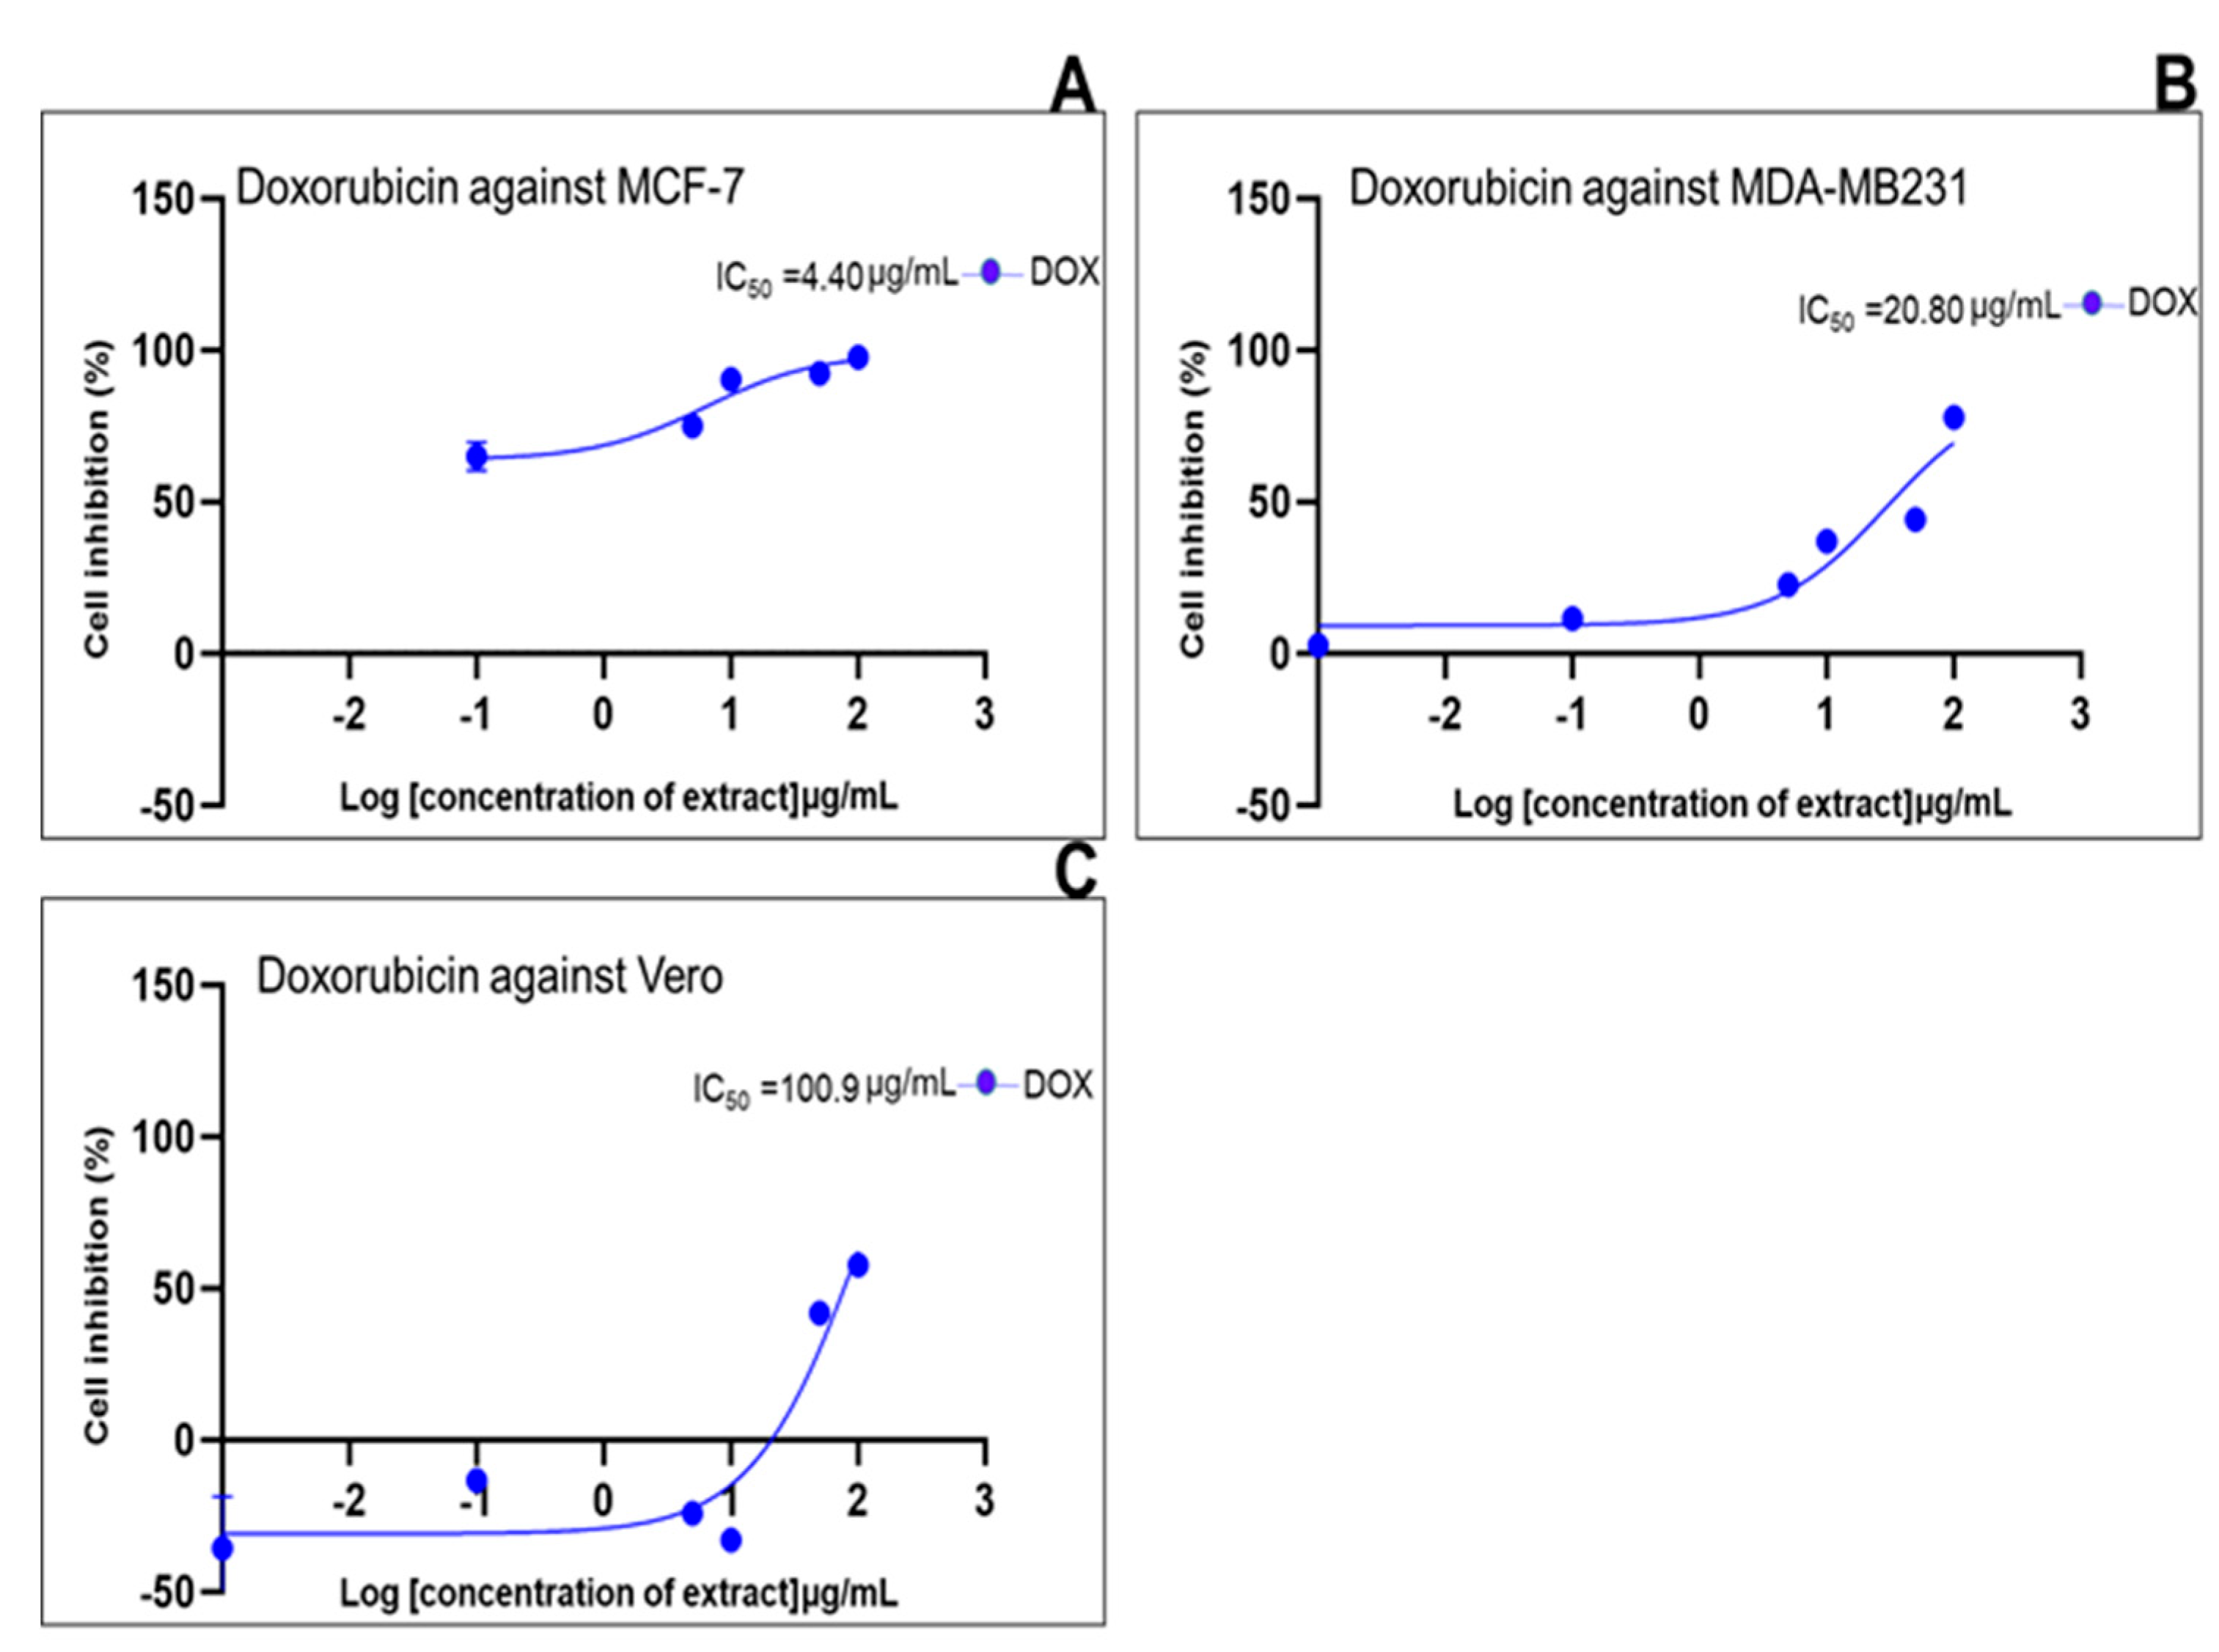
| Doxorubicin | 4.40 | 13.61 | 0.909 | 20.80 | 26.96 | 0.8938 | 100.9 | 40.50 | 0.8790 |
| Plant species | Abbreviation |
|---|---|
| Euphorbia ferox | E. ferox |
| Euphorbia bupleurifolia | E. bupleurifolia |
| Euphorbia tirucalli | E. tirucalli |
| Euphorbia clavariodes | E. clavarioides |
| Euphorbia polygona | E. polygona |
| Euphorbia gorgonis | E. gorgonis |
| Euphorbia enopla | E. enopla |
| Euphorbia cooperi | E. cooperi |
| Euphorbia ammak | E. ammak |
| Euphorbia coerulescens | E. coerulescens |
| Euphorbia trigona | E. trigona |
| Euphorbia horrida Var | E. horrida Var |
| Euphorbia horrida Indigenous | E. horrida ind |
| Euphorbia arabica | E. arabica |
| Euphorbia stellata | E. stellata |
| Euphorbia ledienii | E. ledienii |
| CC50 (µg/mL) | Status |
|---|---|
| >100 µg/mL | Inactive |
| <100≥ 50 µg/mL | Low activity |
| < 50 µg/mL ≥10 µg/mL | Moderate activity |
| < 10 µg/mL ≥ 5 µg/mL | Good activity |
| <5 µg/mL | Potent activity |
| Time (min) | % Solvent A (0.1% formic acid in H2O) |
% Solvent B (Acetonitrile) |
|---|---|---|
| 0 | 95 | 5 |
| 10 | 90 | 10 |
| 20 | 70 | 30 |
| 30 | 50 | 50 |
| 40 | 95 | 5 |
| 41 | STOP |
Disclaimer/Publisher’s Note: The statements, opinions and data contained in all publications are solely those of the individual author(s) and contributor(s) and not of MDPI and/or the editor(s). MDPI and/or the editor(s) disclaim responsibility for any injury to people or property resulting from any ideas, methods, instructions or products referred to in the content. |
© 2025 by the authors. Licensee MDPI, Basel, Switzerland. This article is an open access article distributed under the terms and conditions of the Creative Commons Attribution (CC BY) license (https://creativecommons.org/licenses/by/4.0/).


