Submitted:
11 October 2025
Posted:
13 October 2025
You are already at the latest version
Abstract
This study presents a systematic approach to enhancing the mechanical performance of composite materials for submarine applications by quantitatively evaluating and control-ling internal micro-voids generated during the manufacturing process. Three non-destructive evaluation techniques—ultrasonic testing, optical microscopy, and mi-cro-computed tomography (Micro-CT)—were employed to assess void content in fi-ber-reinforced composite specimens fabricated under various processing conditions. Ten-sile and flexural strength tests were conducted to investigate the correlation between void content and mechanical properties. Among the methods, ultrasonic testing exhibited the strongest negative correlation (correlation coefficient = –0.703), confirming its effectiveness as a representative non-destructive evaluation technique. Furthermore, statistical design of experiments, including factorial design, steepest ascent method, and response surface methodology (RSM), identified defoamer concentration and mixing time as the most in-fluential process parameters in void reduction. The optimal processing conditions were determined to be 0.049% defoamer and 232 minutes of mixing. Under these conditions, void content was minimized, and mechanical properties were significantly improved. These findings offer practical guidance for void control and non-destructive evaluation in large-scale composite structures, contributing to improved reliability in underwater structural applications.
Keywords:
void content
; fiber-reinforced polymer composites
; process optimization
; mechanical performance
1. Introduction
Sample Submarines are strategic naval weapon systems capable of stealth operations, superior maneuverability, and sustained mission execution, playing a pivotal role in national maritime defense. During missions, submarines are constantly exposed to extreme hydrostatic pressure, mechanical impact, friction, and wear. Therefore, ensuring the durability and structural reliability of their hulls is a critical requirement for stable operation [1].
Structurally, a submarine consists of a pressure hull and a non-pressure hull. The pressure hull, constructed from high-strength metallic materials such as HY80 and HY100, is designed to withstand external pressure and protect the crew and onboard equipment [2]. In contrast, the non-pressure hull, although not directly exposed to external pressure, serves to protect equipment, minimize hydrodynamic resistance, and improve acoustic performance. It is nonetheless subjected to continuous mechanical loads and harsh marine environments, demanding properties such as lightweight design, corrosion resistance, and mechanical strength [1].
Fiber-reinforced polymer (FRP) composites such as glass fiber reinforced plastic (GRP) and carbon fiber reinforced plastic (CRP) are widely employed as structural materials for non-pressure hulls [3]. GRP offers excellent processability, corrosion resistance, and cost-effective mechanical performance, while CRP is selectively used in local areas requiring high stiffness and acoustic properties [4].
One of the most common defects during composite manufacturing is the presence of voids [5]. These voids significantly degrade the physical, mechanical, and thermodynamic properties of the composite. Submarine composites are typically fabricated via Liquid Composite Molding (LCM), in which a liquid thermosetting resin is infused into a fibrous preform [6]. During this process, voids are generated through mechanisms such as mechanical air entrapment, gas evolution during curing, and volatilization of dissolved gases in the resin [6]. In particular, the heterogeneous permeability of the fiber preform induces local variations in flow velocity, which, coupled with capillary effects, increases void formation [7].
Voids in composites are generally classified as macro-, meso-, or micro-scale, depending on their size and morphology [6]. Macro-voids result from incomplete resin infiltration, while meso- and micro-voids typically occur due to insufficient resin penetration into the fiber structure. Controlling void content in LCM processes requires the regulation of void formation, dissolution, and migration stages [8].
Voids induce local stress concentrations, increasing the peak stress near the void boundary by up to 1.85 times [9]. This promotes fiber-matrix interfacial debonding, accelerates crack initiation and propagation, and ultimately reduces the mechanical reliability of the structure. Furthermore, voids facilitate moisture ingress, thereby degrading corrosion and environmental resistance, and in the long term, accelerating fiber wear and damage. As a result, void control is considered a crucial factor in the design and manufacturing of composite structures exposed to harsh underwater environments [10].
Representative techniques for quantitative void analysis include optical microscopy, ultrasonic testing, and micro-computed tomography (Micro-CT) [11]. Optical microscopy enables visualization of void size, shape, and distribution, but is inherently limited by localized bias due to cross-sectional observation. Although image-based area fraction measurements show trends similar to density-based volume fractions, several studies have reported that image-based void content tends to be overestimated [12]. Ultrasonic testing evaluates internal voids in a non-destructive manner by analyzing pulse attenuation and velocity, and is less sensitive to fiber volume fraction variations, making it suitable for evaluating bulk composite structures [13]. Micro-CT, which exploits differences in X-ray absorption and scattering, enables high-resolution three-dimensional characterization of internal structures and is gaining attention as a reliable method for void quantification [14].
Given the high mechanical performance requirements for submarine composites—such as tensile and flexural strength—quantitative void evaluation and its correlation with mechanical properties are increasingly important [12]. Voids generated during LCM processes are influenced by various process parameters including degassing conditions, injection pressure, vacuum level, and curing rate [15]. Among these, degassing parameters are considered particularly critical, as they directly influence void reduction and are relatively easy to control [16].
This study aims to quantitatively evaluate micro-voids generated during the fabrication of GRP composites for submarine applications and to identify and optimize key process variables affecting mechanical performance. The correlations between void characteristics and mechanical properties such as tensile and flexural strength were investigated using three void analysis methods: optical microscopy, ultrasonic attenuation analysis, and Micro-CT imaging. Furthermore, statistical design of experiments (DOE) was employed to derive optimal degassing process conditions, and the effects of each parameter on composite mechanical performance were quantitatively analyzed to establish a foundation for improving the reliability of composite manufacturing for underwater structural applications.
2. Experimental Methods
2.1. Subsection
To investigate the effect of internal micro-voids on the mechanical properties of submarine composite structures, specimens with varying void content were fabricated through random modulation of process conditions. The reinforcement material used was DBLT-100 glass fiber, while the matrix resin was an unsaturated polyester resin, DION-9100LF. The curing agent, TBPB, was added at 1.5 wt% relative to the resin weight. Process parameters such as vacuum pressure and degassing time were randomly altered to induce a range of void distributions in the fabricated specimens.
2.2. Void Quantification Techniques
Since internal micro-voids significantly influence the mechanical performance, environmental resistance, and long-term reliability of composite materials, their accurate and reliable quantification is crucial. In this study, three non-destructive evaluation techniques—ultrasonic testing, optical microscopy-based image analysis, and micro-computed tomography (Micro-CT)—were employed independently to measure void content. While these methods share the advantage of non-destructive internal assessment, they differ in terms of measurement accuracy, spatial resolution, applicable specimen size, and analysis range.
2.2.1. Ultrasonic Testing
Ultrasonic testing evaluates internal defects by utilizing reflection and attenuation phenomena that occur at heterogeneous interfaces within the material. In this study, a C-Scan system (Model: 4UTTU-01, Poyutek) was used, consisting of a 14-axis scanning setup capable of analyzing specimens up to 10 m × 1.5 m × 2.5 m in size. The scan speed was set at 35 inch/s, the operating frequency at 2.25 MHz, and data were acquired in Time-Through Transmission (TTU) mode.
Attenuation data were obtained on a pixel-by-pixel basis over a central region of 85 mm × 85 mm, and the average value was defined as the representative attenuation for each specimen. This method is advantageous for estimating bulk void content as it reflects the overall internal state across a wide measurement area.
2.2.2. Optical Microscopy and Image Analysis
This method involves cross-sectional observation of the composite using an optical microscope, followed by image processing to quantitatively estimate the void content. A Carl Zeiss Axio Observer 3 inverted fluorescence microscope was used. The specimen surfaces were polished with #2400 grit abrasive paper prior to observation. Each specimen was first observed at 50× magnification to scan the entire cross-section, and then five selected areas were examined at 100× magnification for detailed analysis.
Voids were defined as regions with light intensity values between 4000 and 6000, based on their lower transmittance compared to resin and fiber. Through RGB channel-based image processing, the green channel was used to identify the resin phase, and fibers and voids were separated based on contrast with other channels.
2.2.3. Micro-Computed Tomography (Micro-CT)
Micro-CT enables high-resolution, three-dimensional observation of internal voids using X-ray attenuation differences. A Vtomex M300 system (GE) was employed for analysis, with a scan volume of 600 × 400 × 600 μm. The voxel resolution was set to 9.0 μm, using a 0.1 mm copper filter. A total of 2000 projection images were acquired, with an integration time of 1.0 s per image. The images were reconstructed into 3D using VGStudio MAX software, and voids were distinguished based on local density differences to quantify both their distribution and volume fraction.
2.3. Design of Experiments
To identify process variables influencing micro-void content during the degassing stage, three parameters were selected: defoamer concentration, mixing speed (RPM), and mixing time. The ranges for each parameter were defined as follows: defoamer content from 0 to 0.03 wt% with a center point at 0.015 wt%, mixing speed from 100 to 400 rpm, and mixing time from 30 to 150 minutes.

Table 1.
Experimental matrix for factorial design: combinations of defoamer concentration, mixing speed, and mixing time used to fabricate composite specimens.
Table 1.
Experimental matrix for factorial design: combinations of defoamer concentration, mixing speed, and mixing time used to fabricate composite specimens.
| RunOrder | Defoamer Concentration |
RPM | Mixing Time |
|---|---|---|---|
| 1 | 0 | 400 | 150 |
| 2 | 0.015 | 250 | 90 |
| 3 | 0.03 | 400 | 30 |
| 4 | 0 | 100 | 30 |
| 5 | 0.03 | 400 | 30 |
| 6 | 0.03 | 400 | 150 |
| 7 | 0.015 | 250 | 90 |
| 8 | 0.03 | 100 | 30 |
| 9 | 0 | 400 | 30 |
| 10 | 0 | 100 | 30 |
| 11 | 0.03 | 400 | 150 |
| 12 | 0 | 400 | 30 |
| 13 | 0 | 400 | 150 |
| 14 | 0.03 | 100 | 30 |
| 15 | 0 | 100 | 150 |
| 16 | 0.015 | 250 | 90 |
| 17 | 0.03 | 100 | 150 |
| 18 | 0 | 100 | 150 |
| 19 | 0.03 | 100 | 150 |
Statistical optimization of these process variables was performed using Minitab Statistical Software (version 22). The experimental process was carried out in three stages. First, factorial design was applied to identify significant factors. Second, the steepest ascent method was used to move toward the direction of maximum response improvement. Finally, response surface methodology (RSM) was employed to conduct additional experiments at the center and axial points and derive the optimal combination of process parameters.
2.4. Mechanical Property Evaluation
Mechanical properties of the composite specimens were evaluated through tensile and flexural strength testing. Tensile strength tests were performed according to ASTM D3039 using an Instron 8802 machine, while flexural strength was measured based on ASTM D790 using an Instron 5582 system. For each condition, ten specimens were prepared, and the average values were reported as the final results.
3. Results and Discussion
3.1. Comparison of Void Measurement Techniques
Accurate quantification of internal micro-voids in composite materials is essential for ensuring structural integrity and predicting mechanical performance. In this study, three different non-destructive techniques—C-Scan ultrasonic testing, optical microscopy, and Micro-CT analysis—were applied to ten specimens fabricated from the same composite system but with varying void contents. The void content results obtained from each method were evaluated in terms of mean values and standard deviations.
Figure 1 (a) shows the attenuation rate obtained from C-Scan ultrasonic testing, while Figures 1 (b) and (c) depict the void content variations determined through optical microscopy and Micro-CT analysis, respectively.
The ultrasonic testing yielded an average attenuation of 31.7% with a standard deviation of 4.9%. This method has the advantage of scanning a relatively large area (85 mm × 85 mm), enabling it to represent the average void distribution in the bulk material. In contrast, the optical microscopy method provided an average void content of 1.45% and a standard deviation of 0.51%, based on detailed observation of a small cross-sectional region (~0.14 mm²). While this method offers high spatial resolution for local void characterization, it has limitations in terms of representativeness of the overall structure.
Micro-CT analysis showed an average void content of 2.09% with a standard deviation of 0.86%. This technique allows for three-dimensional visualization of internal voids, providing detailed information on their morphology, spatial distribution, and location. However, its analysis volume is limited to approximately 0.096 mm³, making it difficult to fully represent the global void distribution in large-scale composite structures. Consequently, care must be taken when correlating Micro-CT results with bulk mechanical behavior.
All three techniques revealed considerable variation in void distribution among specimens, reflecting the inherent randomness and non-uniformity of void formation. Rather than identifying a universally superior method, it is important to select the most appropriate technique based on the specific purpose and characteristics of the composite structure. Critical factors such as measurement representativeness, spatial resolution, and non-destructive capability must be holistically considered. Ultimately, identifying the measurement method that exhibits the strongest correlation with mechanical properties is essential for establishing the reliability of composite materials.
3.2. Correlation Between Void Content and Mechanical Properties
Table 2 presents the Pearson correlation coefficients between void content and tensile strength. The C-Scan ultrasonic method exhibited the highest negative correlation (–0.703), whereas the optical microscopy and Micro-CT methods showed lower correlation coefficients of –0.557 and –0.508, respectively. Statistically, only the ultrasonic method satisfied the significance level (p < 0.05), indicating a meaningful relationship between void content and tensile strength.
Figure 2.
Influence of void content on mechanical properties of composite specimens: (a) Tensile strength variation according to void content; (b) Flexural strength variation according to void content.
Figure 2.
Influence of void content on mechanical properties of composite specimens: (a) Tensile strength variation according to void content; (b) Flexural strength variation according to void content.
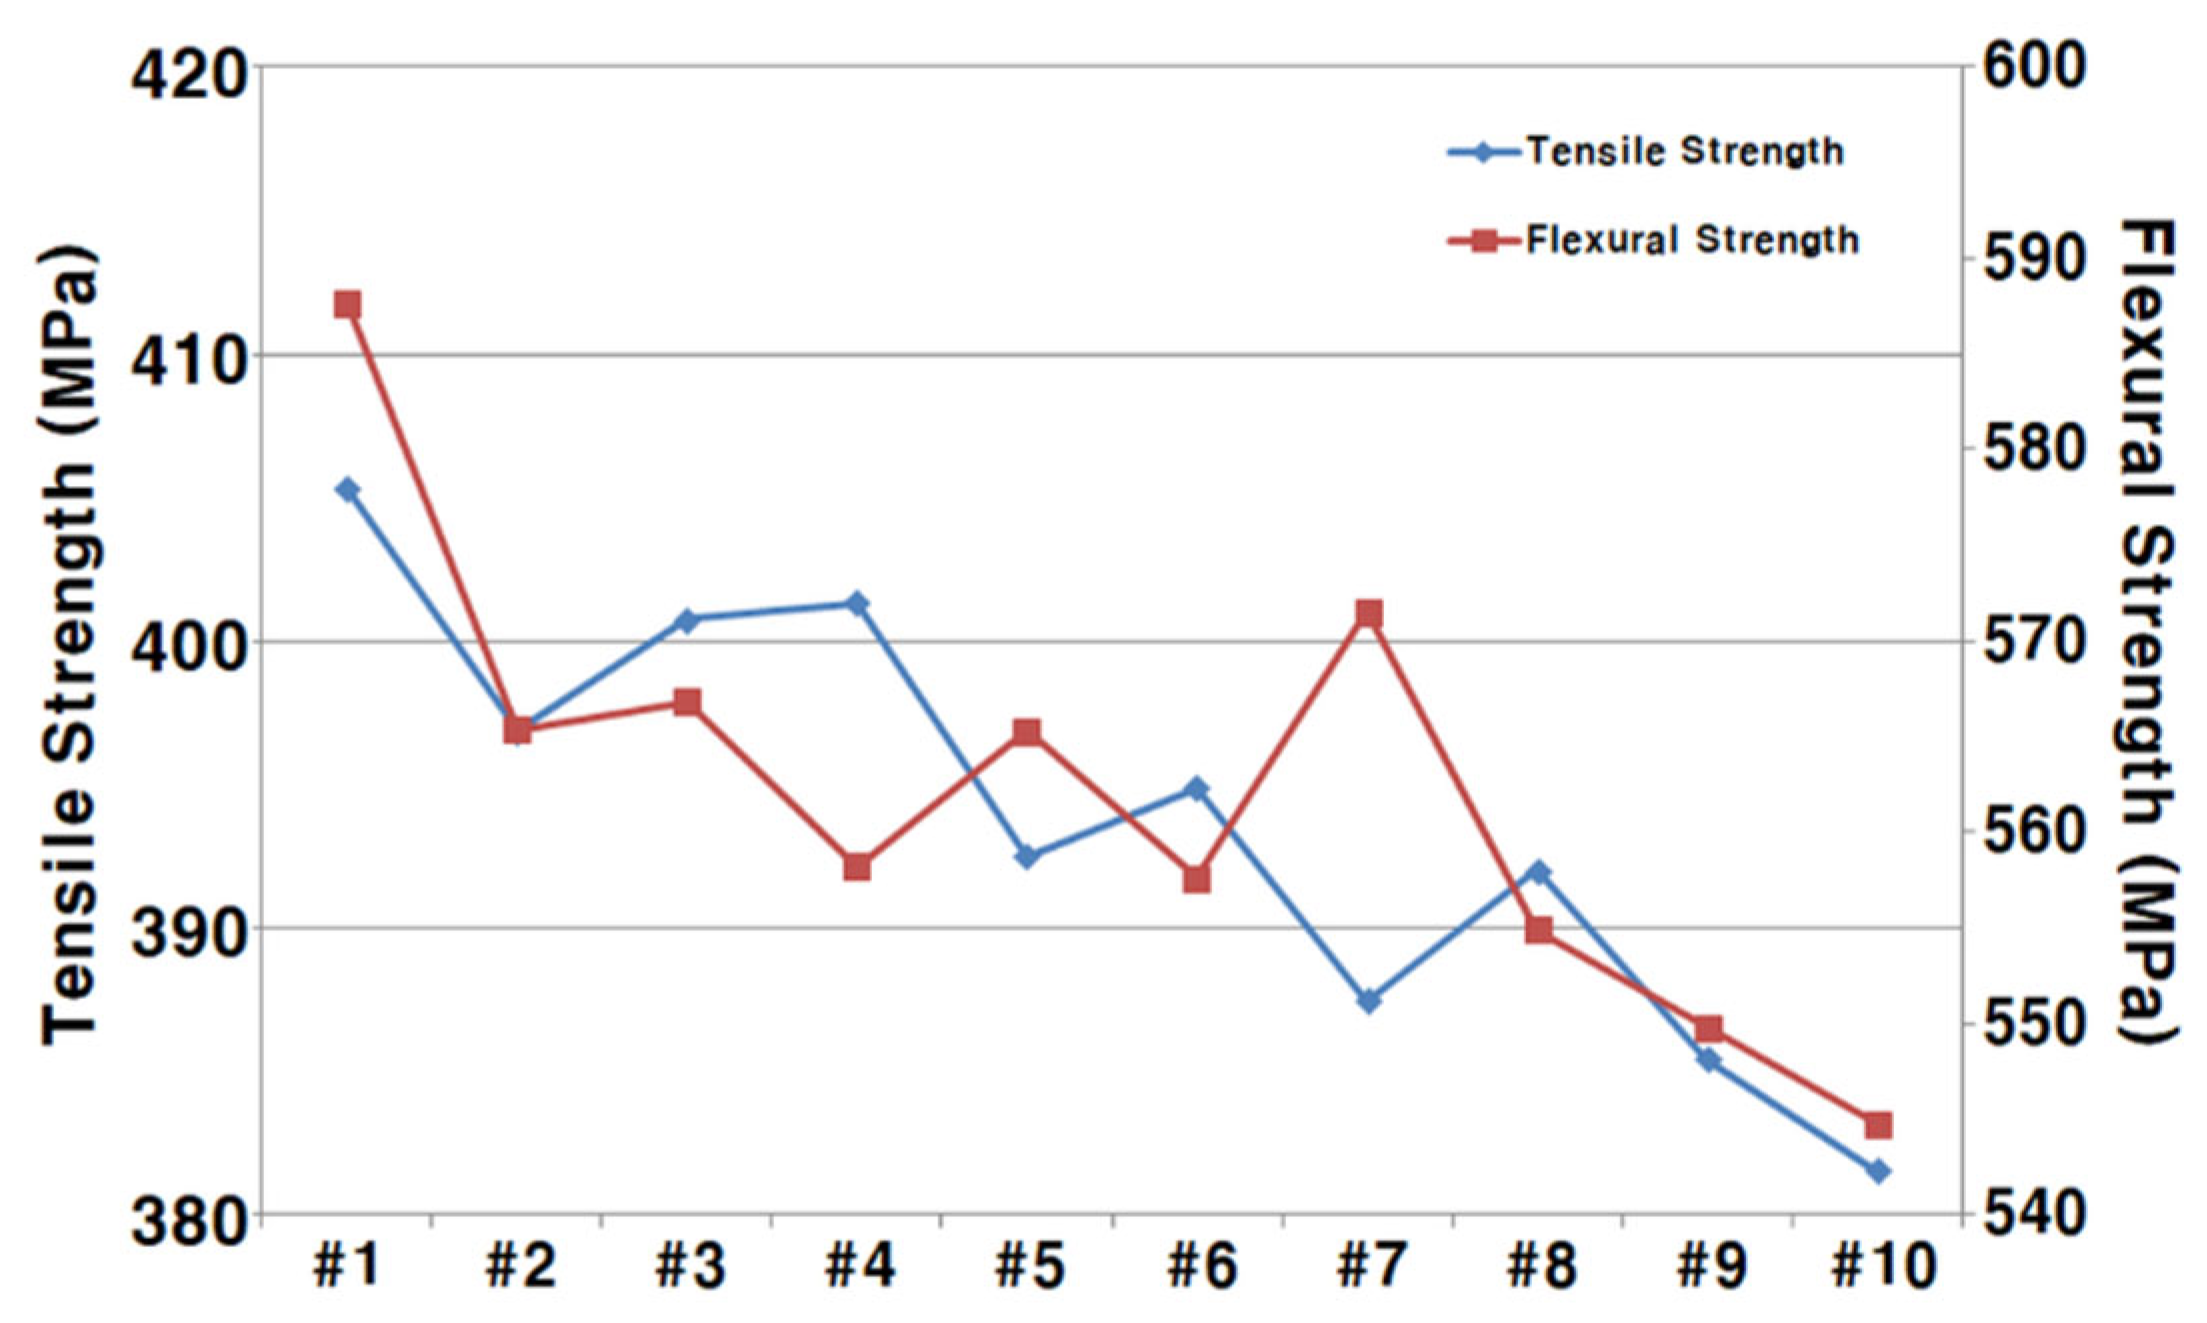
Table 3 shows the correlation between void content and flexural strength, revealing a similar trend. The ultrasonic method again demonstrated a statistically significant correlation (p < 0.05), reinforcing its validity as a predictor of mechanical performance in relation to void content.
All three measurement techniques revealed a consistent negative correlation between void content and mechanical properties, suggesting that an increase in voids leads to a deterioration in structural performance. This is attributable to the fact that voids act as stress concentrators, weakening the interfacial bonding between fibers and matrix, thereby accelerating crack initiation and propagation. In tensile loading, in particular, voids often serve as the starting point for cracks, resulting in a direct reduction in strength. Therefore, void content is confirmed as a critical factor in the degradation of composite mechanical properties.
The differences in statistical significance across the three methods can be attributed to the representativeness of their respective measurement areas. Submarine composites typically have surface areas ranging from several square centimeters to several square meters. As the mechanical properties are influenced by the statistical distribution of voids throughout the entire structure, localized analysis techniques such as microscopy and Micro-CT may not sufficiently capture this variability. In contrast, the ultrasonic method, with its ability to cover larger areas non-destructively, is better suited to represent bulk properties.
Although Micro-CT offers superior spatial resolution and the ability to analyze the shape, size, and spatial distribution of voids in three dimensions, the small volume of analyzable material (approximately 0.096 mm³) limits its applicability for assessing large-scale composite structures such as those used in submarines. In comparison, the ultrasonic method can scan an area of 85 mm × 85 mm (totaling 7,225 mm²), thus offering higher representativeness. The optical microscopy method, in contrast, evaluates only about 0.14 mm² per specimen, based on five selected regions from a divided cross-sectional area of 0.25 mm².
In summary, the ultrasonic method emerges as the most effective technique for predicting the mechanical performance of composites, particularly when representative, non-destructive evaluation over a large area is required. These findings highlight the need to balance resolution, analysis volume, and representativeness when selecting void quantification methods, and emphasize that choosing a measurement technique based on its correlation with mechanical properties is essential for improving the precision and reliability of composite material evaluations.
3.3. Optimization of Process Parameters for Micro-void Control
3.3.1. Factorial Design
Submarine composite structures are typically manufactured using Liquid Composite Molding (LCM), a resin-based molding process. During this process, micro-voids may form due to a variety of factors, including mechanical air entrapment during resin injection, gas generation from the curing reaction, and degassing of dissolved gases in the resin [5]. These voids not only degrade the mechanical properties of the composite but also serve as critical defects that compromise the structural reliability. Therefore, effective control of micro-void formation is not merely a matter of quality enhancement, but a fundamental requirement for ensuring the performance of high-reliability systems such as submarines.
The LCM process for composite fabrication typically involves several stages, including mold preparation, gel coating, defoaming, lay-up, resin injection, vacuum application and curing, and demolding. Among these, the defoaming step—where entrapped air is removed from the resin prior to injection—is the most directly influential in determining void formation. Despite its importance, systematic optimization of the defoaming process remains insufficiently explored.
In this study, three critical parameters of the defoaming process were selected for investigation: defoamer concentration, mixing speed, and mixing time. The defoamer facilitates the collapse of entrapped air bubbles by reducing surface tension. However, excessive use can alter interfacial properties and deteriorate the resin’s performance. Mixing speed promotes uniform dispersion of additives, but overly high speeds may introduce additional air, while insufficient speeds may cause inhomogeneity and poor curing. Likewise, mixing time must be carefully optimized; insufficient time results in uneven composition, while prolonged mixing may cause premature curing or re-bubbling of the resin [17].
To quantitatively evaluate the effects of these process parameters and identify optimal conditions, a factorial design approach was employed. Factorial design is a statistical experimental methodology that allows simultaneous evaluation of the main and interaction effects of multiple variables on the response factor. Minitab 22 statistical software was used to construct the design matrix. The detailed design structure is summarized in Table 1, and the relative effect sizes of the factors are visualized using a Pareto chart in Figure 3.
The experimental results indicated that defoamer concentration and mixing time significantly affected the attenuation rate, which served as a proxy for void content. In contrast, interaction effects and higher-order terms (second- or third-order interactions) were found to be statistically insignificant. Notably, mixing time had a greater influence than defoamer concentration, which may be attributed to the physical behavior of entrapped air—naturally escaping from the resin over time.
To validate the reliability of the regression model, a residual analysis was conducted. The results were as follows:
The normal probability plot of residuals (Figure 4a) showed that the residuals approximately followed a straight line, indicating that the assumption of normality was satisfied.
The residuals versus observation order plot (Figure 4b) revealed no discernible patterns, suggesting that the experiments were conducted in a random sequence.
The residuals versus fitted values plot (Figure 4c) showed constant variance across the fitted values, confirming the homoscedasticity of the residuals.
The histogram of residuals (Figure 4d) exhibited a bell-shaped normal distribution, indicating that the statistical characteristics of the data were well captured by the regression model.
Collectively, these results confirm that the regression model satisfies key statistical assumptions—normality, independence, and homoscedasticity—and that the predictive reliability of the model is sufficiently robust for subsequent optimization steps [18].
Based on the factorial analysis results, the two primary process parameters that had statistically significant effects on ultrasonic attenuation (used as a proxy for void content) were identified as defoamer concentration and mixing time. In contrast, the second-order terms and the interaction effect between these two factors were found to be statistically insignificant, with p-values exceeding the threshold of 0.05.
Table 4 presents the results of the analysis of variance (ANOVA) considering only the significant main effects. Both defoamer concentration and mixing time exhibited p-values less than 0.05, reaffirming their statistically significant influence on attenuation rate. Notably, the lower p-value for mixing time indicates that this factor exerts a relatively greater effect on the variation in attenuation, likely due to the extended time allowing for more effective physical removal of entrapped air bubbles from the resin.
In addition, a curvature test was conducted to evaluate the existence of non-linearity in the response surface. The p-value for the curvature term was calculated as 0.714, which is significantly greater than 0.05, indicating no statistically significant evidence of curvature within the current experimental domain. This result implies that the response surface behaves in a linear manner under the tested conditions and that the global optimum may lie beyond the current design space.
Based on these results, a first-order regression model in uncoded (real-world) units was established as follows:
Attenuation rate (%) = 34.59 − 119.6 × Defoamer concentration (wt%) − 0.0327 × Mixing time (min)
Both coefficients in the regression equation are negative, suggesting that increasing the defoamer concentration and mixing time leads to a reduction in attenuation rate. This trend indicates a corresponding decrease in void content, thereby implying improved physical integrity and mechanical performance of the composite material.
Furthermore, the absence of an interaction term (i.e., the product of the two variables) in the regression model confirms that the interaction effect between defoamer concentration and mixing time was statistically insignificant within the tested range.
Figure 5 illustrates the main effects of each factor on attenuation rate. The results clearly show that attenuation reaches its minimum near a defoamer concentration of 0.03 wt% and a mixing time of 150 minutes, corroborating the findings derived from the regression model. Both parameters demonstrate a strong negative correlation with attenuation.
However, the lack of statistical significance in the curvature test indicates that the response surface remains linear within the current design domain. This suggests that the optimal conditions for minimizing void content may not yet have been reached and could exist outside the currently tested range. Accordingly, further experiments employing the Steepest Ascent Method are recommended to explore the response gradient and identify a local optimum in regions where curvature may bepresent.
3.3.2. Steepest Ascent Method
Based on the results of the factorial design analysis, defoamer concentration and mixing time were identified as statistically significant factors influencing ultrasonic attenuation. However, no curvature was observed in the response surface, suggesting that the response exhibited a linear trend within the tested experimental range. This implies that the optimal response conditions may lie outside the current design space, highlighting the need for further experimentation to explore extended process conditions.
Figure 6 presents a two-dimensional contour plot showing the variation of attenuation rate with respect to defoamer concentration and mixing time. The contour distribution indicates that the lowest attenuation values occur in the upper-right region of the plot, where both variables are at their highest levels. This trend suggests that, in order to reach the optimal response, both defoamer concentration and mixing time should be increased simultaneously.
To systematically approach the optimum region, the Steepest Ascent Method was employed in this study. This method involves adjusting the experimental conditions along the direction of the gradient vector derived from the initial regression model, thereby iteratively moving toward conditions that yield improved response values [19]. Once the progression reaches a point where no further meaningful improvement in attenuation is observed, subsequent optimization can be performed using Response Surface Methodology (RSM) to precisely identify the local optimum.
The estimated regression coefficients and their statistical significance for defoamer concentration and mixing time are summarized in Table 5. The negative coefficients confirm that both factors contribute to reducing attenuation, with mixing time exhibiting a slightly stronger effect.
In particular, as shown in Table 5, the defoamer concentration and mixing time yielded statistically significant p-values (0.044 and 0.029, respectively), indicating their individual influence on attenuation rate. Meanwhile, the interaction term between defoamer and mixing time was not statistically significant (p = 0.389), suggesting that the effects of each parameter are largely independent within the studied range. This supports the validity of the linear first-order model used in the steepest ascent approach.
Accordingly, the Steepest Ascent Method was applied in this study to identify the optimal processing conditions for minimizing ultrasonic attenuation. This statistical approach iteratively adjusts the experimental variables in the direction of the steepest gradient—i.e., the direction in which the response variable (attenuation rate) improves most rapidly—enabling efficient navigation toward the optimal region within the response surface.
A critical step in implementing the Steepest Ascent Method is the selection of a principal variable. Although both defoamer concentration and mixing time were found to significantly influence the attenuation rate, defoamer concentration was selected as the primary factor due to its relative ease of experimental control. Using standardized regression coefficients derived from the initial model, the gradient ratio was calculated to determine how much the mixing time should be adjusted when the defoamer concentration is increased by one coded unit. The ratio of the mixing time coefficient (−1.962) to the defoamer coefficient (1.794) yielded approximately 1.1. When converted to actual experimental units, this corresponds to an increment of 66 minutes in mixing time (i.e., 60 minutes × 1.1) for every unit increase in defoamer concentration [17].
Based on this gradient direction, a series of experiments was conducted by progressively adjusting the process conditions. The results are summarized in Table 6. The attenuation rate continued to decrease up to a condition of 0.045 wt% defoamer concentration and 222 minutes of mixing time, beyond which further changes in the process variables did not lead to additional improvements in the response. This indicates that these conditions are located near the optimal region for minimizing attenuation.
It is also worth noting that excessive defoamer addition can adversely alter the interfacial properties of the resin, leading to degradation in curing characteristics and mechanical performance. Similarly, overly extended mixing times may increase the resin’s viscosity or cause premature curing, compromising the processability. Therefore, the experimental results suggest that the practical optimal conditions for attenuation minimization lie near 0.045 wt% defoamer concentration and 222 minutes of mixing time. In the subsequent step, Response Surface Methodology (RSM) was employed to conduct a more precise exploration of the local optimum within the defined design space.
3.3.3. Response Surface Methodology
Following the factorial design and Steepest Ascent Method, defoamer concentration and mixing time were identified as statistically significant factors influencing the attenuation rate, and the potential presence of curvature in the response surface was suggested. Consequently, this study employed Response Surface Methodology (RSM) to perform a more refined optimization of the process parameters [20].
The RSM experimental design was based on a Central Composite Design (CCD), with the optimal condition derived from the Steepest Ascent Method—namely, 0.045 wt% defoamer concentration and 222 minutes of mixing time—used as the center point. The design included a total of 14 additional experiments: three center points per block, four axial points, and seven factorial points from the previous design [21]. The detailed experimental matrix and the measured attenuation rates are summarized in Table 7.
Figure 7 presents a three-dimensional contour plot of the response surface, visually confirming that the minimum attenuation rate occurs in the vicinity of 0.045 wt% defoamer concentration and 222 minutes of mixing time. Subsequently, a numerical optimization tool based on the fitted RSM model was employed to determine the precise combination of process variables that minimizes the attenuation rate.
As shown in Figure 8, the optimal condition was identified at a defoamer concentration of 0.049 wt% and a mixing time of 232 minutes, at which point the attenuation rate was minimized to approximately 21%. These findings experimentally demonstrate that fine control over defoamer concentration and mixing time significantly contributes to the reduction of micro-void content, thereby enhancing the mechanical performance of the composite material [22].
The outcome of the response surface optimization highlights the critical impact of the defoaming process on the quality of composite structures used in submarine applications. Furthermore, it supports the effectiveness of statistical process optimization approaches in achieving consistent manufacturing quality and improving the reliability of advanced composite fabrication.
4. Conclusions
This study systematically investigated the improvement of mechanical performance in composite materials used for the non-pressure hull structures of submarines by focusing on the quantitative evaluation of internal micro-voids and their reduction through process optimization. Three non-destructive evaluation (NDE) techniques—C-Scan ultrasonic testing, optical microscopy with image analysis, and Micro-CT scanning—were applied to quantify void content, and the correlations between void characteristics and mechanical properties (tensile and flexural strength) were comparatively analyzed.
The results indicated a negative correlation between void content and mechanical strength across all evaluation methods, with the C-Scan ultrasonic method demonstrating the strongest correlation. Due to its broad scanning area, this method also showed statistical significance (p < 0.05), thereby validating its effectiveness in reflecting overall material behavior. These findings underscore the importance of representativeness in measurement scope for predicting mechanical performance and experimentally confirm that the C-Scan ultrasonic method is particularly effective for reliability assessment of composite structures.
Furthermore, factorial design, Steepest Ascent Method, and Response Surface Methodology (RSM) were sequentially employed to identify and optimize key defoaming process parameters, including defoamer concentration, mixing speed, and mixing time. The optimal process conditions were determined to be a defoamer concentration of 0.049 wt% and a mixing time of 232 minutes, which corresponded to the lowest ultrasonic attenuation rate, indicating a reduction in void content and improved mechanical strength.
These results suggest that precise control of defoaming parameters can effectively suppress void defects and contribute to the structural soundness and reliability required for large-scale composite applications. In particular, the establishment of a quantitative correlation between process parameters and void characteristics provides a practical and technically grounded optimization strategy that can enhance industrial applicability.
Nevertheless, this study was conducted under limited sample sizes and processing conditions, indicating the need for extended research across various resin systems, fiber configurations, and molding techniques. Future work should also aim to establish advanced composite design and evaluation models through detailed correlation analyses between microstructural features (e.g., void shape, spatial distribution) and mechanical behavior.
Author Contributions
Conceptualization, W.-S.C. and J.-Y.P.; methodology, W.-S.C.; investigation, W.-S.C.; data curation, W.-S.C.; writing—original draft preparation, W.-S.C.; writing—review and editing, J.-Y.P.; visualization, W.-S.C.; supervision, J.-Y.P.; project administration, W.-S.C. All authors have read and agreed to the published version of the manuscript.
Funding
This research received no external funding.
Data Availability Statement
The data that support the findings of this study are part of an ongoing work and are not available at this time.
Conflicts of Interest
The authors declare no conflict of interest.
References
- Li, Y.; Yu, C.; Wang, W.; Li, H.; Jiang, X. A review on structural failure of composite pressure hulls in deep sea. J. Mar. Sci. Eng. 2022, 10, 1456. [CrossRef]
- Eyiler, B.; Bayraktarkatal, E. Investigation of optimum structures at submarine pressure hulls under hydrostatic pressure with finite element method. J. Nav. Archit. Mar. Technol. 2024, 226, 25–35. [CrossRef]
- Babu, S.; Bandyopadhyay, S.; Debnath, A.; Kumar, S. Marine application of fiber reinforced composites: A review. J. Mar. Sci. Eng. 2020, 8, 26.
- Ertuğ, B. Advanced fiber-reinforced composite materials for marine applications. Adv. Mater. Res. 2024, 1195, 112–120.
- Mehdikhani, M.; Gorbatikh, L.; Verpoest, I.; Lomov, S.V. Voids in fiber reinforced polymer composites: formation, characteristics, and effects on mechanical performance. J. Compos. Mater. 2019, 53, 1573–1590. [CrossRef]
- Saad, A.; Echchelh, A.; Hattabi, M.; El Ganaoui, M. Review of modeling and simulation of void formation in liquid composite molding. Compos. Mech. Comput. Appl. Int. J. 2018, 9, 50–68.
- Teixidó, H.; Staal, J.; Caglar, B.; Michaud, V. Capillary effects in fiber reinforced polymer composite processing: a review. Front. Mater. 2022, 9, 809226. [CrossRef]
- Park, C.H.; Lee, W.I. Modeling void formation and unsaturated flow in liquid composite molding processes: a survey and review. J. Compos. Mater. 2011, 45, 957–977.
- Sayed, M.; et al. Void content determination of carbon fiber reinforced polymers: Stress concentration increase by a factor of up to 1.85 near the edges of the voids. Polymers 2021, 13, 685.
- Shukla, A.; Matos, J. Review of implosion design considerations for underwater composite structures. J. Mar. Sci. Eng. 2024, 12, 1468.
- Abdelal, N.; Donaldson, S.L. Comparison of methods for the characterization of voids in glass fiber composites: ultrasonic scanning, epoxy burn off, serial sectioning, and X-ray computed tomography. J. Compos. Mater. 2019, 53, 463–478.
- Wang, T.; Steensels, E.; Standaert, A.; Vallons, K.; Gorbatikh, L. Void content characterization and its impact on tensile and flexural performance of fiber reinforced composites. Compos. Sci. Technol. 2022, 217, 109132.
- Ono, K. Ultrasonic attenuation of carbon-fiber reinforced composites. J. Compos. Sci. 2023, 7, 479. [CrossRef]
- Veiga, R.; Bouville, F.; Gauvin, R.; Scazonatto, J.; Ferri, A. A review of micro-computed tomography (micro-CT) for non-destructive quantitative analysis of voids in fiber-reinforced composites. Compos. Struct. 2021, 256, 113163.
- Bourmaud, A.; Lejeune, I.; Ferrié, E.; Boisse, P. Impact of process parameters (vacuum, injection pressure, resin viscosity, curing conditions) on void content in Liquid Composite Moulding. Compos. Sci. Technol. 2020, 194, 108126.
- Juan, J.; Silva, A.; Tornero, J.A.; Gamez-Perez, J.; Salán, N. Void content minimization in vacuum infusion (VI) via effective degassing. Polymers 2021, 13, 2876.
- Sritharan, R.; Askari, D. A design of experiment study to investigate the effects of hardener concentration, stirring time, and air bubbles on the tensile strength of epoxy resin. J. Elastomers Plast. 2022, 0, 1–19. [CrossRef]
- Osborne, J.W.; Waters, E. Four assumptions of regression that research practitioners need to know. Pract. Assess. Res. Eval. 2002, 8, 1–5.
- Montgomery, D.C.; Myers, R.H.; Anderson-Cook, C.M. Response Surface Methodology: Process and Product Optimization Using Designed Experiments; Wiley: Hoboken, NJ, USA, 2016.
- Bezerra, M.A.; Santelli, R.E.; Oliveira, E.P.; Villar, L.S.; Escaleira, L.A. Response surface methodology (RSM) as a tool for optimization in analytical chemistry. Talanta 2008, 76, 965–977.
- Bayuo, J.; Abukari, M.A. Optimization using central composite design of response surface methodology for biosorption of hexavalent chromium from aqueous media. Appl. Water Sci. 2020, 10, 135. [CrossRef]
- Li, R.; Liu, R.; Yang, J.; et al. Defoaming and toughening effects of highly dispersed graphene oxide in polymer-modified cement composites. Materials 2023, 16, 7492.
Figure 1.
Comparison of void quantification results by different non-destructive techniques.: (C-scan) Ultrasonic attenuation rates measured by C-Scan for each composite specimen; (Image Analysis) Void content of composite specimens as quantified by optical microscopy image analysis; (Micro-CT) Void content of composite specimens as measured by Micro-CT analysis.
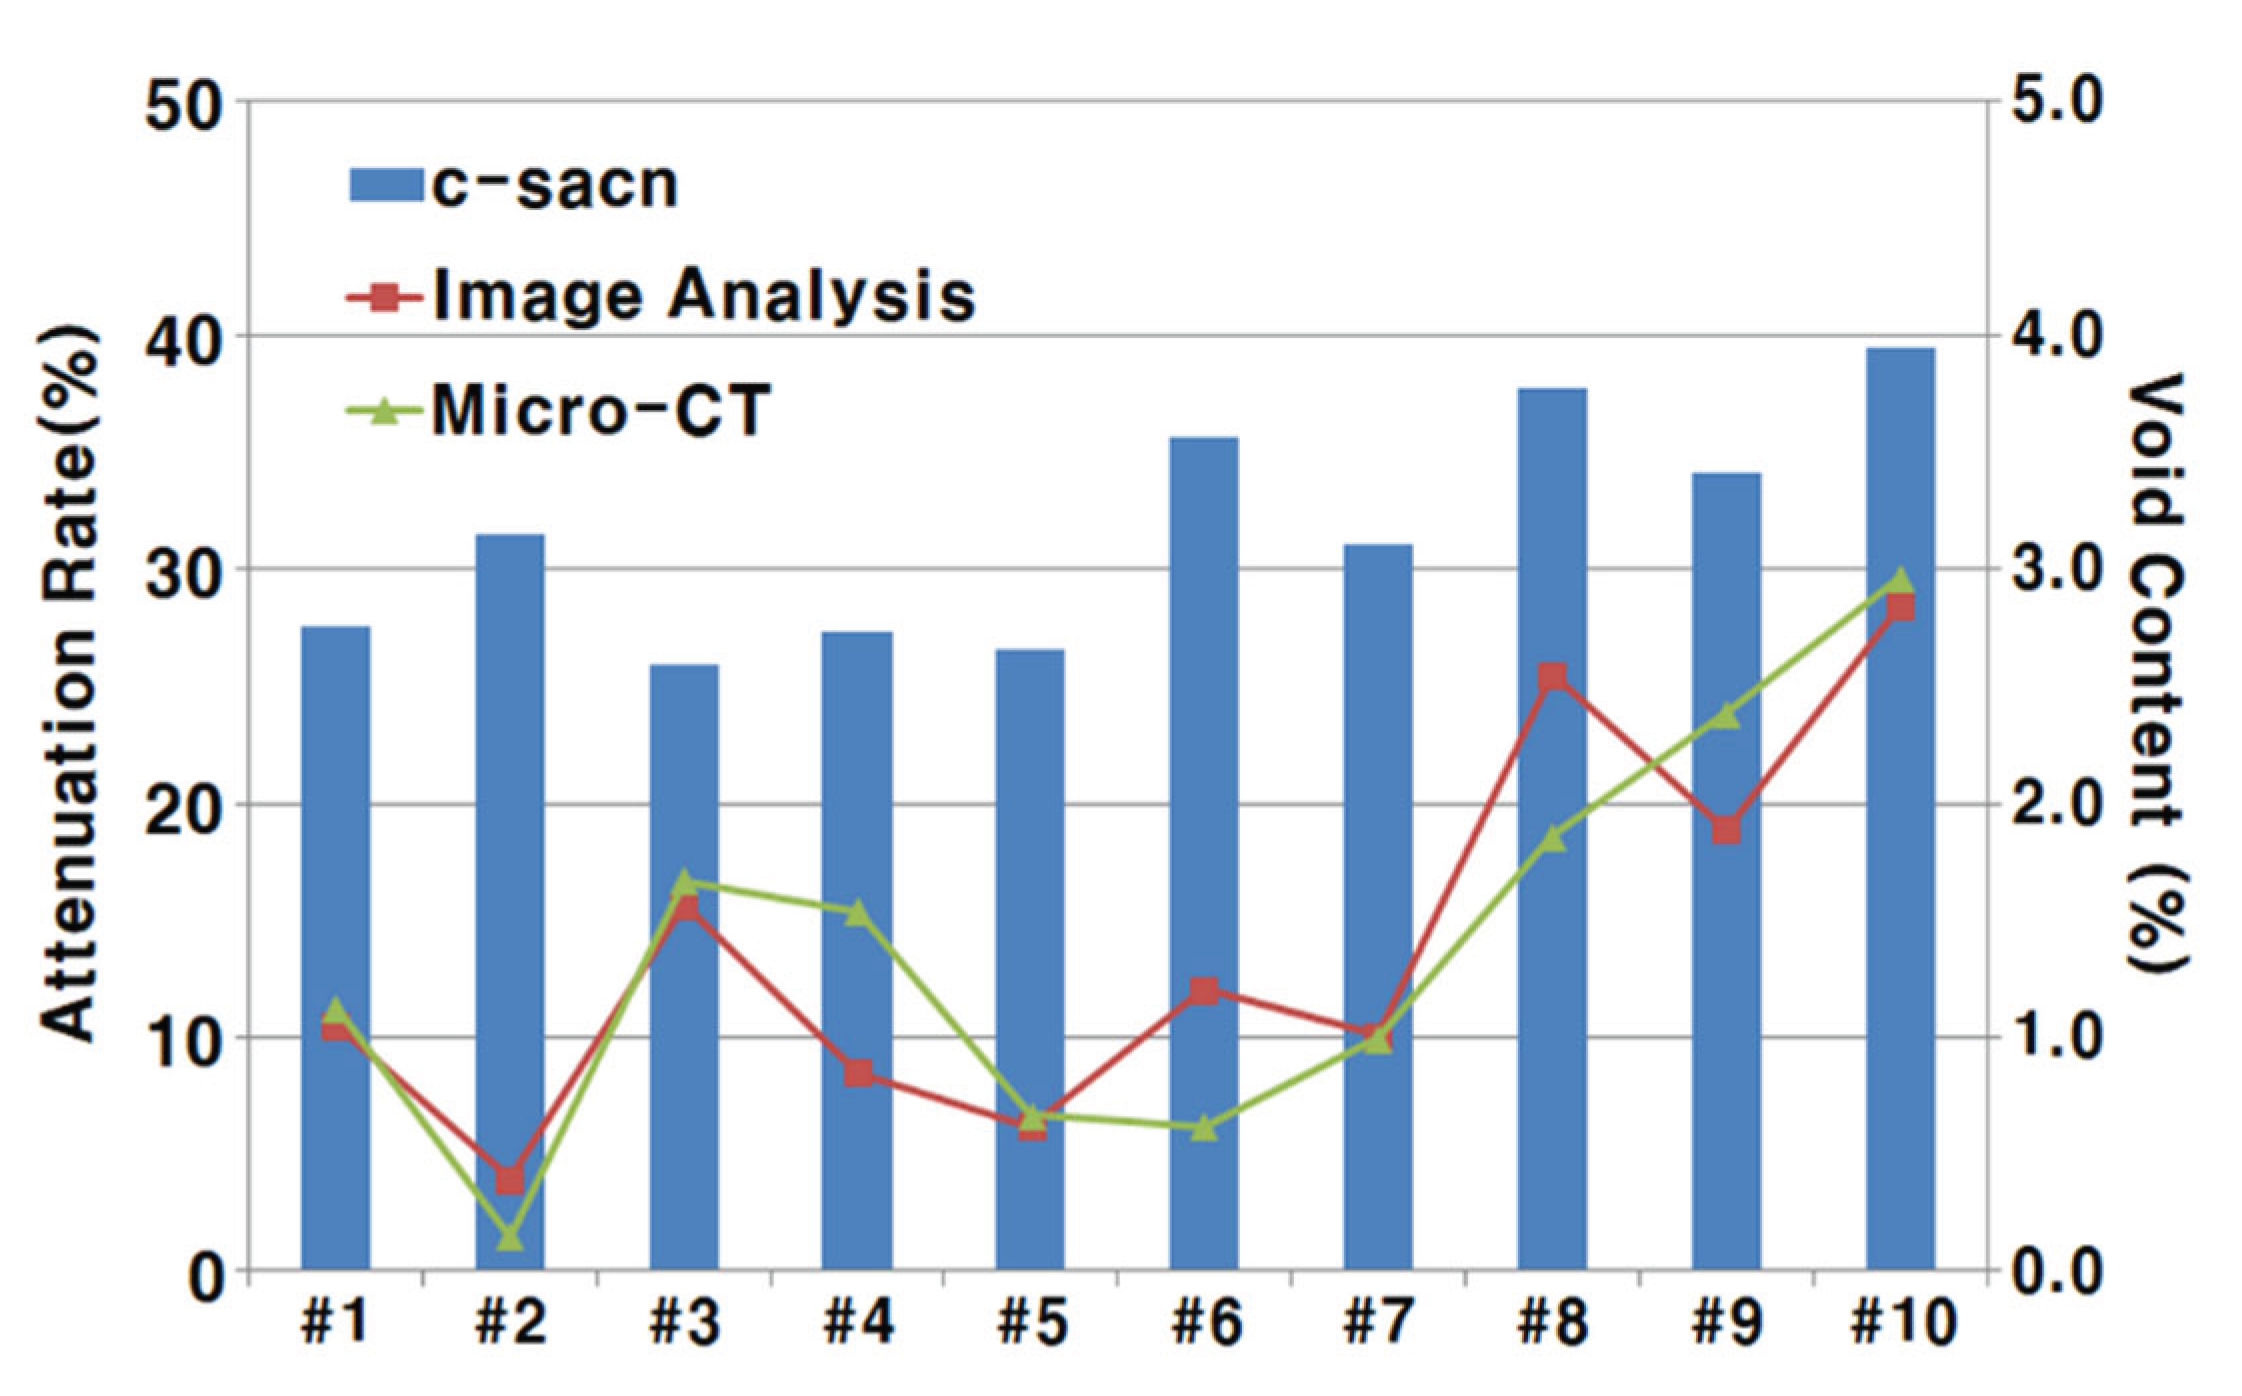
Figure 3.
Pareto chart of standardized effects illustrating the relative significance of process parameters on ultrasonic attenuation rate (%).
Figure 3.
Pareto chart of standardized effects illustrating the relative significance of process parameters on ultrasonic attenuation rate (%).
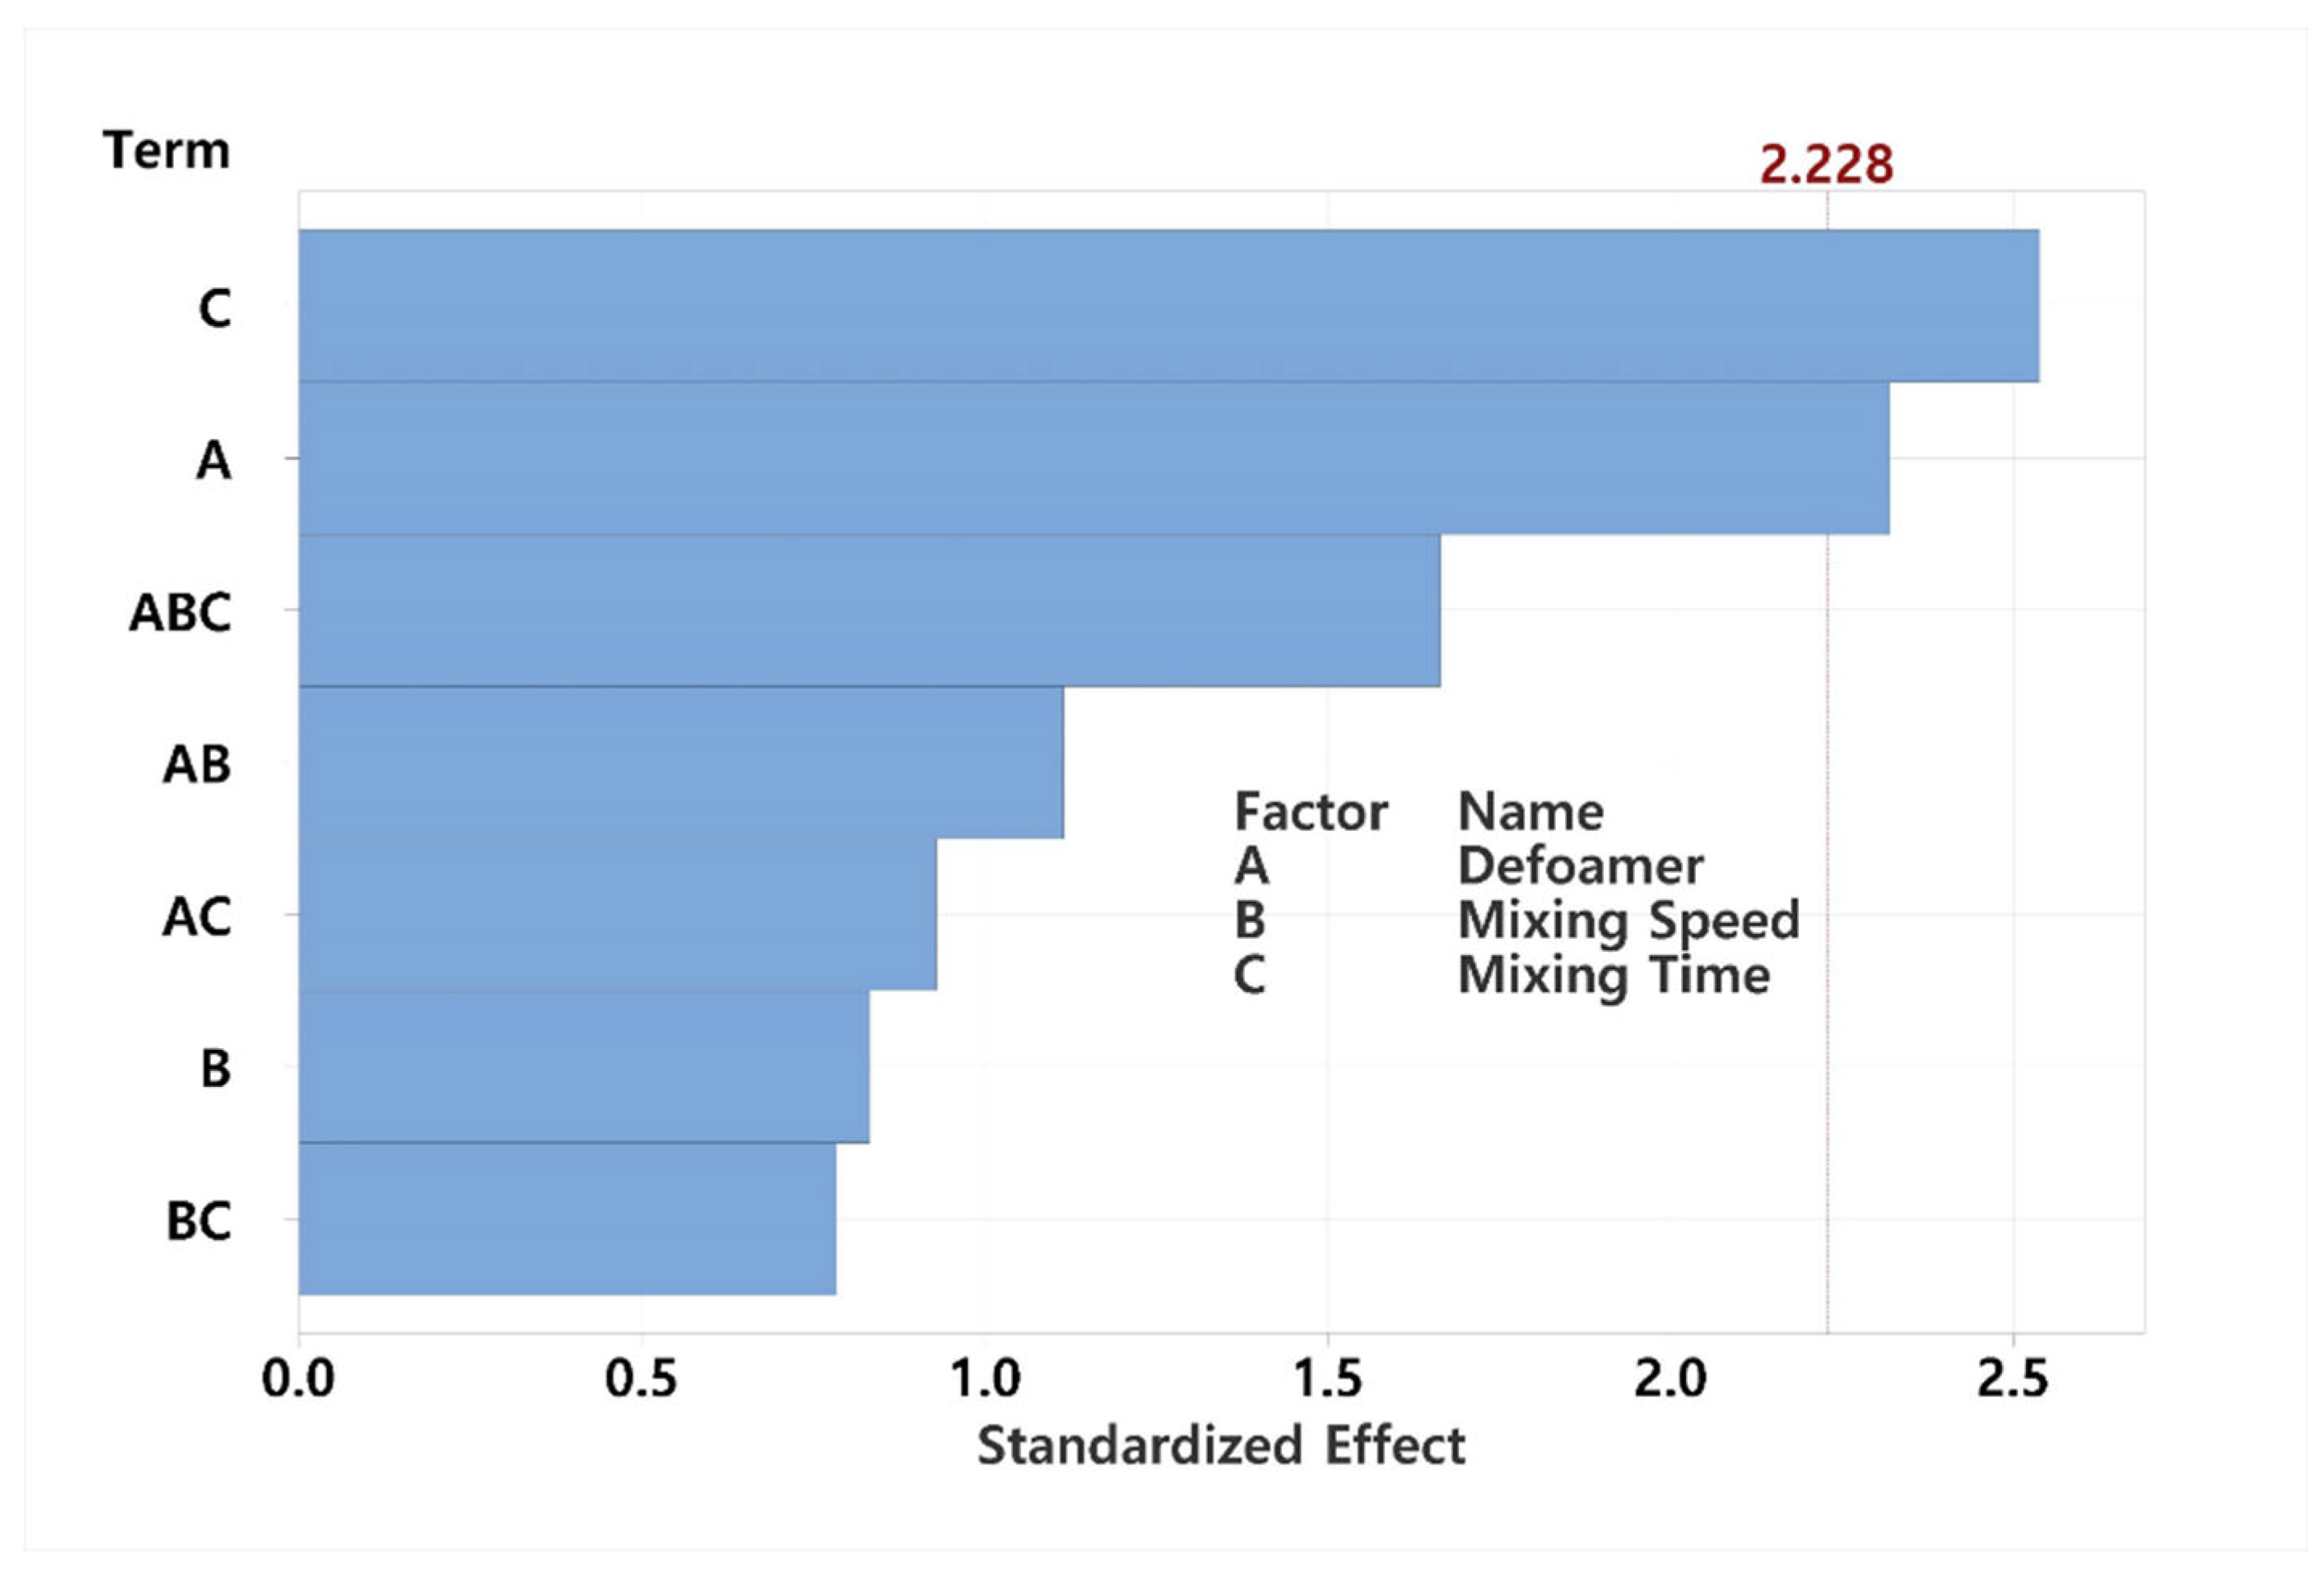
Figure 4.
Diagnostic plots for regression model residuals: (a) Normal probability plot of residuals, (b) Residuals versus observation order, (c) Residuals versus fitted values, (d) Histogram of residuals.
Figure 4.
Diagnostic plots for regression model residuals: (a) Normal probability plot of residuals, (b) Residuals versus observation order, (c) Residuals versus fitted values, (d) Histogram of residuals.
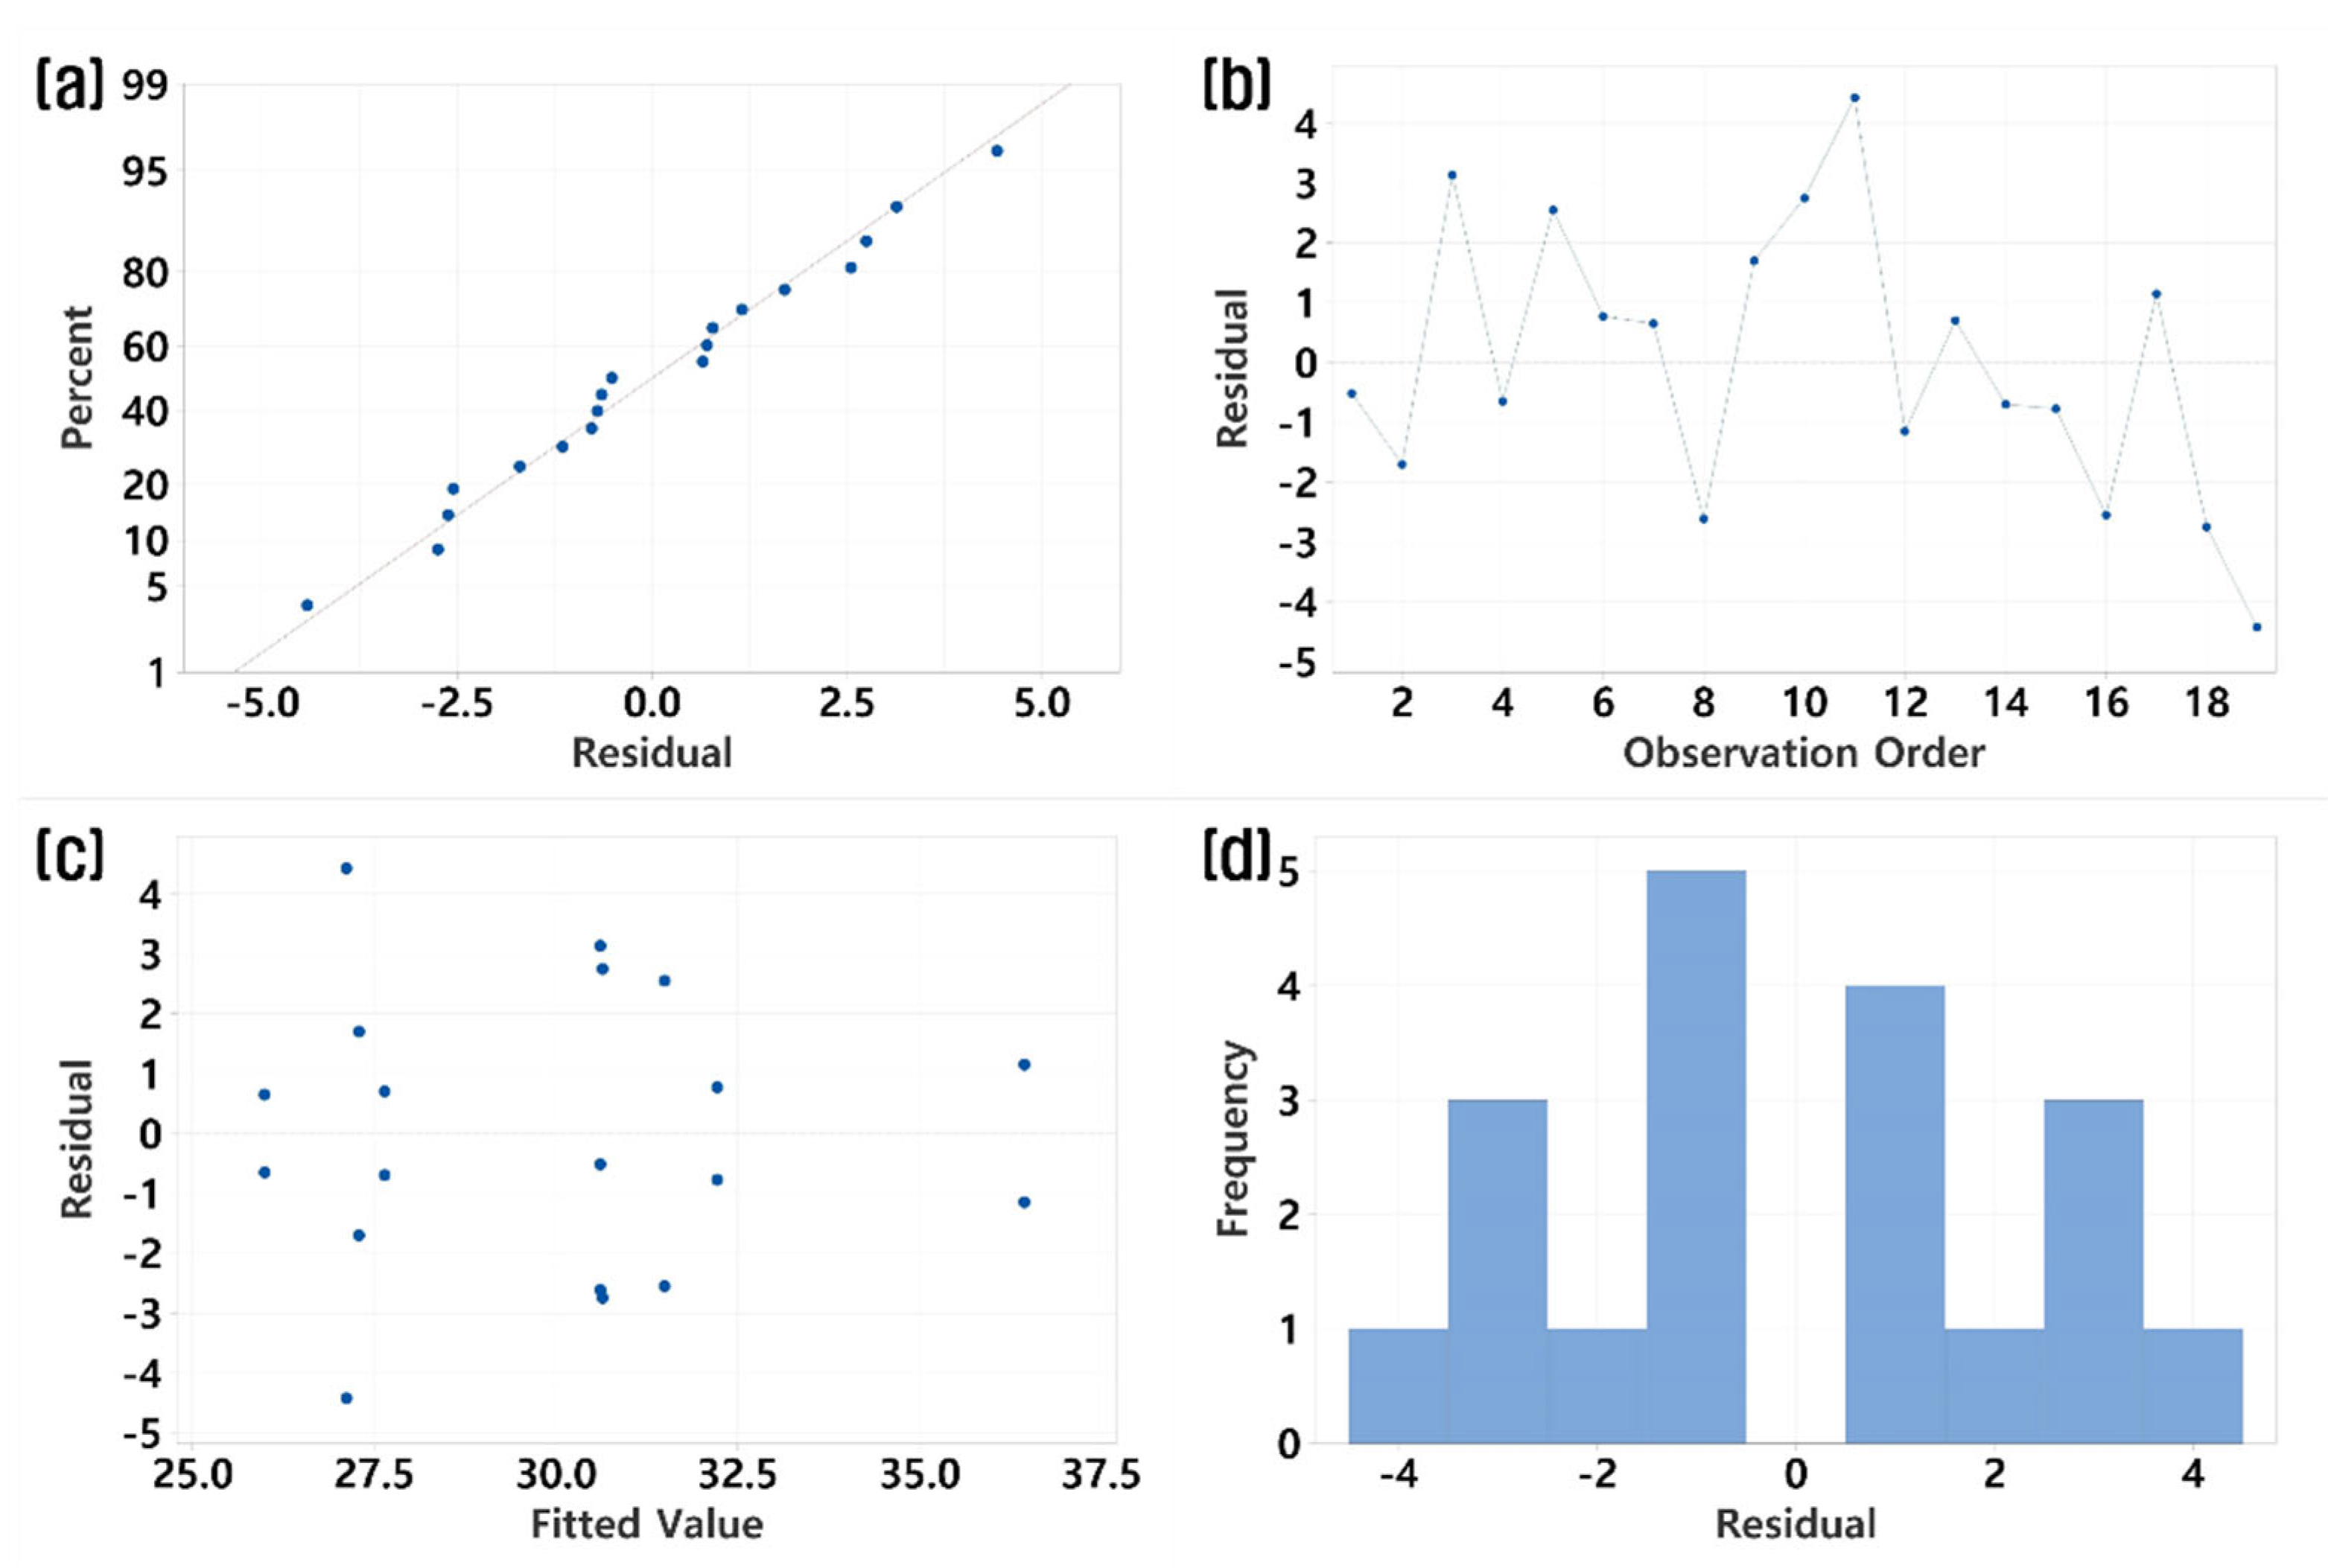
Figure 5.
Main effects plot showing the influence of defoamer concentration and mixing time on attenuation rate (%).
Figure 5.
Main effects plot showing the influence of defoamer concentration and mixing time on attenuation rate (%).
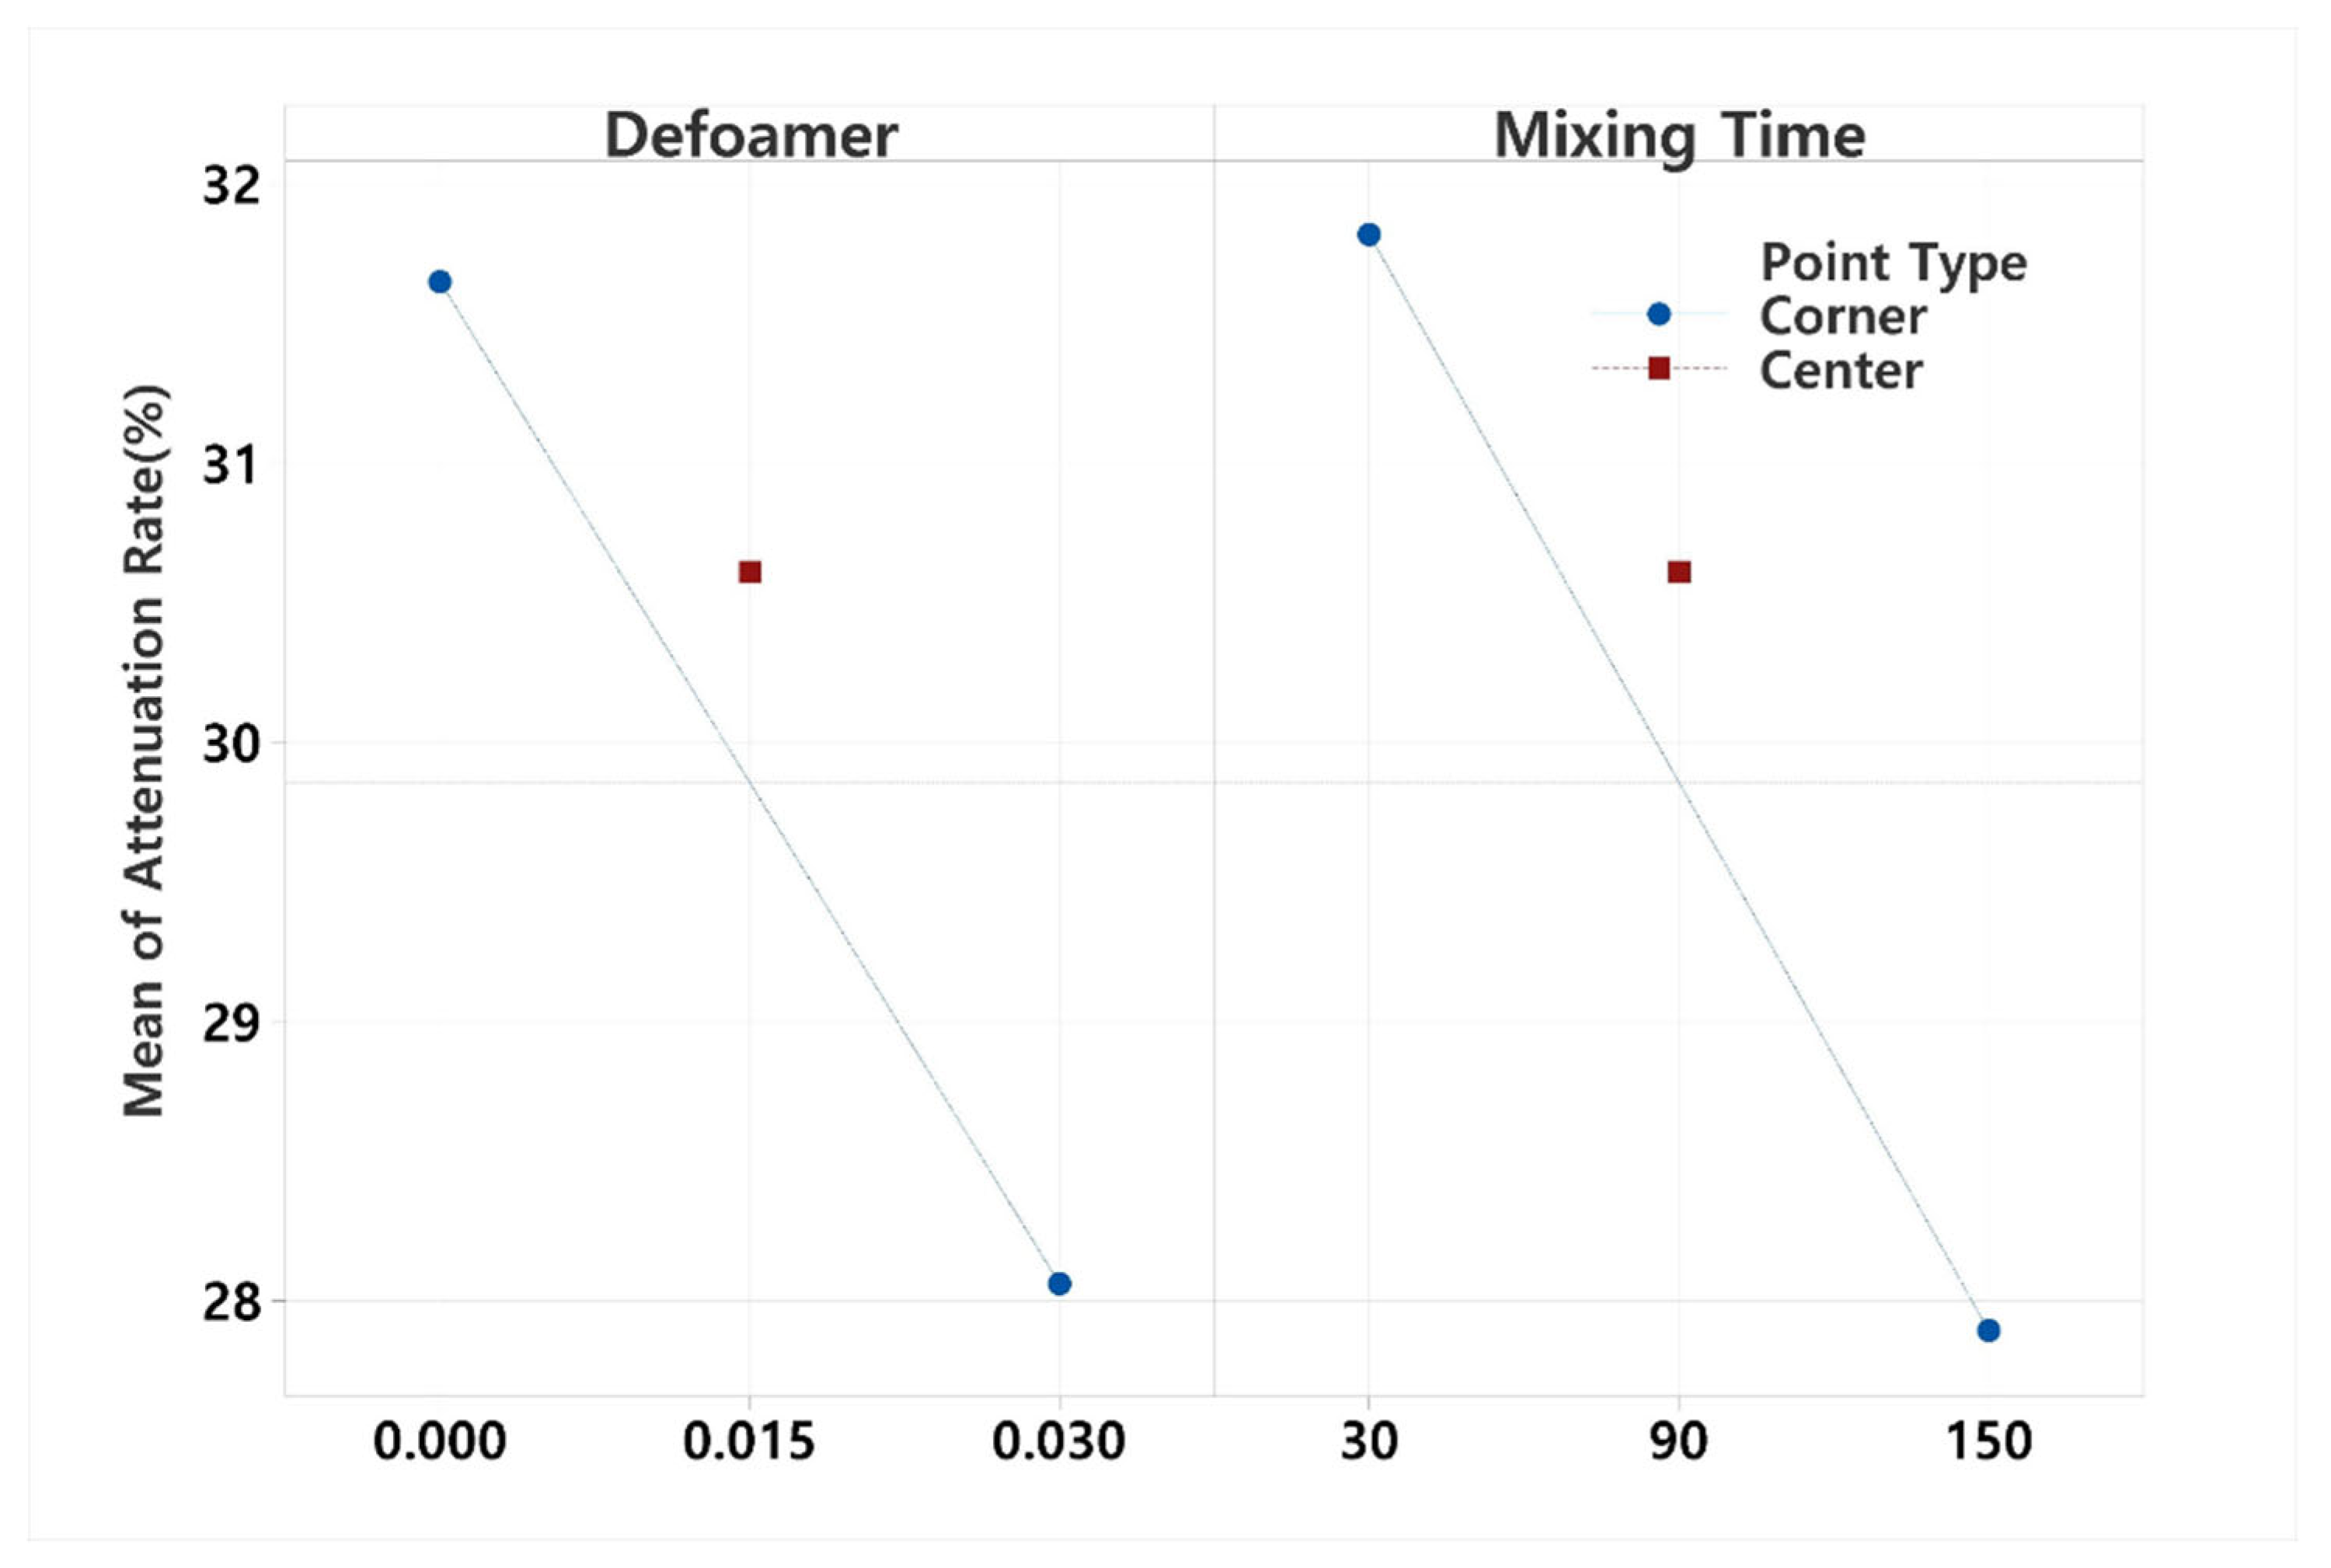
Figure 6.
Contour plot of attenuation rate (%) as a function of defoamer concentration and mixing time.
Figure 6.
Contour plot of attenuation rate (%) as a function of defoamer concentration and mixing time.
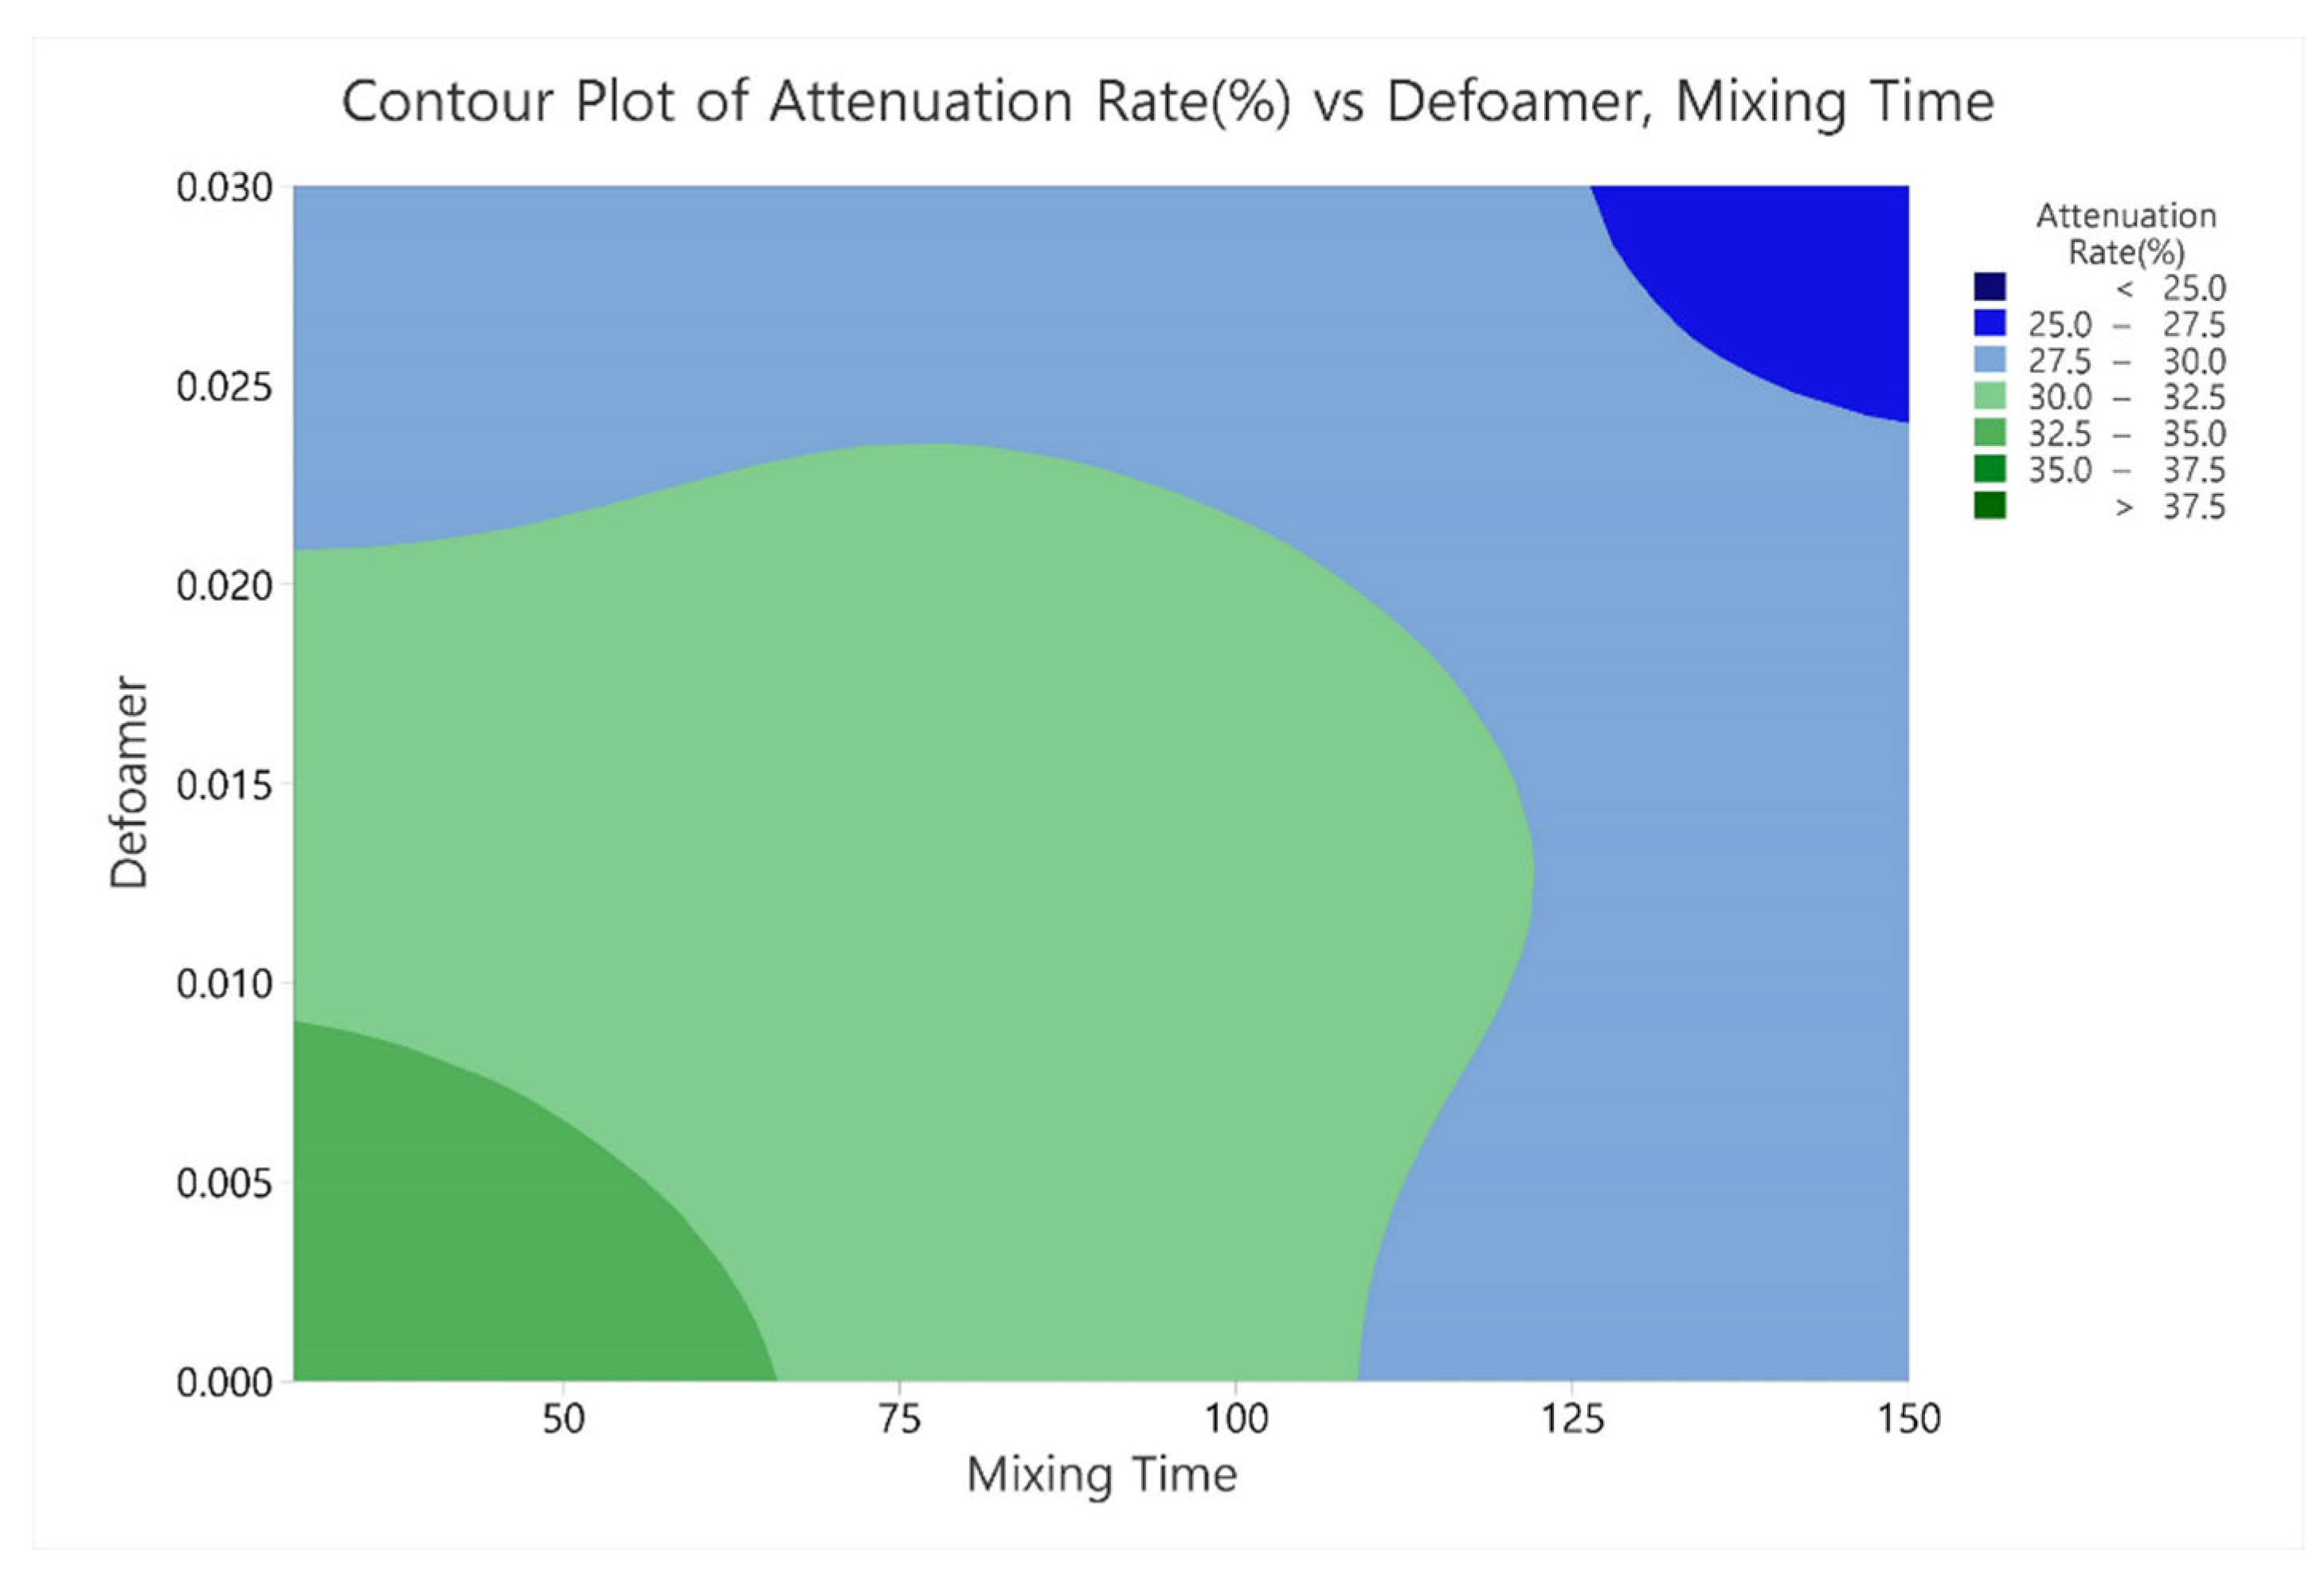
Figure 7.
Three-dimensional surface plot showing the combined effects of defoamer concentration and mixing time on ultrasonic attenuation rate (%).
Figure 7.
Three-dimensional surface plot showing the combined effects of defoamer concentration and mixing time on ultrasonic attenuation rate (%).
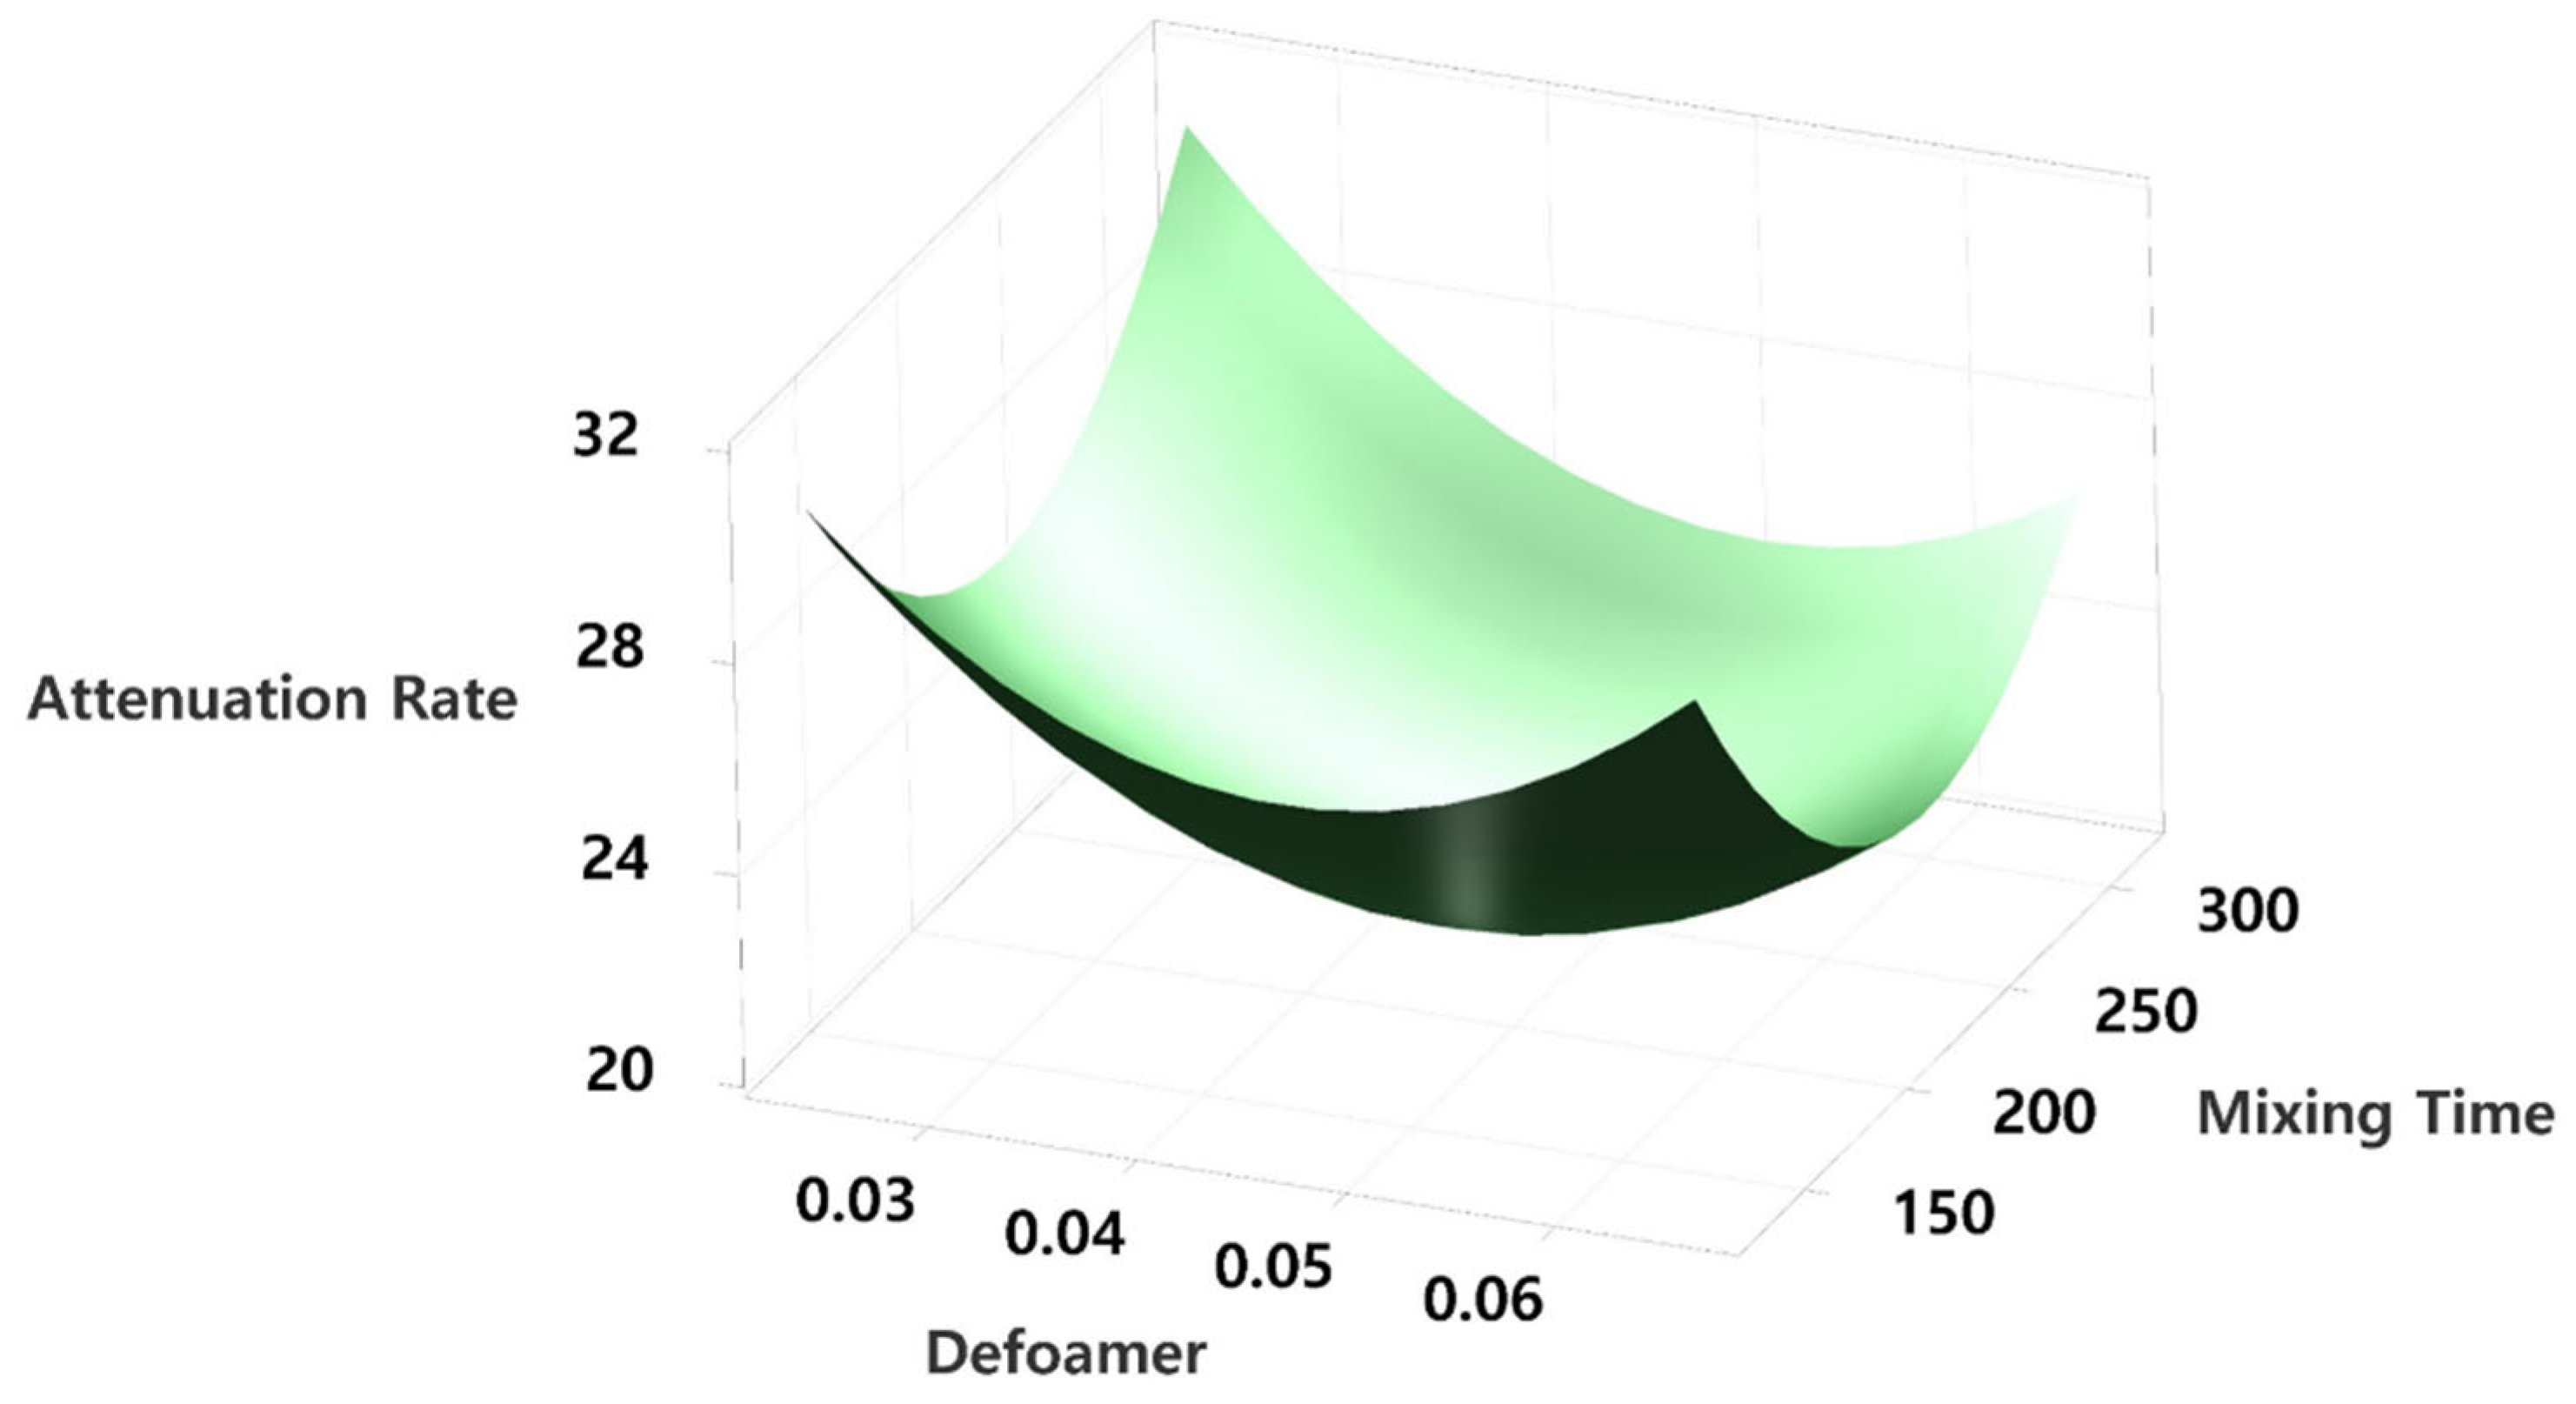
Figure 8.
Response optimization plot identifying the optimal process conditions for minimizing attenuation rate: 0.049 wt% defoamer concentration and 232 minutes of mixing time.
Figure 8.
Response optimization plot identifying the optimal process conditions for minimizing attenuation rate: 0.049 wt% defoamer concentration and 232 minutes of mixing time.
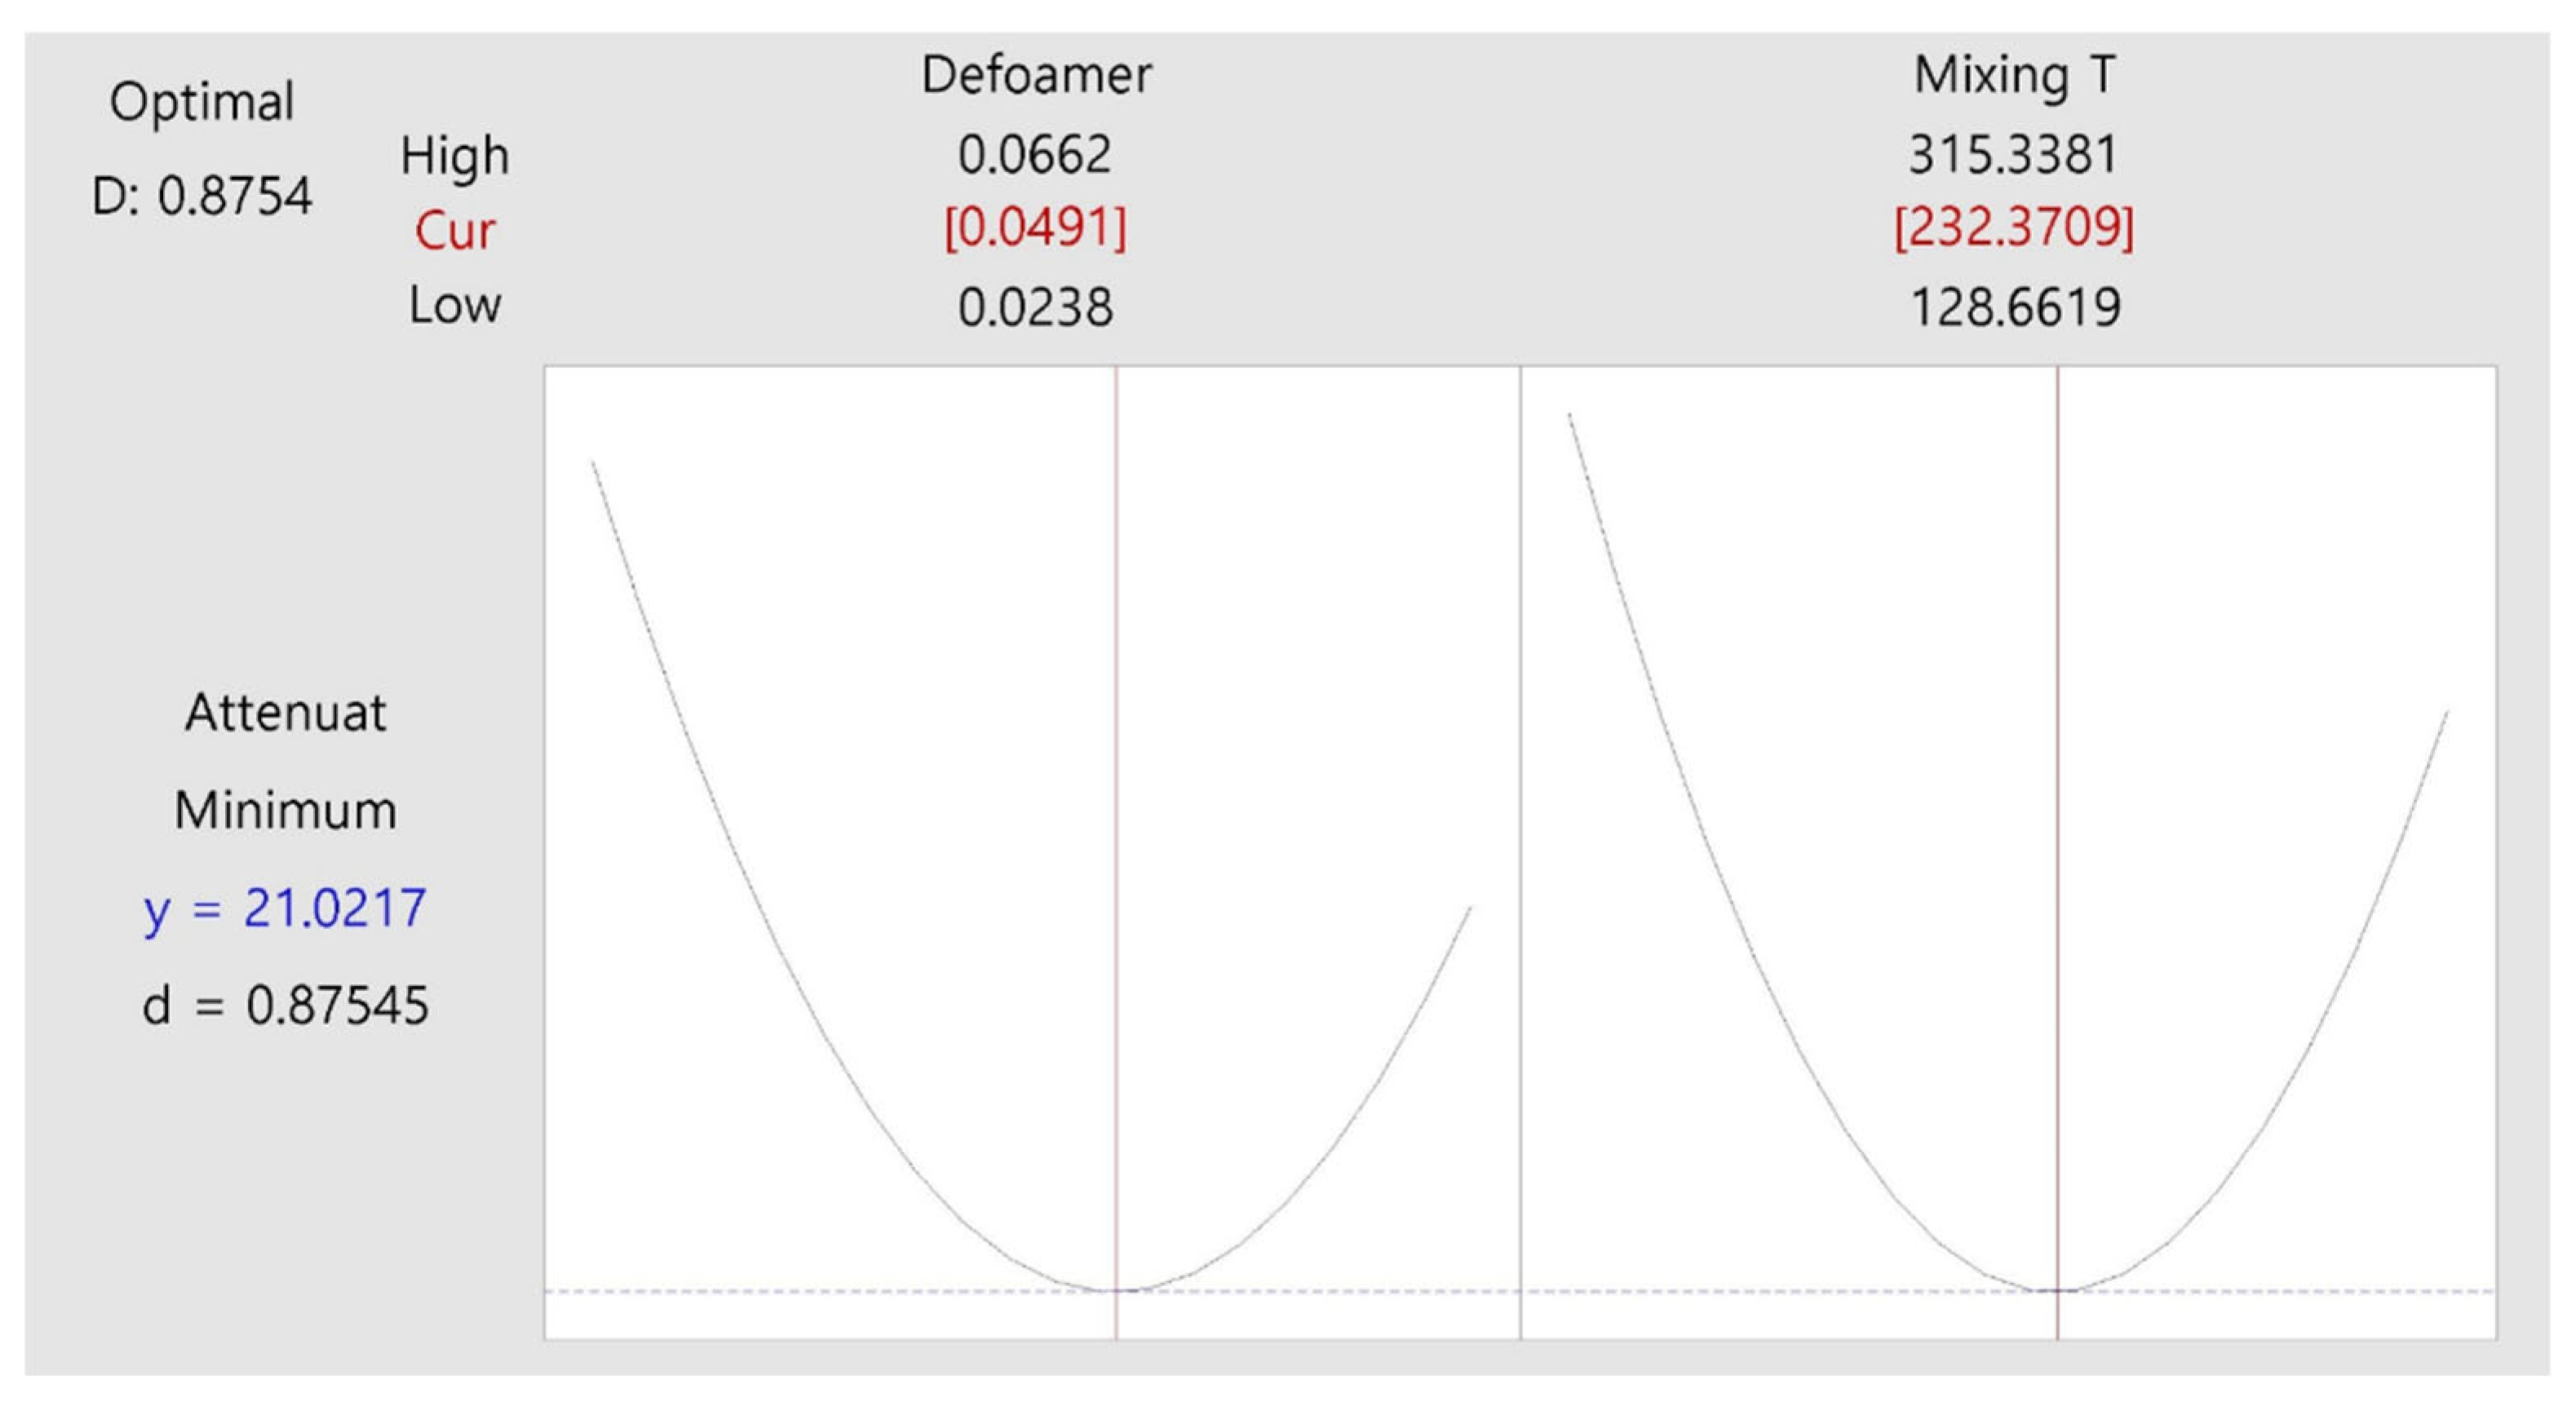
Table 2.
Pearson correlation coefficients and significance levels between void content and tensile strength for different void measurement methods.
Table 2.
Pearson correlation coefficients and significance levels between void content and tensile strength for different void measurement methods.
| Correlation | Significance level | |
|---|---|---|
| C-Scan | -0.703 | 0.023 |
| Image Analysis | -0.557 | 0.094 |
| Micro-CT | -0.508 | 0.134 |
Table 3.
Pearson correlation coefficients and significance levels between void content and flexural strength for different void measurement methods.
Table 3.
Pearson correlation coefficients and significance levels between void content and flexural strength for different void measurement methods.
| Correlation | Significance level | |
|---|---|---|
| C-Scan | -0.608 | 0.030 |
| Image Analysis | -0.610 | 0.061 |
| Micro-CT | -0.591 | 0.072 |
Table 4.
Analysis of variance (ANOVA) results for the effects of process parameters on ultrasonic attenuation rate (%).
Table 4.
Analysis of variance (ANOVA) results for the effects of process parameters on ultrasonic attenuation rate (%).
| Source | Adj SS | Adj MS | F-Value | P-Value |
|---|---|---|---|---|
| Model | 114.54 | 38.18 | 3.70 | 0.036 |
| Linear | 113.10 | 56.55 | 5.48 | 0.016 |
| Defoamer | 51.48 | 51.48 | 4.99 | 0.041 |
| Mixing Speed | 61.62 | 61.62 | 5.97 | 0.027 |
| Curvature | 1.44 | 1.14 | 0.14 | 0.714 |
| Error | 154.87 | 10.32 | ||
| Lack-of-fit | 59.20 | 11.84 | 1.24 | 0.361 |
| Pure Error | 95.67 | 9.56 | ||
| Total | 269.41 |
Table 5.
Estimated regression coefficients, t-values, and p-values for the first-order model evaluating the effects of defoamer concentration and mixing time on ultrasonic attenuation rate (%).
Table 5.
Estimated regression coefficients, t-values, and p-values for the first-order model evaluating the effects of defoamer concentration and mixing time on ultrasonic attenuation rate (%).
| Term | Effect | Coef | T-Value | P-Value |
|---|---|---|---|---|
| Constant | 29.855 | 36.90 | 0.000 | |
| Defoamer | -3.588 | -1.794 | -2.22 | 0.044 |
| Mixing Time | -3.925 | -1.962 | -2.43 | 0.029 |
| Defoamer* Mixing time |
1.437 | 0.719 | 0.89 | 0.389 |
| Ct Pt | 0.75 | 0.37 | 0.717 |
Table 6.
Experimental results from the Steepest Ascent Method showing the effect of increasing defoamer concentration and mixing time on attenuation rate (%).
Table 6.
Experimental results from the Steepest Ascent Method showing the effect of increasing defoamer concentration and mixing time on attenuation rate (%).
| StdOrder | Defoamer | Mixing Time | Attenuation Rate(%) |
|---|---|---|---|
| 1 | 0.015 | 90 | 30.8 |
| 2 | 0.030 | 156 | 25.8 |
| 3 | 0.045 | 222 | 21.4 |
| 4 | 0.060 | 288 | 21.0 |
| 5 | 0.075 | 354 | 21.6 |
| 6 | 0.090 | 420 | 20.7 |
Table 7.
Experimental matrix and attenuation rate results for response surface methodology (RSM) based on central composite design.
Table 7.
Experimental matrix and attenuation rate results for response surface methodology (RSM) based on central composite design.
| StdOrder | Defoamer | Mixing Time | Attenuation Rate(%) |
|---|---|---|---|
| 1 | 0.06 | 156 | 23.6 |
| 2 | 0.045 | 222 | 21.5 |
| 3 | 0.06 | 288 | 21.0 |
| 4 | 0.045 | 222 | 20.8 |
| 5 | 0.03 | 288 | 24.9 |
| 6 | 0.045 | 156 | 25.8 |
| 7 | 0.024 | 222 | 20.1 |
| 8 | 0.066 | 222 | 26.8 |
| 9 | 0.045 | 222 | 25.9 |
| 10 | 0.045 | 128 | 27.5 |
| 11 | 0.045 | 315 | 26.9 |
| 12 | 0.045 | 222 | 22.3 |
| 13 | 0.045 | 222 | 20.8 |
| 14 | 0.045 | 222 | 21.6 |
Disclaimer/Publisher’s Note: The statements, opinions and data contained in all publications are solely those of the individual author(s) and contributor(s) and not of MDPI and/or the editor(s). MDPI and/or the editor(s) disclaim responsibility for any injury to people or property resulting from any ideas, methods, instructions or products referred to in the content. |
© 2025 by the authors. Licensee MDPI, Basel, Switzerland. This article is an open access article distributed under the terms and conditions of the Creative Commons Attribution (CC BY) license (http://creativecommons.org/licenses/by/4.0/).
Copyright: This open access article is published under a Creative Commons CC BY 4.0 license, which permit the free download, distribution, and reuse, provided that the author and preprint are cited in any reuse.


