1. Introduction
Diabetic retinopathy (DR), a common diabetes complication, is a leading cause of vision loss [
1,
2] expected to affect 160 million people by 2045. [
3] Timely detection of disease can prevent 98% of vision loss, hence routine annual or biennial DR screening is typically recommended. [
4,
5] However, half of First Nations Australians and one-quarter of other Australians did not meet screening recommendations in a national survey and screening rates were lower in remote areas [
6] which have higher proportions of First Nations people and increasing diabetes prevalence. [
7,
8,
9] A recent study reported a diabetes prevalence of 29% in remote First Nations Australians and this was >50% among those ≥45 years, [
8] almost six times higher than the national prevalence. [
7] Barriers to DR screening in these remote areas include a lower ophthalmology and optometry workforce, needing to travel significant distances to access eye care, [
2] and in primary care, high staff turnover and lengthy waits for screening results. [
10] Deep learning systems (DLSs), a type of artificial intelligence, require minimal staff training and in conjunction with automated cameras may overcome these barriers to provide equitable screening access in remote regions and prevent vision loss.
DLSs can detect DR with sufficient accuracy, have potential for cost-saving and may be of particular value in remote settings with limited health service access. [
11,
12] In Australia, using a universal DLS-based DR screening program was estimated to save AU
$595.8 million over 40 years [
11]. However, few DLSs for DR have been trained or validated on Indigenous peoples internationally. [
13,
14,
15,
16] Notably, Google Health’s Automated Retinal Disease Assessment (ARDA) [
17] has outperformed retinal specialist grading in First Nations Australians. [
13] ARDA has been Conformité Européene-marked, but Australian regulatory approval has not yet been sought. Thirona RetCAD [
18] and EyRIS SELENA+ [
19] have multiple regulatory approvals including Therapeutic Goods Administration approval in Australia, yet neither have been validated on First Nations people specifically. DLSs require validation in the population where they are to be used to ensure adequate performance, especially when comprised of minority populations not sufficiently represented in the training dataset for the DLS development. [
20] Data distribution differences between training and validation datasets can potentially lead to a marked drop in DLS performance. [
21,
22] As such, DLS performance should be assessed in real-world settings, and for First Nations Peoples before implementation. No Australian study has directly compared the performance of multiple DLSs on the same population. A direct real-world comparison of multiple DLSs can be valuable to illustrate differences in performance so the most appropriate tool for that population can be implemented. Therefore, the aim of this study was to prospectively compare the performance of multiple DLSs, to detect referrable DR in a remote Western Australian real-world setting.
2. Materials and Methods
A mobile service delivered by Lions Outback Vision in consultation with First Nations communities, provided DR screening to people living in the Pilbara region of Western Australia between February and August 2024 with facilities previously described. [
23] Those who attended DR screening, with any diabetes type, were eligible to participate. Diabetes status was based on patient self-report.
Participants had single-field colour fundus photographs centered on the macula captured using an automated table-top camera, Topcon Maestro 2 (Topcon Healthcare, Tokyo, Japan), with images uploaded to a viewing platform (Topcon Harmony) where two integrated DLSs, Thirona RetCAD
TM (v2.2.0) and EyRIS SELENA+ (v1.7.0) were used to synchronously grade retinal images at the point of care. Images were graded by Google ARDA retrospectively in batches, as software was unavailable to integrate ARDA into the viewing platform for real-time use. All three DLSs are based on convolutional neural networks
. [
24,
25,
26] There was no recalibration nor fine-tuning of these DLSs prior to use in the study, with a categorical result given by each, not a prediction score. SELENA+ output stated whether there was referable DR or non-referable DR, but did not give DR severity. Both RetCAD
TM and ARDA outputs gave the DR severity. Due to the real-world nature of this research, participants’ pupils were only dilated as necessary. To ensure adequate clinician oversight, when the DR screener was not a clinician, images were reviewed by an on-call doctor at the time of screening and on-the-spot telehealth consultation was provided for patients with referable disease, or at patient request.
The color fundus photographs were independently graded by two ophthalmologists (YS and SB) according to the The International Clinical Diabetic Retinopathy and Diabetic Macular Edema Disease Severity Scale. [
27] Any images where there were discrepancies were independently adjudicated by a retinal specialist (VS). This grading formed the reference standard. Referable DR was defined as moderate non-proliferative diabetic retinopathy (NPDR) or worse. Vision-threatening DR was defined as severe non-proliferative DR or proliferative DR.
2.1. Development of the DLSs
ARDA was developed on approximately 130,000 images from the US and India and initially validated on approximately 10,000 images from EyePACS-1 and Messidor-2 datasets. [
24] RETCAD
TM has been validated on multiple datasets including Messidor, Messidor 2 and a private dataset according to their White Paper, yet the initial training set is not clear. [
26] SELENA+ was developed in Singapore using 76,370 images from their national DR screening program and internally validated on 70,000 different photographs, also from the screening program. [
25] External validation comprised 40,000 photographs from many countries, but mostly comprising people of Chinese ethnicity. [
25]
2.2. Ethical Approval
The research project was supported by the Pilbara Aboriginal Health Alliance and approved by the Western Australian Aboriginal Health Ethics Committee (HREC1294). All participants included gave written informed consent. People with diabetes were invited to undergo the DLS-assisted DR screening as part of a clinical service regardless of whether they gave consent to use their data for research purposes.
2.3. Statistical Analysis
Sample size analysis showed that 173 images would be required, based on an expected sensitivity of 90% and specificity of 85%, estimated prevalence of referable DR of 20% and precision of ±10%. [
28] Data are presented as number (percentage) for categorical variables and mean ± standard deviation for normally distributed continuous variables. To assess the performance of the DLSs sensitivity, specificity, diagnostic accuracy, negative predictive value (NPV) and positive predictive value (PPV), excluding images deemed ungradable by the DLSs, were calculated using ophthalmologists’ grading as the reference standard. Additionally, the performance of the three DLSs was calculated classifying images deemed ungradable by the DLSs as referable DR. The performance of ARDA and RetCAD
TM to assess vision-threatening DR was also assessed.
To determine if there was a significant difference between the results of the different DLSs and the reference standard, Cochran’s Q, an extension of McNemar’s test, was used. [
29] Firstly, this was used to compare referable DR versus non-referable DR between the ophthalmology grading and the three DLSs and secondly comparing misclassification (true positives and true negatives versus false positives and false negatives) between the three DLSs. Where this was significant, a post-hoc Dunn test with Bonferroni correction identified significant differences between the different DR grading systems. Results with p-value or adjusted p-value <0.05 were considered significant.
3. Results
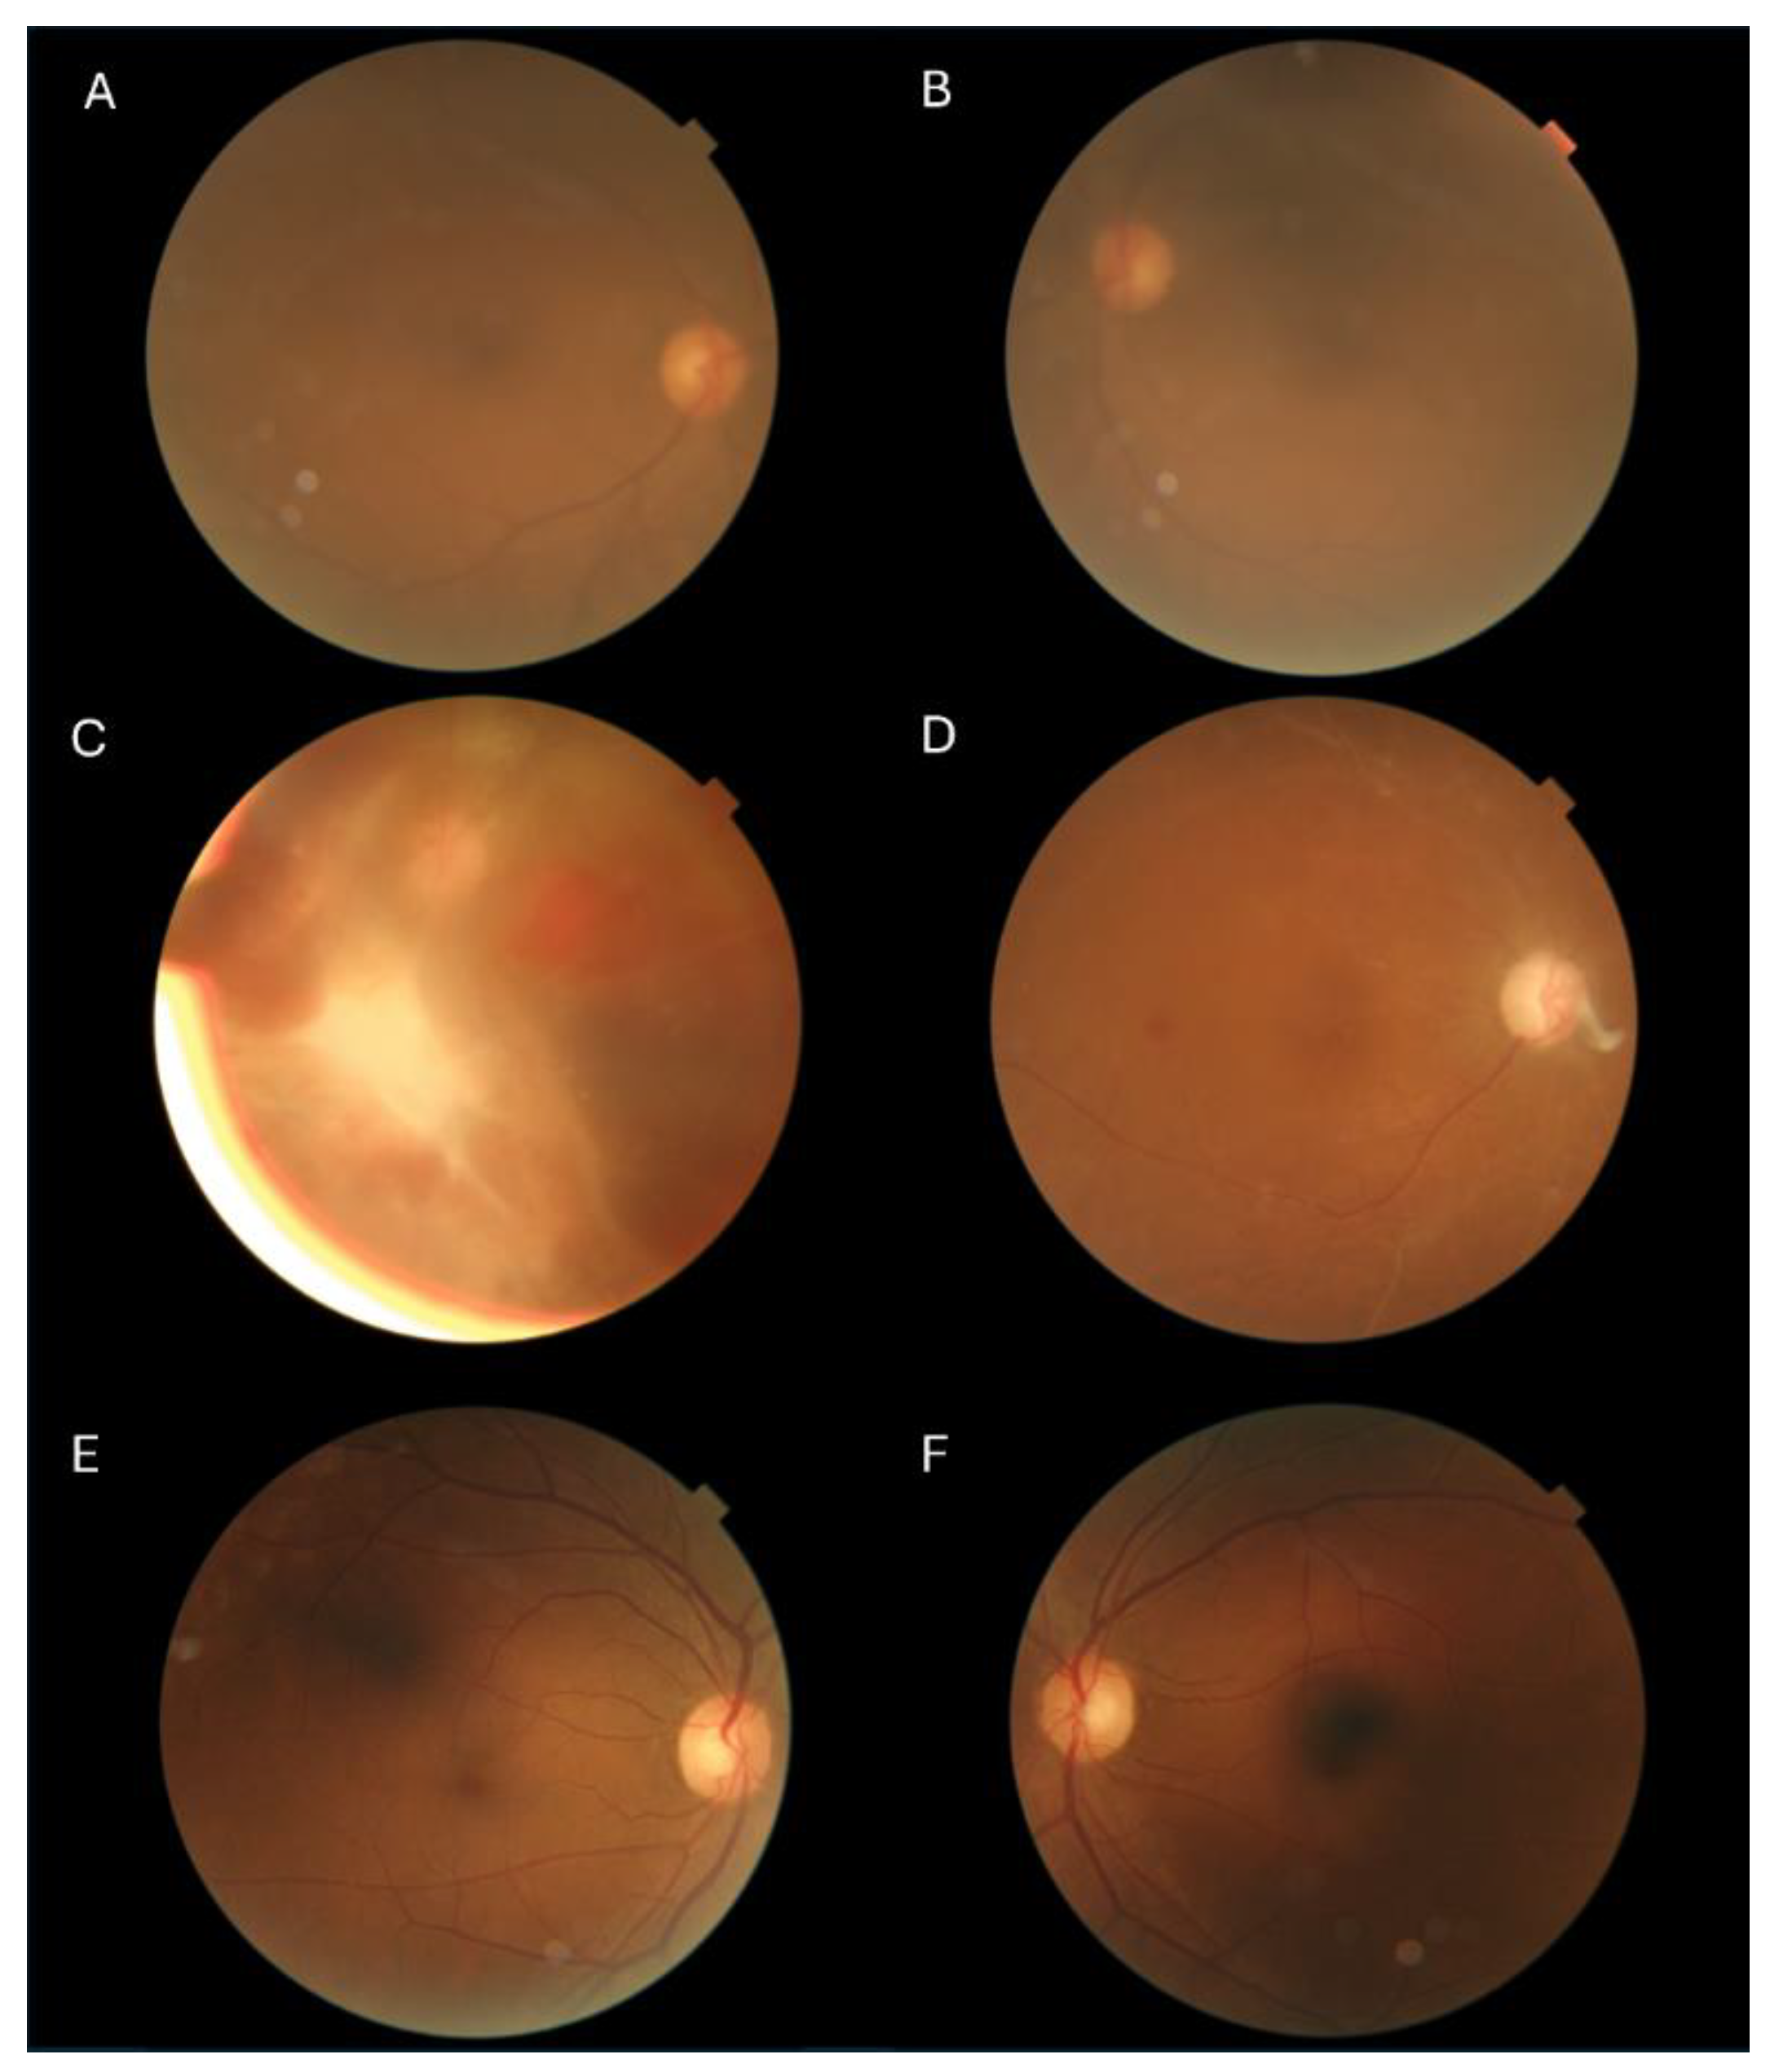
Across six communities, there were 94 people included in the study. Of these, 48 (51.1%) were male, 66 (70.2%) identified as First Nations and the mean ± SD age was 60.3 ± 12.0 years at the time of screening. Ophthalmologist grading of the 188 colour fundus photographs determined 135 (71.8%) images had no referrable DR (121 (64.4%) with no DR and 14 (7.4%) with mild NPDR) and 39 (20.7%) images had referrable DR (26 (13.8%) with moderate NPDR, 6 (3.2%) with severe NPDR and 7 (3.7%) with PDR). There were 14 (7.4%) ungradable images, which were excluded from analysis. There was substantial agreement between the two main graders (kappa=0.71).
ARDA had 100% (95% CI: 91.03-100%) sensitivity overall and therefore 100% NPV, while maintaining specificity of 94.81% (89.68-97.47%) (see
Table 1). RetCAD
TM had high sensitivity and specificity of 97.37% (86.50-99.53%) and 97.01% (92.58-98.83%), respectively. SELENA+ had sensitivity of 91.67% (78.17-97.13%) and specificity of 80.80% (73.02-86.74%). ARDA had a high proportion of gradable images, giving a DR grade for all the images deemed gradable by the ophthalmologists, only four of the 188 images (2.1%) were ungradable. Some examples of differences in gradability of images by the ophthalmologists and the DLSs are shown in
Figure 1. ARDA classified seven images as referable DR that were non-referable. There were two images with referable DR that RetCAD
TM classified as non-referrable and ungradable. RetCAD
TM classified four images as referable that were non-referable. The diagnostic accuracy for all DLSs was preserved or improved in First Nations Australians (
Table 1). For non-First Nations, the sensitivity was 100% for all DLSs, however there were only two with referable DR (
Table 1).
There was a significant difference between the DLSs overall for grading for referable DR vs non-referable DR, based on the Cochran’s Q test (p<0.001). The ophthalmology grading (reference standard) was not statistically different to RetCADTM and ARDA grading, nor was there a significant difference between RetCADTM and ARDA grading (adjusted p≥0.415). However, the ophthalmology grading, RetCADTM and ARDA were significantly different to SELENA+ (adjusted p≤0.002). Additionally, there was an overall difference in misclassification between the DLSs (p<0.001) with post-hoc tests showing no significant differences between RetCADTM and ARDA but both of these were different to SELENA+ (adjusted p<0.001).
When including the ungradable images from the DLSs as referable DR, there was an increase in sensitivity and decrease in specificity and diagnostic accuracy in both RetCAD
TM and SELENA+, as shown in
Table 2. When assessing detection of vision-threatening DR in those with diabetes, ARDA had sensitivity of 92.31% (95% CI: 66.69-98.63%) and specificity of 97.52% (93.79-99.03%) and RetCAD
TM results were 91.67% (64.61-98.51%) and 96.25% (92.06-98.27%), respectively.
4. Discussion
In a remote Australian population with a high proportion of First Nations people, ARDA correctly identified all patients with referable DR. This is the first Australian study to compare multiple DLSs for DR on the same real-world study population and showed that without any modification or finetuning to the DLSs, RetCAD
TM and ARDA detected referable DR and vision-threatening DR with both sensitivity and specificity ≥94.8%. These results were statistically significantly different to SELENA+. While the accuracy was generally high across all three DLSs, there was variation in sensitivity, specificity and gradability underlining the importance of validating DLSs prior to implementation to determine which may be the most appropriate for that setting. Our study highlights that DLSs can be successfully used for DR screening prospectively in a remote Australian setting, providing further evidence to support implementation. Utilising this technology may improve access to DR screening in remote settings, improve health equity and reduce the risk of vision loss. [
4,
30,
31]
ARDA and RetCAD
TM had similar results to other international validation studies, yet SELENA+ had lower performance. ARDA had a sensitivity/specificity of 100% (95%CI: 91.03-100%)/94.81% (89.68-97.47%) which is improved or consistent with previous validation studies from India and Thailand that reported sensitivities between 89-98% and specificities between 92-95%. [
32,
33] In the current study, RetCAD
TM had a sensitivity/specificity of 97.37% (86.50-99.53%)/97.01% (92.58-98.83%), which is more similar to studies evaluating later versions of RetCAD
TM, with sensitivities between 95-97% and specificities 92-94% (version 2) [
34,
35] than earlier versions with sensitivities of 84-86% and specificities of 92-93% (version 1), [
36,
37] but none assessed the same version (v2.2.0) used in this study. SELENA+ had a sensitivity of 91.67% (78.17-97.13%) which is comparable to other studies, however the specificity of 80.80% (73.02-86.74%) was lower than previously reported. The primary validation of SELENA+ for referable DR yielded a sensitivity of 90.5% and specificity of 91.6%. [
25] SELENA+ was also validated on 4504 retinal images of Zambians with a sensitivity of 92.25% and specificity of 89.04% for referable DR, including macular oedema. [
38] Of note, the dataset used to train SELENA+ comprised a large proportion of Chinese people, [
25] while our study had a large population of First Nations Australians, as such, ethnic bias may explain differences in performance.
Australian studies validating the performance of DLSs have shown reasonably good performance. Optain (previously Eyetelligence), DAPHNE and CSIRO’s Dr Grader have reported both sensitivity and specificity over 90%. [
14,
16,
39] However, Optain had lower performance when only assessing First Nations peoples. [
15,
16] Dr Grader also showed 100% sensitivity but there were only two cases of referable DR in the sample and specificity was lower than Thirona and ARDA. [
39] Similar to the current study, DAPHNE was validated on 393 images from First Nations peoples living in remote Australia, yet it used different outcomes of any DR and proliferative DR, [
14] which may not be as useful for a population screening tool, where those with moderate NPDR or worse are typically referred to ophthalmology. ARDA has previously been validated on an urban First Nations population, using 1682 images, with a sensitivity of 98.0% and specificity of 95.1% for more than mild DR. [
13] ARDA has now been validated in both urban and remote First Nations populations and has high sensitivity, suggesting fewer positive cases would be missed if used for a DR screening program.
Establishment of screening programs requires consideration of diagnostic sensitivity and specificity trade-off. [
40] A higher sensitivity would mean that fewer true-positive referable DR cases would be missed, but that more false-positive cases would be referred to ophthalmology. Conversely an increase in specificity would result in fewer unnecessary referrals, but higher number of missed referrable DR cases. Although ARDA had highest sensitivity and RetCAD
TM had highest specificity, both these DLSs had high sensitivity and high specificity, with similar diagnostic accuracy. When determining which tool to use the population needs should be considered. Minimising false-positives may be preferred for rural or remote areas for patients facing significant travel and costs to access ophthalmology services and many patients for few clinicians. [
41] For those who attend regular annual or biennial DR screening, it is unlikely that a false-negative would result in vision loss prior to the next screening. [
42] However, where recommended DR screening adherence is low, such as in remote Australian settings, [
6] it is possible that missing a case of referrable DR could result in vision loss before the next opportunity for DR screening, especially in the context of other risk factors, for example suboptimal glycaemic control. [
42] In these cases, ARDA may be better suited. In practice, a hybrid system, incorporating human ‘over-reading’ prior to a specialist review may mitigate unnecessary referral burden. [
43]
An ungradable image in a real-world setting would likely result in a referral to ophthalmology or a repeat visit, which decreased DLS specificity and leads to greater unnecessary referrals. Ideally a DLS would be able to grade an image that is of sufficient quality for an ophthalmologist to grade, yet this nuance is not always reported. In the current study, ARDA was able to grade all images deemed gradable by the ophthalmologists, while two were ungradable by RetCADTM. In contrast, almost 13% of all images were ungradable by SELENA+ and 54% of these ungradable images were gradable by ophthalmologists. Proportion of gradable images, and gradability in comparison to a human grader should also be considered prior to implementing DLS-assisted DR screening.
4.1. Strengths and Limitations
The strengths of this study include the real-world design, comparison of multiple DLSs on a population with a high proportion of First Nations people and images graded by an ophthalmologist adjudication panel. By assessing three DLSs simultaneously, the diagnostic performance metrics demonstrate pertinent differences to consider prior to implementation. However, limitations of the study include that diabetes status relied on self-report and consistent with other similar studies, diabetes type was not ascertained, [
13,
16,
24,
35,
36,
39] which may introduce misclassification bias. As expected with the real-world nature of the study, there was inconsistent dilation, which may have contributed to more ungradable images. Furthermore, by using single-field retinal images it is possible that some DR was not detected. This study did not specifically assess diabetic macular oedema from the retinal photographs, as this is not reported by RetCAD
TM or SELENA+. While we had sufficient sample size to analyse performance of the DLSs in First Nations, only two people of other Australian ethnicity had referable DR. A greater sample size would have resulted in smaller confidence interval widths. The Pilbara region of Australia is unique, hence results may not be generalisable to other settings.
4.2. Conclusions
In a remote real-world study comprising majority First Nations people, DLSs had high sensitivity and specificity for detecting referable DR. Direct real-world comparison is useful to guide implementation, particularly when the population comprises minority groups. As DLS are not widely adopted, research focussed on addressing implementation barriers is needed. Point-of-care DR screening using DLSs may improve DR screening rates and potentially improve health equity and prevent vision loss when paired with appropriate referral and treatment pathways.
Author Contributions
JJD assisted with project design, writing the protocol, data analysis, data interpretation and wrote the first draft of the manuscript. QL assisted with writing the protocol, data collection, data interpretation. KW ensured the project was culturally appropriate, conducted stakeholder meetings, assisted with study design and data interpretation. ED assisted with project design, writing the protocol, research coordination and data interpretation. YZ assisted with data interpretation. SB, YS and VS assisted with diabetic retinopathy grading and data interpretation. PAK assisted with study design and data interpretation. AWT was the principal investigator on the study, assisted with design, stakeholder engagement, securing funding, coordination, and data interpretation. All authors reviewed and edited the manuscript.
Funding
: This activity was supported by the Western Australian Future Health Research and Innovation Fund, Grant ID DoH202310626/1. The funders had no role in study design, data collection, analysis or reporting.
Data Availability Statement
Data available on reasonable request from the corresponding author. Data are not publicly available due to confidentiality restrictions.
Acknowledgments
We would like to acknowledge the contribution of Aboriginal communities in the Pilbara for welcoming our staff into their communities, attending consultation meetings and participating in the project. We specifically acknowledge Jigalong, Wakathuni, Bellary Springs, Bindi Bindi as well as the Aboriginal communities within Newman, Tom Price, Paraburdoo, Onslow. We would like to acknowledge the unwavering local support of our WA / Pilbara regional partners: Puntukurnu Aboriginal Medical Service, Mawarnkarra Health Service, Royal Flying Doctor Service, Nintirri Centre, Karratha Central Healthcare, Aboriginal Health Council of Western Australia, Diabetes WA, WA Country Health Service, IBN Group, Panaceum Pilbara, Jigalong Community Inc., Ashburton Aboriginal Corporation, Gumala Aboriginal Corporation and Yinhawangka Aboriginal Corporation. We would like to equally acknowledge the in-kind support of our technology partners: Thirona RetCADTM, EyRIS, Topcon Healthcare and Optomed. The DLSs were provided without cost and these partners did not have any involvement with the study design, data collection, analysis or reporting.
Conflicts of Interest
The authors declare that they have no conflict of interest.
References
- Bourne RRA, Jonas JB, Flaxman SR, et al. Prevalence and causes of vision loss in high-income countries and in Eastern and Central Europe: 1990–2010. Br J Ophthalmol. 2014;98(5): 629-638. [CrossRef]
- Australian Institute of Health and Welfare. Indigenous eye health measures 2021. AIHW 261. Canberra: Australian Institute of Health and Welfare; 2021. Accessed 20 January 2025. https://www.aihw.gov.au/reports/indigenous-australians/indigenous-eye-health-measures-2021.
- Teo ZL, Tham YC, Yu M, et al. Global prevalence of diabetic retinopathy and projection of burden through 2045: Systematic review and meta-analysis. Ophthalmology. 2021;128(11): 1580-1591. [CrossRef]
- Wong TY, Sun J, Kawasaki R, et al. Guidelines on diabetic eye care: The International Council of Ophthalmology recommendations for screening, follow-up, referral, and treatment based on resource settings. Ophthalmology. 2018;125(10): 1608-1622. [CrossRef]
- Mitchell P, Foran S, Wong T, Chua B, Patel I, Ojaimi E. Guidelines for the management of diabetic retinopathy. National Health and Medical Research Council; 2008:1-183.
- Foreman J, Keel S, Xie J, Van Wijngaarden P, Taylor HR, Dirani M. Adherence to diabetic eye examination guidelines in Australia: The National Eye Health Survey. Med J Aust. 2017;206(9): 402-406. [CrossRef]
- Australian Institute of Health and Welfare. Diabetes: Australian facts. Canberra: Australian Institute of Health and Welfare; 2023. Accessed 26 August 2024. https://www.aihw.gov.au/reports/diabetes/diabetes.
- White C, Seear K, Anderson L, Griffiths E. Use of a primary care dataset to describe ‘the real picture’ of diabetes in Kimberley Aboriginal communities. Journal of the Australian Indigenous HealthInfoNet. 2024;5(1). [CrossRef]
- Australian Bureau of Statistics. 2021 census Aboriginal and/or Torres Strait Islander people quickstats. Australian Bureau of Statistics,; 2021. Accessed 25 August 2024. https://abs.gov.au/census/find-census-data/quickstats/2021/IQS51002.
- Khou V, Khan MA, Jiang IW, Katalinic P, Agar A, Zangerl B. Evaluation of the initial implementation of a nationwide diabetic retinopathy screening programme in primary care: A multimethod study. BMJ Open. 2021;11(8): e044805. [CrossRef]
- Hu W, Joseph S, Li R, et al. Population impact and cost-effectiveness of artificial intelligence-based diabetic retinopathy screening in people living with diabetes in Australia: A cost effectiveness analysis. eClinicalMedicine. 2024;67. [CrossRef]
- Joseph S, Selvaraj J, Mani I, et al. Diagnostic accuracy of artificial intelligence-based automated diabetic retinopathy screening in real-world settings: A systematic review and meta-analysis. Am J Ophthalmol. 2024;263: 214-230. [CrossRef]
- Chia MA, Hersch F, Sayres R, et al. Validation of a deep learning system for the detection of diabetic retinopathy in Indigenous Australians. Brit J Ophthalmol. 2023: bjo-2022-322237. [CrossRef]
- Quinn N, Brazionis L, Zhu B, et al. Facilitating diabetic retinopathy screening using automated retinal image analysis in underresourced settings. Diabetic Med. 2021;38(9): e14582. [CrossRef]
- Scheetz J, Koca D, McGuinness M, et al. Real-world artificial intelligence-based opportunistic screening for diabetic retinopathy in endocrinology and Indigenous healthcare settings in Australia. Sci Rep. 2021;11(1): 15808. [CrossRef]
- Li Z, Keel S, Liu C, et al. An automated grading system for detection of vision-threatening referable diabetic retinopathy on the basis of color fundus photographs. Diabetes Care. 2018;41(12): 2509-2516. [CrossRef]
- Google Health.. Using AI to prevent blindness. Accessed 19 February 2025. https://health.google/caregivers/arda/.
- Thirona Retina. Artificial intelligence for high performance eye disease screening. Accessed 19 February 2025. https://retcad.eu/.
- EyRIS. Revolutionizing the detection of eye diseases. Accessed 19 February 2025. https://www.eyris.io/index.cfm.
- Arora A, Alderman JE, Palmer J, et al. The value of standards for health datasets in artificial intelligence-based applications. Nat Med. 2023;29(11): 2929-2938. [CrossRef]
- Ktena I, Wiles O, Albuquerque I, et al. Generative models improve fairness of medical classifiers under distribution shifts. Nat Med. 2024;30(4): 1166-1173. [CrossRef]
- Yang Y, Zhang H, Gichoya JW, Katabi D, Ghassemi M. The limits of fair medical imaging AI in real-world generalization. Nat Med. 2024;30(10): 2838-2848. [CrossRef]
- Li Q, Drinkwater JJ, Woods K, Douglas E, Ramirez A, Turner AW. Implementation of a new, mobile diabetic retinopathy screening model incorporating artificial intelligence in remote Western Australia. Aust J Rural Health. 2025;33(2): e70031. [CrossRef]
- Gulshan V, Peng L, Coram M, et al. Development and validation of a deep learning algorithm for detection of diabetic retinopathy in retinal fundus photographs. JAMA. 2016;316(22): 2402-2410. [CrossRef]
- Ting DSW, Cheung CY-L, Lim G, et al. Development and validation of a deep learning system for diabetic retinopathy and related eye diseases using retinal images from multiethnic populations with diabetes. JAMA. 2017;318(22): 2211-2223. [CrossRef]
- RetCAD version 2.2 White paper. .Accessed May 12, 2025. https://delft.care/retcad/. 2023.
- Wilkinson CP, Ferris FL, Klein RE, et al. Proposed international clinical diabetic retinopathy and diabetic macular edema disease severity scales. Ophthalmology. 2003;110(9): 1677-1682. [CrossRef]
- Arifin WN. Sample size calculator (web). http://wnarifin.github.io.
- Al-Jawabreh A, Dumaidi K, Ereqat S, et al. A comparison of the efficiency of three sampling methods for use in the molecular and conventional diagnosis of cutaneous leishmaniasis. Acta Tropica. 2018;182: 173-177. [CrossRef]
- Ibrahim H, Liu X, Zariffa N, Morris AD, Denniston AK. Health data poverty: An assailable barrier to equitable digital health care. Lancet Digit Health. 2021;3(4): e260-e265. [CrossRef]
- Wolf RM, Channa R, Liu TYA, et al. Autonomous artificial intelligence increases screening and follow-up for diabetic retinopathy in youth: The ACCESS randomized control trial. Nat Commun. 2024;15(1): 421. [CrossRef]
- Ruamviboonsuk P, Tiwari R, Sayres R, et al. Real-time diabetic retinopathy screening by deep learning in a multisite national screening programme: A prospective interventional cohort study. Lancet Digit Health. 2022;4(4): e235-e244. [CrossRef]
- Gulshan V, Rajan RP, Widner K, et al. Performance of a deep-learning algorithm vs manual grading for detecting diabetic retinopathy in India. JAMA Ophthalmol. 2019;137(9): 987-993. [CrossRef]
- Piatti A, Rui C, Gazzina S, et al. Diabetic retinopathy screening with confocal fundus camera and artificial intelligence - assisted grading. Eu J Ophthalmol. 2024: 11206721241272229. [CrossRef]
- Meredith S, van Grinsven M, Engelberts J, et al. Performance of an artificial intelligence automated system for diabetic eye screening in a large English population. Diabet Med. 2023;40(6): e15055. [CrossRef]
- Taylor JR, Drinkwater J, Sousa DC, Shah V, Turner AW. Real-world evaluation of retcad deep-learning system for the detection of referable diabetic retinopathy and age-related macular degeneration. Clin Exp Optom. 2024: 1-6. [CrossRef]
- Skevas C, Weindler H, Levering M, Engelberts J, van Grinsven M, Katz T. Simultaneous screening and classification of diabetic retinopathy and age-related macular degeneration based on fundus photos-a prospective analysis of the RetCAD system. Int J Ophthalmol. 2022;15(12): 1985-1993. [CrossRef]
- Bellemo V, Lim ZW, Lim G, et al. Artificial intelligence using deep learning to screen for referable and vision-threatening diabetic retinopathy in Africa: A clinical validation study. Lancet Digital Health. 2019;1(1): e35-e44. [CrossRef]
- Kanagasingam Y, Xiao D, Vignarajan J, Preetham A, Tay-Kearney M-L, Mehrotra A. Evaluation of artificial intelligence–based grading of diabetic retinopathy in primary care. JAMA Network Open. 2018;1(5): e182665-e182665. [CrossRef]
- Chu K. An introduction to sensitivity, specificity, predictive values and likelihood ratios. Emerg Med. 1999;11(3): 175-181. [CrossRef]
- Cheung R, Ly A. A survey of eyecare affordability among patients seen in collaborative care inAaustralia and factors contributing to cost barriers. Public Health Res Pract. 2024;34(2):e3422415. [CrossRef]
- Drinkwater JJ, Kalantary A, Turner AW. A systematic review of diabetic retinopathy screening intervals. Acta Ophthalmologica. 2024;102(4): e473-e484. [CrossRef]
- Ta AWA, Goh HL, Ang C, Koh LY, Poon K, Miller SM. Two Singapore public healthcare AI applications for national screening programs and other examples. Health Care Sci. 2022;1(2): 41-57. [CrossRef]
|
Disclaimer/Publisher’s Note: The statements, opinions and data contained in all publications are solely those of the individual author(s) and contributor(s) and not of MDPI and/or the editor(s). MDPI and/or the editor(s) disclaim responsibility for any injury to people or property resulting from any ideas, methods, instructions or products referred to in the content. |
© 2025 by the authors. Licensee MDPI, Basel, Switzerland. This article is an open access article distributed under the terms and conditions of the Creative Commons Attribution (CC BY) license (http://creativecommons.org/licenses/by/4.0/).