
Submitted:
19 December 2025
Posted:
22 December 2025
You are already at the latest version
Abstract
On-road vehicles are a primary source of urban air pollution. It is known that high-emitting vehicles represent a fraction of the fleet but contribute significantly to the total emissions. Usually, road transportation emission inventories do not capture the impact of these types of vehicles, underestimating emissions. This study introduces a simple method to refine vehicle emission inventories by incorporating data from Ecuador's Inspection and Maintenance (I/M) program. We analyzed I/M data from Quito to develop a correction factor for the Vehicular Emissions INventory (VEIN) model, accounting for the higher emissions from vehicles that fail inspection. Our analysis shows that while less than 10% of gasoline and 20% of diesel vehicles failed inspection, their emissions were substantially higher; for instance, accounting for reproved vehicles produced 60% more CO, 18% more NMVOC, 40% more PM2.5, and 34% more PM10 . These findings demonstrate that incorporating I/M data is crucial for accurately quantifying vehicular pollution. The proposed methodology offers a way to create more accurate emission estimates, providing a tool for policymakers to manage air quality.
Keywords:
vehicle emissions
; air pollution
; emission inventory
; high-emitting vehicles
; Inspection and Maintenance (I/M)
; Ecuador
; VEIN model
; carbon monoxide (CO)
; hydrocarbons (HC)
1. Introduction
On-road vehicles are a dominant source of air pollution, particularly in urban environments where traffic density is high [1]. The exhaust from cars, trucks, and buses releases a mixture of harmful pollutants that have been linked to significant public health issues, including respiratory and cardiovascular diseases [2,3]. Vehicle inspection and maintenance (I/M) programs are a critical strategy for mitigating the impact of road transport on air quality [4,5]. These programs, implemented in many cities worldwide, mandate periodic checks to ensure vehicles comply with established safety and environmental standards. A primary function of I/M programs is to identify vehicles with high emission levels and require necessary repairs, thereby reducing the overall tailpipe emissions of carbon monoxide (CO), Hydrocarbons (HC), nitrogen oxides (NOX), and particulate matter (PM). Recent studies have validated the effectiveness of I/M programs utilizing On-Board Diagnostics (OBD) and on-board sensing. Jiang et al. (2021) [21] demonstrated that repairing Heavy-Duty Vehicles (HDVs) based on OBD fault codes resulted in NOx reductions of 46–81% and opacity reductions of 43%. Also, Li et al. (2023) [22] utilized on-board sensors to characterize sediment hauling trucks, finding that low Selective Catalytic Reduciton (SCR) temperatures significantly hampered NOX conversion efficiency. The effectiveness of I/M programs is rooted in their ability to address the deterioration of emission control systems that occurs over time with vehicle use. Indeed, the purpose is to enforce emission standards on the circulating fleet, contributing to cleaner air in urban areas.
A key challenge in managing vehicular pollution is the disproportionate impact of a small fraction of “high-emitting” vehicles, which can be responsible for approximately half of all harmful pollutants emitted by the entire fleet [6,20]. These high emitters are often older or poorly maintained vehicles whose pollution control systems are malfunctioning, although other reasons including poor manufacture, contaminated fuel and even tampering may contribute [10]. Although emission inventory models like the Vehicular Emissions INventory (VEIN), which often use emission factor databases such as the COmputer Programme to calculate Emissions from Road Transport (COPERT), provide essential, large-scale estimates of vehicular pollution, they may not fully capture the real-world emissions from these high-polluting vehicles [7,8]. Therefore, incorporating data from on-the-ground I/M programs is crucial for refining these models and obtaining a more accurate characterization of a region’s emissions profile.
In Ecuador, the vehicle Periodical Technical Inspection and Maintenance (I/M) program, is a mandatory regulatory framework designed to ensure that motor vehicles meet minimum safety and emission standards. The program is under the Resolution 925-ANT-DIR-2019 for Vehicle Technical Inspection Regulations in Ecuador [9]. The annual inspection is mandatory for all vehicles older than two years. The IM evaluates technical aspects, including pollutant emissions, concentrations of CO and HC, mileage, and safety characteristics, affecting gasoline and diesel vehicles. Vehicles that meet all inspection criteria receive a certificate of compliance. If deficiencies are detected, a conditional certificate is issued, requiring corrective repairs and reinspection with up to four attempts permitted. Persistent non-compliance results in the banning of vehicles from circulation. Despite their comprehensive scope, I/M programs around the world exhibit limited effectiveness in detecting and addressing high emitter vehicles, which are often responsible for a disproportionate share of urban air pollution [10].
Ecuador is a country with a growing vehicle fleet and faces significant air quality challenges, particularly in its densely populated urban centers like Quito and Guayaquil [11]. In 2021, Ibarra-Espinosa et al. [7] used the VEIN model to characterize vehicular emissions on a national scale, providing valuable baseline information. As detailed in the accompanying manuscript, these studies relied on COPERT emission factors, corrected for local conditions, to estimate emissions [7], assuming vehicles passing IM. Although Ecuador has a mandatory annual vehicle inspection program, the impact of failures and the prevalence of high-emitters has not been integrated into emission inventories. This new study will build upon the previous work by incorporating data from the I/M program. This will allow for the development of a correction factor to adjust the emission estimations from the VEIN model, accounting for the segment of the fleet that are persistently high emitters and likely responsible for a larger share of pollution. It is hypothesized that this will result in higher, and more realistic emission figures, providing a more accurate tool for policymakers to address air quality management and effectively target emission reduction strategies.
2. Materials and Methods
We obtained the I/M data from 2019 from the Environmental Secretary of Quito, Ecuador. The dataset was analyzed to understand temporal trends over the years. We also studied the distribution statistics. The idea of I/M programs is to advise repairing or removing high emitters vehicles from circulation. However, there is a time before any car can be detected and then repaired depending on the I/M specifications. So, even if the local I/M is highly effective, there is still likely to be a percentage of high emitting cars in circulation at any given time. Here we propose a methodology to correct emission factors accounting for the high emitter cars in the emissions. Since the I/M database includes exhaust measurements of all cars, approved and reproved during a given year, we calculated the emissions ratio of reproved/approved cars by year of use. Then, as we know the number of each type of vehicle, we know the percentage of high emitting vehicles. Then, the final emission factor is weighted against high emitting vehicles and their fleet participation as shown in equation 1:
E = EF*[PERCA + (IMR/IMA)*PERCR]*VEH*LKM Equation 1
Where E are the emissions (g), EF emission factors representing vehicles with approved IM. For the purpose of this study, the emission factors come from Ntziachristos and Zamaras [8], available in VEIN. PERCA and PERCR are the percentage of the fleet that approves or reproves IM, respectively. IMA and IMR are the emissions for the approved and reproved vehicles from the IM program. VEH is the number of vehicles in circulation during the period of time, in this case by year. LKM is the distance travelled by the vehicles by year in km. This equation is extended for all the possible combinations of vehicle type, fuel, technology, year of use, deterioration, which are indeed considered when running VEIN. However, equation 1 intends to express a generic formulation but we explicitly applied for each age of use. To furthermore expand the reproducibility of this study, readers can find the project “ecuador_mdpi” at https://github.com/atmoschem/vein/tree/master/projects/ecuador_mdpi. Since opacity is an optic measurement that reflects(daqui a duas semanas) particulate matter [26] we applied our methodology for particulate matter.
VEIN is an open-source vehicular emissions model that was developed in Brazil and expanded with methodologies and emission factors from all over the world [19]. As a result, it currently has about 60k downloads. VEIN [12] is an R package which imports spatial features sf R package [13,14] with bindings for GDAL https://gdal.org/, GEOS https://libgeos.org/ and PROJ https://proj.org/ for spatial processing. Furthermore, VEIN also imports the data.table R package [15], which provides an optimized and fast approach to deal with data. VEIN also incorporates Fortran Subroutines with parallel processes to calculate the emissions efficiently.
To account for the effect of high-emitting cars in the emissions we developed two emissions inventories for Ecuador. The base scenario assumes emission factors with normal degradation over time and no high emitters. The second scenario, includes the percentage of the fleet with high emitters. Finally, we perform a characterization of emissions and their comparison. We also included a comparison with road transport sector emissions from two global inventories, EDGAR v8.1 and CEDS v2024_07_08 [16,17].
3. Results and Discussion
3.1. Vehicle Inspection and Maintenance Program (I/M)
Diesel and gasoline cars show an expected pattern, with a larger proportion of approvals being awarded to newer vehicles, as shown in Figure 1. Data of older vehicles in circulation is very limited, around 0% for diesel lower than 1994 and 0% for gasoline lower than 1965. Hence, we limited gasoline cars between 1965 and 2020, and diesel between 1994 and 2020. The average of approved gasoline vehicles was 91.22% while for the diesel was 81.99%.
In gasoline vehicles, the CO is measured as a percentage (%), while HC is measured in ppm. In diesel vehicles, opacity is measured as the percentage, which represents the amount of light blocked by the exhaust plume. Therefore, the opacity is a good indicator of particle matter, the darker the plume, the more soot. While there are studies that estimate particle matter from opacity measurements [16], in this study we applied the ratio of reproved to approved as an indicator of particle matter emission factors for high-emitting diesel vehicles. The averaged values by age of CO, HC and opacity is shown in Figure 2, showing higher values for reproved vehicles. Specifically, on average, the ratio reproved/approved for CO, HC and opacity was 3.9, 6.2 and 3.6, respectively. Also, the CO and HC in gasoline vehicles pattern was similar, where the values of reproved vehicles are high in the first years, then drop with about 10 to 20 years of use, climbing again the older the vehicle. The increase in emissions for cars around the year 2000 and older is very likely due to the degradation of emission control systems, like the catalytic converter, over time.
3.2. Emissions Inventory
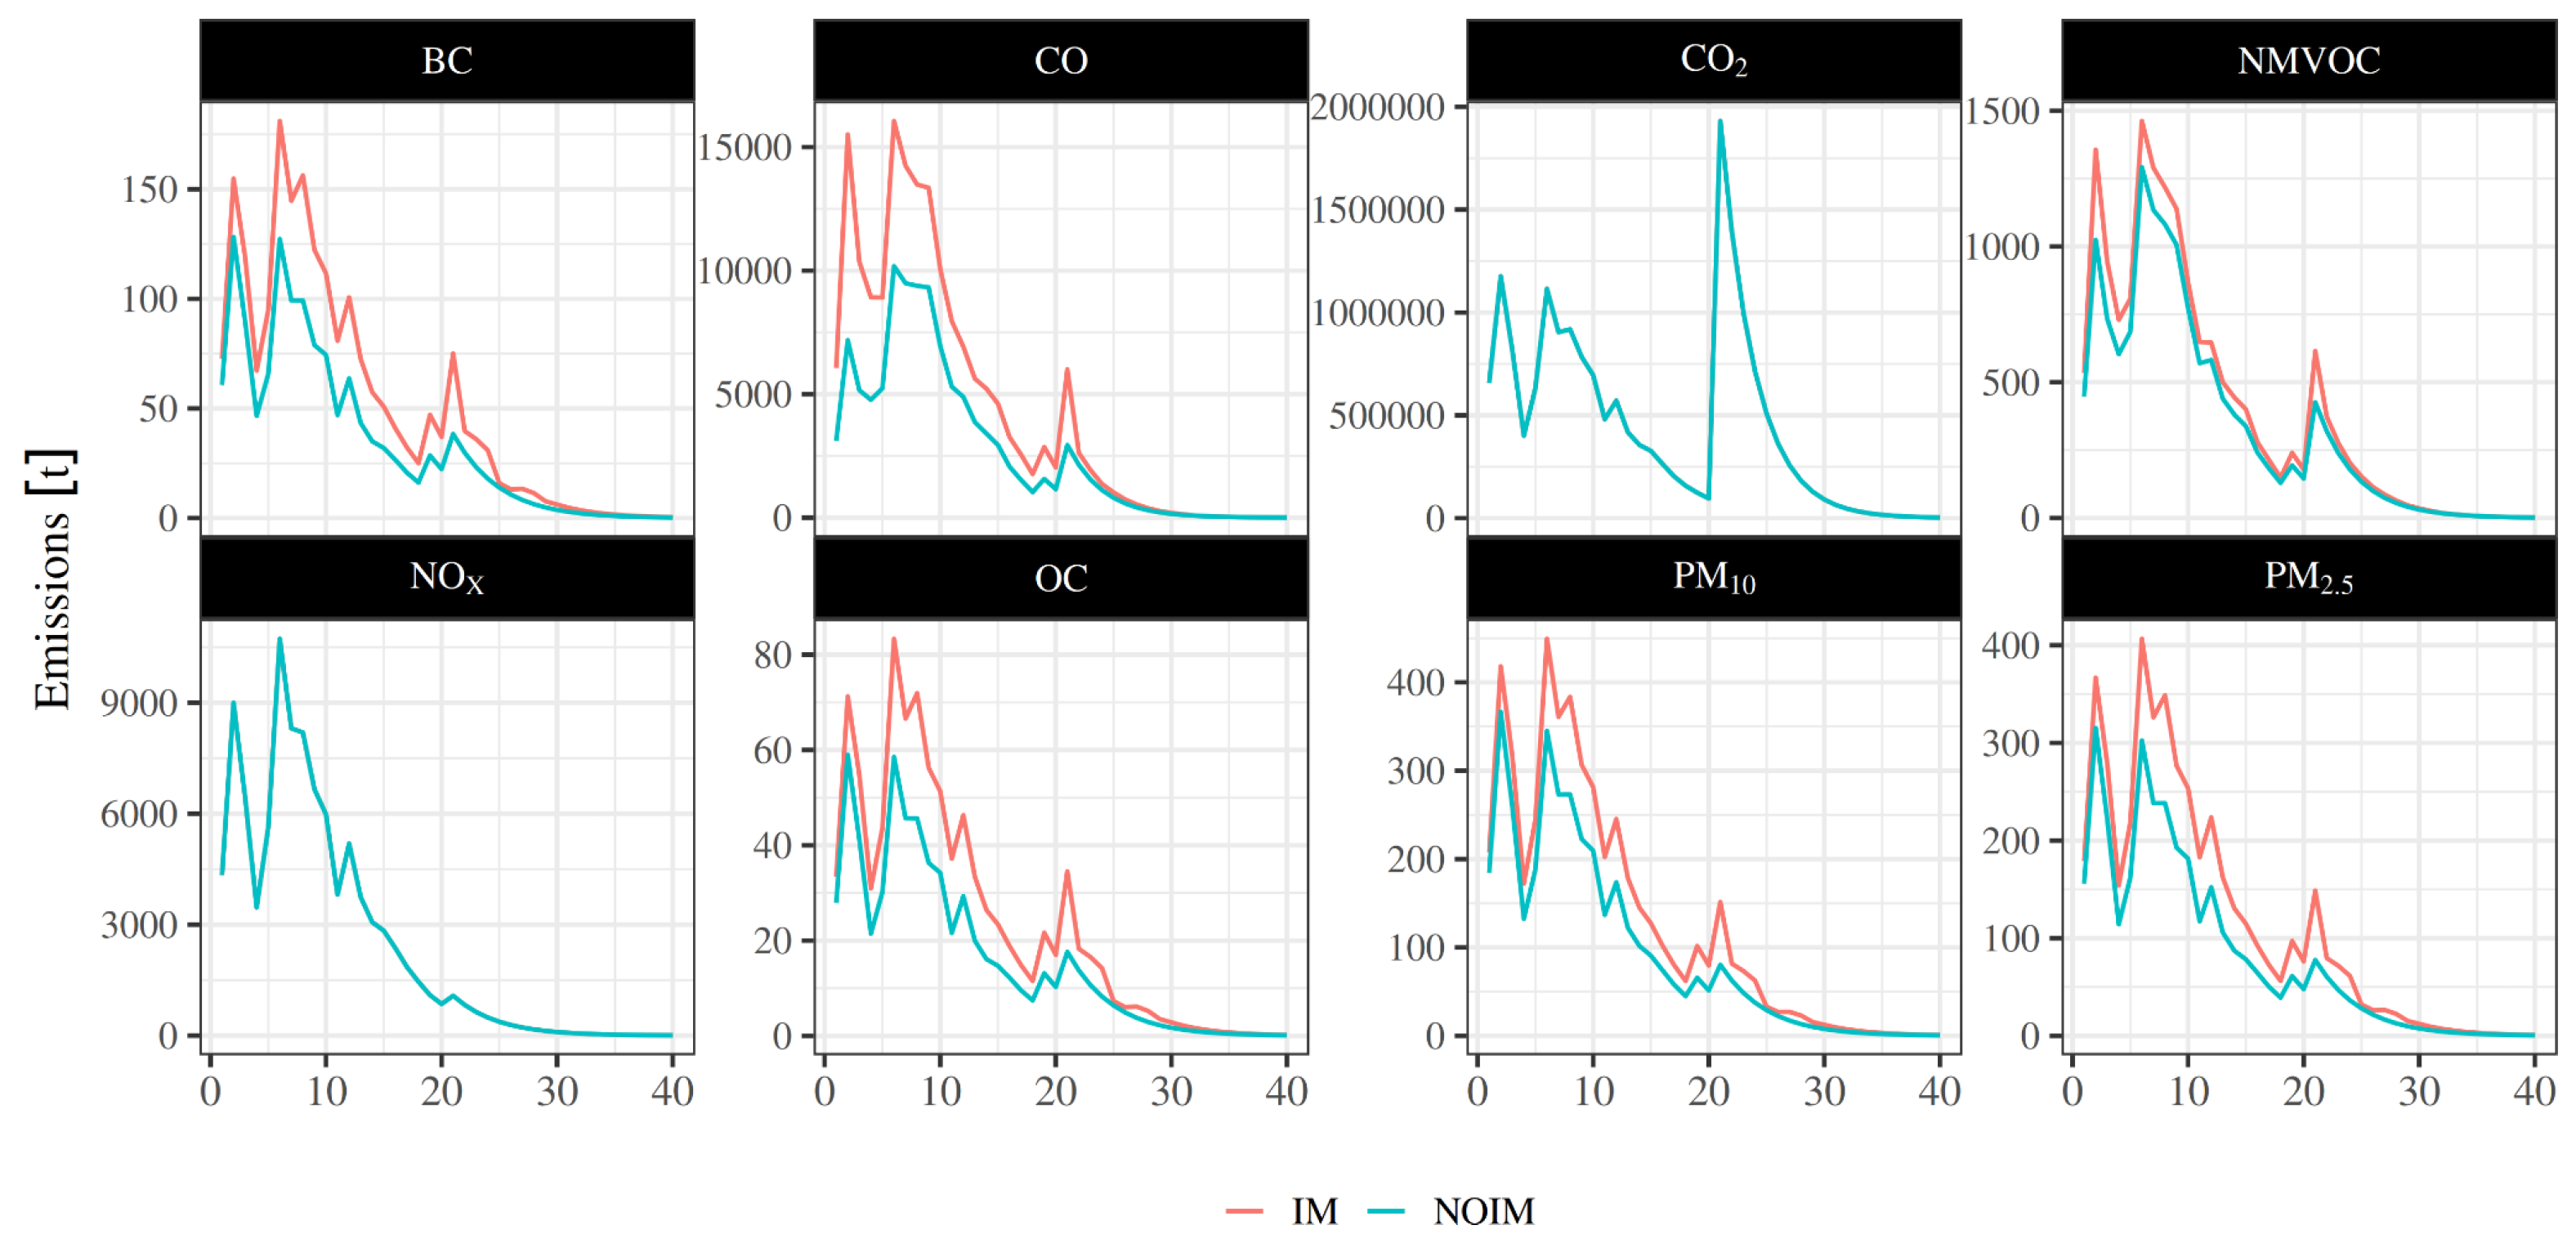
The emissions inventory included a combination of vehicles no older than 40 years, 12 months, 62 types of vehicles, 12 pollutants, 25 regions and two scenarios, resulting in a database of 42 million estimations. The visualization of the emissions by scenario and pollutant is shown in Figure 3. The values in our study are labeled as IM, to account for the effect of high emitters vehicles only available in the IM dataset, and NOIM, which assumes all vehicles would pass the IM program. While less than 10% of gasoline and 20% of diesel vehicles did not pass the IM inspection, their impact on emissions is more significant. The average shows that emissions are 31% higher including high emitters, but the percentage varies greatly for each pollutant. Specifically, the largest increment is 65% for CO, while the smallest change was 1% for NMVOC. Since I/M did not measure CO2 or NOX, no change was expected for these gases. Regarding CO2, we also see that our estimation aligns well with literature values which demonstrate the strength of your methodology and differences in our estimations are due emission factors, finding small differences from CEDS as 11% and from EDGAR 5% lower than our estimations. However, for all the other pollutants, our literature values are lower than literature. Also, worth noting here, VEIN can direct estimation of NO and NO2 and more pollutants, applying the methodology of the European Emissions Guidelines [18,25], not shown in this inventory. Our estimations are separated by type, in this way we see that exhaust emissions are the most important for all the pollutants, while evaporative plays a secondary role for NMVOC, same as wear emissions for particulate matter PM10 and PM2.5.
The emissions vehicle type can be seen in Figure 4, accounting for 62 categories. Appendix includes a definition for each vehicle category. First we see that diesel vehicles change emissions only for particulate matter, BC and OC, as a result for using the opacity as a proxy for measurement. For CO, NMVOC we only see that emissions accounting for high emitters affect only gasoline vehicles. Lastly, CO2 and NOX are not affected by the scenarios because there are no measurements of these gases. Nevertheless, NOX is an important gas for atmospheric photochemistry [23] and should be added into the Ecuadorian IM program. Furthermore, NOX is usually considered in IM programs resulting in proper characterization and recommendations for control in Europe [24]. Furthermore, we see that electric vehicles do emit particulate matter for tyre, brake and road wear.
Figure 5 shows the breakdown of total emissions by vehicle age for both the IM and NOIM scenarios. The highest emissions for most pollutants come from vehicles that are between 0 and 10 years old, which is likely because there are more of these newer cars in the fleet. Across almost all pollutants and age groups, the emissions are higher in the IM scenario, which accounts for high-emitting vehicles. This difference is most noticeable for pollutants such as CO, where older vehicles that fail inspection contribute significantly to the total pollution.
4. Conclusions
This study presents a method for improving vehicle emission inventories by using data from Ecuador’s Inspection and Maintenance (I/M) program. Including data on vehicles that failed the inspections, allow us to more accurately account emissions from high-emitting vehicles, which are often overlooked in standard models. Our analysis of the I/M data from Quito revealed that while a relatively small percentage of the fleet fails the annual inspection (less than 10% of gasoline vehicles and less than 20% of diesel vehicles), accounting for reproved vehicles produced 60% more CO, 18% more NMVOC, 40% more PM2.5, and 34% more PM10. Our CO2 estimates were similar to those from global inventories, such as CEDS and EDGAR, suggesting that our basic fleet and activity data are correct. However, our estimates for other pollutants were lower, indicating that the emission factors used in global models may differ from those used locally in Ecuador. Our results also show that failing to include I/M data can lead to a significant underestimation of actual on-road emissions. We also propose that the method presented here offers a way to create more realistic emission figures and provides policymakers with a better tool for developing effective strategies for managing air quality and reducing transportation-related pollution, and assessing the need for more targeted action to address high emitting vehicles specifically.
References
Author Contributions
Conceptualization, SIE, ZM.; methodology, SIE, ZM, KR.; software, SIE, KR.; validation,SIE, ZM, JM.; formal analysis, SIE, ZM, KR, JM; investigation, SIE, ZM; resources, SIE; data curation, ZM.; writing—original draft preparation, SIE.; writing—review and editing, SIE, ZM, KR, JM; visualization, SIE. All authors have read and agreed to the published version of the manuscript.
Funding
Please add: This research received no external funding.
Institutional Review Board Statement
Not applicable.
Informed Consent Statement
Not applicable.
Data Availability Statement
To replicate this study, information can be found at https://github.com/atmoschem/vein/tree/master/projects/ecuador_td.
Acknowledgments
No Applicable.
Conflicts of Interest
The authors declare no conflicts of interest.
Abbreviations
| CO | Carbon Monoxide |
| CO2 | Carbon Dioxide |
| NMVOC | Non Methanic Volatile Organic Compounds |
| NO | Nitrogen Monixide |
| NO2 | Nitrogen dioxide |
| NOX | Nitrogen oxides (NO + NO2) |
| PM10 | Particulate matter with an aerodynamic diameter less or equal to 10 micrometers. |
| PM2.5 | Particulate matter with an aerodynamic diameter less or equal to 2.5 micrometers. |
Appendix
Vehicular categories used in this study.

Table A1.
Vehicular categories used in this study.
| Vehicles | Description | Fuel | Size |
| PC_MINI_G | Passenger cars mini with gasoline | G | <1400cc |
| PC_SMALL_G | Passenger cars small with gasoline | G | 1400-2000cc |
| PC_MEDIUM_G | Passenger cars medium with gasoline | G | >2000cc |
| PC_SUV_G | Sport utility vehicle with gasoline | G | >1400cc |
| PC_MINI_D | Passenger cars mini with gasoline | D | <1400cc |
| PC_SMALL_D | Passenger cars small with gasoline | D | 1400-2000cc |
| PC_MEDIUM_D | Passenger cars medium with gasoline | D | >2000cc |
| PC_SUV_D | Sport utility vehicle with gasoline | D | >1400cc |
| PC_ELEC | Passenger cars electric | ELEC | all |
| PC_SMALL_HY | Passenger cars small hybrid with gasoline | HY | 1400-2000cc |
| TAXI_SMALL_G | Taxi small with gasoline | G | 1400-2000cc |
| TAXI_SMALL_GLP | Taxi small with glp | GLP | 1400-2000cc |
| LCV_NI_G | Light commercial vehicles N1 with gasoline | G | <=1.305t |
| LCV_NII_G | Light commercial vehicles N2 with gasoline | G | 1.305-1.76t |
| LCV_NIII_G | Light commercial vehicles N3 with gasoline | G | >=1.76t |
| LCV_NI_D | Light commercial vehicles N1 with diesel | D | <=1.305t |
| LCV_NII_D | Light commercial vehicles N2 with diesel | D | 1.305-1.76t |
| LCV_NIII_D | Light commercial vehicles N3 with diesel | D | >=1.76t |
| LCV_ELEC | Light commercial vehicles electric | ELEC | all |
| LCV_HY | Light commercial vehicles hybrid with gasoline | HY | all |
| TRUCKS_RT_7_D | Rigid trucks diesel <=7.5t | D | <=7.5t |
| TRUCKS_RT_7_12_D | Rigid trucks diesel 7.5-12t | D | 7.5-12t |
| TRUCKS_RT_12_14_D | Rigid trucks diesel 12-14t | D | 12-14t |
| TRUCKS_RT_14_16_D | Rigid trucks diesel 14-16t | D | 14-16t |
| TRUCKS_RT_16_20_D | Rigid trucks diesel 16-20t | D | 16-20t |
| TRUCKS_RT_20_26_D | Rigid trucks diesel 20-26t | D | 20-26t |
| TRUCKS_RT_26_28_D | Rigid trucks diesel 26-28t | D | 26-28t |
| TRUCKS_RT_28_32_D | Rigid trucks diesel 38-32t | D | 38-32t |
| TRUCKS_RT_32_D | Rigid trucks diesel >=32t | D | >=32t |
| TRUCKS_RT_7_G | Rigid trucks gasoline <=7.5t | G | <=7.5t |
| TRUCKS_RT_7_12_G | Rigid trucks gasoline 7.5-12t | G | 7.5-12t |
| TRUCKS_RT_12_14_G | Rigid trucks gasoline 12-14t | G | 12-14t |
| TRUCKS_RT_14_16_G | Rigid trucks gasoline 14-16t | G | 14-16t |
| TRUCKS_RT_16_20_G | Rigid trucks gasoline 16-20t | G | 16-20t |
| TRUCKS_RT_20_26_G | Rigid trucks gasoline 20-26t | G | 20-26t |
| TRUCKS_RT_26_28_G | Rigid trucks gasoline 26-28t | G | 26-28t |
| TRUCKS_RT_28_32_G | Rigid trucks gasoline 38-32t | G | 38-32t |
| TRUCKS_RT_32_G | Rigid trucks gasoline >=32t | G | >=32t |
| TRUCKS_AT_16_20_D | Articulated trucks diesel 16-20t | D | 16-20t |
| TRUCKS_AT_20_28_D | Articulated trucks diesel 20-28t | D | 20-28t |
| TRUCKS_AT_28_34_D | Articulated trucks diesel 28-34t | D | 28-34t |
| TRUCKS_AT_34_40_D | Articulated trucks diesel 34-40t | D | 34-40t |
| TRUCKS_AT_40_50_D | Articulated trucks diesel 40-50t | D | 40-50t |
| TRUCKS_AT_50_60_D | Articulated trucks diesel 50-60t | D | 50-60t |
| TRUCKS_ELEC | Trucks electric | ELEC | all |
| BUS_UB_15_D | Urban bus diesel <=15t | D | <=15t |
| BUS_UB_15_18_D | Urban bus diesel 15-18t | D | 15-18t |
| BUS_UB_18_D | Urban bus diesel >=18t | D | >=18t |
| BUS_UB_15_G | Urban bus gasoline<=15t | G | <=15t |
| BUS_UB_15_18_G | Urban bus gasoline15-18t | G | 15-18t |
| BUS_UB_18_G | Urban bus gasoline>=18t | G | >=18t |
| BUS_COACH_17_D | Coach bus diesel <=18 | D | <=18 |
| BUS_COACH_18_D | Coach bus diesel >18t | D | >18t |
| BUS_COACH_17_G | Coach bus gasoline <=18 | G | <=18 |
| BUS_COACH_18_G | Coach bus gasoline >18t | G | >18t |
| BUS_UB_15_HY | Bus hybrid | HY | all |
| BUS_ELEC | Bus electric | ELEC | all |
| MC_2S_50_G | Motorcycle 2 strokes >=50 cc gasoline | G | 50cc |
| MC_4S_50_250_G | Motorcycle 4 strokes <=250 cc gasoline | G | 50_250 |
| MC_4S_250_750_G | Motorcycle 4 strokes 250-750 cc gasoline | G | 250-750cc |
| MC_4S_750_G | Motorcycle 4 strokes >=750 cc gasoline | G | >=750cc |
| MC_ELEC | Motorcycle electric | ELEC | all |
References
- Ibarra Espinosa, Sergio, Mario Gavidia Calderon, Pedro Jose Perez Martinez, Leila Droprinchinski Martins, Ana Paula Mendes Emygdio, Carlos Eduardo Souto-Oliveira, Regina Miranda, Perola Vasconcellos, Edmilson Dias de Freitas, and Maria de Fatima Andrade. (2024) “Chapter 3 - Sources and Emissions of Air Pollution.”. In Sokhi et al., (2024) Air Quality Science, Impacts, and Management 1, 1:81. Elsevier, 2024. [CrossRef]
- Leiva, M.; Santibañez, D.A.; Ibarra, S.; Matus, P.; Seguel, R. A five-year study of particulate matter (PM2. 5) and cerebrovascular diseases. Environmental pollution 2013, 181, 1–6. [Google Scholar] [CrossRef] [PubMed]
- Braga, A.L.; Saldiva, P.H.; Pereira, L.A.; Menezes, J.J.; Conceição, G.M.; Lin, C.A.; Zanobetti, A.; Schwartz, J.; Dockery, D.W. Health effects of air pollution exposure on children and adolescents in São Paulo, Brazil. Pediatric pulmonology 2001, 31(2), 106–113. [Google Scholar] [CrossRef] [PubMed]
- U.S.EPA. (2021). Overview of Vehicle Inspection and Maintenance (I/M) Programs. https://nepis.epa.gov/Exe/ZyPDF.cgi?Dockey=P1013CC0.pdf.
- Ventura, Luciana Maria Baptista, Fellipe de Oliveira Pinto, Adriana Gioda, and Márcio de Almeida D’Agosto. “Inspection and maintenance programs for in-service vehicles: an important air pollution control tool.” Sustainable Cities and Society 53 (2020): 101956. [CrossRef]
- Ropkins, K.; DeFries, T.H.; Pope, F.; Green, D.C.; Kemper, J.; Kishan, S.; Fuller, G.W.; Li, H.; Sidebottom, J.; Crilley, L.R.; Kramer, L. Evaluation of EDAR vehicle emissions remote sensing technology. Science of the Total Environment 2017, 609, 1464–1474. [Google Scholar] [CrossRef] [PubMed]
- Ibarra-Espinosa, S.; Mera, Z.; Rosero, R.; Díaz, M.V. Spatial and temporal characterization of vehicular emissions in Ecuador using VEIN. 2021 Congreso Colombiano y Conferencia Internacional de Calidad de Aire y Salud Pública (CASAP), 2021, November; IEEE; pp. 1–5. [Google Scholar]
- Ntziachristos, L.; Samaras, Z. EMEP/EEA emission inventory guidebook; Road Transport: Passenger cars, Light commercial trucks, Heavy-duty vehicles including buses and Motorcycles; European Environment Agency: Copenhagen, 2019. [Google Scholar]
- ANT Resolution No. 025-ANT-DIR-2019. Reglamento de Revision Tecnica Vehicular; Agencia National del Transito. 2019.
- Smit, R.; Ayala, A; Kadijk, G.; Buekenhoudt, P. Excess Pollution From Vehicles - A Review and Outlook on Emission Controls, Testing, Malfunctions, Tampering, and Cheating. Sustainability 2025, 17, 5362. [Google Scholar] [CrossRef]
- Valencia, V.H.; Hertel, O.; Ketzel, M.; Levin, G. Modeling urban background air pollution in Quito, Ecuador. Atmospheric Pollution Research 2020, 11(4), 646–666. [Google Scholar] [CrossRef]
- Ibarra-Espinosa, S.; Ynoue, R.; O’Sullivan, S.; Pebesma, E.; Andrade, M. D. F.; Osses, M. : VEIN v0.2.2: an R package for bottom–up vehicular emissions inventories. Geosci. Model Dev. 11, 2209–2229. [CrossRef]
- Pebesma, E.; Bivand, R. Spatial Data Science: With Applications in R; Chapman and Hall/CRC, 2023. [Google Scholar] [CrossRef]
- Pebesma, E. Simple Features for R: Standardized Support for Spatial Vector Data. The R Journal 2018, 10(1), 439–446. [Google Scholar] [CrossRef]
- Yang, H.H.; Kumar, A.; Dhital, N.B.; Wang, L.C.; Wu, C.H.; Kamyab, H.; Yusuf, M. Evaluating the feasibility of estimating particulate mass emissions of older-model diesel vehicle using smoke opacity measurements. Scientific Reports 2024, 14(1), 31494. [Google Scholar] [CrossRef] [PubMed]
- Crippa, M.; Guizzardi, D.; Pagani, F.; Schiavina, M.; Melchiorri, M.; Pisoni, E.; Graziosi, F.; Muntean, M.; Maes, J.; Dijkstra, L.; et al. Insights into the Spatial Distribution of Global, National, and Subnational Greenhouse Gas Emissions in the Emissions Database for Global Atmospheric Research (EDGAR v8.0). Earth Syst. Sci. Data 2024, 16, 2811–2830. [Google Scholar] [CrossRef]
- McDuffie, E. E.; Smith, S. J.; O’Rourke, P.; Tibrewal, K.; Venkataraman, C.; Marais, E. A.; Zheng, B.; Crippa, M.; Brauer, M.; Martin, R. V. A Global Anthropogenic Emission Inventory of Atmospheric Pollutants from Sector- and Fuel-Specific Sources (1970–2017): An Application of the Community Emissions Data System (CEDS). Earth Syst. Sci. Data 2020, 12, 3413–3442. [Google Scholar] [CrossRef]
- Ntziachristos, L.; Samaras, Z. EMEP/EEA emission inventory guidebook; Road Transport: Passenger cars, Light commercial trucks, Heavy-duty vehicles including buses and Motorcycles; European Environment Agency: Copenhagen, 2023. [Google Scholar]
- Sattari, A.; Hooyberghs, H.; Janssen, S.; Struzewska, J.; Gawuc, L.; Blyth, L.; Vranckx, S. Evaluating traffic-related air pollution in urban areas: A case study of Warsaw using the ATMO-Street model chain. In Atmospheric Environment; 2025; p. 121376. [Google Scholar]
- Ghaffarpasand, Omid, David CS Beddows, Karl Ropkins, and Francis D. Pope. “Real-world assessment of vehicle air pollutant emissions subset by vehicle type, fuel and EURO class: New findings from the recent UK EDAR field campaigns, and implications for emissions restricted zones.” Science of The Total Environment 734 (2020): 139416. [CrossRef] [PubMed]
- Jiang, Y.; Yang, J.; Tan, Y.; Yoon, S.; Chang, H.-L.; Collins, J.; Durbin, T. D. Evaluation of emissions benefits of OBD-based repairs for potential application in a heavy-duty vehicle Inspection and Maintenance program. Atmospheric Environment 2021, 247, 118186. [Google Scholar] [CrossRef]
- Li, C.; Ma, T.; Karavalakis, G.; Johnson, K. C.; Durbin, T. D. Evaluation of On-Board Sensor-Based NOx Emissions from the Heavy-Duty Vehicles in an Inspection and Maintenance Program. Emission Control Science and Technology 2023, 9, 12–24. [Google Scholar] [CrossRef]
- Parra, R.; Espinoza, C. Insights for air quality management from modeling and record studies in Cuenca, Ecuador. Atmosphere 2020, 11(9), 998. [Google Scholar] [CrossRef]
- Franzetti, J.; Selleri, T.; Fonseca González, N.; Melas, A.; Gioria, R.; Suarez-Bertoa, R. Measuring NOx during periodic technical inspection of diesel vehicles. Environmental Sciences Europe 2024, 36(1), 175. [Google Scholar] [CrossRef]
- Ibarra-Espinosa, S.; Zhang, X.; Xiu, A.; Gao, C.; Wang, S.; Ba, Q.; Gao, C.; Chen, W. A comprehensive spatial and temporal vehicular emissions for northeast China. Atmospheric Environment 2021, 244, 117952. [Google Scholar] [CrossRef]
- McCormick, R.L., Graboski, M.S., Alleman, T.L., Alvarez, J.R. and Duleep, K.G., 2003. Quantifying the emission benefits of opacity testing and repair of heavy-duty diesel vehicles. Environmental science & technology, 37(3), pp.630-637.McCormick, R.L., Graboski, M.S., Alleman, T.L., Alvarez, J.R. and Duleep, K.G., 2003. Quantifying the emission benefits of opacity testing and repair of heavy-duty diesel vehicles. Environmental science & technology, 37(3), pp.630-637.
Figure 1.
Percentage of vehicles approved and reproved by fuel.
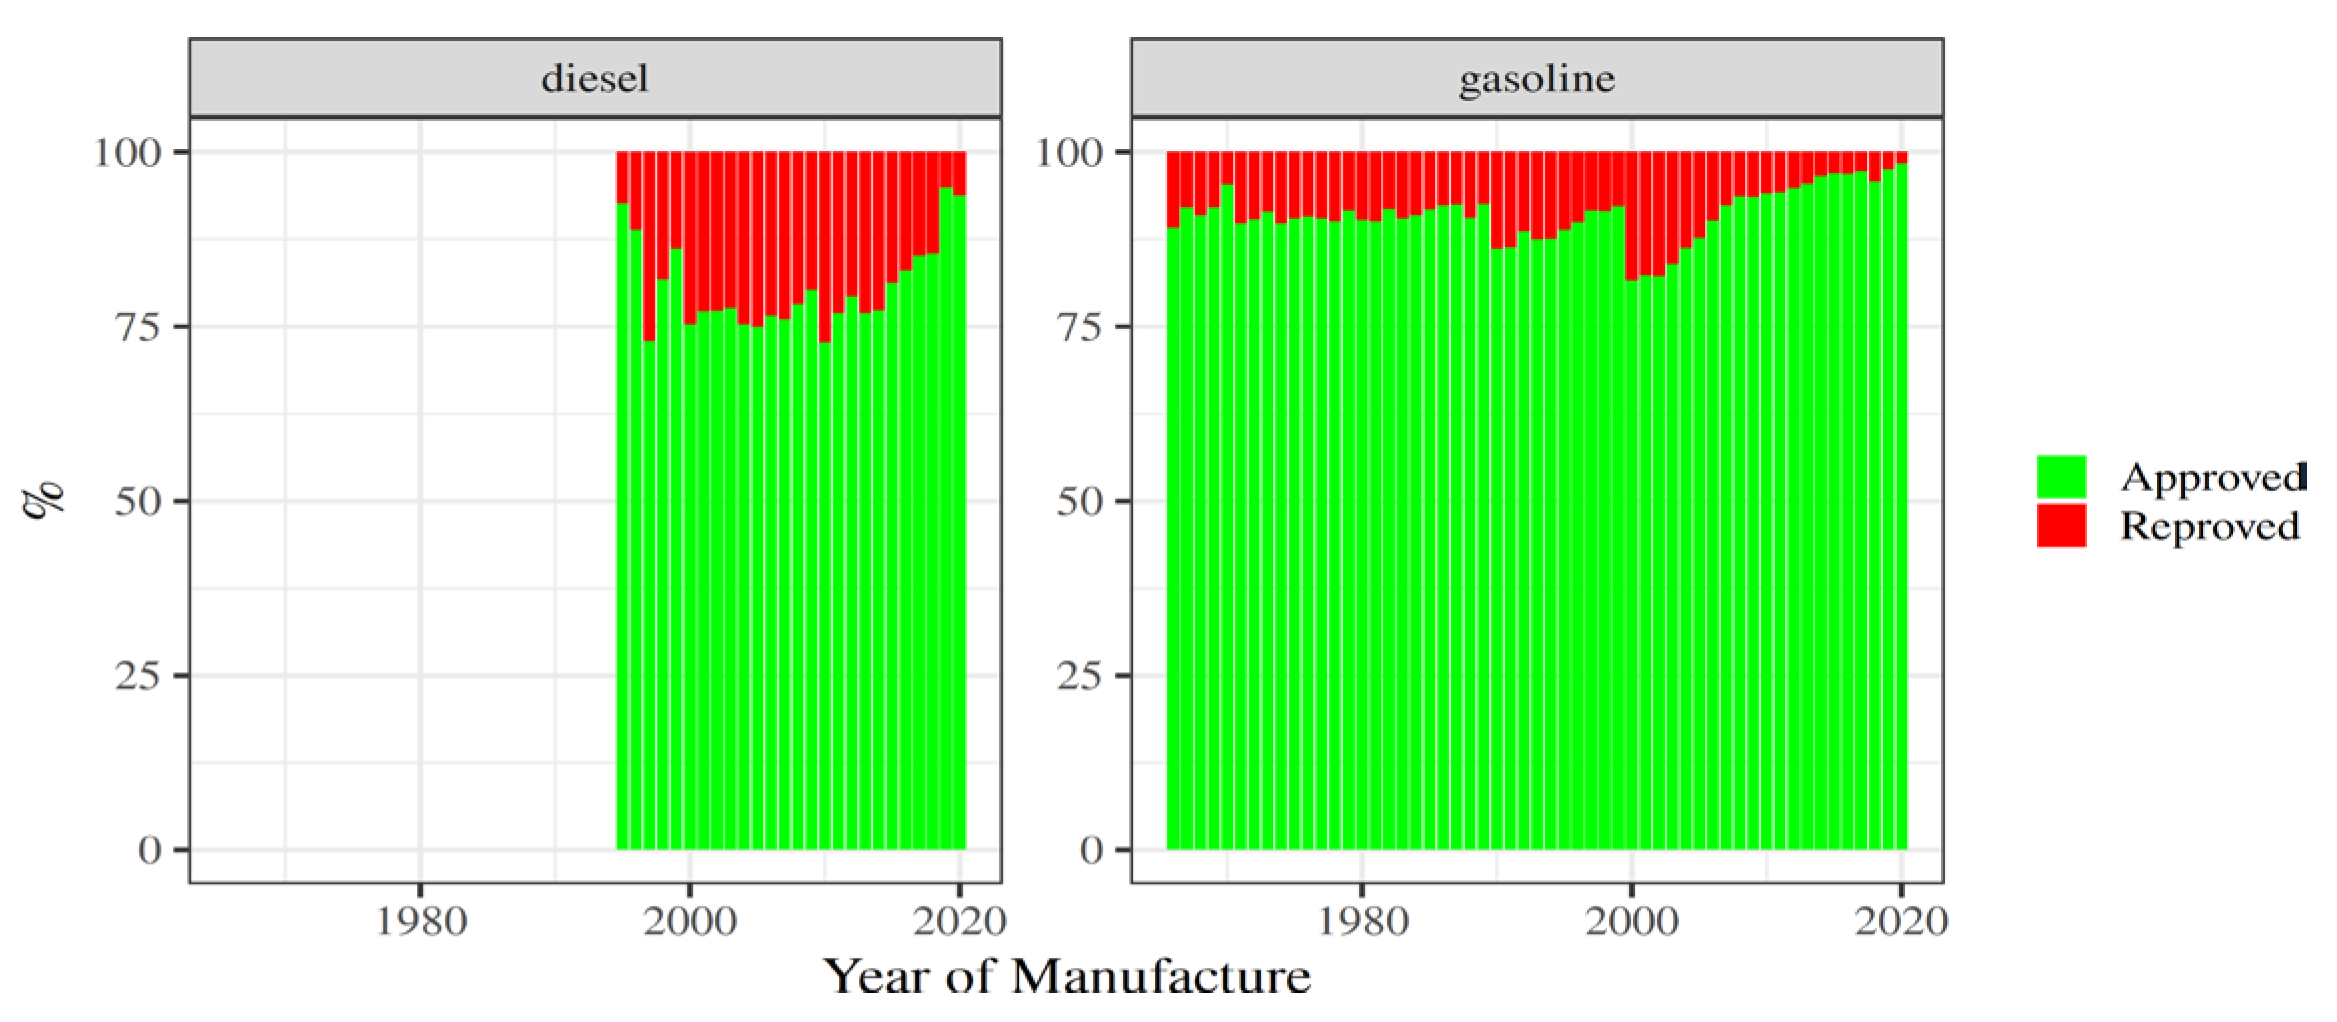
Figure 2.
Average values of IM results for gasoline cars CO (%), HC (ppm) and diesel vehicles opacity (%) in Quito, Ecuador for 2020 by year of fabrication.
Figure 2.
Average values of IM results for gasoline cars CO (%), HC (ppm) and diesel vehicles opacity (%) in Quito, Ecuador for 2020 by year of fabrication.
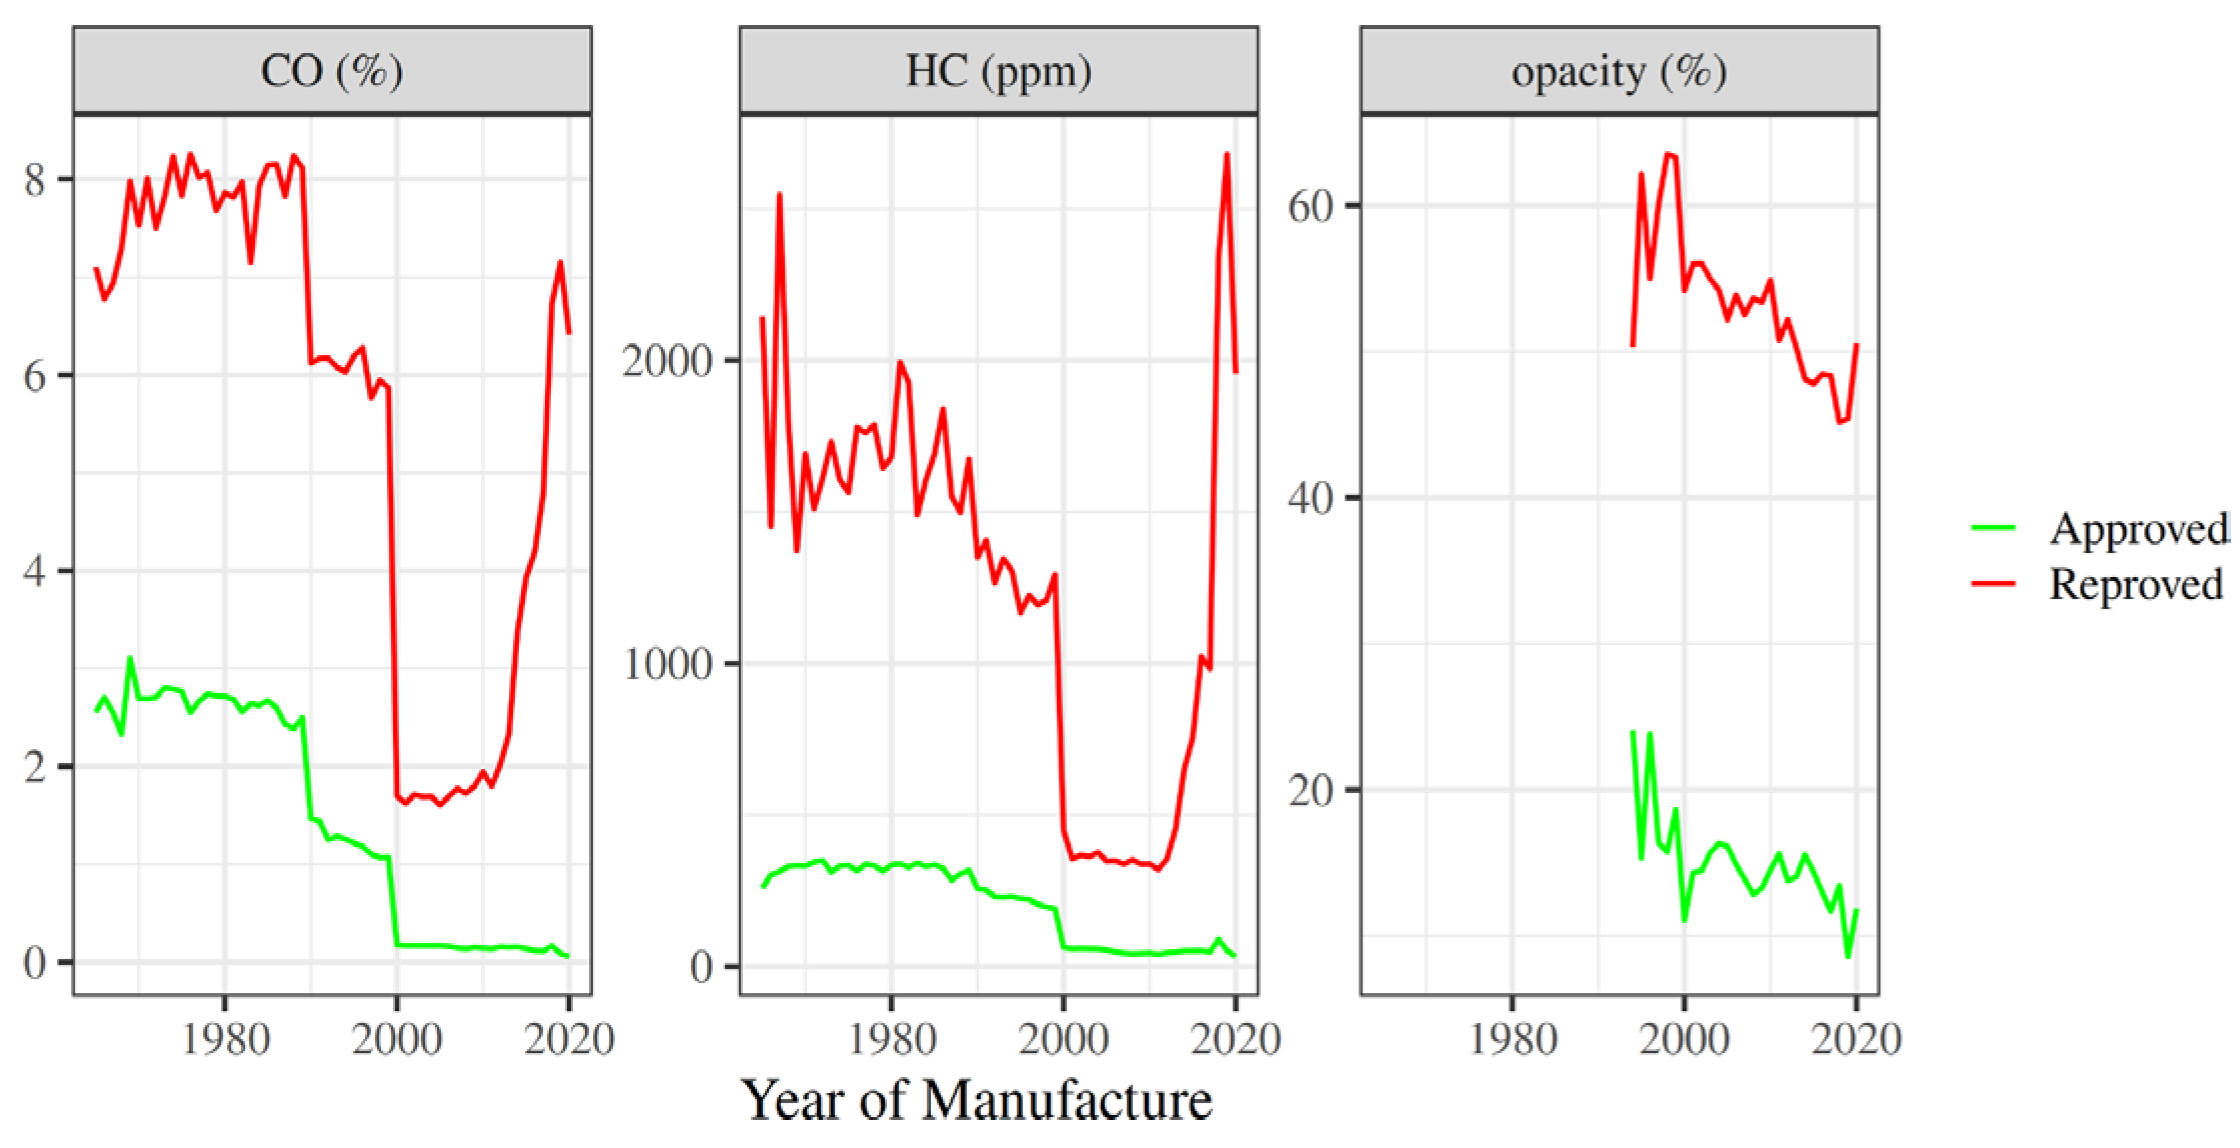
Figure 3.
Road transportation emissions including the effect of high emitters on Inspection and Maintenance (IM), without incorporating high emitters (NOIM) and from EDGAR v8.1 and CEDS v2024_07_08 [16,17] in 2019 (t/year).
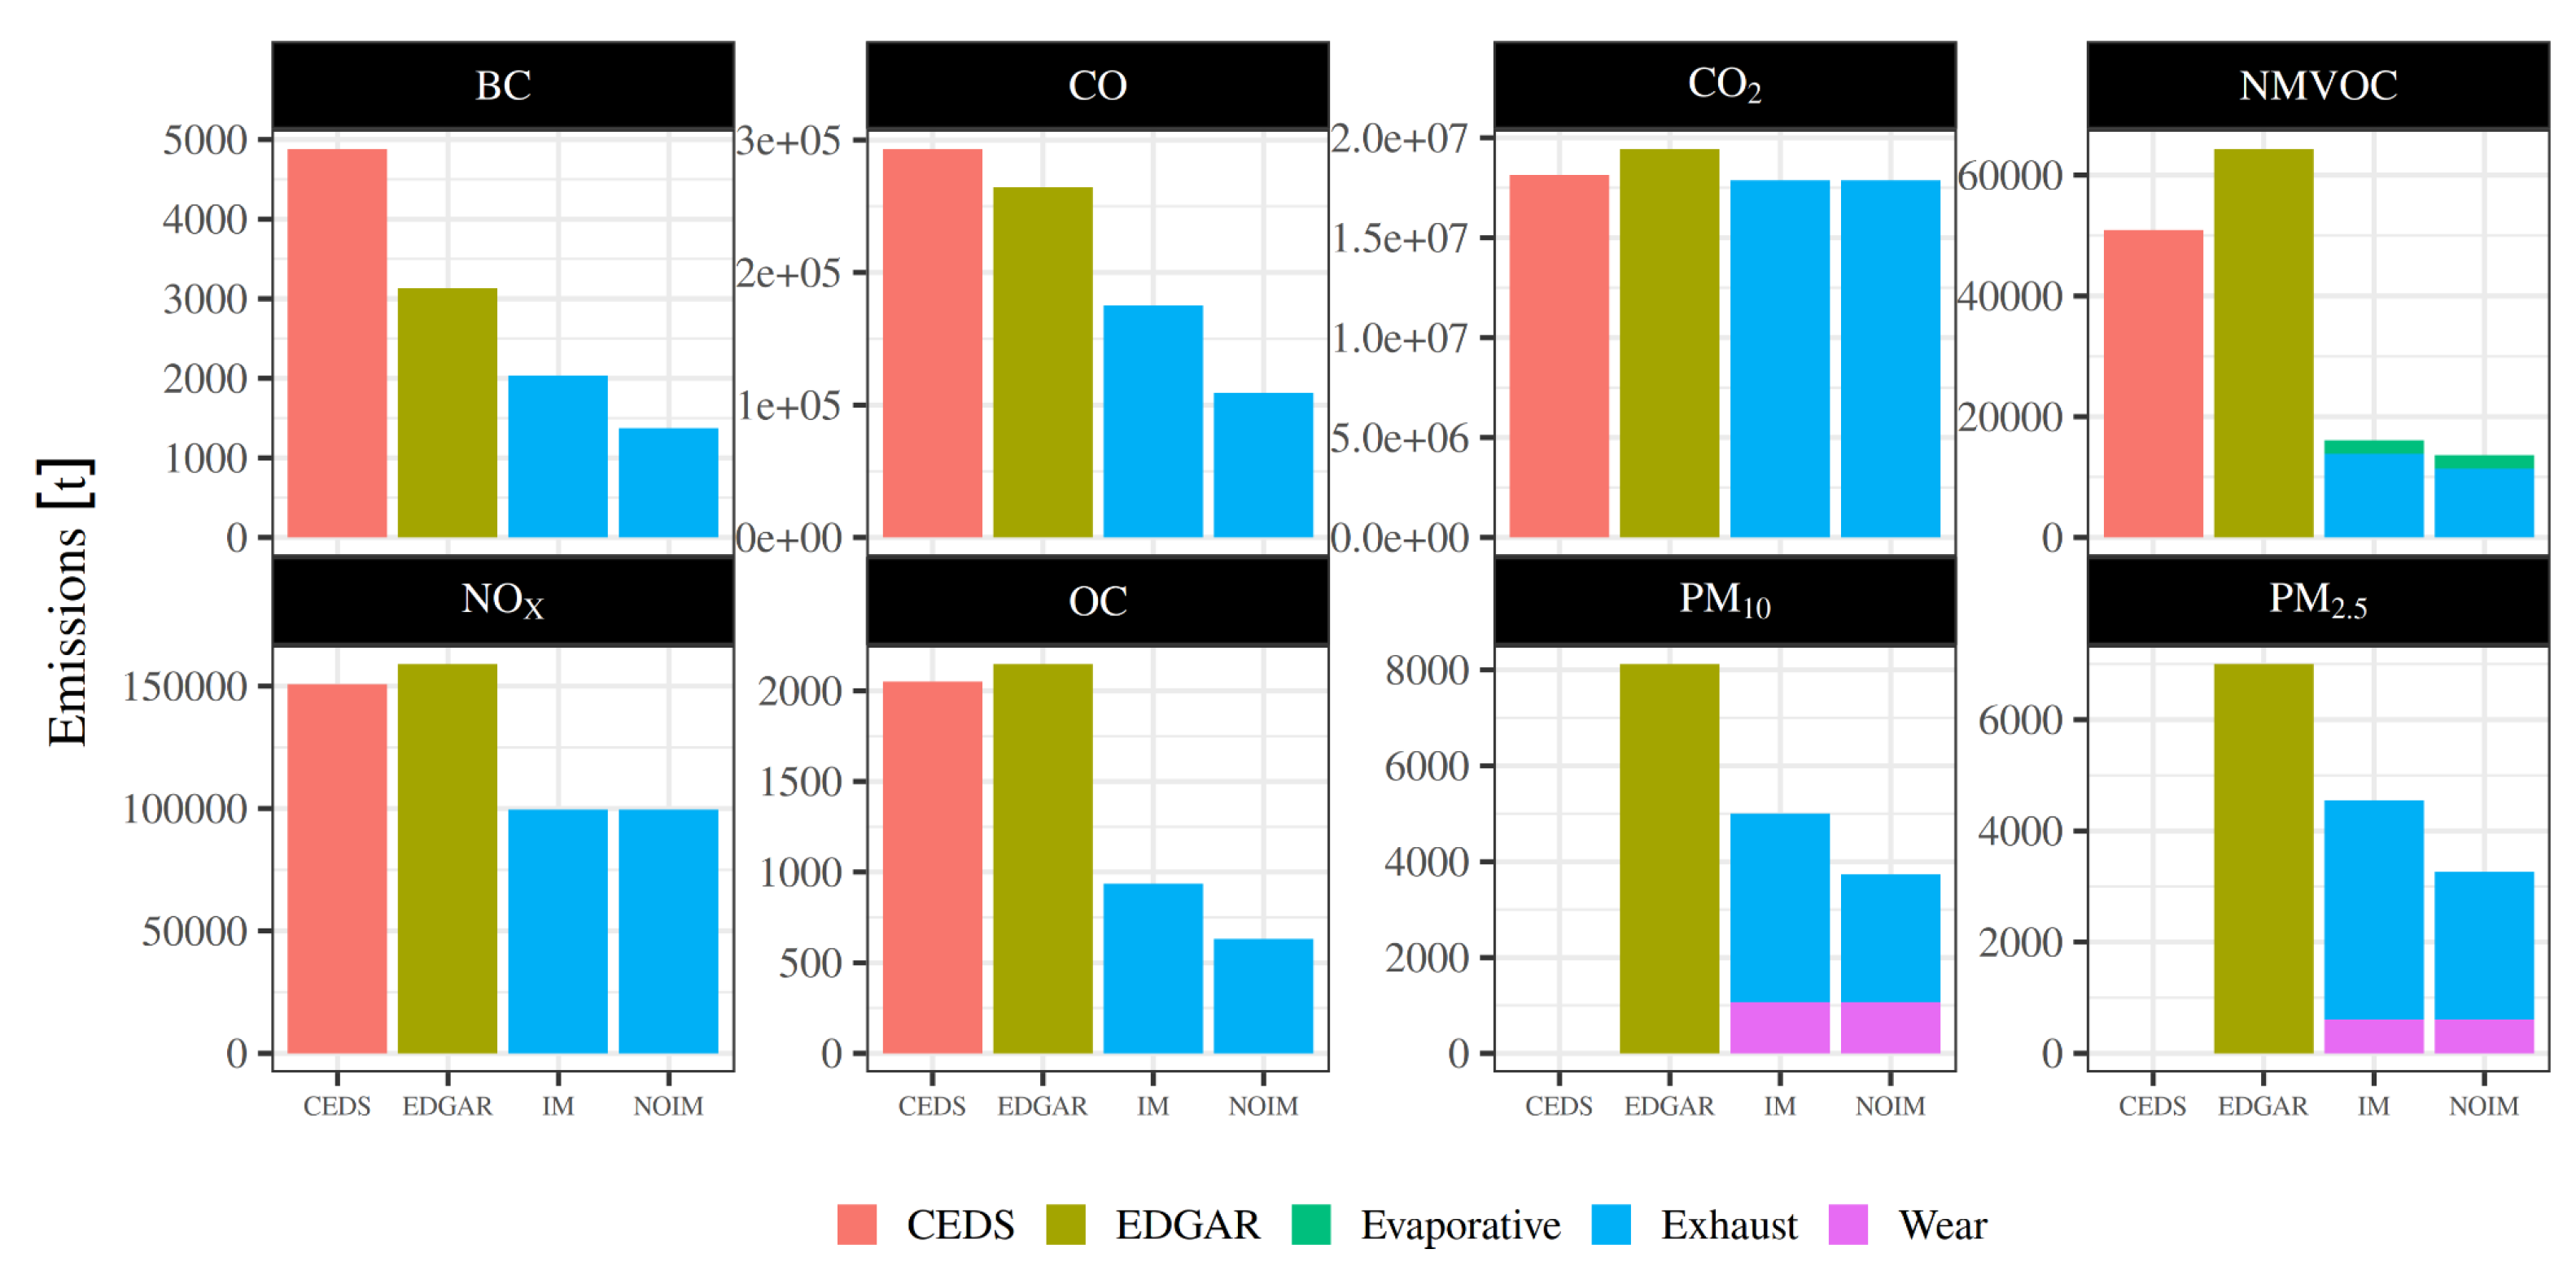
Figure 4.
Road transportation emissions in Ecuador including the effect of high emitters on Inspection and Maintenance (IM), without incorporating high emitters (NOIM) by type of vehicle (t/year). Please note that CO, NMVOC and NOX are expressed in kt/year while CO2 in Mt/year, to help in the visualization of the magnitudes.
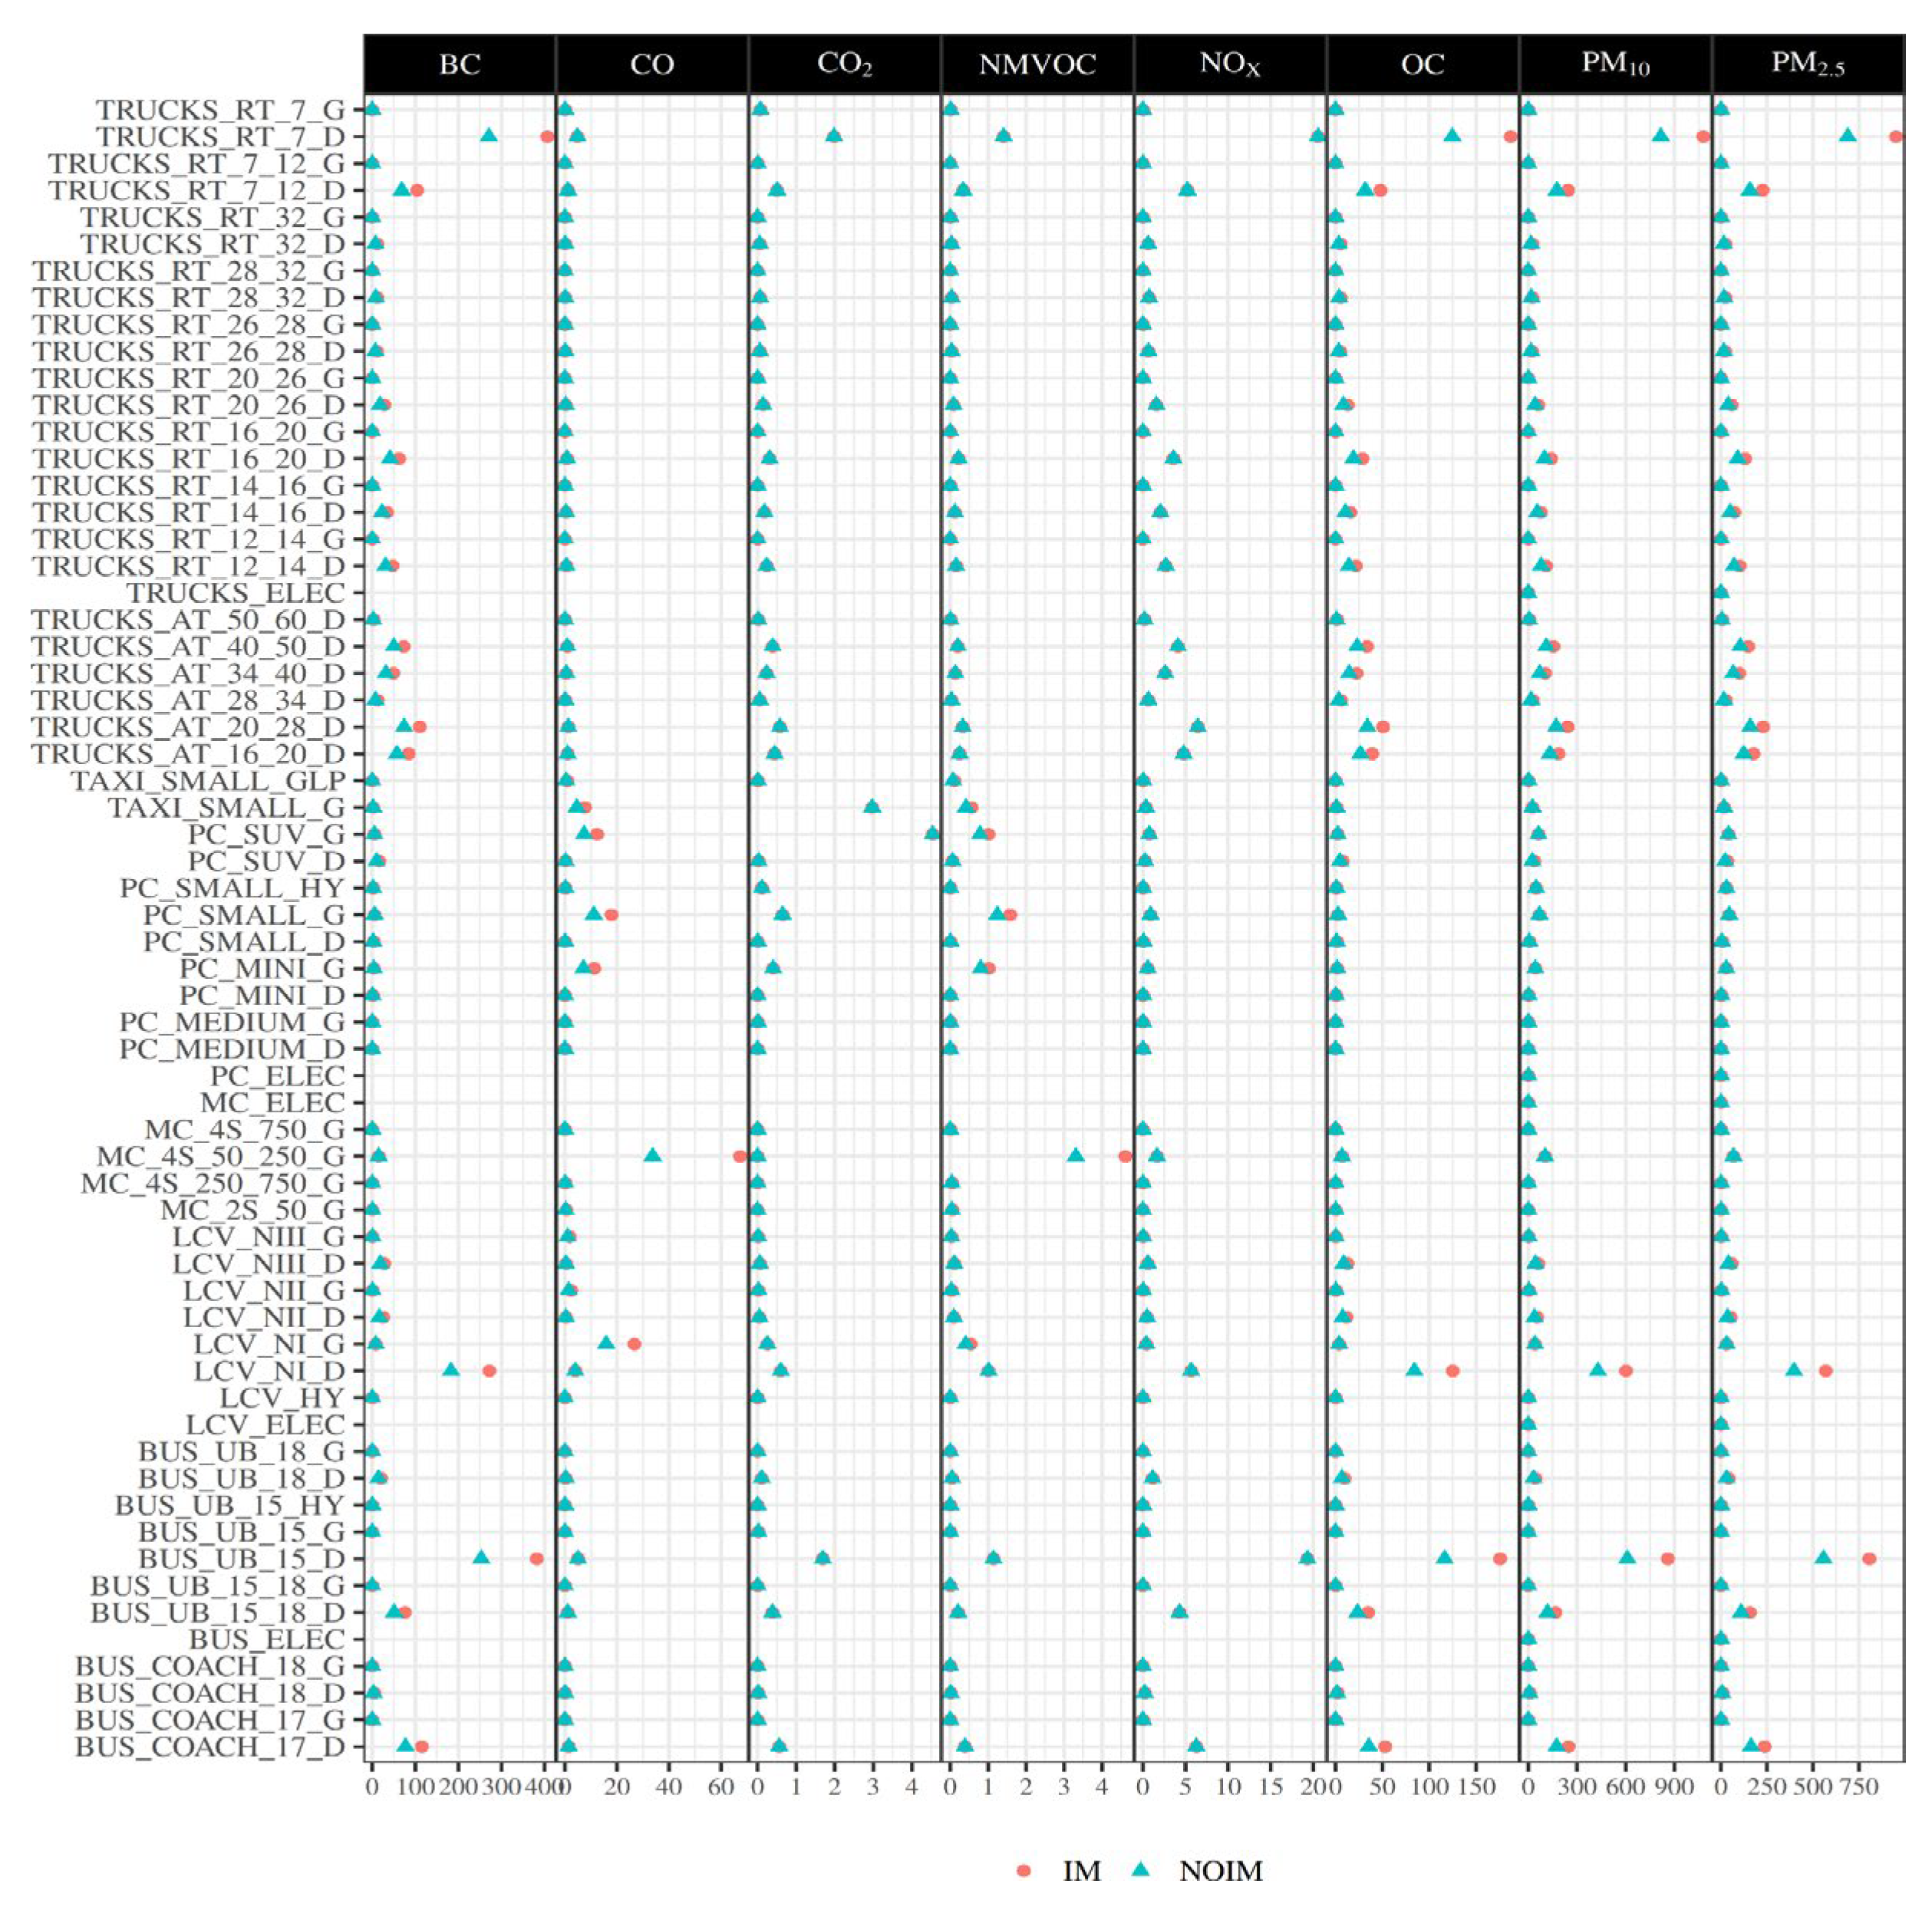
Figure 5.
Road transportation emissions with the effect of high emitters on Inspection and Maintenance (I/M), without incorporating high emitters (NOIM) and by age of use in 2019 (t/year).
Figure 5.
Road transportation emissions with the effect of high emitters on Inspection and Maintenance (I/M), without incorporating high emitters (NOIM) and by age of use in 2019 (t/year).
Disclaimer/Publisher’s Note: The statements, opinions and data contained in all publications are solely those of the individual author(s) and contributor(s) and not of MDPI and/or the editor(s). MDPI and/or the editor(s) disclaim responsibility for any injury to people or property resulting from any ideas, methods, instructions or products referred to in the content. |
© 2025 by the authors. Licensee MDPI, Basel, Switzerland. This article is an open access article distributed under the terms and conditions of the Creative Commons Attribution (CC BY) license (http://creativecommons.org/licenses/by/4.0/).
Copyright: This open access article is published under a Creative Commons CC BY 4.0 license, which permit the free download, distribution, and reuse, provided that the author and preprint are cited in any reuse.


