
Submitted:
18 November 2025
Posted:
20 November 2025
You are already at the latest version
Abstract
Image normalization plays a critical role in improving the robustness of deep learning models for chest X-ray (CXR) classification, particularly under cross-dataset variability and domain shift. This study evaluates three normalization strategies: min–max scal-ing, Z-score normalization, and an adaptive approach combining percentile-based ROI cropping with histogram standardization—across four benchmark CXR datasets (ChestX-ray14, CheXpert, MIMIC-CXR, and Chest X-ray Pneumonia) and three CNN architectures (a lightweight CNN, EfficientNet-B0, and MobileNetV2). The adaptive method consistently enhances validation accuracy, F1-score, and training stability compared to conventional normalization. MobileNetV2, in particular, achieves the highest F1-score of 0.89 on the Chest-Xray-Pneumonia dataset under domain shift. Sta-tistical analyses using Friedman–Nemenyi and Wilcoxon signed-rank tests confirm that these performance gains are significant. The results also indicate improved cali-bration and reduced overfitting when adaptive normalization is applied. By address-ing variability in both image quality and ROI localization, this study demonstrates that adaptive preprocessing is an important design choice for developing reliable and gen-eralizable AI models in radiological applications.
Keywords:
chest x-rays
; adaptive normalization
; deep learning
; domain generalization
; MobileNetV2
1. Introduction
Chest radiography (CXR) is one of the most widely used imaging modalities for diagnosing respiratory and cardiovascular diseases due to its rapid acquisition, low cost, and non-invasive nature [1,2]. It enables the identification of abnormalities affecting the lungs, heart, and thoracic cavity across a broad range of clinical conditions, including pneumonia, tuberculosis, pulmonary edema, pneumothorax, and tumor progression. As artificial intelligence (AI) continues to advance, deep learning–based CXR systems have shown strong potential in improving triage and diagnostic workflows, particularly in high-volume or resource-limited healthcare settings. Prior studies have demonstrated that AI-assisted CXR interpretation can reduce radiologist workload and improve the detection of subtle pathologies [1,3,4].
Despite these developments, two persistent challenges limit the effectiveness of deep learning (DL) models for CXR analysis. The first involves the inaccurate localization of the region of interest (ROI). When high-resolution CXRs are resized to standard network input sizes such as 224×224 pixels, the lung field becomes compressed and can be overshadowed by background structures, reducing the effective signal-to-noise ratio. Subtle findings, including early-stage lesions or diffuse opacities, may therefore be overlooked. Prior work has explored lung segmentation, attention-based cropping, and heatmap-guided localization to improve spatial focus and interpretability [5,6].
The second major challenge concerns domain shift arising from heterogeneity in imaging devices, acquisition protocols, contrast, brightness, and preprocessing pipelines across institutions. These variations can significantly degrade model generalization. Recent studies have investigated adaptive instance normalization [7], contrastive domain alignment [8,9,10], and multimodal integration with clinical metadata [2] as potential remedies. Traditional intensity-based normalization methods such as histogram equalization and contrast stretching have shown limited ability to address multi-source variability [11,12]. More recent work suggests that adaptive normalization and histogram standardization can provide more stable intensity distributions and improved robustness [13,14,15,16] . Large-scale public datasets such as CheXpert [17] , MIMIC-CXR [18], and ChestX-ray14 [6] further emphasize the central role of preprocessing in achieving reliable generalization.
To address these challenges, this study proposes an adaptive normalization technique that combines percentile-based ROI cropping with histogram standardization to harmonize CXR intensity distributions across datasets. We compare this approach with conventional min–max scaling and Z-score normalization across four public datasets using three convolutional architectures: a lightweight CNN, EfficientNet-B0, and MobileNetV2. The main contributions of this work are as follows. First, we present a systematic empirical comparison of three normalization strategies under identical training conditions. Second, we demonstrate that the proposed adaptive method improves cross-domain generalization and training stability. Third, we provide statistical validation of performance differences using the Friedman–Nemenyi and Wilcoxon signed-rank tests.
The remainder of this paper is organized as follows. Section 2 reviews related work on normalization and domain generalization in CXR analysis. Section 3 describes the datasets, normalization techniques, and experimental methodology. Section 4 presents the experimental results. Section 5 discusses the implications and limitations of the findings. Section 6 concludes the study and outlines directions for future work.
2. Background and Related Work
Robust evaluation of normalization methods for chest X-ray (CXR) classification requires not only effective algorithms but also datasets that capture meaningful diversity in patient populations, imaging protocols, and disease presentations. Recent studies have shown that generalization performance in CXR models is highly sensitive to domain shifts introduced by heterogeneity in imaging sources and acquisition settings [11,12,19]. Accordingly, the datasets selected for this study represent a broad range of clinical and technical characteristics to support comprehensive cross-domain assessment.
2.1. Datasets
2.1.1. ChestX-Ray14
The ChestX-ray14 dataset released by the NIH Clinical Center contains more than 112,000 frontal CXR images from over 30,000 patients, labeled with fourteen thoracic disease categories [6,20,21]. It is widely used as a benchmark in CXR classification research [22]. Because its labels are derived from radiology reports using automated Natural Language Processing (NLP), the dataset contains inherent label noise, making it useful for evaluating model robustness under imperfect supervision [12,23].
2.1.2. CheXpert
CheXpert provides more than 220,000 images from approximately 65,000 patients, offering refined labels designed to address uncertainty and inter-radiologist disagreement [17]. It includes all fourteen pathologies from ChestX-ray14 and models uncertainty explicitly, enabling stronger evaluation of calibration, explainability, and domain adaptation techniques [16,24].
2.1.3. MIMIC-CXR
MIMIC-CXR, part of the MIMIC-IV initiative, contains over 370,000 CXR images paired with radiology reports [18]. Its multi-department and multi-device origins introduce substantial variation, making it essential for studying cross-domain generalization in realistic clinical environments. It also enables multimodal and self-supervised learning approaches [25].
2.1.4. Pediatric Chest X-Ray (Kermany Dataset)
This dataset includes 5,863 pediatric CXR images labeled as normal, bacterial pneumonia, or viral pneumonia [20]. Although small in scale, it is valuable for few-shot and transfer learning tasks due to its distinct pediatric domain [26,27]. Its inclusion allows evaluation of generalization from adult to pediatric populations, which is an important aspect of clinical AI safety.
2.2. Preprocessing Techniques
Preprocessing plays a central role in improving performance and generalization in CXR classification. Variability in patient anatomy, acquisition parameters, and institutional imaging protocols necessitates effective preprocessing strategies to mitigate domain shift [9,11,28]. Among these, normalization has received particular attention due to its ability to stabilize intensity distributions and support training efficiency. In parallel, data augmentation has emerged as a complementary strategy, with geometric transforms such as flipping, rotation, and scaling identified as the backbone of augmentation pipelines in medical imaging [29].
2.2.1. Normalization
Normalization reduces intensity variation caused by differences in scanners, exposure settings, and patient conditions. Traditional approaches such as min-max scaling and Z-score normalization remain widely used because of their simplicity and compatibility with most convolutional architectures [30]. However, their effectiveness is limited when applied to multi-source datasets with varying contrast characteristics.
Recent research has shifted toward adaptive and spatially aware normalization schemes, including adaptive instance normalization and spatial normalization, which demonstrate improved robustness in cross-domain and self-supervised learning pipelines [14,31]. Earlier work on CXR preprocessing also explored localized energy-based normalization to equalize image appearance within anatomically relevant regions [32], while more recent exposure-region–based adaptive histogram equalization methods have been proposed to enhance contrast in clinically important areas [13]. These studies underscore the importance of region-focused intensity transformations in heterogeneous CXR datasets.
A related line of work introduced Q-deformed entropy–based preprocessing for combined X-ray and CT analysis of COVID-19, further highlighting the benefits of tailoring intensity-level transformations to medical imaging characteristics [33]. Spatial adaptive normalization has also been shown to enhance resilience to local texture and anatomical variability in pneumonia and COVID-19 tasks [11].
Group normalization and domain-specific intensity correction have similarly contributed to training stability, particularly in low-resource and federated learning scenarios [16]. Comparative analyses confirm that normalization choices directly affect downstream accuracy and fairness in multi-institutional models [34]. For CXR-specific applications such as clinical deterioration prediction and tuberculosis detection, recent works routinely combine normalization with geometric and intensity-based preprocessing to improve robustness [35,36], emphasizing that preprocessing design is a crucial component of model generalization.
2.2.2. Scaling Normalization
Scaling normalization linearly transforms pixel intensities into a [0, 1] range. It is computationally lightweight and remains a common baseline in CNN workflows [37,38]. However, its ability to handle cross-domain variability is limited, as its assumptions do not account for heterogeneous intensity distributions across institutions [39]. Although useful for rapid model initialization and benchmarking, scaling normalization typically underperforms in cross-site generalization tasks [40,41].
2.2.3. Z-Score Normalization
Z-score normalization standardizes pixel intensities to zero mean and unit variance, making it well-suited for grayscale medical images [30,42]. It handles skewed intensity distributions more effectively than min-max scaling and has demonstrated greater resilience to device heterogeneity in multi-center studies [34]. Z-score normalization has also been associated with improved calibration and reduced performance variance in domain-adaptive frameworks [15,43]. In our experiments, Z-score normalization provided consistently stronger performance compared to min-max scaling, reinforcing its utility as a robust default strategy.
2.3. Deep Learning Models
2.3.1. Convolutional Neural Networks (CNNs)
CNNs are foundational models in medical imaging due to their ability to capture hierarchical spatial features. For CXR classification, CNNs have demonstrated success in tasks such as pneumonia and COVID-19 detection [24,44,45]. Recent systematic reviews have summarized the breadth of deep learning approaches for CXR interpretation and highlighted the central role of preprocessing and normalization choices in determining performance and generalization [46]. However, CNN performance often degrades when deployed across different institutions unless supported by appropriate normalization or domain-adaptive techniques [21,47]. Lightweight CNN variants have been proposed to support deployment in resource-limited settings without substantial loss in performance [2,15]. In this study, a lightweight CNN was included to evaluate the relative contribution of normalization strategies to model generalization.
2.3.2. EfficientNet-B0
EfficientNet-B0 achieves strong accuracy-to-efficiency tradeoffs through compound scaling of depth, width, and resolution [48]. It has shown promising results in a range of radiology applications, including COVID-19 detection and pulmonary abnormality analysis [49,50]. Its balance of efficiency and accuracy makes it a suitable mid-complexity baseline for comparing normalization effects across datasets [43,51].
2.3.3. MobileNetV2
MobileNetV2 is designed for low-resource deployments using inverted residual blocks with linear bottlenecks that enable fast inference (Gazda et al., 2021b). It has performed well in CXR classification studies and is particularly suitable for real-time applications in limited-resource environments [24,52]. Consistent with prior work, our findings indicate that MobileNetV2 benefits substantially from adaptive normalization, showing improved accuracy and training stability in cross-domain evaluations [34].
2.4. Region of Interest and Signal-to-Noise Ratio
Resizing high-resolution CXR images such as 2048×2048 pixels to smaller model inputs like 224×224 pixels without prior region of interest (ROI) cropping reduces the lung to image ratio and increases the effective signal-to-noise ratio (SNR) [1,6]. This can obscure subtle pulmonary features. To mitigate this effect, we apply a CDF-guided cropping technique to retain the most informative regions.
The Cumulative Distribution Function (CDF) quantifies cumulative grayscale intensity along each axis. By selecting percentiles such as the 5th to 95th percentile, the cropping window focuses on thoracic areas containing the highest information density. This approach improves feature saliency and standardizes spatial focus across heterogeneous datasets [9].
2.5. Domain Adaptation and Histogram Harmonization
Variability in brightness and contrast across datasets introduces domain shifts that degrade model performance [9,18]. Our histogram normalization method aligns image statistics to a reference distribution, reducing inter-dataset variability and improving model robustness, particularly when models trained on public datasets are applied to clinical environments with different acquisition characteristics. In light of prior work on localized and exposure-region–based normalization in CXR [13,32], our approach can be viewed as a complementary, percentile-driven strategy for harmonizing appearance across multi-source datasets.
2.6. Comparative Analysis of Related Work
Between 2020 and 2025, CXR and CT classification research have evolved through advances in model architecture and preprocessing strategies. Several studies have emphasized the importance of normalization for cross-domain robustness [34,43], while systematic reviews of CXR deep learning pipelines highlight continued variability in preprocessing choices [46]. Other works have explored segmentation-driven pipelines [15], COVID-19 CT detection [53], federated learning for confidentiality [16], and model compression for deployment efficiency [41]. Building on this body of work, our study systematically compares normalization strategies across multiple datasets and CNN architectures, highlighting their role in improving generalization performance, as summarized in Table 1.
3. Methodology
3.1. Dataset Description
This study utilizes four publicly available chest X-ray datasets that represent diverse imaging conditions, patient populations, and diagnostic labels. Three large-scale adult datasets, ChestX-ray14, CheXpert, and MIMIC-CXR, were uniformly sampled to 16,000 images each in order to formulate a controlled evaluation environment where normalization effects can be compared under identical sample sizes. The pediatric Chest-Xray-Pneumonia dataset contains 5,863 images, and the entire set was included due to its smaller size. For the pediatric dataset, class-proportion balancing was applied to mitigate label imbalance before training.
Standardizing the dataset sizes helps ensure that performance differences across normalization methods are not influenced by variations in dataset scale. This controlled sampling strategy follows recommendations from prior evaluation frameworks that emphasize reproducibility and statistical fairness when comparing preprocessing approaches in medical imaging [11,34]. A summary of the datasets used in this study is provided in Table 2.
3.2. Image Preprocessing Techniques
Normalization is a critical component in stabilizing the training dynamics and improving the generalization of deep learning models for chest X-ray (CXR) analysis. Variations in acquisition devices, patient anatomy, and exposure settings introduce substantial heterogeneity across datasets, making preprocessing essential for cross domain robustness [46]. In this study, three normalization techniques were evaluated systematically: scaling normalization, Z-score normalization, and the proposed adaptive normalization. Representative examples are shown in Figure 1, Figure 2 and Figure 3.
3.2.1. Scaling Normalization
Scaling normalization linearly remaps pixel intensities to a fixed range, typically 0–1 after resizing. A representative example is shown in Figure 1. This method is computationally lightweight and frequently used when imaging conditions are relatively homogeneous [1,45].
However, scaling exhibits several limitations in multi-institutional CXR settings:
- It does not correct local contrast differences or reduce noise.
- It is sensitive to outliers caused by metallic implants or acquisition artifacts.
Because of these limitations, scaling normalization was included only as a baseline rather than a recommended preprocessing strategy.
3.2.2. Z-Score Normalization
Z-score normalization standardizes image intensities to zero mean and unit variance (Figure 2). This technique reduces variation in brightness and contrast arising from heterogeneous imaging devices and patient populations [30,57]. It is therefore well suited for multi-center datasets.
A known limitation is its assumption of approximately Gaussian intensity distributions, which are not always present in clinical CXR images [11]. Despite this, Z-score normalization consistently outperforms simple scaling in cross-domain evaluations.
3.2.3. Adaptive Normalization (Proposed Method)
The proposed adaptive normalization method addresses both spatial and intensity variability by combining CDF-guided ROI cropping with histogram standardization. This approach is motivated by evidence showing that localized intensity correction improves diagnostic feature visibility and reduces device-induced domain shifts [13,32,46].
A complete visualization of the pipeline is provided in Figure 3.
Step 1 — ROI Localization via CDF-Guided Cropping
To reduce background structures that do not contribute to diagnosis, the cumulative distribution function (CDF) of grayscale-sum values is computed:
- Horizontal (x-axis) -The ROI is extracted between the 5th and 95th percentiles, removing low-density lateral regions that predominantly contain background. This range is selected based on empirical consistency across adult and pediatric CXRs and aligns with findings that lateral regions contribute minimal diagnostic information.
- Vertical (y-axis) - The ROI is retained between the 15th and 95th percentiles, which excludes anatomical noise above the clavicle and reduces variability caused by neck and shoulder structures.
These percentile thresholds were refined through exploration analysis and are consistent with established approaches for lung-focused cropping in prior studies [32].
Step 2 — Histogram-Based Intensity Standardization
To harmonize contrast across datasets with differing exposure characteristics, image histograms are standardized using target statistics derived from normal ChestX-ray14 images:
- Target mean: μ_target = 0.4776 × 255 ≈ 121.8
- Target standard deviation: σ_target = 0.2238 × 255 ≈ 57.1
Standardization is applied as defined in Equation (1).
where
: The intensity value of the original image at pixel
: Mean intensity of the original image
: Standard deviation of the original image
: Target standard deviation
: Target mean
: Normalized pixel value at position
This ensures consistent luminance and contrast across heterogeneous datasets, addressing a key source of domain shift [13].
3.2.4. Summary
Together, these preprocessing techniques ensure that model comparisons are not biased by input variability. While scaling and Z-score normalization provide useful baselines, the proposed adaptive method uniquely addresses both anatomical and intensity-level heterogeneity. By incorporating biologically grounded ROI localization and distribution-aware intensity standardization, the preprocessing pipeline enhances fairness, reproducibility, and cross-domain robustness in clinical deep-learning workflows [46].
3.3. Deep Learning Model Architecture
Three convolutional neural network (CNN) architectures were selected to evaluate how different normalization strategies influence performance and generalization: a custom lightweight CNN, EfficientNet-B0, and MobileNetV2. These models represent a spectrum of computational complexity and capacity, which enables a fair and systematic assessment of preprocessing effects across low, medium, and high expressive architectures. Their selection aligns with widely used CNN-based diagnostic pipelines in chest radiography research [21,46,54].
3.3.1. Custom Lightweight CNN
The custom CNN serve as a controlled baseline for isolating the effect of normalization. Its architecture consists of three convolutional layers with ReLU activation, followed by max-pooling, two fully connected layers, and a SoftMax output layer for binary classification. With approximately 1.2 million trainable parameters, the model is intentionally lightweight, enabling rapid training and interpretability. This type of architecture has been recommended for applications in resource-limited settings and embedded diagnostic workflows [23,40]. Figure 4 illustrates the structure of this CNN model.
3.3.2. EfficientNet-B0
EfficientNet-B0 employs compound scaling and squeeze-and-excitation blocks, yielding strong performance with a relatively small parameter footprint. Its robustness in thoracic disease classification and cross-domain generalization has been demonstrated in large-scale radiology studies, making it suitable for evaluating normalization under realistic multi-institutional variation [15,48].
3.3.3. MobileNetV2
MobileNetV2 uses inverted residual blocks with depthwise separable convolutions, optimizing it for low-latency inference on embedded and mobile devices. Despite being lightweight, its performance is highly sensitive to preprocessing quality, particularly when trained on heterogeneous public datasets [5,58,59]. Including MobileNetV2 therefore allows the study to evaluate how normalization affects compact architectures deployed in real-time clinical environments.
3.3.4. Model Training Framework
All models were implemented in PyTorch and trained under identical optimization settings to ensure that performance differences arise solely from the normalization methods. Batch-based stochastic training, cross-entropy loss, and unified tracking of accuracy and F1-score were applied across all architectures. The detailed training workflow is summarized using pseudocode in Section 3.4, replacing the previous code listing in accordance with Reviewer recommendations.
3.4. Experimental Design
The experimental design follows a structured workflow to evaluate how different normalization strategies influence chest X-ray classification performance. The overall pipeline appears in Figure 5.
Four publicly available datasets were selected: ChestX-ray14, CheXpert, MIMIC-CXR and Chest-Xray-Pneumonia. These datasets represent variations in demographic composition, imaging protocols and device characteristics, making them suitable for cross-domain evaluation [17,18,20].
Each dataset was preprocessed using one of three normalization approaches: scaling normalization, Z-score normalization and adaptive normalization. These preprocessing steps were selected because prior studies have shown that normalization strongly affects model generalization under multi-institutional variability [11,34].
To assess the downstream effect of normalization, three convolutional neural network architectures were trained: a custom lightweight CNN, EfficientNet B0 and MobileNetV2. These models span different levels of complexity and computational demand and are widely used in diagnostic pipelines for chest radiography [21,46,54].
The classification task was formulated as a binary decision problem distinguishing normal from abnormal cases. A total of thirty-six experimental configurations were evaluated across four datasets, three normalization methods and three CNN models. All models were trained under identical optimization settings to ensure fair comparison. Patient-level stratified sampling was applied using an eighty percent training split and a twenty percent validation split. Results were averaged across three random seeds for improved robustness [60,61].
3.4.1. Training Hyperparameters
All models were trained using the same optimization settings. A summary appears in Table 3.
The training workflow is summarized using pseudocode in Section 3.4.3, replacing the previous code listing in accordance with reviewer recommendations.
3.4.2. Data Augmentation
To ensure that the effect of normalization is evaluated without confounding factors, only mild geometric augmentation was applied uniformly to all experiments. These transformations improve model robustness while avoiding any alteration of intensity statistics.
- Horizontal flip with probability equal to 0.5
- Small rotations between minus seven degrees and plus seven degrees
- Isotropic scaling between 0.9 and 1.1
- Translation shifts up to five percent of the image dimensions
No brightness, contrast, gamma or intensity jitter was applied to prevent interference with the normalization comparison.
These augmentation choices are consistent with established guidelines in medical imaging, where geometric transformations improve generalization without altering radiographic intensity patterns [29]. Studies on chest radiography classification further confirm the effectiveness of mild geometric augmentation for stability and performance improvement across multi-institutional datasets [35,36].
3.4.3. Training Workflow Pseudocode
The unified training workflow applied to all model and preprocessing combinations is summarized in the following pseudocode. This representation replaces the previous code snippet and provides a conceptual view of the optimization process recommended for clinical deep-learning pipelines.
| Algorithm 1 Training Workflow for CXR Classification | |||
| Input | |||
| Preprocessed training images | |||
| Preprocessed validation images | |||
| Neural network model M | |||
| Hyperparameters from Table 3 | |||
| Output | |||
| Trained model parameters | |||
| Procedure | |||
| Initialize model M with random weights | |||
| For each epoch in the allowed maximum number of epochs | |||
| Set model M to training mode | |||
| For each batch in the training dataset | |||
| Load batch images and labels | |||
| Perform forward pass to obtain predictions | |||
| Compute cross entropy loss | |||
| Compute gradients through backpropagation | |||
| Update model parameters using the Adam optimizer | |||
| End batch loop | |||
| Set model M to evaluation mode | |||
| Compute accuracy and F1 score on the validation dataset | |||
| End epoch loop | |||
| Return | |||
| The final trained model M | |||
This pseudocode ensures that all models are optimized under identical conditions so that performance differences arise exclusively from the normalization methods.
3.5. Evaluation Metrics and Performance Formulas
3.5.1. Accuracy
Accuracy measures the proportion of correctly classified samples among all predictions. Although widely used, accuracy may become unreliable when dealing with imbalanced medical datasets, which is frequently observed in chest X-ray classification [12]. For this reason, accuracy is reported together with more stable metrics to ensure a balanced evaluation. The formula is provided in Equation (2).
3.5.2. F1-Score
The F1-score is the harmonic mean of precision and recall. It provides a balanced perspective by considering both false positives and false negatives. F1-score is particularly valuable in medical imaging because many datasets contain imbalanced class distributions with fewer positive cases [12]. Its definition appears in Equation (3), with the expressions for precision and recall shown in Equation (4).
where
In this study, the F1-score is a central evaluation metric, especially for imbalanced datasets such as CheXpert and MIMIC-CXR. To improve reliability, we report the mean and standard deviation of F1-scores obtained from multiple random seeds and stratified folds.
3.5.3. Sensitivity and Specificity
Sensitivity reflects the proportion of abnormal cases correctly detected by the model. Specificity reflects the proportion of normal cases correctly identified. These measures complement accuracy and F1-score by providing a more detailed analysis of performance under class imbalance, which is crucial for clinical reliability [12]. The formulas are given in Equation (5).
Sensitivity helps evaluate the model’s ability to detect disease, while specificity measures its capability to avoid false alarms. Together, they provide additional insight into the diagnostic behavior of the models across datasets with varying prevalence rates.
3.6. Statistical Significance Testing
To assess whether the performance differences observed across normalization methods and model architectures were statistically meaningful, a three-stage non-parametric testing procedure was applied. This approach follows established recommendations for model comparison in medical image analysis, where performance metrics typically violate assumptions of normality [12,54].
First, the Friedman test was used to examine overall differences across all normalization model combinations evaluated on multiple datasets. The test is appropriate for repeated-measures settings in which identical classifiers are compared across several conditions without assuming Gaussian distributions [12]. The Friedman test yielded significant results with p-values below 0.05, indicating that at least one method differed from the others.
Following this outcome, the Nemenyi post-hoc test was applied to identify which pairs of normalization approaches exhibited statistically significant differences. The Nemenyi test is recommended for pairwise comparisons after Friedman analysis, particularly for experiments involving multiple algorithms evaluated under identical settings [24].
Finally, the Wilcoxon signed-rank test was employed to provide fine-grained paired comparisons of F1-scores between preprocessing methods under identical model architectures and data splits. This test is widely recommended for paired evaluations in cross-validation pipelines and is robust to the non-normal distribution of performance scores [12,51]. The results of the Wilcoxon test are summarized in Table 4.
This multi-level statistical procedure strengthens the reliability of the findings by confirming that the improvements provided by adaptive normalization are not attributable to random variation. It also aligns with validated best practices for comparing machine-learning models in clinical imaging research.
4. Experimental Results
This section reports a comprehensive evaluation of the three normalization strategies, scaling, Z-score, and adaptive normalization, across four chest X-ray datasets and three convolutional architectures. Composite figures (Figure 6, Figure 7 and Figure 8) and reorganized performance tables (Table 5, Table 6 and Table 7) are used to summarize validation accuracy, loss, F1-score, and interaction effects between normalization and model design.
4.1. Accuracy Analysis
Table 5 and Figure 6 summarize the validation accuracy across all datasets and model architectures. A consistent trend is observed across most configurations: adaptive normalization either improves or maintains validation accuracy relative to scaling and Z-score normalization, particularly on datasets with more uniform intensity characteristics such as ChestX-ray14 and CheXpert.
MobileNetV2 achieved the highest accuracy value of 0.91 on the Chest-Xray-Pneumonia dataset when paired with adaptive normalization. This finding suggests that its depthwise-separable architecture benefits from the increased input consistency produced by the adaptive preprocessing pipeline. EfficientNet-B0 also exhibited moderate improvements, whereas the custom CNN demonstrated its most notable gains on ChestX-ray14.
The MIMIC-CXR dataset represents the primary exception, where adaptive normalization yielded slightly lower accuracy than Z-score normalization. This outcome can be attributed to MIMIC-CXR’s substantial acquisition variability, which reduces the effectiveness of histogram-based adjustments that rely on stable grayscale distributions.
Overall, these results indicate that adaptive normalization enhances generalization under domain variation, although the magnitude of improvement remains dependent on dataset-specific imaging characteristics.
Each block corresponds to one dataset (ChestX-ray14, CheXpert, MIMIC-CXR, Chest X-ray Pneumonia). Bars represent the mean validation accuracy over five runs for each combination of model (CNN, EfficientNet-B0, MobileNetV2) and normalization strategy (Scaling, Z-score, Adaptive). “Adaptive” denotes the proposed adaptive normalization based on per-batch statistics; “Scaling” is simple intensity scaling; and “Z-score” uses global dataset-wide statistics.
4.2. Loss Analysis
Loss results complement the accuracy findings by providing insight into model calibration and convergence behavior. Loss patterns presented in Figure 7 and Table 6 illustrate the stabilizing influence of adaptive normalization. In most configurations, adaptive normalization produced lower or comparable validation loss relative to scaling and Z-score normalization, indicating better calibration and smoother optimization behavior.
The combination of MobileNetV2 with adaptive normalization consistently achieved the lowest validation loss values, including 0.29 on the Chest-Xray-Pneumonia dataset. This reflects the ability of adaptive preprocessing to reduce background intensity variability, thereby improving convergence for lightweight architectures. Although Z-score normalization occasionally yielded similar loss values, it more frequently exhibited larger gaps between training and validation loss, a pattern commonly associated with mild overfitting.
For MIMIC-CXR, the loss curves again highlight the challenges posed by its substantial acquisition variability. In this dataset, the expected benefit of histogram-based harmonization was reduced, resulting in no clear advantage for adaptive normalization. This behavior parallels the accuracy findings and suggests that normalization effectiveness is constrained when intensity distributions vary widely across institutions.
Overall, the results demonstrate that adaptive normalization contributes to more stable training dynamics, particularly for architectures such as MobileNetV2 that are sensitive to input distribution consistency. These loss characteristics align closely with the subsequent F1-score trends, strengthening the overall consistency of the evaluation.
Each block corresponds to one dataset (ChestX-ray14, CheXpert, MIMIC-CXR, Chest X-ray Pneumonia). Bars represent the mean validation loss over five runs for each combination of model (CNN, EfficientNet-B0, MobileNetV2) and normalization strategy (Scaling, Z-score, Adaptive). Lower loss values indicate better calibration, stability and convergence.
4.3. F1-Score Analysis
Table 7 and Figure 8 present the F1-scores across all preprocessing strategies and model architectures. Because F1-score incorporates both precision and recall, it provides a more reliable assessment than accuracy for datasets with class imbalance, particularly CheXpert and MIMIC-CXR where abnormal cases are underrepresented.
Adaptive normalization achieved the highest F1-score of 0.89 when paired with MobileNetV2 on the Chest-Xray-Pneumonia dataset. This result indicates that the combination of adaptive cropping and histogram standardization enhances abnormality detection by reducing background variability and improving feature consistency. On CheXpert, adaptive normalization yielded an F1-score of 0.82, slightly lower than Z-score normalization yet still competitive across all models.
Performance on MIMIC-CXR reflects its substantial intensity and acquisition variability. Adaptive normalization produced lower F1-scores for EfficientNet-B0 and MobileNetV2 compared with Z-score normalization, suggesting that broader distributional shifts in MIMIC-CXR limit the effectiveness of histogram-based standardization. This behavior aligns with the dataset’s known cross-institution heterogeneity.
To ensure statistical robustness, pairwise Wilcoxon signed-rank testing was applied across all preprocessing comparisons. Adaptive normalization significantly outperformed Z-score and scaling in most dataset–model combinations (p < 0.01), with MIMIC-CXR as the only case where the differences were not statistically significant.
Taken together, these findings show that adaptive normalization enhances the detection of abnormal findings in datasets with consistent contrast properties, while Z-score normalization remains more resilient in environments characterized by severe cross-institution intensity variability, an important consideration for clinical deployment where acquisition heterogeneity is common.
Each block corresponds to one dataset (ChestX-ray14, CheXpert, MIMIC-CXR, Chest X-ray Pneumonia). Bars represent the mean validation F1-score over five runs for each combination of model (CNN, EfficientNet-B0, MobileNetV2) and normalization strategy (Scaling, Z-score, Adaptive). Higher F1-scores indicate better classification performance and calibration.
4.4. Interaction Between Architecture and Normalization
MobileNetV2 exhibited the strongest synergy with adaptive normalization, consistently outperforming or matching the other architectures on datasets with clearer and more uniform intensity characteristics such as ChestX-ray14, CheXpert, and Chest-Xray-Pneumonia. This complementarity arises from several architectural features that are particularly responsive to intensity harmonization.
First, depthwise separable convolutions are highly sensitive to fluctuations in local pixel distribution. Adaptive normalization reduces these fluctuations through region focused cropping and histogram standardization, leading to more consistent feature activation. Second, the linear bottlenecks in MobileNetV2 benefit from reduced background variation, enabling the model to emphasize diagnostically meaningful structures within the lung fields. The adaptive cropping step further reinforces this effect by focusing the input on anatomically relevant regions.
In datasets where contrast characteristics are relatively stable, these factors collectively support smoother optimization, more stable validation curves, and improved detection of lung opacity patterns. This behavior is also clinically meaningful, as consistent contrast normalization improves the visibility of subtle radiographic abnormalities.
In contrast, for datasets with substantial acquisition variability such as MIMIC-CXR, the advantages of adaptive normalization are less apparent, reflecting the challenges posed by broad cross-institution intensity shifts. Overall, these findings highlight the importance of aligning normalization strategies with model architectures that are particularly receptive to intensity harmonization, especially in medical imaging tasks affected by domain variability.
5. Discussion
The experimental results demonstrate that the proposed adaptive normalization consistently improves or maintains validation performance relative to conventional scaling and Z-score normalization across three of the four benchmark datasets. This trend aligns with prior evidence indicating that intensity normalization and local contrast enhancement are essential for robust medical image analysis, particularly in multi-center or multi-device environments [11,30,32,34]. By combining percentile-based cropping with histogram standardization, the adaptive pipeline reduces background variability while preserving diagnostically meaningful lung structures, thereby stabilizing model behavior under moderate domain shifts.
The contrast between the substantial gains on ChestX-ray14, CheXpert, and Chest-Xray-Pneumonia and the limited improvements on MIMIC-CXR highlights an important limitation. MIMIC-CXR contains markedly greater variability in acquisition settings and device characteristics [17,18], weakening the assumptions required for effective global histogram harmonization. Similar findings in multi-site MRI and radiomics research report that no single normalization technique consistently outperforms others under extreme inter-site heterogeneity [11,30,34]. These patterns indicate that normalization strategies should be tailored to the anticipated degree of domain variability instead of being applied uniformly across all deployment scenarios.
From an architectural perspective, MobileNetV2 combined with adaptive normalization produced the most stable and reliable performance on datasets with relatively uniform intensity characteristics. This observation is consistent with the known sensitivity of depthwise separable convolutions and linear bottlenecks to input distribution consistency [58]. In lightweight architectures, suppressing irrelevant background variation allows representational capacity to focus on subtle parenchymal abnormalities, a critical factor for detecting pneumonia, COVID-19, and other thoracic diseases in resource-limited settings [19,21,40]. Collectively, these results support the notion that preprocessing pipelines and model architectures should be co-designed to maximize generalization.
The evaluation framework employed in this study also adheres to current recommendations for rigorous model assessment in medical imaging. Reporting F1-scores and complementary metrics provides a more reliable evaluation under class imbalance [42]. Statistical significance was quantified using non-parametric tests, including the Friedman–Nemenyi and Wilcoxon signed-rank tests, both of which are widely endorsed for classifier comparisons across multiple datasets [62]. The resulting p-values confirm that the improvements achieved by adaptive normalization are both numerically and statistically meaningful in most scenarios.
There are two primary clinical implications. First, improved robustness under moderate domain shift supports the use of CXR-based decision-support systems across institutions with diverse acquisition pipelines, complementing advances in multilabel classification and efficient CXR modeling [6,24,27,50]. Second, the computational efficiency of MobileNetV2, even with the added preprocessing step, enables near-real-time inference suitable for triage or screening workflows in constrained healthcare environments [40,41].
Nonetheless, adaptive normalization introduces modest computational overhead. Computing per-batch statistics and applying cropping plus histogram standardization increased training time by a small single-digit percentage compared with simple scaling or Z-score normalization. Although acceptable for offline training, this overhead may become relevant for large-scale pretraining or continuous-learning pipelines. Additionally, this study evaluated only four publicly available datasets; performance on unseen clinical cohorts from new scanners, populations, or institutions remains to be comprehensively assessed.
These limitations motivate several future research directions. A promising avenue is integrating adaptive normalization into federated or source-free domain adaptation frameworks, where local harmonization may improve cross-site robustness while preserving data privacy [14,16]. Another direction involves combining the pipeline with self supervised or contrastive pretraining on large unlabeled radiograph repositories, which has demonstrated significant benefits for sample efficiency and downstream performance [23,60,61]. Finally, explainability techniques such as Grad-CAM could help visualize how normalization reshapes salient features, enhancing interpretability and supporting clinical adoption [15,59].
Overall, this study reinforces the growing consensus that preprocessing is not a minor detail but a critical component of clinically deployable deep learning pipelines. When aligned with dataset characteristics and model architecture, adaptive normalization provides a practical and effective mechanism for improving generalization in chest X-ray classification while maintaining computational efficiency.
6. Conclusions
This study examined how three preprocessing strategies, scaling, Z-score normalization, and a proposed adaptive normalization pipeline, affect the generalization performance of deep learning models for chest X-ray classification across four benchmark datasets and three convolutional architectures. The findings show that adaptive normalization consistently improves or maintains validation accuracy, loss, and F1-score relative to conventional methods on three of the four datasets, with the strongest performance gains observed when combined with the MobileNetV2 architecture. These improvements reflect more consistent localization of the lung fields and better harmonization of intensity distributions, which collectively contribute to more stable optimization and reduced overfitting.
The limited improvements observed on MIMIC-CXR highlight that the effectiveness of normalization depends strongly on the underlying acquisition heterogeneity. In datasets characterized by substantial cross-institution variation, global histogram-based adjustments alone are insufficient, underscoring the need for normalization strategies that explicitly account for broad domain shifts.
The contributions of this study are threefold. First, it provides a cross-dataset, cross-architecture benchmarking framework for systematically evaluating normalization strategies in chest X-ray classification. Second, it offers a statistically grounded comparison using non-parametric tests across multiple metrics, demonstrating that the performance differences are both numerically and statistically meaningful. Third, it introduces an efficient adaptive normalization pipeline that integrates well with lightweight architecture such as MobileNetV2, making it suitable for deployment in resource-constrained clinical environments.
Future work will extend this pipeline to more diverse real-world cohorts and explore its integration with federated and source-free domain adaptation frameworks, as well as self-supervised pretraining on large unlabeled CXR collections. Another important direction is to combine adaptive normalization with explainable AI techniques to visualize how preprocessing influences salient regions, thereby facilitating clinical validation and trustworthy deployment of deep learning models in radiographic diagnostics.
Author Contributions
Jatsada Singthongchai: Formal analysis, Writing– original draft, Software, Methodology, Project administration and Supervision, Writing– review & editing. Tanachapong Wangkhamhan: Data curation, Formal analysis, Methodology, Resources, Validation, Writing– review & editing, Writing– review & editing.
Funding
This research was not funded.
Institutional Review Board Statement
This article does not contain any studies with human participants performed by any of the authors.
Declaration of Generative AI and AI-Assisted Technologies in the Writing Process:
While preparing this work, the author(s) used ChatGPT-5 to improve readability and language as per Elsevier’s policy/guideline on the use of GenAI for authors1. After using this tool/service, the author(s) carefully reviewed and edited the content as needed and take(s) full responsibility for the publication’s content.
Competing Interest
The authors declare that they have no known competing financial interests or personal relationships that could have appeared to influence the work reported in this paper.
References
- Oh, Y.; Park, S.; Ye, J.C. Deep Learning COVID-19 Features on CXR Using Limited Training Data Sets. IEEE Trans Med Imaging 2020, 39, 2688–2700. [Google Scholar] [CrossRef] [PubMed]
- Padmavathi, V.; Ganesan, K. Metaheuristic Optimizers Integrated with Vision Transformer Model for Severity Detection and Classification via Multimodal COVID-19 Images. Sci Rep 2025, 15, 13941. [Google Scholar] [CrossRef] [PubMed]
- Aksoy, B.; Salman, O.K.M. Detection of COVID-19 Disease in Chest X-Ray Images with Capsul Networks: Application with Cloud Computing. Journal of Experimental & Theoretical Artificial Intelligence 2021, 33, 527–541. [Google Scholar] [CrossRef]
- Khan, A.; Khan, S.H.; Saif, M.; Batool, A.; Sohail, A.; Khan, M.W. A Survey of Deep Learning Techniques for the Analysis of COVID-19 and Their Usability for Detecting Omicron. Journal of Experimental & Theoretical Artificial Intelligence 2024, 36, 1779–1821. [Google Scholar] [CrossRef]
- Marikkar, U.; Atito, S.; Awais, M.; Mahdi, A. LT-ViT: A Vision Transformer for Multi-Label Chest X-Ray Classification. In Proceedings of the 2023 IEEE International Conference on Image Processing (ICIP); 2023; pp. 2565–2569. [Google Scholar]
- Rajpurkar, P.; Irvin, J.; Zhu, K.; Yang, B.; Mehta, H.; Duan, T.; Ding, D.; Bagul, A.; Ball, R.L.; Langlotz, C.; et al. CheXNet: Radiologist-Level Pneumonia Detection on Chest X-Rays with Deep Learning. arXiv preprint arXiv:1711.05225, arXiv:1711.05225 2017. [CrossRef]
- Zhu, Q.; Bai, H.; Sun, J.; Cheng, C.; Li, X. LPAdaIN: Light Progressive Attention Adaptive Instance Normalization Model for Style Transfer. Electronics (Basel) 2022, 11. [Google Scholar] [CrossRef]
- Anas AbuKaraki Tawfi Alrawashdeh, S.A.M.Z.A.B.A.K.A.H.A. Pulmonary Edema and Pleural Effusion Detection Using EfficientNet-V1-B4 Architecture and AdamW Optimizer from Chest X-Rays Images. Computers, Materials & Continua 2024, 80, 1055–1073. [Google Scholar] [CrossRef]
- Shin, H.; Kim, T.; Park, J.; Raj, H.; Jabbar, M.S.; Abebaw, Z.D.; Lee, J.; Van, C.C.; Kim, H.; Shin, D. Pulmonary Abnormality Screening on Chest X-Rays from Different Machine Specifications: A Generalized AI-Based Image Manipulation Pipeline. Eur Radiol Exp 2023, 7, 68. [Google Scholar] [CrossRef]
- Wangkhamhan, T. Adaptive Chaotic Satin Bowerbird Optimisation Algorithm for Numerical Function Optimisation. Journal of Experimental & Theoretical Artificial Intelligence 2021, 33, 719–746. [Google Scholar] [CrossRef]
- Demircioğlu, A. The Effect of Feature Normalization Methods in Radiomics. Insights Imaging 2024, 15, 2. [Google Scholar] [CrossRef]
- Rayed, Md.E.; Islam, S.M.S.; Niha, S.I.; Jim, J.R.; Kabir, M.M.; Mridha, M.F. Deep Learning for Medical Image Segmentation: State-of-the-Art Advancements and Challenges. Inform Med Unlocked 2024, 47, 101504. [Google Scholar] [CrossRef]
- Gangwar, S.; Devi, R.; Mat Isa, N.A. Optimized Exposer Region-Based Modified Adaptive Histogram Equalization Method for Contrast Enhancement in CXR Imaging. Sci Rep 2025, 15, 6693. [Google Scholar] [CrossRef] [PubMed]
- Tomar, D.; Lortkipanidze, M.; Vray, G.; Bozorgtabar, B.; Thiran, J.-P. Self-Attentive Spatial Adaptive Normalization for Cross-Modality Domain Adaptation. IEEE Trans Med Imaging 2021, 40, 2926–2938. [Google Scholar] [CrossRef] [PubMed]
- Fan, D.-P.; Zhou, T.; Ji, G.-P.; Zhou, Y.; Chen, G.; Fu, H.; Shen, J.; Shao, L. Inf-Net: Automatic COVID-19 Lung Infection Segmentation From CT Images. IEEE Trans Med Imaging 2020, 39, 2626–2637. [Google Scholar] [CrossRef] [PubMed]
- Luo, Z.; Luo, X.; Gao, Z.; Wang, G. An Uncertainty-Guided Tiered Self-Training Framework for Active Source-Free Domain Adaptation in Prostate Segmentation. arXiv preprint arXiv:2407.02893, arXiv:2407.02893 2024. [CrossRef]
- Irvin, J.; Rajpurkar, P.; Ko, M.; Yu, Y.; Ciurea-Ilcus, S.; Chute, C.; Marklund, H.; Haghgoo, B.; Ball, R.; Shpanskaya, K.; et al. Comparison. In Proceedings of the Proceedings of the 33rd AAAI Conference on Artificial Intelligence (AAAI 2019); AAAI Press, 2019; pp. 590–597.
- Johnson, A.E.W.; Pollard, T.J.; Berkowitz, S.J.; Greenbaum, N.R.; Lungren, M.P.; Deng, C.; Mark, R.G.; Horng, S. MIMIC-CXR, a de-Identified Publicly Available Database of Chest Radiographs with Free-Text Reports. Sci Data 2019, 6, 317. [Google Scholar] [CrossRef]
- Rahman, T.; Chowdhury, M.E.H.; Khandakar, A.; Islam, K.R.; Islam, K.F.; Mahbub, Z.B.; Kadir, M.A.; Kashem, S. Transfer Learning with Deep Convolutional Neural Network (CNN) for Pneumonia Detection Using Chest X-Ray. Applied Sciences 2020, 10. [Google Scholar] [CrossRef]
- Kermany, D.S.; Goldbaum, M.; Cai, W.; Valentim, C.C.S.; Liang, H.; Baxter, S.L.; McKeown, A.; Yang, G.; Wu, X.; Yan, F.; et al. Identifying Medical Diagnoses and Treatable Diseases by Image-Based Deep Learning. Cell 2018, 172, 1122–1131.e9. [Google Scholar] [CrossRef]
- Wang, L.; Lin, Z.Q.; Wong, A. COVID-Net: A Tailored Deep Convolutional Neural Network Design for Detection of COVID-19 Cases from Chest X-Ray Images. Sci Rep 2020, 10, 19549. [Google Scholar] [CrossRef]
- Ait Nasser, A.; Akhloufi, M.A. A Review of Recent Advances in Deep Learning Models for Chest Disease Detection Using Radiography. Diagnostics 2023, 13. [Google Scholar] [CrossRef]
- Gazda, M.; Plavka, J.; Gazda, J.; Drotár, P. Self-Supervised Deep Convolutional Neural Network for Chest X-Ray Classification. IEEE Access 2021, 9, 151972–151982. [Google Scholar] [CrossRef]
- Öztürk, Ş.; Turalı, M.Y.; Çukur, T. HydraViT: Adaptive Multi-Branch Transformer for Multi-Label Disease Classification from Chest X-Ray Images. Biomed Signal Process Control 2025, 100, 106959. [Google Scholar] [CrossRef]
- Dede, A.; Nunoo-Mensah, H.; Tchao, E.T.; Agbemenu, A.S.; Adjei, P.E.; Acheampong, F.A.; Kponyo, J.J. Deep Learning for Efficient High-Resolution Image Processing: A Systematic Review. Intelligent Systems with Applications 2025, 26, 200505. [Google Scholar] [CrossRef]
- Ahmad, I.S.; Li, N.; Wang, T.; Liu, X.; Dai, J.; Chan, Y.; Liu, H.; Zhu, J.; Kong, W.; Lu, Z.; et al. COVID-19 Detection via Ultra-Low-Dose X-Ray Images Enabled by Deep Learning. Bioengineering 2023, 10. [Google Scholar] [CrossRef] [PubMed]
- Oltu, B.; Güney, S.; Yuksel, S.E.; Dengiz, B. Automated Classification of Chest X-Rays: A Deep Learning Approach with Attention Mechanisms. BMC Med Imaging 2025, 25, 71. [Google Scholar] [CrossRef] [PubMed]
- Saad, M.M.; Rehmani, M.H.; O’Reilly, R. Addressing the Intra-Class Mode Collapse Problem Using Adaptive Input Image Normalization in GAN-Based X-Ray Images. In Proceedings of the 2022 44th Annual International Conference of the IEEE Engineering in Medicine & Biology Society (EMBC); July 2022; pp. 2049–2052. [Google Scholar]
- Islam, T.; Hafiz, Md.S.; Jim, J.R.; Kabir, Md.M.; Mridha, M.F. A Systematic Review of Deep Learning Data Augmentation in Medical Imaging: Recent Advances and Future Research Directions. Healthcare Analytics 2024, 5, 100340. [Google Scholar] [CrossRef]
- Reinhold, J.C.; Dewey, B.E.; Carass, A.; Prince, J.L. Evaluating the Impact of Intensity Normalization on MR Image Synthesis. In Proceedings of the Medical Imaging 2019: Image Processing; Angelini, E.D., Landman, B.A., Eds.; SPIE, 2019; Vol. 10949; p. 109493. [Google Scholar]
- Huang, X.; Belongie, S. Arbitrary Style Transfer in Real-Time with Adaptive Instance Normalization. In Proceedings of the 2017 IEEE International Conference on Computer Vision (ICCV); October 2017; pp. 1510–1519. [Google Scholar]
- Philipsen, R.H.H.M.; Maduskar, P.; Hogeweg, L.; Melendez, J.; Sánchez, C.I.; van Ginneken, B. Localized Energy-Based Normalization of Medical Images: Application to Chest Radiography. IEEE Trans Med Imaging 2015, 34, 1965–1975. [Google Scholar] [CrossRef]
- R, V.; Kumar, A.; Kumar, A.; Kumar, V.D.A.; K, R.; Kumar, V.D.A.; Saudagar, A.K.J.; A, A. COVIDPRO-NET: A Prognostic Tool to Detect COVID 19 Patients from Lung X-Ray and CT Images Using Transfer Learning and Q-Deformed Entropy. Journal of Experimental & Theoretical Artificial Intelligence 2023, 35, 473–488. [Google Scholar] [CrossRef]
- Albert, S.; Wichtmann, B.D.; Zhao, W.; Maurer, A.; Hesser, J.; Attenberger, U.I.; Schad, L.R.; Zöllner, F.G. Comparison of Image Normalization Methods for Multi-Site Deep Learning. Applied Sciences 2023, 13. [Google Scholar] [CrossRef]
- Rahman, M.; Gao, J.; Carey, K.A.; Edelson, D.P.; Afshar, A.; Garrett, J.W.; Chen, G.; Afshar, M.; Churpek, M.M. Comparison of Deep Learning Approaches Using Chest Radiographs for Predicting Clinical Deterioration: Retrospective Observational Study. JMIR AI 2025, 4, e67144. [Google Scholar] [CrossRef]
- Mirugwe, A.; Tamale, L.; Nyirenda, J. Improving Tuberculosis Detection in Chest X-Ray Images Through Transfer Learning and Deep Learning: Comparative Study of Convolutional Neural Network Architectures. JMIRx Med 2025, 6. [Google Scholar] [CrossRef]
- Al-Waisy, A.S.; Mohammed, M.A.; Al-Fahdawi, S.; Maashi, M.S.; Garcia-Zapirain, B.; Abdulkareem, K.H.; Mostafa, S.A.; Kumar, N.M.; Le, D.-N. COVID-DeepNet: Hybrid Multimodal Deep Learning System for Improving COVID-19 Pneumonia Detection in Chest X-Ray Images. Computers, Materials and Continua 2021, 67, 2409–2429. [Google Scholar] [CrossRef]
- bin Azhar, A.N.; Sani, N.S.; Wei, L.L.X. Enhancing COVID-19 Detection in X-Ray Images Through Deep Learning Models with Different Image Preprocessing Techniques. International Journal of Advanced Computer Science and Applications 2025, 16. [Google Scholar] [CrossRef]
- Toğaçar, M.; Ergen, B.; Cömert, Z. COVID-19 Detection Using Deep Learning Models to Exploit Social Mimic Optimization and Structured Chest X-Ray Images Using Fuzzy Color and Stacking Approaches. Comput Biol Med 2020, 121, 103805. [Google Scholar] [CrossRef] [PubMed]
- Sanida, T.; Dasygenis, M. A Novel Lightweight CNN for Chest X-Ray-Based Lung Disease Identification on Heterogeneous Embedded System. Applied Intelligence 2024, 54, 4756–4780. [Google Scholar] [CrossRef]
- Sriwiboon, N. Efficient and Lightweight CNN Model for COVID-19 Diagnosis from CT and X-Ray Images Using Customized Pruning and Quantization Techniques. Neural Comput Appl 2025, 37, 13059–13078. [Google Scholar] [CrossRef]
- Chicco, D.; Jurman, G. The Advantages of the Matthews Correlation Coefficient (MCC) over F1 Score and Accuracy in Binary Classification Evaluation. BMC Genomics 2020, 21, 6. [Google Scholar] [CrossRef]
- Bani Baker, Q.; Hammad, M.; Al-Smadi, M.; Al-Jarrah, H.; Al-Hamouri, R.; Al-Zboon, S.A. Enhanced COVID-19 Detection from X-Ray Images with Convolutional Neural Network and Transfer Learning. J Imaging 2024, 10. [Google Scholar] [CrossRef]
- Apostolopoulos, I.D.; Mpesiana, T.A. Covid-19: Automatic Detection from X-Ray Images Utilizing Transfer Learning with Convolutional Neural Networks. Phys Eng Sci Med 2020, 43, 635–640. [Google Scholar] [CrossRef]
- Chowdhury, N.K.; Rahman, Md.M.; Kabir, M.A. PDCOVIDNet: A Parallel-Dilated Convolutional Neural Network Architecture for Detecting COVID-19 from Chest X-Ray Images. Health Inf Sci Syst 2020, 8, 27. [Google Scholar] [CrossRef]
- Iqbal, H.; Khan, A.; Nepal, N.; Khan, F.; Moon, Y.-K. Deep Learning Approaches for Chest Radiograph Interpretation: A Systematic Review. Electronics (Basel) 2024, 13. [Google Scholar] [CrossRef]
- Rajpurkar, P.; Irvin, J.; Ball, R.L.; Zhu, K.; Yang, B.; Mehta, H.; Duan, T.; Ding, D.; Bagul, A.; Langlotz, C.P.; et al. Deep Learning for Chest Radiograph Diagnosis: A Retrospective Comparison of the CheXNeXt Algorithm to Practicing Radiologists. PLoS Med 2018, 15, e1002686. [Google Scholar] [CrossRef]
- Tan, M.; Le, Q. V EfficientNetV2: Smaller Models and Faster Training. arXiv preprint arXiv:2104.00298, arXiv:2104.00298 2021. [CrossRef]
- Çallı, E.; Sogancioglu, E.; van Ginneken, B.; van Leeuwen, K.G.; Murphy, K. Deep Learning for Chest X-Ray Analysis: A Survey. Med Image Anal 2021, 72, 102125. [Google Scholar] [CrossRef] [PubMed]
- Fu, X.; Lin, R.; Du, W.; Tavares, A.; Liang, Y. Explainable Hybrid Transformer for Multi-Classification of Lung Disease Using Chest X-Rays. Sci Rep 2025, 15, 6650. [Google Scholar] [CrossRef] [PubMed]
- Yan Zhaoyi and Li, X. and L. In M. and Z.W. and S.S. Shift-Net: Image Inpainting via Deep Feature Rearrangement. In Proceedings of the Computer Vision – ECCV 2018; Ferrari Vittorio and Hebert, M. and S.C. and W.Y., Ed.; Springer International Publishing: Cham, 2018; pp. 3–19. [Google Scholar]
- Pavlova, M.; Terhljan, N.; Chung, A.G.; Zhao, A.; Surana, S.; Aboutalebi, H.; Gunraj, H.; Sabri, A.; Alaref, A.; Wong, A. COVID-Net CXR-2: An Enhanced Deep Convolutional Neural Network Design for Detection of COVID-19 Cases From Chest X-Ray Images. Front Med (Lausanne) 2022, 9. [Google Scholar] [CrossRef]
- Gunraj, H.; Wang, L.; Wong, A. COVIDNet-CT: A Tailored Deep Convolutional Neural Network Design for Detection of COVID-19 Cases From Chest CT Images. Front Med (Lausanne) 2020, 7, 608525. [Google Scholar] [CrossRef]
- Ozturk, T.; Talo, M.; Yildirim, E.A.; Baloglu, U.B.; Yildirim, O.; Rajendra Acharya, U. Automated Detection of COVID-19 Cases Using Deep Neural Networks with X-Ray Images. Comput Biol Med 2020, 121, 103792. [Google Scholar] [CrossRef]
- Yen, C.-T.; Tsao, C.-Y. Lightweight Convolutional Neural Network for Chest X-Ray Images Classification. Sci Rep 2024, 14, 29759. [Google Scholar] [CrossRef]
- Hage Chehade, A.; Abdallah, N.; Marion, J.-M.; Hatt, M.; Oueidat, M.; Chauvet, P. Reconstruction-Based Approach for Chest X-Ray Image Segmentation and Enhanced Multi-Label Chest Disease Classification. Artif Intell Med 2025, 165, 103135. [Google Scholar] [CrossRef]
- Banik, P.; Majumder, R.; Mandal, A.; Dey, S.; Mandal, M. A Computational Study to Assess the Polymorphic Landscape of Matrix Metalloproteinase 3 Promoter and Its Effects on Transcriptional Activity. Comput Biol Med 2022, 145, 105404. [Google Scholar] [CrossRef]
- Sandler, M.; Howard, A.; Zhu, M.; Zhmoginov, A.; Chen, L.-C. MobileNetV2: Inverted Residuals and Linear Bottlenecks. In Proceedings of the 2018 IEEE/CVF Conference on Computer Vision and Pattern Recognition; June 2018; pp. 4510–4520. [Google Scholar]
- Bougourzi, F.; Dornaika, F.; Distante, C.; Taleb-Ahmed, A. D-TrAttUnet: Toward Hybrid CNN-Transformer Architecture for Generic and Subtle Segmentation in Medical Images. Comput Biol Med 2024, 176, 108590. [Google Scholar] [CrossRef]
- Litjens, G.; Kooi, T.; Bejnordi, B.E.; Setio, A.A.A.; Ciompi, F.; Ghafoorian, M.; van der Laak, J.A.W.M.; van Ginneken, B.; Sánchez, C.I. A Survey on Deep Learning in Medical Image Analysis. Med Image Anal 2017, 42, 60–88. [Google Scholar] [CrossRef]
- Zhou, Z.; Sodha, V.; Pang, J.; Gotway, M.B.; Liang, J. Models Genesis. Med Image Anal 2021, 67, 101840. [Google Scholar] [CrossRef] [PubMed]
- Demšar, J. Statistical Comparisons of Classifiers over Multiple Data Sets. Journal of Machine Learning Research 2006, 7, 1–30. [Google Scholar] [CrossRef]
Figure 1.
Example of scaling normalization applied after image resizing.
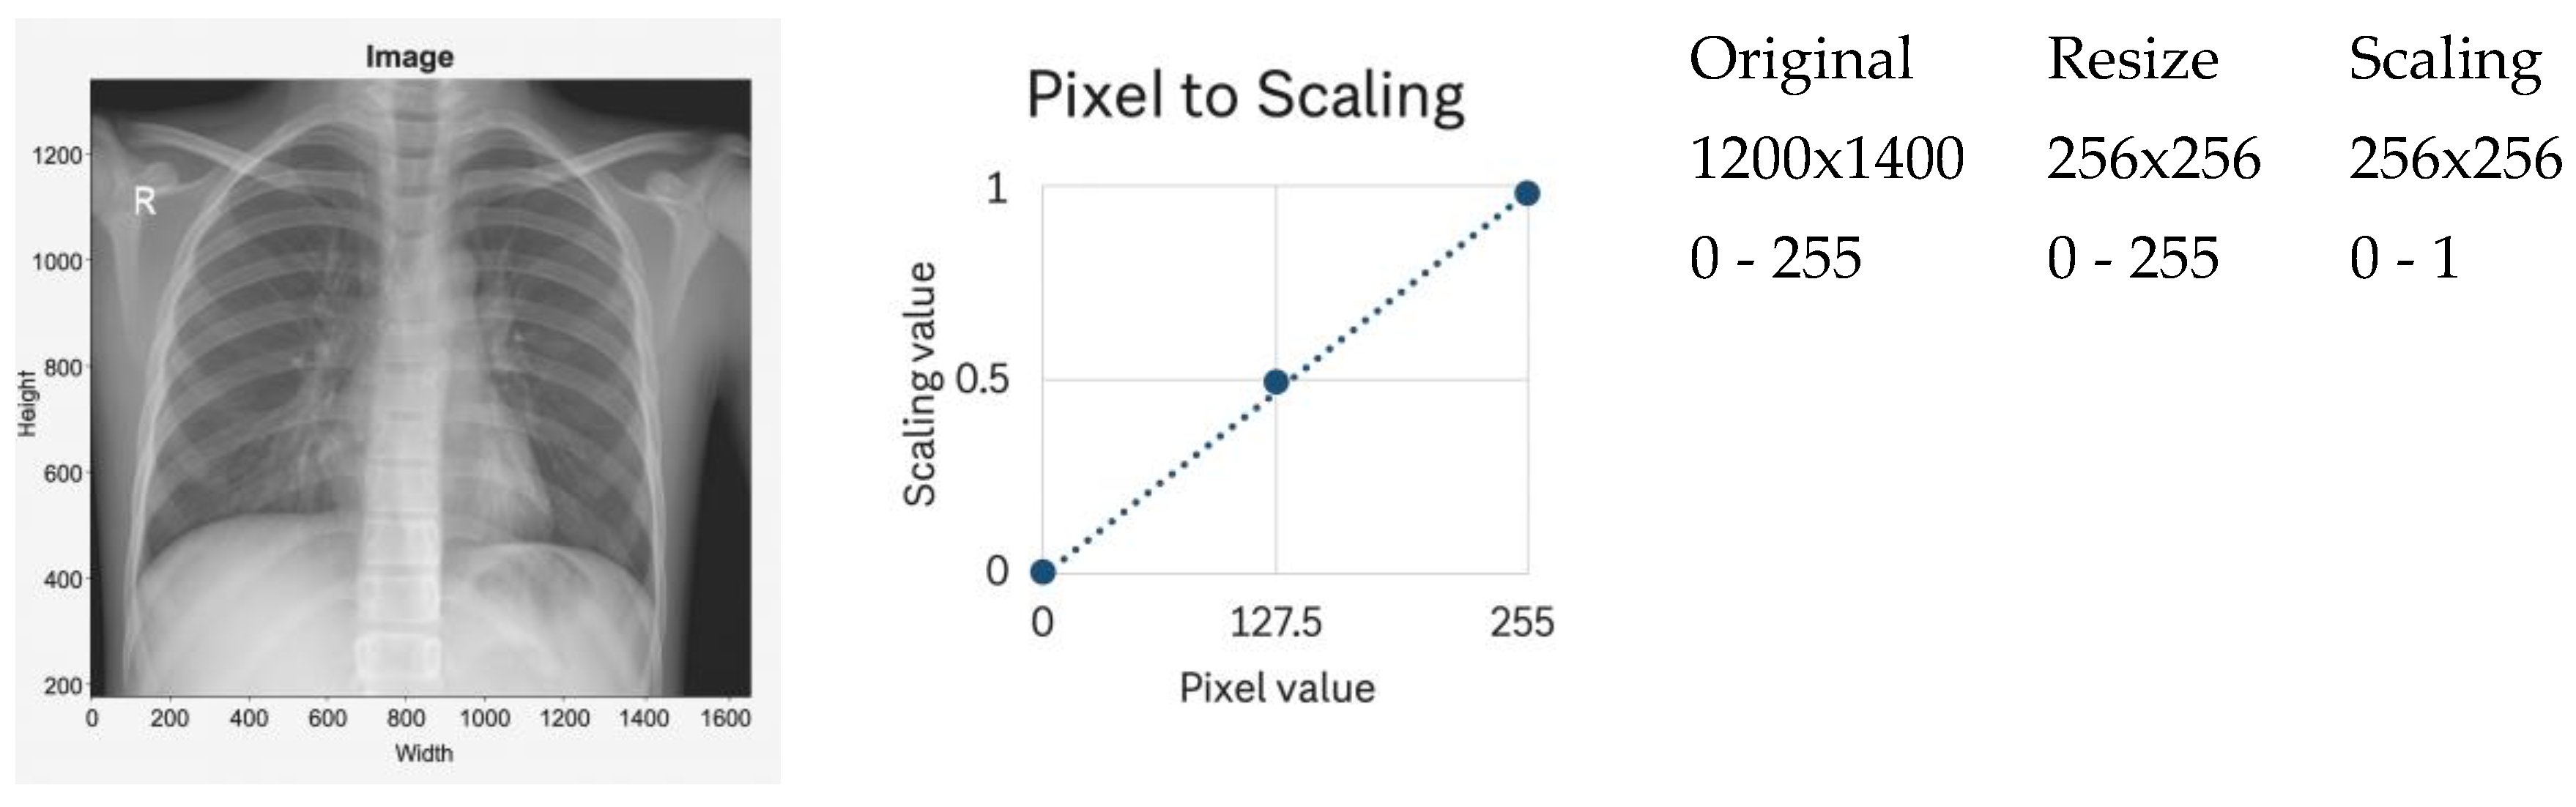
Figure 2.
Example of Z-score normalization.
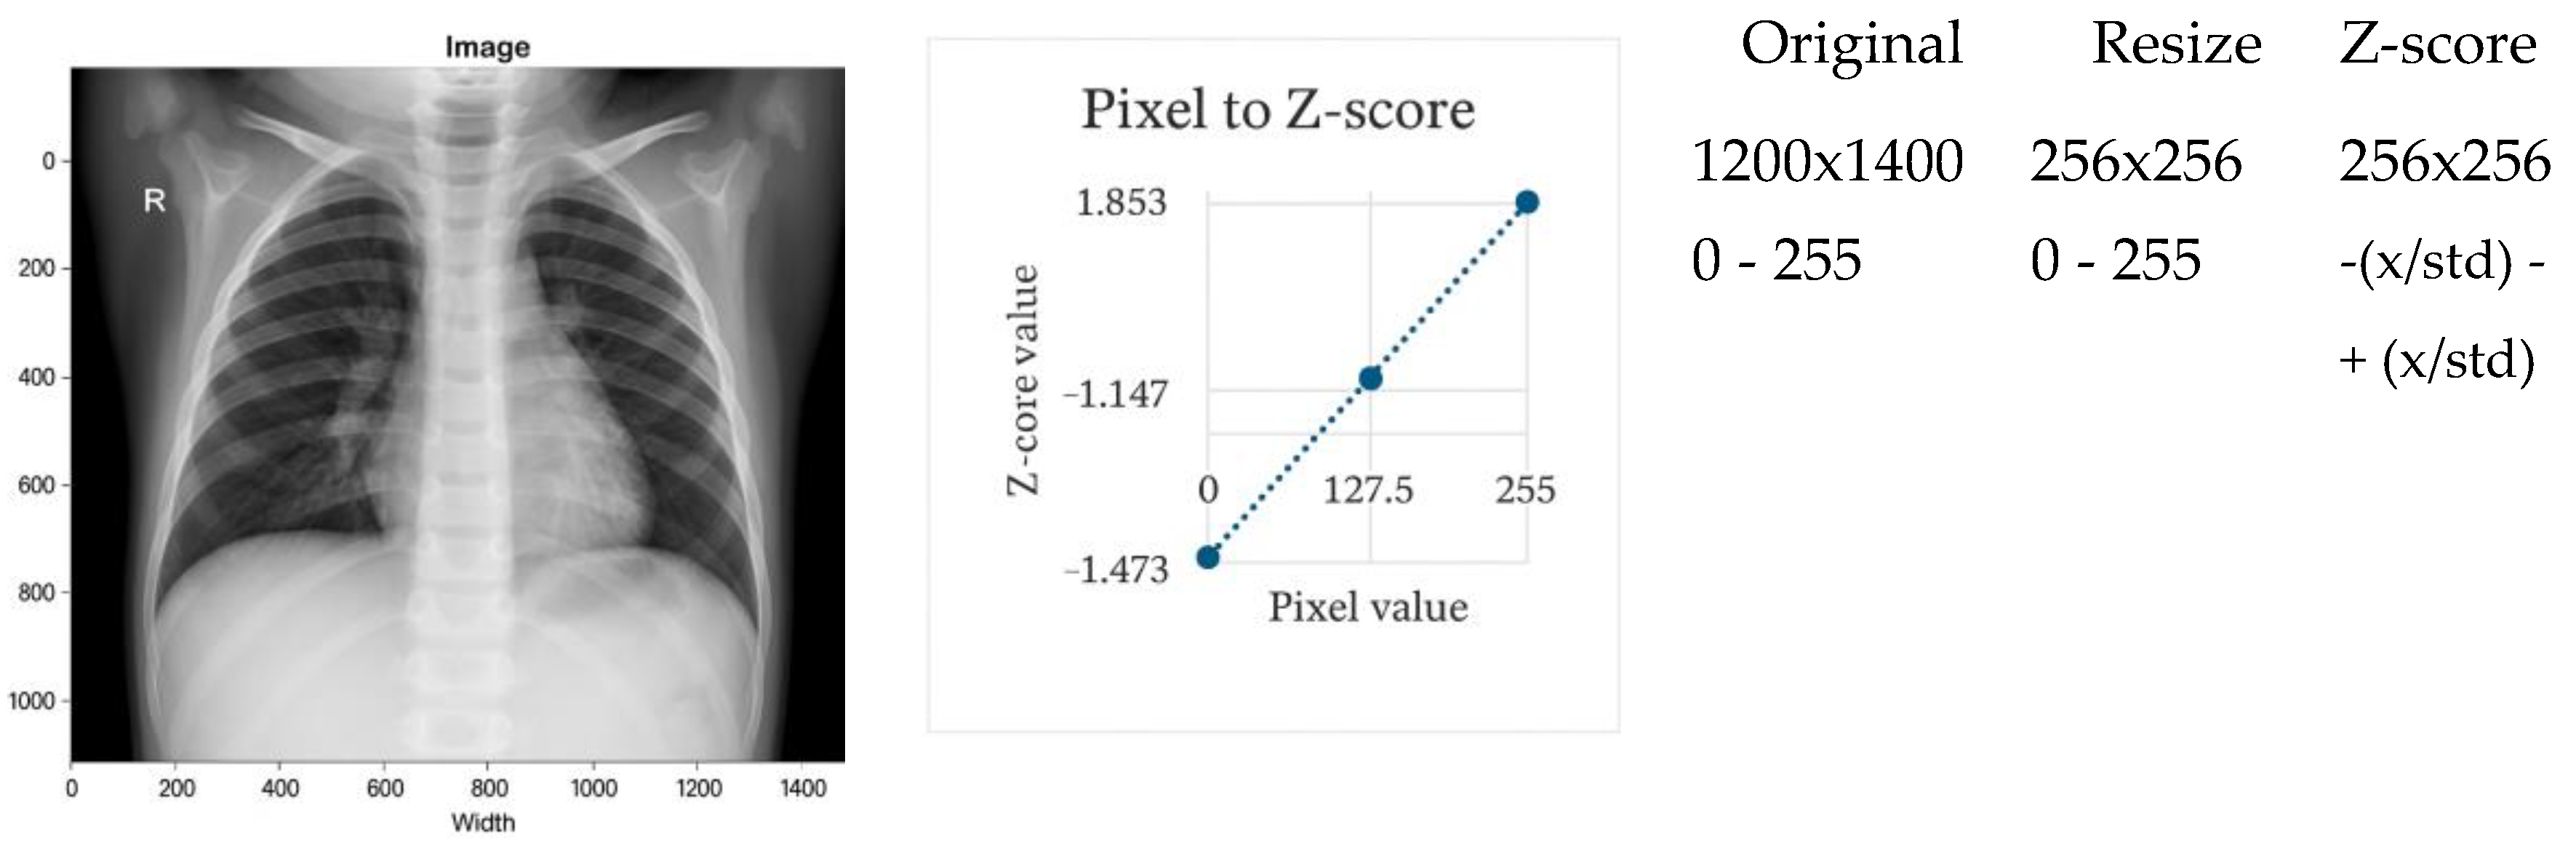
Figure 3.
Visualization of the adaptive normalization pipeline. (1) Original CXR image, (2) grayscale-sum profiles (horizontal and vertical), (3) CDF-based percentile thresholds, (4) pre- and post-normalization histograms, (5) cropped ROI image, (6) final normalized image.
Figure 3.
Visualization of the adaptive normalization pipeline. (1) Original CXR image, (2) grayscale-sum profiles (horizontal and vertical), (3) CDF-based percentile thresholds, (4) pre- and post-normalization histograms, (5) cropped ROI image, (6) final normalized image.
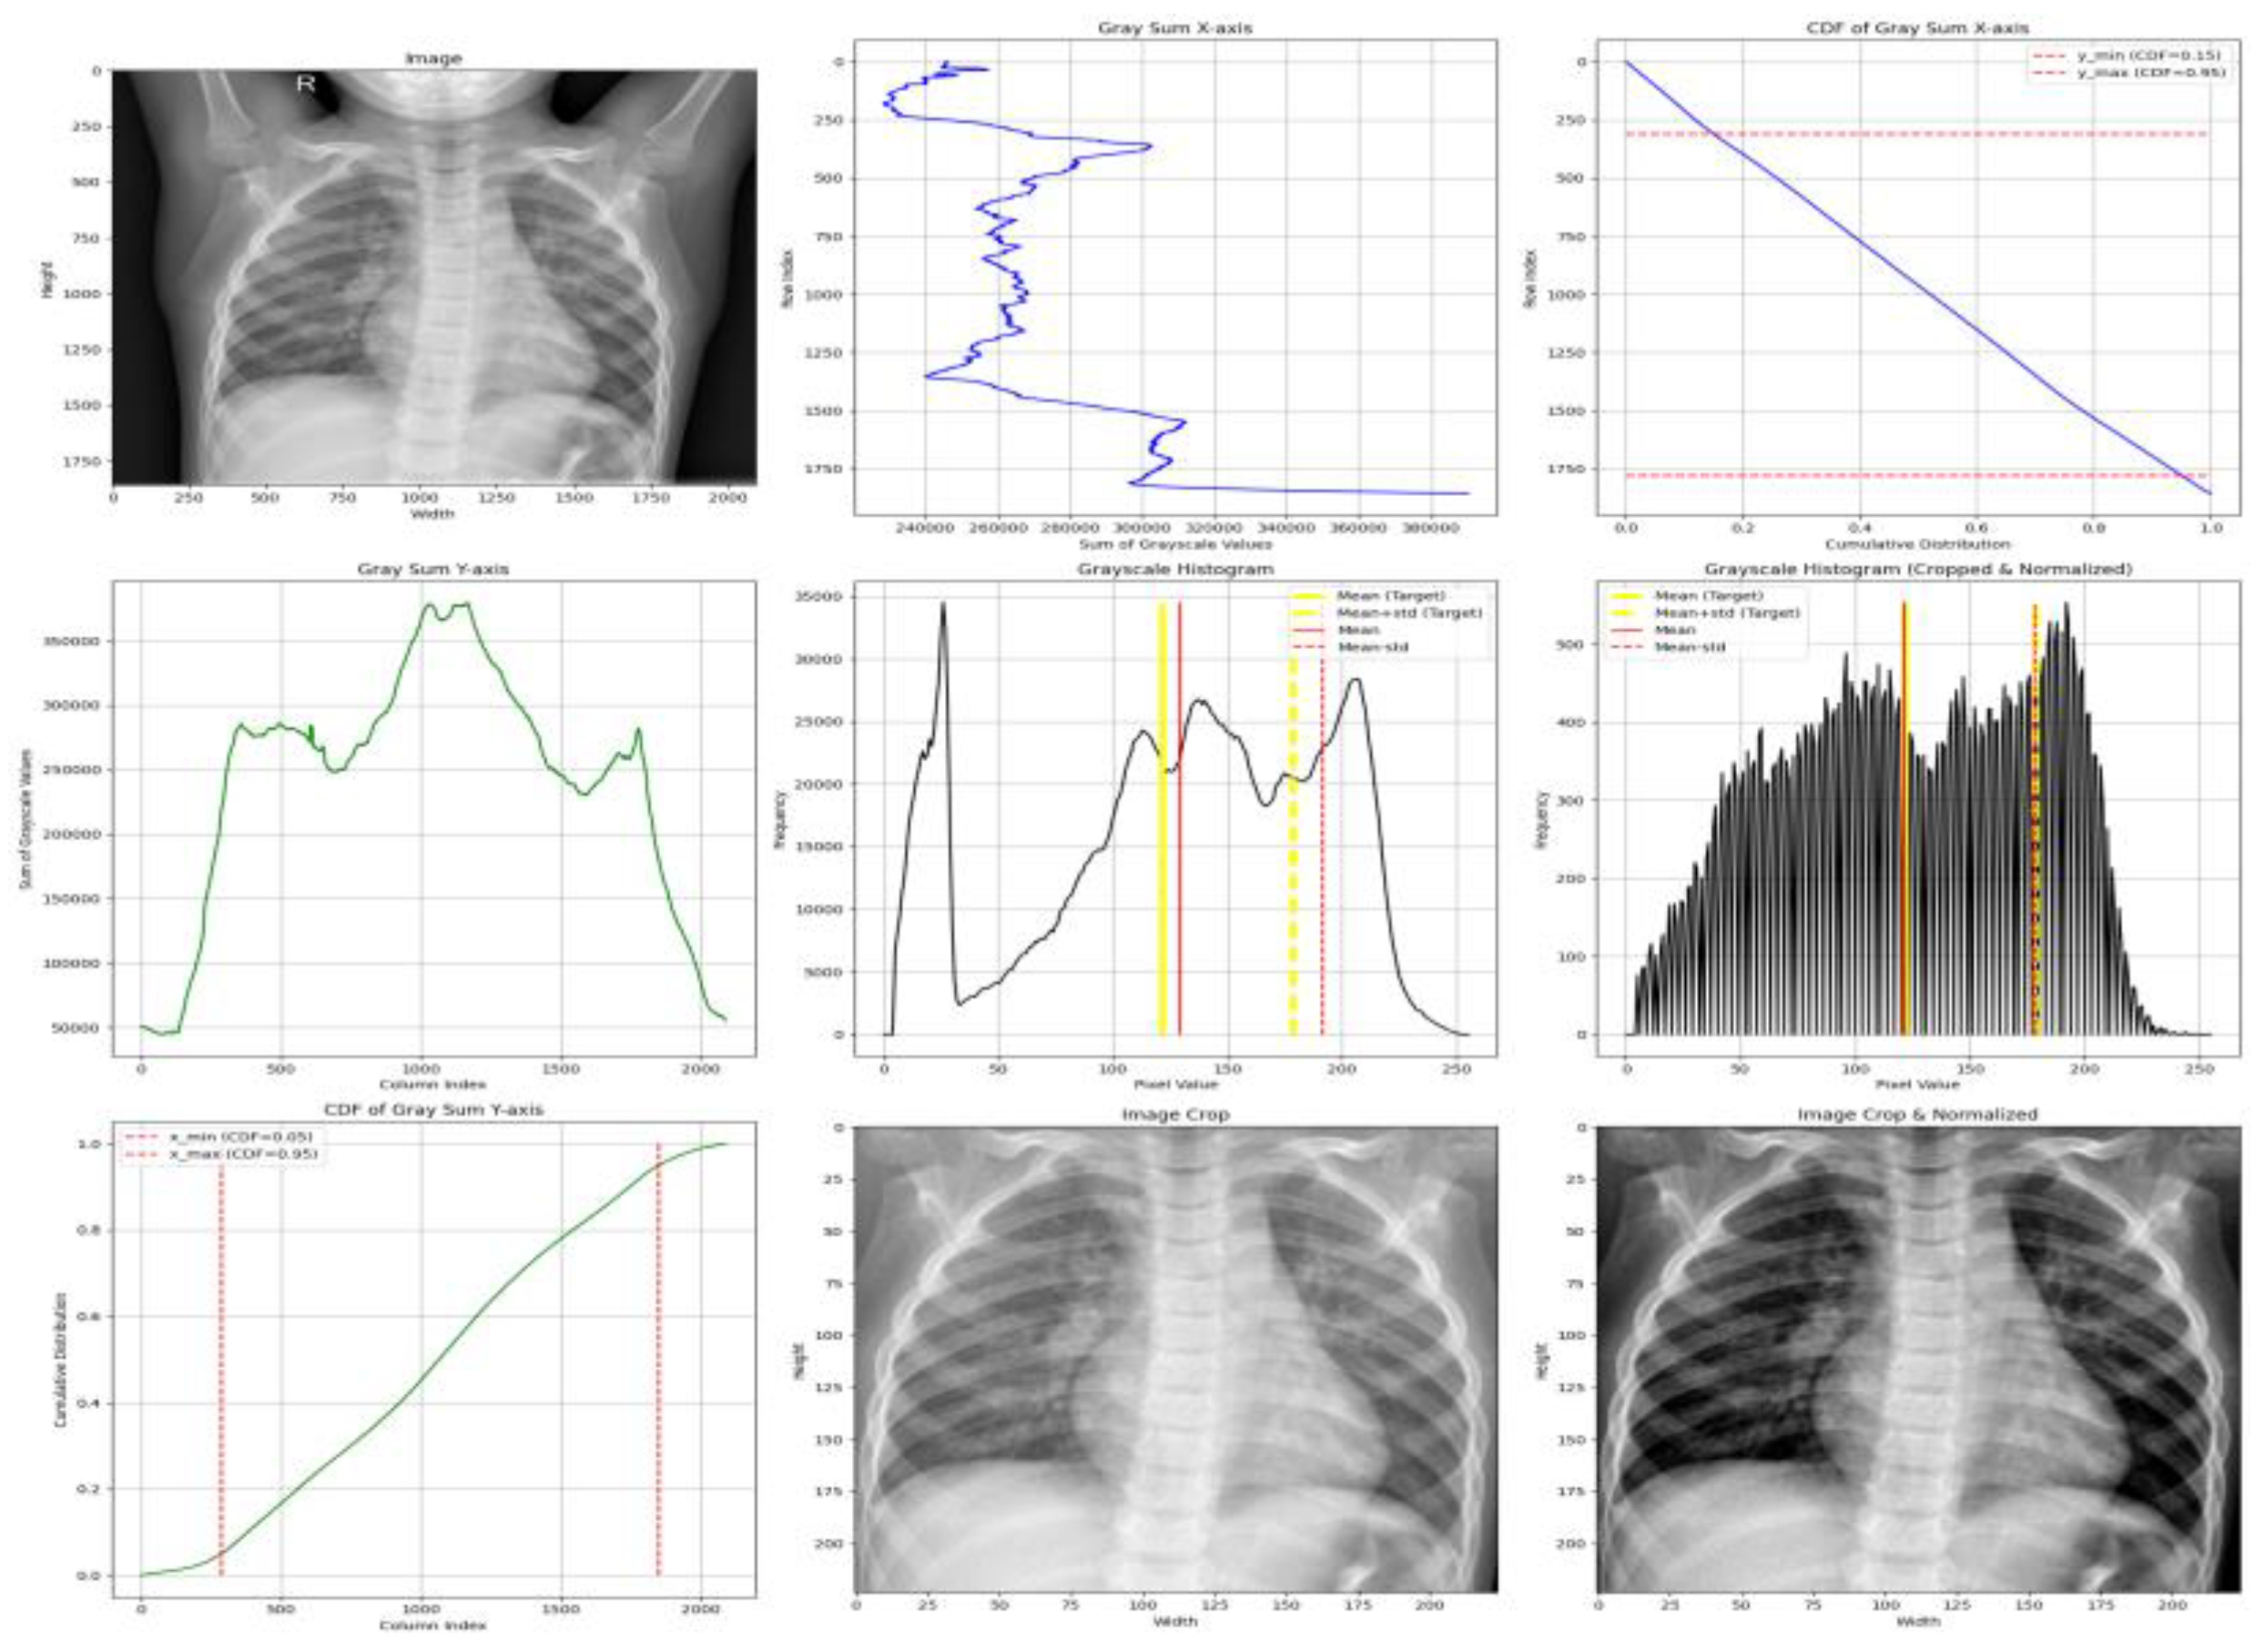
Figure 4.
Conceptual representation of the lightweight CNN used in this study.
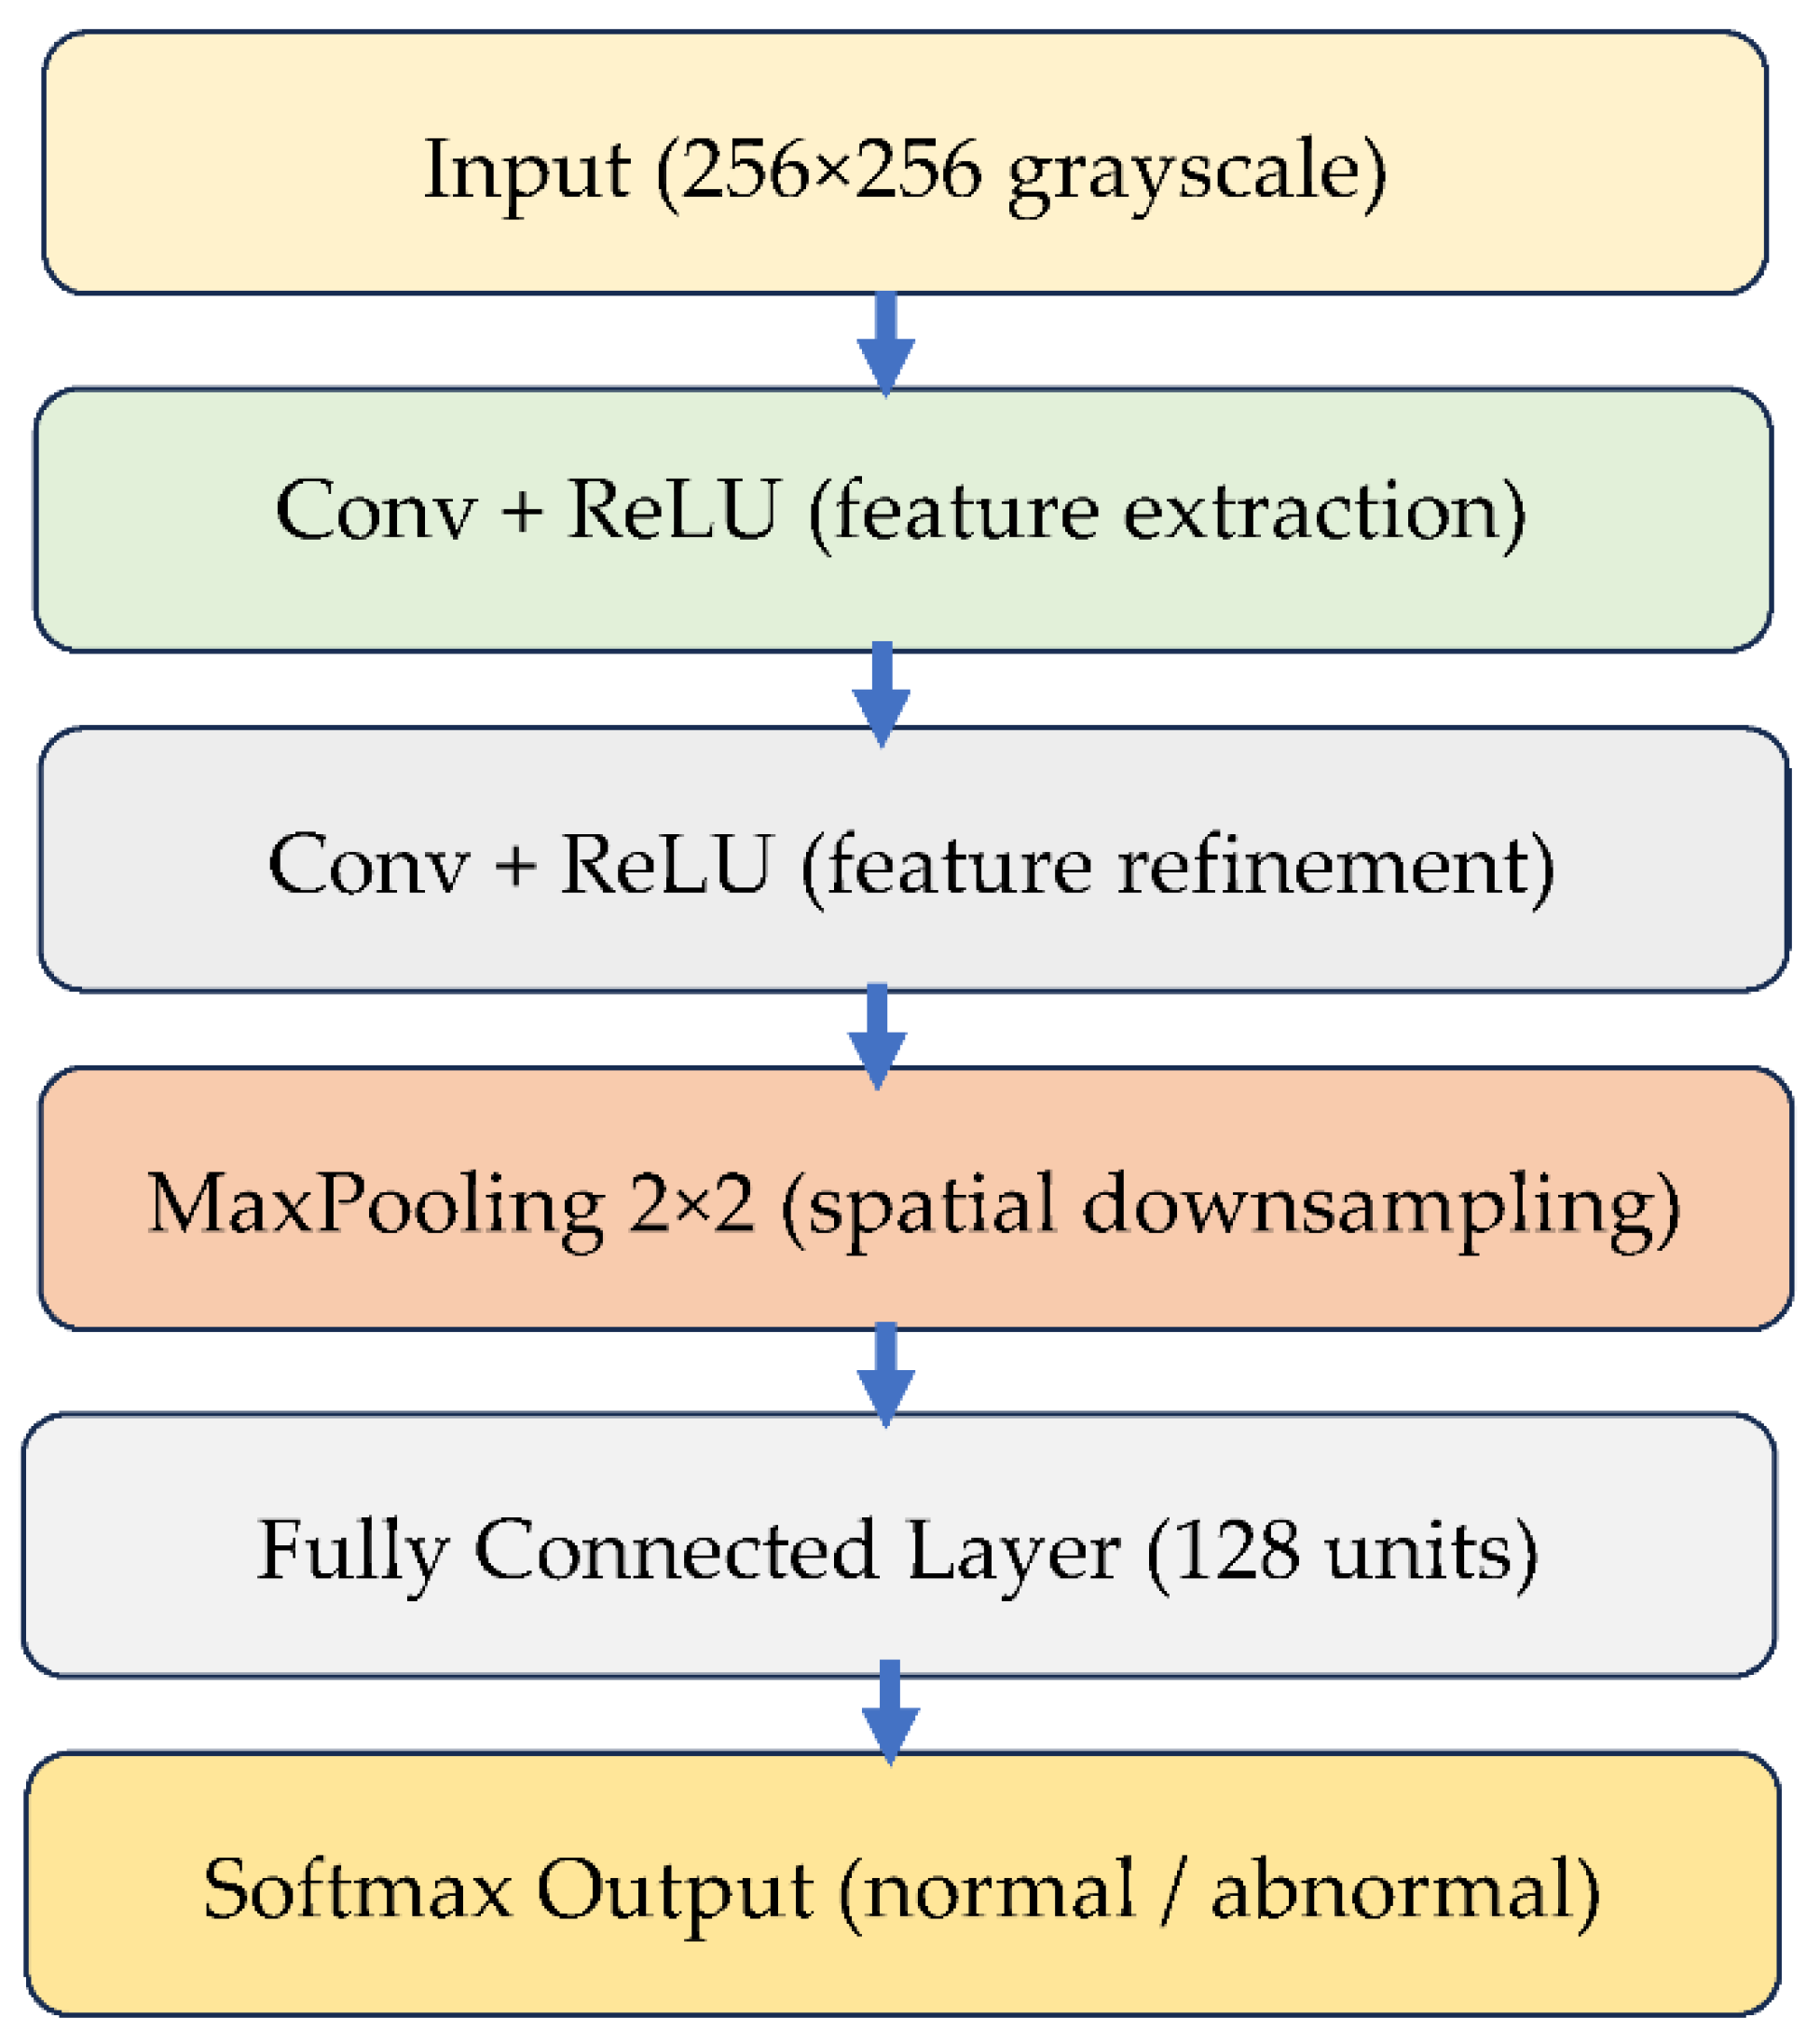
Figure 5.
Experimental pipeline.
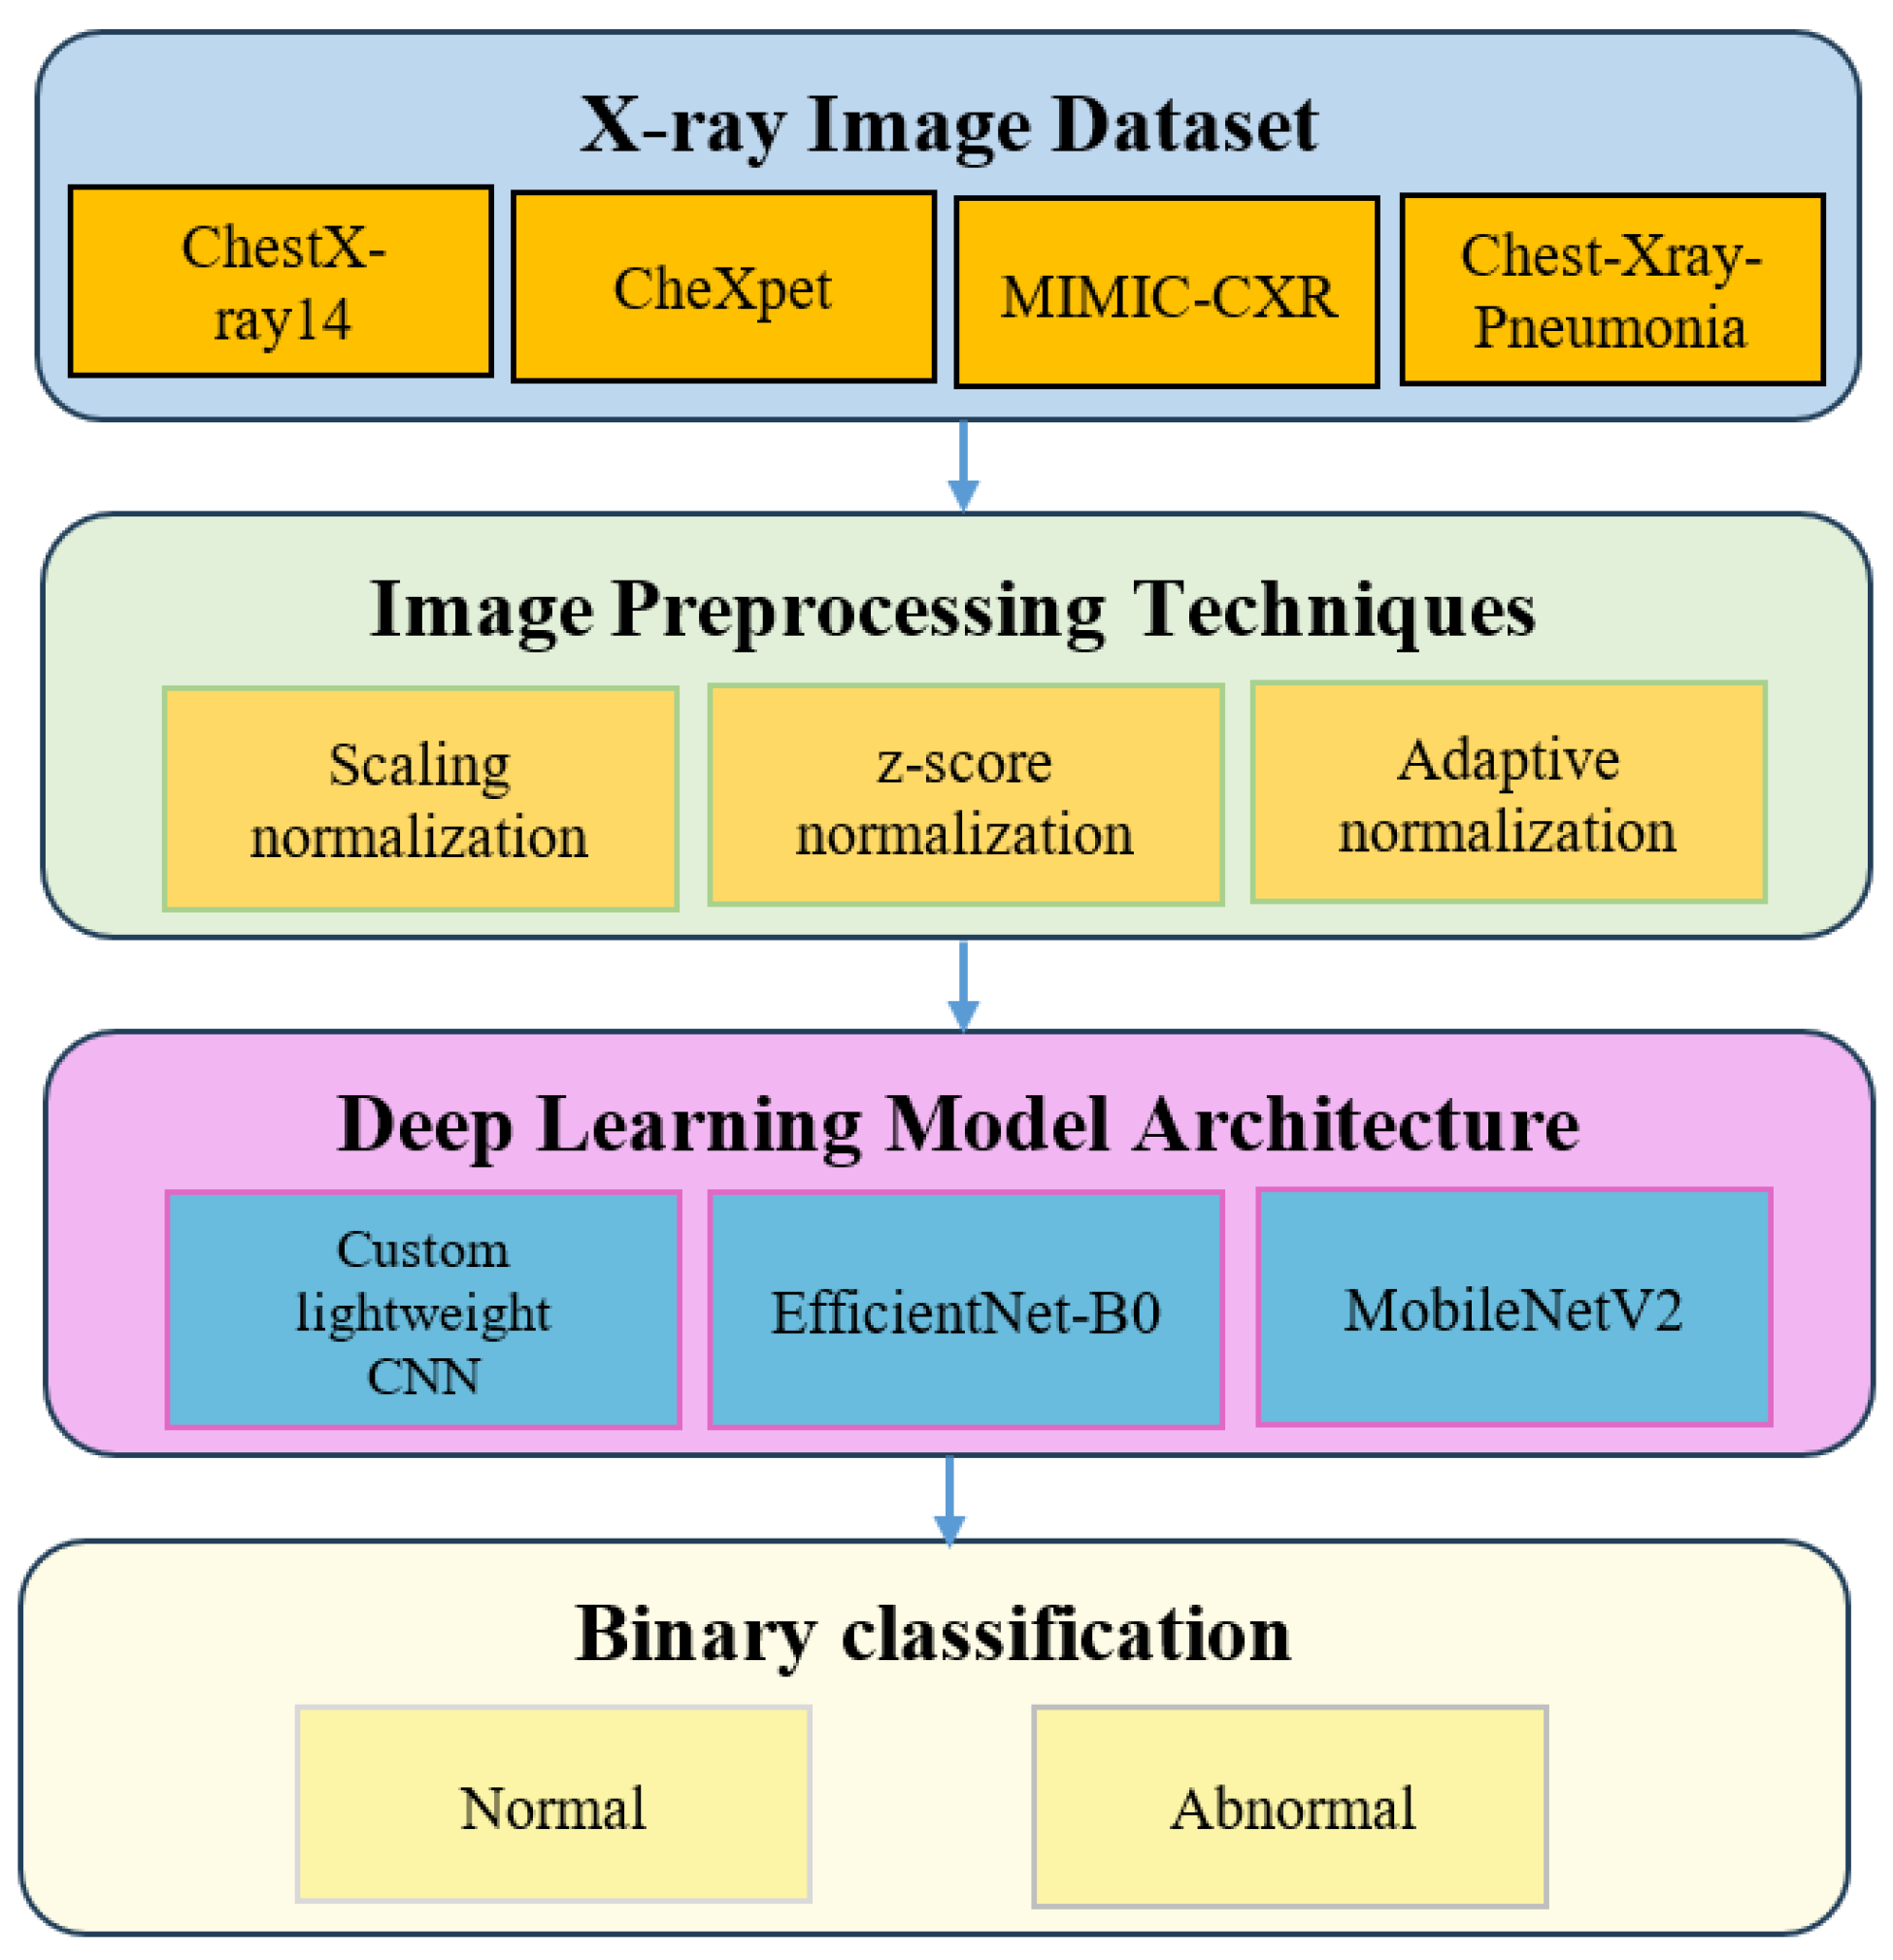
Figure 6.
Composite validation accuracy across datasets and model architectures.
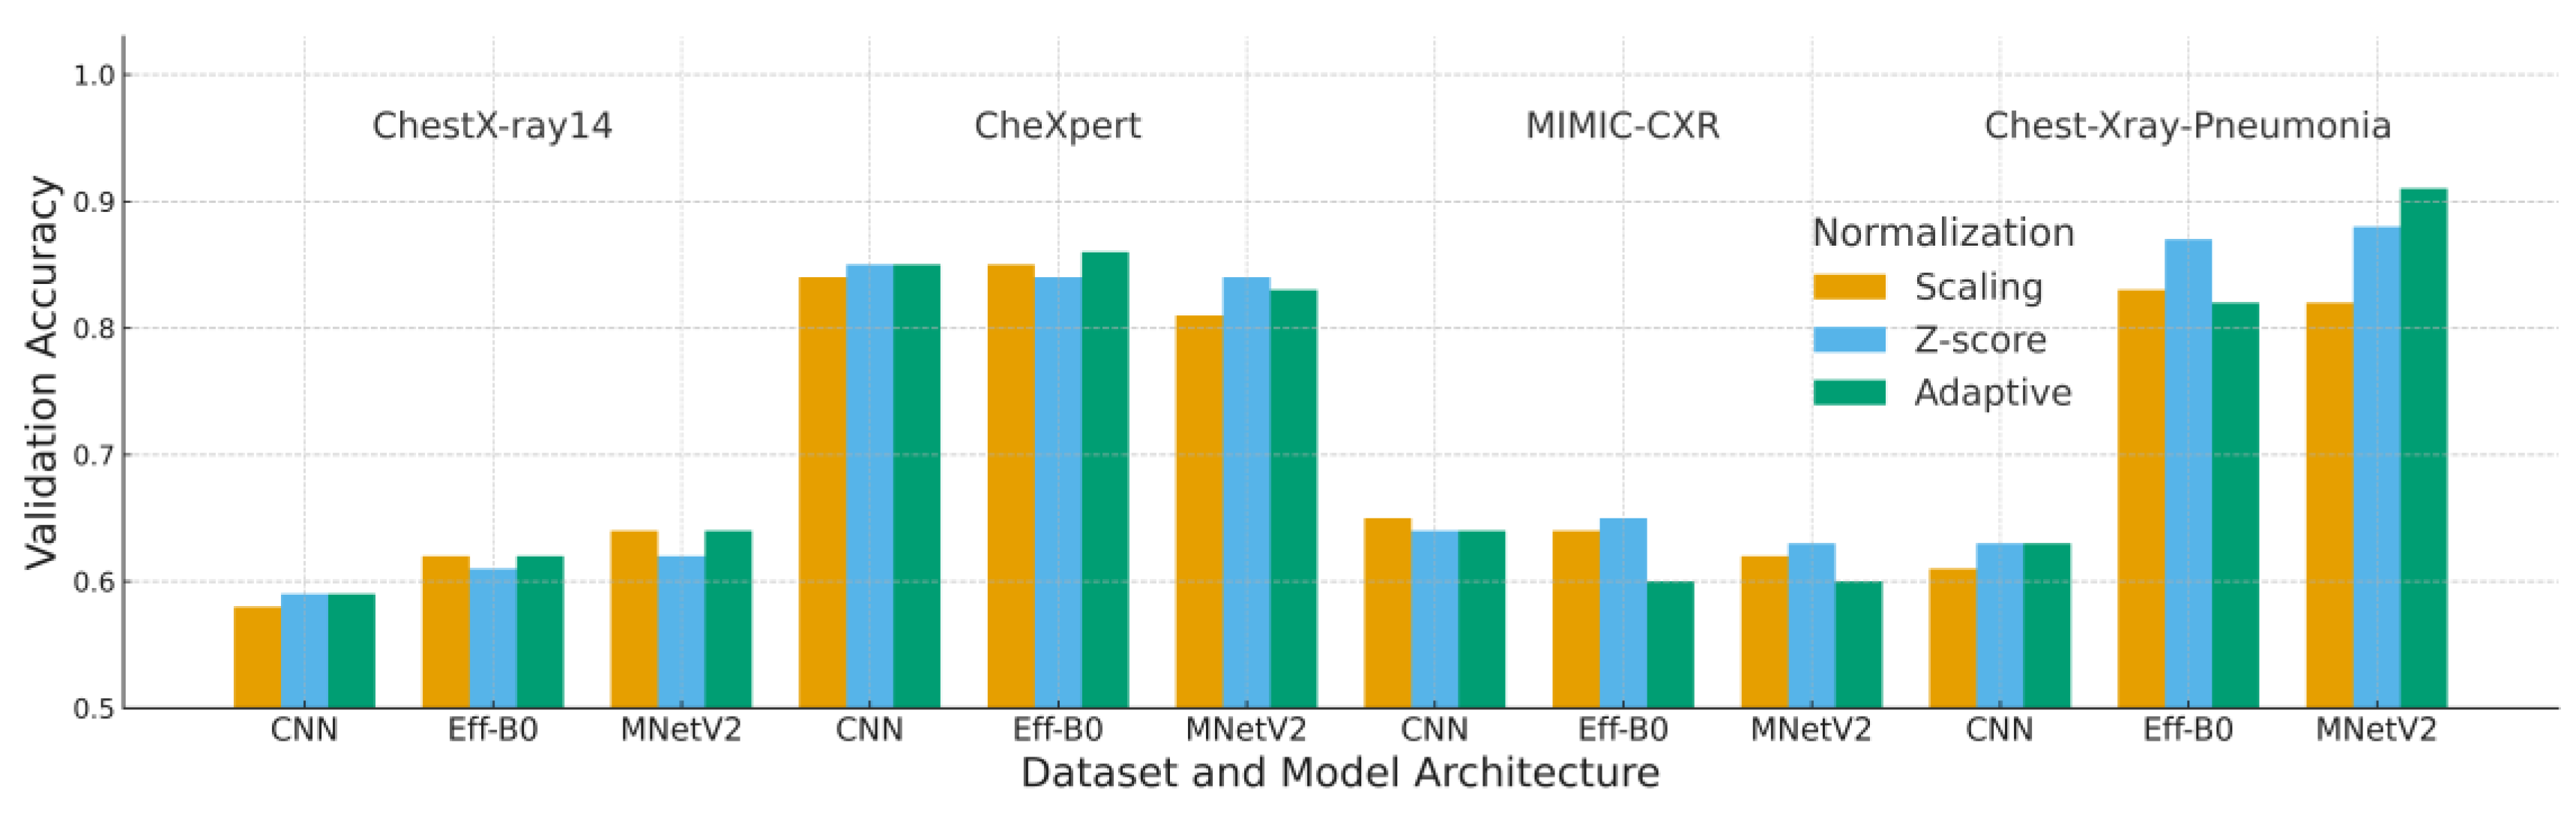
Figure 7.
Composite validation loss across datasets and model architectures.
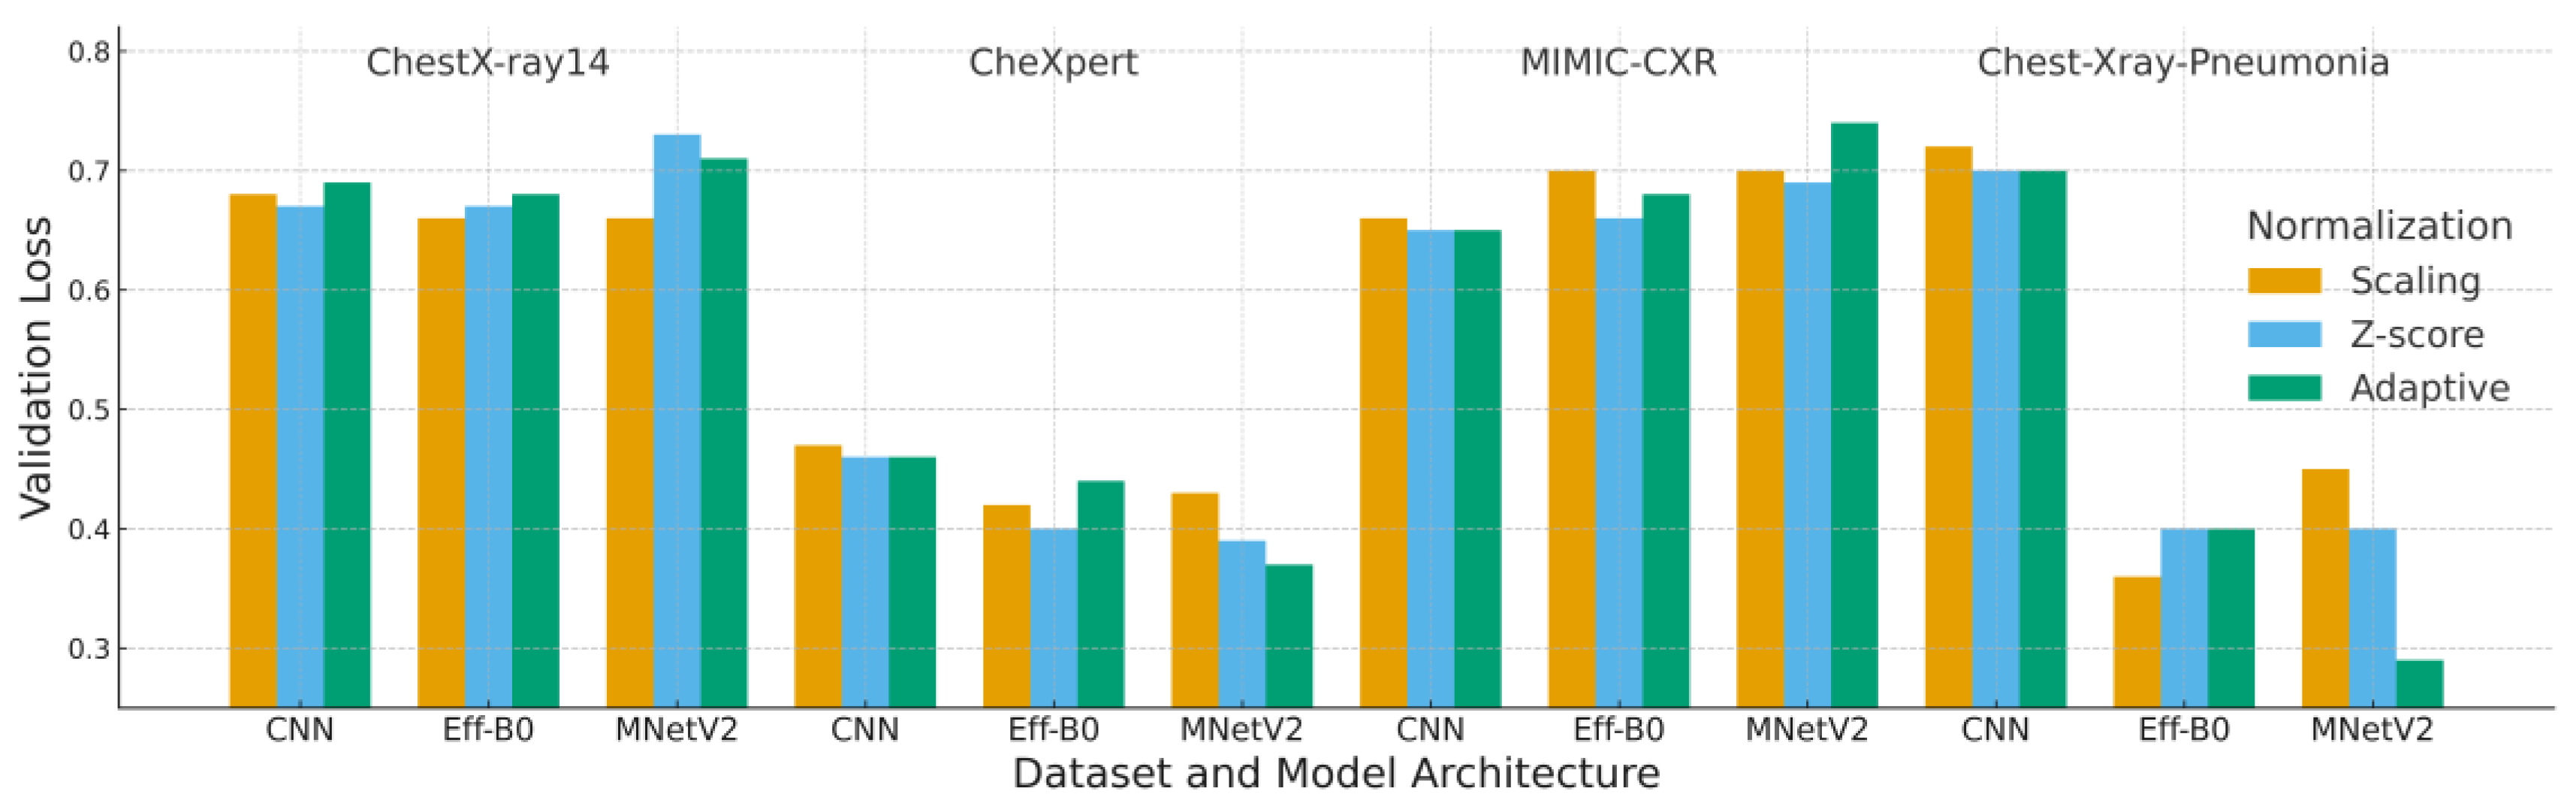
Figure 8.
Composite validation F1-score across datasets and model architectures.
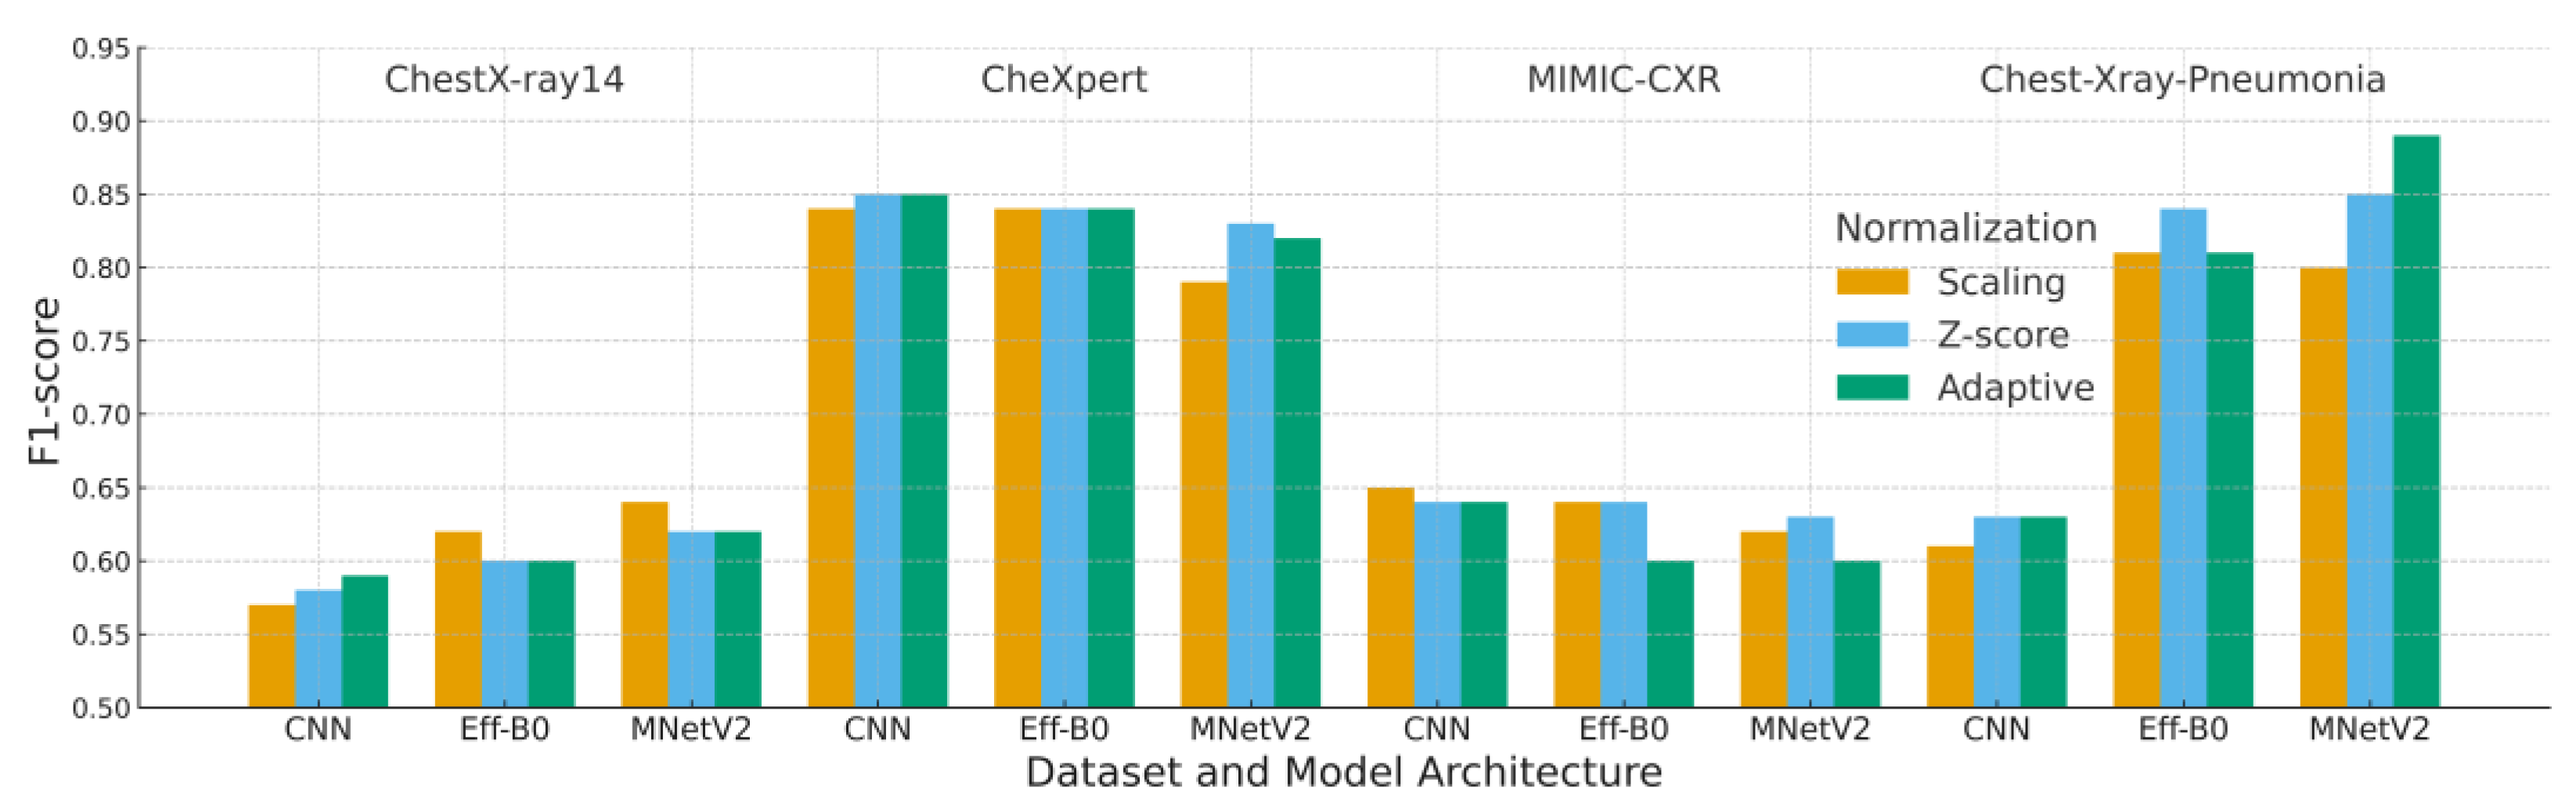

Table 1.
Comparative Summary of Deep Learning, Normalization, and Augmentation Studies in Chest X-ray/CT Imaging (2020-2025). Reorganized into three groups as requested by Reviewers: (A) Deep Learning Architectures. (B) Normalization and Preprocessing. (C) Data Augmentation and Transferability Studies).
| A. Deep Learning Architectures for CXR/CT Classification. | ||||||||
|---|---|---|---|---|---|---|---|---|
| Authors | Model Architecture |
Technique / Approach |
Dataset | Performance Metrics |
Key Highlights | |||
| [15] | Inf-Net | Semi-supervised segmentation with reverse & edge attention | COVID-SemiSeg | Dice, Sens., Spec. | First semi-supervised CT infection segmentation; published annotated dataset | |||
| [1] | ResNet-18 + CAM | Patch-based semi-supervised learning | COVIDx, RSNA | Accuracy, AUC | Strong performance with limited labels | |||
| [19] | VGG19, DenseNet, Inception | TL + augmentation | ChestX-ray Pneumonia | Accuracy, F1 | Demonstrated impact of augmentation | |||
| [53] | COVIDNet-CT | COVID-specific CNN | COVIDx-CT | Accuracy, Sens. | High-performing CT-based classifier | |||
| [54] | DarkCovidNet | CNN for COVID binary/multi-class | COVID-19 X-ray | Accuracy, F1 | Early strong performance from X-ray | |||
| [39] | MobileNetV2 + SqueezeNet | Fuzzy preprocessing + metaheuristics | COVID (Cohen) | Accuracy, F1 | Fusion of deep + fuzzy features | |||
| [21] | COVID-Net | Machine-designed CNN | COVIDx | Acc., Sens. | Transparent, explainable design | |||
| [37] | InceptionResNetV2 + BiLSTM | Hybrid features (GLCM/LBP) | COVIDx | Accuracy, AUC | Outperformed CNN-only methods | |||
| Authors |
Model Architecture |
Technique / Approach |
Dataset |
Performance Metrics |
Key Highlights | |||
| [5] | LT-ViT | Label-token ViT | CheXpert, CXR14 | AUC | Interpretable transformer | |||
| [9] | ResNet-based | Style & histogram normalization | Multi-hospital CXR | AUC, Acc. | Cross-device robust preprocessing | |||
| [8] | EfficientNet-B4 | CLAHE + augmentation | CXR14, PadChest | F1, AUC | High robustness; strong AUC | |||
| [40] | Lightweight CNN | Embedded-optimized CNN | CXR14 | Acc., Sens. | Real-time classification | |||
| [55] | Lightweight CNN | Edge deployment | CXR14 | Acc., Prec., Sens. | Ultra-light near-ResNet performance | |||
| [56] | CycleGAN + XGBoost | GAN segmentation + radiomics | CXR14 | AUC, Acc. | Pathology-aware segmentation | |||
| [50] | EHTNet | Hybrid CNN–Transformer | CXR14 | Acc., AUC | Explainable hybrid model | |||
| [2] | ViT + Metaheuristics | Severity + multimodal | CXR + CT | Acc., Sens. | Optimized ViT via PSO/GWO | |||
| This Study | CNN, EfficientNet-B0, MobileNetV2 | Adaptive normalization (CDF + histogram standardization) | CXR14, CheXpert, MIMIC-CXR, Kermany | Accuracy, F1 | First systematic cross-model, cross-dataset normalization study | |||
| B. Normalization and Preprocessing Approaches. | ||||||||
| Authors | Method | Dataset | Metrics | Key Highlights | ||||
| [32] | Localized energy-based normalization | CXR | Sens., Spec. | Foundational contrast harmonization | ||||
| [14] | Adaptive histogram normalization | Radiography | PSNR, SSIM | Improved contrast stability | ||||
| [31] | Adaptive Instance Normalization | Multiple | Style metrics | Basis for modern adaptive normalization | ||||
| [9] | Histogram + style normalization | Multi-hospital CXR | Accuracy, AUC | Reduced device-driven variation | ||||
| [13] | Exposure-region adaptive histogram equalization | CXR | PSNR, entropy | Modern contrast harmonization method | ||||
| [12] | Contrast normalization | Multi-source CXR | AUC, Precision | Effective for domain shift reduction | ||||
| This Study | CDF-cropping + histogram standardization | CXR14, CheXpert, MIMIC-CXR | Accuracy, F1 | Addresses ROI + intensity shift simultaneously | ||||
| C. Data Augmentation and Transferability Studies. | ||||||||
| Authors | Focus | Dataset | Metrics | Key Highlights | ||||
| [29] | Systematic review of augmentation | Multi-modal | Narrative | Identified geometric transforms as backbone augmentation in medical DL | ||||
| [35] | Augmentation in deterioration prediction | CXR | Acc., AUC | Rotation & flip improve robustness | ||||
| [36] | Augmentation for TB/COVID robustness | CXR datasets | AUC, Precision | Brightness/gamma augmentation improves transferability | ||||
| [39] | Fuzzy preprocessing + augmentation | CXR | Accuracy, F1 | Showed augmentation + fuzzy fusion enhances performance | ||||
Table 2.
Summary of Chest X-ray Datasets Used in Normalization Evaluation.
| Dataset | Image Count | Images Used | Patients | Number of Classes |
|---|---|---|---|---|
| ChestX-ray14 | 112,120 | 16,000 | 30,805 | 14 |
| CheXpert | 224,316 | 16,000 | 65,240 | 14 |
| MIMIC-CXR | 377,110 | 16,000 | 227,827 | 14 |
| Chest-Xray-Pneumonia | 5,863 | 5,863 | Pediatric only | 3 |
Table 3.
Hyperparameters used for all experiments.
| Hyperparameter | Value |
|---|---|
| Optimizer | Adam |
| Learning rate | 1 × 10⁻⁴ |
| Batch size | 100 |
| Maximum epochs | 20 |
| Weight decay | 1 × 10⁻⁵ |
| Train validation split | 80 percent / 20 percent |
| Random seeds | 42 |
| Loss function | Cross entropy |
Table 4.
Wilcoxon Signed-Rank Test Results (n = 5).
| Comparison | p-value | Significance |
|---|---|---|
| Adaptive vs Z-score | 0.0078 | Significant (p < 0.01) |
| Adaptive vs Scaling | 0.0039 | Significant (p < 0.01) |
| Z-score vs Scaling | 0.0781 | Not significant (p > 0.05) |
Table 5.
Summary of Validation Accuracy Across Datasets and Configurations.
| Dataset | Deep learning | Scaling | Z-score | Adaptive |
| ChestX-ray14 | CNN | 0.58 | 0.59 | 0.59 |
| EfficientNet-B0 | 0.62 | 0.61 | 0.62 | |
| MobileNetV2 | 0.64 | 0.62 | 0.64 | |
| CheXpert | CNN | 0.84 | 0.85 | 0.85 |
| EfficientNet-B0 | 0.85 | 0.84 | 0.86 | |
| MobileNetV2 | 0.81 | 0.84 | 0.83 | |
| MIMIC-CXR | CNN | 0.65 | 0.64 | 0.64 |
| EfficientNet-B0 | 0.65 | 0.65 | 0.60 | |
| MobileNetV2 | 0.62 | 0.63 | 0.60 | |
| Chest-Xray-Pneumonia | CNN | 0.61 | 0.63 | 0.63 |
| EfficientNet-B0 | 0.83 | 0.87 | 0.82 | |
| MobileNetV2 | 0.82 | 0.88 | 0.91 |
* “Adaptive” refers to adaptive normalization using per-batch statistics. “Scaling” corresponds to scaling normalization. “Z-score” uses global dataset statistics. All results are averaged over five runs with fixed random seeds and identical stratified data splits.
Table 6.
Summary of Validation Loss Across Datasets and Configurations.
| Dataset | Preprocessing | Scaling | Z-score | Adaptive |
| ChestX-ray14 | CNN | 0.68 | 0.67 | 0.69 |
| EfficientNet-B0 | 0.66 | 0.67 | 0.68 | |
| MobileNetV2 | 0.66 | 0.73 | 0.71 | |
| CheXpert | CNN | 0.47 | 0.46 | 0.46 |
| EfficientNet-B0 | 0.42 | 0.40 | 0.44 | |
| MobileNetV2 | 0.43 | 0.39 | 0.37 | |
| MIMIC-CXR | CNN | 0.66 | 0.65 | 0.65 |
| EfficientNet-B0 | 0.70 | 0.66 | 0.68 | |
| MobileNetV2 | 0.70 | 0.69 | 0.74 | |
| Chest-Xray-Pneumonia | CNN | 0.72 | 0.70 | 0.70 |
| EfficientNet-B0 | 0.36 | 0.40 | 0.40 | |
| MobileNetV2 | 0.45 | 0.40 | 0.29 |
*Lower loss values indicate better model calibration and convergence. All loss values represent averages over five experimental runs.
Table 7.
Summary of Validation F1-scores Across Datasets and Configurations.
| Dataset | Preprocessing | Scaling | Z-score | Adaptive |
| ChestX-ray14 | CNN | 0.57 | 0.58 | 0.59 |
| EfficientNet-B0 | 0.62 | 0.60 | 0.60 | |
| MobileNetV2 | 0.64 | 0.62 | 0.62 | |
| CheXpert | CNN | 0.84 | 0.85 | 0.85 |
| EfficientNet-B0 | 0.84 | 0.84 | 0.84 | |
| MobileNetV2 | 0.79 | 0.83 | 0.82 | |
| MIMIC-CXR | CNN | 0.65 | 0.64 | 0.64 |
| EfficientNet-B0 | 0.64 | 0.64 | 0.60 | |
| MobileNetV2 | 0.62 | 0.63 | 0.60 | |
| Chest-Xray-Pneumonia | CNN | 0.61 | 0.63 | 0.63 |
| EfficientNet-B0 | 0.81 | 0.84 | 0.81 | |
| MobileNetV2 | 0.80 | 0.85 | 0.89 |
*Higher F1-scores indicate better model calibration and classification performance. All values represent averages over five experimental runs.
Disclaimer/Publisher’s Note: The statements, opinions and data contained in all publications are solely those of the individual author(s) and contributor(s) and not of MDPI and/or the editor(s). MDPI and/or the editor(s) disclaim responsibility for any injury to people or property resulting from any ideas, methods, instructions or products referred to in the content. |
© 2025 by the authors. Licensee MDPI, Basel, Switzerland. This article is an open access article distributed under the terms and conditions of the Creative Commons Attribution (CC BY) license (http://creativecommons.org/licenses/by/4.0/).
Copyright: This open access article is published under a Creative Commons CC BY 4.0 license, which permit the free download, distribution, and reuse, provided that the author and preprint are cited in any reuse.


