
Submitted:
10 October 2025
Posted:
13 October 2025
You are already at the latest version
Abstract
This study collected 820 topsoil samples from cultivated lands across Ningxia, covering the Yellow River irrigation area, the central arid zone, and the southern mountainous region. The concentrations of Arsenic (As), mercury (Hg), cadmium (Cd), chromium (Cr), and lead (Pb) were analyzed to evaluate the pollution levels and spatial distribution patterns of heavy metals, which were interpolated using Kriging. Pollution status was assessed via the Nemerow composite index and the geoaccumulation index (Igeo). Source identification and contribution quantification were performed using Pearson correlation analysis, principal component analysis (PCA), and positive matrix factorization (PMF). Results indicated that the cultivated soils in Ningxia are generally clean, with isolated instances of warning and light pollution. Ecological risk assessment revealed differential risk levels among elements, with Hg and Cd presenting the highest ecological risks. Geospatially, regions with higher pollution probabilities for Cd, Cr, Pb, Hg, and As were concentrated in the northern and central parts of Ningxia, whereas the southern region exhibited lower pollution probabilities.pH significantly influences the accumulation and spatial distribution of heavy metals in soil. Source apportionment identified three primary contributors: transportation and natural parent materials (As, Pb, Cr), industrial activities (Hg), and agricultural practices (Cd). Hg and Cd were identified as the key risk elements requiring prioritized management.
Keywords:
cultivated soil
; heavy metal pollution
; ecological risk assessment
; spatial distribution
; source apportionment
1. Introduction
High-quality and sustainable agricultural development in China hinges on well-cultivated soil, which directly impacts agricultural product quality, safety, food security, and human health(Hu et al.2021). The initial nationwide soil pollution survey in 2014 revealed that 16.1% of farmland soil in China exceeded standards, with varying degrees of pollution: slight (11.2%), mild (2.3%), moderate (1.5%), and severe (1.1%). The main pollutants contributing to this were Cd, Hg, As, Cu, Pb, Cr, Zn, and Ni, accounting for 82.4%(Ministry of Environmental Protection.2014). Factors such as population growth, urbanization, industrialization, and climate change may accelerate the accumulation of heavy metals in soil, which persist for extended periods and are absorbed by plant roots, entering the food chain and posing risks to organisms within it(Yu et al.2022). The accumulation of heavy metals in soil is influenced by regional environmental changes and human activities, leading to complex and unpredictable spatial distributions(Li et al. 2021;Chen et al.2014). Heavy metal pollution in cultivated soil significantly jeopardizes agricultural product safety, with long-lasting and costly consequences once soil is contaminated(Rashid et al.2023;Xu et al.2018). Therefore, it is crucial to proactively address and mitigate sources of heavy metal pollution in cultivated soil to safeguard soil and product quality.
In recent years, various techniques and models have been employed to assess the origins of heavy metal contamination in agricultural soils. These methods can be broadly categorized into qualitative identification of pollution sources and quantitative analysis of pollution sources(Zhang et al.2021;Chai et al.2020). Qualitative identification primarily involves determining the primary pollution sources through multivariate statistical analysis and principal component analysis. On the other hand, quantitative analysis utilizes receptor models, such as positive definite matrix factor analysis (PMF), chemical mass balance (CMB), and Unmix model(Hu et al.2020;Chen et al.2019;Zhang et al.2019), to quantify the sources of contamination. Among these analytical tools, PMF analysis is commonly utilized due to its constraint of non-negative values in the factor matrix, enabling the derivation of more practical factors. Initially utilized for source apportionment of atmospheric particles, PMF analysis has been increasingly applied to analyze heavy metal sources in water, soil, and sediment(Chai et al.2020). The outcomes demonstrate the model is efficacy in identifying pollution sources and determining their respective contributions to heavy metal concentrations. Consequently, the PMF model has been employed for evaluating heavy metal levels in cultivated soils.
Ningxia, located in Northwest China, is a vital region for commodity grain production and irrigation along the Yellow River. The soil quality of farmland in Ningxia is under threat from various heavy metal pollutants due to rapid urbanization and the continuous progress of modern industry and agriculture. Therefore, there is an urgent need to investigate heavy metal pollution in typical farmland in the Ningxia Hui Autonomous Region. Existing literature review reveals a focus on the spatial distribution and risk assessment of heavy metals in cultivated soil in Ningxia, with limited attention given to analyzing the sources of heavy metal pollution. Arsenic (As), mercury (Hg), cadmium (Cd), chromium (Cr), and lead (Pb)—have been identified as the primary pollutants in farmland soils and cultivated crops across Ningxia(Guan et al. 2025). Meanwhile, these elements are also designated as key risk control indicators for farmland soil pollution under national standards, highlighting their potential to compromise soil cultivability. Accordingly, this study determines As, Hg, Cd, Cr, and Pb as the primary contaminants for monitoring and risk assessment based on their environmental toxicity and relevance to the current pollution profile of farmland soils in Ningxia, offering data support and scientific insights to enhance prevention and control measures against heavy metal pollution in the region.
2. Materials and Methods
2.1. Overview of the Study Area
The Ningxia Hui Autonomous Region is situated in northwestern China, bordered by Shaanxi Province to the east, Inner Mongolia Autonomous Region to the west and north, and Gansu Province to the south, spanning between 35°14′ to 39°23′ N and 104°17′ to 107°39′ E. The region features a narrow north-south terrain, with higher elevations in the south gradually decreasing towards the north, characterized by significant elevation differences in the west and gentle undulations in the east. Benefiting from irrigation by the Yellow River, Ningxia is renowned as the "frontier south of the Yangtze River, the land of fish and rice." The cultivated land area in Ningxia spans 120.092 million hectares, with annual precipitation ranging from 167.2 mm to 618.3 mm, exhibiting a decreasing trend from south to north and predominantly occurring during the summer months.
2.2. Sample Collection and Analysis
Soil samples will be collected between June and August 2024 from key cultivated areas in the region, considering factors such as soil type, land use, cultivated area, and farming practices. Following a preliminary assessment of the farmland soil environment, areas with significant heavy metal pollution will be identified for targeted sampling. A combination of random and grid sampling methods will be employed across Ningxia, with GPS used to record the precise coordinates of each soil sample. A total of 820 soil samples were collected, as shown in Figure 1. During sampling, five soil samples were taken at depths of 0–20 cm from four corners and the center of a 10m x 10m square using a wooden shovel. Subsequently, 1 kg of soil samples were reserved using the quartering method, properly labeled, bagged, and recorded in a dedicated data collection application. The collected soil samples were air-dried to eliminate impurities like stones and plant roots, then sieved through a 2 mm mesh and further ground until passing through a 0.15 mm sieve before final storage.
Soil samples underwent microwave digestion with a mixture of HCl, HNO3, HF, and H2O2, followed by filtration through a 0.25 mm membrane and analysis using inductively coupled plasma mass spectrometry (ICP-OES). Each batch of samples was analyzed in triplicate, with national standard soil samples utilized for quality control. The precision of the analysis was maintained within a 10% relative deviation. Soil pH was determined potentiometrically, organic matter content was assessed via potassium dichromate oxidation-spectrophotometry, soil salinity was measured using the conductivity method, and soil cation exchange capacity (CEC) was determined using the resin method.
2.3. Data Processing
The soil samples were analyzed for heavy metal content using SPSS 21.0 for descriptive and qualitative analyses, PMF 5.0 for quantitative analysis of heavy metals in cultivated soil, and ArcGIS 10.7 for assessing the spatial distribution characteristics of heavy metals in the cultivated soil.
2.4. Research Technique
2.4.1. Nemero Integrated Pollution Index Method
The Nemerow Integrated Pollution Index, introduced by the American researcher Nemerow, offers a comprehensive assessment of the pollution levels of various factors by considering both extreme and average values. This index effectively evaluates the overall pollution status of heavy metals at individual sampling points within the research area. Widely utilized, it stands as a prominent method for the holistic appraisal of pollution within a study area. The calculation formula is as follows:
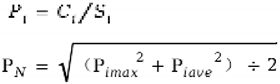
In this study, Pi represents the pollution index of pollutant i in the soil, Ci denotes the measured content of pollutant i, and Si stands for the evaluation reference value of pollutant i. The reference value utilized is the secondary standard value outlined in China's soil environmental quality standard (GB15618-2008). PN signifies the Nemerow comprehensive pollution index, Pimax is the maximum value of the single pollution index of heavy metal pollutant i at the sampling point, and Piave represents the average value of the single pollution index of heavy metal pollutants at the sampling point.
The evaluation standard utilized for risk screening was the Soil Environmental Quality Agricultural Land Soil Pollution Risk Control Standard (GB15618-2018). Table 1 displays the classification criteria for the single-factor pollution index and Nemerow index evaluation method.
2.4.2. Potential Ecological Risk Index Method
The Potential Ecological Risk Index method was introduced by the Swedish researcher Hakanson. This approach assesses the potential ecological risk posed by heavy metals in soil while accounting for their ecological toxicity(Hakanson Lars. 1980). The calculation formula for this method is as follows.
Where, RI represents the integrated potential ecological hazard index of heavy metals, Ci denotes the concentration of heavy metal i, stands for the background concentration of heavy metal i (mg/kg) specific to Ningxia soil, signifies the pollution index of heavy metal i in soil, represents the biological toxicity response factor of heavy metal i, and indicates the potential ecological hazard index of heavy metal i in soil.
The biological toxicity coefficients for Cd, Cr, Pb, Hg, and As are 30, 2, 5, 40, and 10, respectively.
The and RI values are listed in Table 2.
2.4.3. Geoaccumulation Index Method
The geoaccumulation index method is a crucial parameter for discerning the influence of human activities, as outlined by previous studies(Chen et al.2014;Yang et al.2024). The calculation formula is presented below:
The geoaccumulation index (Igeo) represents the concentration of heavy metal(Ci) in comparison to its background value (Bi), which is determined using the background value of heavy metal i in Ningxia soil and a correction factor of 1.5. The pollution levels are classified into seven grades based on the geoaccumulation index: Igeo≤ 0 indicates no pollution;0 <Igeo ≤ 1 signifies light pollution; 1 <Igeo ≤ 2 indicates moderate-leaning pollution; 2 <Igeo ≤ 3 indicates moderate pollution; 3 < Igeo≤ 4 signifies heavy-leaning pollution; 4 <Igeo ≤ 5 indicates heavy pollution; and values exceeding 5 represents severe pollution.
2.4.4. Indicator Kriging
Journel proposed Indicator Kriging, a widely utilized method in soil pollution studies due to its ability to address extreme values and high deviation characteristics(Sandeep Ravish et al.2025). The methodology of Indicator Kriging involves: (1) determining the indicator based on a specified threshold value of the index; (2) computing the optimal indicator semivariance function; (3) conducting indicator kriging interpolation using the semivariance function model parameters in ArcGIS 10.2 software to generate a spatial distribution map depicting the probability of soil heavy metal pollution.
2.4.5. Principal Component Analysis
Principal component analysis-multiple linear regression (PCA-MLR) was employed to discern pollution sources in the research area. Following the determination of pollution factor quantities, a multiple linear regression analysis was conducted on the concentration of individual tracer elements. This process yielded regression equations linking the concentration of heavy metals to each tracer element's concentration. The regression coefficients were utilized to compute the relative contribution of each pollution source.
2.4.6. PMF Model
Positive definite matrix factorization (PMF) is a data analysis technique rooted in factor analysis principles. The PMF model decomposes the initial matrix X (i×j) into two factor matrices, F (k×j) and G(i×k), along with a residual matrix E (i×j), according to the following equation:
Let Xij represent the concentration of the jth chemical component in the ith sample, Gik denote the contribution of the ith sample in source k (contribution rate matrix of the source), Fkj indicate the concentration of the jth chemical component in source k (source component spectrum matrix), and Eij stand for the residual matrix.
PMF defines the objective function Q as follows:
where Uij represents the uncertainty of the jth chemical component in the ith sample.
The PMF software necessitates the submission of concentration and uncertainty files. The uncertainty data files were computed in the following manner:
Unc=5/6×MDL
The uncertainty value is determined when the concentration of each element exceeds its respective method detection limit (MDL).
The relative standard deviation (RSD) is defined as the ratio of the standard deviation to the mean of a dataset, where the standard deviation represents the variability within the data. The elemental concentration refers to the amount of a specific element present in a sample, while the method detection limit (MDL) signifies the lowest concentration of an analyte that can be reliably detected by a given method.
The signal-to-noise ratio (SNR) serves as the primary diagnostic tool in the model, distinguishing genuine variability in measured values from data interference. A lower SNR indicates greater instability in the chemical composition within the model, reducing the likelihood of sample detection. The determination of the number of Positive Matrix Factorization (PMF) factors is based on the analysis of multiple experiments, errors, and relative changes in the Q values(Yu et al.2022;Wei et al.1991).
3. Results
3.1. Statistical Analysis of Heavy Metal Content
Table 4 presents the key statistical parameters of five heavy metals within the study area. The levels of risk (i.e., low, medium, and high) were determined based on the screening and risk control values outlined in the Soil Environmental Quality Control Standard for Soil Pollution of Agricultural Land (referred to as GB 15618-2018). Soil contamination in agricultural land is classified as low risk when heavy metal concentrations are at or below the risk screening value, typically considered negligible. Conversely, if heavy metal levels exceed the risk screening value but are equal to or below the risk control value, there is a medium risk of soil pollution, potentially impacting the quality and safety standards of edible agricultural products. In such cases, mitigation measures like agronomic adjustments and crop diversification are recommended(Shi et al.2023;Li et al.2021). When heavy metal concentrations surpass the risk control value, indicating a high risk of soil pollution leading to non-compliance of edible agricultural products with safety standards, conventional mitigation strategies may be insufficient. Under these circumstances, stringent measures such as banning the cultivation of edible crops and converting farmland to forested areas are advised(Zhang et al.2019; Ji et al. 2024).

Table 3.
Background values of heavy metals in Ningxia soil mg/kg.
| Item | Cd | Cr | Pb | Hg | As |
| Background value | 0.112 | 60 | 20.9 | 0.021 | 11.9 |
Table 4.
Characteristics of heavy metal content in surface soil of the study area.
| Item | Number | Number of different risk points | Max (mg/kg) | Min(mg/kg) | Mean(mg/kg) | CV | ||
| Low | Medium | High | Midium | Low | ||||
| Cd | 820 | 816 | 2 | 2 | 0.61 | 0.1 | 0.27 | 0.3 |
| Cr | 820 | 820 | 0 | 0 | 97.2 | 14.3 | 57.34 | 0.28 |
| Pb | 820 | 820 | 0 | 0 | 52.4 | 10.4 | 23.81 | 0.19 |
| Hg | 820 | 820 | 0 | 0 | 0.18 | 0.003 | 0.04 | 0.47 |
| As | 820 | 820 | 0 | 0 | 20.3 | 1.77 | 9.91 | 0.24 |
| PH | 820 | — | — | — | 9.09 | 6.45 | 8.18 | 0.04 |
| OM(g/kg) | 820 | — | — | — | 61.5 | 2.31 | 14.35 | 0.43 |
| CEC (cmol/kg) | 820 | — | — | — | 18.3 | 3.1 | 10.95 | 0.2 |
Note: "-" indicates that relevant data are not monitored.
Table 4 presents findings from the analysis of 820 cultivated soils in Ningxia, revealing pH values ranging from 6.45 to 9.09. The average organic matter content was 14.35 g·kg-1, with a cation exchange capacity ranging from 3.10 to 18.30 cmol·kg-1. The study indicated low levels of heavy metal pollution in the agricultural soil, with 816 areas classified as low risk for Cd, while Cr, Pb, Hg, and As were all deemed low risk. None of the average heavy metal contents exceeded the risk screening values outlined in GB 15618-2018. The coefficient of variation (CV) was utilized to assess the dispersion of heavy metal content, with a CV exceeding 0.36 indicating high variation. The variation degree of heavy metals in Table 4 ranked as Hg>Cd>Cr>As>Pb, with Hg exhibiting the highest variation (CV>0.36), suggesting significant susceptibility to external influences and human activities. Overall, the ecological risk to cultivated soil in the study area was low, with Cd and Hg posing pollution risks.
3.2. Heavy Metal Pollution Assessment and Risk Assessment of Cultivated Soil
3.2.1. Evaluation of Soil Comprehensive Pollution Index
The pollution levels of heavy metals at various sampling points were assessed based on Pi, PN, and RI criteria. Ecological risk assessment of heavy metal pollution in cultivated soil in Ningxia was conducted using single-factor pollution index and Nemerow comprehensive pollution index(Yu et al.2022; Ji et al. 2020;Zhang et al.2019). Analysis presented in Table 5 revealed that the levels of Cr, Pb, and Hg were within safe limits, while Cd and As were at warning levels in 3.17% and 0.37% of the sample points, respectively. Additionally, Cd was found to be at a light pollution level in 0.27% of the sample points. Applying the Nemerow comprehensive pollution index to evaluate heavy metal contamination in soil, it was determined that 0.49% of the soil samples in the study area fell within the warning range. Furthermore, the Nemerow comprehensive pollution index for other heavy metal samples in the cultivated soil was below 0.7, indicating a safe pollution level.
Based on the potential ecological risk index () classification for heavy metal content in soil, the distribution of ecological risk levels was as follows: 0.12% of Hg samples exhibited extremely strong ecological risk, 1.10% showed very strong ecological risk, 38.05% indicated relatively strong ecological risk, 41.34% demonstrated moderate ecological risk, and 19.39% displayed slight ecological risk. Specifically, Cd elements were present in 0.49% of samples with strong ecological risk, 30.12% with moderate ecological risk, 66.83% with medium ecological risk, and 2.56% with slight ecological risk; other heavy metal elements posed only slight ecological risks. In terms of the comprehensive ecological risk index (RI) for soil heavy metals, among the 820 sampling points within the study area, 0.12% were classified as having strong ecological risk, 60% as medium ecological risk, and 39.88% as slight ecological risk, no sampling points with strong or extremely strong ecological risk.
3.2.2. Evaluation of Geoaccumulation Index
The accumulation index of heavy metal elements in cultivated soil within the study area was determined using the Ningxia soil background values(Wei et al.1991). The results indicate that the heavy metal pollution levels in cultivated soil in Ningxia are predominantly low, with the exception of Cd and Hg. For Cd, 7.93% of the samples were classified as non-polluted, 74.39% as lightly polluted, and 17.70% as moderately polluted. Regarding Hg, 29.76% of the samples were non-polluted, 61.34% were lightly polluted, and 8.78% were moderately polluted. Furthermore, Cr, Pb, and As exhibited non-pollution levels in 99.76%, 96.70%, and 99.63% of the samples, respectively, while light pollution levels were observed in 0.24%, 3.30%, and 0.37% of the samples, respectively.
Table 6.
presents the geoaccumulation index (Igeo) for heavy metal accumulation in cultivated soil in Ningxia ( mg/kg ).
Table 6.
presents the geoaccumulation index (Igeo) for heavy metal accumulation in cultivated soil in Ningxia ( mg/kg ).
| Item | Max | Min | Proportion of Sample Points by Different Pollution Levels(%) | ||||||
| No pollution | Mild | Moderate-Tending | Moderate | Severe-Tending | Severe | Critical | |||
| Cd | 0.61 | 0.10 | 7.93 | 74.39 | 17.70 | 0 | 0 | 0 | 0 |
| Cr | 97.20 | 14.30 | 99.76 | 0.24 | 0 | 0 | 0 | 0 | 0 |
| Pb | 52.40 | 10.40 | 96.70 | 3.30 | 0 | 0 | 0 | 0 | 0 |
| Hg | 0.18 | 0.003 | 29.76 | 61.34 | 8.78 | 0 | 0 | 0 | 0 |
| As | 20.30 | 1.77 | 99.63 | 0.37 | 0 | 0 | 0 | 0 | 0 |
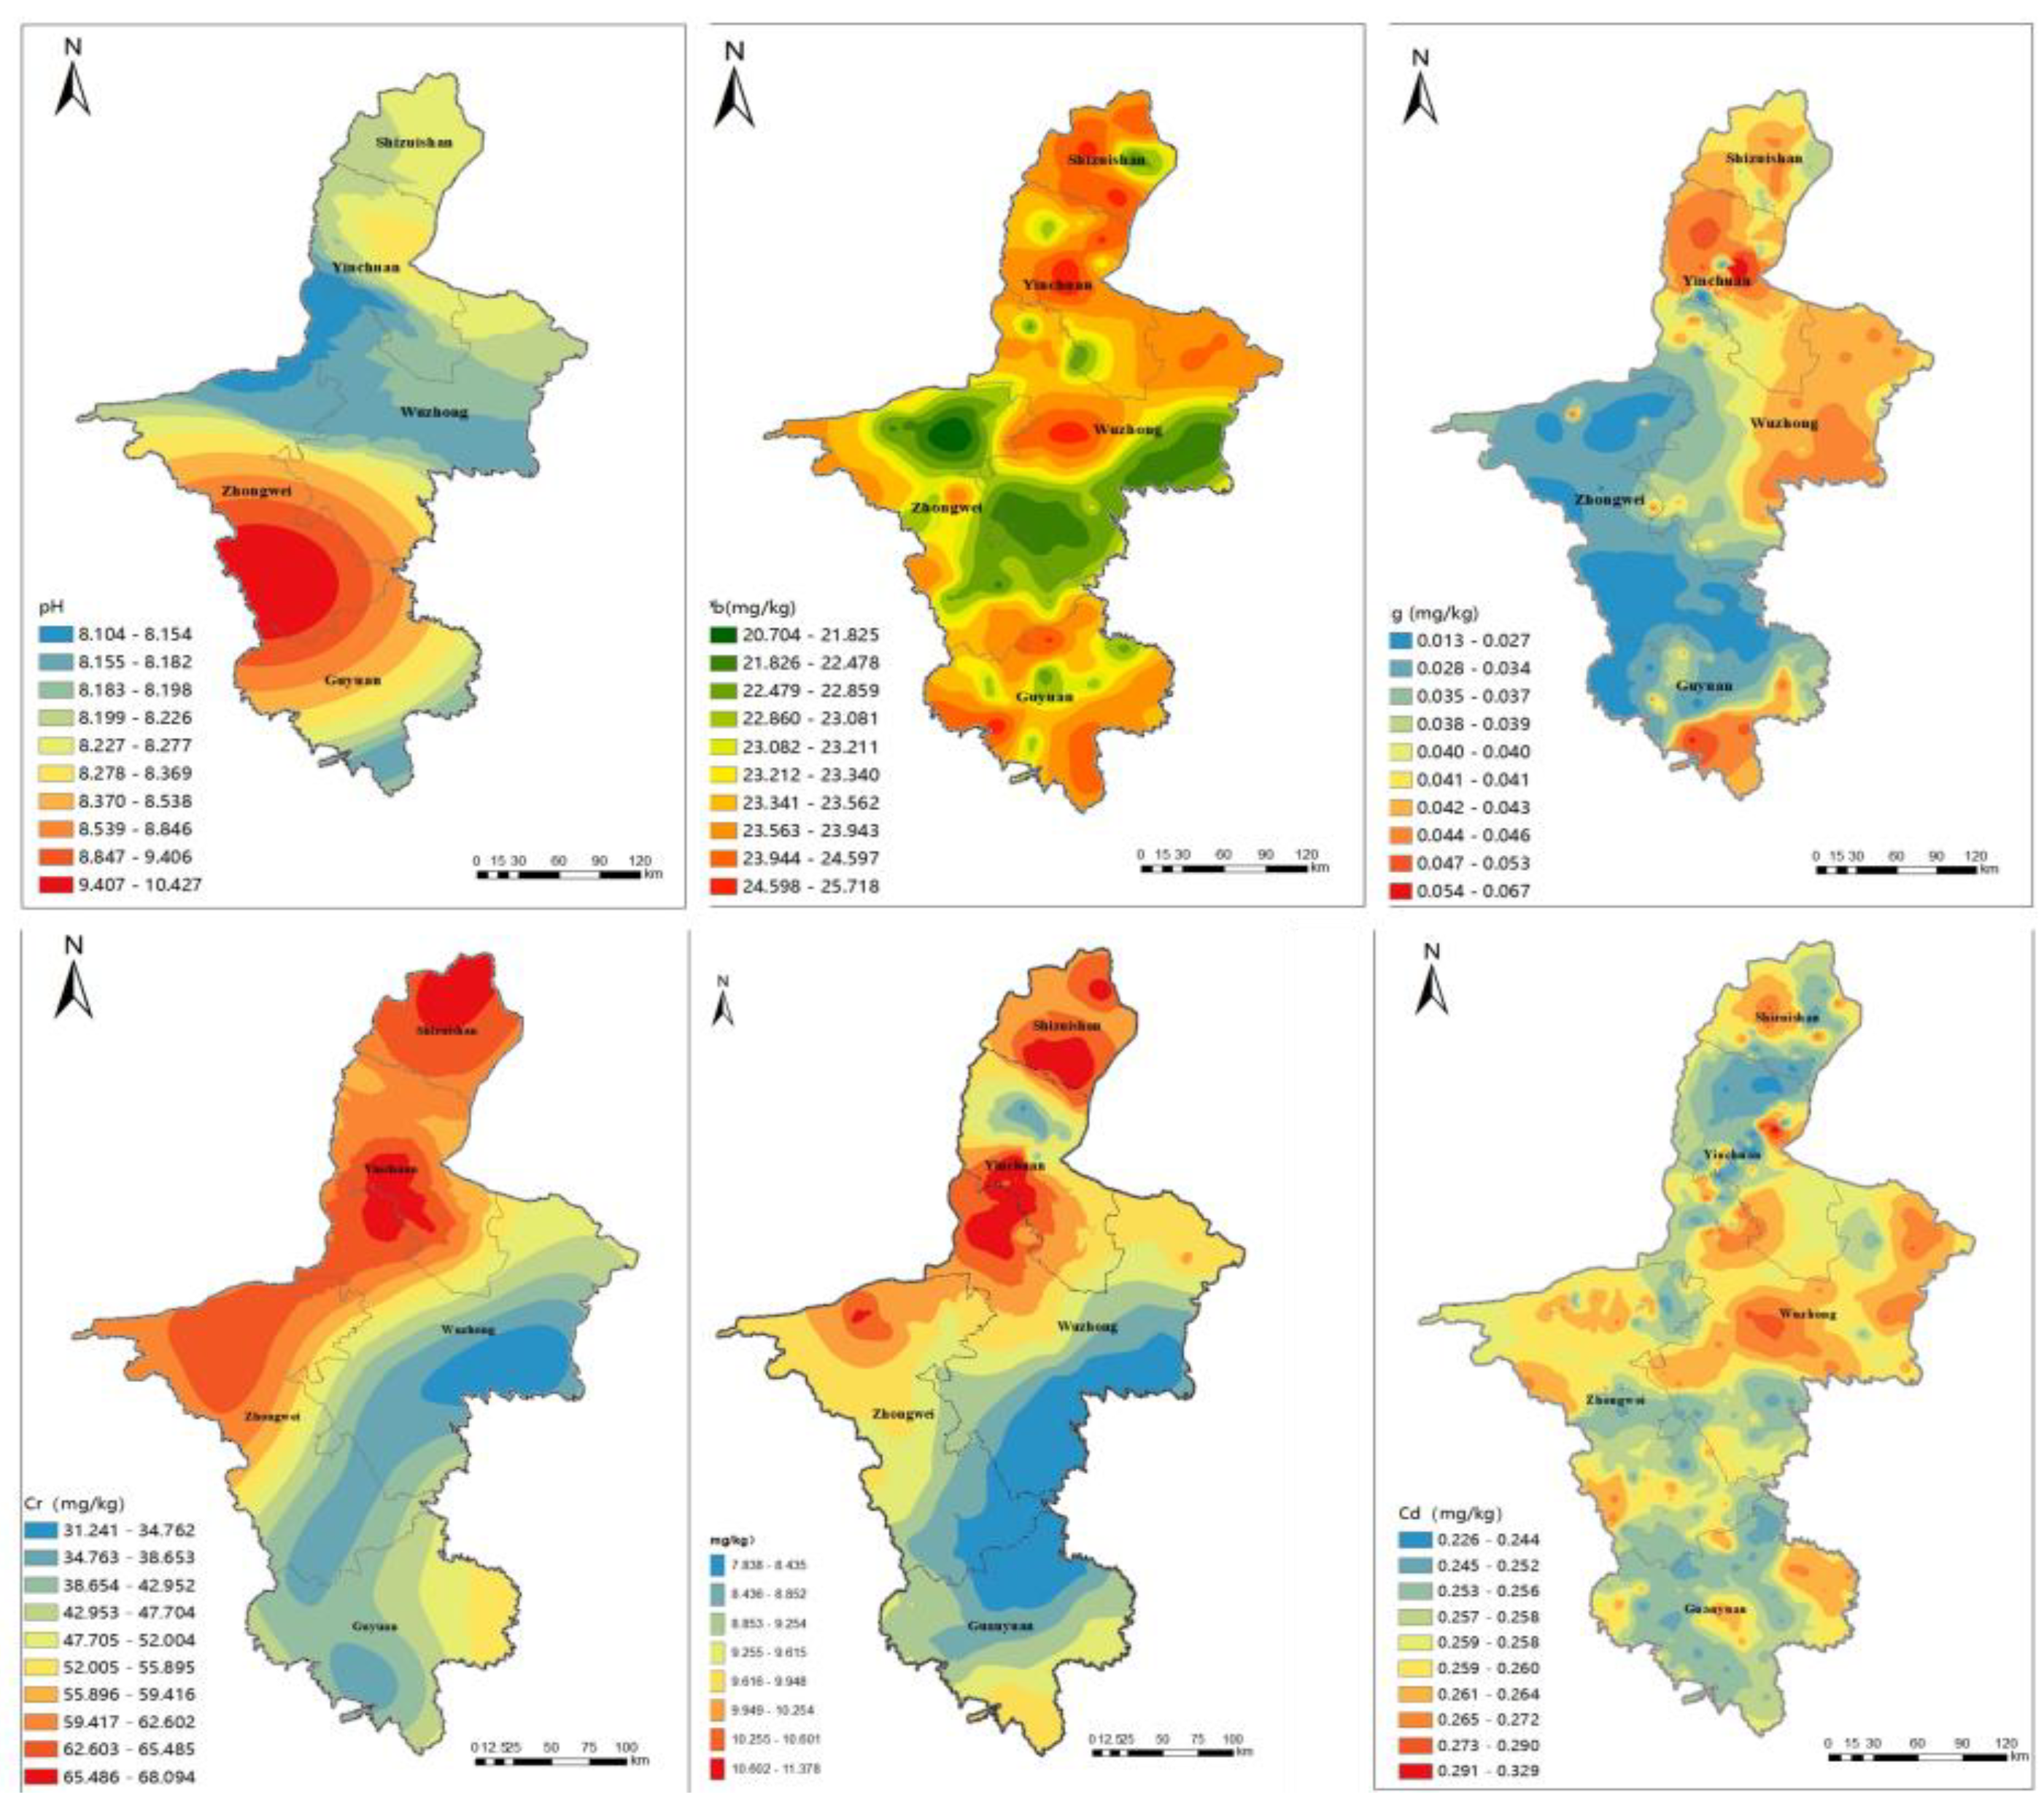
3.3. Analysis of Spatial Distribution Characteristics of Heavy Metals and PH
Geostatistical analysis of five heavy metals in Ningxia cultivated soil was conducted using ArcGIS software, employing the Kriging interpolation method to map their spatial distribution(Wei et al.2023). The spatial patterns of As and Cr exhibit similarities, with elevated concentrations observed in the northern, northwestern, and central regions of Ningxia, while lower levels are found in the eastern and southern areas. High concentrations of Hg are concentrated in the northern and eastern parts of Ningxia, with additional elevated areas in the southern region, whereas lower levels are present in the central and western areas. Cd concentrations are predominantly elevated in the central and eastern regions, with additional high-value areas in the north, west, and south. Pb concentrations peak in the northern and central regions of Ningxia. Overall, all heavy metals exhibit elevated concentrations in the central and northern regions, with widespread high values observed for Hg and Cd. The heavy metal content is lower in the high-pH regions of cultivated soils.
Figure 2.
Spatial Interpolation distribution of heavy metals in agricultural soils.
3.4. Analysis of Heavy Metal Sources
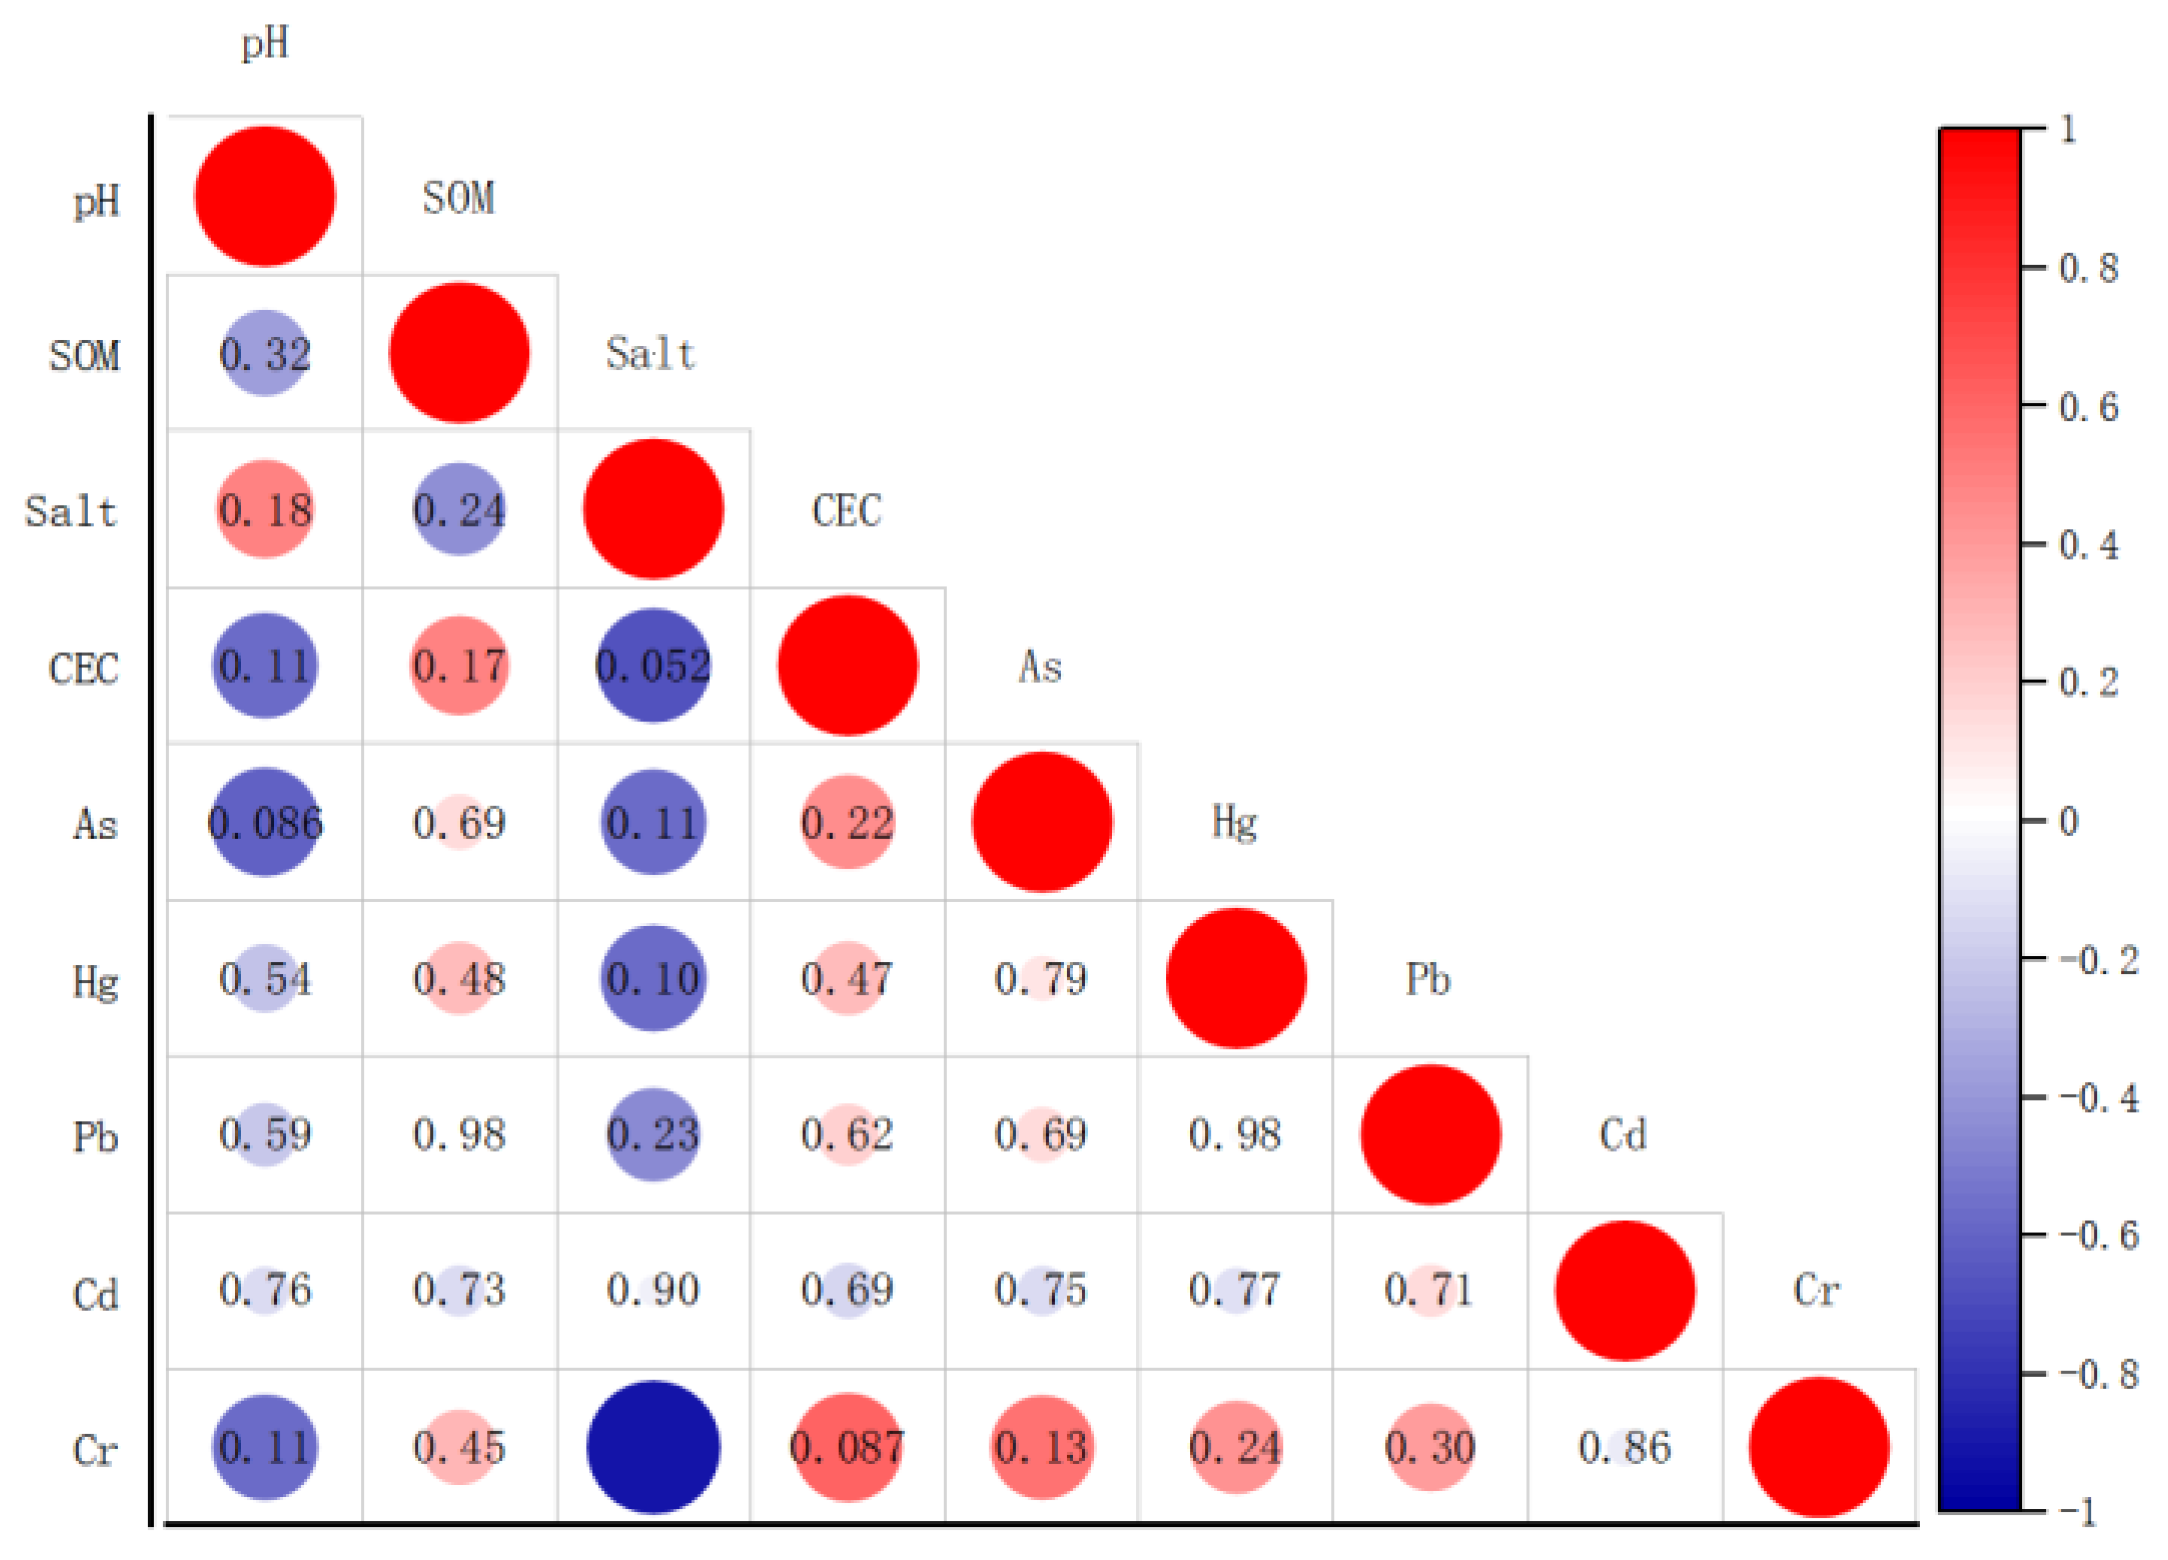
3.4.1. Correlation Analysis of Heavy Metals in Soil
Pearson correlation analysis revealed significant negative correlations between soil pH and soil organic matter, cation exchange capacity, As, Hg, Cd, and Cr. Additionally, soil pH exhibited negative correlations with As and Cr. Soil organic matter showed positive correlations with cation exchange capacity, As, Hg, Pb, and Cr. Conversely, soil salt content displayed negative correlations with cation exchange capacity, As, Hg, Pb, and Cr. Furthermore, As exhibited significant positive correlations with Pb and Cr, suggesting strong homology among these elements. Notably, Hg demonstrated an extremely significant positive correlation with Cr, indicating potential similarities in their migration patterns or sources.
Figure 3.
Pearson correlation analysis of heavy metal in agricultural land.
3.4.2. Principal Component Analysis of Heavy Metals in Soil
Principal component analysis (PCA) was employed to investigate the sources of heavy metals in cultivated soil in Ningxia. The Kaiser-Meyer-Olkin (KMO) value for the distribution of five heavy metals was 0.636, surpassing the significance threshold of 0.01, affirming the suitability of PCA for elucidating the correlation among heavy metal sources in Ningxia soil. Prior to PCA, data underwent averaging to account for variations in the magnitude of heavy metals. Through assessment of eigenvalues, cumulative explained variances, and factor loadings, three principal components were derived, collectively elucidating 71.52% of the variance. Specifically, the first principal component (PC1) explained 30.57% of the variance, followed by the second (PC2) at 21.67% and the third (PC3) at 19.28%. PC1 exhibited higher positive loadings for As and Cr, suggesting a common source for these heavy metals in agricultural soils. Cd displayed elevated positive loadings in PC2, while Hg exhibited the same in PC3.
Table 7.
Principal Component Matrix of Heavy Metals in Cultivated Soil.
| Item | PC1 | PC2 | PC3 |
| As | 0.81 | -0.061 | -0.092 |
| Cr | 0.694 | 0.13 | 0.401 |
| Cd | -0.184 | 0.844 | 0.05 |
| Pb | 0.41 | 0.646 | -0.047 |
| Hg | 0.038 | -0.007 | 0.955 |
| Eigenvalue | 1.529 | 1.084 | 0.964 |
| Variance Contribution Rate(%) | 30.57 | 21.67 | 19.28 |
| Cumulative Variance Contribution Rate | 30.57 | 52.24 | 71.52 |
3.4.3. PMF Heavy Metal Quantitative Source Analysis
The PMF model was employed to assess the origins of heavy metals in cultivated soil in Ningxia (Shen et al.2024). Experimental data were inputted into the EPA PMF 5. software. Pollution factors with a signal-to-noise ratio exceeding 1 were considered "strong" variables. The model was configured to include 3 to 7 factors, with 25 runs conducted from random starting points. The optimal number of factors was determined by comparing Qrob/Qexp values, where Qrob represents the optimal solution of the objective function Q obtained in Robust mode, and Qexp represents the true value of objective function Q. The model performed best with three factors, as indicated by minimal discrepancies between Qrobust and Qtrue, standard residuals of each element falling within the range of -3 to 3, and optimal fit. These findings are summarized in Table 8, demonstrating that the selected number of factors in the PMF model effectively captures the information within the original dataset.
The analysis of Figure 4 and Figure 5 reveals that factor 1 significantly contributes to As, Pb, and Cr at rates of 62.5%, 46.1%, and 76.2%, respectively. These elements exhibit a strong correlation at a significance level of 1%, suggesting a common pollution source. Previous research has identified natural and anthropogenic sources of As in soil, with As-containing oxides and sulfide rocks migrating to cultivated soil layers through weathering and erosion processes(Fikret et al.2024;Bi et al.2024). The average As content in cultivated land in Ningxia (9.91 mg/kg) is notably lower than the regional soil's background value for heavy metals (11.9 mg/kg), indicating a potential contribution from natural parent materials. Pb serves as a key indicator of traffic-related emissions, particularly from vehicular combustion ( Uniyal et al. 2024 ). Given the proximity of a substantial portion of cultivated land to roadways, Pb contamination in cultivated soil is plausible. Conversely, Cr is commonly associated with soil parent material composition and is typically considered a low-level pollutant (Nyiramigisha et al. 2021). Analysis in Table 5 and Table 6 indicates that the ecological risk index for Cr suggests a minor risk level, with 99.76% of samples exhibiting non-polluted levels based on the geoaccumulation index. Consequently, factor 1 is inferred to originate from a combination of transportation-related sources and natural parent materials.
Factor 2 significantly contributes to the presence of mercury (Hg) at a rate of 85.7%. An evaluation of potential ecological risk indicates that 38.05% of the sampled sites exhibit Hg pollution, with Hg displaying the highest coefficient of variation in the research area, suggesting substantial impact from human activities on cultivated soil. Previous research has established a correlation between Hg contamination and coal combustion(Li et al.2024). The northern region of the study area is characterized by a thriving energy sector. Emissions from processing facilities, including airborne chromium compounds, lead to varying degrees of heavy metal contamination in the surrounding soil through dry and wet deposition of industrial emissions(Tu et al.2024;Wang et al.2024). This contaminated soil is a primary source of pollution for crops, particularly vegetables. Field investigations and sampling in the study area have uncovered instances of unauthorized discharge of untreated or substandard industrial wastewater into agricultural channels via concealed pipelines(Liu et al.2019). Consequently, farmers irrigate their fields with polluted water, resulting in Hg accumulation in the soil. Furthermore, there are instances of haphazardly disposed industrial waste materials (e.g., smelting by-products and electroplating residues) near some sampled cultivated areas, facilitating Hg infiltration into the soil through runoff. Hence, Factor 2 is identified as an industrial contamination source.
Factor 3 accounted for 72.1% of the cadmium (Cd) content. The average Cd levels exceed the background levels in Ningxia soil, indicating potential influence from human activities. Previous research suggests that agricultural practices can result in Cd accumulation in soil( Luo et al.2024;Li et al.2024;Shen et al.2024;Dong et al.2023). The Yinchuan Plain, a significant grain-producing region in northwest China with a long history of agricultural development, exhibits substantial fertilizer usage, suggesting a plausible link between Cd levels and agricultural activities in the area. Cd, a prominent component of pesticides and fertilizers, is prone to migration and volatilization. Prolonged use of these substances can lead to Cd buildup in the soil(Luo et al.2022). Furthermore, certain agricultural inputs, such as livestock manure, may also contain Cd, possibly originating from feed additives( Lu et al.2021). Excessive application of chemical fertilizers, pesticides, and organic fertilizers poses a significant risk of Cd pollution in cultivated lands(Wang et al.2019). Data from the Ningxia Statistical Yearbook indicates an annual application of approximately 900,000 tons of chemical fertilizers in cultivated soil, which can result in cumulative effects over time. Therefore, Factor 3 is identified as originating from agricultural production activities.
In summary, the apportionment of the three source factors to the presence of the five heavy metals is as follows: Arsenic (As), Lead (Pb), and Chromium (Cr) predominantly originated from a combination of transportation sources and natural parent materials, Mercury (Hg) primarily stemmed from industrial activities, and Cadmium (Cd) chiefly emanated from agricultural practices.
4. Discussion
4.1. Heavy Metal Pollution Status and Risk Assessment of Cultivated Soil in Ningxia
Ningxia, a significant agricultural region in northwest China, has witnessed a notable trend towards scale and distinctive characteristics in agricultural development in recent years. However, the prolonged application of agricultural inputs and the rapid urbanization at the county level have led to the emergence of heavy metal pollution issues in cultivated soil within certain irrigation areas. Particularly, the risks of cadmium (Cd), arsenic (As), lead (Pb), and mercury (Hg) pollution have become increasingly prominent (Reijonen et al.2016). It is crucial to remain vigilant against the compound pollution of heavy metals in cultivated soil, as this poses challenges to the safety and quality of agricultural products and the ecological preservation of the Yellow River Basin. In this investigation, the over-standard rates of each heavy metal at different sites in Ningxia were compared with the region's soil background values. The ranking of over-standard rates is as follows: Cd (98.7%) > Hg (80.1%) > Pb (77.5%) > Cr (47.6%) > As (21.5%). The notably high over-standard rates suggest varying degrees of human-induced impacts on As, Hg, Pb, Cd, and Cr, with Cd, Hg, and Pb showing particularly significant accumulation, mirroring the broader pollution scenario observed in cultivated soil across China. The study findings reveal that the heavy metal pollution in Ningxia's cultivated land exhibits characteristics of "localized distribution and clustered occurrences." The pollution hotspots are predominantly situated in the northwest and central regions of Ningxia, primarily around the outskirts of Shizuishan, Yinchuan, Wuzhong, and other longstanding industrial zones, as well as in areas with extensive historical high-intensity cultivation within the Yellow River irrigation zone. The sources of pollution can be attributed to past industrial discharges, sewage irrigation practices, and human activities such as excessive utilization of plastic film, pesticides, and fertilizers. These factors have led to the accumulation of heavy metals, particularly Cd and Hg, in the cultivated soil of Ningxia.
The single-factor pollution index, comprehensive pollution index, ecological risk index, and land accumulation index of five heavy metals exhibited distinct pollution profiles. Specifically, based on the single-factor pollution index, Cd and As displayed elevated levels in certain samples, indicating a higher pollution risk. Furthermore, according to the potential ecological risk assessment, Cd and Hg posed significant ecological pollution risks in cultivated soil in Ningxia. Lastly, the accumulation index highlighted that Cd and Hg have accumulated over the long term in cultivated soil, leading to moderate pollution levels in Ningxia.
Based on the current pollution scenario, Cd and Hg are the predominant contaminants in cultivated soil in Ningxia. It is imperative to enhance ongoing monitoring of soil sites, establish prompt emergency monitoring protocols, promptly identify emerging pollution and diffusion risks, and implement tailored safety measures for the sustainable management of heavy metal-contaminated soil. These actions, informed by the ecological risks associated with heavy metal pollution in soil and the sources of such pollution, are essential for safeguarding the environmental integrity of cultivated soil in Ningxia and ensuring the safe production of agricultural goods.
4.2. Analysis of Heavy Metal Sources in Cultivated Soil of Ningxia
The fragile agricultural ecological environment in Ningxia is characterized by low soil fertility and a risk of heavy metal accumulation, making the analysis of heavy metal pollution sources in cultivated land is crucial for enhancing agricultural productivity. Through Pearson analysis, it was revealed that the salt content in Ningxia's cultivated soil exhibited a significant negative correlation with four heavy metals. This phenomenon can be attributed to the high concentration of soluble salt ions in salinized soil, leading to an increase in the ionic strength of the soil solution. Moreover, certain anions present in salt can form soluble complexes with heavy metal ions, thereby decreasing the adsorption tendency of heavy metals by soil solids and increasing their solubility and mobility in the solution( Shang et al.2018;Zhang et al.2023). Conversely, a notable positive correlation was observed between soil organic matter and the four heavy metals, suggesting that higher soil organic matter content enhances the adsorption of heavy metals in the soil. Soil particles with low organic matter content, on the other hand, carry fewer net negative charges, making it challenging for them to bind with positively charged heavy metals(Shen et al.2024). This circumstance may result in some free heavy metal ions in the soil solution being absorbed by plants. Additionally, a significant positive correlation was found between soil organic matter and cation exchange capacity (CEC). This relationship is primarily attributed to the permanent negative charge on the organic matter's surface, significantly enhancing the overall soil's cation exchange capacity. A high CEC can capture heavy metal cations through electrostatic adsorption, thereby reducing their free concentration in the soil solution. This observation aligns with the significant positive correlation between CEC and the four heavy metals as indicated by the Pearson analysis(Luo et al.2022;Zhang et al.2022). Additionally,There is a significant correlation between heavy metal content and soil chemical properties(Ravish et al.2025). Higher pH values and alkaline cation content favor metal accumulation(Wojciech et al.2025;Luo et al.2018).
Based on Pearson analysis, PCL principal component analysis, and PMF model analysis, 820 cultivated soils were classified into three groups based on heavy metal content(Luo et al.2022). The first group comprised As, Pb, and Cr, originating mainly from a combination of transportation sources and natural parent materials. The findings indicated that As and Pb were primarily derived from automobile exhaust emissions and soil parent materials, entering cultivated soil through atmospheric deposition and rain leaching. Cr in cultivated soil predominantly originated from the weathering of soil-forming parent materials, explaining the spatial distribution patterns of As, Pb, and Cr in the study. In the first component (PC1), with higher loading values, the contribution rates of the three components were 62.5%, 46.1%, and 76.2%, respectively, showing significant correlations among the three heavy metals, suggesting similar migration patterns and sources. Furthermore, Cr, Pb, and As exhibited minimal spatial variation, indicating their retention of the original natural state in the soil, primarily influenced by parent materials. Category II focused on Hg, primarily sourced from industrial activities. Hg exhibited the highest factor loading (0.956) in the second component (PC2), contributing 85.70% of the variance. Hg displayed the largest coefficient of variation (0.47), indicating significant disturbance by human activities in its accumulation in cultivated soil. The results revealed that Hg pollution in cultivated soil primarily stemmed from natural sources and intense human activities(Lu et al.2021;Zeng et al.2022), posing direct threats to the safety of agricultural products. The spatial distribution of sampling points indicated the presence of numerous factories and enterprises surrounding the Hg-polluted cultivated land, particularly concentrated processing enterprise bases in highly polluted areas, attributing Hg accumulation in cultivated soil to industrial production activities(Jia et al.2020;Zhou et al. 2020). The recent strengthening of the industrial development model of "agglomeration" in northern Ningxia, particularly the dispersion of smelting dust from coal-fired power generation, oil production, and garbage incineration enterprises into farmland through atmospheric, wet, or dry deposition, resulted in Hg accumulation, consistent with the spatial distribution characteristics of Hg. Category III focused on Cd, primarily originating from agricultural activities. In the third principal component (PC3), Cd exhibited the highest factor loading value (0.990), contributing 72.1% of the variance, with substantial spatial variation (0.30), indicating significant human-induced influences on Cd levels, widely distributed in high-value areas across the study area. The findings indicated that Cd in cultivated soil primarily resulted from agricultural practices, with excessive use of chemical and organic fertilizers leading to Cd accumulation. Long-term production of microplastics from agricultural residual film was positively correlated with heavy metal accumulation(Zeng et al.2022;Wang et al.2023 ), contributing to Cd pollution in cultivated soil over time.
5. Conclusions
- (1)
- The concentrations of five heavy metals in cultivated soil in Ningxia were below the threshold values for agricultural soil pollution risk. However, the average levels of Cd, Pb, and Hg exceeded the background levels of Ningxia soil, with Cd and As approaching the threshold values for agricultural soil pollution risk. Given that heavy metals are significant contributors to adult carcinogenic risk(Jia et al.2020;Selahvarzi et al.2024), continuous long-term monitoring is essential.
- (2)
- The single-factor index method and Nemerow comprehensive pollution index method indicated that, overall, the cultivated soil in Ningxia was deemed clean. However, 97.44% and 80.61% of Cd and Hg elements, respectively, still exhibited medium to high potential ecological risks. The cumulative index analysis revealed that Cd and Hg are the primary heavy metal pollutants in Ningxia's cultivated soil, posing significant toxicity levels that can adversely impact plant health across various pollution levels(Huang et al.2018; Kumari et al.2024;Zhang et al.2025;Shi et al.2023). Particular concern is the compounded pollution of agricultural land due to the synergistic effects of emerging contaminants like microplastics and antibiotics, in addition to heavy metals, retained in the agricultural production processes(Pei et al.2025; Xu et al.2018;).
- (3)
- The spatial distribution patterns of heavy metals in cultivated soil in Ningxia exhibited distinct characteristics. Arsenic (As) and Chromium (Cr) displayed continuous high concentrations in the northern and western regions of the study area. Mercury (Hg) exhibited persistent high levels in the northern and eastern parts of the study area. Cadmium (Cd) showed continuous high concentrations in the central region, with elevated levels also observed in certain areas in the northern and southern parts of the study area. Lead (Pb) concentrations were predominantly high in the central and northern regions of the study area.
- (4)
- A notable inverse relationship was observed between soil salinity and heavy metal concentrations in cultivated soil, while a substantial positive correlation was noted between soil cation exchange capacity and heavy metal levels in the same soil. Analysis using Pearson correlation, principal component analysis (PCA), and positive matrix factorization (PMF) indicated that arsenic (As), lead (Pb), and chromium (Cr) predominantly originated from a combination of transportation activities and natural parent materials, mercury (Hg) primarily originated from industrial sources, and cadmium (Cd) mainly originated from agricultural activities.
Acknowledgments
This work was supported by Key Research and Development Program of Ningxia Hui Autonomous Region (Grant NO. 2023BEG01002).
References
- Hu W., Tao T., Tian K.,2021.Discussed the present status and future prospects of managing farmland soil environmental quality in China.Acta Pedologica Sinica.58(5),1094-1109.
- Ministry of Environmental Protection, 2014. People's Republic of China; Ministry of Land and Resources, People's Republic of China. Bulletin of the National Survey on Soil Pollution [R]. Beijing: Ministry of Environmental Protection.
- Yu F., Zhang Y., Yan M.,2022. Conducted a study on the heavy metal pollution levels and associated health risks in cultivated soil and crops in the mercury Kuangqu mining area. Environmental Chemistry.41(02),536-548.
- Li W., Zhu S., Wang Z.,2021.Conducted a study on heavy metal enrichment and health risk assessment in cultivated soil and crops in a coal mining area in southwest mountains. China Inorganic Analytical Chemistry.11(05),22-30.
- Rashid A., Schutte B.J., Ulery A.,2023. Investigated the impact of heavy metal contamination on agricultural soil, focusing on its effects on crop health. Agronomy. 13(6),1521.
- Zhang J., Zhai M., Chen J., 2021.Conducted a meta-analysis on the impact of metal mining on heavy metal concentrations in soils in the Kuangqu region of Southwest China.Environmental Science.42(09),4414-4421.
- Chai L., Wang X., Ma L., 2020. Conducted an analysis of heavy metal sources in cultivated soil in Lanzhou using the Positive Matrix Factorization (PMF) model. Environmental Science.40(09),3919-3929.
- Hu Y., Su H., Zhang B., 2020. Discussed soil heavy metal pollution and assessment methods. Jiangsu Agricultural Science.48(17):33-39.
- Chen S., Wang M., Li S., 2019.Assessed the current status and challenges of heavy metal pollution control in Chinese farmland soil.Geoscience Frontiers.26(06),35-41.
- Zhang W., Yu R., Yang Y.,2019. Study on the migration and source analysis of heavy metals in the vertical profile of dryland soil in Xiamen. Environmental Science.40(08),3764-3773.
- Guan Y., Zhang N., Li B., 2025.A novel evaluation of farmland soil environmental risk integrating heavy metal(loid) pollution risk and industrial risk potential.Stochastic Environmental Research and Risk Assessment.39,3085–3102.
- Shang, E., Xu, E., Zhang, H., 2018. Spatial and temporal variability and sources of heavy metal pollution in cultivated soils of key grain-producing regions in China. Environmental Science, 39(10), 467-4683.
- Luo Y., Teng Y., 2018. Discussed regional disparities in soil pollution across China and proposed tailored remediation approaches for distinct geographical areas. Proceedings of the China Academy of Sciences.39(10),4670-4683.
- Xu J., Meng J., Liu X., 2018. Addressed the issue of heavy metal pollution in farmland soil and its implications for food security in China. Proceedings of the China Academy of Sciences.33(02),153-159.
- Chen, Y., Fang, L., Yang, J.,2014. Farmland soil pollution status and control measures in China. Agricultural Resources and Regionalization in China, 35(4), 14.
- Hakanson, L. (198). An ecological risk index for aquatic pollution control: a sedimentological approach. Water Research. 14(8), 975-1001. [CrossRef]
- Li, Y., Zong, B., Wen, B., 2024. Analysis and evaluation of heavy metal pollution in Chinese farmland soils. Environmental Science. 45(05), 2913-2925.
- Ravish, S.,2025. Enhancing precision in groundwater salinity mapping through the utilization of Indicator Kriging Technique. Appl. Water Sci. 15(7), 149-149.
- Shi H., Wang P., Zhen J., 2023. The spatial distribution characteristics of heavy metals in Chinese provincial soils and proposed zoning control measures. Environmental Science.44(8),4706-4716.
- Yu L., Wan F., Fan H., 2022. Spatial distribution, source analysis, and ecological risk assessment of heavy metals in the soil of the Jianghu Gongmi producing area. Environmental Science.43(08),4199-4211.
- Li M., Shen C., Wu J., 2021.Distribution characteristics and ecological risk of heavy metals in soils across various land use types in rapidly urbanizing regions. Environmental Science.42(10),4889-4896.
- Zhang M., Chen H., Shi Q.,2019. Spatial distribution and determinants of heavy metal concentrations in the topsoil of a loess hilly and gully region. Agricultural Environmental Sciences.38(11), 2465-2475.
- Ji C., Hou D., Li F., 2020.Spatial distribution characteristics of health risks associated with heavy metals in cultivated soils. Environmental Science.41(03),1440-1448.
- Wei F., Yang G., Jiang D.,1991. The fundamental statistics and features of baseline soil element values in China. Environmental Monitoring.(01),1-6.
- Reijonen, I., Metzler, M., Hartikainen, H. 2016. Impact of soil pH and organic matter on the chemical bioavailability of vanadium species. Environmental Pollution.210, 371–379. [CrossRef]
- Uniyal et al.2024. Investigated the detrimental effects of heavy metal contamination on soil quality and plant development in agricultural settings. Emergent Life Sciences Research. 10(02), 103–115.
- Nyiramigisha, P., Komariah., Sajidan. 2021. Harmful effects of heavy metal contamination in soil and crops near landfill sites. Reviews in Agricultural Science, 9(0), 271–282.
- Luo Y., Ma Y., Wang X., 2024.Accumulation of heavy metals in cultivated land surface soil and its associated health risks. Water, Air, & Soil Pollution.235(2).
- Shen, Z., Li, J., Li, C.,2024. Pollution source apportionment of heavy metals in cultivated soil surrounding a red mud yard using APCS-MLR and PMF models. Environmental Science.2024, 45(2), 1058-1068.
- Fikret, S. Determination of heavy metal concentrations in cultivated soils and prediction of pollution risk indices using artificial neural network approach. Rendiconti Lincei. Scienze Fisiche e Naturali, 2024, 35(2), 451-469.
- Bi, Z., Sun, J., Xie, Y., et al. Machine learning-based source identification and ecological risk prediction of heavy metal pollution in cultivated soils. J. Hazard. Mater. 2024, 476:135109. [CrossRef]
- Tu J., 2024. Environmental risk and source analysis of heavy metals in tailings sand and surrounding soils in the Huangshaping mining area.Environmental Pollutants and Bioavailability.36(1). [CrossRef]
- Jing W.,2024.Sources analysis and risk assessment of heavy metals in soil in a polymetallic mining area in southeastern Hubei based on Monte Carlo simulation. Ecotoxicology and environmental safety.290,117607.
- Liu, Q., Jia, Z., et al. (2019). Evaluation of heavy metal contamination, spatial distribution, and quantitative source identification in surface sediments within a partially mixed estuary (Modaomen, China). Chemosphere, 225, 829-838.
- Li, Y., Zong B., Wen B., 2024. Analysis and evaluation of heavy metal pollution in Chinese farmland soils. Environmental Science, 45(05), 2913-2925.
- Shen Z., Li J., Li C., 2024. Sources of heavy metal pollution in cultivated soil surrounding a red mud dump using APCS-MLR and PMF models. Environmental Science.45(02),1058-1068.
- Dong, M., Xia, W., Zhou, H., 2023. Investigation of soil heavy metal pollution and its underlying factors at a block scale in Hunan Province. Environ. Sci. Technol. 46 (S1), 60-66.
- Luo T., Zhao F., Liu X., 2022.Sources of heavy metal pollution in cultivated soil within a representative small watershed near an industrial zone. Agricultural Modernization Research. 43(03), 541-550.
- Zhang Y., Zhou X., Zeng X.,2022. Characteristics and assessment of heavy metal contamination in soils within the industrial zone of the Yangtze River economic belt. Environmental Science.43(04), 2062-207.
- Lu B., Wang C., Shi H., 2021.Analysis of sources of heavy metal pollution in cultivated soil using a receptor model and geostatistics. Environmental Science Research.34(12),2962-2969.
- Zeng S., Yu H., Ma J., 2022. Heavy metal contamination in arable topsoil and examined the spatial trade-offs of fallow cultivation in China. Acta Pedologica Sinica.59(04),1036-1047.
- Jia, Z., 2020. Pollution characteristics, source analysis, and ecological health risk assessment of heavy metals in soils of northwest Chongqing [D]. Southwest University.10(09),25-28.
- Zhou, J.,2020. Heavy metal pollution in Chinese cultivated land and analysis of anthropogenic pollution sources. China Soil Fertil. (02),83-92.
- Wang L., and He S.,2019. Investigated the technology for safe utilization of cadmium-contaminated agricultural land. Environment and Sustainable Development, 44( 05), 134-137.
- Huang D., Zhu Q., Zhu H., 2018. Study on the advancements and future outlook of utilizing heavy metal contaminated farmland for agricultural safety. Agricultural Modernization Research.39(06), 103-1043.
- Xu J., Meng J., Liu X., 2018. Heavy metal pollution in farmland soil and its implications for food security in China. Proceedings of the China Academy of Sciences.33(02),153-159.
- Pei P., Feng Y., Zhao X., 2025. Characteristics, risks, and sources of heavy metal pollution in cultivated soils surrounding representative coal-fired industrial zones. Environmental Science.45(04), 413-423.
- Wojciech Piaszczyka, 2025.The effect of soil chemical properties and ecological implications on the distribution of heavy metals in different types of peatland.Ecological Indicators.178,113922. [CrossRef]
- Zhang C., Liu L., Dai J., 2025.The method for classifying and managing cultivated land environmental quality by assessing soil heavy metal pollution and accumulation. Ecology and Environment, 34( 02), 311-320.
- Shi H., Wang P., Zhen J., 2023.Study on the spatial distribution characteristics and zoning control measures of heavy metals in soil across various provinces in China. Environmental Science.44(08),4706-4716.
- Wei H., Luo M., Wu K., 2023.Analysis and risk assessment of heavy metal pollution sources in farmland soils of the Jidong Plain. Soil Bulletin.54(02),462-472.
- Zhang H., Cui W., Liu S., 2023.Identification of source drivers and interactions of heavy metals in cultivated soils using geosensors and multi-source data. Environmental Science.44(04),2177-2191.
- Ying, W., Aijun, D., Jianfeng, Y., 2023. Migration and accumulation of heavy metals in soil-crop systems of historically industrialized urban areas and co-assessment of associated risks. Environ. Sci. 44, 4429-4439.
- Kumari, A., Chakraborty, S. 2024. Influence of soil properties and farming techniques on microplastic levels in sandy soils and their correlation with heavy metal pollution. Environmental Monitoring and Assessment, 197(1), 111.
- Selahvarzi.2024. Investigation on the analysis, spatial distribution, and ecological risk assessment of heavy metals in surface soils in Khorramabad, Iran. Environmental Analytical Chemistry. 104(20),8955-8976.
Figure 1.
Distribution map of cultivated soil sampling points.
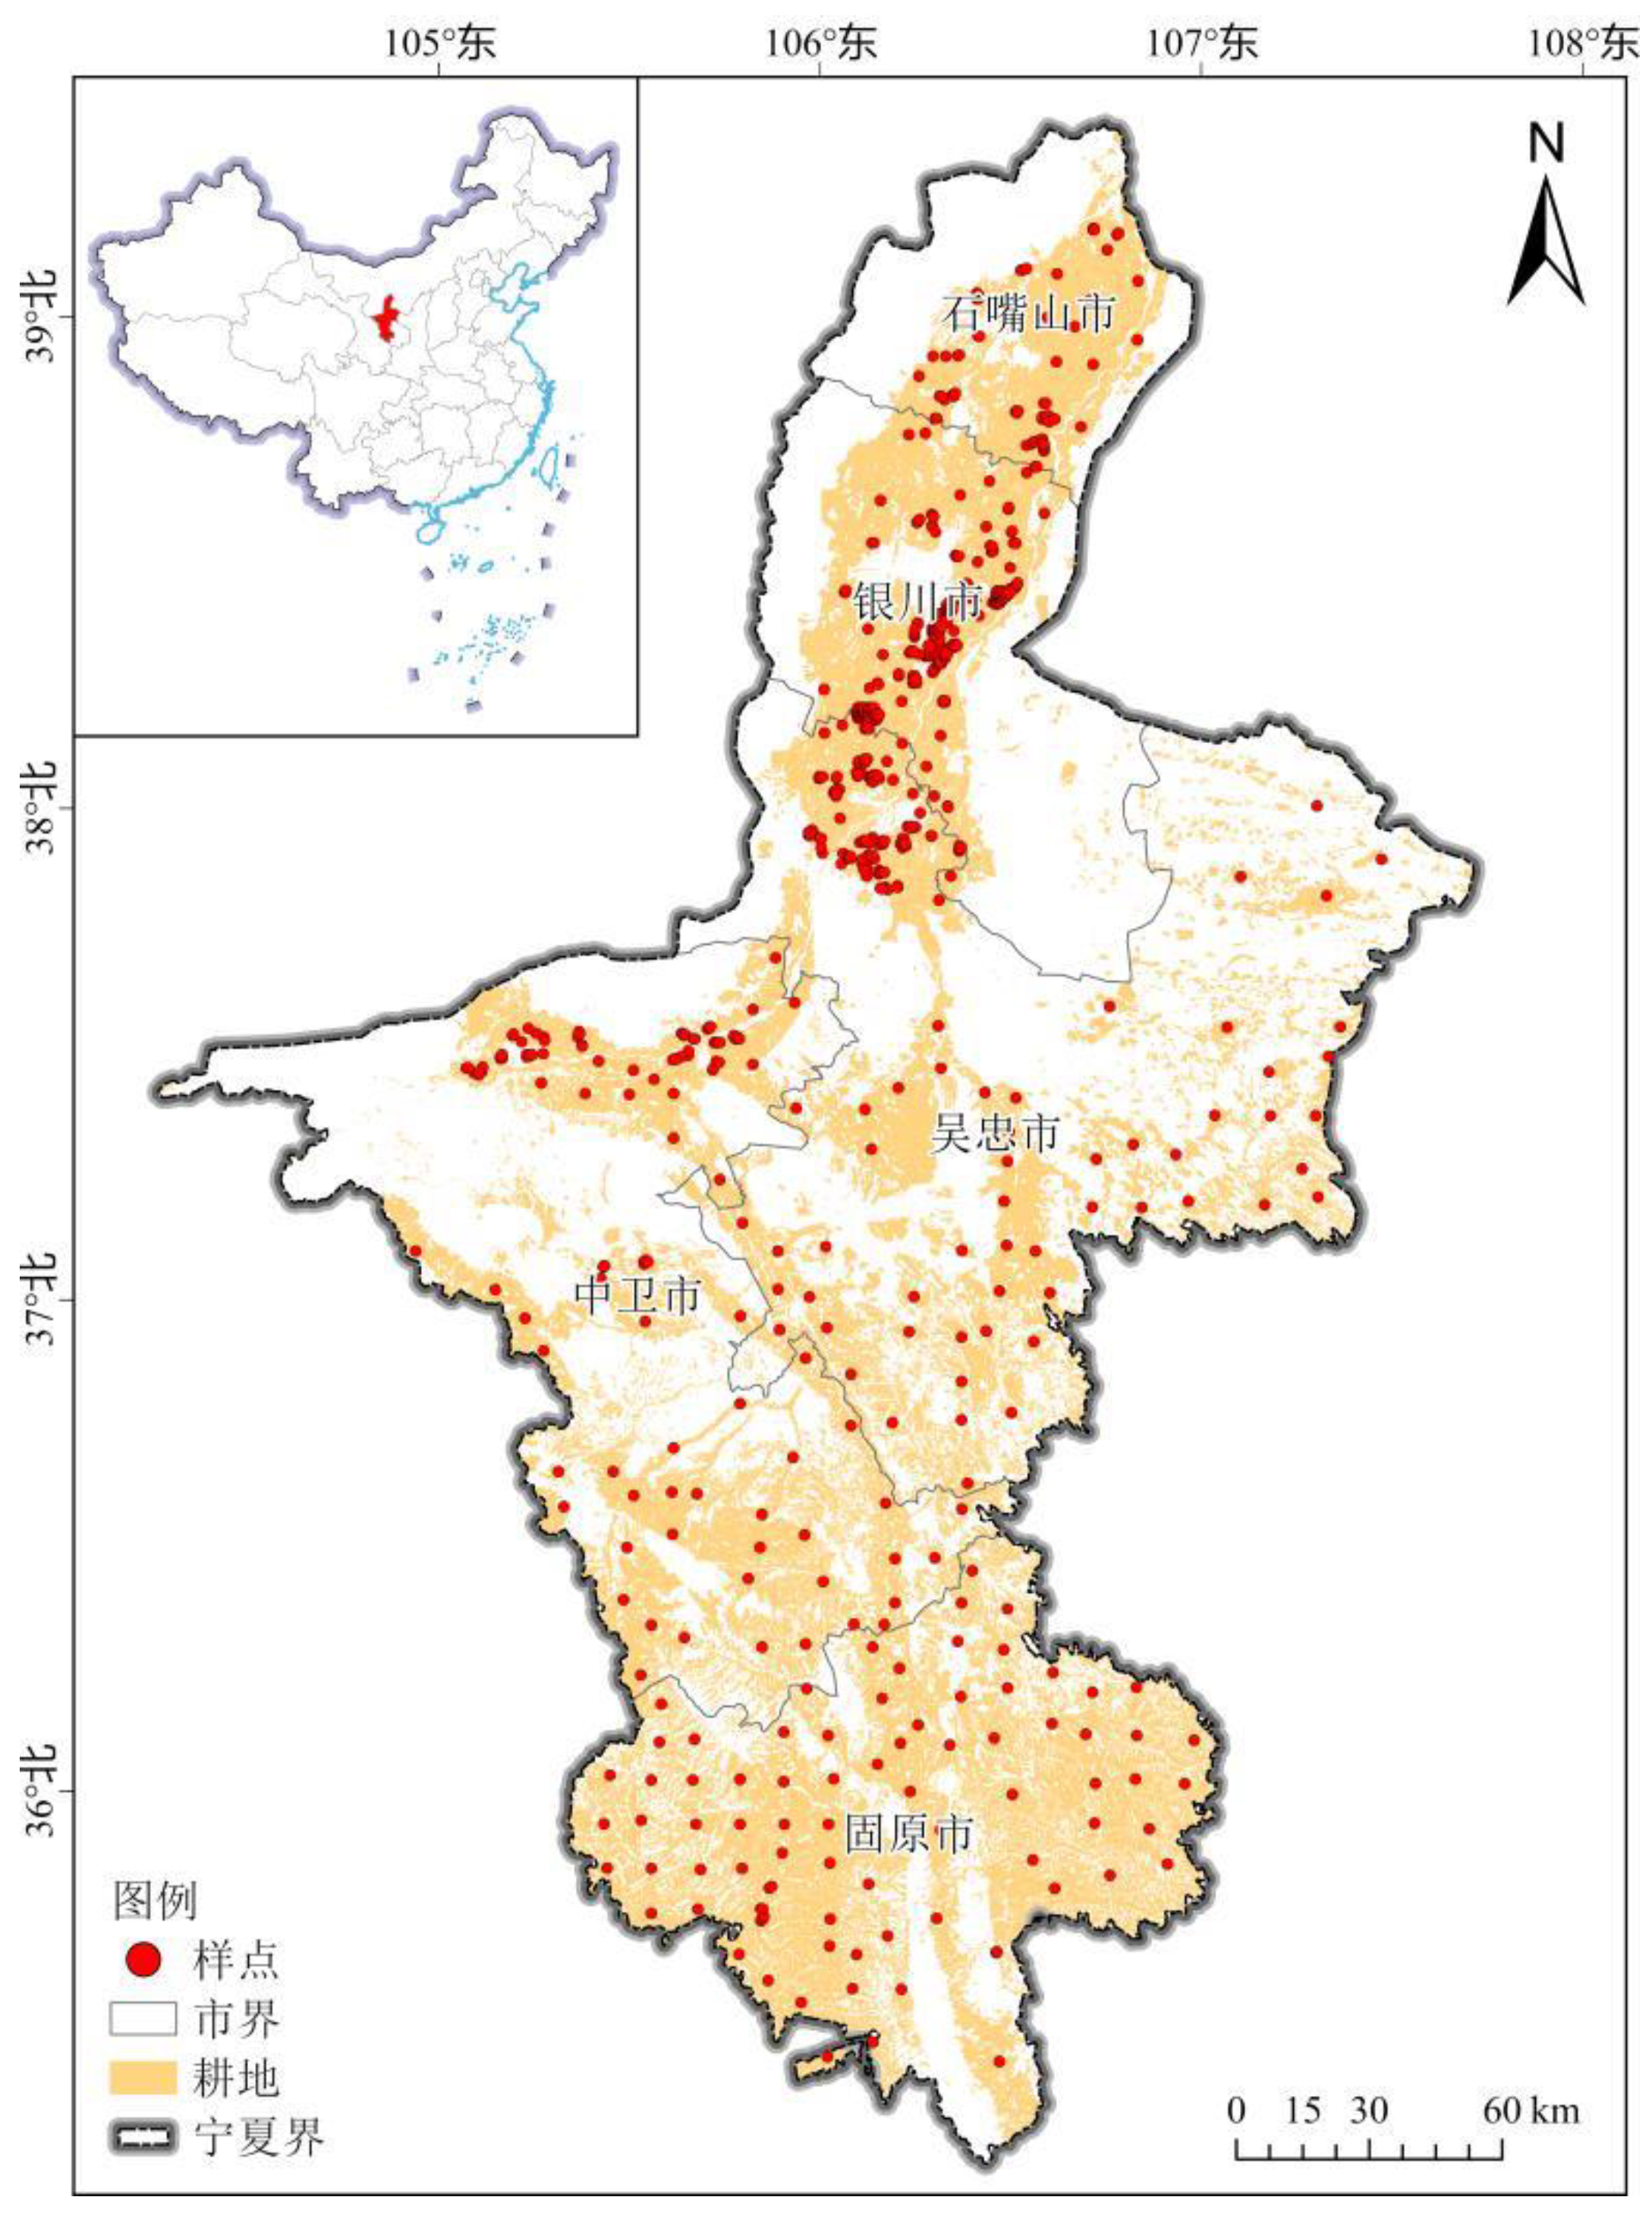
Figure 4.
illustrates the contribution rates of heavy metal pollution sources in the soils of the study area.
Figure 4.
illustrates the contribution rates of heavy metal pollution sources in the soils of the study area.
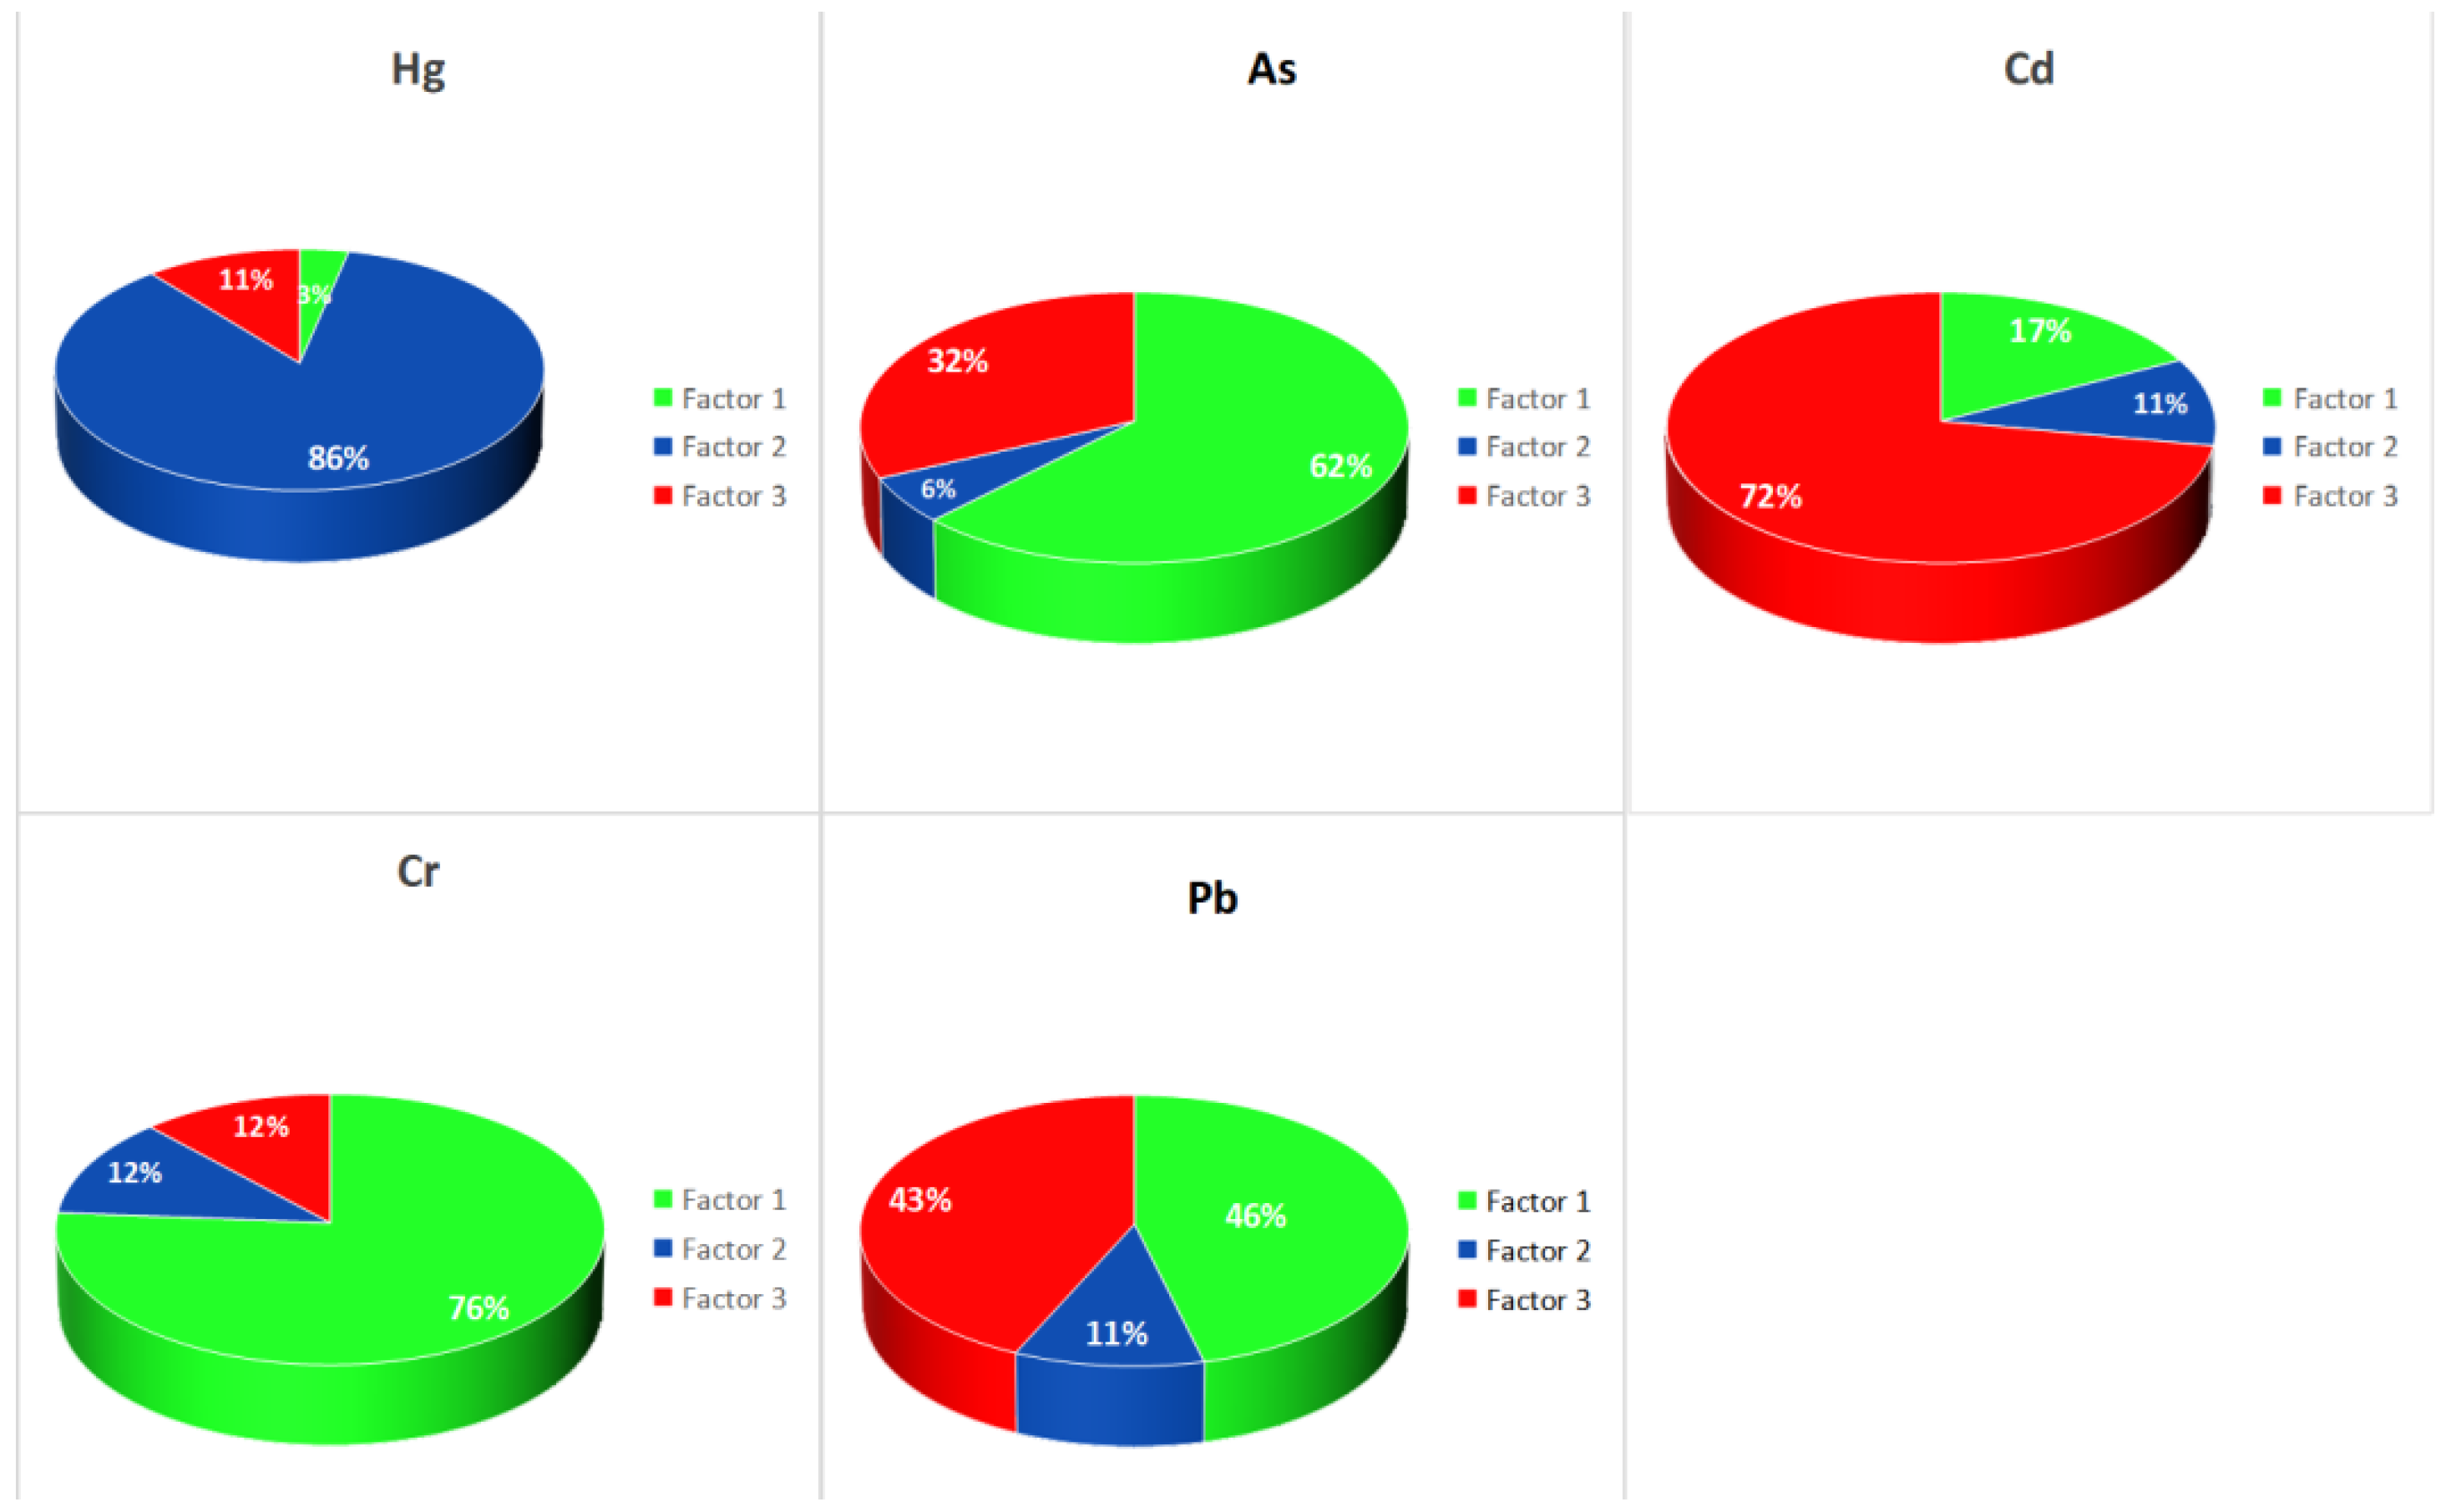
Figure 5.
Contribution of PMF source analysis of heavy metals.
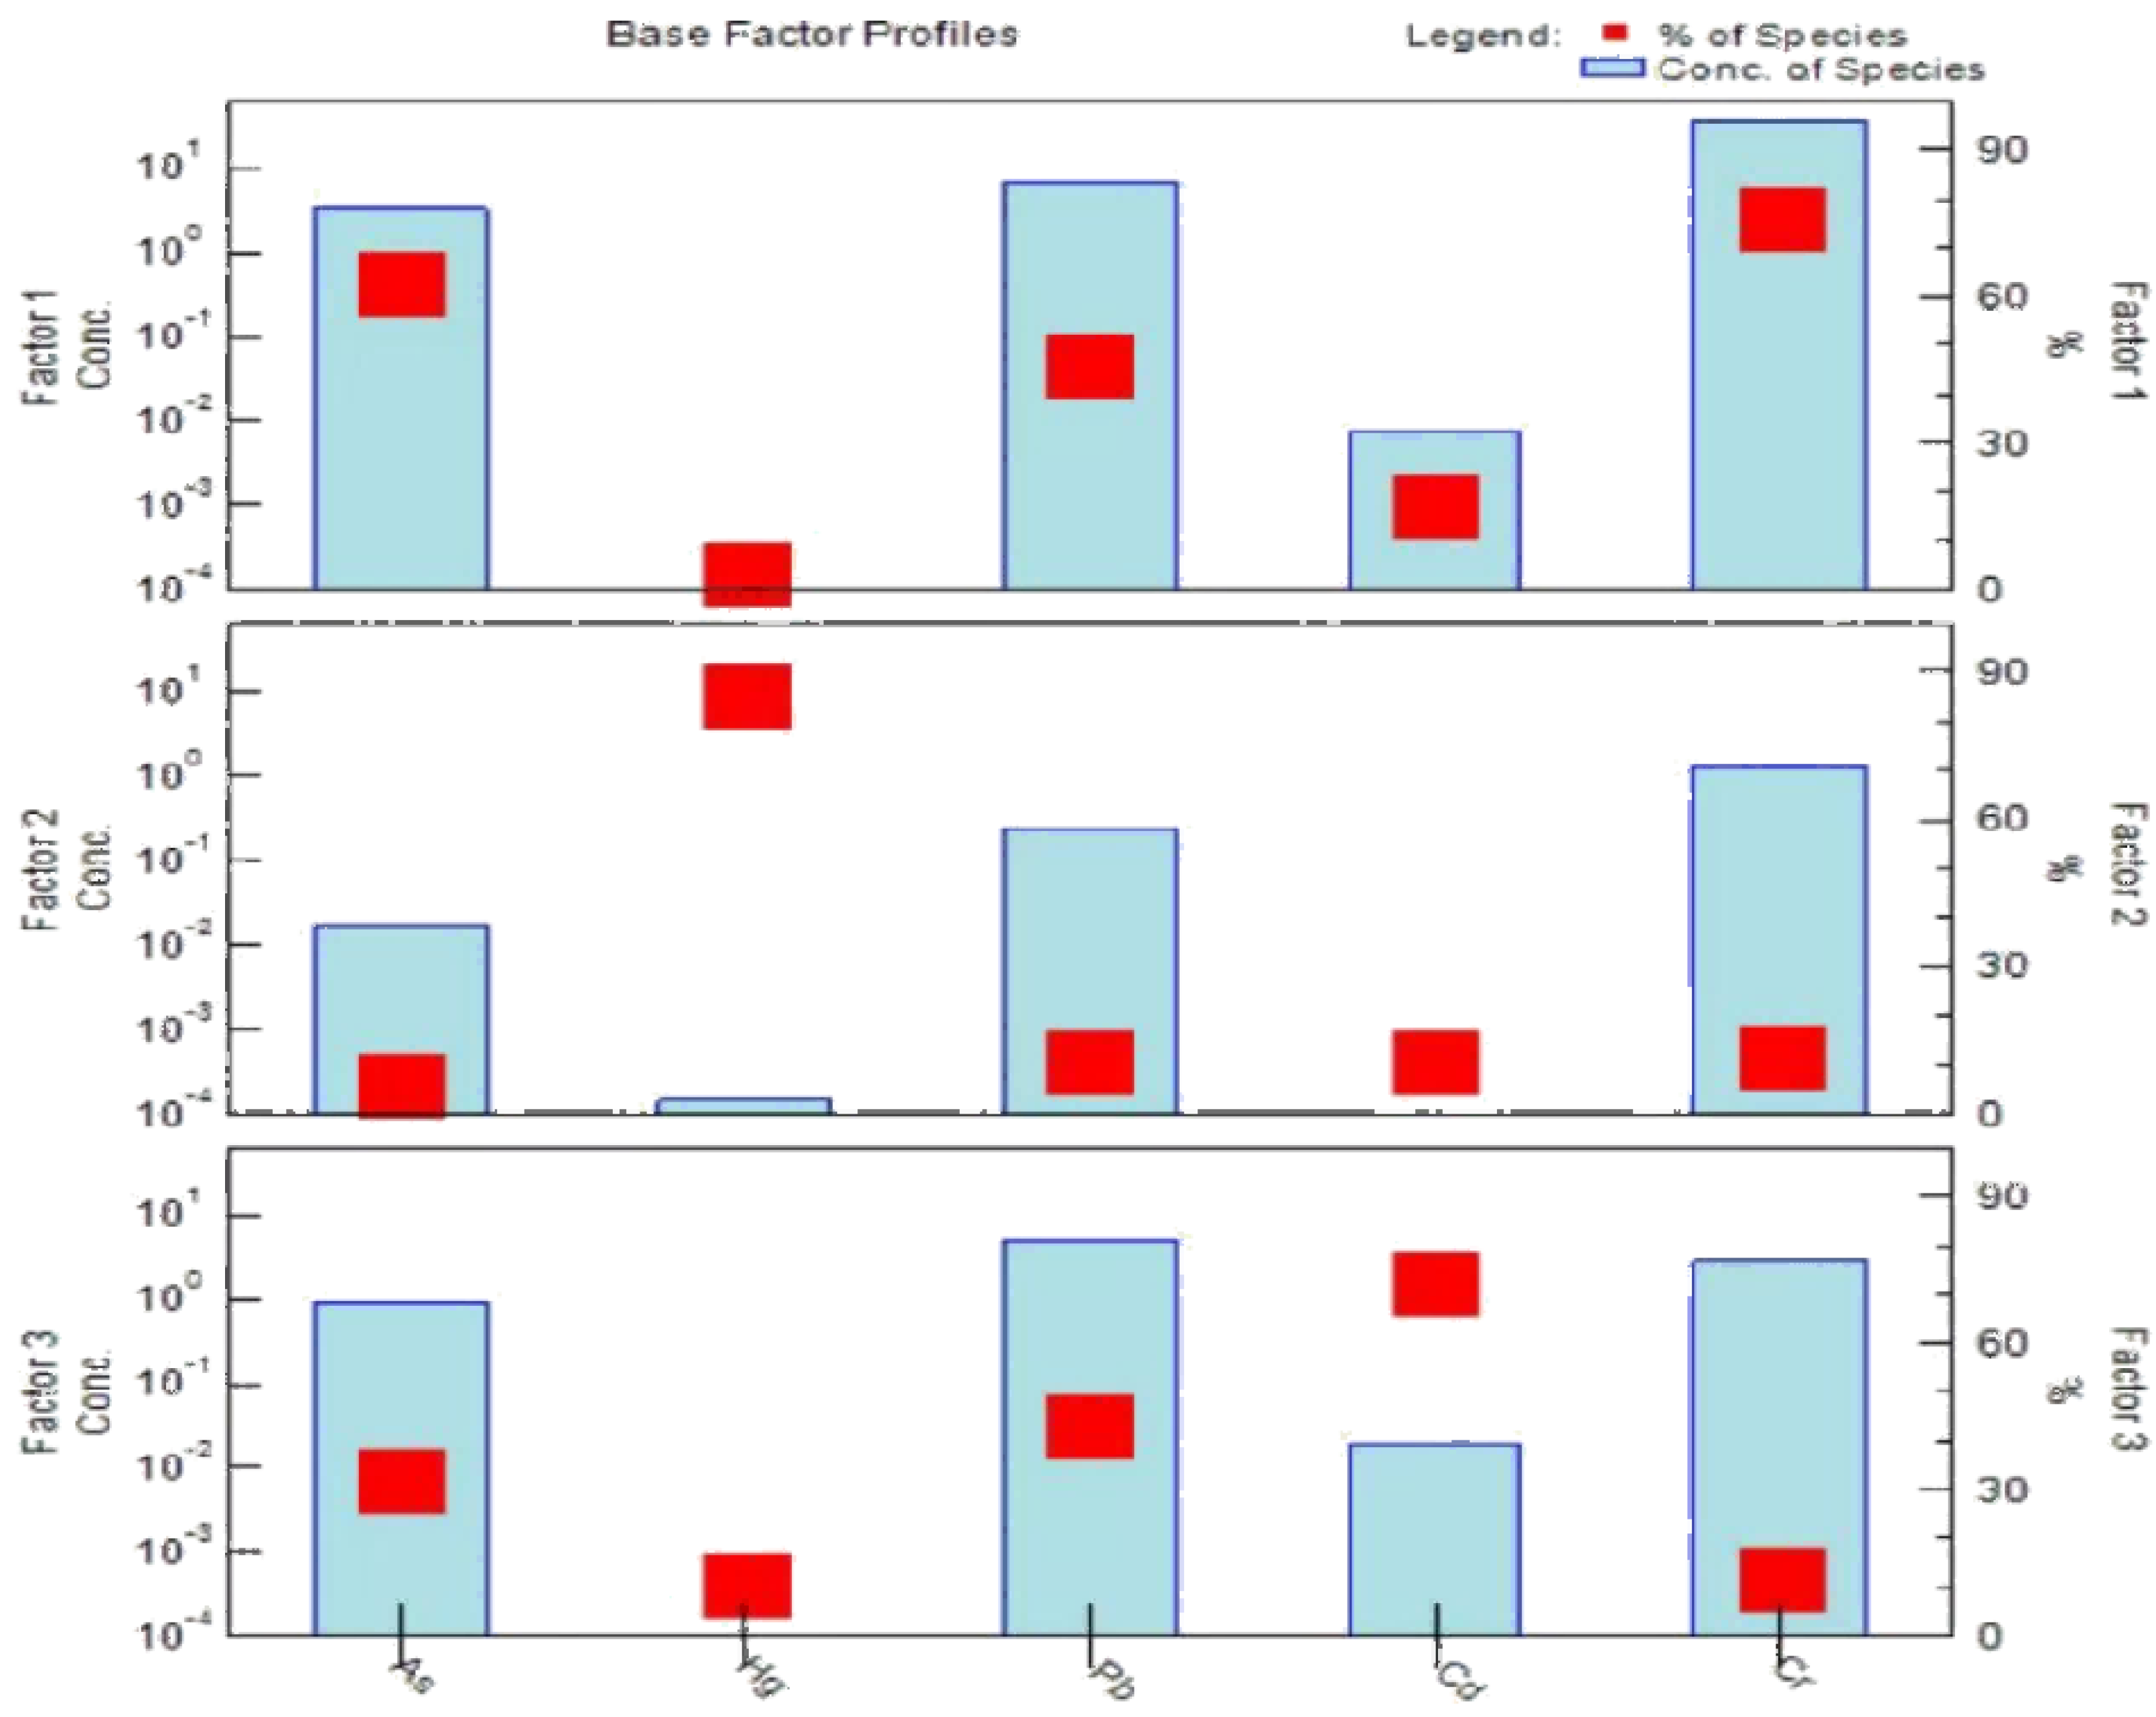
Table 1.
Classification standard of Nemero index evaluation method.
| Classification | Pi | PN | Pollution level |
| Ⅰ | P | P | Safe |
| Ⅱ | 0.7<P | 0.7<P | Low |
| Ⅲ | 1.0<P | 1.0<P | Moderate |
| Ⅳ | 2.0<P | 2.0<P | High |
| Ⅴ | Pi>3.0 | P | Very high |
Table 2.
Classification and hazard class of heavy metal potential ecological hazard index.
 |
RI | Classification of Potential ecological risk factor |
| ≦40 | RI≦150 | Low |
| 40<≦80 | 150<RI≦300 | Moderate |
| 80<≦160 | 300<RI≦600 | Considerable |
| 160<≦320 | 600<RI≦1200 | High |
| >320 | RI>1200 | Very high |
Table 5.
presents the statistics concerning heavy metal pollution index and potential ecological risk index within the research area.
Table 5.
presents the statistics concerning heavy metal pollution index and potential ecological risk index within the research area.
| Item | Pollution Index | Proportion of sampling points at different pollution levels(%) | Ecological Hazard Index | Proportion of sampling sites with different ecological risk levels(%) | ||||||||
| safe | Alert | Mild | Moderate | severe | Mild | Moderate | Strong | Very strong | Extremely strong | |||
| Cd | Pi | 96.56 | 3.17 | 0.27 | 0 | 0 | 2.56 | 66.83 | 30.12 | 0.49 | 0 | |
| Cr | Pi | 100 | 0 | 0 | 0 | 0 | 100 | 0 | 0 | 0 | 0 | |
| Pb | Pi | 100 | 0 | 0 | 0 | 0 | 100 | 0 | 0 | 0 | 0 | |
| Hg | Pi | 100 | 0 | 0 | 0 | 0 | 19.39 | 41.34 | 38.05 | 1.10 | 0.12 | |
| As | Pi | 99.63 | 0.37 | 0 | 0 | 0 | 100 | 0 | 0 | 0 | 0 | |
| PN | 99.51 | 0.49 | 0 | 0 | 0 | RI | 39.88 | 60 | 0.12 | 0 | 0 | |
Table 8.
presents the fitting results comparing measured values with simulated predicted values of soil heavy metal content.
Table 8.
presents the fitting results comparing measured values with simulated predicted values of soil heavy metal content.
| Item | R2 | Slope | Intercept |
| Pb | 0.647 | 0.408 | 13.07 |
| As | 0.676 | 0.46 | 4.795 |
| Cd | 0.841 | 0.747 | 0.06 |
| Cr | 0.784 | 0.8 | 9.627 |
| Hg | 0.998 | 0.998 | 0.001 |
Disclaimer/Publisher’s Note: The statements, opinions and data contained in all publications are solely those of the individual author(s) and contributor(s) and not of MDPI and/or the editor(s). MDPI and/or the editor(s) disclaim responsibility for any injury to people or property resulting from any ideas, methods, instructions or products referred to in the content. |
© 2025 by the authors. Licensee MDPI, Basel, Switzerland. This article is an open access article distributed under the terms and conditions of the Creative Commons Attribution (CC BY) license (http://creativecommons.org/licenses/by/4.0/).
Copyright: This open access article is published under a Creative Commons CC BY 4.0 license, which permit the free download, distribution, and reuse, provided that the author and preprint are cited in any reuse.


