
Submitted:
10 October 2025
Posted:
13 October 2025
You are already at the latest version
Abstract
This study investigated the effects of NaCl on growth, Monascus pigment production, and Monascus flavor profile in Monascus ruber CICC41233. The M.ruber CICC41233 was first cultured on a solid malt-peptone-starch medium containing varying NaCl concentrations (0-6% w/v) to evaluate the growth. Subsequently, different NaCl levels (0%, 1%, 3%, 5%) were added to the fermentation culture to assess their effect on Monascus pigment production and volatile flavor compounds. Results showed that low NaCl (1%) significantly promoted mycelial growth, while high NaCl (5%) significantly inhibited fungi growth. Although NaCl was added on 3 day, the yield of Monascus pigments was lower than that of the control group without NaCl, the production of the total pigments was enhanced by 5.91% for 1% NaCl, while 3% and 5% NaCl led to decreases of 53.31% and 91.23%, respectively, after 6 days, compared with the control without NaCl. The addition of NaCl promoted the production of numerous flavor compounds, which increased over fermentation time, particularly at a concentration of 1%. A total of 46 volatile monomers and 14 dimers were identified across all samples. The monomers included 13 aldehydes, 10 ketones, 8 alcohols, 6 esters, 3 acids, 2 pyrazines, 1 phenol, and 3 other compounds. Transcriptomic analysis revealed that salt stress significantly altered expression of genes involved in Glycolysis / Gluconeogenesis, glycerophospholipid metabolism, amino acid metabolism like phenylalanine metabolism, tryptophan metabolism, and arginine, proline metabolism, and energy metabolism. Key pigment biosynthesis genes were upregulated under 1% NaCl. These findings provide insights into the salt-responsive mechanisms of M. ruber and suggest potential strategies for optimizing pigment and flavor production under mild salinity.
Keywords:
Monascus ruber CICC41233
; Monascus pigment
; Monascus flavor
; NaCl
; Transcriptome
1. Introduction
Monascus spp. are well-documented filamentous fungi known for their pigment production. They synthesize amost secondary metabolites, among which Monascus pigments (MPs)—a mixture of compounds—exhibit antibacterial, antitumor, antioxidant, and other bioactive properties [1,2,3,4,5]. These pigments are traditionally categorized into red, orange, and yellow types based on their absorbance maxima at 490–530 nm, 460–480 nm, and 330–450 nm, respectively [1,4].
The growth and metabolic activity of Monascus spp. are highly influenced by media composition and culture conditions—including temperature, humidity, and pH [6]—which significantly affect mycelial growth rate, sporulation [7], and enzyme system distribution[8]. For instance, inorganic nitrogen sources (e.g., NH₄Cl and NH₄NO₃) promote MPs biosynthesis [9], as do acidic conditions [10]. Divalent metal ions such as Fe²⁺, Zn²⁺, and Mn²⁺ also contribute notably to MPs accumulation [11]. Additionally, high glucose concentrations enhance growth and stimulate the metabolism and secretion of extracellular yellow pigments [12]. And high NaCl conditions can promote pigments production in M. ruber CGMCC 10910 [13]. MPs have been used as natural colorants and preservatives in the food industry for over 1000 years, valued for their coloring, antiseptic, and antioxidant properties. For example, they can reduce nitrite levels while improving meat coloration [14]. Given their broad application, enhancing MP productivity remains an important objective. However, few studies have examined the effect of salt concentration on the growth, pigment synthesis, and flavor formation of Monascus spp, especially on the molecular mechanisms.
In this study, we investigated the influence of NaCl on pigment production and flavor profile in M. ruber CICC41233. Variations in volatile flavor compounds (VFCs) during MPs fermentation were analyzed using headspace gas chromatography–ion mobility spectrometry (GC–IMS) [15]. Furthermore, transcriptome sequencing was employed to elucidate the molecular mechanisms underlying salt stress responses. Differentially expressed genes were subjected to KEGG pathway enrichment analysis to identify key metabolic pathways involved.
These findings provide a theoretical foundation for understanding the salt tolerance mechanism in M. ruber CICC41233 and support strategies for improving strain performance in industrial fermentation processes.
2. Materials and Methods
2.1. Fungal Strain
M.ruber CICC41233 was purchased from the China Center of Industrial Culture Collection.
2.2. Medium and Strain Culture
The NaCl-supplemented malt-peptone-starch (MPS) solid medium was prepared with the following composition: 20 g soluble starch, 10 g malt extract, 20 g peptone, and 2 mL acetic acid, brought to a final volume of 1 L with tap water. Agar powder was added at a concentration of 2% (w/v) to solidify the medium. After thorough mixing, the medium was aliquoted into 250 mL conical flasks—100 mL per flask—and supplemented with NaCl to achieve final concentrations of 0%, 1% (10 g/L), 2% (20 g/L), 3% (30 g/L), 4% (40 g/L), 5% (50 g/L), and 6% (60 g/L) (w/v) in each 100 mL system. The flasks were then sterilized at 121 °C for 20 minutes and stored for subsequent use.
Under aseptic conditions, the sterilized MPS solid medium containing different NaCl concentrations was poured into plates according to the concentration gradient. Three plates were prepared for each NaCl concentration. Once the medium had solidified, M. ruber CICC41233 was inoculated onto each plate. The plates were sealed with parafilm and incubated at 30 °C in a mold incubator. Colony growth was observed after 3 and 6 days of cultivation.
2.3. Monascus Pigments Production Under Salt Stress
Salt stress fermentation experiments were conducted in 250 mL Erlenmeyer flasks, each containing 50 mL of fermentation medium composed of 9.0% rice flour, 0.2% NaNO₃, 0.1% KH₂PO₄, 0.2% MgSO₄·7H₂O (w/v), and 2% acetate (v/v). NaCl was added to the medium at concentrations of 0%, 1% (10 g/L), 3% (30 g/L), and 5% (50 g/L), respectively. Freshly harvested spores were inoculated at a final concentration of 10⁵ conidia/mL [16] and cultivated at 30 °C with orbital shaking at 180 rpm. Pigment production was assessed after 3 and 6 days of fermentation. All experiments were independently performed in triplicate.
After fermentation, the broth was centrifuged (9000×g, 30 min, 16 °C) to obtain the supernatant for the determination of extracellular pigments. Intracellular pigments were extracted by resuspending the pellet in 70% (v/v) ethanol, incubating at 60 °C for 1 hour, followed by centrifugation (9000×g, 30 min, 4 °C) to collect the supernatant. The remaining precipitate was dried at 60 °C to constant weight [20] to determine the biomass, expressed as dry cell weight per unit volume of fermentation broth. Absorption spectra of the pigments were recorded from 200 to 700 nm using a UV/Vis spectrophotometer (Cary 60, Agilent, USA). Total Monascus pigments (MPs) were defined as the sum of extracellular and intracellular pigments.
2.4. Analysis of Monascus flavor with GC-IMS
The volatile compounds of Monascus flavor in the fermentation samples were analyzed by GC–IMS with Fla-vourSpec® Flavor Analyzer (Gesellschaft für Analytische Sensorsysteme mbH, Dortmund, Germany). The detailed procedures for the methods could be found in the reference by Zhang et al. [15]
2.5. Transcriptome Sequencing Analysis
Mycelial samples from solid plate cultures grown under 0%, 1%, and 5% (w/v) NaCl conditions were collected at 3 and 6 days, and immediately frozen in liquid nitrogen.
After fermentation, 25 mL of culture broth was reserved for pigment analysis. The remainder was centrifuged (9000×g, 30 min, 4 °C), after which the supernatant was discarded and the pellet flash-frozen in liquid nitrogen.
All samples were sent to Guangzhou Kedio Biotechnology Co., Ltd. for Illumina-based high-throughput transcriptome sequencing.
The resulting sequencing reads were aligned to the Monascus ruber NRRL1597 reference genome using Tophat. Splicing and alignment outcomes were stored in SAM format files for downstream analysis. Gene expression levels were normalized and quantified as RPKM (reads per kilobase per million mapped reads). Based on orthologous relationships and functional annotations from the KEGG database, metabolic pathway reconstruction and analysis of expression dynamics were performed.
2.6. Statistical Analysis
Each experiment was repeated at least in triplicate. Numerical dataare presented as the mean ± standard deviation (SD).Single factor analysis of variance (ANOVA) was used to analyze the differences between different treatments. Values with p<0.05 are considered statistically significant.
3. Results and Discussion
3.1. Effect of NaCl on the Growth in M. ruber CICC41233
The effect of different NaCl concentrations ranging from 0% to 6% on the growth in M.ruber CICC41233 for 3 and 6 days are shown in Figure 1. The strain growth varied significantly under different NaCl levels.
After 3 days of culture on MPS solid medium, the strain exhibited faster mycelial growth, larger pigment halo diameter, and deeper coloration at 1% NaCl compared to the no-NaCl control. At 2% NaCl, mycelial growth remained relatively vigorous, but the pigment halo was smaller and lighter in color. Higher concentrations (4%–6%) significantly inhibited mycelial expansion (Figure 1 and Figure 2).
After 6 days of cultivation, strains cultured with 1%–3% NaCl showed accelerated growth and larger pigment halos, especially at a NaCl concentration of 1%. At 4% NaCl, both growth and pigment production were reduced, resulting in a smaller colony with faint pigmentation. Concentrations equal to or exceeding 5% strongly suppressed mycelial growth, yielding very small colonies with minimal and faint pigment halos (Figure 1 and Figure 2). These results indicate that increasing NaCl concentration progressively inhibits colony growth and pigment synthesis in M. ruber CICC41233.
The high-salt conditions were known to strongly inhibit fungal growth—as demonstrated in species such as Penicillium roqueforti and Aspergillus niger [17].But the Monascus fungus M. ruber CGMCC 10910 grew well with 35 g/L (3.5%) NaCl conditions [18], while NaCl didn’t affect the cell growth on M. purpureus [19]. This indicates that the effects of NaCl on microbial growth vary by species.
3.2. Effect of NaCl on Monascus Pigment Production
Monascus pigment fermentation was conducted under varying NaCl concentrations (0%, 1%, 3%, and 5%), with pigment yields assessed after 3 and 6 days. Notable differences in pigment production were observed in response to salt stress (Supplementary Figure S1).
After 3 days of fermentation, both water-soluble pigment (WSP-3) and ethanol-soluble pigment (ESP-3) decreased progressively with increasing NaCl concentration. Compared to the control (0% NaCl), total Monascus pigment (TMP) declined by 25.40% at 1% NaCl, 83.74% at 3% NaCl, and 88.71% at 5% NaCl (Figure 3A).
By day 6, water-soluble pigment (WSP-6) continued to decrease across all salt concentrations relative to the control. In contrast, ethanol-soluble pigment (ESP-6) increased under 1% NaCl but decreased under higher concentrations (3% and 5% NaCl). TMP at 1% NaCl showed a slight increase of 5.91% compared to the control, with no significant difference observed. However, TMP was significantly reduced at 3% and 5% NaCl, declining by 53.31% and 91.23%, respectively (Figure 3A).
However, for instance, in M. ruber CGMCC 10910, the total yellow pigment yield (intracellular plus extracellular) under high salt stress (35 g/L NaCl) exceeded that of conventional fermentation systems [18]. Similarly, in M. purpureus, the addition of 0.02 M NaCl by the 10th day of cultivation resulted in a 48.0% reduction in citrinin content, while enhancing the production of yellow, orange, and red pigments as well as monacolin K by 1.7-, 1.4-, 1.4-, and 1.4-fold, respectively, compared to the control [19].
Biomass was markedly inhibited with increasing NaCl concentration (Figure 3B). UV–vis spectral analysis at day 6 indicated that extracellular pigments under 0% and 1% NaCl were predominantly red (Figure 3C). Intracellular pigments exhibited absorption peaks in the yellow (330–450 nm) and red (490–530 nm) regions (Figure 3D). Almost no pigment peaks were detected at 5% NaCl.
Although 1% NaCl slightly promoted mycelial growth, it significantly altered the composition of ethanol-soluble pigments without markedly affecting TMP after 6 days. Collectively, these results demonstrate that high NaCl concentrations strongly suppress Monascus pigment synthesis.
3.3. Effect of NaCl on Monascus Flavor Fingerprint
The 3 and 6 days Monasucs fermentation sample of volatile compounds was analyzed by GC-IMS to construct the Monasucs flavor fingerprint. As shown in Figure 4, Figure 5 and Figure 6, Table 1, Supplementary Figure S2 and Supplementary Table S1, compared to 0% NaCl, 1% NaCl has a relatively minor impact on the volatile compounds produced by M.ruber CICC41233 fermentation on 3 day but a significant difference was observed on day 6, while 3% and 5% NaCl induce more substantial changes on 3 and 6 days.
The 8 samples of fermentation exhibited distinct characteristic peak regions in their Monascus flavor profiles, while also sharing some commonalities (Figure 5 and Figure 6 and Table 1). As shown in Figure 5, in the absence of NaCl, more flavor compounds were produced on day 3 than on day 6. However, with the addition of NaCl (1%, 3%, and 5%), the number of flavor compounds generated by day 6 significantly exceeded that on day 3 as fermentation progressed.
A total of 46 volatile monomers and 14 dimers were identified across all samples (Figure 5 and 6 and Supplementary Table S1). The monomers included 13 aldehydes, 10 ketones, 8 alcohols, 6 esters, 3 acids, 2 pyrazines, 1 phenol, and 3 other compounds. As shown in Table 1, ketones, aldehydes, and alcohols were the main components, accounting for over 94%, with small amounts of esters, acids, pyrazines and others components. As the fermentation time extends, compared with the 3 day, on the 6 day, the proportion of ketones in the CK group increased from 41.63% to 52.87%, while the proportions in the TY1, TY3, and TY5 groups showed a downward trend. Meanwhile, the proportion of aldehydes in the CK group decreased from 33.34% to 26.63%, while the proportions in the TY1, TY3, and TY5 groups showed an upward trend.
As shown in Figure 5, fermentation samples with higher NaCl concentrations generally exhibited lower overall volatile organic compound (VOC) concentrations. However, the specific varieties of VOCs remained unclear (Figure 5, 1-12 compounds). The regions a–f indicate higher abundance of certain compounds in specific samples, with darker colors representing higher concentrations. Zhang et al. [15] employed GC-IMS to analyze differences in volatile flavor compounds (VFCs) between solid-state (MSFTB) and liquid-state (MLFTB) Monascus-fermented Tartary buckwheat. Significant variations were observed in the composition and abundance of VFCs between the two fermentation methods. GC-IMS analysis identified 25 VFCs, categorized as 9 esters, 7 alcohols, 5 ketones, and 4 aldehydes.
The key findings for each sample group were summarized below. 0% NaCl-3d group: High levels of 1-hexanol, acetoin, acetone, methyl benzoate, propyl acetate, butyric acid, valeric acid, 2-methylpropanal, 3-methylbutanal, and 2-methylpropanol. 1% NaCl-3d group: Elevated concentrations of 2-heptanone, 2-nonanone, 2-hexanone, phenylacetaldehyde, hexyl acetate, methyl hexanoate, p-xylene, p-cresol, hexanal, pentanal, E-2-octenal, E-2-heptenal, and 2-pentanone. 3% NaCl-3d group: Dominated by 2-methylpentanol and dimethyl sulfide. 5% NaCl-3d group: Prominent levels of heptanal, nonanal, octanal, 3-octanone, 2-butanone, 1-pentanol, 3-methylbutanol, 2-methylbutanol, benzaldehyde, amyl acetate, ethyl butyrate, decanal, and diallyl disulfide.
0% NaCl-6d group: High abundance of methyl benzoate, propyl acetate, 1-hexanol, heptanal, dimethyl sulfide, and 2-hexanone. 1% NaCl-6d group: Rich in acetoin, 2-pentanone, pentanal, hexyl acetate, nonanal, octanal, phenylacetaldehyde, benzaldehyde, 2-methylpentanol, hexanal, 2-methylpropanal, (E,Z)-2,6-nonadienal, E-2-octenal, E-2-heptenal, p-cresol, and methylpyrazine. 3% NaCl-6d group: Characterized by valeric acid, butyric acid, heptanoic acid, 2-nonanone, p-xylene, 1-pentanol, 3-methylbutanol, amyl acetate, methyl hexanoate, and 3-methylbutanal. 5% NaCl-6d group: Dominated by 2-methylpropanol, 3-octanone, 6-methyl-5-hepten-2-one, 2-butanone, acetone, ethanol, 2-propanol, diallyl disulfide, 2-cyclohexen-1-one, 2,5-dimethylpyrazine, and ethyl butyrate.
These findings support the potential application of salt-containing Monascus fermentation in the food industry.
3.4. Transcriptomic Insights into the Metabolic Regulation of M. ruber Cultivated on Solid Substrate
To further investigate the regulatory effect of NaCl on M. ruber growth and Monascus pigment (Figure 1), a comparative transcriptomic analysis was performed using solid-state cultures under different salinity conditions: 0% NaCl (control, CK-G), 1% NaCl (TG1), and 5% NaCl (TG5), harvested at 3 and 6 days.
As summarized in Table 2, the number of differentially expressed genes (DEGs) varied significantly across treatments. Compared to the 3-day control (CK-G3), 199 DEGs were identified under 1% NaCl (TG1-3), with 99 up-regulated and 100 down-regulated. In contrast, 5% NaCl (TG5-3) induced 1351 DEGs, including 336 up-regulated and 1015 down-regulated. At the 6-day time point, comparison with CK-G6 revealed 356 DEGs under 1% NaCl (TG1-6; 172 up, 184 down), and 1319 DEGs under 5% NaCl (TG5-6; 315 up, 1004 down).
The markedly higher number of DEGs under 5% NaCl treatment compared to 1% NaCl suggests that higher salinity significantly enhances the transcriptional response. These results indicate that increased NaCl concentration may intensify the inhibitory effect on the metabolism of M. ruber CICC41233.
*CK-Y3: Add 0% NaCl, 3 d liquid fermentation sample; TY1-3: Add 1% NaCl, 3 d liquid fermentation sample ; TY5-3: Add 5% NaCl, 3 d liquid fermentation sample. CK-Y6: Add 0% NaCl, 6 d liquid fermentation sample; TY1-6: Add 1% NaCl, 6 d liquid fermentation sample ; TY5-6: Add 5% NaCl, 6 d liquid fermentation sample.
To further investigate the biological functions of the differentially expressed genes (DEGs), pathway enrichment analysis was performed using the KEGG database. Significantly enriched pathways were identified based on an adjusted P-value (Q-value ≤ 0.05), and the major metabolic pathways involving DEGs are summarized in Table 3.
Analysis revealed that in the comparison between CK-G3 and TG1-3, several DEGs were enriched in lipoic acid metabolism and glycerophospholipid metabolism (Table 3). Specifically, the expression of lipoyl synthase (evm.TU.Contig5.599), a key enzyme in lipoic acid biosynthesis, was significantly up-regulated. Lipoic acid metabolism activates critical energy-metabolizing enzyme complexes, enhancing ATP production and thereby directly supporting microbial growth. Additionally, the expression of phosphatidylglycerophosphatase GEP4 (evm.TU.Contig1.491) involved in glycerophospholipid metabolism was significantly up-regulated. This enzyme contributes to cell membrane formation and energy supply, further facilitating microbial growth. In the CK-G6 vs. TG1-6 comparison, DEGs were associated with glycerophospholipid metabolism, alpha-linolenic acid metabolism, linoleic acid metabolism, and galactose metabolism (Table 3). These metabolic pathways provide energy and structural materials for microorganisms, directly participate in the synthesis of metabolic products, and promote microbial growth through signaling regulation [20,21].
Furthermore, in the CK-G3 vs. TG5-3 comparison, DEGs were enriched in starch and sucrose metabolism, pyruvate metabolism, tryptophan metabolism, phenylalanine metabolism, and tyrosine metabolism (Table 3). Similarly, in the CK-G6 vs. TG5-6 comparison, DEGs were involved in phenylalanine metabolism, tryptophan metabolism, and tyrosine metabolism (Table 3). Synthesizing these aromatic amino acids and their derivatives was a highly energy-intensive process. When the strain M.ruber CICC41233 encounter stressful environments, such as high salt concentrations (5%), they mount a stress or compensatory response that activates these metabolic pathways. This disrupts central metabolism, reduces the supply of energy and precursor molecules, and indirectly inhibits growth. The "diversion" of resources directly diminishes the energy available for cell division and biomass accumulation, thereby slowing down or even inhibiting growth rates. A trade-off exists between growth and stress response in terms of resource allocation [22]..
3.5. Transcriptomic Insights into the Monascus Pigment Fermentation and Monascus flavor of M. ruber
To further elucidate the regulatory mechanisms underlying the effects of different NaCl concentrations on Monascus pigment fermentation and Monascus flavor formation in M. ruber (Figure 3, Figure 5 and Figure 6), a comparative transcriptomic analysis was conducted using fermentation samples with 0% NaCl (CK-Y), 1% NaCl (TY1), and 5% NaCl (TY5) collected at 3 and 6 days. The read counts of differentially expressed genes (DEGs) were summarized in Table 2.
Transcriptome sequencing revealed that, compared to the 3-day control (CK-Y3), 1078 DEGs were identified in the 1% NaCl group at 3 days (TY1-3), including 662 up-regulated and 416 down-regulated genes. In contrast, 2873 DEGs were detected in the 5% NaCl group at 3 days (TY5-3), with 1749 up-regulated and 1124 down-regulated. At the 6-day time point, comparison with the no-NaCl control (CK-Y6) showed 3681 DEGs in the 1% NaCl group (TY1-6), of which 3264 were up-regulated and 417 down-regulated. The 5% NaCl group at 6 days (TY5-6) exhibited 3530 DEGs, including 2426 up-regulated and 1104 down-regulated genes. The significantly higher number of DEGs under 5% NaCl suggests that increased salt concentration enhances the metabolic inhibition of M. ruber CICC41233.
Metabolic pathway analysis indicated that DEGs in the CK-Y3 vs TY1-3 comparison were enriched in glycolysis/gluconeogenesis and biosynthesis of amino acids (Table 4). Key up-regulated genes involved in glycolysis/gluconeogenesis—including evm.TU.Contig2.556 (phosphoglucomutase), evm.TU.Contig6.123 (triosephosphate isomerase), evm.TU.Contig1.1016 (glyceraldehyde-3-phosphate dehydrogenase), and evm.TU.Contig8.309 (enolase)—likely facilitate starch degradation and promote Monascus pigment synthesis.
In the CK-Y6 vs TY1-6 comparison, DEGs were associated with phenylalanine metabolism, tryptophan metabolism, and arginine and proline metabolism (Table 4). Phenylalanine is an aromatic amino acid, which can be converted into a variety of biological compounds (including 5-hydroxytryptamine, allobiotin, dopamine, melanin, etc.) through a series of oxidation reactions. This molecue, participates in biological physiology and growth processes, and can produce pigment biosynthetic precursor [23]. This further confirmed that a 1% NaCl concentration can promote the production of Monascus pigment. Phenylalanine metabolism gives rise to key flavor compounds such as benzeneacetaldehyde, phenylethyl alcohol, and phenethyl acetate. Meanwhile, the arginine and proline metabolism pathways serve as critical precursors for the synthesis of flavor substances, including proline and glutamate [24,25,26,27].The metabolism of these amino acids not only affects pigment synthesis but also serves as a critical biochemical source of flavor compounds, particularly in fermenting microbial strains.
Meanwhile, DEGs in the CK-Y3 vs TY5-3 group were enriched in oxidative phosphorylation, fatty acid degradation, lysine degradation, and tryptophan metabolism (Table 4). In the CK-Y6 vs TY5-6 comparison, DEGs were implicated in pyruvate metabolism; glycine, serine, and threonine metabolism; and cysteine and methionine metabolism (Table 4), but these DEGs genes were down-regulated. Studies have also demonstrated that arginine, glycine, tyrosine, serine and histidine are the only nitrogen sources that are beneficial to the production of red Monascus pigment [1,4,23,28]. Benzene alanine, lysine, and tryptophan can produce the biosynthetic precursors of Monascus pigment, which have significant effects on the production and biosynthesis of MPs [9]. The metabolism of glycine, serine, and threonine is involved in the synthesis of pyrazine compounds. Compounds including hydrogen sulfide, methanethiol, thiophene, and thiazole are generated through the metabolic pathways of cysteine and methionine [24,25,26,27].
3.6. Monascus Pigment Biosynthetic Gene Cluster Expression Under Salt Condition in M. ruber CICC41233
Based on the M. pilosus pigment biosynthetic gene cluster (GenBank accession number KC148521) [29], the identity of the pigment biosynthetic gene cluster of M. ruber CICC41233 was shown in Table 5.
The results showed that the key genes [10] involved in pigment synthesis were no significant difference was observed on the solid culture sample (Table S2).
But the liquid fermatation sample, the results showed that the FPKM value of the key genes MpPKS5 (evm.TU.Contig6.566, conidial yellow pigment biosynthesis polyketide synthase) involved in pigment synthesis was 555.47 in TY1-3 group ,while 388.7 in TY1-3 group (Table 5). The key gene evm.TU.Contig6.568 (amino oxidase/esterase) involved in pigment synthesis were up-regulated in TY1-3 group (Table 5). The genes within this pigment biosynthetic gene cluster play a critical role in increasing the yield of Monasucs pigment [29].
Although the pigment-related metabolic genes in Monascus were significantly suppressed under 5% salt concentration on day 3, an upward trend of genes [10] evm.TU.Contig6.566 (conidial yellow pigment biosynthesis polyketide synthase), evm.TU.Contig6.568 (amino oxidase/esterase), evm.TU.Contig6.569 (amino oxidase/esterase), evm.TU.Contig6.573 (fatty acid synthase beta subunit) were observed by day 6 (Table 5). The expression of these key genes [29] was suppressed on day 3 but up-regulated on day 6, which is consistent with the pigment production profile observed during fermentation.
4. Conclusions
This study demonstrated that NaCl concentration critically influences the growth, pigment synthesis, and flavor formation of M. ruber CICC41233. While low salt (1%) promoted growth, enhanced metabolic activity and flavor complexity, high salt (≥3%) severely inhibits cellular and biosynthetic processes. Transcriptomic data further reveal salt-induced reprogramming of key pathways related to energy, amino acids, and lipid metabolism. These results offer a foundation for exploiting mild salt stress to improve the production and quality of Monascus pigments and flavors in industrial applications.
Supplementary Materials
The following supporting information can be downloaded at the website of this paper posted on Preprints.org. Figure S1. Effects of NaCl concentration on morphology and pigment production in Monascus ruber CICC41233. Figure S2. View of GC-IMS spectrum of fermentation samples. Table S1. GC-IMS analysis volatile compounds. Table S2. FPKM value of Monascus pigment biosynthetic gene cluster of solid sample in M. ruber CICC41233.
Author Contributions
W.W. performed the experiments, analyzed the data and wrote the manuscript. Y.W. cultured for M. ruber CICC41233. Y.W. and S.W. provided the information of MPs synthesis gene cluster and GC-IMS data analysis. J.C. revised the manuscript. C.L. supervised, reviewed and edited the whole work. J.C.and C.L.conceived, designed the experiments, and provided financial support. All authors have read and agreed to the published version of the manuscript.
Funding
This work was funded by the National Natural Science Foundation of China (grant no.31860436, no. 32460569), Natural Science Foundation of Jiangxi Province (grant nos. 20181BAB204001, 20212BAB205002).
Data Availability Statement
Data are contained within the article and Supplementary Materials.
Conflicts of Interest
The authors declare that this study was conducted without any commercial or financial relationship.
References
- Chen, W.P.; Chen, R.F.; Liu, Q.P.; He, Y.; He, K.; Ding, X.L.; Kang, L.J.; Guo, X.X.; Xie, N.N.; Zhou, Y.X.; Lu, Y.Y.; Cox, R.J.; Molnár, I.; Li, M.; Shao, Y.C.; Chen, F.S. Orange, red, yellow: biosynthesis of azaphilone pigments in Monascus fungi. Chem. Sci. 2017, 8, 4917–4925. [Google Scholar] [CrossRef]
- Huang, Q.; Zhang, H.; Xue, D. Enhancement of antioxidant activity of Radix Puerariae and red yeast rice by mixed fermentation with Monascus purpureus. Food Chem. 2017, 226, 89–94. [Google Scholar] [CrossRef]
- Morales-Oyervides, L.; Ruiz-Sánchez, J. P.; Oliveira, J. C.; Sousa-Gallagher, M. J.; Méndez-Zavala, A.; Giuffrida, D.; Dufossé, L.; Montañez, J. Biotechnological approaches for the production of natural colorants by Talaromyces/Penicillium: A review. Biotechnol. Adv. 2020, 43, 107601. [Google Scholar] [CrossRef] [PubMed]
- Chen, W.P.; He, Y.; Zhou, Y.X.; Shao, Y.C.; Feng, Y.L.; Li, M.; Chen, F.S. Edible Filamentous Fungi from the Species Monascus: Early Traditional Fermentations, Modern Molecular Biology, and Future Genomics. Compr Rev Food Sci F. 2015, 14, 555–567. [Google Scholar] [CrossRef]
- Farawahida, A.H.; Palmer, J.; Flint, S. The relationship between pH, pigments production, and citrinin synthesis by Monascus purpureus during red fermented rice fermentation. Food Biosci. 2025, 71, 107034. [Google Scholar] [CrossRef]
- Panagou, E. Z.; Skandamis, P. N.; Nychas, G. J. Modelling the combined effect of temperature, pH and aw on the growth rate of Monascus ruber, a heat-resistant fungus isolated from green table olives. J. Appl. Microbiol. 2003, 94, 146–156. [Google Scholar] [CrossRef]
- Wang, Y. H.; Zhang, B. B.; Lu, L. P.; Huang, Y.; Xu. G. R. Enhanced production of pigments by addition of surfactants in submerged fermentation of Monascus purpureus H1102. J. Sci. Food Agr. 2013, 93, 3339–3344. [Google Scholar] [CrossRef]
- Zhou, B.; Ma, Y.F.; Tian, Y.; Li, J. B.; Zhong, H. Y. Quantitative proteomics analysis by sequential window acquisition of all theoretical mass spectra–mass spectrometry reveals inhibition mechanism of pigments and citrinin production of Monascus response to high ammonium chloride concentration. J.Agr. Food Chem. 2019, 68, 808–817. [Google Scholar] [CrossRef]
- Hong, J. L.; Wu, L.; Lu, J. Q.; Zhou, W. B.; Cao, Y. J.; Lv, W. L.; Liu, B.; Rao, P. F.; Ni, L.; Lv, X. C. Comparative transcriptomic analysis reveals the regulatory effects of inorganic nitrogen on the biosynthesis of Monascus pigments and citrinin. RSC Adv. 2020, 10, 5268–5282. [Google Scholar] [CrossRef] [PubMed]
- Wang, Y.; Wu, W.; Wu, X.; Li, W.; Cui, J.; Long, C. Transcriptome analysis revealed the molecular mechanism of acetic acid increasing Monascus pigment production in Monascus ruber CICC41233. J. Fungi 2025, 11, 49. [Google Scholar] [CrossRef] [PubMed]
- Chen, G.; Tang, R.; Tian, X. F.; Qin, P.; Wu, Z. Q. Change of Monascus pigment metabolism and secretion in different extractive fermentation process. Bioproc. Biosyst. Eng. 2017, 40, 857–866. [Google Scholar] [CrossRef] [PubMed]
- Huang, T.; Wang, M. H.; Shi, K.; Chen, G.; Tian, X. F.; Wu, Z. Q. Metabolism and secretion of yellow pigment under high glucose stress with Monascus ruber. AMB Express 2017, 7, 1–11. [Google Scholar] [CrossRef]
- Samapundo, S.; Deschuyffeleer, N.; Van Laere, D.; De Leyn, I.; Devlieghere, F. Effect of NaCl reduction and replacement on the growth of fungi important to the spoilage of bread. Food Microbiol. 2010, 27, 749–756. [Google Scholar] [CrossRef]
- Vendruscolo, F.; Bühler, R. M. M.; de Carvalho, J. C.; de Oliveira, D.; Moritz, D. E.; Schmidell, W.; Ninow, J. L. Monascus: a reality on the production and application of microbial pigments. Appl. Biochem. Biotech. 2016, 178, 211–223. [Google Scholar] [CrossRef] [PubMed]
- Zhang, J.; Li, M.; Li, L.; Liu, Y.; Gu, T.; Wang, J.; Gao, M. Evaluation of differences in volatile flavor compounds between liquid-state and solid-state fermented Tartary buckwheat by Monascus purpureus. Food Chem. 2025, 464, 141662. [Google Scholar] [CrossRef]
- Long, C. N.; Liu, M. M.; Chen, X.; Wang, X. F.; Ai, M. Q.; Cui, J. J.; Zeng, B. The acyl-CoA binding protein affects Monascus pigment production in Monascus ruber CICC41233. 3 Biotech 2018, 8, 1–8. [Google Scholar] [CrossRef] [PubMed]
- Shi, K.; Song, D.; Chen, G.; Pistolozzi, M.; Wu, Z. Q.; Quan, L. Controlling composition and color characteristics of Monascus pigments by pH and nitrogen sources in submerged fermentation. J. Biosci. Bioeng. 2015, 120, 145–154. [Google Scholar] [CrossRef]
- Chen, G.; Yang, S. Z.; Wang, C. T.; Shi, K.; Zhao, X. H.; Wu, Z. Q. Investigation of the mycelial morphology of Monascus and the expression of pigment biosynthetic genes in high-salt-stress fermentation. Appl. Microbiol, Biot. 2020, 104, 2469–2479. [Google Scholar] [CrossRef]
- Zhen, Z. X.; Xiong, X. Q.; Liu, Y. B.; Zhang, J. L.; Wang, S. J.; Li, L.; Gao, M. X. NaCl inhibits citrinin and stimulates Monascus pigments and monacolin K production. Toxins 2019, 11, 118. [Google Scholar] [CrossRef]
- Rühl, J.; Hein, E.-M.; Hayen, H.; Schmid, A.; Blank, L.M. The Glycerophospholipid Inventory of Pseudomonas putida Is Conserved between Strains and Enables Growth Condition-Related Alterations. Microb. Biotechnol. 2012, 5, 45–58. [Google Scholar] [CrossRef]
- Li, Q.; Xia, Z.; Wu, Y.; Ma, Y.; Zhang, D.; Wang, S.; Fan, J.; Xu, P.; Li, X.; Bai, L.; Zhou, X.L.; Xue, M. Lysophospholipid Acyltransferase-Mediated Formation of Saturated Glycerophospholipids Maintained Cell Membrane Integrity for Hypoxic Adaptation. FEBS J. 2024, 291, 3191–3210. [Google Scholar] [CrossRef]
- Tzin, V.; Galili, G. New Insights into the Shikimate and Aromatic Amino Acids Biosynthesis Pathways in Plants. Mol. Plant 2010, 3, 956–972. [Google Scholar] [CrossRef]
- Yin, S.; Zhu, Y.; Zhang, B.; Huang, B.; Jia, R. Diverse Effects of Amino Acids on Monascus Pigments Biosynthesis in Monascus purpureus. Front. Microbiol. 2022, 15, 13–951266. [Google Scholar] [CrossRef]
- Fang, X.P.; Shen, J.S.; Zhang, L.Q.; Zou, X.H.; Jin, L. Metabolomic and transcriptomic integration reveals the mechanism of aroma formation as strawberries naturally turn colors while ripening. Food Chem. 2024, 460, 140765. [Google Scholar] [CrossRef]
- Huang, L.P.; Zhang, L.N.; Wang, M.; Zhu, Y.; Xun, Z.L.; Dai, X.; Zhao, Q.F. Integrated Transcriptomic and Metabolomic Insights into Flavor-Related Metabolism in Grape Berries Across Cultivars and Developmental Stages. Metabolites 2025, 15, 648. [Google Scholar] [CrossRef]
- Zhang, X.; Shao, F.H.; Cao, J.; He, Y.F.; Zhang, L.T.; Zhang, B.; Jun, S.J.; Febrisiantosa, A.; Feng, A.G.; Yang, J.; Zhu, L.L.; Li, C. Multi-omics integration deciphered microbial and metabolite dynamics during flavor development of rapidly fermented golden pompano. Food Biosci. 2025, 73, 107697. [Google Scholar] [CrossRef]
- Wang, Y.; Zhang, S.; Li, F.; Chen, H.; Liu, Y. Formation of Aroma Active Volatiles from Thermal Degradation of 18 Amino Acids with or without Sugars in Low-Moisture Systems and the Modulation by Sucrose and Epigallocatechin Gallate. Food Res. Int. 2025, 194, 114686. [Google Scholar]
- Hajjaj, H.; François, J. M.; Goma, G.; Blanc, P. J. Effect of amino acids on red pigments and citrinin production in Monascus ruber. J. Food Sci. 2012, 77, 156–159. [Google Scholar] [CrossRef] [PubMed]
- Balakrishnan, B.; Karki, S.; Chiu, S. H.; Kim, H. J.; Suh, J. W.; Nam, B.; Yoon, Y. M.; Chen, C. C.; Kwon, H. J. Genetic localization and in vivo characterization of a Monascus azaphilone pigment biosynthetic gene cluster. Appl. Microbiol. Biot. 2013, 97, 6337–6345. [Google Scholar] [CrossRef] [PubMed]
Figure 1.
Effect of NaCl on the morphology in M. ruber CICC41233 (T: Top; B:Bottom).
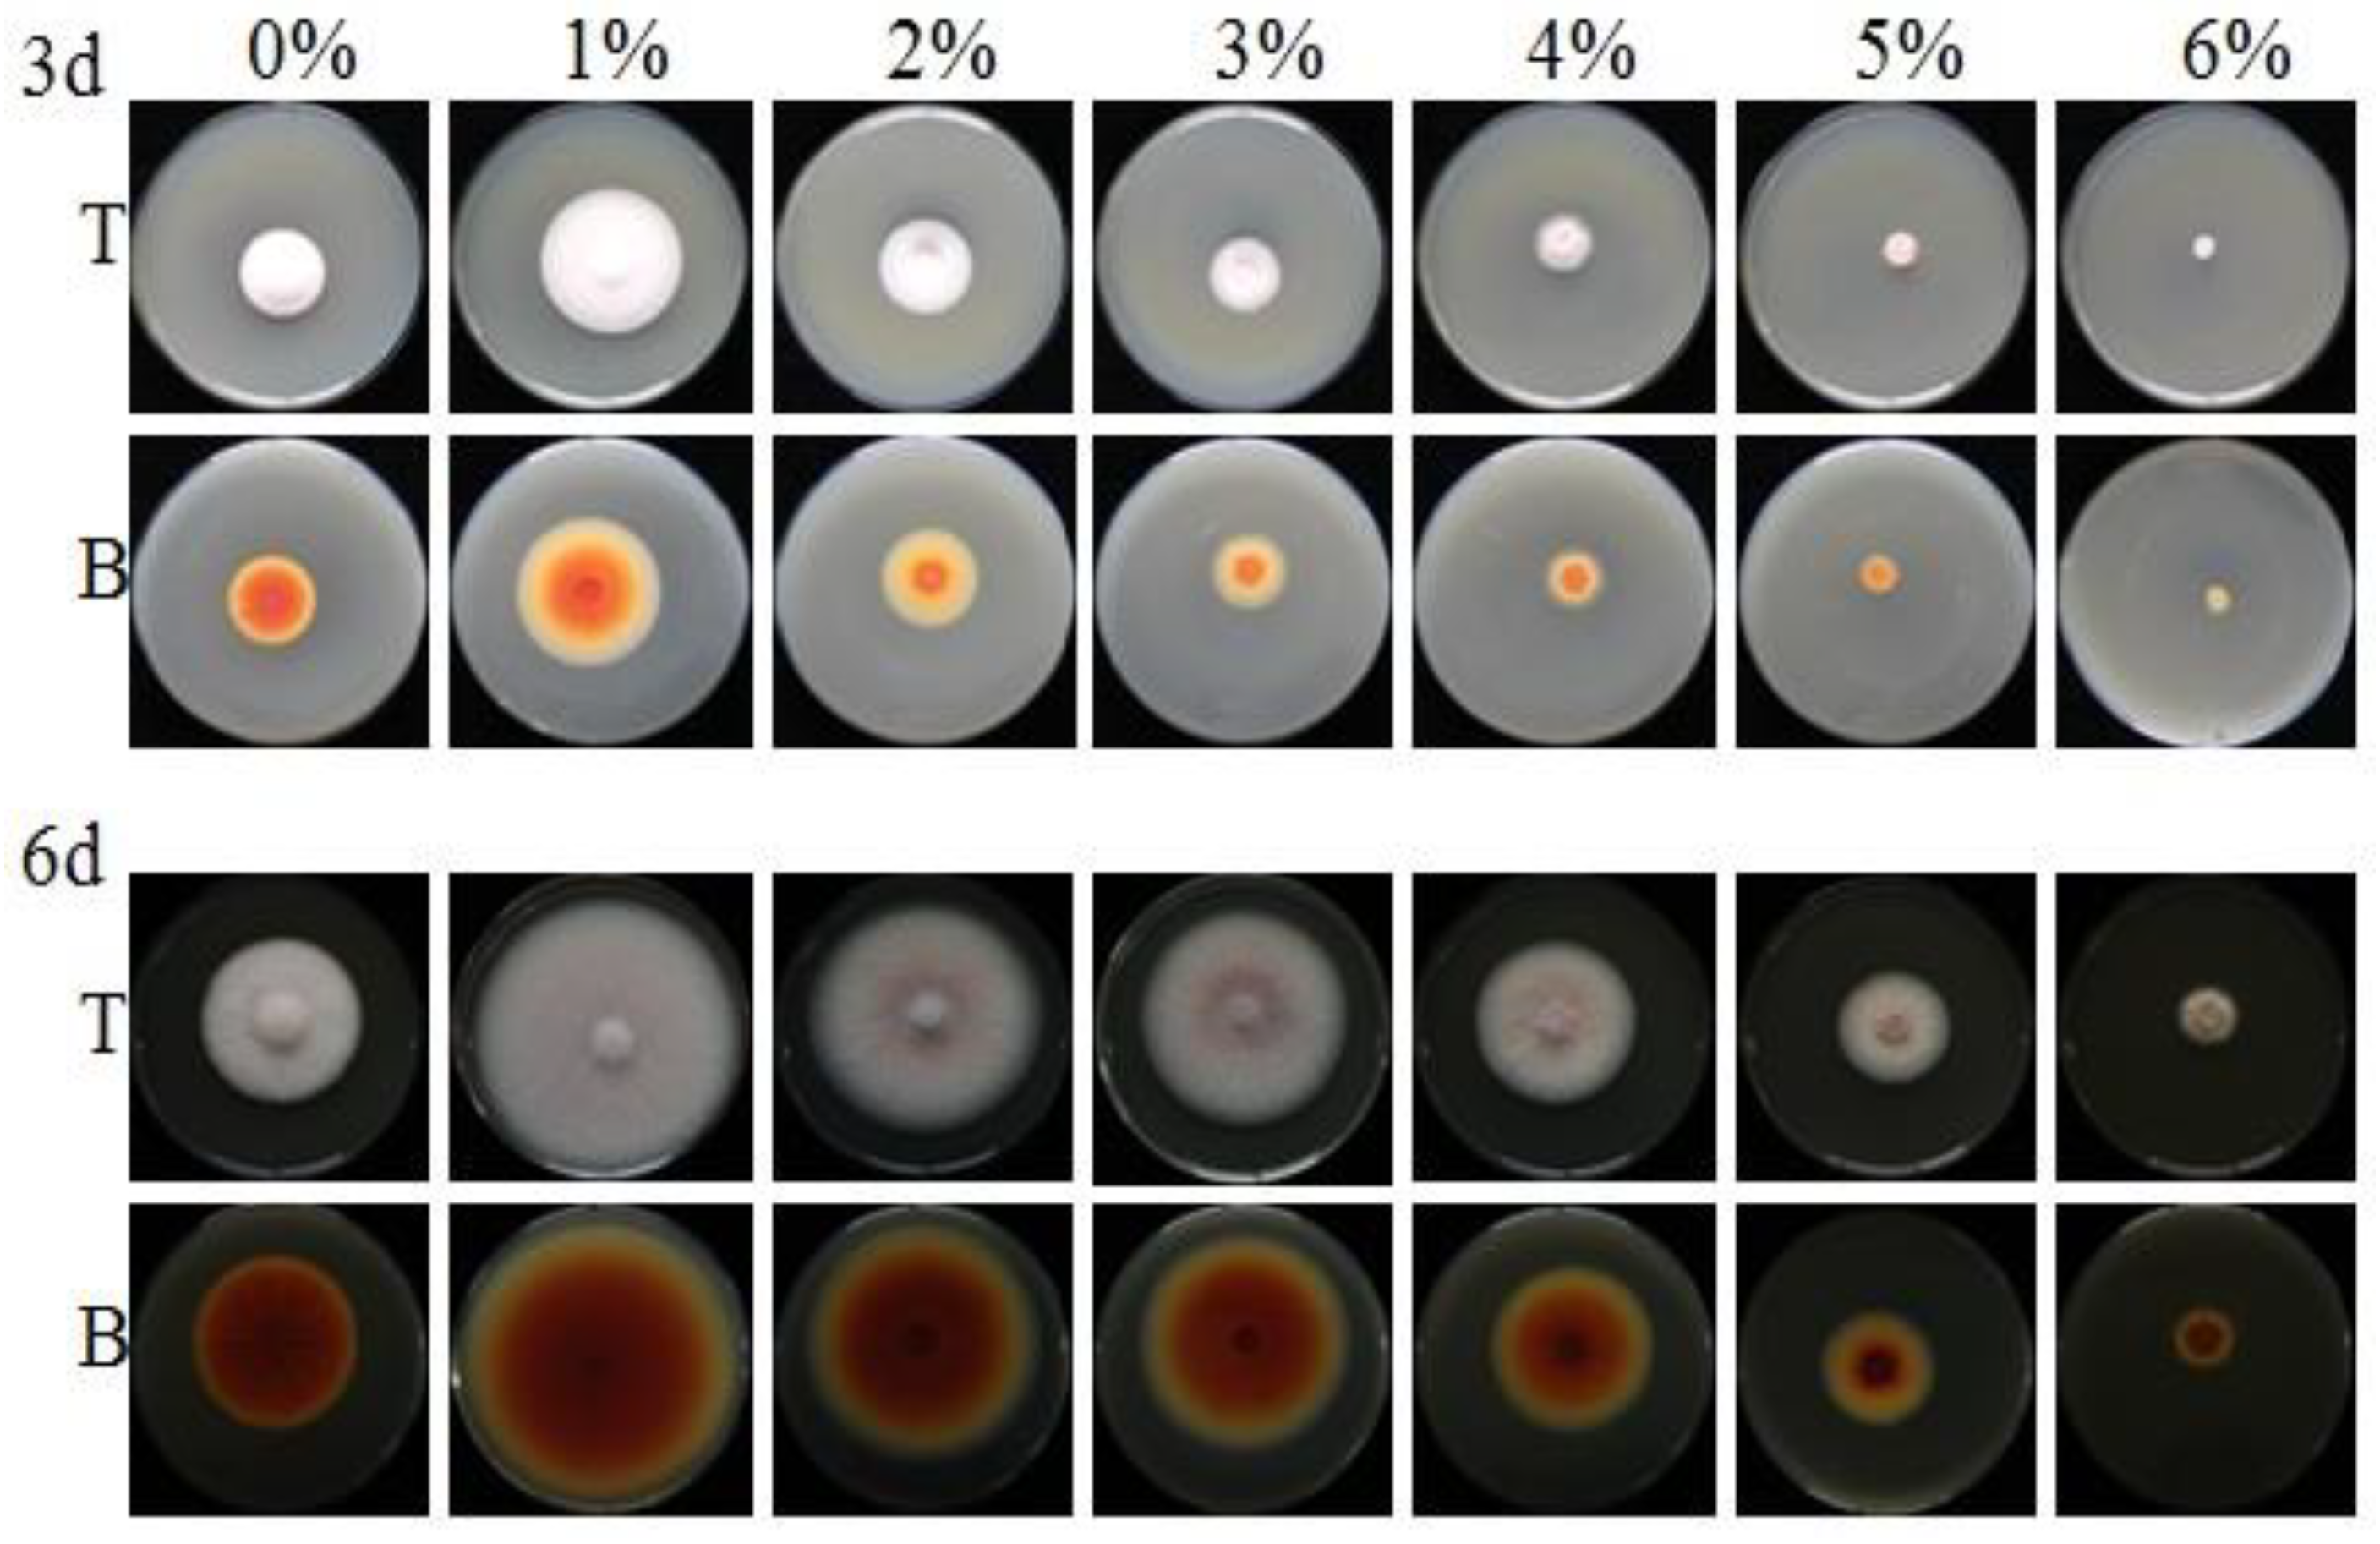
Figure 2.
Effect of NaCl on the growth in M. ruber CICC41233 (*p<0.05; ** p<0.01).
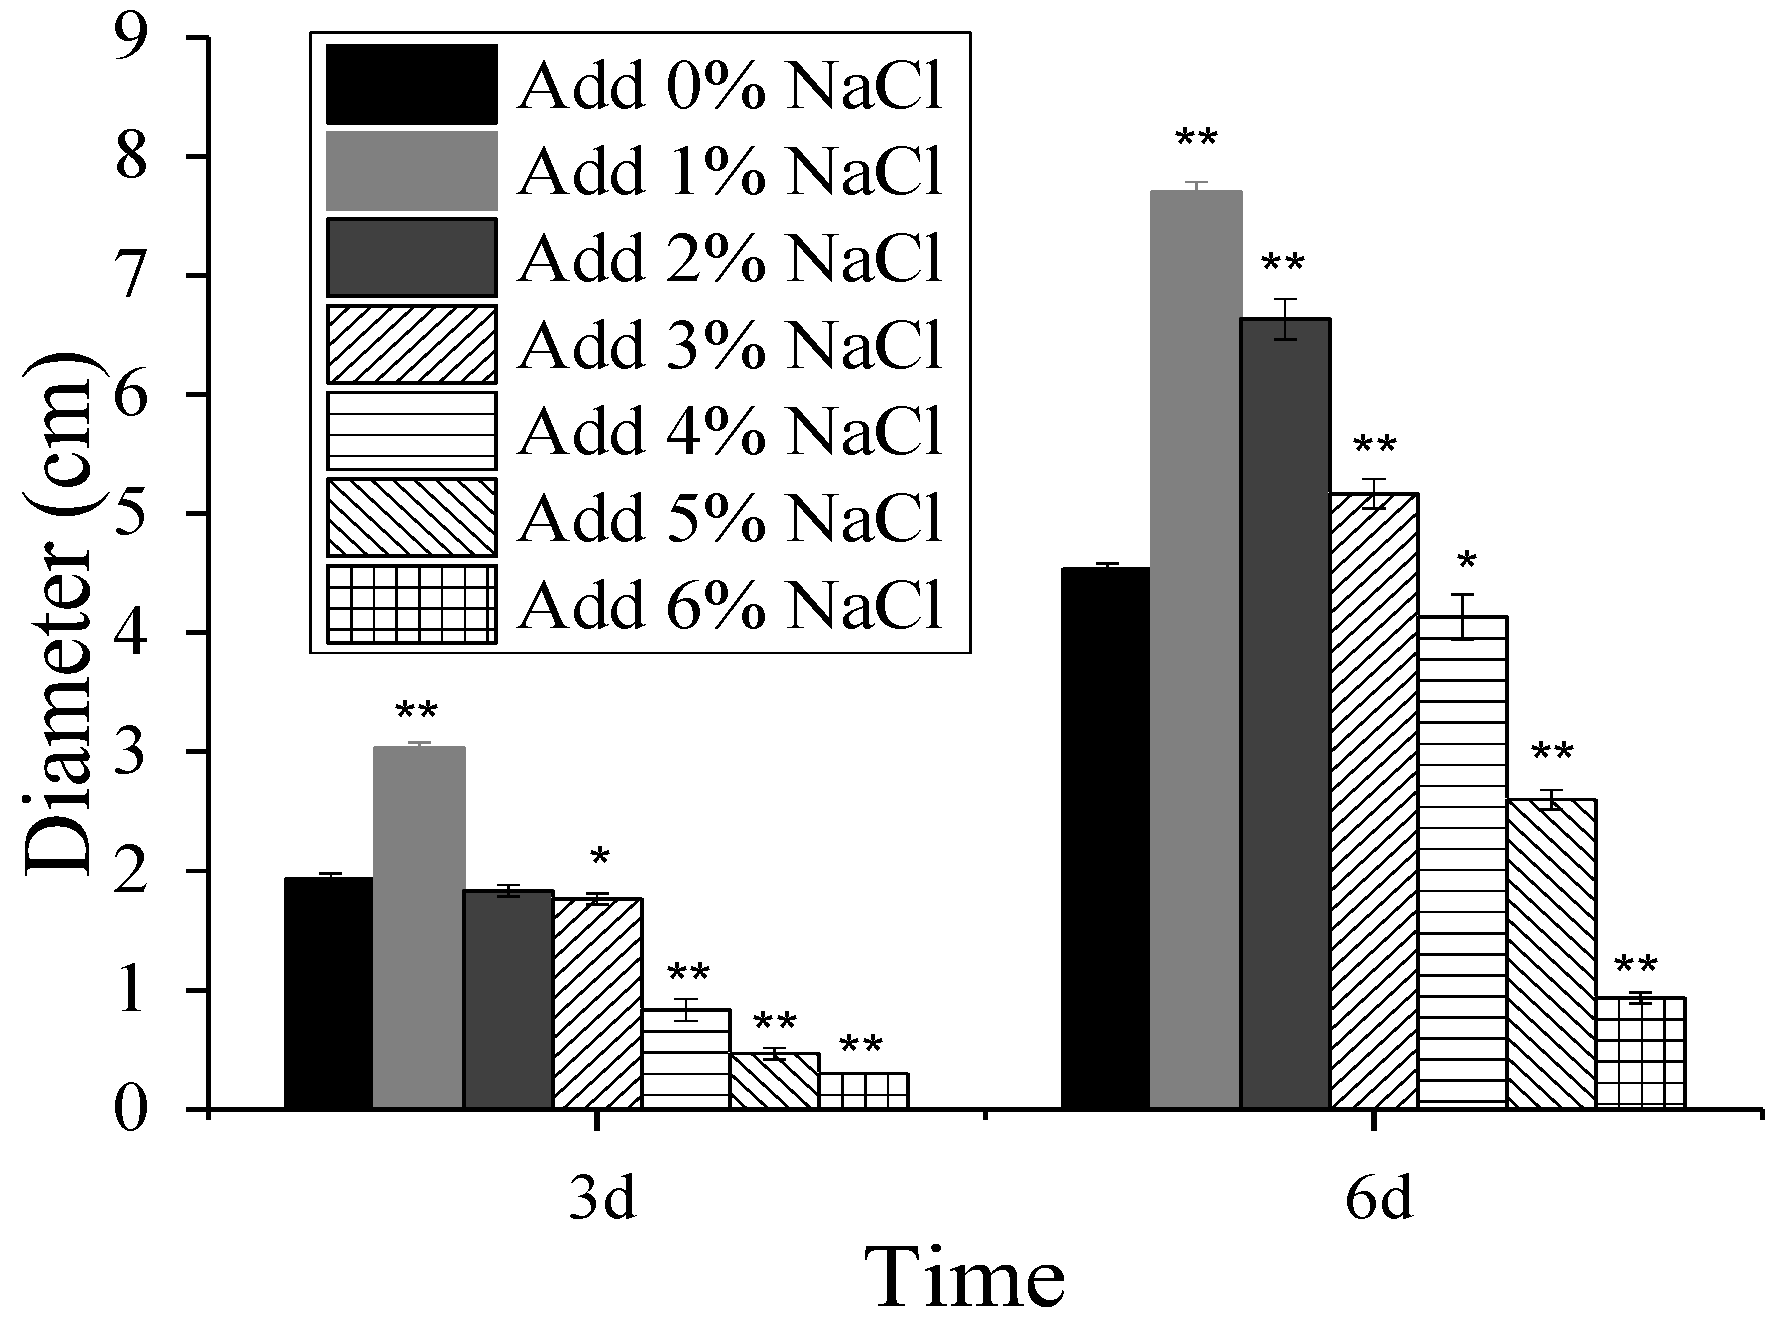
Figure 3.
Analysis of Monascus pigment production and biomass in M. ruber CICC41233. ((A) Monascus pigment; (B) biomass; (C) spectra of water-soluble pigments; (D) spectra of alcohol-soluble pigments. *p<0.05; ** p<0.01).
Figure 3.
Analysis of Monascus pigment production and biomass in M. ruber CICC41233. ((A) Monascus pigment; (B) biomass; (C) spectra of water-soluble pigments; (D) spectra of alcohol-soluble pigments. *p<0.05; ** p<0.01).
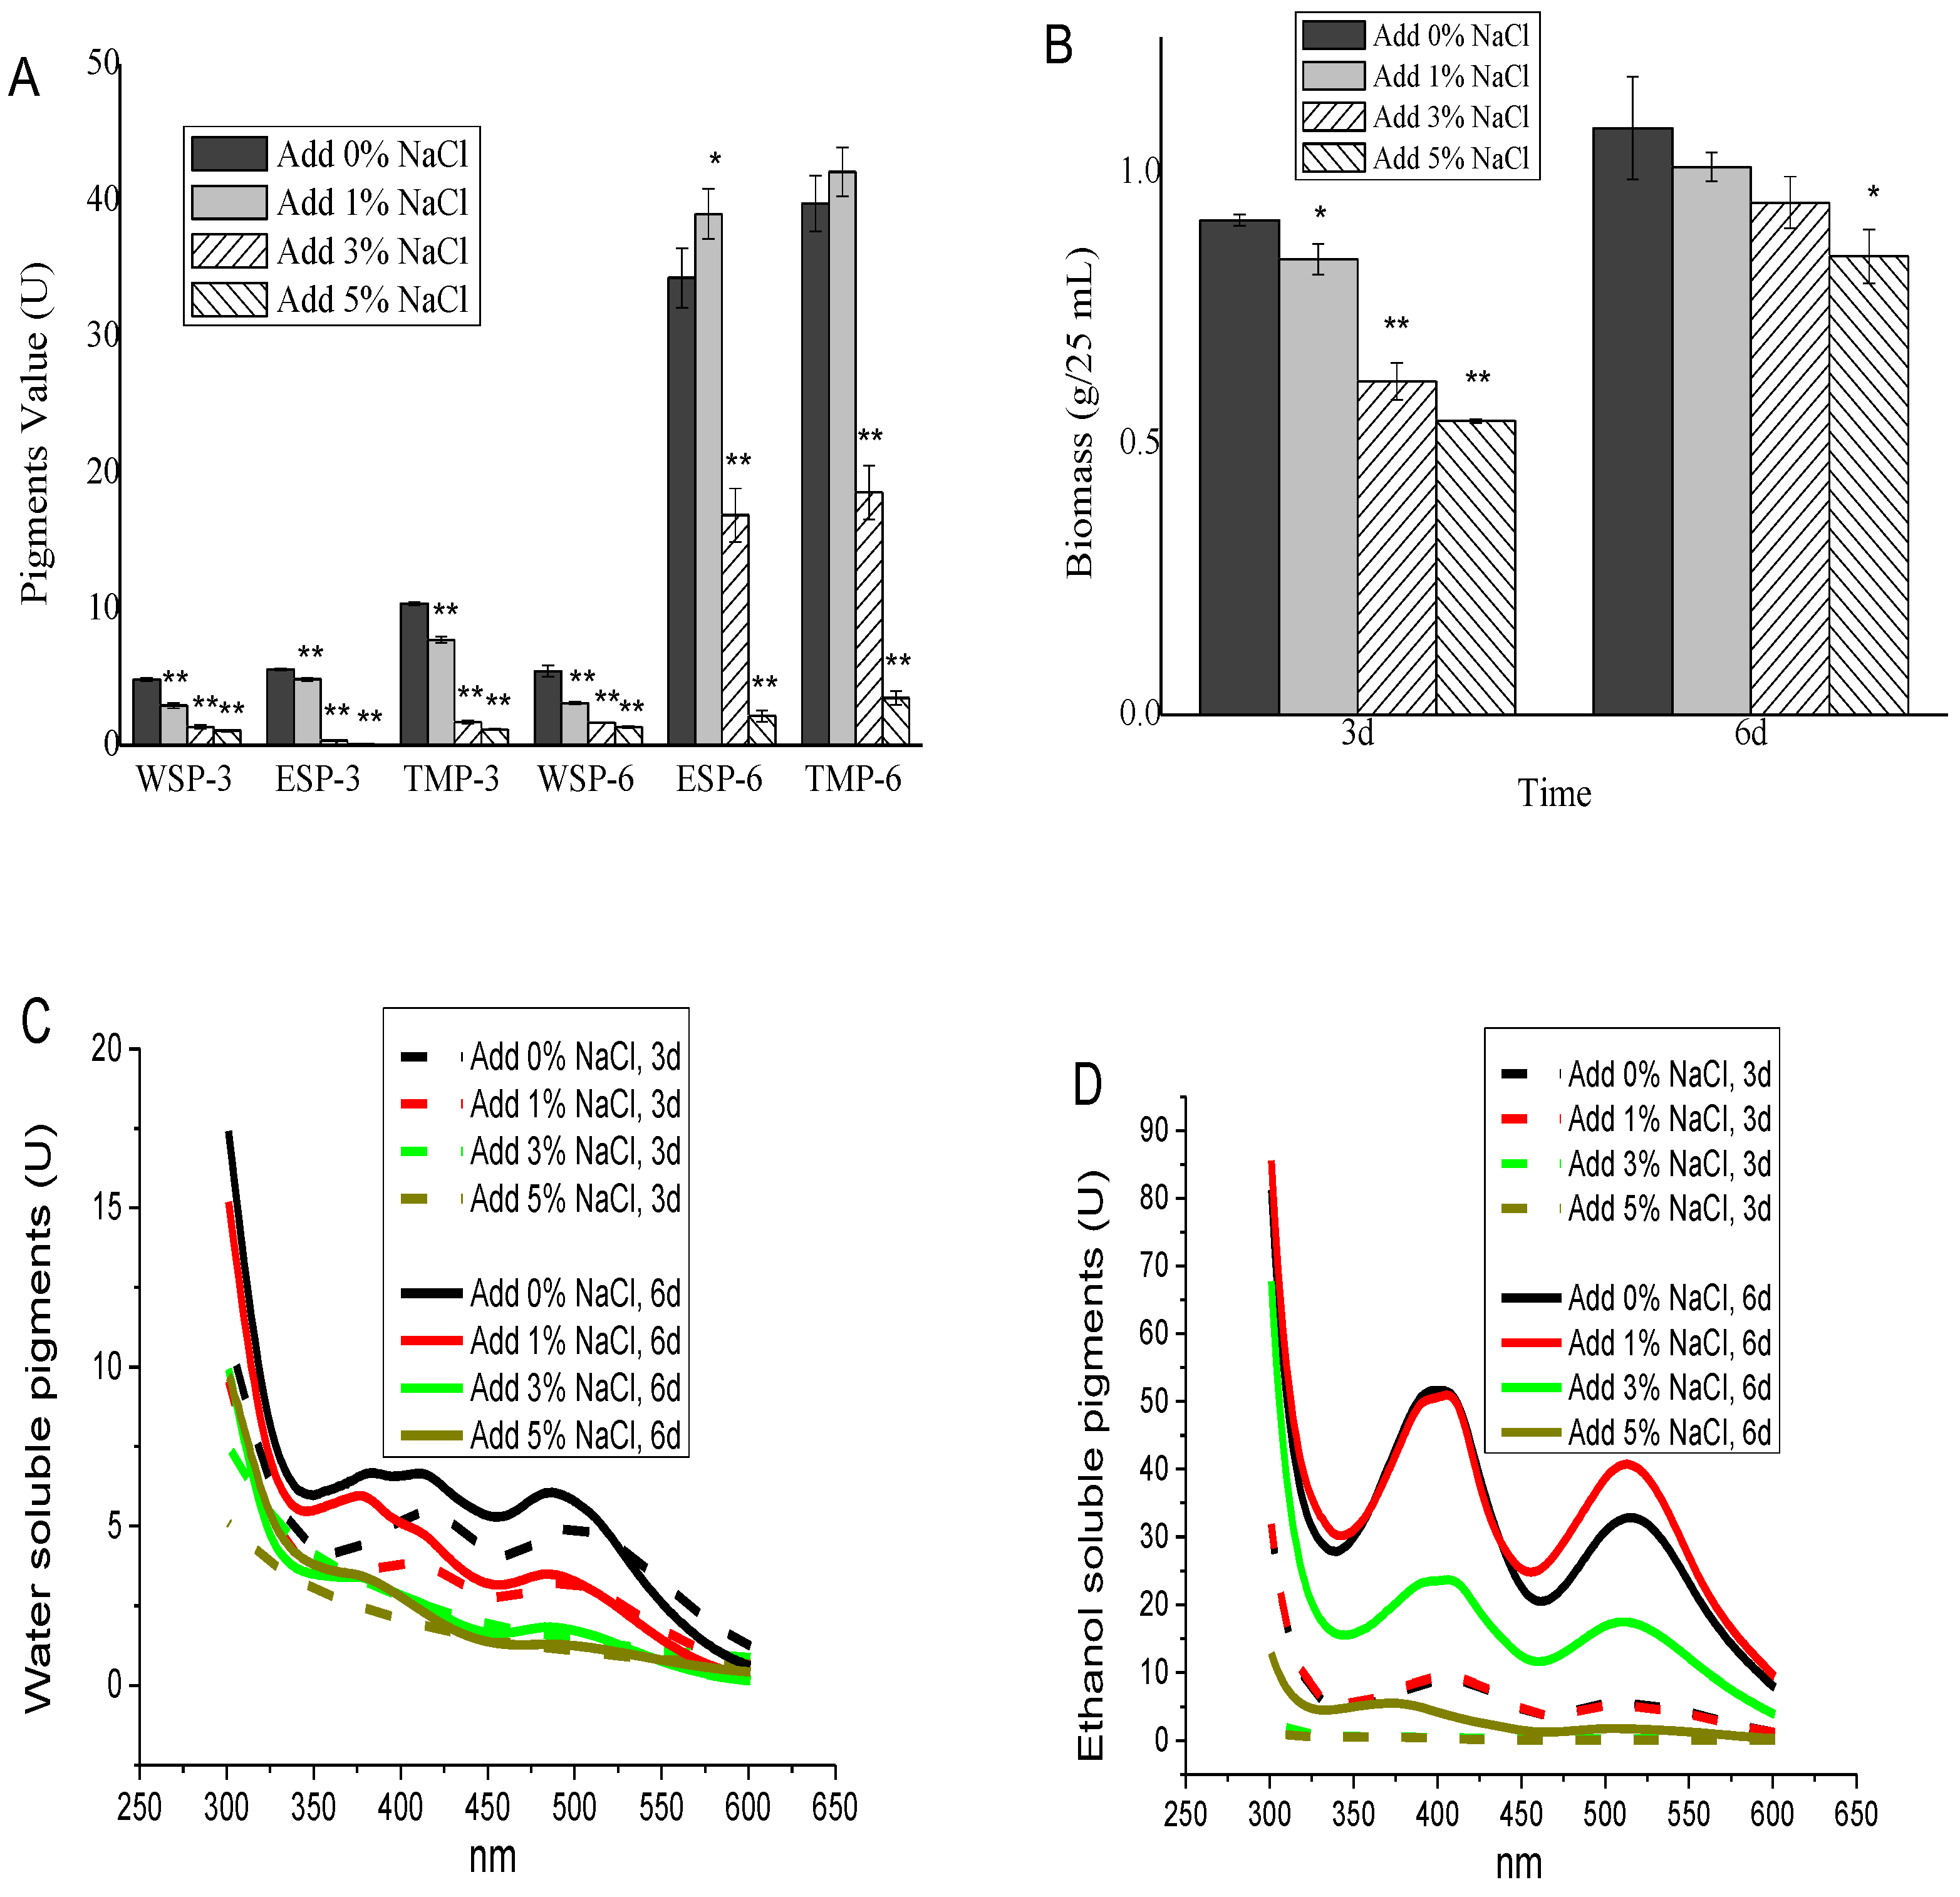
Figure 4.
Distance graph of the nearest neighbor algorithm for the sample (A: 3d sample, B:6d sample. The greater the distance, the lower the similarity).
Figure 4.
Distance graph of the nearest neighbor algorithm for the sample (A: 3d sample, B:6d sample. The greater the distance, the lower the similarity).
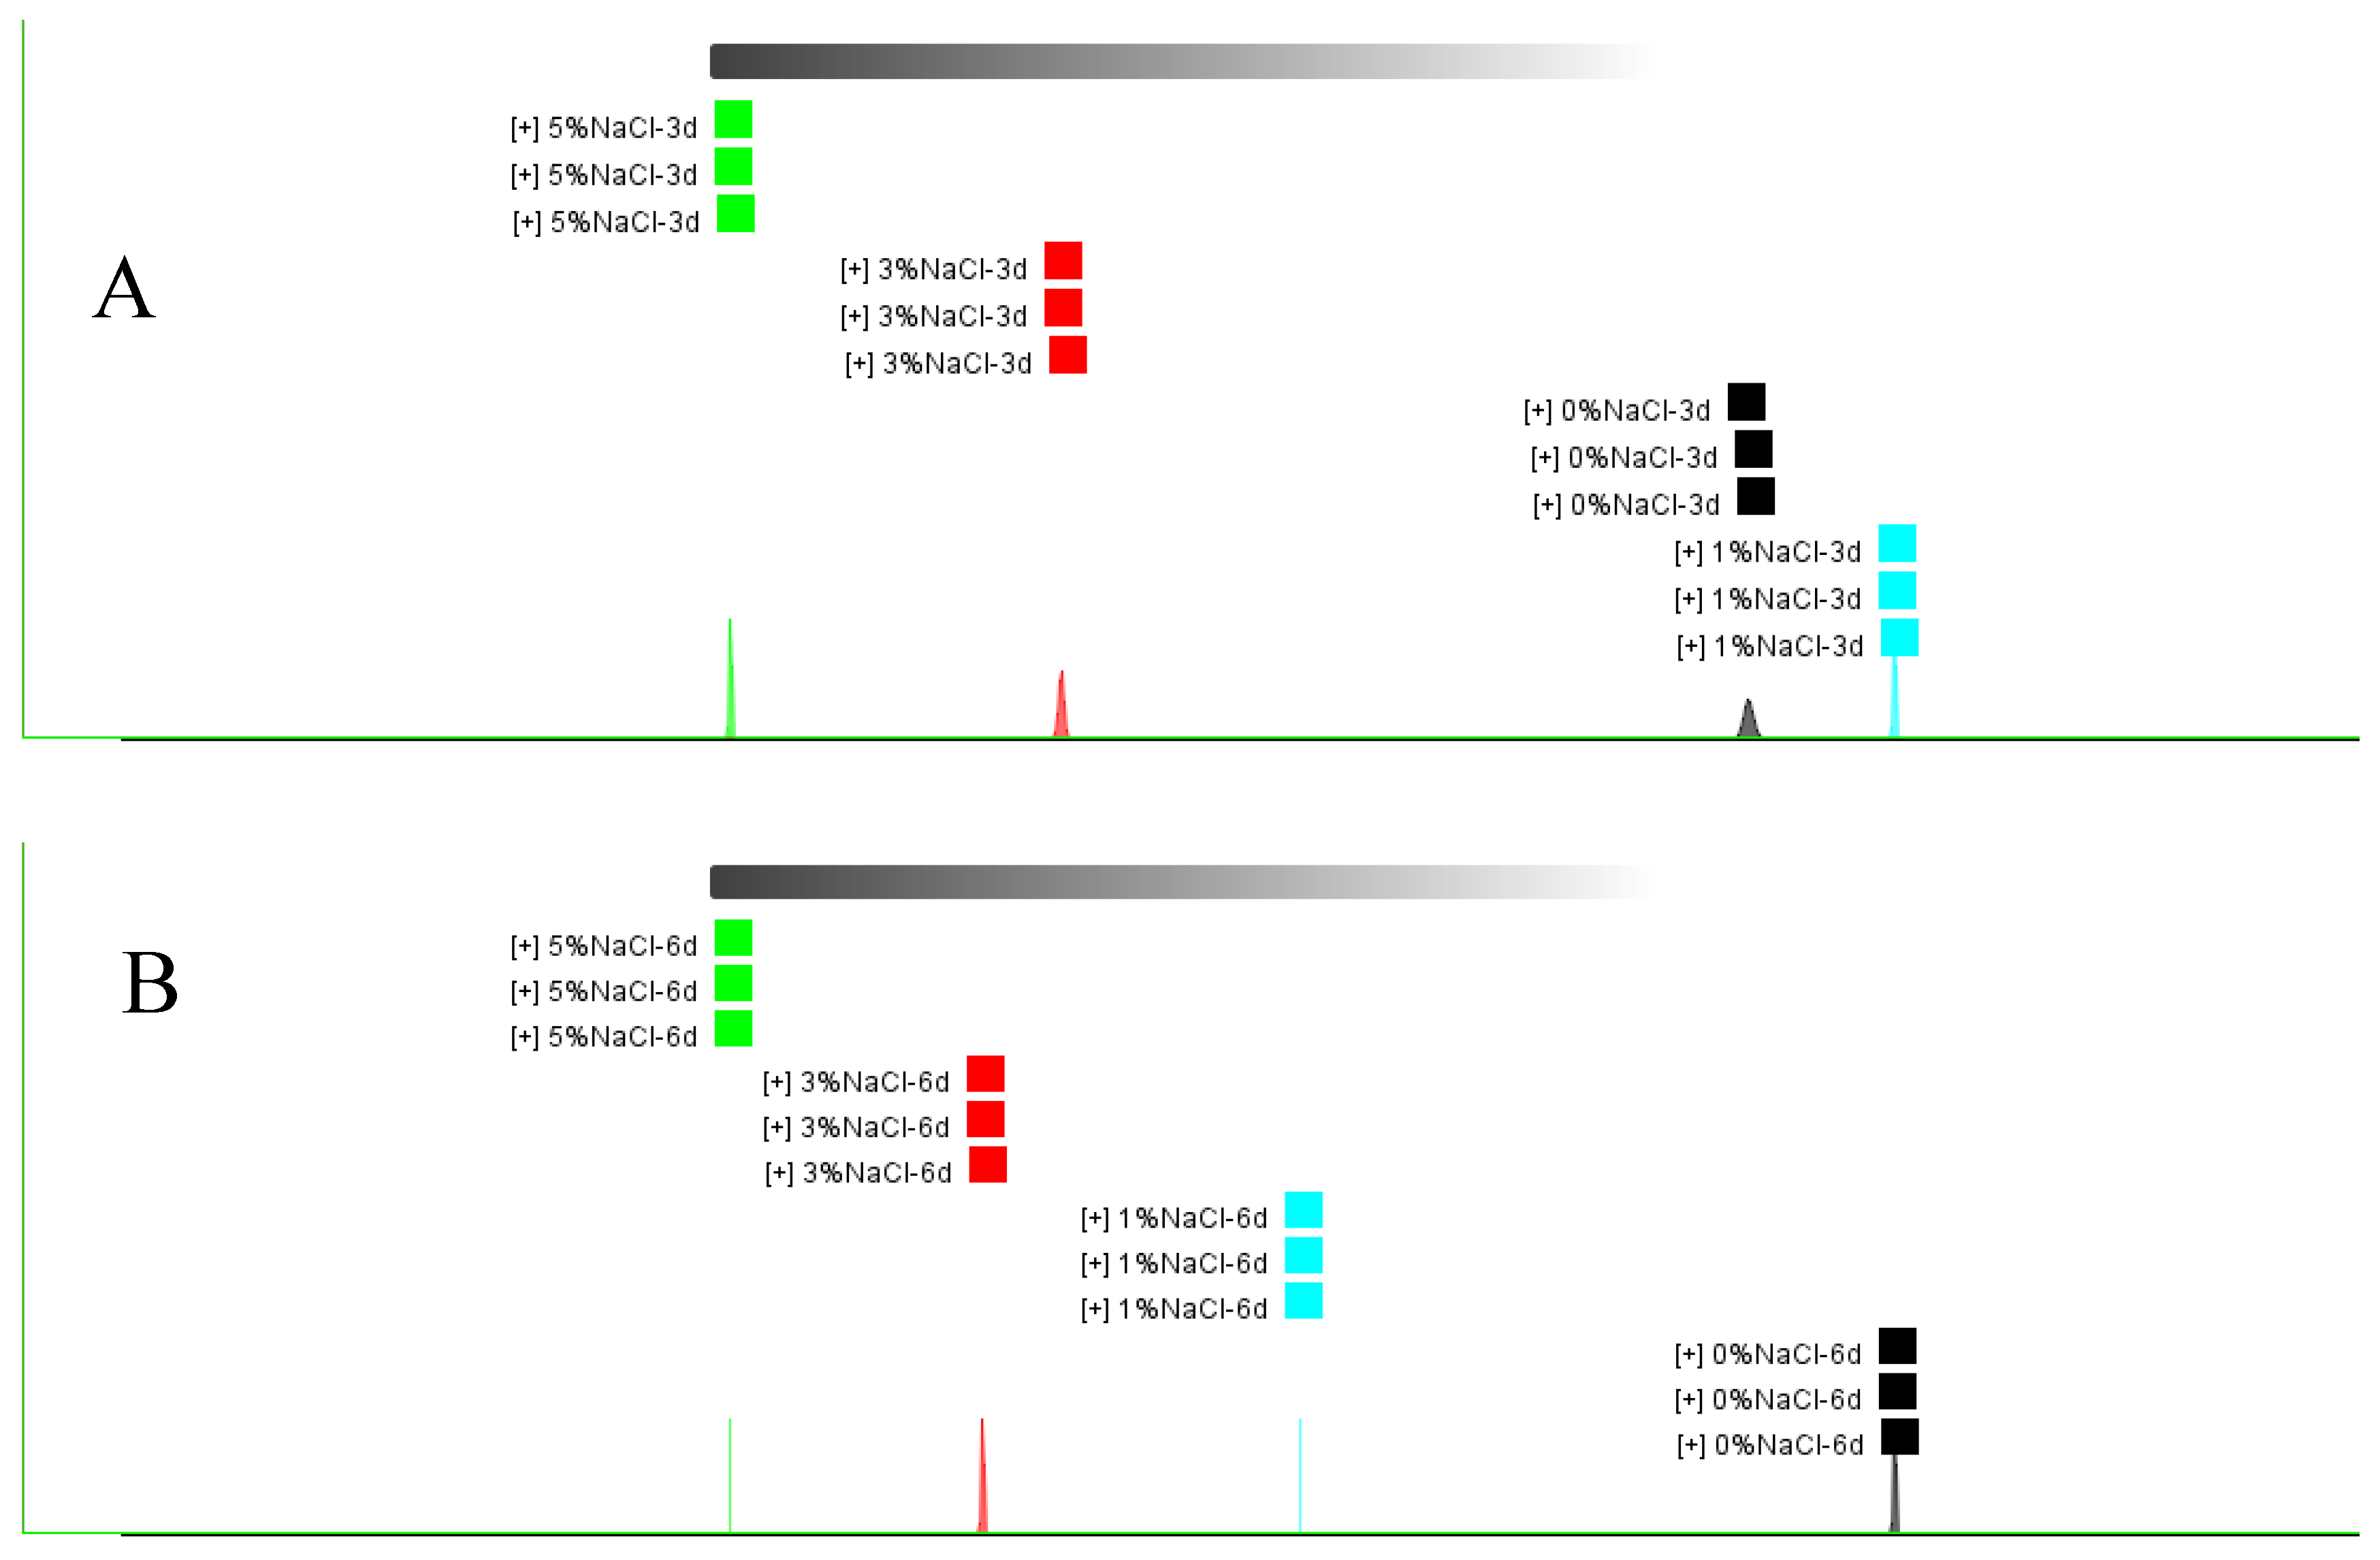
Figure 5.
Monasucs flavor fingerprint of volatile compounds in Monascus pigment fermentation sample (A: 3d sample, B:6d sample, compounds 1 to 12 were unidentified flavor substances).
Figure 5.
Monasucs flavor fingerprint of volatile compounds in Monascus pigment fermentation sample (A: 3d sample, B:6d sample, compounds 1 to 12 were unidentified flavor substances).
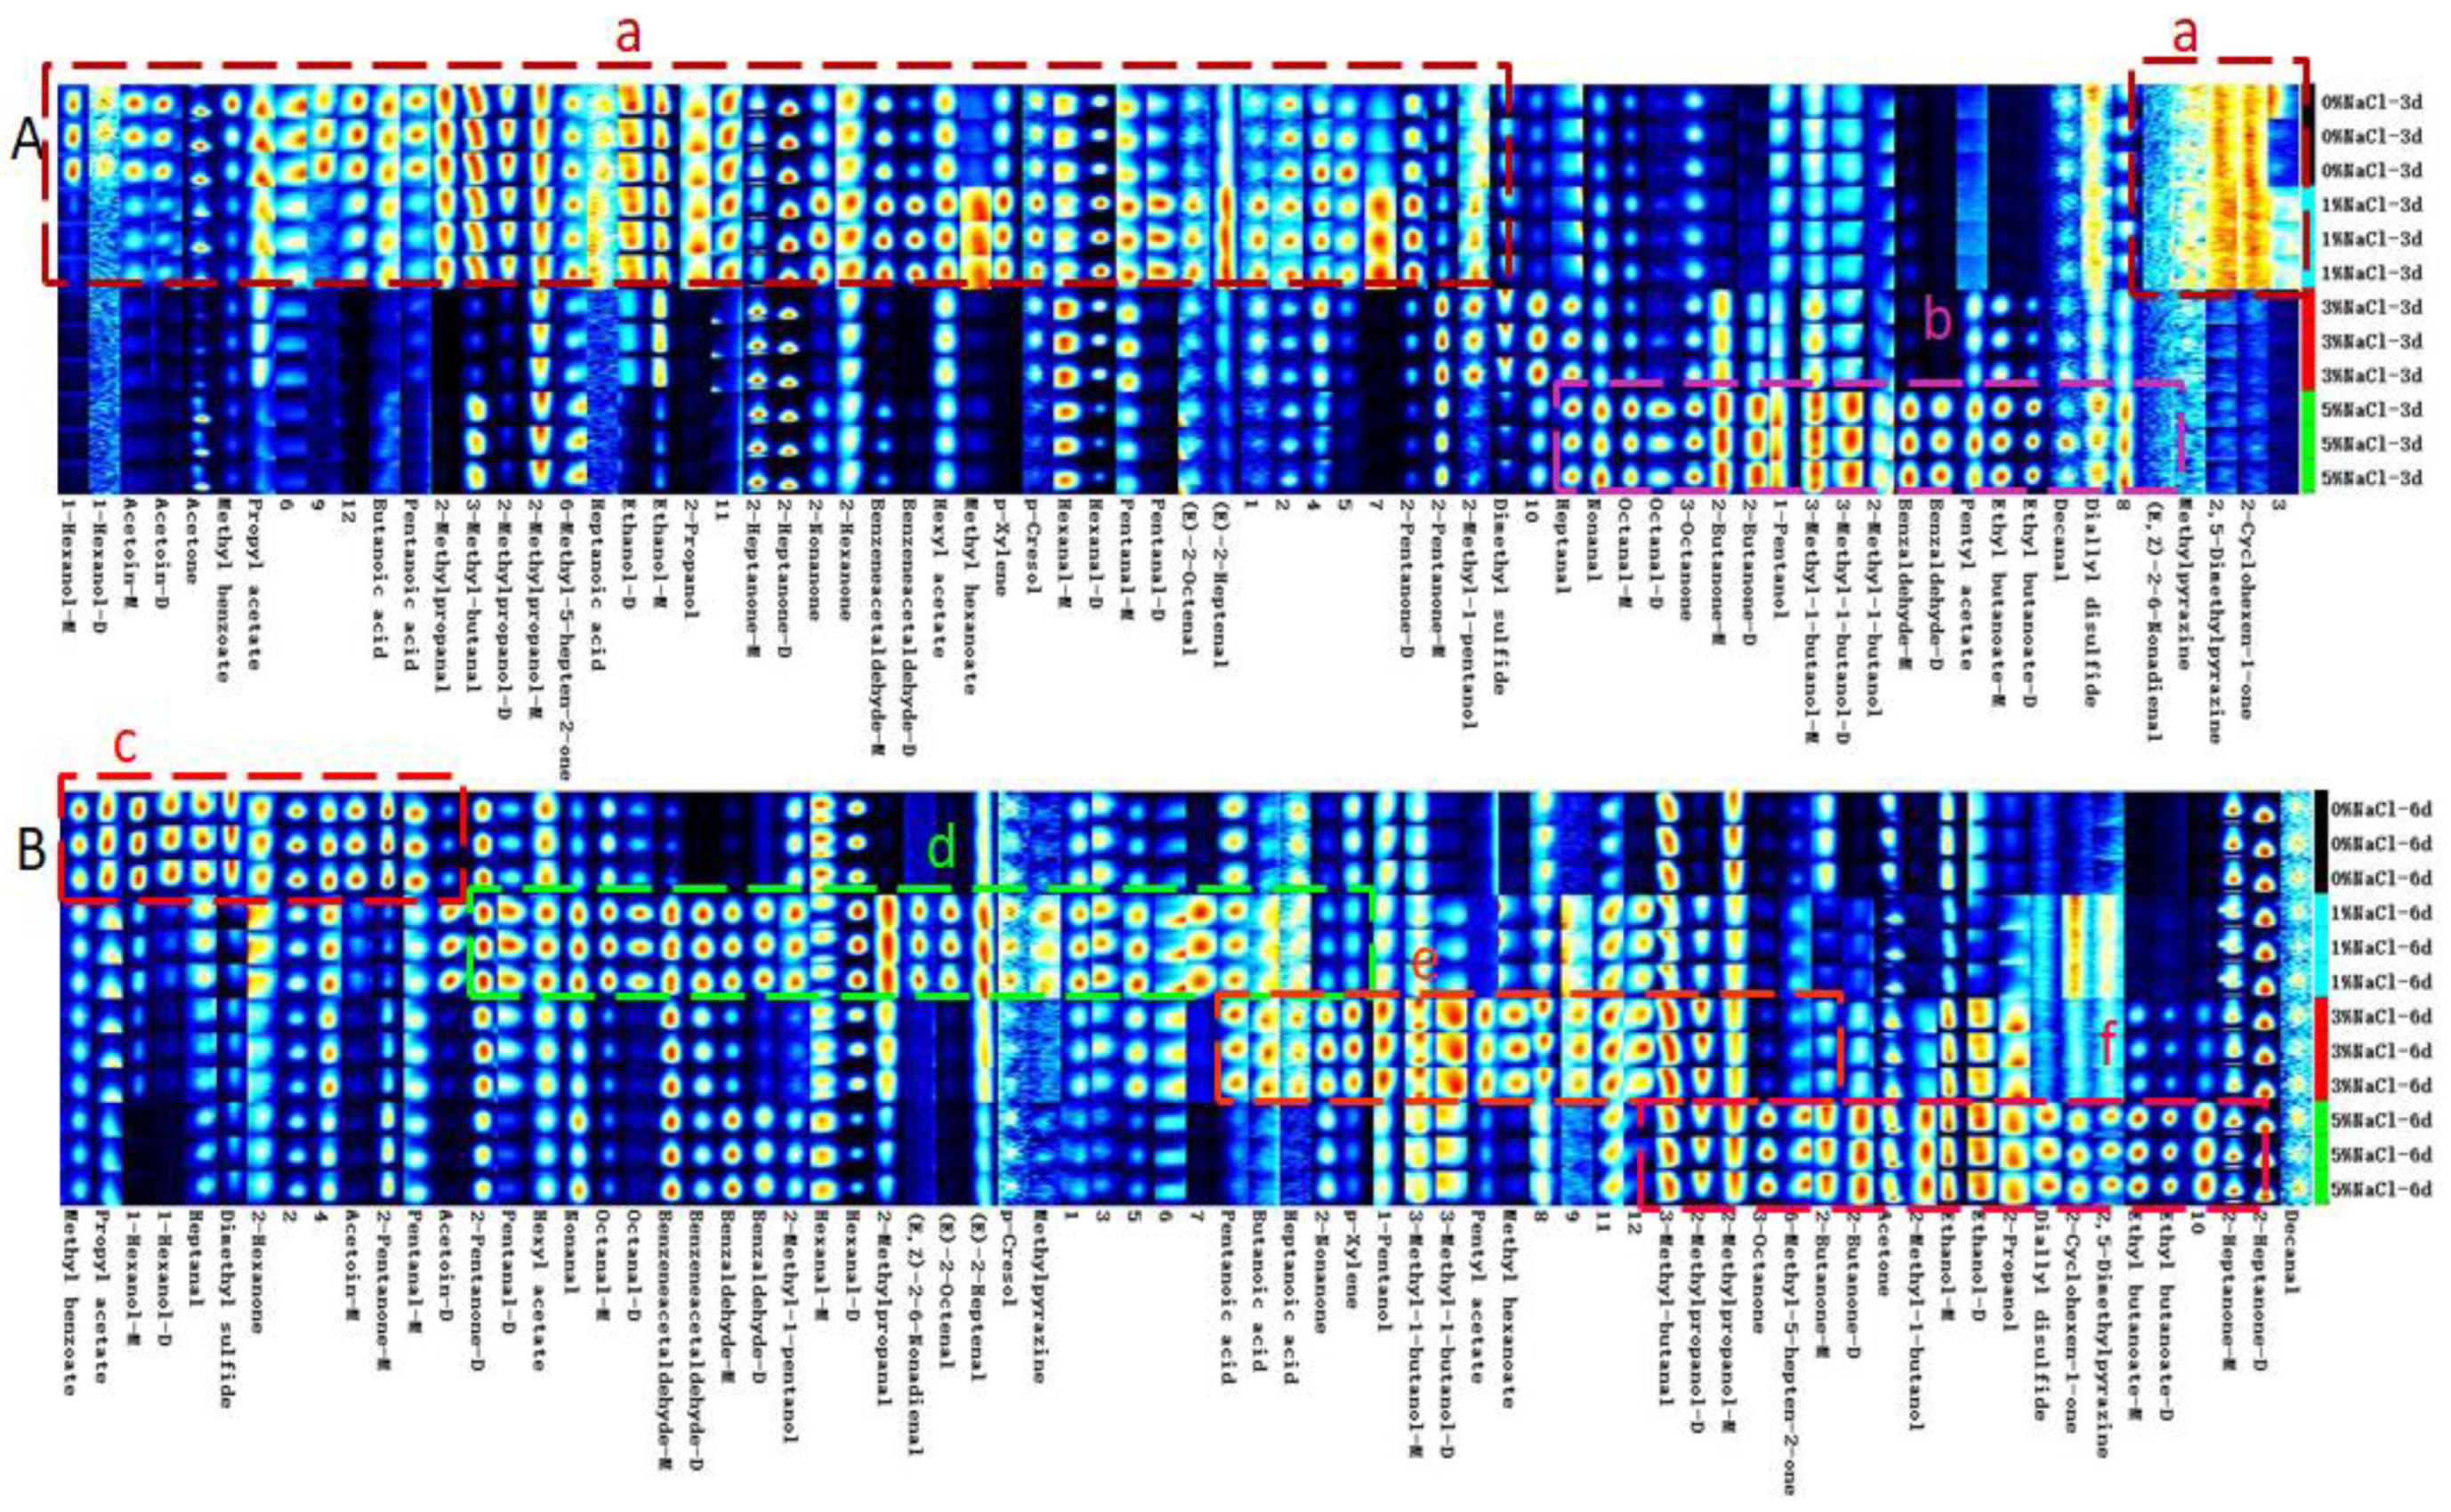
Figure 6.
Hierarchical clustering heat map of volatile compounds of 8 samples. (A: Alcohol compounds; B: Aldehyde compounds; C: Ketone compounds; D: Others compounds, like Ester, Acid, Pyrazine, and so on. Average peak volume or peak intensity of 3 replicate samples).
Figure 6.
Hierarchical clustering heat map of volatile compounds of 8 samples. (A: Alcohol compounds; B: Aldehyde compounds; C: Ketone compounds; D: Others compounds, like Ester, Acid, Pyrazine, and so on. Average peak volume or peak intensity of 3 replicate samples).
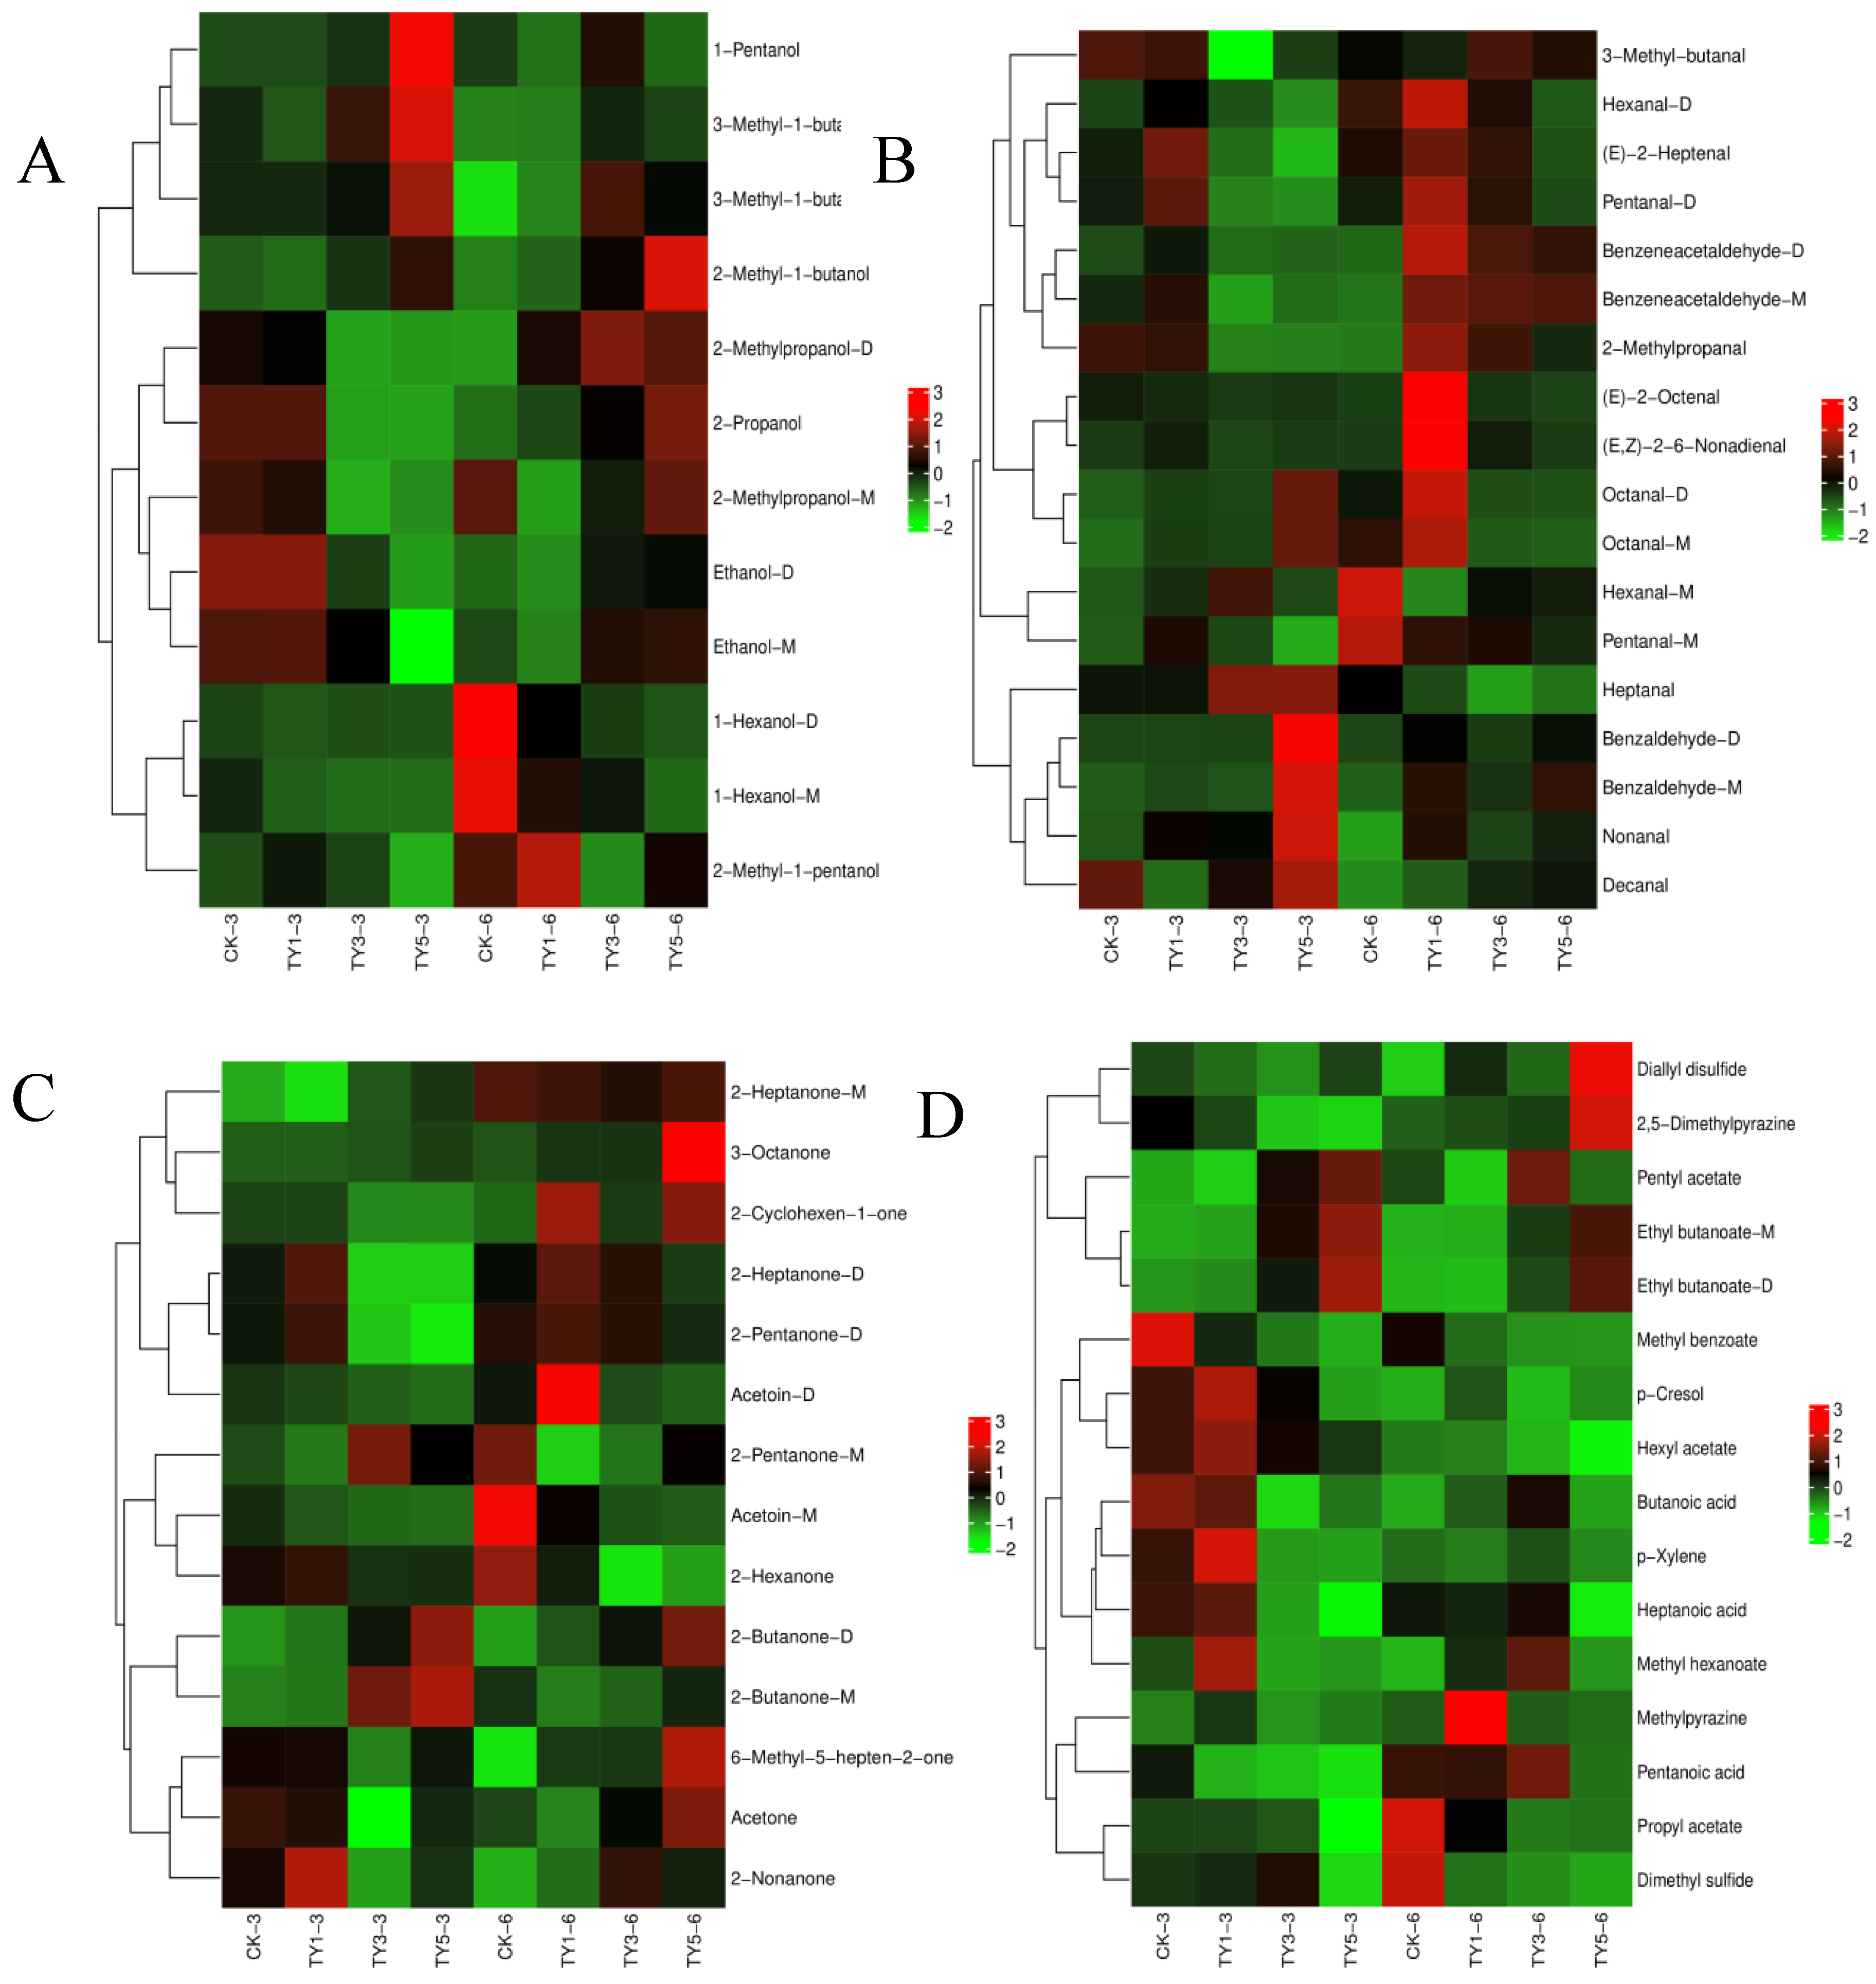

Table 1.
Proportion of volatile compounds identified in 8 samples.
| Sample* | Alcohol | Aldehyde | Ketone | Ester | Acid | Pyrazine | Others |
| CK-Y3 | 21.30% | 33.34% | 41.63% | 1.92% | 0.36% | 0.09% | 1.35% |
| TY1-3 | 18.78% | 33.73% | 43.64% | 1.90% | 0.29% | 0.08% | 1.59% |
| TY3-3 | 25.71% | 17.73% | 51.28% | 3.36% | 0.32% | 0.12% | 1.47% |
| TY5-3 | 15.96% | 29.80% | 50.07% | 2.93% | 0.26% | 0.10% | 0.87% |
| CK-Y6 | 16.59% | 26.63% | 52.87% | 2.15% | 0.38% | 0.10% | 1.28% |
| TY1-6 | 11.38% | 44.00% | 42.22% | 1.32% | 0.27% | 0.09% | 0.71% |
| TY3-6 | 18.64% | 36.44% | 42.10% | 1.66% | 0.33% | 0.08% | 0.74% |
| TY5-6 | 20.84% | 31.17% | 45.18% | 1.68% | 0.20% | 0.11% | 0.82% |
*CK-Y3: Add 0% NaCl, 3 d liquid fermentation sample; TY1-3: Add 1% NaCl, 3 d liquid fermentation sample ; TY5-3: Add 5% NaCl, 3 d liquid fermentation sample. CK-Y6: Add 0% NaCl, 6 d liquid fermentation sample; TY1-6: Add 1% NaCl, 6 d liquid fermentation sample ; TY5-6: Add 5% NaCl, 6 d liquid fermentation sample.
Table 2.
Gene counts of differentially expressed genes (DEGs).
| DEG Set* | DEG Number | Up-regulated | Down-regulated |
| CK-G3 vs TG1-3 | 199 | 99 | 100 |
| CK-G3 vs TG5-3 | 1351 | 336 | 1015 |
| CK-G6 vs TG1-6 | 356 | 172 | 184 |
| CK-G6 vs TG5-6 | 1319 | 315 | 1004 |
| CK-G3 vs CK-G6 | 623 | 523 | 100 |
| TG1-3 vs TG1-6 | 633 | 522 | 111 |
| TG5-3 vs TG5-6 | 696 | 581 | 115 |
| CK-Y3 vs TY1-3 | 1078 | 662 | 416 |
| CK-Y3 vs TY5-3 | 2873 | 1749 | 1124 |
| CK-Y6 vs TY1-6 | 3681 | 3264 | 417 |
| CK-Y6 vs TY5-6 | 3530 | 2426 | 1104 |
| CK-Y3 vs CK-Y6 | 2755 | 1510 | 1245 |
| TY1-3 vs TY1-6 | 4451 | 3340 | 1111 |
| TY5-3 vs TY5-6 | 2757 | 1784 | 973 |
* CK-G3: Add 0% NaCl, 3 d solid culture sample; TG1-3: Add 1% NaCl, 3 d solid culture sample ; TG5-3: Add 5% NaCl, 3 d solid culture sample. CK-G6: Add 0% NaCl, 6 d solid culture sample; TG1-6: Add 1% NaCl, 6 d solid culture sample ; TG5-6: Add 5% NaCl, 6 d solid culture sample.
Table 3.
KEGG pathway enrichment analysis of DEGs for solid culture sample.
| DEG Set | Pathway ID | KEGG Pathway | Number of Genes | p-value |
qvalue |
| CK-G3 vs TG1-3 | ko00785 | Lipoic acid metabolism | 1 | 0.020172 | 0.259847 |
| ko00564 | Glycerophospholipid metabolism | 2 | 0.046493 | 0.259847 | |
| CK-G3 vs TG5-3 | ko00380 | Tryptophan metabolism | 14 | 0.000009 |
0.000321 |
| ko00360 | Phenylalanine metabolism | 12 | 0.000011 | 0.000321 | |
| ko00620 | Pyruvate metabolism | 12 | 0.000088 | 0.001917 | |
| ko00350 | Tyrosine metabolism | 9 | 0.001026 | 0.017855 | |
| ko00500 | Starch and sucrose metabolism | 10 | 0.003144 | 0.045581 | |
| CK-G6 vs TG1-6 | ko00564 | Glycerophospholipid metabolism | 5 | 0.005180 | 0.126913 |
| ko00592 | alpha-Linolenic acid metabolism | 2 | 0.015765 | 0.229069 | |
| ko00052 | Galactose metabolism | 3 | 0.018699 | 0.229069 | |
| ko00591 | Linoleic acid metabolism | 1 | 0.043982 | 0.359187 | |
| CK-G6 vs TG5-6 | ko00360 | Phenylalanine metabolism | 10 | 0.000878 | 0.039661 |
| ko00520 | Amino sugar and nucleotide sugar metabolism | 12 | 0.001293 | 0.039661 | |
| ko00380 | Tryptophan metabolism | 11 | 0.002274 | 0.043861 | |
| ko00350 | Tyrosine metabolism | 9 | 0.002384 | 0.043861 | |
| CK-G3 vs CK-G6 | ko00520 | Amino sugar and nucleotide sugar metabolism | 8 | 0.000287 | 0.008184 |
| ko00500 | Starch and sucrose metabolism | 7 | 0.001016 | 0.019304 | |
| ko01212 | Fatty acid metabolism | 5 | 0.004113 | 0.046890 | |
| TG1-3 vs TG1-6 | ko00590 | Arachidonic acid metabolism | 3 | 0.000233 | 0.005547 |
| ko00592 | alpha-Linolenic acid metabolism | 4 | 0.000248 | 0.005547 | |
| ko00591 | Linoleic acid metabolism | 2 | 0.001552 | 0.023848 | |
| ko00561 | Glycerolipid metabolism | 6 | 0.001780 | 0.023848 | |
| ko00430 | Taurine and hypotaurine metabolism | 3 | 0.002910 | 0.031995 | |
| ko00500 | Starch and sucrose metabolism | 7 | 0.003343 | 0.031995 | |
| TG5-3 vs TG5-6 | ko00130 | Ubiquinone and other terpenoid-quinone biosynthesis | 5 | 0.000428 | 0.014330 |
Table 4.
KEGG pathway enrichment analysis of DEGs for liquid fermentation sample.
| DEG Set | Pathway ID | KEGG Pathway | Number of Genes | p-value |
qvalue |
| CK-Y3 vs TY1-3 | ko01210 | 2-Oxocarboxylic acid metabolism | 11 | 0.000604 | 0.018919 |
| ko00010 | Glycolysis / Gluconeogenesis | 13 | 0.000772 | 0.018919 | |
| ko01230 | Biosynthesis of amino acids | 22 | 0.001241 | 0.024325 | |
| ko00300 | Lysine biosynthesis | 5 | 0.003003 | 0.049051 | |
| CK-Y3 vs TY5-3 | ko00190 | Oxidative phosphorylation | 40 | 0.000000 | 0.000010 |
| ko00280 | Valine, leucine and isoleucine degradation | 25 | 0.000146 | 0.003450 | |
| ko00310 | Lysine degradation | 21 | 0.000154 | 0.003450 | |
| ko00071 | Fatty acid degradation | 20 | 0.000175 | 0.003450 | |
| ko00380 | Tryptophan metabolism | 26 | 0.001690 | 0.024933 | |
| CK-Y6 vs TY1-6 | ko00360 | Phenylalanine metabolism | 28 | 0.000006 | 0.000459 |
| ko00380 | Tryptophan metabolism | 34 | 0.000008 | 0.000459 | |
| ko00330 | Arginine and proline metabolism | 34 | 0.000857 | 0.022708 | |
| CK-Y6 vs TY5-6 | ko00270 | Cysteine and methionine metabolism | 31 | 0.000851 |
0.021275 |
| ko00260 | Glycine, serine and threonine metabolism | 36 | 0.002722 |
0.049153 | |
| ko00620 | Pyruvate metabolism | 28 | 0.003539 | 0.049153 |
|
| CK-Y3 vs CK-Y6 | ko01212 | Fatty acid metabolism | 20 | 0.000155 | 0.004560 |
| ko00010 | Glycolysis / Gluconeogenesis | 28 | 0.000756 | 0.014868 | |
| ko00380 | Tryptophan metabolism | 25 | 0.001093 | 0.018430 | |
| ko00310 | Lysine degradation | 18 | 0.001823 | 0.026888 | |
| ko00071 | Fatty acid degradation | 17 | 0.002322 | 0.030442 | |
| ko00520 | Amino sugar and nucleotide sugar metabolism | 25 | 0.004086 | 0.040182 | |
| TY1-Y3 vs TY1-6 | ko01212 | Fatty acid metabolism |
27 | 0.000087 | 0.003112 |
| ko00010 | Glycolysis / Gluconeogenesis | 41 | 0.000154 | 0.003843 | |
| ko00260 | Glycine, serine and threonine metabolism | 42 | 0.000934 | 0.013805 | |
| ko00350 | Tyrosine metabolism | 27 | 0.000982 | 0.013805 | |
| ko00071 | Fatty acid degradation | 24 | 0.000994 | 0.013805 | |
| ko00280 | Valine, leucine and isoleucine degradation | 30 | 0.001707 | 0.021336 | |
| ko00360 | Phenylalanine metabolism | 27 | 0.003465 | 0.039377 | |
| TY5-Y3 vs TY5-6 | ko03008 | Ribosome biogenesis in eukaryotes | 41 | 0.000000 | 0.000000 |
| ko03020 | RNA polymerase | 17 | 0.000011 | 0.000654 |
Table 5.
FPKM value of Monascus pigment biosynthetic gene cluster in M. ruber CICC41233.
| NO. | M. ruber PKS cluster | CK-Y3 | TY1-3 | TY5-3 | CK-Y6 | TY1-6 | TY5-6 |
| 1 | Contig6.564 | 3.59 | 4.29 | 3.67 | 4.16 | 15.92 | 4.33 |
| 2 | Contig6.565 | 18.95 |
18.04 |
89.2 |
88.74 |
241.36 |
34.06 |
| 3 | Contig6.566 | 388.7 |
555.47 |
234.37 |
0.76 |
↑2.88 |
↑149.04 |
| 4 | Contig1.632 | 5.4 |
6.17 |
5.9 |
5.81 |
10.96 |
7.92 |
| 5 | Contig6.567 | 698.17 |
1160.71 |
↓202.36 |
1.64 |
3.46 |
↑208.39 |
| 6 | Contig3.926 | 2.34 |
↓1.06 |
↑17.03 |
3.3 |
6.35 |
↓1.55 |
| 7 | Contig9.114 | 84.13 |
↓33.53 |
64.54 |
30.13 |
56.12 |
31.84 |
| 8 | Contig6.568 | 7870.3 |
↑16165. 92 |
3023.02 |
10.64 |
12.76 |
↑4851. 14 |
| 9 | Contig6.569 | 493.42 |
838.2 |
700.63 |
30.01 |
40.42 |
↑340.48 |
| 10 | Contig8.37 | 0.24 |
↑0.71 |
↑0.48 |
0.58 |
↑2.21 |
↑1.67 |
| 11 | Contig6.571 | 2587.31 |
1896.89 |
↓176.57 |
1005.73 |
1101.42 |
↓334.17 |
| 12 | Contig6.572 | 3028.21 |
2036.55 |
↓359.36 |
1632.78 |
2079.7 |
↓623.97 |
| 13 | Contig9.526 | 59.75 |
45.12 |
90.99 |
222.59 |
238.44 |
145.63 |
| 14 | Contig6.573 | 182.56 |
283.66 |
142.07 |
2.04 |
3.32 |
↑90.62 |
| 15 | Contig5.231 | 10.96 |
9.99 |
9.43 |
16.58 |
29.98 |
15.8 |
| 16 | Contig6.574 | 2.95 |
5.77 |
2.68 |
0.8 |
3.52 |
1.97 |
| 17 | Contig1.420 | 37.69 |
55.92 |
154.97 |
27.63 |
31.07 |
70.48 |
| 18 | Contig6.575 | 3.31 |
2.72 |
3.04 |
2.68 |
5.92 |
3.19 |
| 19 | Contig6.576 | 1.03 |
0.34 |
1.03 |
0.89 |
1.36 |
0.88 |
| 20 | Contig2.99 | 2.4 |
2.17 |
1.84 |
2.32 |
5.67 |
2.66 |
| 21 | Contig6.578 | 11.92 |
7.85 |
10.68 |
5.62 |
10.93 |
3.04 |
| 22 | Contig6.579 | 585.88 |
507.92 |
↓219.4 |
0.67 |
↑1.58 |
↑165.35 |
| 23 | Contig6.580 | 2455.46 |
↑4927.89 |
↓718.85 |
2.02 |
↑4.69 |
↑814.05 |
| 24 | Contig6.581 | 863.66 |
1561.22 |
885.15 |
5.57 |
8.95 |
↑579.8 |
| 25 | Contig6.582 | 1142.83 |
1053.13 |
↓245.26 |
241.3 |
348.49 |
298.28 |
* evm.TU.Contig6.566, omitting "evm.TU.", Contig6.566, the same applies hereafter. ↑Up-regulated, ↓Down-regulated.
Disclaimer/Publisher’s Note: The statements, opinions and data contained in all publications are solely those of the individual author(s) and contributor(s) and not of MDPI and/or the editor(s). MDPI and/or the editor(s) disclaim responsibility for any injury to people or property resulting from any ideas, methods, instructions or products referred to in the content. |
© 2025 by the authors. Licensee MDPI, Basel, Switzerland. This article is an open access article distributed under the terms and conditions of the Creative Commons Attribution (CC BY) license (http://creativecommons.org/licenses/by/4.0/).
Copyright: This open access article is published under a Creative Commons CC BY 4.0 license, which permit the free download, distribution, and reuse, provided that the author and preprint are cited in any reuse.