
Submitted:
15 October 2025
Posted:
16 October 2025
You are already at the latest version
Abstract
Background: The growing interest in optimizing rowing performance has led to the development of a wide range of ergometer-based tests. However, this diversity has also resulted in a lack of consensus regarding which physiological variables are most predictive of rowing performance. This systematic review aimed to provide an updated synthesis of the main testing protocols used on rowing ergometers and to identify the variables most strongly associated with 2,000-m performance. Methods: A systematic search was conducted across PubMed, Web of Science, and Scopus databases, following PRISMA and STROBE guidelines. Studies were selected based on predefined inclusion criteria, and methodological quality was assessed accordingly (PROSPERO: CRD420251027702). Results: Thirty studies comprising 787 rowers (566 men, 221 women) across elite (16%), sub-elite (32%), and recreational (56%) levels were analyzed. The 2,000-m test was the most frequently employed protocol (76%), followed by incremental tests (INCR). The 2,000-m test reflects competition performance, whereas INCR are primarily used to assess VO₂max and peak power, the variables most strongly correlated with 2,000-m outcomes. Power at lactate threshold and critical power also showed strong associations with performance, particularly when measured through short, time-efficient protocols that minimize fatigue. Conclusions: VO₂max, peak power output, and critical power (CP) are the variables most consistently associated with 2,000-m ergometer performance, highlighting the value of both maximal and submaximal testing protocols.
Keywords:
rowing performance
; rowing ergometer
; 2
; 000-m test
; Critical Power
; 3-min all-out test
1. Introduction
The rowing ergometer is a tool that allows the simulation of the rowing movement and the practice of this discipline outside the aquatic environment. Given the ease to control the training volume and to evaluate physical performance [1],the use of rowing ergometer is becoming more widespread, especially in countries where the weather does not allow rowing for several months of the year [2].
Different brands of rowing ergometers have been developed such as Gjessing or RowPerfect, but the most marketed model is the Concept2, which has held a leading position in the market since the introduction of the Model IIb in 1986 [3]. Subsequently, Concept2 designed new models with some technical improvements in terms of user comfort, durability, and monitor display although neither the biomechanics of movement nor the physical evaluation were modified from the previous models [4]. Currently, athletes and practitioners can visualize in real time different variables related to practice, schedule workouts and synchronize with various devices [3] while controlling the drag factor that increases of reduces resistance depending on the air output. Main variables are the average power (watts) and the split time (per 500-m), and the stroke frequency (strokes per minute). Data from the IIb model have been compared with mechanical sensors, showing an almost perfect correlation (r = 0.96) and therefore a high reliability [5].
One of the main sports applications of the rowing ergometer is the assessment of physical performance in teams or groups of athletes [3], as the conditions of the tests can be easily standardized regardless of environmental conditions or water [6]. The most common tests used are i) distance test, ii) time test, iii) maximum stroke test and iv) both continuous and discontinuous incremental tests (INCR). For distance tests, the 2,000-m test is the most common as it represents the distance used in competition according to the rules of the Fédération Internationale des Sociétés d’Aviron (FISA). However, shorter distances such as 500-m and 1,000-m [7] are also used to calculate CP using the traditional model. Additionally, da Silva et al. [8] employed the 100-m test to predict 2,000-m performance, reporting a correlation of r = 0.73. Longer distances, such as 6,000-m are also employed to assess aerobic fitness [9], showing strong correlations with performance variables, including power output (PO) at the ventilatory threshold (r = 0.74) and at VO₂max (r = 0.75).
Although researchers have also aimed to predict 2,000-m performance using shorter-duration tests such as the Wingate test [10,11,12], the 20-second test [13,14], or the 60-second test [14,15], results vary depending on the protocol and competitive level of the athletes. The Wingate test, traditionally performed over 30 seconds, has shown moderate to strong correlations with 2,000-m rowing performance, particularly when mean PO is used as a predictor10. Similarly, the 20-s all-out test has demonstrated significant associations with both peak and mean PO during longer efforts, making it a practical and time-efficient alternative for estimating rowing capacity [14,15]. More recently, Cerasola et al. [14,15] reported that the 60-s test provides a stronger predictive value compared to shorter tests, with correlation coefficients reaching up to r = 0.90 when analyzing mean PO and pacing consistency throughout the trial.
Maximum stroke tests focus on evaluating peak power in a small number of rowing strokes. For instance, 1-stroke tests [16] show a moderate correlation with 2,000-m performance (r = 0.62), while 5-stroke [1] and 10-stroke protocols [17] are also used. Peak power is 9% higher in elite than in amateur rowers, highlighting the relevance of this variable in high-level performance.
In the discontinuous INCR tests, rowers commonly perform 3-minute rowing bouts with a 1-minute rest period, with an intensity increase that varies depending on the level of participants and gender [18]. An alternative approach is the continuous INCR test, where intensity is increased every minute with no effort interruptions and, therefore, in a shorter amount of time. This is the most widely used test to measure maximal oxygen uptake (VO2max), which shows the highest correlation with the average power of the 2,000-m test [19].
An increasingly important variable for assessing rowing performance is CP, traditionally calculated using mathematical models based on three to four separate time-trial tests to determine the PO that an athlete can sustain in a physiological steady state. However, this traditional approach can be time-consuming and impractical. To address this, shorter tests such as the 3-minute all-out test have been developed to estimate CP more efficiently and with high reliability (r = 0.74). This test involves an all-out effort sustained for 3 minutes, allowing for a quicker evaluation of CP without substantial loss of accuracy [20].
Given the variety of tests and protocols used in rowing performance evaluation, it is essential to clarify which test or variable among those proposed and analyzed best predicts performance. Therefore, the aim of the present study was: (1) to provide an updated review of the existing tests for physical evaluation in rowing ergometers and (2) to synthesize the main variables measured in each test and their relationships with 2,000-m performance.
2. Materials and Methods
The present systematic review was conducted according to the Preferred Reporting Items for Systematic reviews and Meta-Analyses (PRISMA) [21,22] checklist, and the PROSPERO guidelines (registration no. CRD420251027702).
2.1. Systematic Literature Search
A literature search was conducted in June 2023 using the PubMed, Web of Science and Scopus databases. The strategy for searching in the databases was carried out using terms grouped into two search strings:
(1) "rowing ergometer" or "rowing test" or "rowing ergometry" or "indoor rowing" and "power output" or "critical power" or "all-out"; (2) "rowing ergometer" or "rowing test" or "rowing ergometry" or "indoor rowing" and "reliability" or "validity" or "performance" or "test".
All articles were selected based on eligibility criteria. Additional records were identified through other sources (hand searching the reference list of articles). Within the article, the characteristics of the level of the participants, tests used, experimental designs, description of the intervention and the results of the main variables (critical power, aerobic and anaerobic threshold, lactate threshold and ventilatory threshold) with the correlation of the different tests used were classified.
2.2. Inclusion and Exclusion Criteria
Original scientific research based on predictive tests of performance or variables relevant to performance in humans were included. Selected studies were up to December 2022 in peer-reviewed journals.
According to the PICO(s) strategy for searching, the inclusion criteria were as follows: (1) Population. All articles that performed the tests on rowers (women and men) with competitive experience, at any level or category of competition, were included. (2) Intervention. The tests were carried out only on the Concept2 rowing ergometer. (3) Comparison. Recording of variables that are especially important in the performance of rowers such as maximum oxygen consumption, average power, critical power, and aerobic and anaerobic threshold. (4) Outcomes. Average or maximum watts (W) on average in the INCR correlate with the main physiological variables related to performance in the rowing ergometer.
Exclusion criteria were (1) performed tests on other rowing ergometers such as the RowPerfect or Gjessing, (2) used supplementation; (3) inclusion of rowers with physical and/or intellectual disabilities; (4) the relationship between performance and hormonal responses is sought; (5) calculate biomechanical variables but not performance predictors; (6) compare results with on-water performance.
2.3. Data Extraction Strategy
The protocol was carried out in December 2022. The authors conducted a peer review of the articles to ensure the reliability and eligibility of the selection of articles for the review, according to the criteria for preparing systematic reviews (PRISMA)21. On 19 June 2023, an update to the search process was carried out using the same methods as in the first search. A form was designed to extract data from the studies included in the review and the scientific evidence that included the following information: (A) author(s); (B) characteristics of the sample (n, sex, and age); (C) competitive level; (D) tests and protocols used in the experimental design (INCR, fixed distance test, and time-determined test) such as the tools used (gas analyzers, lactic acid analyzer and ergometer data recording programs); (E) main results of the studies (reliability of evidence, reproducibility and validity).
2.4. Study Quality Assessment
The Strengthening the Reporting of Observational Studies in Epidemiology (STROBE) checklist was used to determine the quality of the studies [23]. The checklist was composed of 22 items clustered into six categories belonging to the different study sections: Title and Abstract (item 1), Introduction (items 2 and 3), Methods (items 4–12), Results (items 13–17), Discussion (items 18–21), and Funding (item 22). A score of ‘0’ was assigned to incomplete items or items with a lack information, and ‘1’ to items that were described accurately. The overall rating obtained from the sum of the item values was categorized according to following levels: very low quality (0–4 points); low quality (5–8 points); medium quality (9–12 points); high quality (13–16 points); and very high quality (17–22 points). The study quality assessment was carried out by two independent reviewers (IB and PG-F). A third author (SV) resolved disagreements in the rating, and inter-rater reliability was calculated. For the results and discussion of the results, the correlation of the variables was explained as follows: r = r = 1, perfect; r > 0.90, almost perfect; r = 0.80-0.90, very high; r = 0.70-0.80, high; r = 0.50-0.70, moderate; r < 0.50 low correlation.
3. Results
3.1. Review Statistics
The four stages of the search process are shown in Figure 1. (1) Identification: The first author (IB) identified scientific studies through a single search process (n = 478), including records from databases and registers. (2) Screening: The second author (SV) removed duplicate records (n = 268), and the first author (IB) excluded those not relevant through a preliminary reading of the title, abstract, and keywords (n = 119). (3) Eligibility: The authors IB and PG-F assessed the remaining full-text reports and excluded those unrelated to the topic according to the exclusion criteria (n = 59). (4) Inclusion: Finally, the remaining studies were included in the systematic review (n = 30).
3.2. Study Characteristics
Table 1 shows, in chronological order, the sample characteristics of the studies included in this systematic review. In total, 787 rowers (566 males and 221 females) were analyzed in the collected studies, the total sample was 72% male and 28% female. 21 of the 30 studies were conducted in men, six in women, and three studies included both men and women. Following the classification by Lawton et al. [24] about the competitive level, three articles used a sample of Olympic or world-class rowers who participated in World Cups or World Championships (Class A) [1,9,25], seven articles used a sub-elite sample considered as junior or under-23 category competitors with international experience (Class B) [7,8,13,15,18,26,27] and 16 articles used a sample of "non-elite" rowers who are considered federated or university rowers (Class C) [10,11,12,13,16,19,20,28,29,30,31,32,33,34,35,36]. Finally, four articles used samples with a mix of different levels [17,37,38,39].
The Class A included a total of 66 men and 36 women, representing a 12% for men and 16% for women of the total rowers. In Class B group, 225 men and 70 women, representing 40% and 32%, respectively. In the Class C, the total sample of men was 275, representing 48% of the total, and in women, a sample of 115, represented 52%. Three articles performed subgroups with the studied sample, differentiating between heavyweight (HWT) and lightweight (LWT) [1,18,19]. According to FISA, HWT men have a weight higher than 72.5 kg and women higher than 59 kg, and LWT lower than the above mentioned. The total sample of the studies is 54 HWT males, 33 LWT males, 17 HWT females and 36 LWT females.
Reviewing the objectives of the articles, we have made a classification of three different objectives. 18 articles aim to know the physiological variables (aerobic and anaerobic capacity, lactate thresholds and VO2max) that are related to performance in the 2,000-m test [1,7,9,17,18,19,26,28,29,30,32,33,34,35,37,38,40], five articles aim to develop mathematical models to predict performance in ergometer rowing [8,10,12,36,39] and seven articles aim to know the relationship between the average power of the 2,000-m test with the short duration tests [11,13,14,15,16,20,31].
3.3. Main Tests for Performance Measurement
Table 2 summarizes the distance or time tests, and the results are represented with the total time to completion the test or with the average power. The test that has been performed more times by the researchers was the 2,000-m test (n=23) [1,7,8,10,12,13,14,15,16,18,19,25,26,28,29,30,31,32,33,34,38,39,40] , that also represents the competition distance. Table 3 includes the articles that have performed INCR tests, both continuous and discontinuous. The results summarize the maximum power recorded in the test and the VO2max. This table also shows the main findings of the research and the correlation between principal variables measured. The results of the INCR tests are very important, as this is the second most widely used test in research, with the discontinuous test being used 16 times [1,9,12,17,18,20,25,28,33,37,39,40] and the continuous test 11 times [13,15,29,30,31,34,35]. The next most frequently used tests are the distance tests. In this case, we will break down the number of times they have been performed: 100-m (n=1) [8], 500-m (n=1) [7], 1,000-m (n=1) [7], 1,500-m (n=1) [11] and 6,000-m (n=3) [7,9,16]. In the case of time tests, the 20-s (n=2) [13,14], Wingate (n=3) [10,11,12], 60-s (n=2) [14,15], 3-min all-out (n=2) [16,20], 6-min all-out (n=1) [35] and 20-min (n=1) [17] tests were used. In three of the studies, maximal effort tests were conducted using maximal stroke test to determine peak PO, the assessment protocols included tests of 1, 5, and 10 strokes [1,16,17]. The CP or critical velocity (CV) were calculated on three articles [16,20,31].
The variables used to differentiate the groups included maximum oxygen consumption (VO₂max), maximum power achieved in an INCR and average power during a 2,000-m test. The results are presented according to competitive level (classes A, B and C) and differentiated by sex. In the Class A (elite) rowers, the only variable reported was VO₂max in men, with values ranging from 5.33 to 5.53 L/min [1,9,25,27]. No data were found corresponding to women in this category. Class B (sub-elite) rowers, the three variables showed broader ranges. Regarding maximum power in the INCR test, men recorded values ranging from 308 to 441 W [7,8,13,14,15,17,26], while women presented values between 266 and 285 W [18]. VO₂max values in this group varied considerably, from 4.19 to 5.68 L/min in men [7,8,13,14,15,17,26] and from 3.5 to 3.8 L/min in women [18]. In relation to the mean power during the 2,000-m test, men reached between 235 and 463 W [7,8,13,14,15,17,26], and women between 259 and 284 W [18]. The highest number of participants was found in Class C (amateur or recreational level). The maximum power in the INCR test in men was between 234 and 350 W [10,17,20,28,30,32,34,38]; this variable was not reported for women. As for VO₂max, men presented values between 4.07 and 5.30 L/min [10,17,20,28,30,32,34,38], while in women only one value was found reported, of 3.18 L/min [12]. Finally, the mean power during the 2,000-m test varied between 275 and 382 W in men [10,17,20,28,30,32,34,38], and in the case of women, a mean value of 245 W was reported [12,16,19,29,33].
3.4. Main Findings
The shorter time tests were performed in 11 articles and showed high correlations with 2,000-m performance (r = 0.73-0.94), providing useful at specific points of the season to track rowers’ improvement. Within this group we observed that the 20-s and 60-s tests have a nearly perfect relationship with the average power of the 2,000-m test (r = 0.92-0.94) [13,14,15], unlike the Wingate (r=0.79-0.87) [10,11,12] and the 100-m test (r=0.74) [8], which showed very large relationship.
Table 3 summarizes the results of the INCR tests reported in 23 articles. In four articles, both tests (INCR continuous and discontinuous) were performed [7,19,28,32], with the aim of determining which of the measured variables were strongly associated with performance in the 2,000-m test. Among the most important findings (Table 3) we can highlight the relationship between the main physiological variables with 2,000-m performance. The physiological variable with the highest correlation is VO2max (r = 0.61-0.99) [1,18,19,26,28,29,30,31,33,34,37,40,41], followed by power at lactate threshold (r = 0.73-0.92) [12,28]. Maximum power in the INCR tests was also highly relevant, given its very large to nearly perfect association with 2,000-m performance (r = 0.83-0.98) [1,18,26,33,37,38].
3.5. Study Quality
The quality analysis (RAE–Performance Strengthening the Reporting of Observational Studies in Epidemiology (STROBE) checklist) [23] yielded the following results: (a) The quality scores ranged from 15 to 21. (b) The average score was 18 points. (c) A total of 10 out of the 30 included studies (33%) were categorized as high quality (13–16 points), and 20 (67%) were considered very high quality (17–20 points). The highest scores were obtained in the Title and Abstract (100%), Introduction (98.3%), Results (82.7%), Method (82.2%), and Discussion (79,2%) sections. The lowest scores were detected in the other section (33.3%). Among the highest-quality studies, items 1 (Title and abstract), 2 (background/rationale), 4 (Study design), 6 (participants), 12 (Statistical methods), 16 (main results) and 18 (key results), were considered complete (100%). By contrast, the most uncommon items were numbers 19 (Limitations) with 33.3%, 17 (other analyses) with 30.0%, 22 (Funding) with 33.3%, and 9 (Bias) with 0%.
4. Discussion
The present systematic review aimed to synthesize the available protocols for physical evaluation on Concept2 rowing ergometers. VO₂max and peak PO derived from INCR were the most frequently assessed variables, both showing strong associations with 2,000-m performance. PO at lactate threshold and CP also demonstrated very high correlations with performance, particularly when evaluated through short-duration, time-efficient protocols that minimize fatigue. These findings are consistent with previous evidence highlighting the predictive value of VO2max and power-related measures in rowing performance, while also suggesting that submaximal indices can provide practical alternatives in monitoring frameworks. Nevertheless, the strength of these associations appears to vary according to competitive level, which warrants further research to clarify how athlete status may mediate the predictive utility of different testing protocols.
4.1. Study Characteristics
Most of the studies in this systematic review (72%) were conducted with male participants, while only six focused exclusively on women, limiting the applicability of findings to female rowers [12,16,18,31,39,40] and confirming the lack of evidence in women’s rowing performance. In terms of competitive level, most samples consisted of non-elite rowers (Class C), followed by sub-elite (Class B) and, to a lesser extent, elite rowers (Class A). This distribution highlights a research gap in high-performance populations, despite the particular importance of physiological profiling and performance modeling for elite-level training and selection processes. Weight categories (according to FISA rules) were even less frequently considered, with only three studies distinguishing between heavyweight and lightweight rowers [1,18,19]. Such underrepresentation may obscure meaningful distinctions in metabolic demands and adaptations between categories, underscoring the need for more systematic inclusion of weight-class-specific data in future research. Regarding research objectives, most studies (n = 19) investigated physiological variables such as VO₂max and lactate thresholds in relation to 2,000-m performance, whereas fewer examined predictive modeling approaches (n = 5) or explored associations between short-duration maximal effort tests and 2,000-m average PO (n = 6). While the predominance of physiological investigations confirms their foundational role in rowing performance, the limited attention to predictive modeling and short-test correlates highlights key opportunities for future research, particularly in the development of reliable, time-efficient assessments for athlete monitoring and talent identification.
4.2. Main Tests for Performance Measurement
The main tests identified in this review (Table 4) were distance and time tests, highlighting the 2,000-m test. In addition, shorter tests have been used either to predict 2,000-m performance by correlating average power values, or to calculate the CP or CV.
VO₂max and peak PO emerged as the strongest physiological variables associated with rowing performance. Both were primarily assessed using INCR, whereas the 2,000-m test, the most frequently employed protocol (n = 23 of 30 studies), measured average power or total time. Variables obtained from INCR demonstrated very high correlations with 2,000-m performance, highlighting their relevance as predictors of rowing success. In elite rowers (Class A), male VO₂max values exceeded 5.30 L/min, showing near-perfect correlations with average 2,000-m PO (r = 0.93–0.99) [1,9,25,27]. Sub-elite athletes (Class B) presented intermediate values with greater variability; for instance, male VO₂max ranged from 4.19 to 5.68 L/min [7,8,13,14,15,17,26], maintaining strong correlations with 2,000-m performance (r = 0.76–0.84). Female athletes in this category exhibited slightly lower VO₂max (3.5–3.8 L/min) but retained very high correlations (r = 0.83)[18], consistent with known sex-based physiological differences [42]. Among recreational rowers (Class C), correlations remained large to very large: men r = 0.61–0.88 [10,11,17,20,28,30,32,34,35,38], women r = 0.87–0.92 [12,16], and mixed groups r = 0.88–0.96 [19,29,33]. These findings emphasize the central role of VO₂max and peak PO obtained from INCR as universal predictors of rowing capacity, with a clear and consistent link to performance in the 2,000-m test.
In terms of PO, both peak power (INCR) and mean power during the 2,000-m test showed a descending trend across elite, sub-elite, and recreational levels. Peak power obtained in INCR test is a variable that also has a high correlation with average power over 2,000-m, so it can be considered a predictor of performance. Among Class B male athletes, peak power reached up to 441 W, while mean power during the 2,000-m test peaked at 463 W (r=0.92) [7,8,13,14,15,17,26]. These values are consistent with what would be expected in rowers who possess a solid training base but have not yet reached the physiological benchmarks of top international competitors. As anticipated, female athletes in this group exhibited lower values, with peak power reaching 285 W and mean 2,000-m test power at 284 W (r=0.88) [18]. However, these outcomes remain within the range reported in studies involving similarly trained female rowing populations. Mean power during the 2,000-m test was substantially lower compared to the higher-level groups, with male values ranging between 278 and 382 W [10,11,17,20,28,30,32,34,35,38], and a single female value recorded at 245 W [12].
These findings align with prior research showing that rowing performance scales predictably with competitive level and training background [26,41]. Performance indicators such as VO₂max and mean 2,000-m PO have been shown to correlate strongly with years of structured training and exposure to high-intensity workloads [28]. Taken together, these findings reinforce the central role of VO₂max and PO as key determinants of rowing performance. The progressive variation of these variables across competitive levels underscores their sensitivity to training status and athletic development. Moreover, the observed sex-based differences align with existing literature, showing lower absolute capacities in female athletes, while relative efficiency may remain comparable [42]. To develop a more comprehensive understanding of performance in rowing, it is essential to consider not only maximal aerobic capacity but also additional physiological and biomechanical variables. Previous studies have highlighted the importance of factors such as anaerobic threshold, technical proficiency, and body composition in shaping rowing outcomes [42,43].

Table 5.
Summary of key physiological variables associated with 2,000-m rowing performance: definitions, advantages and limitations.
Table 5.
Summary of key physiological variables associated with 2,000-m rowing performance: definitions, advantages and limitations.
| Physiological Variable | Definition / Description | 2,000-m Performance | Advantages | Limitations |
| VO2max | Maximal oxygen uptake (L/min), measured during INCR using gas analysis. Reflects aerobic capacity. | Very high to almost perfect (r = 0.76–0.99) depending on athlete category. | Gold standard for aerobic fitness; high predictive power; validated across multiple populations. | Requires expensive equipment and lab setting; time-consuming; effort-dependent; less accessible for low-budget teams. |
| Estimated from 3-min all-out test– non-invasive protocol to derive VO₂max without gas exchange analysis. | Strong agreement with traditional gas-based VO₂max values. | Time-efficient; low-cost alternative; suitable for field testing; allows performance estimation without sophisticated tools. | Less widely validated; may not replace direct gas analysis in elite settings. | |
| Peak Power Output (INCR) | Highest power (W) achieved during an INCR to exhaustion (continuous or discontinuous). | High to almost perfect (r = 0.84–0.99) |
Easy to measure with rowing ergometer; non-invasive; suitable for field or lab; correlates with VO₂max and 2,000-m performance |
Requires maximal effort and proper protocol standardization; results may vary with pacing strategy or motivation. |
| Blood Lactate Concentration | Blood lactate measured during rest intervals in INCR; commonly analyzed at anaerobic threshold (4 mmol/L). Reflects metabolic response and aerobic/anaerobic transition zones. | High to very high at threshold (r = 0.83–0.92); poor post-threshold (r = 0.19). | Enables individualized training zones; widely used in endurance sports; strong predictor at 4 mmol/L threshold; relevant for both HWT and LWT categories | Invasive (requires blood sampling); limited utility after threshold due to weak correlation with performance; needs biochemical analysis and trained personnel. |
4.3. Main Findings
The main findings are summarized below, in alignment with the primary research objectives. Short-duration tests—particularly the 20-s and 60-s tests—demonstrated the greatest relevance for predicting 2,000-m performance [13,14,15]. Among the physiological variables, VO₂max [1,18,19,26], power at the anaerobic threshold [13,14,15,26], and peak power during the INCR showed the strongest associations [25]. Additional variables relevant to rowing performance include blood lactate concentration and estimates of CP or CV [7,20,31]. VO₂max remains the gold-standard marker of aerobic capacity, showing very high correlations with 2,000-m average power across athlete categories (r = 0.76–0.99)[1,9,25,27]. While traditionally measured via expensive gas analysis, Cheng et al. [20] demonstrated that VO₂max can be reliably estimated through a 3-minute all-out test, offering a cost-effective and practical alternative for teams with limited access to laboratory resources. Peak PO measured during INCR, whether continuous or discontinuous, also correlates highly with rowing performance (r = 0.84–0.99) [13,14,15,26]. This variable reflects an athlete’s capacity to produce maximal power under increasing fatigue. It can be easily assessed with rowing ergometers and does not require specialized equipment, though it is influenced by the athlete’s motivation and test standardization. Blood lactate concentration, particularly the power output at the anaerobic threshold (4 mmol/L), is widely used for determining training zones and predicting performance (r = 0.83–0.92) [12,28]. However, correlations drop significantly when peak lactate values are considered (r = 0.27)[1], limiting its predictive utility beyond the threshold. Despite its reliability, lactate testing is invasive and requires skilled personnel for sample collection and analysis, which can be a logistical limitation.
CP and CV are promising indicators of maximal sustainable rowing power. They can be calculated using three to four maximal efforts of different duration, but the 3-min all-out test provides a simpler and equally reliable estimate. Although typically requiring multiple sessions, adaptations such as the 3-minute all-out test [20] allow for practical field-based estimation. CP has shown strong correlations with MLSS and with 2,000-m average power (r = 0.88)[31] , highlighting its potential as a non-invasive performance monitoring tool. However, the method still requires further validation within rowing populations and is sensitive to protocol adherence. Overall, these physiological markers offer complementary insights for performance evaluation in rowing. While some demand advanced equipment and expertise, others—such as estimated VO₂max or CP—present efficient, accessible, and field-applicable alternatives with growing scientific support.
Several studies have investigated alternative rowing tests to the standard 2,000-m race to assess performance. Common distance tests include 100-m, 500-m, 1,000-m, and 6,000-m. For instance, da Silva et al. [8] found a strong correlation (r = 0.74) between average power in the 100-m test and 2,000-m performance. The 500-m (r = 0.65) and 1,000-m (r = -0.86)[7] tests were used to estimate CP and its association with MLSS. Holmes et al. [16] highlighted the relevance of using “split” (average 500-m pace) as a performance metric. In their study, the split correlated more strongly with CP (r = -0.99) than average power (r = -0.62) during the 2,000-m test. Lastly, the 3-minute all-out test proved to be a time-efficient method to determine CP. The average power from the final 30 seconds showed high correlation with CP [20] and nearly perfect correlation with 2,000-m average power [16], making it a valuable tool for in-season monitoring. The 6,000-m test on the rowing ergometer, although less commonly used, shows strong potential as a field-based indicator of aerobic capacity. Mikulic [9] reported a strong correlation between power output at VO₂max during an INCR discontinuous test and the power achieved in the 6,000-m ergometer test (r = –0.732; p < 0.01), along with a moderate association with total completion time (r = –0.484; p < 0.05). These findings support its value for performance profiling when laboratory assessments are not feasible. Very short maximal tests, such as the 20-s and 60-s tests, also yielded nearly perfect correlations with 2,000-m average power over: (60-s: r = -0.9415; 20-s: r = -0.92 to -0.95)[13,14]. The Wingate test, adapted from cycling, showed high correlations with 2,000-m (r = 0.79–0.87)[10,11,12] and 1,500-m (r = 0.83)[11] performance in Class C and junior rowers respectively [10,11,12]. This suggests it may be particularly reliable for youth athletes, who rely more on power in shorter races. In anticipation of to the Los Angeles 2028 Olympic Games, it would be interesting to consider some of this variables or test since the competition distance will be reduced to 1,500-m [44].
One of the most important aspects was the comparison between HWT and LWT rowers. When both groups were analyzed, LWT rowers recorded lower VO₂max (12%), lower peak power (11%) and average power in a 2,000-m test (12%) than HWT [26]. HWT rowers can produce more power due to greater weight and muscle mass than LWT rowers. Ingham et al. [1] were the only researchers who analyzed both HWT and LWT male and female athletes within a single study. Although detailed data were not reported, they concluded that the HWT group exhibited higher peak power in the 5- and 7-stroke maximal tests, with this variable showing an almost perfect correlation (r > 0.90) with 2,000-m performance ones. When comparing the performance of men and women, women produced 33% less peak power in an INCR test, 34% less average power in a 20-minute test [36] and 21% less VO₂max [29]. This performance gap may be partially explained since men have a greater relative muscle mass, which allows for greater force production and greater aerobic capacity due to higher hemoglobin concentrations [44].
An additional consideration is the correlation coefficient and protocol design. Despite the correlation coefficient found in the studies the strength of these relationships appears to depend on competitive level. Among recreational rowers, sample heterogeneity and incomplete reporting of training history or rowing experience limit the interpretability of findings. In contrast, studies involving elite rowers generally reveal nearly perfect correlations (r > 0.90) between physiological variables and 2,000-m performance. Several authors standardized the protocol using the ergometer’s drag factor (DF). This variable, adjustable before each test, directly influences resistance and must be controlled to ensure reproducibility. Bourdon et al. [25] individualized the DF for different categories (male and female, LWT and HWT), while other studies, such as Cheng et al. [20], standardized DF at its maximum setting, whereas some allowed rowers to self-select the DF [38,39]. The rowing ergometer also requires calibration for airflow resistance, since lower damper settings increase drag resistance. Standardized procedures are therefore essential to ensure comparability of results across contexts.
The findings of this review highlight several promising directions for future research. First, the refinement and validation of short-duration tests could significantly enhance the efficiency of performance assessment in rowing. These protocols provide reliable data in a short time frame and induce minimal fatigue, making them particularly suitable for frequent monitoring in elite athletes [16,20]. The 3-minute all-out test has shown strong correlations with both CP and VO₂max, offering a practical alternative to traditional INCR, which usually demand longer durations of up to 20 minutes [45]. Further studies should explore whether CP estimates derived from this protocol are more accurate in elite rowers compared to those in recreational athletes, given the stronger associations observed in high-performance samples [1,26]. Moreover, considering the upcoming change in Olympic rowing distance from 2,000-m to 1,500-m, it is essential to investigate how this shift will influence the physiological demands of the sport. Preliminary evidence suggests an increased contribution of anaerobic metabolism and peak power output under the new format [46], reinforcing the relevance of CP and short-duration tests for performance profiling and training adaptation.
5. Conclusions
This systematic review confirms that ergometer tests are essential tools for evaluating rowing performance and guiding training monitoring. Among the different protocols, the 2,000-m test remains the most widely studied and applied, serving as the main reference for estimating competitive capacity. The physiological variables with the strongest predictive power are VO₂max, peak PO, and power at lactate threshold, underscoring their central role in characterizing rowers’ profiles. However, the high physiological stress associated with the 2,000-m test limits its practicality for frequent assessments, as it induces considerable fatigue. In this context, alternative protocols such as the 3-minute all-out test emerge as valid and time-efficient options, enabling estimation of VO₂max and CP while allowing repeated monitoring during the season. Shorter maximal efforts (20-s and 60-s tests) also provide useful alternatives to track rowing capacity with minimal disruption to training. Looking ahead, the transition to 1,500-m racing in the Los Angeles 2028 Olympic Games reinforces the need to validate adapted testing protocols. Finally, despite notable advances, the literature remains limited by a lack of standardized methodologies and insufficient focus on female rowers and elite competitors. Optimizing the integration of reliable ergometer protocols into daily practice is therefore crucial to individualizing preparation and anticipating future competitive demands.
Author Contributions
Conceptualization, I.B. and P.G-F.; methodology, I.B.; software, S.V..; validation, I.B., P.G-F. and S.V.; formal analysis, S.V..; investigation, I.B.; data curation, S.V.; writing—original draft preparation, I.B.; writing—review and editing, P.G-F. and S.V.; supervision, P.G-F. All authors have read and agreed to the published version of the manuscript.
Funding
This research was funded by Universidad Francisco de Vitoria, grant number UFV2024-50.
Institutional Review Board Statement
Not applicable.
Informed Consent Statement
Not applicable.
Data Availability Statement
The dataset is available on reasonable request from the corresponding author.
Conflicts of Interest
The authors declare no conflicts of interest.
Abbreviations
The following abbreviations are used in this manuscript:
| INCR | Incremental tests |
| FISA | Fédération Internationale des Sociétés d’Aviron |
| CP | Critical Power |
| CV | Critical Velocity |
| VO2max | Maximal oxygen uptake |
| W | Watts |
| PO | Power Output |
References
- Ingham, S.A.; Whyte, G.P.; Jones, K.; Nevill, A.M. Determinants of 2,000 m Rowing Ergometer Performance in Elite Rowers. Eur. J. Appl. Physiol. 2002, 88, 243–246. [CrossRef]
- Šarabon, N.; Kozinc, Ž.; Babič, J.; Marković, G. Effect of Rowing Ergometer Compliance on Biomechanical and Physiological Indicators during Simulated 2,000-Metre Race. J. Sports Sci. Med. 2019, 18, 264–270.
- Smith, T.B.; Hopkins, W.G. Measures of Rowing Performance. Sports Med. 2012, 42, 343–358. [CrossRef]
- Vogler, A.J.; Rice, A.J.; Withers, R.T. Physiological Responses to Exercise on Different Models of the Concept II Rowing Ergometer. Int. J. Sports Physiol. Perform. 2007, 2, 360–370.
- Boyas, S.; Nordez, A.; Cornu, C.; Guével, A. Power Responses of a Rowing Ergometer: Mechanical Sensors vs. Concept2® Measurement System. Int. J. Sports Med. 2006, 27, 830–833. [CrossRef]
- Mäestu, J.; Jürimäe, J.; Jürimäe, T. Monitoring of Performance and Training in Rowing. Sports Med. 2005, 35, 597–617. [CrossRef]
- Possamai, L.T.; Borszcz, F.K.; de Aguiar, R.A.; de Lucas, R.D.; Turnes, T. Agreement of Maximal Lactate Steady State with Critical Power and Physiological Thresholds in Rowing. Eur. J. Sport Sci. 2022, 22, 371–380. [CrossRef]
- da Silva, L.F.; de Almeida-Neto, P.F.; de Matos, D.G.; Riechman, S.E.; de Queiros, V.; de Jesus, J.B.; Reis, V.M.; Clemente, F.M.; Miarka, B.; Aidar, F.J.; et al. Performance Prediction Equation for 2000 m Youth Indoor Rowing Using a 100 m Maximal Test. Biology 2021, 10. [CrossRef]
- Mikulic, P. Anthropometric and Metabolic Determinants of 6,000-m Rowing Ergometer Performance in Internationally Competitive Rowers. J. Strength Cond. Res. 2009, 23, 1851–1857. [CrossRef]
- Akça, F. Prediction of Rowing Ergometer Performance from Functional Anaerobic Power, Strength and Anthropometric Components. J. Hum. Kinet. 2014, 41, 133–142. [CrossRef]
- Maciejewski, H.; Rahmani, A.; Chorin, F.; Lardy, J.; Giroux, C.; Ratel, S. The 1,500-m Rowing Performance Is Highly Dependent on Modified Wingate Anaerobic Test Performance in National-Level Adolescent Rowers. Pediatr. Exerc. Sci. 2016, 28, 572–579. [CrossRef]
- Riechman, S.E.; Zoeller, R.F.; Balasekaran, G.; Goss, F.L.; Robertson, R.J. Prediction of 2000 m Indoor Rowing Performance Using a 30 s Sprint and Maximal Oxygen Uptake. J. Sports Sci. 2002, 20, 681–687. [CrossRef]
- Cataldo, A.; Cerasola, D.; Russo, G.; Zangla, D.; Traina, M. Mean Power during 20 Sec All out Test to Predict 2000 m Rowing Ergometer Performance in National Level Young Rowers. J. Sports Med. Physiol. Fit. 2015, 55, 872–877.
- Cerasola, D.; Zangla, D.; Grima, J.N.; Bellafiore, M.; Cataldo, A.; Traina, M.; Capranica, L.; Maksimovic, N.; Drid, P.; Bianco, A. Can the 20 and 60 s All-Out Test Predict the 2000 m Indoor Rowing Performance in Athletes? Front. Physiol. 2022, 13, 1–7. [CrossRef]
- Cerasola, D.; Bellafiore, M.; Cataldo, A.; Zangla, D.; Bianco, A.; Proia, P.; Traina, M.; Palma, A.; Capranica, L. Predicting the 2000-m Rowing Ergometer Performance from Anthropometric, Maximal Oxygen Uptake and 60-s Mean Power Variables in National Level Young Rowers. J. Hum. Kinet. 2020, 75, 77–83. [CrossRef]
- Holmes, C.J.; Hornikel, B.; Sullivan, K.; Fedewa, M. Associations between Multimodal Fitness Assessments and Rowing Ergometer Performance in Collegiate Female Athletes. Sports 2020, 8, 1–13. [CrossRef]
- Izquierdo-Gabarren, M.; De Txabarri Expósito, R.G.; De Villarreal, E.S.S.; Izquierdo, M. Physiological Factors to Predict on Traditional Rowing Performance. Eur. J. Appl. Physiol. 2010, 108, 83–92. [CrossRef]
- Bourdin, M.; Lacour, J.-R.; Imbert, C.; Messonnier, L.A. Factors of Rowing Ergometer Performance in High-Level Female Rowers. Int. J. Sports Med. 2017, 38, 1023–1028. [CrossRef]
- Ingham, S.A.; Pringle, J.S.; Hardman, S.L.; Fudge, B.W.; Richmond, V.L. Comparison of Step-Wise and Ramp-Wise Incremental Rowing Exercise Tests and 2000-m Rowing Ergometer Performance. Int. J. Sports Physiol. Perform. 2013, 8, 123–129. [CrossRef]
- Cheng, C.F.; Yang, Y.S.; Lin, H.M.; Lee, C.L.; Wang, C.Y. Determination of Critical Power in Trained Rowers Using a Three-Minute All-out Rowing Test. Eur. J. Appl. Physiol. 2012, 112, 1251–1260. [CrossRef]
- Liberati, A.; Altman, D.G.; Tetzlaff, J.; Mulrow, C.; Gøtzsche, P.C.; Ioannidis, J.P.A.; Clarke, M.; Devereaux, P.J.; Kleijnen, J.; Moher, D. The PRISMA Statement for Reporting Systematic Reviews and Meta-Analyses of Studies That Evaluate Healthcare Interventions: Explanation and Elaboration. BMJ 2009, 339. [CrossRef]
- Moher, D.; Shamseer, L.; Clarke, M.; Ghersi, D.; Liberati, A.; Petticrew, M.; Shekelle, P.; Stewart, L.A.; Estarli, M.; Barrera, E.S.A.; et al. Preferred Reporting Items for Systematic Review and Meta-Analysis Protocols (PRISMA-P) 2015 Statement. Syst. Rev. 2016, 4, 148–160. [CrossRef]
- Vandenbroucke, J.P.; Von Elm, E.; Altman, D.G.; Gøtzsche, P.C.; Mulrow, C.D.; Pocock, S.J.; Poole, C.; Schlesselman, J.J.; Egger, M. Strengthening the Reporting of Observational Studies in Epidemiology (STROBE): Explanation and Elaboration. Epidemiology 2007, 18, 805–835. [CrossRef]
- Lawton, T.W.; Cronin, J.B.; McGuigan, M.R. Strength Testing and Training of Rowers: A Review. Sports Med. 2011, 41, 413–432. [CrossRef]
- Bourdon, P.C.; David, A.Z.; Buckley, J.D. A Single Exercise Test for Assessing Physiological and Performance Parameters in Elite Rowers: The 2-in-1 Test. J. Sci. Med. Sport 2009, 12, 205–211. [CrossRef]
- Bourdin, M.; Messonnier, L.; Hager, J.P.; Lacour, J.R. Peak Power Output Predicts Rowing Ergometer Performance in Elite Male Rowers. Int. J. Sports Med. 2004, 25, 368–373. [CrossRef]
- Mikulic, P.; Vucetic, V.; Sentija, D. Strong Relationship between Heart Rate Deflection Point and Ventilatory Threshold in Trained Rowers. J. Strength Cond. Res. 2011, 25, 360–366.
- Cosgrove, M.J.; Wilson, J.; Watt, D.; Grant, S.F. The Relationship between Selected Physiological Variables of Rowers and Rowing Performance as Determined by a 2000 m Ergometer Test. J. Sports Sci. 1999, 17, 845–852. [CrossRef]
- Gillies, E.M.; Bell, G.J. The Relationship of Physical and Physiological Parameters to 2000 m Simulated Rowing Performance. Sports Med. Train. Rehabil. 2000, 9, 277–288. [CrossRef]
- Shimoda, M.; Fukunaga, T.; Higuchi, M.; Kawakami, Y. Stroke Power Consistency and 2000 m Rowing Performance in Varsity Rowers. Scand. J. Med. Sci. Sports 2009, 19, 83–86. [CrossRef]
- Kendall, K.L.; Smith, A.E.; Fukuda, D.H.; Dwyer, T.R.; Stout, J.R. Critical Velocity: A Predictor of 2000-m Rowing Ergometer Performance in NCAA D1 Female Collegiate Rowers. J. Sports Sci. 2011, 29, 945–950. [CrossRef]
- Otter, R.T.A.; Brink, M.S.; Lamberts, R.P.; Lemmink, K.A.P.M. A New Submaximal Rowing Test to Predict 2,000-m Rowing Ergometer Performance. J. Strength Cond. Res. 2015, 29, 2426–2433. [CrossRef]
- Turnes, T.; Possamai, L.T.; Penteado Dos Santos, R.; De Aguiar, R.A.; Ribeiro, G.; Caputo, F. Mechanical Power during an Incremental Test Can Be Estimated from 2000-m Rowing Ergometer Performance. J. Sports Med. Phys. Fitness 2020, 60, 214–219. [CrossRef]
- Huerta Ojeda, Á.; Riquelme Guerra, M.; Coronado Román, W.; Yeomans, M.-M.; Fuentes-Kloss, R. Kinetics of Ventilatory and Mechanical Parameters of Novice Male Rowers on the Rowing Ergometer. Int. J. Perform. Anal. Sport 2022, 22, 422–436. [CrossRef]
- Huerta Ojeda, Á.; Guerra, M.R.; Román, W.C.; Yeomans-Cabrera, M.M.; Fuentes-Kloss, R. Six-Minute Rowing Test: A Valid and Reliable Method for Assessing Power Output in Amateur Male Rowers. PeerJ 2022, 10. [CrossRef]
- McGrath, E.; Mahony, N.; Fleming, N.; Donne, B. Prediction of Rowing Functional Threshold Power Using Body Mass, Blood Lactate and GxT Peak Power Data. Int. J. Exerc. Sci. 2023, 16, 31–41.
- Messonnier, L.; Aranda-Belthouze, S.E.; Bourdin, M.; Bredel, Y.; Lacour, J.-R. Rowing Performance and Estimated Training Load. Int. J. Sports Med. 2004, 26, 376–382. [CrossRef]
- Jensen, K.; Frydkjær, M.; Jensen, N.M.B.; Bannerholt, L.M.; Gam, S. A Maximal Rowing Ergometer Protocol to Predict Maximal Oxygen Uptake. Int. J. Sports Physiol. Perform. 2021, 16, 382–386. [CrossRef]
- Mazza, O.B.; Gam, S.; I Kolind, M.E.; Kiaer, C.; Jensen, K. A Maximal Rowing Ergometer Protocol to Predict Maximal Oxygen Uptake in Female Rowers. Int. J. Sports Physiol. Perform. 2021, 16, 382–386. [CrossRef]
- Bourdon, P.C.; Woolford, S.M.; Buckley, J.D. Effects of Varying the Step Duration on the Determination of Lactate Thresholds in Elite Rowers. Int. J. Sports Physiol. Perform. 2018, 13, 687–693. [CrossRef]
- Nevill, A.M.; Allen, S.V.; Ingham, S.A. Modelling the Determinants of 2000 m Rowing Ergometer Performance: A Proportional, Curvilinear Allometric Approach. Scand. J. Med. Sci. Sports 2011, 21, 73–78. [CrossRef]
- Joyner, M.J.; Coyle, E.F. Endurance Exercise Performance: The Physiology of Champions. J. Physiol. 2008, 586, 35–44. [CrossRef]
- Steinacker, J.M. Physiological Aspects of Training in Rowing. Int. J. Sports Med. 1993, 14.
- Astridge, D.J.; Peeling, P.; Goods, P.S.R.; Girard, O.; Hewlett, J.; Rice, A.J.; Binnie, M.J. Rowing in Los Angeles. Performance Considerations for the Change to 1500 m at the 2028 Olympic Games. Int. J. Sports Physiol. Perform. 2023, 18, 104–107. [CrossRef]
- Penichet-Tomas, A.; Jimenez-Olmedo, J.M.; Pueo, B.; Olaya-Cuartero, J. Physiological and Mechanical Responses to a Graded Exercise Test in Traditional Rowing. Int. J. Environ. Res. Public. Health 2023, 3664. [CrossRef]
- Astridge, D.J.; Peeling, P.; Goods, P.S.R.; Girard, O.; Watts, S.P.; Dennis, M.C.; Binnie, M.J. Shifting the Energy Toward Los Angeles: Comparing the Energetic Contribution and Pacing Approach Between 2000- and 1500-m Maximal Ergometer Rowing. Int. J. Sports Physiol. Perform. 2024, 19, 133–141. [CrossRef]
Figure 1.
Flow diagram for screening and selection studies according to Preferred Reporting Item for Systematic Reviews and Analysis (PRISMA).
Figure 1.
Flow diagram for screening and selection studies according to Preferred Reporting Item for Systematic Reviews and Analysis (PRISMA).
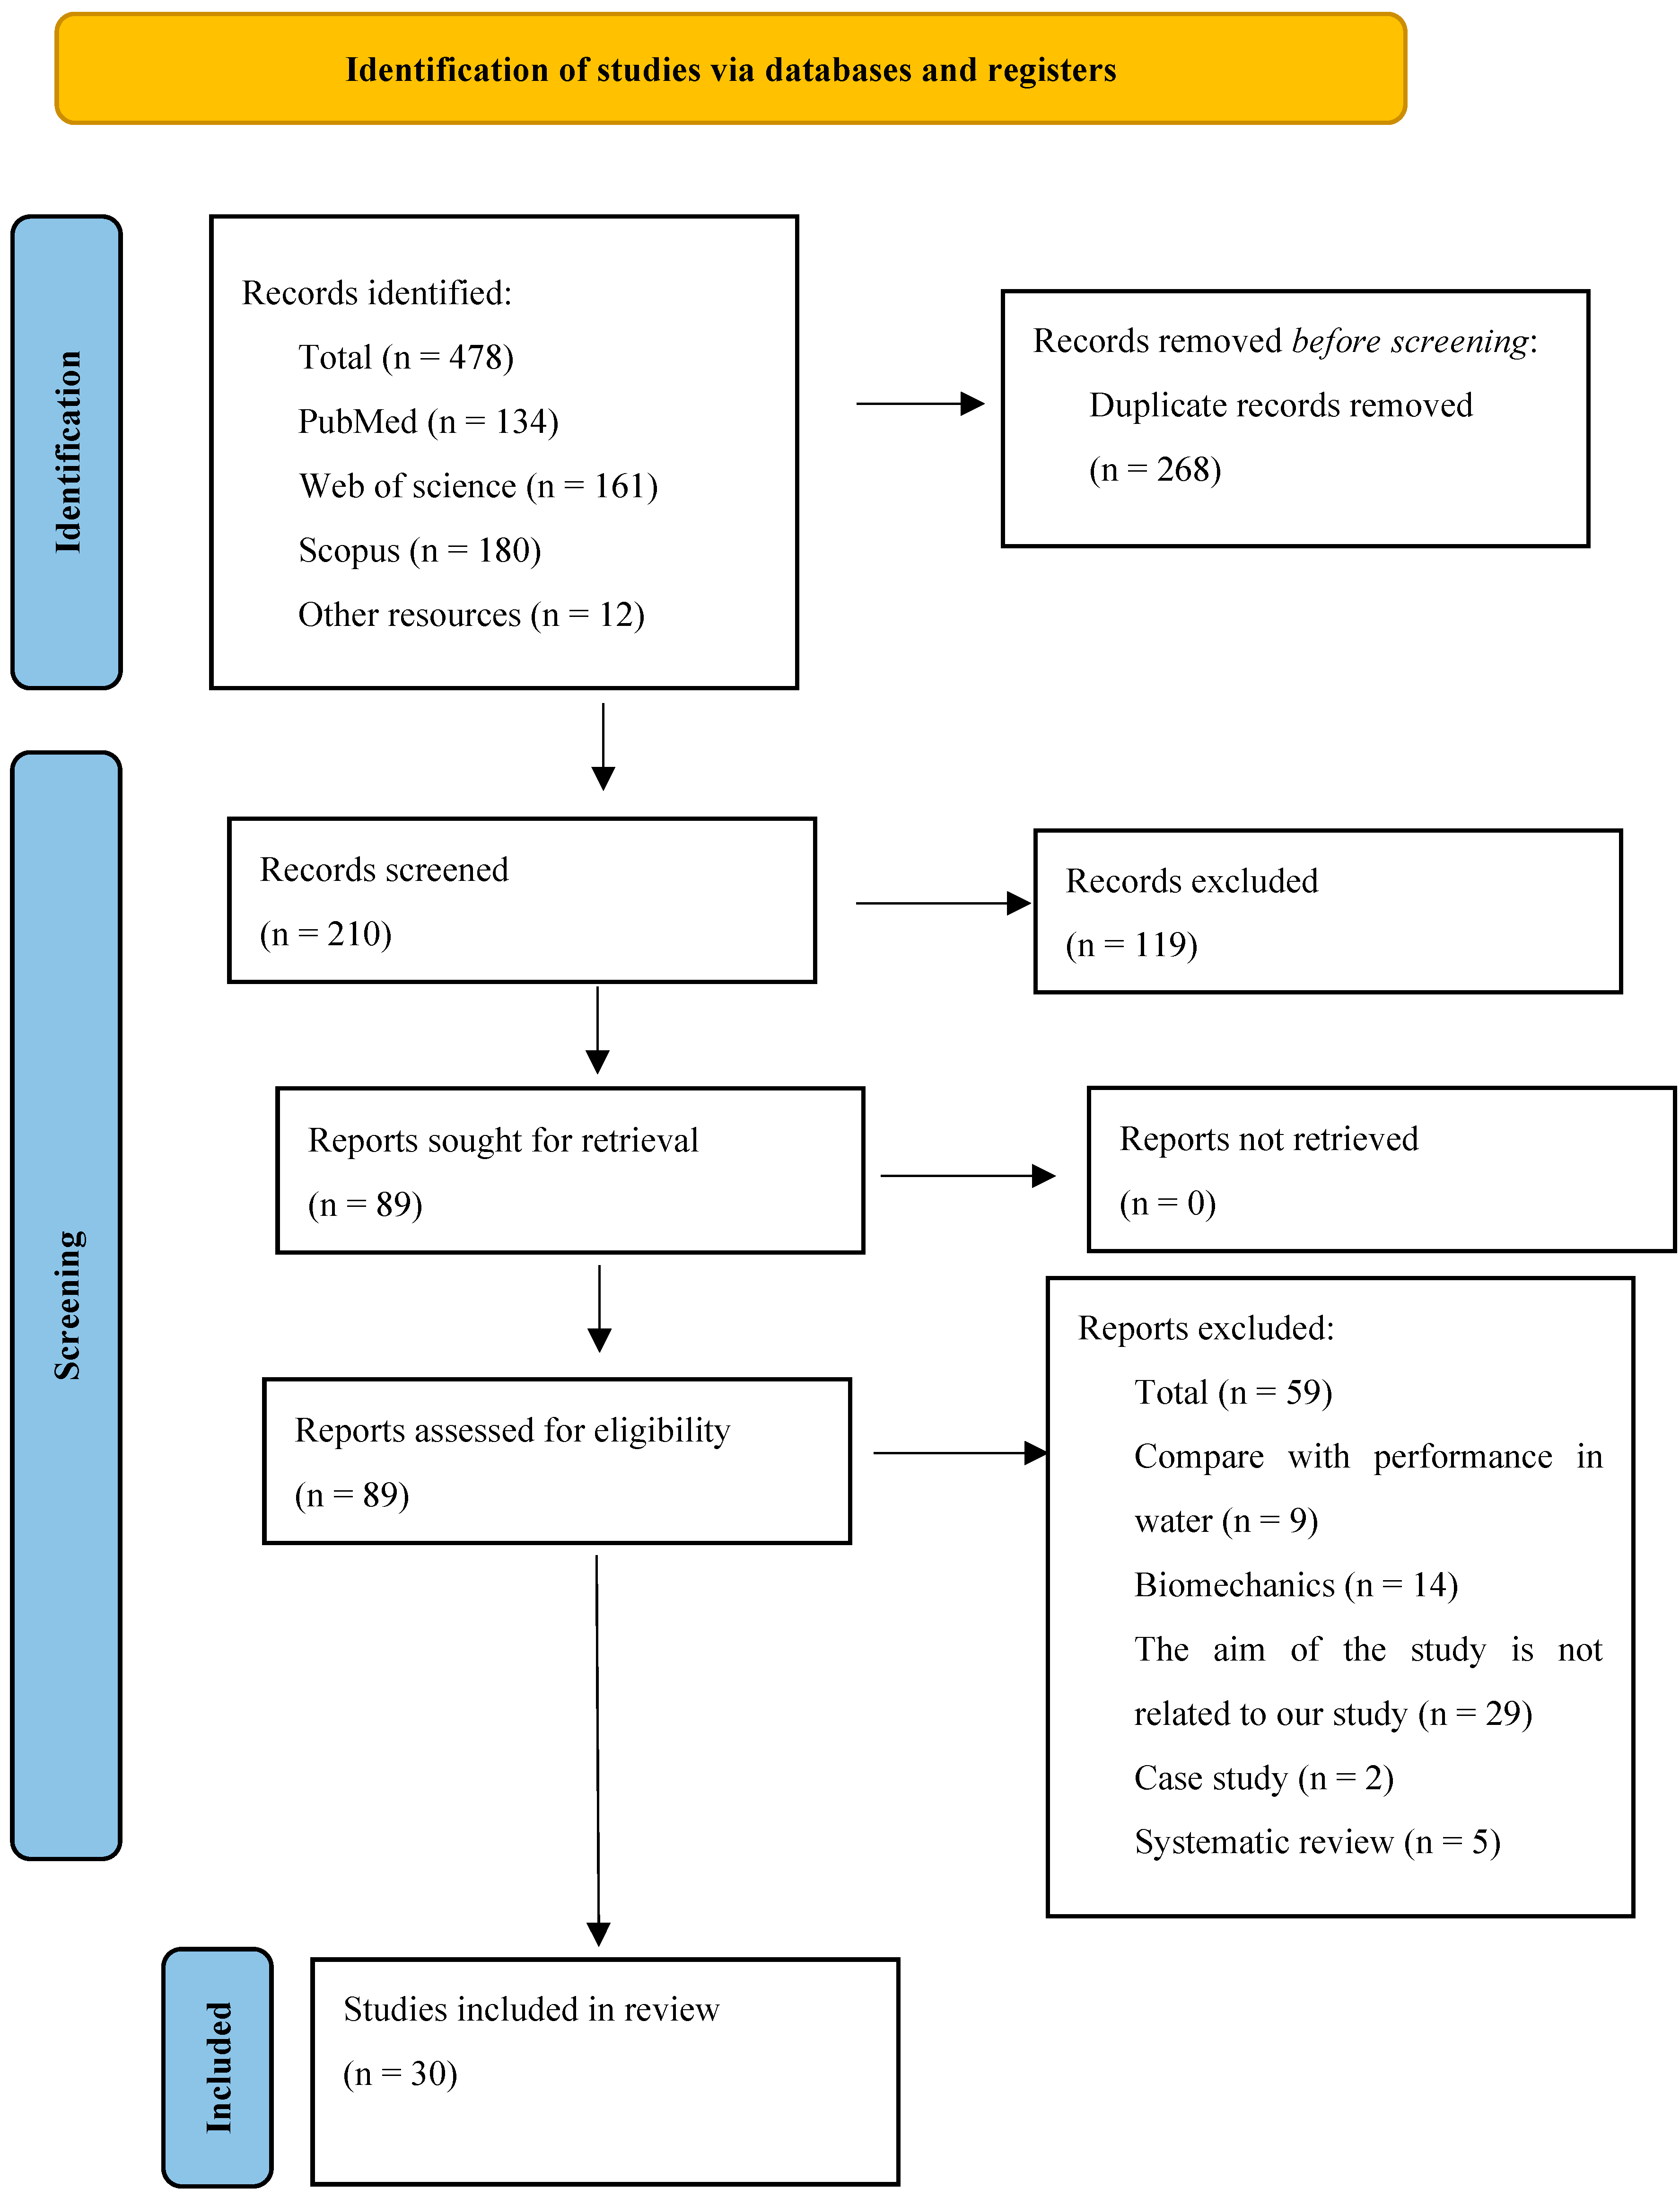
Table 1.
Participant characteristics and aim(s) of the studies on the physical evaluation with rowing ergometer.
Table 1.
Participant characteristics and aim(s) of the studies on the physical evaluation with rowing ergometer.
| Author | Year | Number of participants |
Rowers Classification |
Age | Aim (s) of the study | |
| Male | Female | |||||
| Cosgrove et al. [28] | 1999 | 13 | Class C | 19.9 ± 0.6 | Examine the relationship between selected physiological variables and rowing performance as determined by a 2,000-m time-trial. | |
| Gillies and Bell [29] | 2000 | 10 | 22 | Class C | 22 ± 5 | Examine the physiological requirements of a simulated 2,000-m rowing trial to determine if this relationship differs between genders. |
| Ingham et al. [1] | 2002 | 19 HWT and 4 LWT | 13 HWT and 5 LWT | Class A | 25.8 ± 4.1 | Examine the aerobic and anaerobic determinants of performance during 2,000-m of rowing on an ergometer. |
| Riechman et al. [12] | 2002 | 12 | Class C | 21.3 ± 3.6 | Develop a model to predict 2,000-m indoor rowing performance time from sprint performance. | |
| Bourdin et al. [26] | 2004 | 31 HWT | Class B | 23 ± 3.7 | Test the hypothesis that power peak is an overall index of rowing performance and study the influence of selected physiological variables. | |
| 23 LWT | 22.6 ± 3.7 | |||||
| Messonnier et al. [37] | 2004 | 9 | Class A | 22 ± 3 | Relate rowing performance and associated physiological variables and investigate the specificity of the training intensity on these variables. | |
| 12 | Class C | |||||
| Bourdon et al. [25] | 2009 | 2 | 8 | Class A | 20.9 ± 2.1 | Determine whether incremental exercise and a 2,000-m time trial could be combined into a single test without affecting the validity of the blood lactate threshold and/or performance data collected. |
| Mikulic [9] | 2009 | 25 | Class A | 22.2 ± 4.8 | Examine the anthropometric and metabolic determinants of performance during 6,000-m of rowing on an ergometer. | |
| Shimoda et al. [30] | 2009 | 16 | Class C | 20.7 ± 0.9 | This prompted us to suppose dependence on stroke consistency, aerobic capacity, leg extension power and rowing performance. | |
| Izquierdo-Gabarren et al.[17] | 2010 | 24 | Class B | 28 ± 5 | Examine which one of the performance factors would be able to differentiate rowers at different standards in traditional rowing and determine the best predictors of traditional rowing performance. | |
| 22 | Class C | 23 ± 4 | ||||
| Author | Year | Number of participants |
Rowers Classification |
Age | Aim (s) of the study | |
| Male | Female | |||||
| Kendall et al. [31] | 2011 | 19 | Class C | 19.7 ± 1.4 | Assess the critical velocity test as a means of predicting 2,000-m performance and to study the effect of selected physiological variables. | |
| Cheng et al. [20] | 2012 | 18 | Class C | 17.7 ± 1.9 | Determine the test-retest reliability of the 3-minute all-out rowing test and the differences between traditional CP tests. | |
| Ingham et al. [19] | 2013 | 4 HWT and 6 LWT |
4 HWT and 4 LWT | Class C | 23.3 ± 3.1 | Examine the relationship between parameters derived from both an INCR in relation to 2,000-m ergometer rowing performance. |
| Akça [10] | 2014 | 38 | Class C | 20.1 ± 1.2 | Develop different regression models to predict 2,000-m rowing ergometer performance. | |
| Cataldo et al. [13] | 2015 | 20 | Class C | 15.2 ± 1.3 | Evaluate the relationship between the mean power during the 20-s all-out test rowing ergometer test and the 2,000-m indoor rowing performance. | |
| Otter et al. [32] | 2015 | 24 | Class C | 23 ± 1 | Assess the predictive value of the Submaximal Rowing Test on 2,000-m ergometer rowing time in competitive rowers | |
| Maciejewski et al. [11] | 2016 | 14 | Class C | 15.3 ± 0.6 | Determine whether anaerobic performance assessed from a 30-s all-out test could account for the 1,500-m rowing performance. | |
| Bourdin et al. [18] | 2017 | 43 HWT | Class B | 21.9 ± 3.7 | Point out the predictive factors of physical performance in high-level female rowers and evaluate whether the relative influence of these factors is like that observed in males. | |
| 27 LWT | 20.6 ± 2.9 | |||||
| Cerasola et al. [15] | 2020 | 15 | Class B | 15.7 ± 2.0 | Develop different regression models to predict 2,000-m rowing indoor performance time using VO2max and mean power established during a 60-s all-out test. | |
| Holmes et al. [16] | 2020 | 31 | Class C | 20.2 ± 1.1 | Examine the associations of CP from a three-minute all-out row test and peak power from the 1-Stroke with VO2peak, Wingate Test, 6,000-m and 2,000-m rowing ergometer test. | |
| Turnes et al. [33] | 2020 | 16 | 3 | Class C | 25.5 ± 10.6 | Identify the relationship between the mean PO of 2,000-m rowing ergometer performance with the peak PO obtained during an INCR, and verifying the possibility of achieving VO2max during a 2,000-m time trial and using the mean power of this test |
| Author | Year | Number of participants |
Rowers Classification |
Age | Aim (s) of the study | |
| Male | Female | |||||
| Da Silva et al. [8] | 2021 | 12 | Class B | 15.9 ± 1.0 | Develop a mathematical model capable of predicting 2,000-m performance from a 100-m maximal effort test. | |
| Jensen et al. [38] | 2021 | 7 | Class A | 25.4 ± 5.2 | (1) Compare VO2max measured in a 2,000-m test and a continuous INCR, (2) determine the linear relationship between mean power during 2,000-m and VO2max, (3) and determine the linear relationship between maximal PO measured in a continuous INCR and VO2max. | |
| Possamai et al. [7] | 2021 | 27 | Class C | 26 ± 13 | 1) Compare the intensities of maximal lactate steady state (MLSS) and CP in trained rowers 2) describe the relationship of MLSS with performances of 500-m, 1,000-m, 2,000-m and 6,000-m rowing ergometer time-trial tests | |
| 14 | Class B | |||||
| Cerasola et al. [14] | 2022 | 17 | Class B | 15.8 ± 2 | Investigate the relationship between the fixed-time 20-s and 60-s all-out tests and the fixed-distance 2,000-m indoor rowing performance. | |
| Huerta Ojeda et al. [34] | 2022 | 12 | Class C | 20.3 ± 1.6 | Describe and analyze the kinetics of ventilatory and mechanical parameters on the rowing ergometer. | |
| Huerta Ojeda et al. [35] | 2022 | 12 | Class C | 20.3 ± 1.6 | The main objective of this study was to determine the validity and reliability of the 6-min all-out test as a predictor of Maximal Aerobic Power (MAP). | |
| Mazza et al. [39] | 2023 | 10 | Class A | 23.3 ± 2.8 | Develop an equation that can be used to estimate VO2max in female rowers using the same INCR method. | |
| McGrath et al. [36] | 2023 | 11 | 20 | Class C | 25.5 ± 3.2 | The m-FTP equation could accurately predict rowing Functional Threshold Power (r-FTP) data in a more heterogeneous cohort of club-level male and female rowers |
Abbreviations: HWT, heavyweight; LWT, lightweight.
Table 2.
Distance and time test in rowing ergometer and the corresponding time or power variables.
| Author | Test | Power in W (Mean ± DS) | Time in s (Mean ± DS) | ||||||||
| Akça [10] | 1) 2,000-m | 2) Wingate Test | 2) 638 ± 41.80 | 1) 398.50 ± 20.11 | |||||||
| Bourdin et al. [26] | 1) 2,000-m | 1) 462.9 ± 36.8 | |||||||||
| Bourdin et al. [18] | 1) 2,000-m | 1) 275 ± 32 | |||||||||
| Bourdon et al. [25] | 1) 2,000-m | 1) 430.0 ± 7.3 | |||||||||
| Cataldo et al. [13] | 1) 2,000-m | 2) 20-s | 2) 501.7 ± 113.0 | 1) 425.0 ± 25.8 | |||||||
| Cerasola et al. [14] | 1) 2,000-m | 2) 60-s | 2) 476.1 ± 91.0 | 1) 417.1± 21.8 | |||||||
| Cerasola et al. [15] | 1) 2,000-m | 2) 20-s | 3) 60-s | 2) 525.1 ± 113.7 | 3) 476.1 ± 91.0 | 1) 418.5 ± 23.1 | |||||
| Cheng et al. [20] | 1) 3-min all-out | 1) EP: 269 ± 39 | |||||||||
| Cosgrove et al. [28] | 1) 2,000-m | 1) ? | |||||||||
| Da Silva et al. [8] | 1) 2,000-m | 2) 100-m | 1) 235.9 ± 29.0 | 2) 376.9 ± 62.7 | |||||||
| Gillies and Bell [29] | 1) 2,000-m | 1) 475.1 ± 7.4 | |||||||||
| Holmes et al. [16] | 1) 2,000-m | 2) 6,000-m | 3) 3-min all-out | 3) EP: 232.61 ± 31.27 | 1) 444.96 ± 10.83 2) 1432.73 ± 35.71 | ||||||
| Huerta Ojeda et al. [34] | 1) 2,000-m | 1) 431.4 ± 12.7 | |||||||||
| Huerta Ojeda et al. [35] | 1) 6-min | 1) 289.83 ± 20.91 | |||||||||
| Ingham et al. [1] | 1) 2,000-m | 1) ? | |||||||||
| Ingham et al. [19] | 1) 2,000-m | 1) 346.5 ± 75.5 | |||||||||
| Izquierdo-Gabarren et al. [17] | 1) 2,000-m | 2) 6-min | 2) 272.69 ± 30 | 1) 386 ± 10.47 | |||||||
| Author | Test(s) | Power in W (Mean ± DS) | Time in s (Mean ± DS) | ||||||||
| Jensen et al. [38] | 1) 2,000-m | 1) 333 ± 69 | |||||||||
| Kendall et al. [31] | 1) 2,000-m | 1) 467.6 ± 17.8 | |||||||||
| Maciejewski et al. [11] | 1) 1,500-m | 2) Wingate Test | 1) 279.7 ± 49.1 | 2) 429.2 ± 92. | |||||||
| Mazza et al. [39] | 1) 2,000-m | 1) ? | |||||||||
| McGrath et al. [36] | 1) 6-min | 1) 230 ± 64 | |||||||||
| Messonnier et al. [37] | 1) 2,000-m | 1) MP: 432 ± 12 | |||||||||
| Mikulic [9] | 1) 6,000-m | 1) 1195.4 ± 36.1 | |||||||||
| Otter et al. [32] | 1) 2,000-m | 1) 389 ± 14 | |||||||||
| Possamai et al. [7] | 1) 2,000-m | 2) 6,000-m 3) 500-m 4) 1,000-m | 1) 317 ± 38 | 2) 258 ± 28 | 3) 499 ± 47 | 4) 372 ± 40 | |||||
| Riechman et al. [12] | 1) 2,000-m | 2) Wingate Test | 2) 368 ± 60.0 | 1) 466.8 ± 12.3 | |||||||
| Shimoda et al. [30] | 1) 2,000-m | 1) 409.3 ± 1.2 | |||||||||
| Turnes et al. [33] | 1) 2,000-m | 1) 284.2 ± 49.9 | |||||||||
Abbreviations: EP, End Power (last 30 seconds mean power).
Table 3.
Most important variables of the INCR and main results of the studies.
| Author | INCR | Main findings | |
| Maximal Power | VO2max | ||
| Akça [10] | Wingate mean power correlated with 2,000-m time (r = -0.796; p<0.01) | ||
| Bourdin et al. [26] | INCR disc. | Peak power in INCR correlated with 2,000-m mean power (r =0,92; p<0.0001), VO2max correlated with 2,000-m mean power (r = 0.84; p<0.0001) and with INCR peak power (r = 0.84; p < 0.0001) | |
| 441.6 ± 33.9 W | 5.68 ± 0.32 L/min | ||
| Bourdin et al. [18] | INCR disc. | Peak power in INCR correlated with 2000-m mean power (r = 0.88; p < 0.001), VO2max correlated with 2000-m performance (r = 0.83; p<0.001) and with INCR peak power (r = 0.81; p < 0.001) | |
| 278 ± 29 W | 3.68 ± 0.30 L/min | ||
| Bourdon et al. [25] | INCR disc. | 2,000-m mean power correlated with INCR disc. VO2max (r = 0.99; p = 0,22) | |
| MP: 286.7 ± 16.8 | 4.23 ± 0.22 L/min | ||
| Cataldo et al. [13] | INCR cont. | 2000-m mean power correlated with 20-s mean power (r = -0.947; p<0.001) VO2max correlated with 2000-m mean power (r = -0.884; p<0.0001) | |
| ? | 4.62 ± 0.66 L/min | ||
| Cerasola et al. [14] | INCR cont. | 2000-m mean power correlated with 60-s mean power (r = -0.943; p<0.0001) and with VO2max (r = -0.761; p<0.0001) | |
| ? | 4.66 ± 0.84 L/min | ||
| Cerasola et al. [15] | 2000-m mean power correlated with 60-s mean power (r = -0.914; p<0.0001) and 20-s mean power (r = -0.920; p< 0.0001) | ||
| Cheng et al. [20] | INCR disc. (CP test) | 3-min all-out correlated with Critical Power (r =0.745; p < 0.05), 3-min all-out correlated with VO2max (r=0.664, p<0.05) | |
| ? | ? | ||
| Cosgrove et al. [28] | INCR disc. | VO2max correlated with 2,000-m velocity (r =0.85; p<0.001); PO at lactate threshold correlated with 2,000-m velocity (r=0.73; p<0.004) | |
| ? | ? | ||
| INCR cont. | |||
| ? | 4.5 ± 0.4 L/min | ||
| Da Silva et al. [8] | 100-m mean power correlated with 2000-m mean power (r = 0.734; p=0.006) | ||
| Author | INCR | Main findings | |
| Maximal Power | VO2max | ||
| Gillies and Bell [29] | INCR cont. | 2,000-m time correlated with VO2max (r =0.96, p<0.05) and with PO at VO2max (r=0.83; p<0.05) | |
| ? | 3.52 ± 0.84 L/min | ||
| Holmes et al. [16] | 3-min mean power correlated with 6,000-m time (r=-0.62; p<0.001) and 2000-m time (r=-0.61; p<0.001), 1 maximal stroke power correlated with 6000-m time (r=-0.63; p<0.001) and 2000-m time (r=-0.62; p<0.001) | ||
| Huerta Ojeda et al. [34] | INCR cont. | VO2max in INCR and 2000-m have high correlation (p<0.05) | |
| PO at VO2max: 334.7 ± 20.2 |
4.07 ± 0.26 L/min | ||
| Huerta Ojeda et al. [35] | INCR cont. | VO2max in INCR correlated with 6-min VO2max (p=0.16), maximal aerobic power correlated with de PO at VO2max in 6-min test (p=0.0001) and Mean Power (p=0.004) | |
| PO at VO2max: 325.54 ± 39.82 W |
4.09 ± 0.26 L/min | ||
| Ingham et al. [1] | INCR disc. | 2000-m performance correlated with power of 5 Maximal Strokes (r=0.95; p<0.001) with VO2max (r=0.93; p<0.001) and with the power in 4 mmol/L of the INCR (r=0.92; p<0.001) | |
| ? | |||
| Ingham et al. [19] | INCR disc. | 2,000-m power correlated with INCR cont. Maximum minute power (r = 0.98; p<0.05), VO2max correlated with the power associated with VO2max in INCR disc. (r = 0.90; p<0.05) and VO2max of INCR cont. (r = 0.88; p<0.05) | |
| PO at VO2max: 285.0 ± 44.5 W |
4.62 ± 0.82 L/min | ||
| INCR cont. | |||
| MMP: 352.0 ± 68.2 | 4.67 ± 0.85 L/min | ||
| Izquierdo-Gabarren et al. [17] | INCR disc. | Power at 4 mmol/L correlated with 20-min (r = 0.65; p<0.01) and with 10 maximal strokes power (r = 0.5; p<0.05) | |
| PO at 4 mmol/L: 253.2 ± 34 |
|||
| Jensen et al. [38] | INCR disc. | 2,000-m mean power correlated with INCR disc. Maximum power (p<0.001) and 2,000-m VO2max correlated with INCR disc. VO2max (p=0.51) | |
| 350 ± 65 W | 4.81 ± 0.78 L/min | ||
| Kendall et al. [31] | INCR cont. | 2000-m performance correlated with critical velocity (r=0.886; p<0.001) and VO2max correlated with 2000-m performance (r=-0.923, p<0.001) | |
| 261 ± 27 | 3.14 ± 0.31 L/min | ||
| Author | INCR | Main findings | |
| Maximal Power | VO2max | ||
| Maciejewski et al. [11] | Wingate mean power correlated with 1,500-m mean power (r = 0.83; p<0.0001) | ||
| Mazza et al. [39] | INCR disc. | Predicted and measured VO2max had a high correlation in female rowers (r = 0.97; p<0.001) | |
| T: 843 ± 57 s | 3.50 ± 0.60 L/min | ||
| McGrath et al. [36] | INCR disc. | The estimated FTP with INCR disc. test correlated with calculated in a 20-min test (r=0.98) | |
| PP: 286 ± 77 | ? | ||
| Messonnier et al. [37] | INCR disc. | INCR disc. test power correlated with 2,000-m mean power (r = 0.73; p < 0.001) and INCR disc. test VO2max correlated with 2,000-m VO2max (r = 0.54, p < 0.01) | |
| ? | 5.32 ± 0.14 L/min | ||
| Mikulic [9] | INCR disc. | INCR disc. power at VO2max and 6000-m power at VO2max (r = -0.732; p < 0.01) and INCR disc. power and 6,000-m time (r = -0.484, p < 0.05) | |
| PO at VO2max: 423.8 ± 38.1 |
5.50 ± 0.30 L/min | ||
| Nevill et al. [41] | The 2,000-m performance have correlation with VO2max (r=0.94), power at VO2max (r = 0.96) and 5 maximal strokes peak power (r = 0.94) | ||
| Otter et al. [32] | INCR cont. | The SmRT was able to accurately predict 2,000-m rowing time when performed on an indoor rowing ergometer. Stage 1 power (70% of HRmax) with 2,000-m (r = -0.73), Stage 2 power (80% of HRmax) with 2,000-m (r = -0.85) and Stage 3 power (90% of HRmax) with 2,000-m (r = -0.93). | |
| 290 ± 44 W | 5.3 ± 0.4 L/min | ||
| Possamai et al. [7] | INCR disc. | Critical power correlated with MLSS (p<0.001). 500-m mean power with MLSS (r = 0.65), 1,000-m mean power with MLSS (r = -0.86), 2,000-m mean power with MLSS (r = 0.78) and 6,000-m mean power with MLSS (r = 0.39) | |
| 308 ± 37 W | 4.19 ± 0.39 L/min | ||
| INCR cont. | |||
| 311 ± 35 W | 4.08 ± 0.47 L/min | ||
| Riechman et al. [12] | INCR disc. | Wingate mean power correlated with 2,000-m mean power (r = -0.870; p < 0.001) INCR disc. power at LT correlated with 2,000-m mean power (r = -0.822; p < 0.001) and INCR disc. VO2max correlated with 2,000-m mean power (r = 0.502) | |
| PO at LT: 138 ± 27.2 | 3.18 ± 0.35 L/min | ||
| Shimoda et al. [30] | INCR cont. | VO2max correlated with 2000-m time (r = - 0.61; p = 0.012) | |
| ? | 4.1 ± 0.4 L/min | ||
| Turnes et al. [33] | INCR disc. | INCR disc. peak power correlated with 2,000-m mean power (r = 0.978; p < 0.01) and INCR disc. VO2max correlated with 2,000-m mean power (r = 0.883; p < 0.01) | |
| 284.8 ± 44.7 | 4.61 ± 0.62 L/min | ||
Table 4.
Number and distribution of tests included in the present review.
| Type of test | ||
| Distance [2,000-m] | n=30 [23] | |
| INCR | Discontinuous | n=16 |
| Continuous | n=11 | |
| Time | n=12 | |
| Maximal Strokes | n=3 | |
Disclaimer/Publisher’s Note: The statements, opinions and data contained in all publications are solely those of the individual author(s) and contributor(s) and not of MDPI and/or the editor(s). MDPI and/or the editor(s) disclaim responsibility for any injury to people or property resulting from any ideas, methods, instructions or products referred to in the content. |
© 2025 by the authors. Licensee MDPI, Basel, Switzerland. This article is an open access article distributed under the terms and conditions of the Creative Commons Attribution (CC BY) license (http://creativecommons.org/licenses/by/4.0/).
Copyright: This open access article is published under a Creative Commons CC BY 4.0 license, which permit the free download, distribution, and reuse, provided that the author and preprint are cited in any reuse.


