
Submitted:
28 September 2025
Posted:
11 October 2025
You are already at the latest version
Abstract
Canady Helios Cold Plasma (CHCP) system has emerged as a promising modality for cancer therapy, offering selective tumor cell death while sparing surrounding healthy tissue. The CHCP system, a Cold atmospheric plasma (CAP) technology, creates reactive oxygen and nitrogen species via plasma treated electromagnetic fields (PTEFTM) producing irreversible electroporation (IRE). In this study, we evaluated CHCP-induced IRE across four biologically distinct breast cancer cell lines: triple-negative (MDA-MB-231 and Hs578T), ER⁺/PR⁺/HER2⁻ (MCF-7), and ER⁺/PR⁺/HER2⁺ (BT-474). Membrane permeability was quantified via propidium iodide (PI) uptake following 5-minute exposures at 25 V (~1675 V/cm PTEF) and 30 V (~2010 V/cm). CHCP induced voltage and time dependent IRE at 30 V produced robust and sustained PI uptake across all lines, compared to 25 V at temperatures ranging from 22-240 C. Morphological analyses revealed membrane blebbing, cell shrinkage, and detachment consistent with IRE and oxidative stress. Functional studies demonstrated CHCP-mediated intracellular delivery of siRNA targeting BCL2A1 and suppression of clonogenic potential, confirming pore formation sufficient for macromolecular transport. Ex vivo treatment of tumor margins from our Phase I clinical trial (NCT04267575) specimens corroborated selective tumor cell death while preserving non-cancerous cell integrity. The authors are the first to demonstrate CHCP as a non-thermal (240 C), non-contact plasma-based IRE platform which induce controlled membrane permeabilization and selective cancer cell death. CHCP offers a translational strategy to eradicate residual tumor cells at the surgical margins, and prevent local recurrence, positioning it as a versatile adjunct in precision surgical oncology.
Keywords:
plasma treatment electromagnetic fields (PTEFTM)
; irreversible electroporation (IRE)
; breast cancer
; cold atmospheric plasma
; cancer treatment
; surgical margin treatment
; non-contact
; non-thermal (240 C)
1. Introduction
Irreversible electroporation (IRE) is a non-thermal tumor ablation technique that induces nanoscale pores in the plasma membrane, disrupting cellular homeostasis and leading to cell death while preserving extracellular matrix and vascular structures [1]. Conventional IRE systems, such as NanoKnife and Galvanize Knife, deliver high-voltage pulses via direct electrode insertion, which can produce thermal effects and carry procedural risks, including venous thrombosis, biliary complications, gastrointestinal injuries, and rectal fistula, depending on the tumor location [2,3,4]. Moreover, histologic and imaging studies provide only indirect evidence that NanoKnife or similar platforms achieve true non-thermal IRE, highlighting the need for alternative modalities that combine precision, safety, and mechanistic clarity [5]. Traditional thermal-based surgical and ablative modalities also pose risks of collateral tissue damage and delayed healing [6], emphasizing the importance of developing approaches that selectively target malignant cells while sparing surrounding normal tissue.
Cold atmospheric plasma (CAP) has rapidly emerged as a transformative modality in cancer therapy, offering a non-thermal approach through the generation of reactive oxygen and nitrogen species (RONS) that selectively target malignant cells [7]. Over the past decade, our group has pioneered both the preclinical and clinical translation of CAP technologies, culminating in the development of the Canady Helios Cold Plasma (CHCP) system, the first FDA-approved CAP device(K240297) in the United States for intraoperative use [8,9,10,11]. Preclinical studies have demonstrated CAP’s ability to induce apoptosis, disrupt cell cycles7, and inhibit proliferation in a variety of cancer cell types, including breast [9], head and neck [12], colon, glioblastoma [13], and soft tissue sarcoma [8], while sparing normal tissue. The first Phase I clinical trial of CHCP for advanced solid tumors (NCT04267575) established safety and feasibility, with evidence of effective margin sterilization, exceptional local regional recurrence control, and promising survival outcomes without adverse effects [14]. Previous studies showed that applying gas plasma increased the membrane permeability, allowing macromolecules to enter cells and disrupt homeostasis [15]. While conventional IRE relies solely on direct electrode-delivered pulses [16], CHCP integrates a high frequency electric charge with an inert gas which creates a localized Plasma Treated Electromagnetic Field (PTEFTM) that includes reactive oxygen and nitrogen species including Hydrogen peroxide (H2O2), Atomic oxygen (O- ),Ozone (O3),Singlet oxygen (1O2), Superoxide anion (O⋅−2),Carbonate radicals (CO3⋅−),Nitric oxide (NO⋅),Nitrogen dioxide (NO2⋅),Nitrite (NO2−),Nitrate (NO3−),Peroxynitrite (ONOO−) and Peroxynitric acid (ONOOH) [14,17]. PTEF provides a quantitative, reproducible framework for assessing membrane permeabilization during plasma treatment, distinguishing CHCP from tumor treating fields (TTF) and electrode-based IRE platforms. Notably, CHCP offers a non-contact, non-thermal, and controllable method for inducing IRE, enabling selective targeting of microscopic cancer cells while preserving surrounding normal tissue.
In this study, we systematically investigate CHCP-induced PTEF-mediated IRE across four biologically distinct breast cancer cell lines: triple-negative (MDA-MB-231, Hs578T), ER⁺/PR⁺/HER2⁻ (MCF-7), and ER⁺/PR⁺/HER2⁺ (BT-474). Using propidium iodide (PI) uptake as a sensitive marker of membrane integrity, we quantify field-strength and time dependent responses to CHCP treatment. PI is a membrane impermeant dye that fluoresces upon binding nucleic acids, providing a direct readout of membrane permeabilization and IRE induced cell death. We further demonstrate functional effects of CHCP induced electroporation, that includes intracellular delivery of small interfering RNA (siRNA) targeting the anti-apoptotic gene BCL2A1. We also showed that CHCP induced IRE by suppression of clonogenic potential of breast cancer cell lines. Moreover, morphological analyses of breast cancer cells and pathological analysis of patient tumor samples demonstrated selective induction of tumor cell death after CHCP treatment. Together, these findings establish CHCP induced PTEF as a novel, non-thermal (240 C), and non-contact IRE (NTNC-IRETM)platform for selective IRE based cancer therapy, with significant translational effect for selective tumor cell death at surgical margin and recurrence prevention.
2. Materials and Methods
2.1. Cold Plasma Device
The Canady Helios Cold Plasma (CHCP) XL-1000 CP System was used for performing all experiments at Jerome Canady Research Institute for Advanced Biological and Technological Sciences (JCRI-ABTS), Takoma Park, MD, USA. Briefly, the CHCP XL-1000CP device (FDA cleared in 2024) integrates the high-frequency power generator, helium gas regulation system, and timer functions into a single unit. The system delivers an output voltage of up to 6 kV at a frequency of approximately 300 kHz with a power output of less than 40 W. The CHCP system is designed to operate with the FDA-cleared Canady Helios Cold Plasma Ablator, a disposable handpiece used for the ablation of tumor tissue. Details and schematics on plasma generation by CHCP used in this study is shown in Figure 1. The helium flow rate was set to a constant 3 L/min and the power was set to 25V (~1675 V/cm PTEF) and 30V (~2010 V/cm PTEF). The plasma scalpel tip was placed 1.5 cm above the surface of the cell media and remained unmoved for the duration of the treatment. The CAP treatment was performed in a laminar airflow tissue culture hood, Purifier Logic + Class II, Type A2 Biosafety Cabinet (Labconco, Kansas City, MO, USA) at room temperature.
2.2. Definition and Calculation of Plasma Treated Electromagnetic Field (PTEFTM)
To quantitatively characterize the electrical component of CHCP treatment, we define the Plasma Treated Electromagnetic Field (PTEFTM) as the effective electric field strength generated between the CHCP central electrode and the return ground pad beneath the cell culture. PTEF field strength was calculated using the following equation:
where is the input voltage supplied by the CHCP XL-1000 CP generator, is the voltage conversion coefficient (experimentally determined as 100), and D is the fixed distance between the plasma electrode tip and the cell culture surface (1.5 cm in this study). It should be noted that the reported values represent average electric field strengths; the peak electric field may be higher18.
| Input Setting Voltage (V) | PTEF Field Strength (V/cm) |
| 15 V | ~1005 V/cm |
| 20 V | ~1340 V/cm |
| 25 V | ~1675 V/cm |
| 30V | ~2010 V/cm |
A schematic illustration of PTEF (Figure 2) shows the relationship between the plasma electrode, target cells, and ground pad, with the field vector indicated by a blue arrow. This figure provides a visual definition of PTEF and its experimental geometry. The top is highlighting the Canady Helios Cold Plasma AblatorTM, the plasma beam directed toward the cell culture, the fixed distance (D), and the return ground. This diagram visually defines the PTEF as the spatially directed electric field vector that integrates both the localized electromagnetic field and the plasma-generated species to induce membrane permeabilization in target cells.
2.3. Cell Culture
Cell culture experiments were carried out as described previously. The human breast cancer cell line BT-474 was purchased from ATCC (Manassas, VA, USA). MCF-7, MDA-MB-231, and Hs578T were generously donated by Professor Kanaan’s laboratory at Howard University. All cell lines were cultured in Roswell Park Memorial Institute (RPMI) 1640 Medium supplemented with 10% fetal bovine serum (Sigma-Aldrich, St. Louis, MO, USA) and 1% Pen Strep (Thermo Fisher Scientific, Waltham, MA, USA) in a 37 °C and 5% CO2 humidified incubator (Thermo Fisher Scientific, Waltham, MA, USA). When cells reached approximately 80% confluence, cells were seeded at a concentration of 105 cells/well into 12-well plates (USA Scientific, Ocala, FL, USA) with a 1 mL media volume per well for all experiments.
2.4. Treatment Protocol
Cells were directly treated with CHCP at 15V, 20V, 25V (~1675 V/cm PTEF) and 30V (1005 - 2010 V/cm) for 5 minutes using helium as the carrier gas or with plasma-activated media (PAM). Helium-treated cells served as negative controls.
2.5. Electroporation Assay and Propidium Iodide Staining
Human breast cancer cell lines (Hs578T, BT-474, MCF-7, and MDA-MB-231) were seeded at a density of 1 × 10⁵ cells per well in 12-well tissue culture plates and incubated overnight at 37 °C in a humidified atmosphere containing 5% CO₂. Cells were treated with CHCP using a standardized system as explained above. Untreated and helium-only exposed cells served as controls. Post-treatment, cells were incubated for 0, 30, 60 and 120 minutes, followed by staining with propidium iodide (PI). PI uptake intensity, indicating membrane permeability, was quantified via fluorescence imaging and analyzed statistically (n=3 per condition). Briefly, the culture medium was removed, and cells were incubated with propidium iodide (PI; 1 - 5 μg/mL in phenol red-free RPMI medium) for 30 minutes at 37 °C, protected from light. PI selectively stains cells with compromised membranes by intercalating into DNA, emitting fluorescence upon binding (excitation: 535 nm; emission: 617 nm). After incubation, cells were gently washed with phosphate-buffered saline (PBS) to remove unbound dye and subsequently fixed with 4% paraformaldehyde for 10 minutes or formalin for 5 minutes at room temperature. Cells were then washed again with PBS. Fluorescence intensity was quantified using a microplate reader equipped with appropriate filters (excitation at 535 nm and emission at 617 nm) (BioTek Synergy HTX (Winooski, VT, USA)). The fluorescence signal corresponds to the proportion of membrane-compromised cells. Fluorescence data from treated and control groups were analyzed to assess plasma-induced membrane permeability. Statistical significance was determined using appropriate tests (e.g., Student’s t-test or ANOVA), with p-values < 0.05 considered significant. Data was plotted by Microsoft Excel 2024 (Redmond, WA, USA) as mean ± standard error of the mean.
2.6. Transfection of siRNA
Human BCL2A1 targeting MISSION® esiRNA and matching scrambled control esiRNA were purchased from Sigma-Aldrich. Scrambled control esiRNA that does not target any gene was used as the negative control siRNA. MCF-7, MDA-MB-231 and Hs578T cell were transfected with siRNA after 30 mins following CHCP treatment. Transfection of BCL2A1 esiRNA or control esiRNA was done at 13 pmol. Cells were seeded in a 12-well-plate at a density of 1 × 10⁵ cells/well overnight in (RPMI) 1640 Medium supplemented with 10% fetal bovine serum (Sigma-Aldrich, St. Louis, MO, USA) and 1% Pen Strep (Thermo Fisher Scientific, Waltham, MA, USA) in a 37 °C and 5% CO2 humidified incubator. After 24 hours cells were treated with CHCP as explained above and after 30 mins of incubation the media was replaced with 1 mL of antibiotics-free medium RPMI mixed with esiRNA at the required concentration of 13 pmol/mL and were incubated at 6 hours and total RNA was isolated from the cells.
2.7. Quantitative Real-Time RT-PCR
Total RNA was extracted from MCF-7, MDA-MB-231 and Hs578T cell pellets using the TRI reagent and Direct-sol MiniPrep kit (Zymo Research) with DNAse treatment according to the manufacturer's instructions. First-strand cDNA was synthesized with 1 μg of total RNA from these cells using Transcriptor First Strand cDNA Synthesis Kit (Roche Applied Science). Real-time RT-PCR reactions were performed according to the MIQE Guidelines. Quantitative PCR was performed using 1 µL (diluted 1:20 using PCR grade water) of first strand cDNA under the conditions of 95 °C for 15 s, annealing at 60 °C for 60 s, extension at 72 °C for 30 s for 40 cycles, and a final extension at 72 °C for 10 min using SYBR Green Master Mix (Applied Biosciences). Primer sequences for analyzing 18s RNA were used for normalization and relative mRNA expression was calculated with 2 − ΔΔCT method.
2.8. Plate Colony Formation Assay
MDA-MB-231, MCF-7, and Hs578T cells were seeded at a density of 1 × 10⁵ cells per well in 6-well culture plates and incubated for 24 hours under standard culture conditions (37 °C, 5% CO₂). Cells were subsequently treated with CHCP at voltages of 15 V, 20 V, 25 V, or 30 V for 5 minutes. Following treatment, cells were harvested at three different post-treatment incubation times (30, 60, and 120 minutes), diluted 1:1000 in fresh RPMI medium, and reseeded into 12-well plates to allow colony formation. After 7-10 days of incubation, colonies were fixed with 10% neutral-buffered formalin for 30 minutes and stained with 1% crystal violet for 15 minutes. Excess dye was removed by washing three times with phosphate buffered saline (PBS), and plates were air-dried at room temperature. Colony formation was quantified by counting visible colonies containing ≥50 cells under a light microscope. Colony numbers were recorded as mean ± SEM from three independent experiments.
2.9. Hematoxylin and Eosin (H&E) Staining of Tissue Specimens
Fresh tissue specimens, with or without ex vivo CHCP treatment, were fixed in 10% neutral-buffered formalin for 24-48 hours. Fixed tissues were dehydrated through a graded ethanol series, cleared in xylene, and embedded in paraffin wax. Serial sections of 6-7μm thickness were prepared using a microtome and mounted on glass slides. Sections were deparaffinized in xylene, rehydrated through descending ethanol concentrations, and subjected to standard H&E staining. Briefly, slides were stained with hematoxylin to visualize nuclei, differentiated in acid-alcohol, and counterstained with eosin to highlight cytoplasmic and extracellular components. Following staining, sections were dehydrated with ethanol, and cover slipped using a permanent mounting medium. Stained slides were examined under a light microscope (63× objective) to assess cellular morphology, tissue architecture, and pathological alterations, including plasma-induced cell death and membrane compromise.
2.10. Statistical Analysis
Data are presented as mean ± SEM. Comparisons between CHCP-treated and helium control groups were analyzed using Student’s t-test and one-way ANOVA followed by Post hoc Tukey’s tests. A p-value < 0.05 was considered statistically significant.
3. Results
3.1. CHCP Induces Voltage and Time Dependent Electroporation in Breast Cancer Cells
To evaluate the electroporation capability of CHCP across breast cancer subtypes, MDA-MB-231, MCF-7, Hs578T, and BT-474 cells were treated with CHCP at 25V (~1675 V/cm PTEF) and 30V (~2010 V/cm PTEF) for 5 minutes, and membrane permeability was quantified by propidium iodide (PI) uptake at 0, 30, and 60 minutes post-treatment. CHCP treatment induced voltage-dependent electroporation in MDA-MB-231 cells, as evidenced by PI uptake. At 30V (~2010 V/cm PTEF), membrane permeability was significantly elevated immediately (p < 0.016) and at 30 minutes (p < 0.020), with partial recovery observed by 60 minutes (p = 0.062). At 25 V, a stronger immediate response (p < 0.001) and sustained permeability at 30 minutes (p < 0.008) were observed (Figure 3).
In MCF-7 cells, 30V (~2010 V/cm PTEF) induced robust and sustained PI uptake across all time points (p < 0.0015, p < 0.0089, p < 0.013), while 25V (~1675 V/cm PTEF) caused a transient increase only at 0 minutes (p < 0.014), with no significant differences at 30 (p = 0.203) or 60 minutes (p = 0.168) (Figure 4).
Hs578T cells exhibited pronounced electroporation at 30V (~2010 V/cm PTEF), with significant PI uptake at 0 (p < 0.0030), 30 (p < 0.0105), and 60 minutes (p < 0.00014), whereas 25V (~1675 V/cm PTEF) induced moderate early permeability at 0 (p < 0.0087) and 30 minutes (p < 0.03) but returned to control levels by 60 minutes (p = 0.783) (Figure 5).
Similarly, BT-474 cells showed strong and sustained PI uptake at 30V (~2010 V/cm PTEF) (0, 30, and 60 minutes; p < 0.0005, p < 0.0010, p < 0.0001), while 25V (~1675 V/cm PTEF) elicited early and moderate increases at 0 (p < 0.0008) and 30 minutes (p < 0.0135), with recovery by 60 minutes (p = 0.273) (Figure 6).
Collectively, these data demonstrate that CHCP induces voltage- and time-dependent electroporation in breast cancer cells, with higher voltage producing robust and sustained membrane permeabilization and lower voltage eliciting transient effects. The variation in PI uptake kinetics across cell lines further indicates cell-type specific differences in membrane susceptibility. Even though the PI uptake seem to return to baseline observed by 60 minutes (p = 0.062) incubation in MDA-MB-231 cells is because of the reduction of cells in the CAP treated samples during cell washing process in the PI staining protocol. These results highlight the precise and reproducible nature of CHCP-induced electroporation.
3.2. Temperature Monitoring During CHCP Treatment
Temperature measurements were performed throughout CHCP treatment to assess potential thermal contributions to the observed biological effects. Across all voltages (15V, 20V, 25V, and 30V) for 5 minutes each, the temperature of the treated cell cultures ranged between 22 to 24 °C (Figure 7). These findings confirm that the IRE effect of CHCP, disrupting plasma membrane integrity, are attributable to a non-thermal mechanism inherent to PTEF.
3.3. CHCP-Induced Electroporation Facilitates Efficient BCL2A1 esiRNA Delivery and Gene Silencing
We have previously demonstrated that the anti-apoptotic gene BCL2A1 [19] is expressed following CHCP treatment. Leveraging this characteristic, we investigated the electroporation effects of CHCP by monitoring mRNA BCL2A1 expression and its silencing by esiRNA. Breast cancer cell lines MDA-MB-231, MCF-7, and Hs578T were treated with CHCP at 15 V, 20 V, 25 V, and 30V (~2010 V/cm PTEF) for 5 minutes using a 3 L/min helium flow. Cells were CHCP treatment followed by transfection with either BCL2A1 esiRNA or control esiRNA (13 pmol) 30 minutes later. Total RNA was isolated after 6 hours of incubation, and BCL2A1 expression was quantified by qPCR. In MDA-MB-231 cells, BCL2A1 mRNA was significantly induced by 30V (~2010 V/cm PTEF) treatment and completely silenced in esiRNA-treated samples (p < 0.0056). In MCF-7 and Hs578T cells, BCL2A1 induction was observed at both 25V (~1675 V/cm PTEF) and 30V (~2010 V/cm PTEF) and was significantly silenced by esiRNA (MCF-7: 25 V, p < 0.013; 30V (~2010 V/cm PTEF), p < 5.8 × 10⁻⁶; Hs578T: 25 V, p < 4.9 × 10⁻⁴; 30V (~2010 V/cm PTEF), p < 0.02). Notably, no BCL2A1 expression was detected in any of the cell lines following 15 V or 20 V treatment. Collectively, these findings demonstrate that CHCP induces electroporation in a voltage-dependent manner, enabling BCL2A1 esiRNA to enter cells and effectively silence BCL2A1 mRNA expression (Figure 8).
3.4. Disruption of Plasma Membrane Integrity as a Mechanism for Inhibition of Colony Formation After Cold Plasma Treatment.
CHCP induced disruption of plasma membrane in turn leads to increased membrane permeability, uncontrolled ion fluxes, and oxidative damage to lipids and proteins, ultimately impairing the ability of cancer cells to maintain homeostasis. The downstream consequences include mitochondrial dysfunction, oxidative stress induced signaling, DNA damage, and activation of apoptotic pathways. As the colony formation assay measures the long-term clonogenic survival of individual cells, the loss of plasma membrane integrity following cold plasma exposure directly compromises the ability of treated cancer cells to proliferate and form colonies. Thus, the observed inhibition of colony formation after cold plasma treatment reflects the combined effects of membrane destabilization, loss of viability, and failure to sustain continuous division. We investigated the electroporation effects of CHCP by conducting colony formation in MDA-MB-231, MCF-7, and Hs578T breast cancer cell lines as described in the methods section (Figure 9).
A comprehensive statistical analysis of colony formation was performed across these cell lines (MDA-MB-231, MCF-7, and Hs578T) treated with cold plasma at voltages ranging from 15V to 30V, compared to Helium and non-treated controls. A total of 162 measurements (n = 3 per condition) were analyzed across three time points (30, 60, and 120 min). One-way ANOVA revealed highly significant treatment effects for all cell lines and time point combinations (p < 0.001), with F-statistics ranging from 33.3 to 742.1 (Table 1). Post hoc Tukey’s tests confirmed significant pairwise differences between voltage-treated groups and Helium controls (p < 0.05), indicating that inhibition of colony formation was specifically attributable to the voltage component of cold plasma exposure (Supplement Table 1A, 1B and 1C). Dose-response analysis demonstrated that higher voltages (25V and 30V) consistently produced the greatest reduction in colony formation across all cell lines, while 15V and 20V induced moderate but significant effects. Cell line specific differences were observed: Hs578T cells exhibited the highest baseline clonogenic potential, followed by MDA-MB-231 and MCF-7; however, MCF-7 displayed the greatest relative sensitivity to treatment. Temporal analysis showed peak efficacy at 60 minutes, with significant effects sustained at 120 minutes, suggesting both acute and prolonged treatment responses. The inhibition of colony formation is consistent with the irreversible electroporation effect induced by CHCP treatment, which disrupts plasma membrane integrity and abolishes the ability of cancer cells to sustain long-term proliferation. Collectively, these results demonstrate robust, dose- and time-dependent suppression of clonogenic survival across multiple breast cancer cell lines, validating the potential of irreversible electroporation mediated by CHCP.
3.5. CHCP Induced Morphological Changes Consistent with Irreversible Electroporation
Phase contrast microscopy images (Supplemental Figure 1, Figure 2 and Figure 3) revealed distinct morphological changes in breast cancer cells following CHCP treatment at 25 V and 30 V. In untreated Hs578T (ER⁻/PR⁻/HER2⁻) cells, membranes exhibited well-defined borders (black arrows), whereas treated cells displayed membrane blebbing and cell shrinkage within 1 h, indicative of oxidative stress (red arrows). Cells exposed to 25 V showed no recovery in morphology and detached from the plate by 24 h post-treatment, while those treated at 30 V detached as early as 6 h. Similar morphological patterns were observed in BT-474 (ER⁺/PR⁺/HER2⁺) cells, where CHCP treatment induced membrane blebbing and shrinkage by 1 h and subsequent detachment at 24 h (25 V) and 6 h (30 V). In MDA-MB-231 (ER⁻/PR⁻/HER2⁻) cells, blebbing and shrinkage were evident by 1 h, with detachment occurring at 6 h (25 V) and 4 h (30 V). No such changes were observed in the non-treated (NT) or Helium (He) control groups, confirming that the effects were specific to the voltage component of CHCP exposure. The progressive membrane blebbing, shrinkage, and detachment are consistent with irreversible electroporation and oxidative stress-mediated damage, which compromise plasma membrane integrity in a voltage and dose dependent manner. These results demonstrate that CHCP disrupts cellular homeostasis through non-thermal electroporation effects, ultimately leading to loss of viability and detachment in multiple breast cancer cell lines.
3.6. Ex Vivo Histopathology Reveals Selective Tumor Cell Death via CHCP-Induced Irreversible Electroporation in Human Solid Tumors
We re-examined and analyzed formalin-fixed paraffin-embedded (FFPE) tissue sections obtained from stage IV or recurrent solid tumors in patients enrolled in our recent Phase I clinical study (NCT04267575) [14]. Among the 12 patients included, 60% achieved R0 resection status. Tissue specimens were collected at the surgical margins (Zone 0), and resected samples were subjected to ex vivo CHCP treatment to evaluate localized effects on tumor and adjacent non-tumor tissue. Histopathological evaluation using hematoxylin and eosin (H&E) staining revealed selective CHCP-induced tumor cell death in the resected samples (Figure 10a and 10b). Morphological changes included compromised plasma membrane integrity, cellular swelling, and culminating in leakage of cellular contents. These features are consistent with an IRE mechanism, as observed in our in vitro studies where CHCP produced voltage-dependent membrane permeabilization across breast cancer subtypes. Importantly, CHCP-induced cytotoxic effects were confined to malignant cells within the treated margins, while adjacent structures including connective tissue, and vascular components remained largely preserved. There was no widespread necrosis or nonspecific collateral damage observed in the surrounding non-tumor regions. The results provide translational evidence that CHCP selectively targets tumor cells via NTNC-IRETM mechanisms in both preclinical models and clinical specimens.
4. Discussion
Irreversible electroporation (IRE) has been investigated for over two decades as a non-thermal method of tumor ablation, with foundational studies by Robinsky [20,21] who demonstrated its potential to increase plasma membrane permeability through externally applied electric fields. Conventional clinical platforms, such as NanoKnife [22] and Galvanize Knife [23], rely on direct electrode insertion to deliver high-voltage pulses, creating transient nanopores that induce cell death. However, these systems are invasive, can produce unintended thermal effects, and often lack direct evidence of non-thermal electroporation activity [2,3,4,24].
In contrast, the CHCP system induces electroporation through a combination of localized electromagnetic fields and reactive plasma species, enabling NTNC-IRETM-mediated membrane disruption. Our in vitro studies demonstrate that CHCP produces voltage and time dependent electroporation across multiple breast cancer subtypes. At higher PTEF values (~2010 V/cm, corresponding to 30 V), robust and sustained PI uptake was observed in MDA-MB-231, MCF-7, Hs578T, and BT-474 cells, whereas intermediate PTEF (~1675 V/cm, 25 V) resulted in only transient membrane permeability that largely resolved within 30 to 60 minutes. Notably, triple-negative Hs578T and HER2-positive BT-474 cells exhibited prolonged PI uptake at 30 V, while hormone receptor-positive MCF-7 cells returned to baseline PI intensity. The reduction of cells in the CHCP treated samples is due to the stained severely membrane compromised cells that are removed during the washing process in the PI assay protocol. The difference in PI uptake in these cell lines, is due to the membrane composition, cytoskeletal organization, and intrinsic repair mechanisms which modulate electroporation dynamics.
These results are corroborated by morphological analyses, which revealed voltage dependent membrane blebbing, cell shrinkage, and detachment. Cells treated at 30 V detached more rapidly (4 to 6 hours for MDA-MB-231 and Hs578T) compared to those treated at 25 V (24 hours), indicating irreversible electroporation with increasing voltage. No morphological changes were observed in untreated or helium-only controls, confirming that CHCP-induced effects are specifically driven by the applied electric field in combination with plasma-mediated oxidative stress.
Functionally, CHCP-mediated electroporation permits intracellular delivery of macromolecules. In vitro and in vivo studies have demonstrated that cold atmospheric plasma can successfully deliver plasmids, linear DNA, siRNA, and miRNA into multiple established cell lines various cell lines as well as into live mouse models [15]. Using BCL2A1 expression as a readout, we demonstrated that esiRNA delivery and subsequent gene silencing occurred only at higher PTEF levels (~1675-2010 V/cm), whereas lower voltages (~1005-1340 V/cm) were insufficient to induce RNA uptake. These findings establish a clear voltage threshold for stable pore formation and provide mechanistic evidence that CHCP can be used as a controlled biophysical tool for intracellular access. Our study corroborates with Experimental studies using dielectric barrier discharge (DBD) sources of CAP have shown that microsecond-pulsed plasma treatments induce robust and stable pore formation in biological membranes, similar to electroporation, significantly reducing transepithelial electrical resistance (TEER). This effect is power-density and voltage-dependent, with higher power microsecond DBDs producing more uniform and sustained permeabilization compared to nanosecond DBDs, which rely more on lipid oxidation mechanisms [25].
CHCP induced tumor cell death arises from the synergistic interplay of IRE and plasma generated RONS. IRE exploits tumor cell membrane vulnerabilities such as altered lipid composition, heightened metabolic stress, and depolarized resting potentials to achieve enhanced selectivity and efficacy in tumor ablation [26]. Tumor membranes, with disordered lipid organization and reduced stability, are more easily destabilized by electric fields, lowering the threshold for pore formation and promoting irreversible disruption. Depolarized potentials further reduce the critical field strength required for permeabilization, giving tumor cells greater susceptibility than normal cells [16]. In addition, metabolic stress and diminished repair capacity limit the ability of tumor membranes to reseal after pore formation, while ATP depletion and disrupted ionic gradients rapidly push cells toward apoptosis. The acidic and hypoxic tumor microenvironment further sensitizes malignant cells, amplifying the cytotoxic impact of electroporation and RONS. Meanwhile, RONS generated by cold plasma overwhelm the already fragile redox balance of tumor cells, driving lipid peroxidation, protein oxidation, mitochondrial collapse, and DNA damage. Clinical and experimental evidence confirms that these physicochemical vulnerabilities make tumor cells predictably more sensitive to IRE than surrounding healthy tissues, an effect supported by mathematical modeling of electric field thresholds [27].
In parallel, short-lived reactive species generated by plasma including hydroxyl radicals (∙OH), atomic oxygen (O∙), and hypochlorite (OCl⁻) synergize with the electric field to destabilize membranes [17,28]. These species trigger lipid peroxidation, altering fluidity and integrity of the bilayer, while also oxidizing membrane proteins and inactivating protective enzymes such as catalase [28]. Such oxidative modifications further weaken the tumor membrane and promote sustained pore formation. Direct physical contributions of plasma (electric fields and photons) act alongside chemical oxidation, producing a dual mode of action. Furthermore, membrane damage induced by irreversible electroporation (IRE) promotes immunogenic cell death through the exposure and release of calreticulin, ATP, HMGB1, and other damage-associated molecular patterns (DAMPs), which recruit and activate antigen-presenting cells at the tumor site [29]. These signals facilitate uptake of tumor debris, cross-priming of cytotoxic T cells, and amplification of innate and adaptive immune responses [30], thereby linking CHCP-induced electroporation with antitumor immunity.
Importantly, the translational relevance of CHCP was confirmed in ex vivo histopathology analyses of resected human zone 0 specimens from our Phase I clinical CHCP trial [14]. H&E-stained sections revealed selective tumor cell death at surgical margins (Zone 0), characterized by plasma membrane disruption, cytoplasmic leakage, and nuclear condensation, consistent with an IRE mechanism. Surrounding non-malignant and vascular structures were preserved, demonstrating the tumor-selective nature of CHCP treatment. Notably, CHCP treatment extended the survival of the R0 patients who had microscopic residual disease, highlighting the potential of CHCP for tumor cell death at the surgical margin and reduction of microscopic residual disease which is a critical factor in preventing local recurrence and improving long-term survival in advanced solid tumors.
CHCP offers several advantages including non-contact application, precise control over voltage and exposure duration, non-thermal (22-240 C) tumor cell death, and sustained membrane permeability compared to the classical IRE techniques, such as probe-based high-voltage pulses or nanosecond pulsed electric fields (i.e, NanoKnife [22] and Galvanize Knife [23]). The integration of electromagnetic field effects with reactive plasma species contributes to prolonged pore stability, amplify selective tumor cell death in a cell-type dependent manner. These unique properties make CHCP a versatile platform of NTNC-IRETM for selective tumor cell death.
Figure 11.
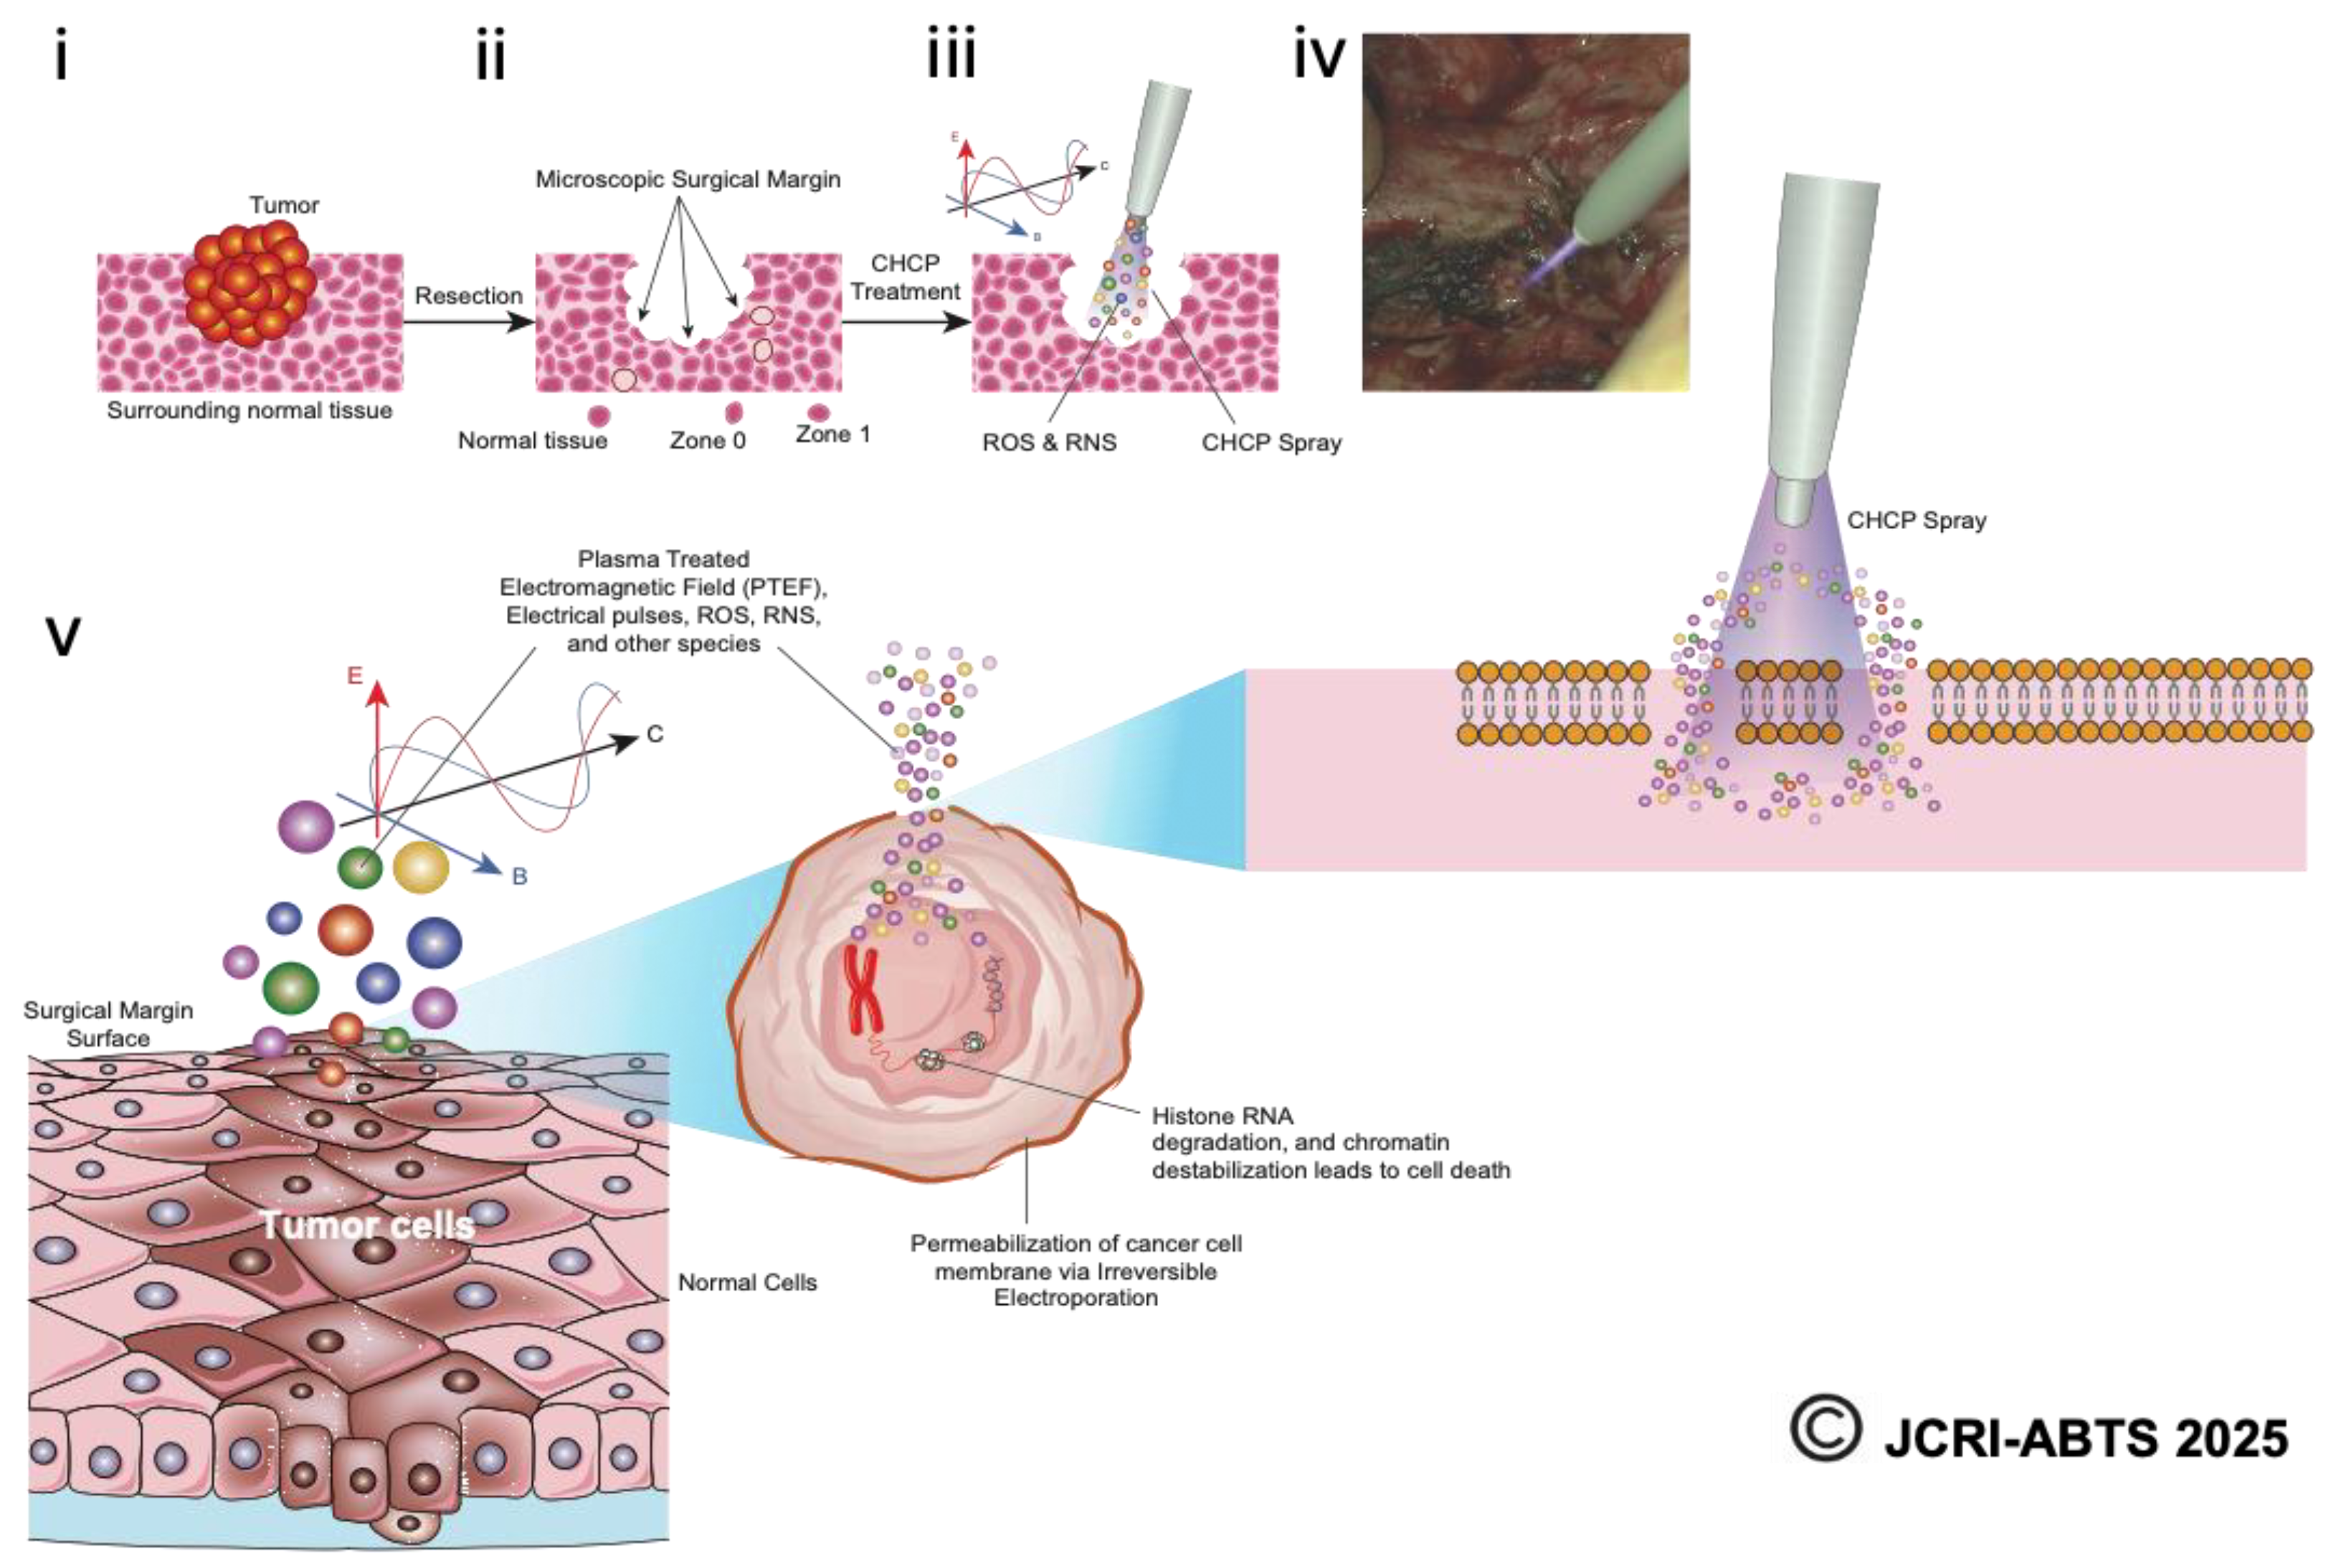
Schematic representation of the Canady Helios Cold Plasma (CHCP) treatment workflow. The illustration depicts (i) surgical resection of the tumor using standard oncologic procedures, (ii) collection of specimens from the tumor core, surgical margin (Zone 0), peritumoral tissue (Zone 1), and adjacent normal tissue, and (iii) intraoperative application of CHCP spray directly to the surgical margin. (iv) A representative intraoperative image shows CHCP treatment of a pancreatic surgical margin following a Whipple procedure. (v) The schematic further highlights CHCP-generated PTEF™, where E denotes the electric field, B the magnetic field, and C the three-dimensional vector reference of the magnetic field. Reactive oxygen and nitrogen species (ROS/RNS), including hydroxyl radicals (OH*), are shown entering the cancer cell membrane through transient “pores” formed by CHCP-induced electroporation, ultimately disrupting cellular integrity and promoting selective tumor cell death.
Figure 11.
Schematic representation of the Canady Helios Cold Plasma (CHCP) treatment workflow. The illustration depicts (i) surgical resection of the tumor using standard oncologic procedures, (ii) collection of specimens from the tumor core, surgical margin (Zone 0), peritumoral tissue (Zone 1), and adjacent normal tissue, and (iii) intraoperative application of CHCP spray directly to the surgical margin. (iv) A representative intraoperative image shows CHCP treatment of a pancreatic surgical margin following a Whipple procedure. (v) The schematic further highlights CHCP-generated PTEF™, where E denotes the electric field, B the magnetic field, and C the three-dimensional vector reference of the magnetic field. Reactive oxygen and nitrogen species (ROS/RNS), including hydroxyl radicals (OH*), are shown entering the cancer cell membrane through transient “pores” formed by CHCP-induced electroporation, ultimately disrupting cellular integrity and promoting selective tumor cell death.
In summary, our findings establish CHCP as a novel, NTNC-IRETM modality with both mechanistic and clinical significance. Voltage and cell type dependent membrane permeabilization, supported by functional RNA delivery and histopathological evidence, underscores its potential for intraoperative margin selective tumor cell death. By selectively targeting residual malignant cells while preserving healthy tissue, CHCP reduce recurrence risk and improve surgical outcomes in patients with advanced or recurrent solid tumors.
5. Conclusions
The CHCP system is the first next-generation, non-thermal (22–24 °C), non-contact electroporation biophysical platform that induces selective tumor cell death through NTNC-IRE™. CHCP integrates plasma-generated reactive species with PTEF to kill malignant cells while preserving normal tissue architecture. Clinically, this approach enables intraoperative strategy to prevent local recurrence, significantly improving patient outcomes and survival.
Supplementary Materials
The following supporting information can be downloaded at the website of this paper posted on Preprints.org, Supplemental Figures 1, 2 and 3; Table 1A, 1B and 1C.
Author Contributions
Conceptualization, J.C.; Methodology, J.C. and S.M.; Software, T.Z.; Validation, J.C. T.Z. S.M., A.N., O.J., and Y.D.; Formal Analysis, J.C., S.M., and T.Z.; Investigation, J.C. and S.M.,; Resources, J.C.; Data Curation, J.C. ,S.M., O.J., and Y.D.; Writing – Original Draft Preparation, J.C. ,S.M., and T.Z.; Writing – Review & Editing, J.C. ,S.M., O.J., M.K., Y.D., and A.N.; Visualization, J.C. T.Z. and S.M.; Supervision, J.C.; Project Administration, J.C. T.Z. and S.M.; Funding Acquisition, J.C. All authors have read and agreed to the published version of the manuscript.
Funding
This research was funded by US Medical Innovations.
Institutional Review Board Statement
The study was conducted in accordance with the Declaration of Helsinki, and approved by the Institutional Review Board of RUMC and SMC after receiving approval from the FDA (IDE #G19065, approved on 6 September 2022) and Israeli Ministry of Health.
Informed Consent Statement
Informed consent was obtained from all subjects involved in the study.
Acknowledgments
We thank the participating patients and their families, previous compassionate use patients, surgical teams performing these advanced high risk surgical procedures, and allowance by Sheba Medical Center, Ramat Gant Israel and Rush University Medical Center Chicago, ILL., and the study team at JCRI-ABTS. All authors approved the final version of the manuscript.
Conflicts of Interest
The authors declare no conflict of interest.
References
- Lee EW, Thai S, Kee ST. Irreversible electroporation: a novel image-guided cancer therapy. Gut Liver. Sep 2010;4 Suppl 1(Suppl 1):S99-S104. [CrossRef]
- Baumler W, Sebald M, Einspieler I, et al. Incidence and evolution of venous thrombosis during the first 3 months after irreversible electroporation of malignant hepatic tumours. Sci Rep. Dec 27 2019;9(1):19876. [CrossRef]
- Baumler W, Sebald M, Einspieler I, et al. Evaluation of Alterations to Bile Ducts and Laboratory Values During the First 3 Months After Irreversible Electroporation of Malignant Hepatic Tumors. Cancer Manag Res. 2020;12:8425-8433. [CrossRef]
- Xiang JC, Xia ZY, Sun JX, Wang SG, Xia QD. Real-world safety of irreversible electroporation therapy for tumors with nanoknife: MAUDE database analysis. BMC Surg. Aug 25 2025;25(1):390. [CrossRef]
- Valerio M, Dickinson L, Ali A, et al. A prospective development study investigating focal irreversible electroporation in men with localised prostate cancer: Nanoknife Electroporation Ablation Trial (NEAT). Contemp Clin Trials. Sep 2014;39(1):57-65. [CrossRef]
- Knavel EM, Brace CL. Tumor ablation: common modalities and general practices. Tech Vasc Interv Radiol. Dec 2013;16(4):192-200. [CrossRef]
- Cheng X, Murthy SRK, Zhuang T, et al. Canady Helios Cold Plasma Induces Breast Cancer Cell Death by Oxidation of Histone mRNA. Int J Mol Sci. Sep 3 2021;22(17). [CrossRef]
- Ly L, Cheng X, Murthy SRK, et al. Canady Cold Helios Plasma Reduces Soft Tissue Sarcoma Viability by Inhibiting Proliferation, Disrupting Cell Cycle, and Inducing Apoptosis: A Preliminary Report. Molecules. Jun 29 2022;27(13). [CrossRef]
- Lawan Ly XC, Saravana R K Murthya, Taisen Zhuang,, Olivia Z Jones GB, Michael Keidar, Jerome Canady Canady cold plasma conversion system treatment: An effective inhibitor of cell viability in breast cancer molecular subtypes. Clinical Plasma Medicine. 2020;19-20. [CrossRef]
- Xiaoqian Cheng WR, Lawan Ly, Alexey Shashurin, Taisen Zhuang,, Shruti Wigh GB, Barry Trink, Michael Keidar and Jerome Canady Treatment of Triple-Negative Breast Cancer Cells with the Canady Cold Plasma Conversion System: Preliminary Results. Plasma. 2018; [CrossRef]
- Warren Rowe XC, Lawan Ly, Taisen Zhuang, Giacomo Basadonna, Barry Trink, Michael Keidar and Jerome Canady. The Canady Helios Cold Plasma Scalpel Significantly Decreases Viability in Malignant Solid Tumor Cells in a Dose-Dependent Manner. 2018; [CrossRef]
- Guerrero-Preston R, Ogawa T, Uemura M, et al. Cold atmospheric plasma treatment selectively targets head and neck squamous cell carcinoma cells. Int J Mol Med. Oct 2014;34(4):941-6. [CrossRef]
- Chen Z, Simonyan H, Cheng X, et al. A Novel Micro Cold Atmospheric Plasma Device for Glioblastoma Both In Vitro and In Vivo. Cancers (Basel). May 30 2017;9(6). [CrossRef]
- Canady J, Murthy SRK, Zhuang T, et al. The First Cold Atmospheric Plasma Phase I Clinical Trial for the Treatment of Advanced Solid Tumors: A Novel Treatment Arm for Cancer. Cancers (Basel). Jul 20 2023;15(14). [CrossRef]
- Sreedevi PR, Suresh K. Cold atmospheric plasma mediated cell membrane permeation and gene delivery-empirical interventions and pertinence. Adv Colloid Interface Sci. Oct 2023;320:102989. [CrossRef]
- Aycock KN, Davalos RV. Irreversible Electroporation: Background, Theory, and Review of Recent Developments in Clinical Oncology. Bioelectricity. Dec 1 2019;1(4):214-234. [CrossRef]
- Sklias K, Santos Sousa J, Girard PM. Role of Short- and Long-Lived Reactive Species on the Selectivity and Anti-Cancer Action of Plasma Treatment In Vitro. Cancers (Basel). Feb 4 2021;13(4). [CrossRef]
- Lin L, Lyu Y, Shneider MN, Keidar M. Average electron temperature estimation of streamer discharge in ambient air. Rev Sci Instrum. Nov 2018;89(11):113502. [CrossRef]
- Murthy SRK, Cheng X, Zhuang T, et al. BCL2A1 regulates Canady Helios Cold Plasma-induced cell death in triple-negative breast cancer. Sci Rep. Mar 8 2022;12(1):4038. [CrossRef]
- Rubinsky B, Onik G, Mikus P. Irreversible electroporation: a new ablation modality--clinical implications. Technol Cancer Res Treat. Feb 2007;6(1):37-48. [CrossRef]
- Jacobs EJ, Rubinsky B, Davalos RV. Pulsed field ablation in medicine: irreversible electroporation and electropermeabilization theory and applications. Radiol Oncol. Mar 1 2025;59(1):1-22. [CrossRef]
- Narayanan G. Irreversible electroporation for treatment of liver cancer. Gastroenterol Hepatol (N Y). May 2011;7(5):313-6.
- Jimenez M, Flandes J, van der Heijden E, et al. Safety and Feasibility of Pulsed Electric Field Ablation for Early-Stage Non-Small Cell Lung Cancer Prior to Surgical Resection. J Surg Oncol. Jun 2025;131(8):1529-1542. [CrossRef]
- Badgwell B, Krouse R, Cormier J, Guevara C, Klimberg VS, Ferrell B. Frequent and early death limits quality of life assessment in patients with advanced malignancies evaluated for palliative surgical intervention. Ann Surg Oncol. Nov 2012;19(12):3651-8. [CrossRef]
- Gelker M, Muller-Goymann CC, Viol W. Plasma Permeabilization of Human Excised Full-Thickness Skin by micros- and ns-pulsed DBD. Skin Pharmacol Physiol. 2020;33(2):69-76. [CrossRef]
- Hanson SM, Forsyth B, Wang C. Combination of irreversible electroporation with sustained release of a synthetic membranolytic polymer for enhanced cancer cell killing. Sci Rep. May 24 2021;11(1):10810. [CrossRef]
- Kranjc M, Kranjc S, Bajd F, Sersa G, Sersa I, Miklavcic D. Predicting irreversible electroporation-induced tissue damage by means of magnetic resonance electrical impedance tomography. Sci Rep. Sep 4 2017;7(1):10323. [CrossRef]
- Lin A, Gorbanev Y, De Backer J, et al. Non-Thermal Plasma as a Unique Delivery System of Short-Lived Reactive Oxygen and Nitrogen Species for Immunogenic Cell Death in Melanoma Cells. Adv Sci (Weinh). Mar 20 2019;6(6):1802062. [CrossRef]
- Montico B, Nigro A, Casolaro V, Dal Col J. Immunogenic Apoptosis as a Novel Tool for Anticancer Vaccine Development. Int J Mol Sci. Feb 16 2018;19(2). [CrossRef]
- Ryu M, Kim E, Kim S, Kim K. Natural killer cell membrane manipulation for augmented immune synapse and anticancer efficacy. Mater Today Bio. Aug 2025;33:101965. [CrossRef]
Figure 1.
Illustration showing the CHCP system.
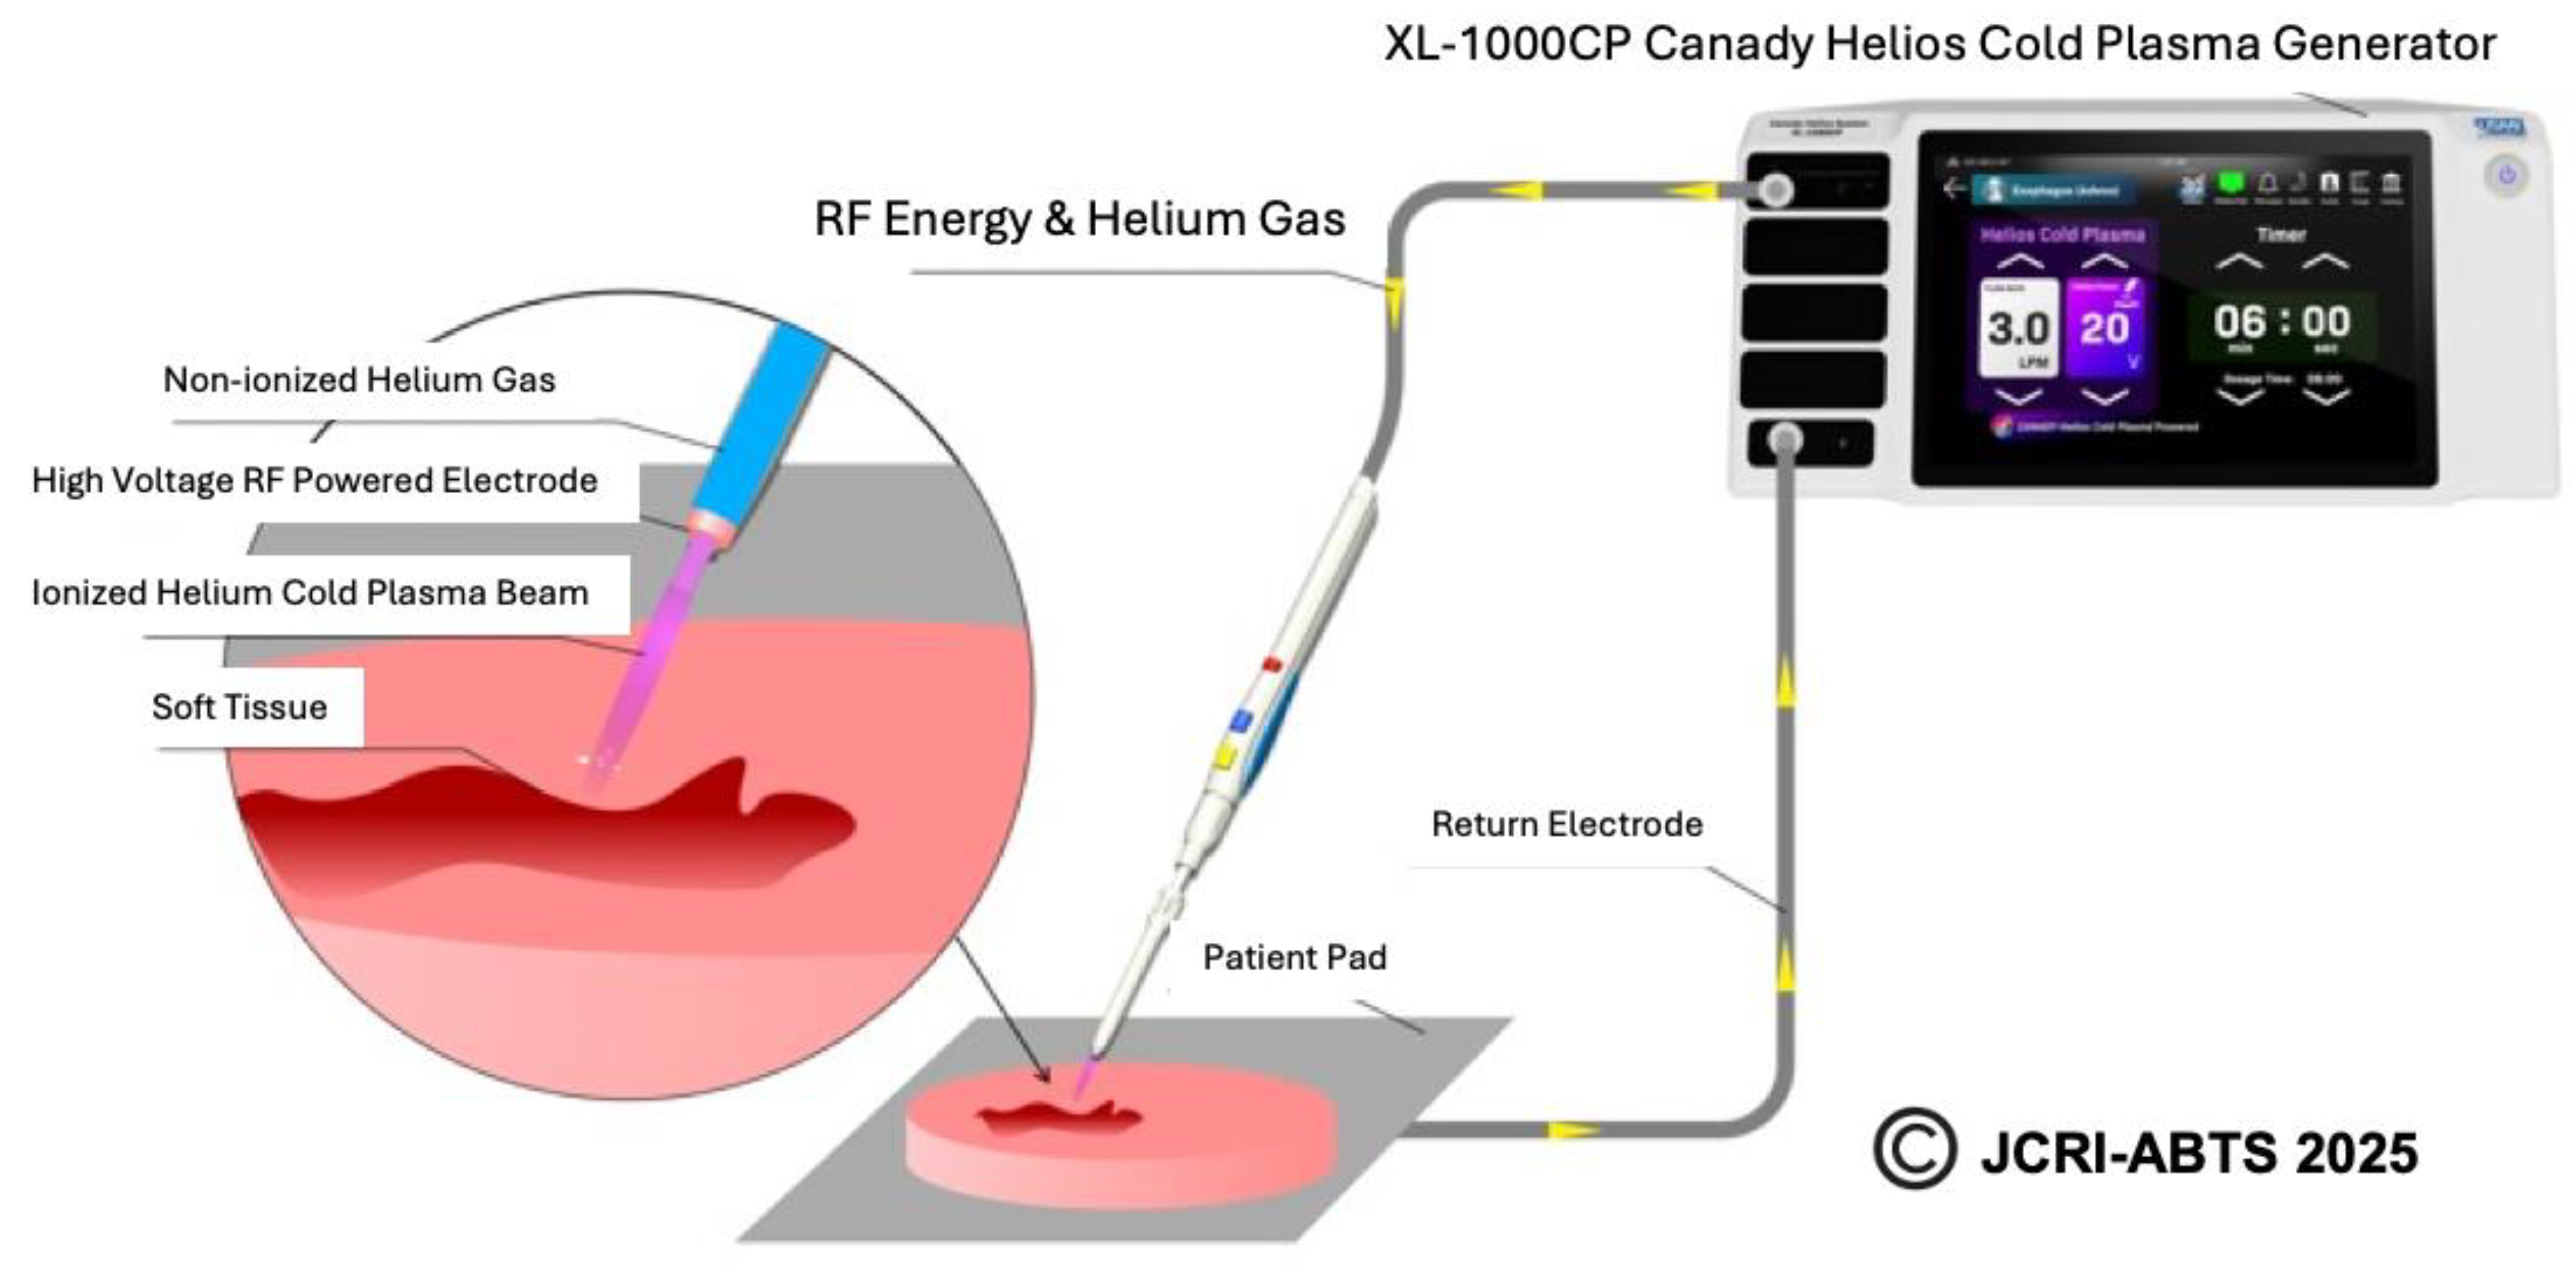
Figure 2.
Schematic representation of the Plasma Treated Electromagnetic Field (PTEFTM) generated by the Canady Helios Cold Plasma (CHCP) system.
Figure 2.
Schematic representation of the Plasma Treated Electromagnetic Field (PTEFTM) generated by the Canady Helios Cold Plasma (CHCP) system.
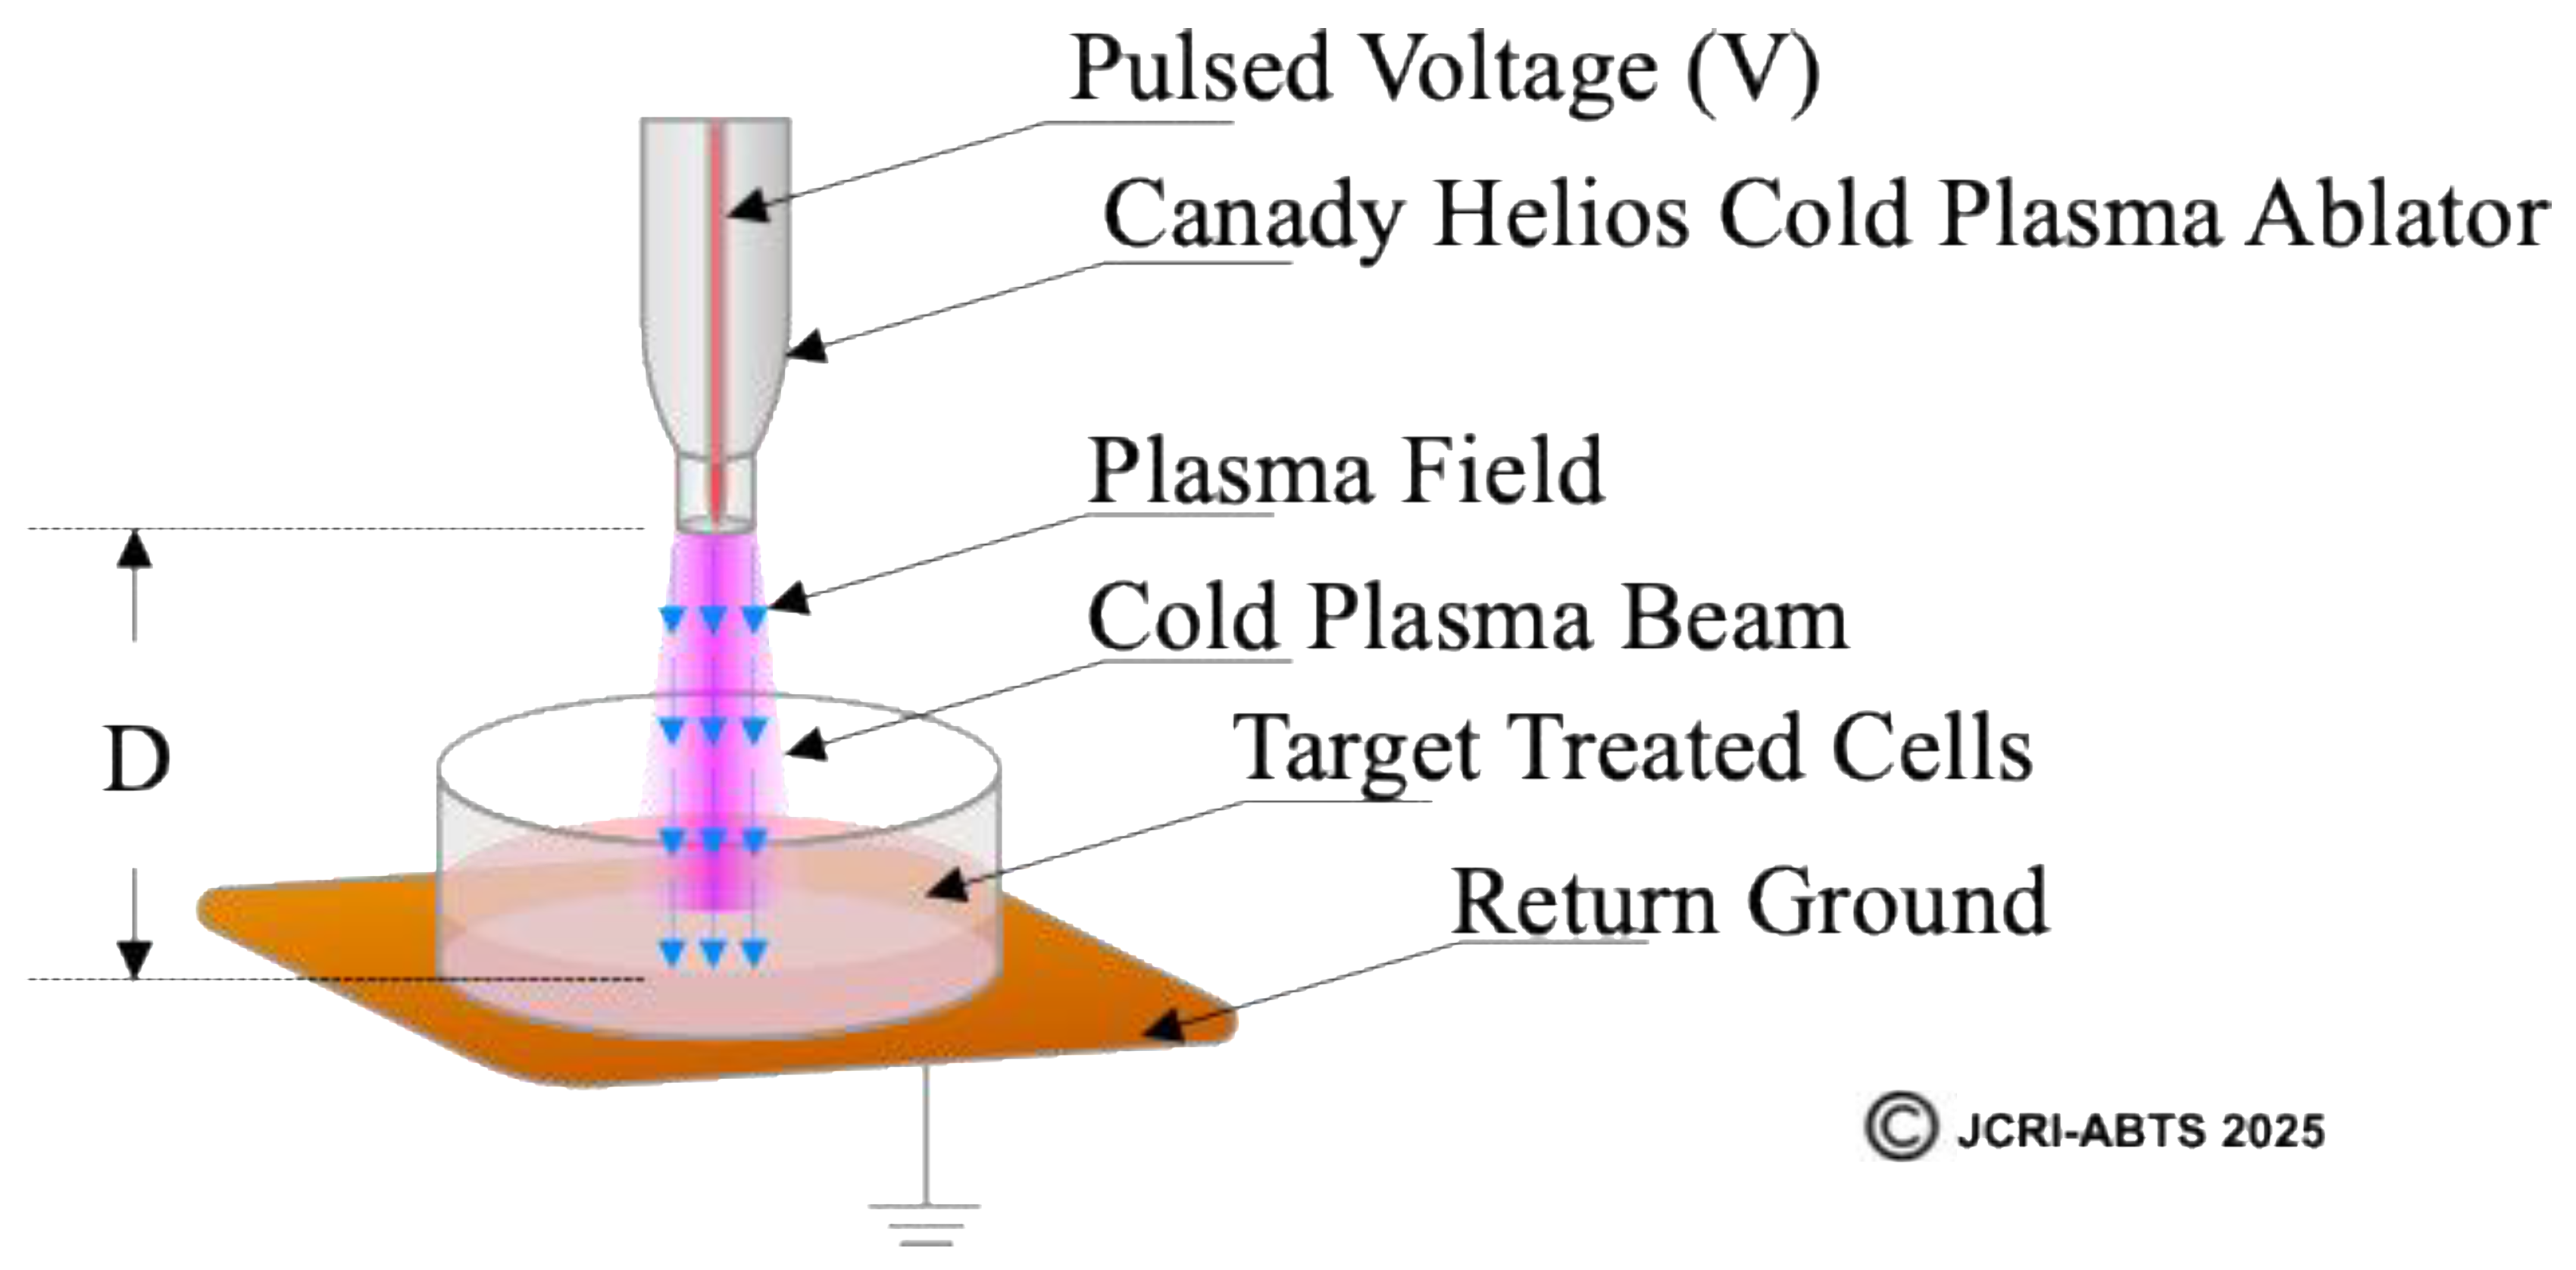
Figure 3.
Analysis of electroporation effects of CHCP treatment on triple-negative breast cancer MDA-MB-231 cells using PI intake intensity measurements. Cells were treated with CHCP at 30V (~2010 V/cm PTEF), 25V (~1675 V/cm PTEF) and Helium for 5 minutes, followed by analysis at multiple incubation time points (0, 30 and 60 minutes) to assess plasma-induced membrane permeability. Percentage of PI intensity indicates the degree of cell membrane electroporation, with data represented as mean ± SEM (n = 3). Statistical significance was analyzed between CHCP-treated and helium-treated samples using Student’s t-test, where 30V (~2010 V/cm PTEF), at Zero, 0.5 and 1 hour were *p < 0.016, * p < 0.020 and p < 0.062 respectively. where 25V (~1675 V/cm PTEF), at Zero, 0.5 and 1 hour were *p < 0.001, *p < 0.008 and p < 0.618 respectively.
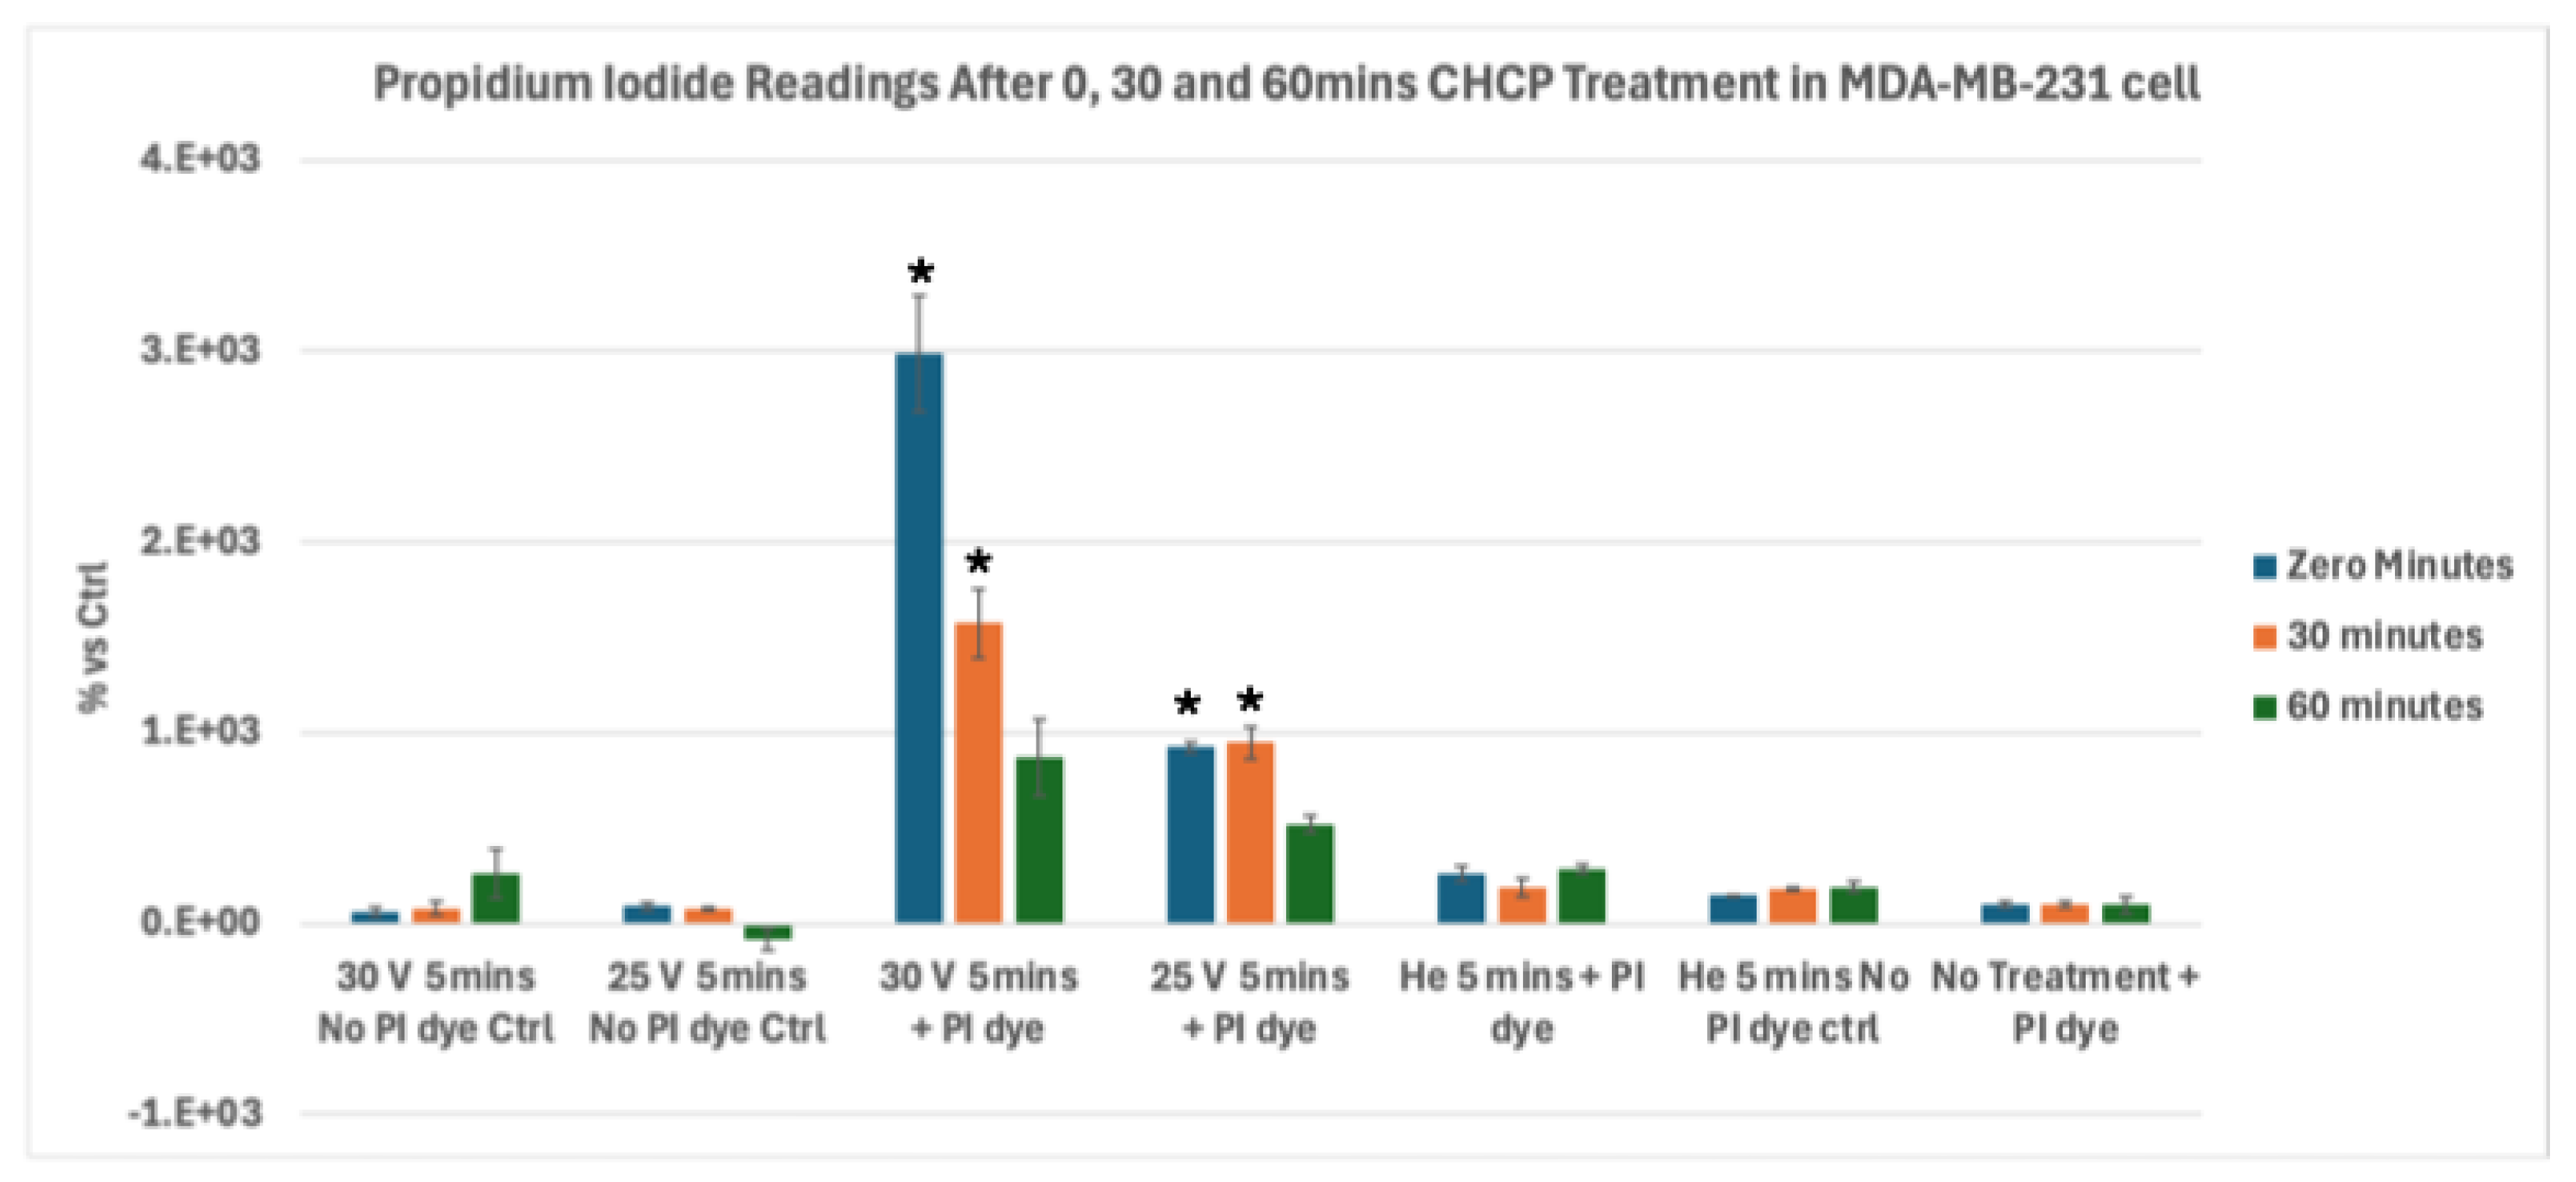
Figure 4.
Analysis of electroporation effects of CHCP treatment on ER+ PR+ HER2- breast cancer MCF-7 cells using PI intake intensity measurements. Cells were treated with CHCP at 30V (~2010 V/cm PTEF) (A) and 25V (~1675 V/cm PTEF) (B) for 5 minutes, followed by analysis at multiple incubation time points (0, 30 and 60 minutes) to assess plasma-induced membrane permeability. Percentage of PI intensity indicates the degree of cell membrane electroporation, with data represented as a mean ± SEM (n = 3). Statistical significance was analyzed between CHCP-treated and helium-treated samples using Student’s t-test, where 30V (~2010 V/cm PTEF), at Zero, 0.5 and 1 hour were *p < 0.0015, * p < 0.0089 and *p < 0.013 respectively. where 25V (~1675 V/cm PTEF), at Zero, 0.5 and 1 hour were *p < 0.014, p < 0.203 and p < 0.168 respectively.
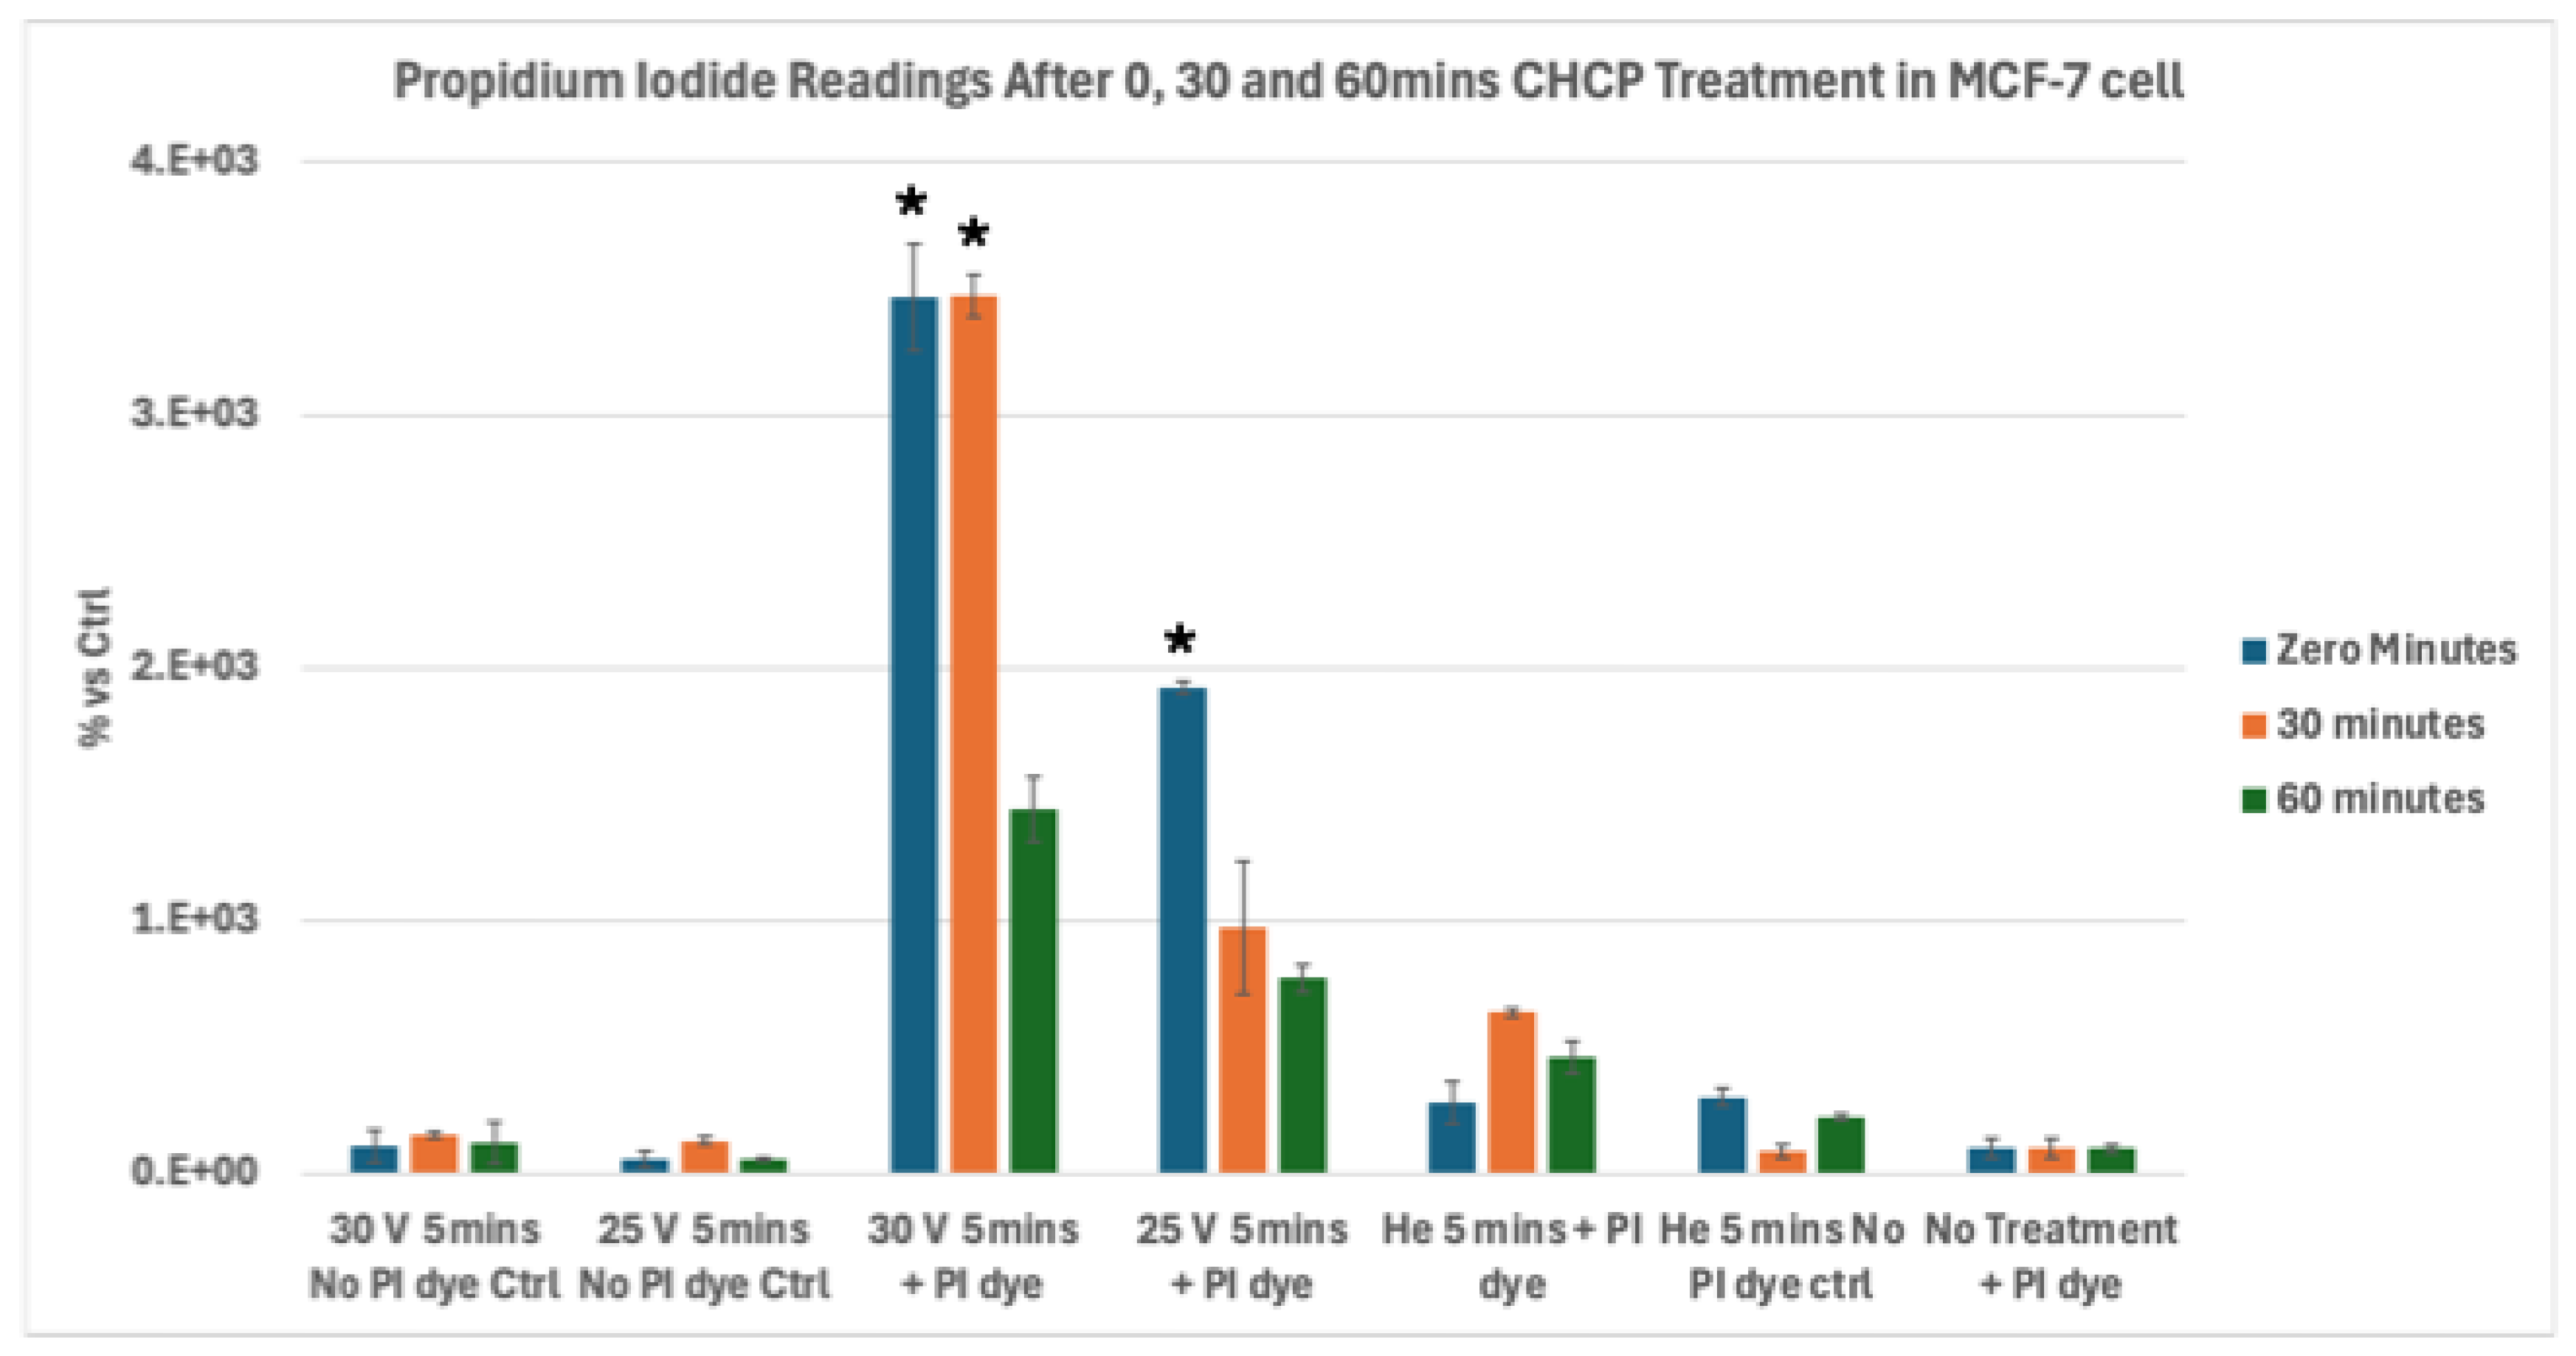
Figure 5.
Analysis of Electroporation effects of CHCP treatment on triple-negative breast cancer Hs578T cells using PI intake intensity measurements. Cells were treated with CHCP at 30V (~2010 V/cm PTEF) and 25V (~1675 V/cm PTEF) for 5 minutes, followed by analysis at multiple incubation time points (0, 30 and 60 minutes) to assess plasma-induced membrane permeability. Percentage of PI intensity indicates the degree of cell membrane electroporation, with data represented as mean ± SEM (n = 3). Statistical significance was analyzed between CHCP-treated and helium-treated samples using Student’s t-test, where 30V (~2010 V/cm PTEF), at Zero, 0.5 and 1 hour were *p < 0.0030, * p < 0.0105 and *p < 0.00014 respectively. where 25V (~1675 V/cm PTEF), at Zero, 0.5 and 1 hour were *p < 0.0087, *p < 0.03 and p < 0.783 respectively.
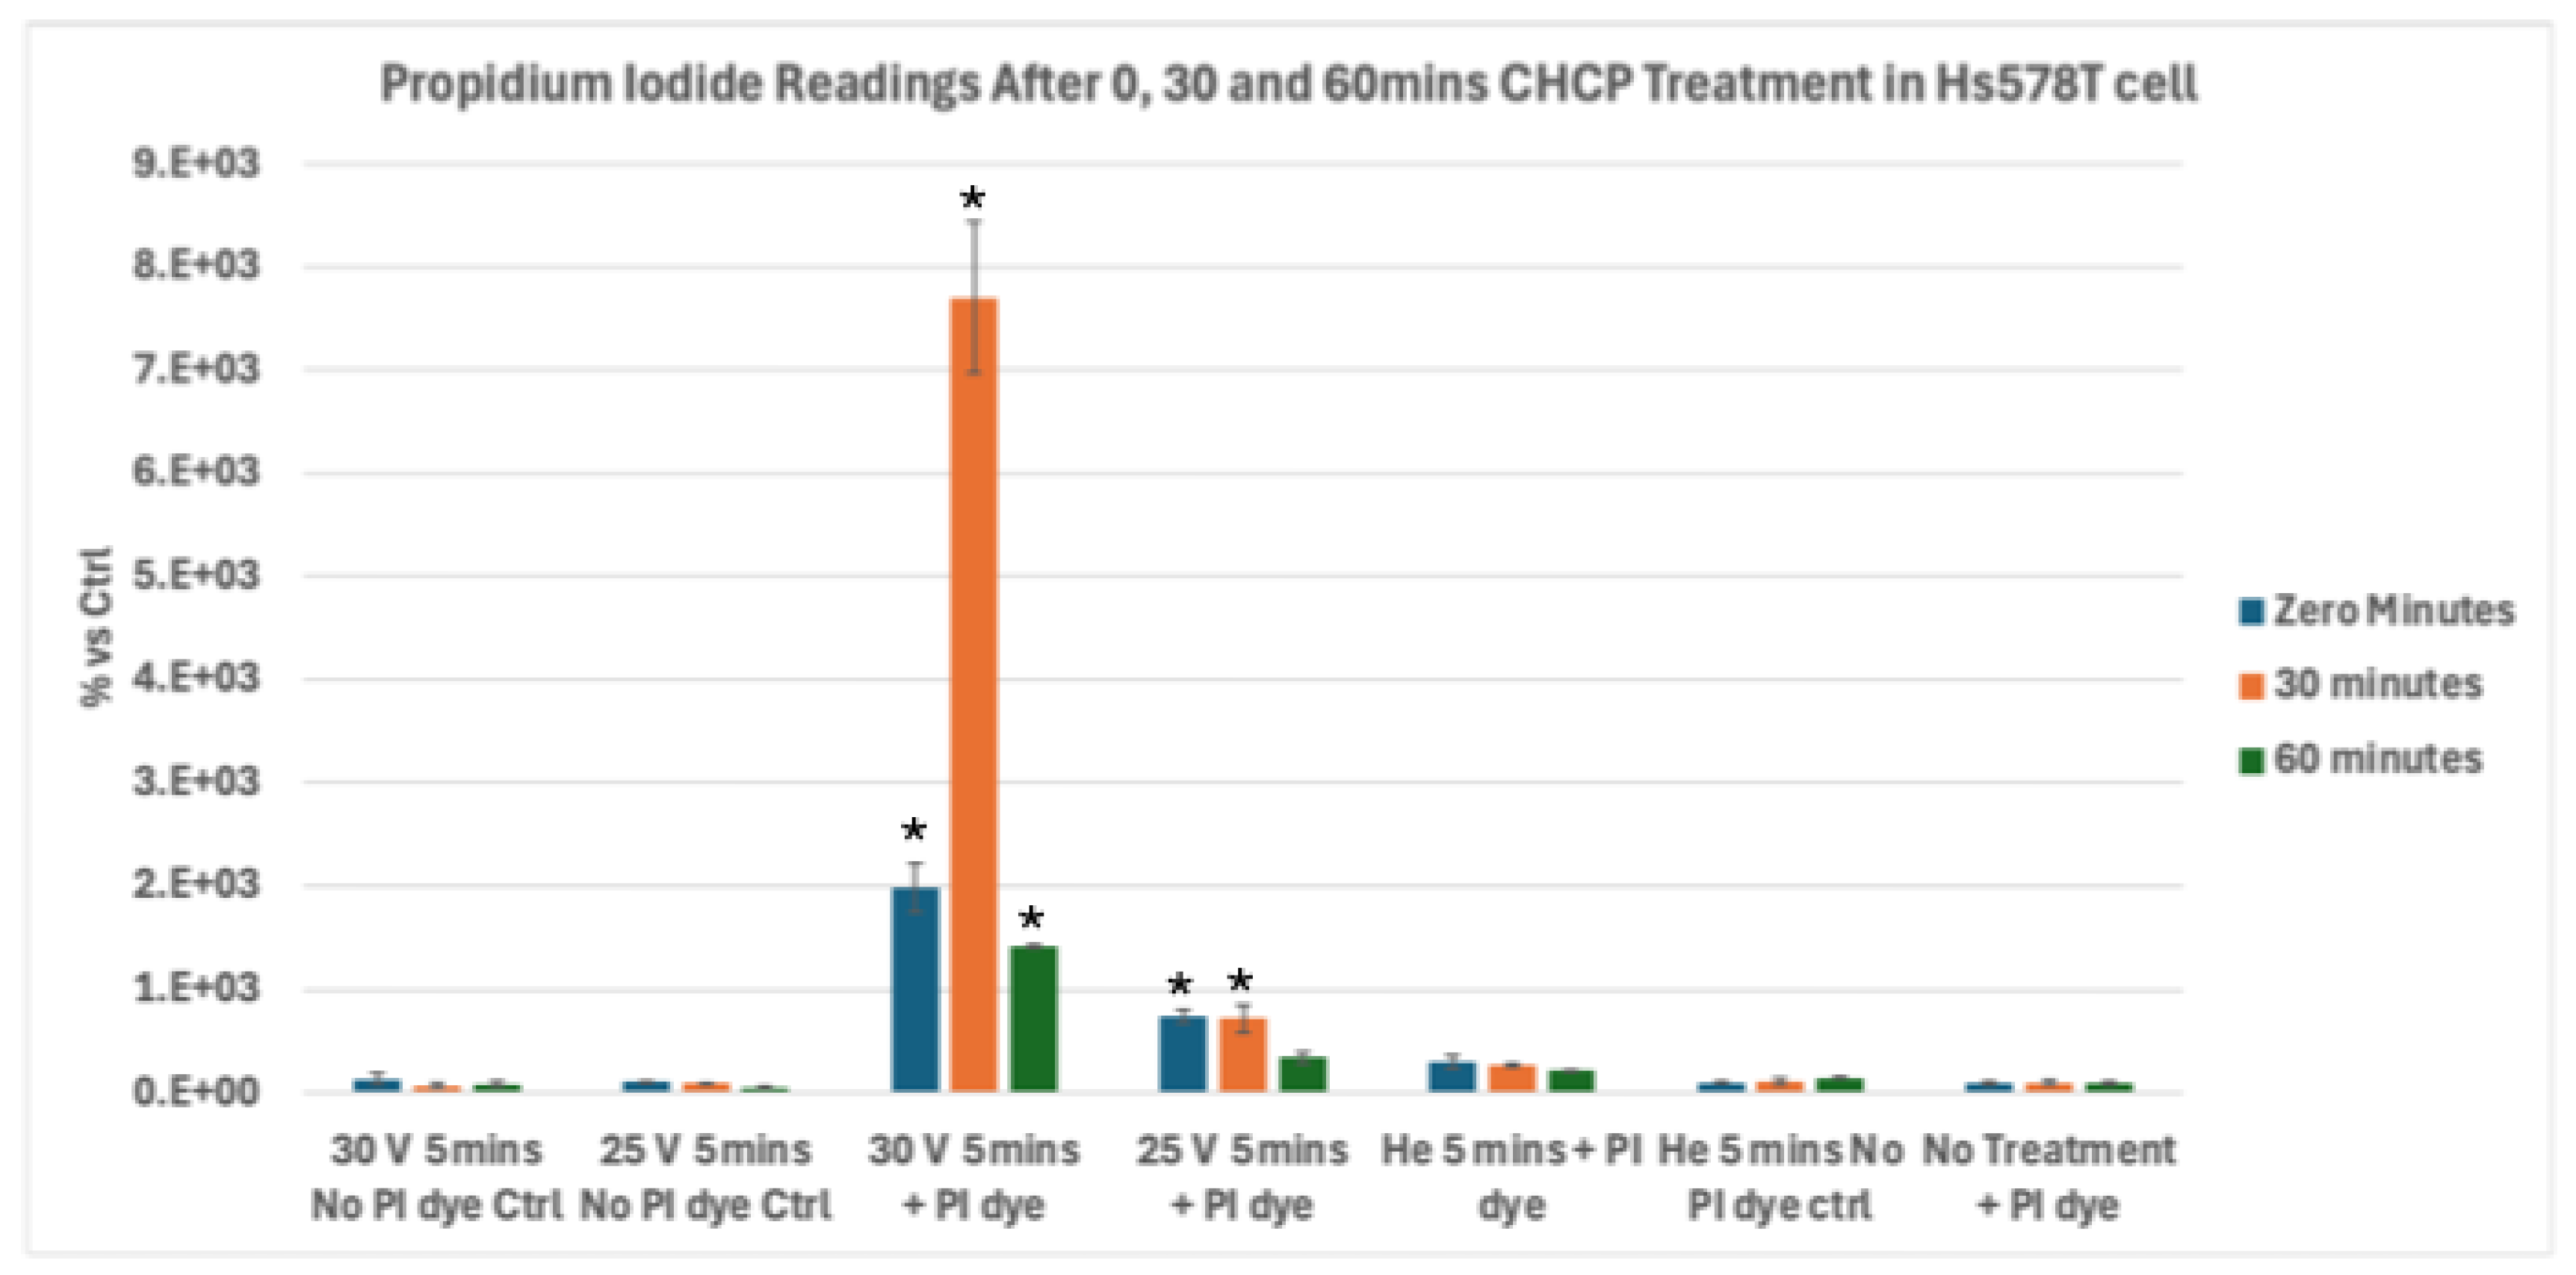
Figure 6.
Analysis of Electroporation effects of CHCP treatment on ER+ PR+ HER2+ breast cancer BT-474 cells using PI intake intensity measurements. Cells were treated with CHCP at 30V (~2010 V/cm PTEF) and 25V (~1675 V/cm PTEF) for 5 minutes, followed by analysis at multiple incubation time points (0, 30 and 60 minutes) to assess plasma-induced membrane permeability. Percentage of PI intensity indicates the degree of cell membrane electroporation, with data represented as mean ± SEM (n = 3). Statistical significance was analyzed between CHCP-treated and helium-treated samples using Student’s t-test, where 30V (~2010 V/cm PTEF), at Zero, 0.5 and 1 hour were *p < 0.0005, * p < 0.0010 and *p < 0.0001 respectively. where 25V (~1675 V/cm PTEF), at Zero, 0.5 and 1 hour were *p < 0.0008, *p < 0.0135 and p < 0.273 respectively.
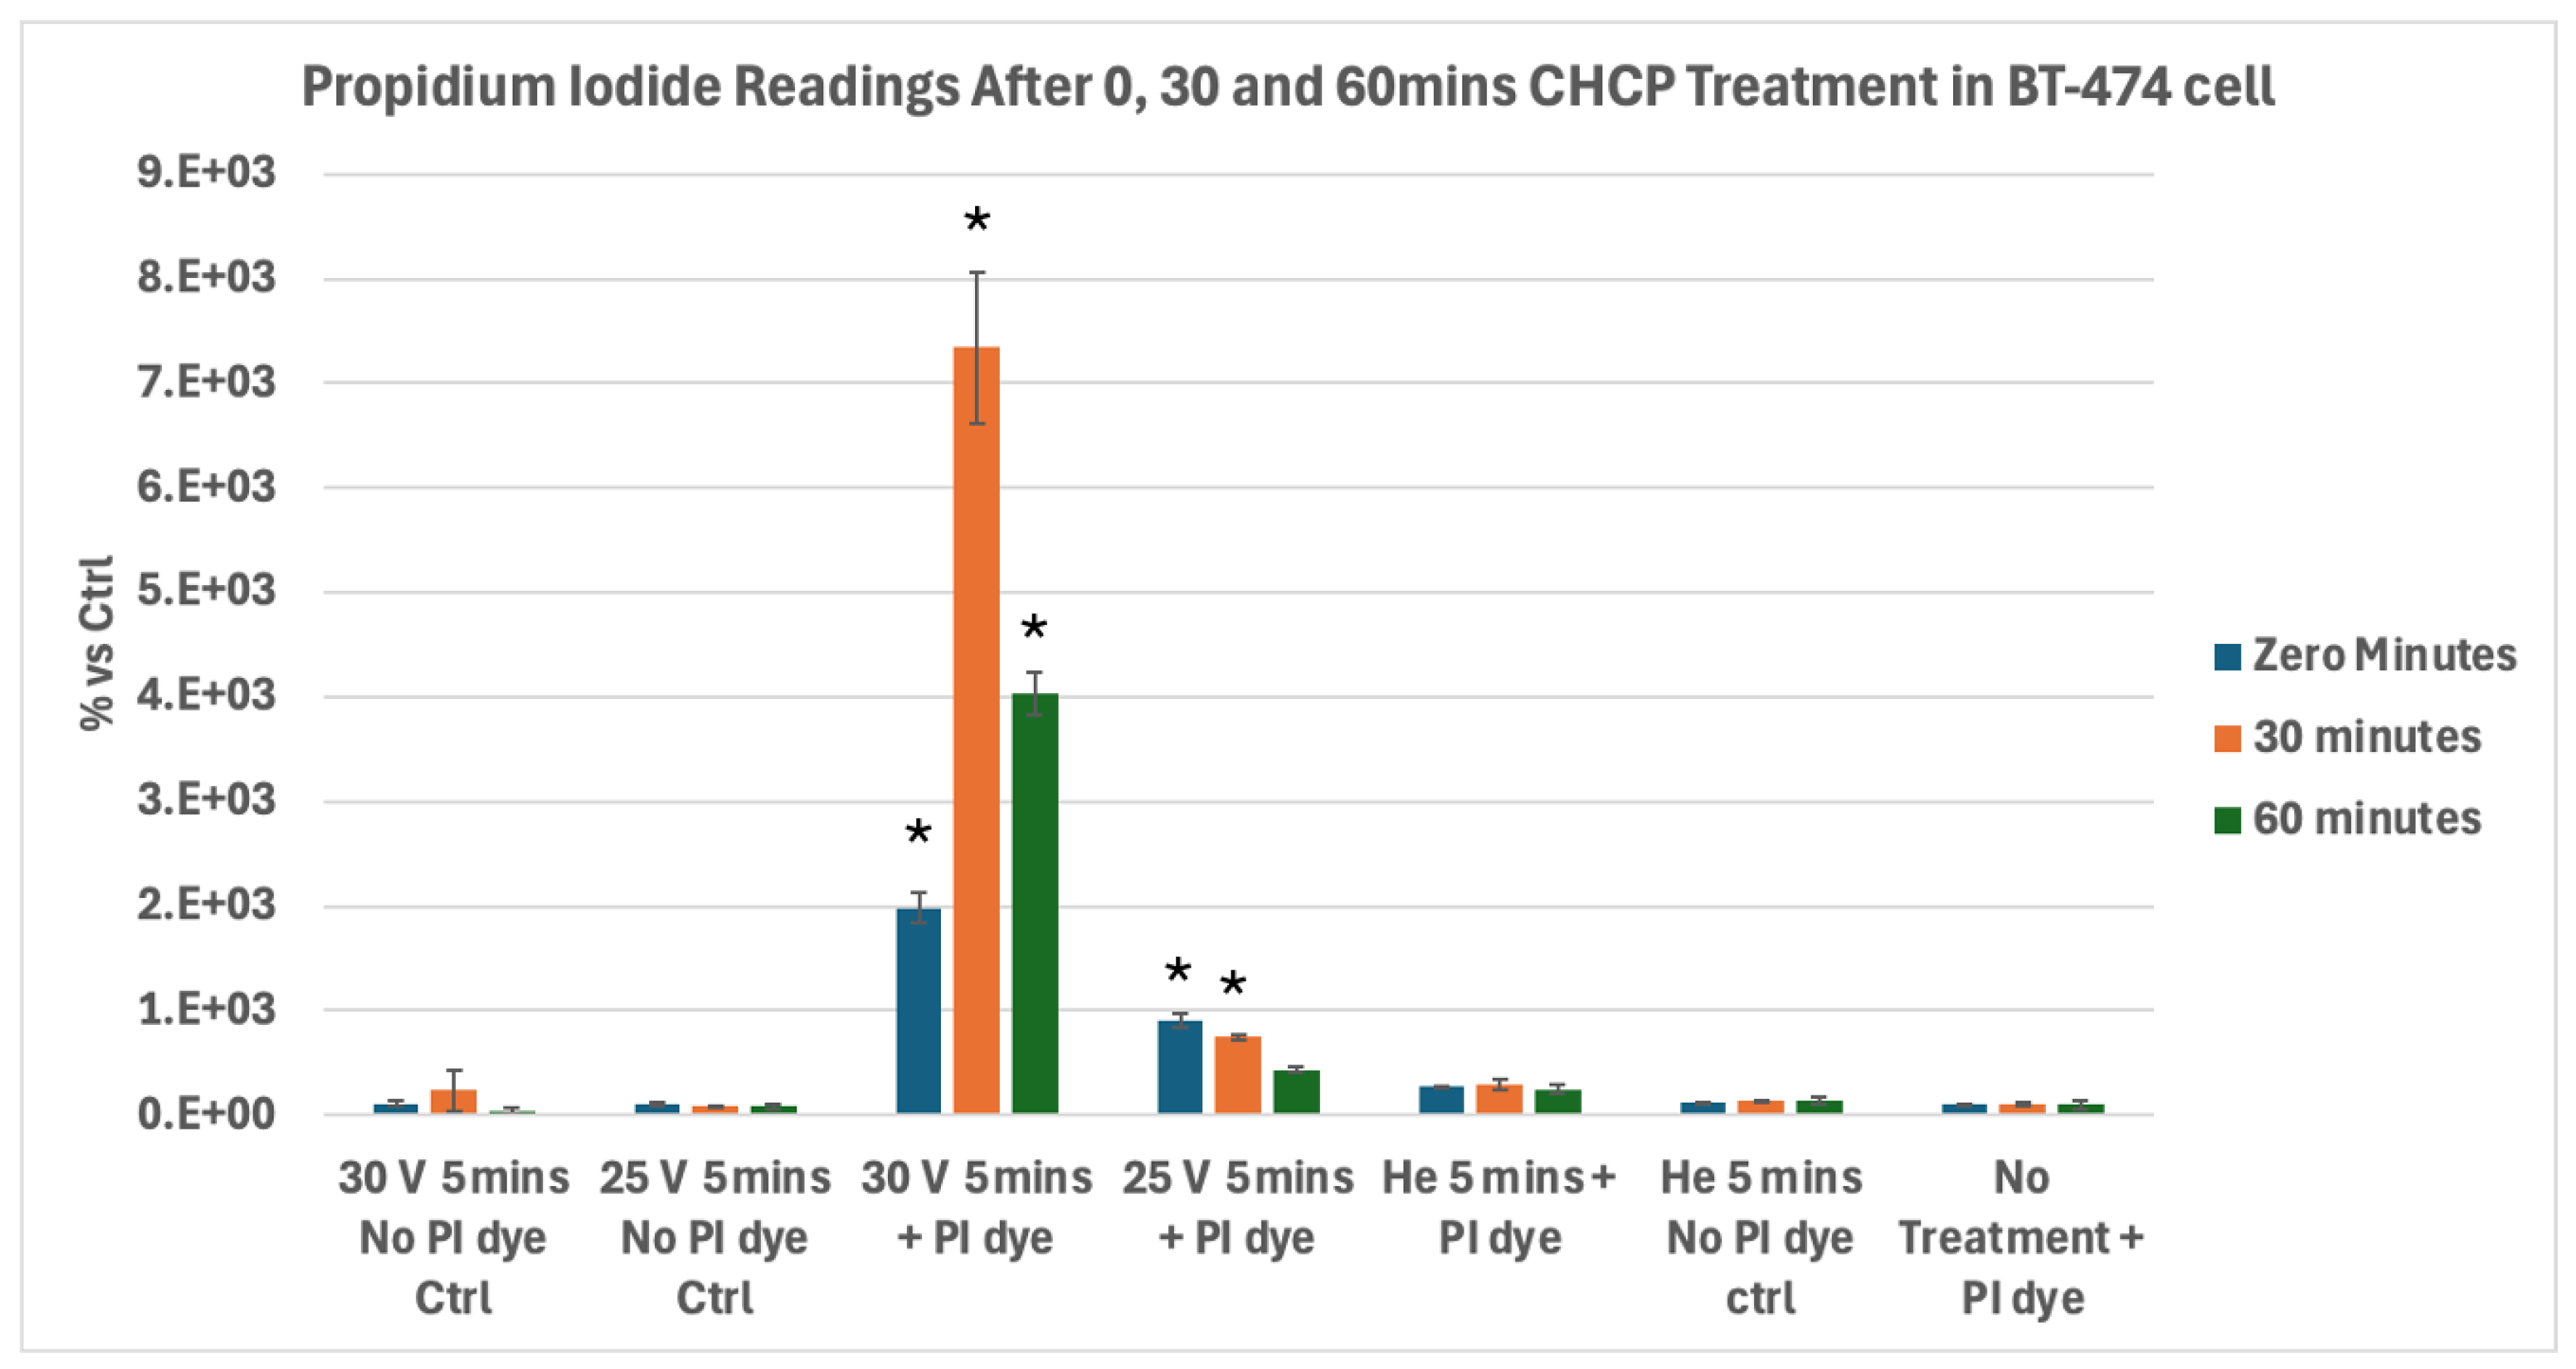
Figure 7.
Analysis of temperature during CHCP treatment on breast cancer cells. Breast cancer cell lines MDA-MB-231, MCF-7, and Hs578T were treated with CHCP at 15 V, 20 V, 25 V, and 30 V for 5 minutes and temperature measurements of media were recorded before, during and after the treatment. Figure showing bar graphs showing the temperatures. The error bars represent means ± SEM. (n = 3). No Treatment (NT) and Helium control (He) at zero volts.
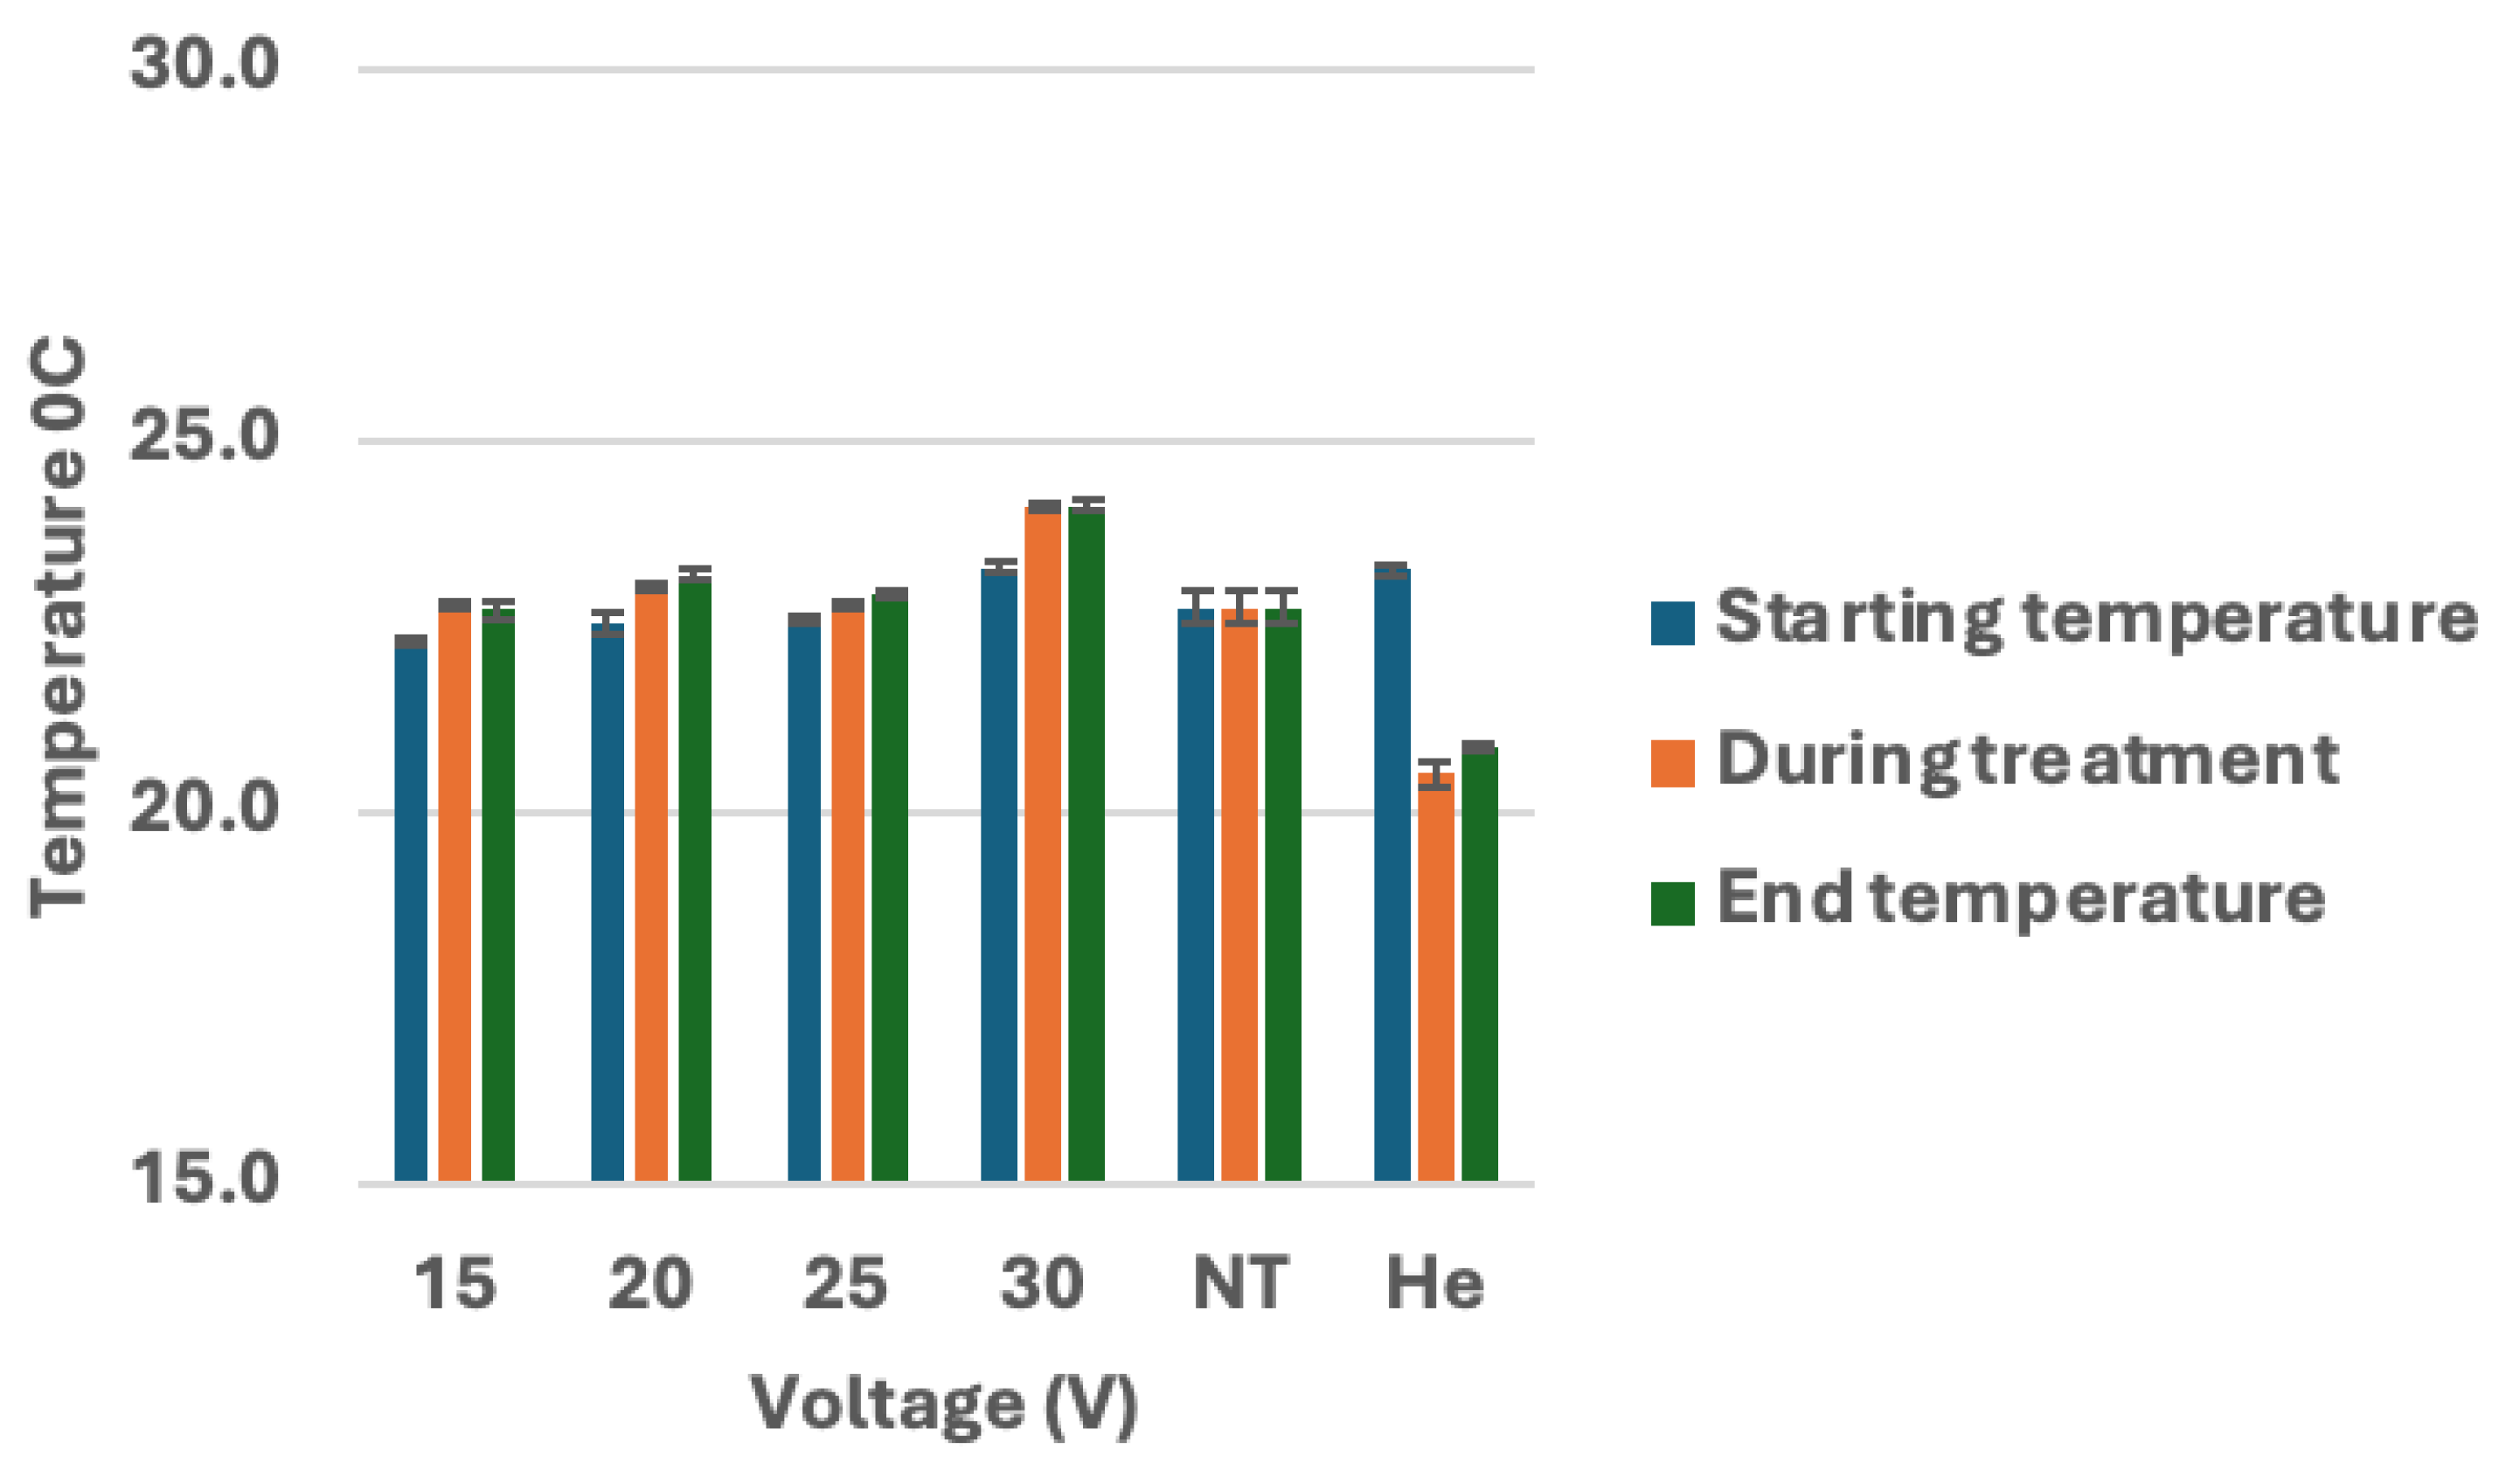
Figure 8.
Analysis of Electroporation effects of CHCP treatment on breast cancer cells by silencing of BCL2A1 mRNA. Transfection of siBCL2A1 by CHCP treatment. Breast cancer cell lines MDA-MB-231, MCF-7, and Hs578T were treated with CHCP at 15 V, 20 V, 25 V, and 30V (~2010 V/cm PTEF) for 5 minutes. Bar graphs showing the expression of BCL2A1 mRNA with esiRNA for BCL2A1 silencing with CAP treatment. The error bars represent means ± SEM. (n = 3). (MDA-MD-231 at 30V (~2010 V/cm PTEF) *p < 0.0055, MCF-7 at 25V (~1675 V/cm PTEF) *p < 0.012 and 30V *p < 5.76253E-06; Hs578T at 25V (~1675 V/cm PTEF) *p < 0.0005, and 30V (~2010 V/cm PTEF) *p < 0.02, Student’s t-test for siBCL2A1 versus control siRNA.
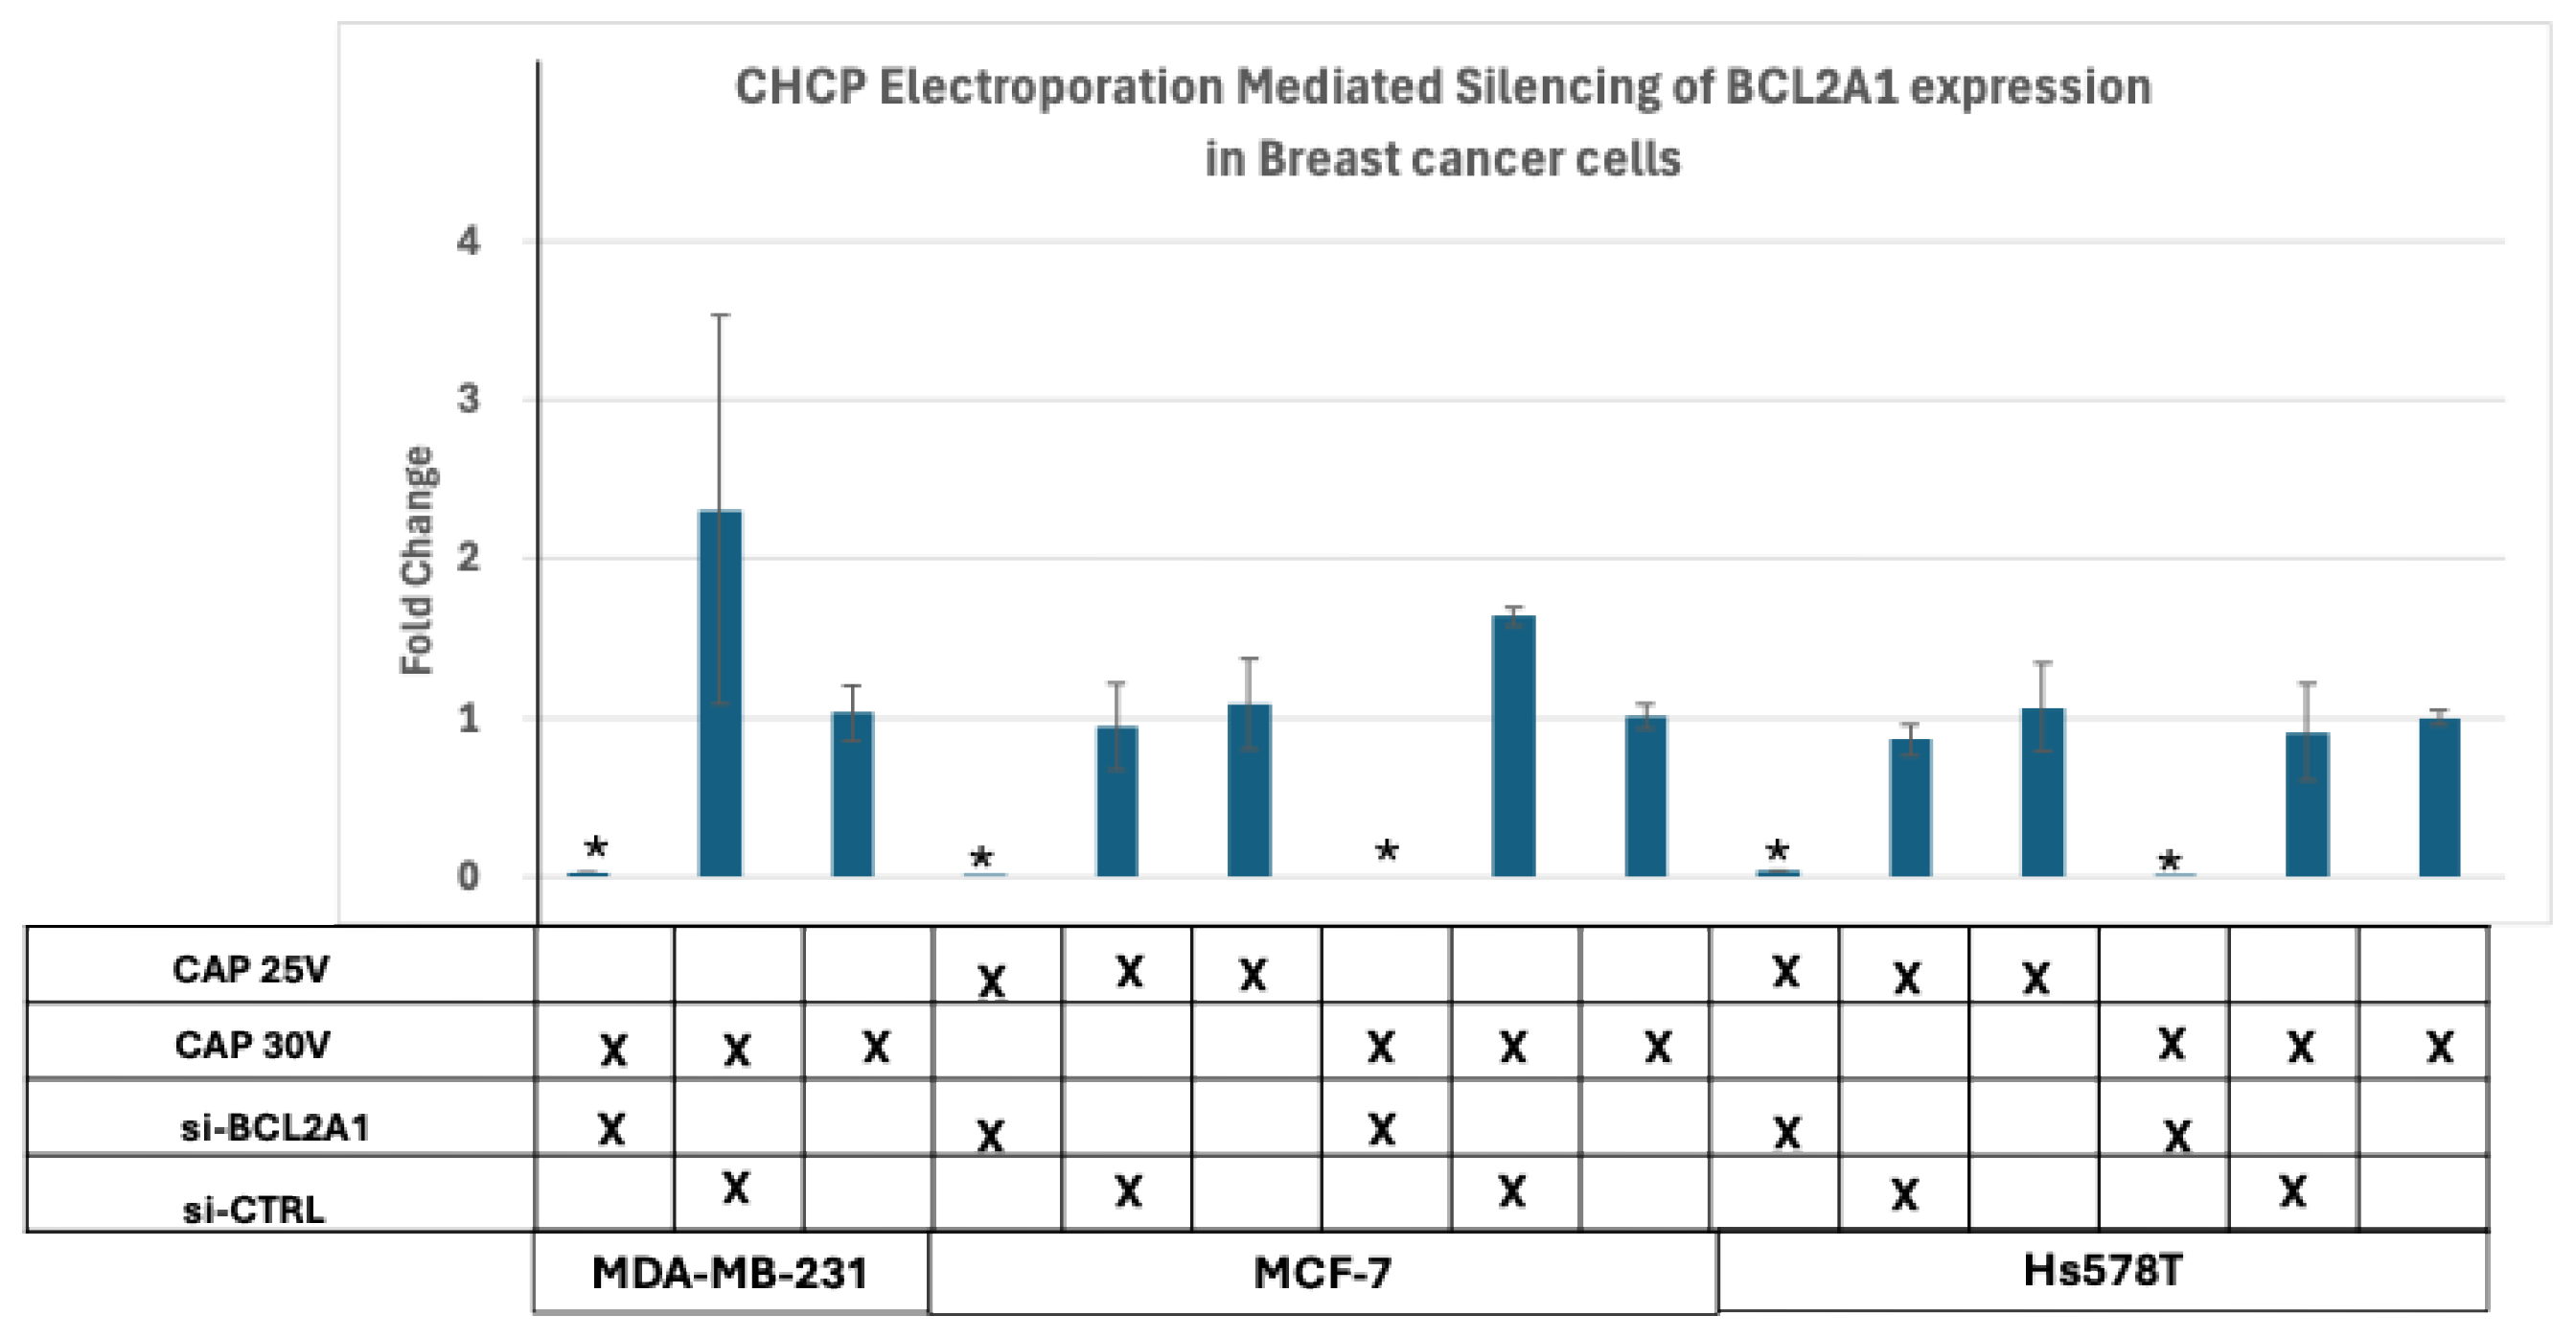
Figure 9.
Analysis of Electroporation effects of CHCP treatment on breast cancer cells on colony formation. Breast cancer cell lines MDA-MB-231, MCF-7, and Hs578T were treated with CHCP at 15 V, 20 V, 25 V, and 30 V for 5 minutes and incubated for 30, 60 and 120 mins followed by colony formation assay. Figure showing bar graphs showing the number of colonies with CAP treatment. The error bars represent means ± SEM. (n = 3). Significance was set at p < 0.05, One-way ANOVA followed by Post hoc Tukey’s tests for treated samples versus Helium control. All p-values < 0 (*), indicating highly significant.
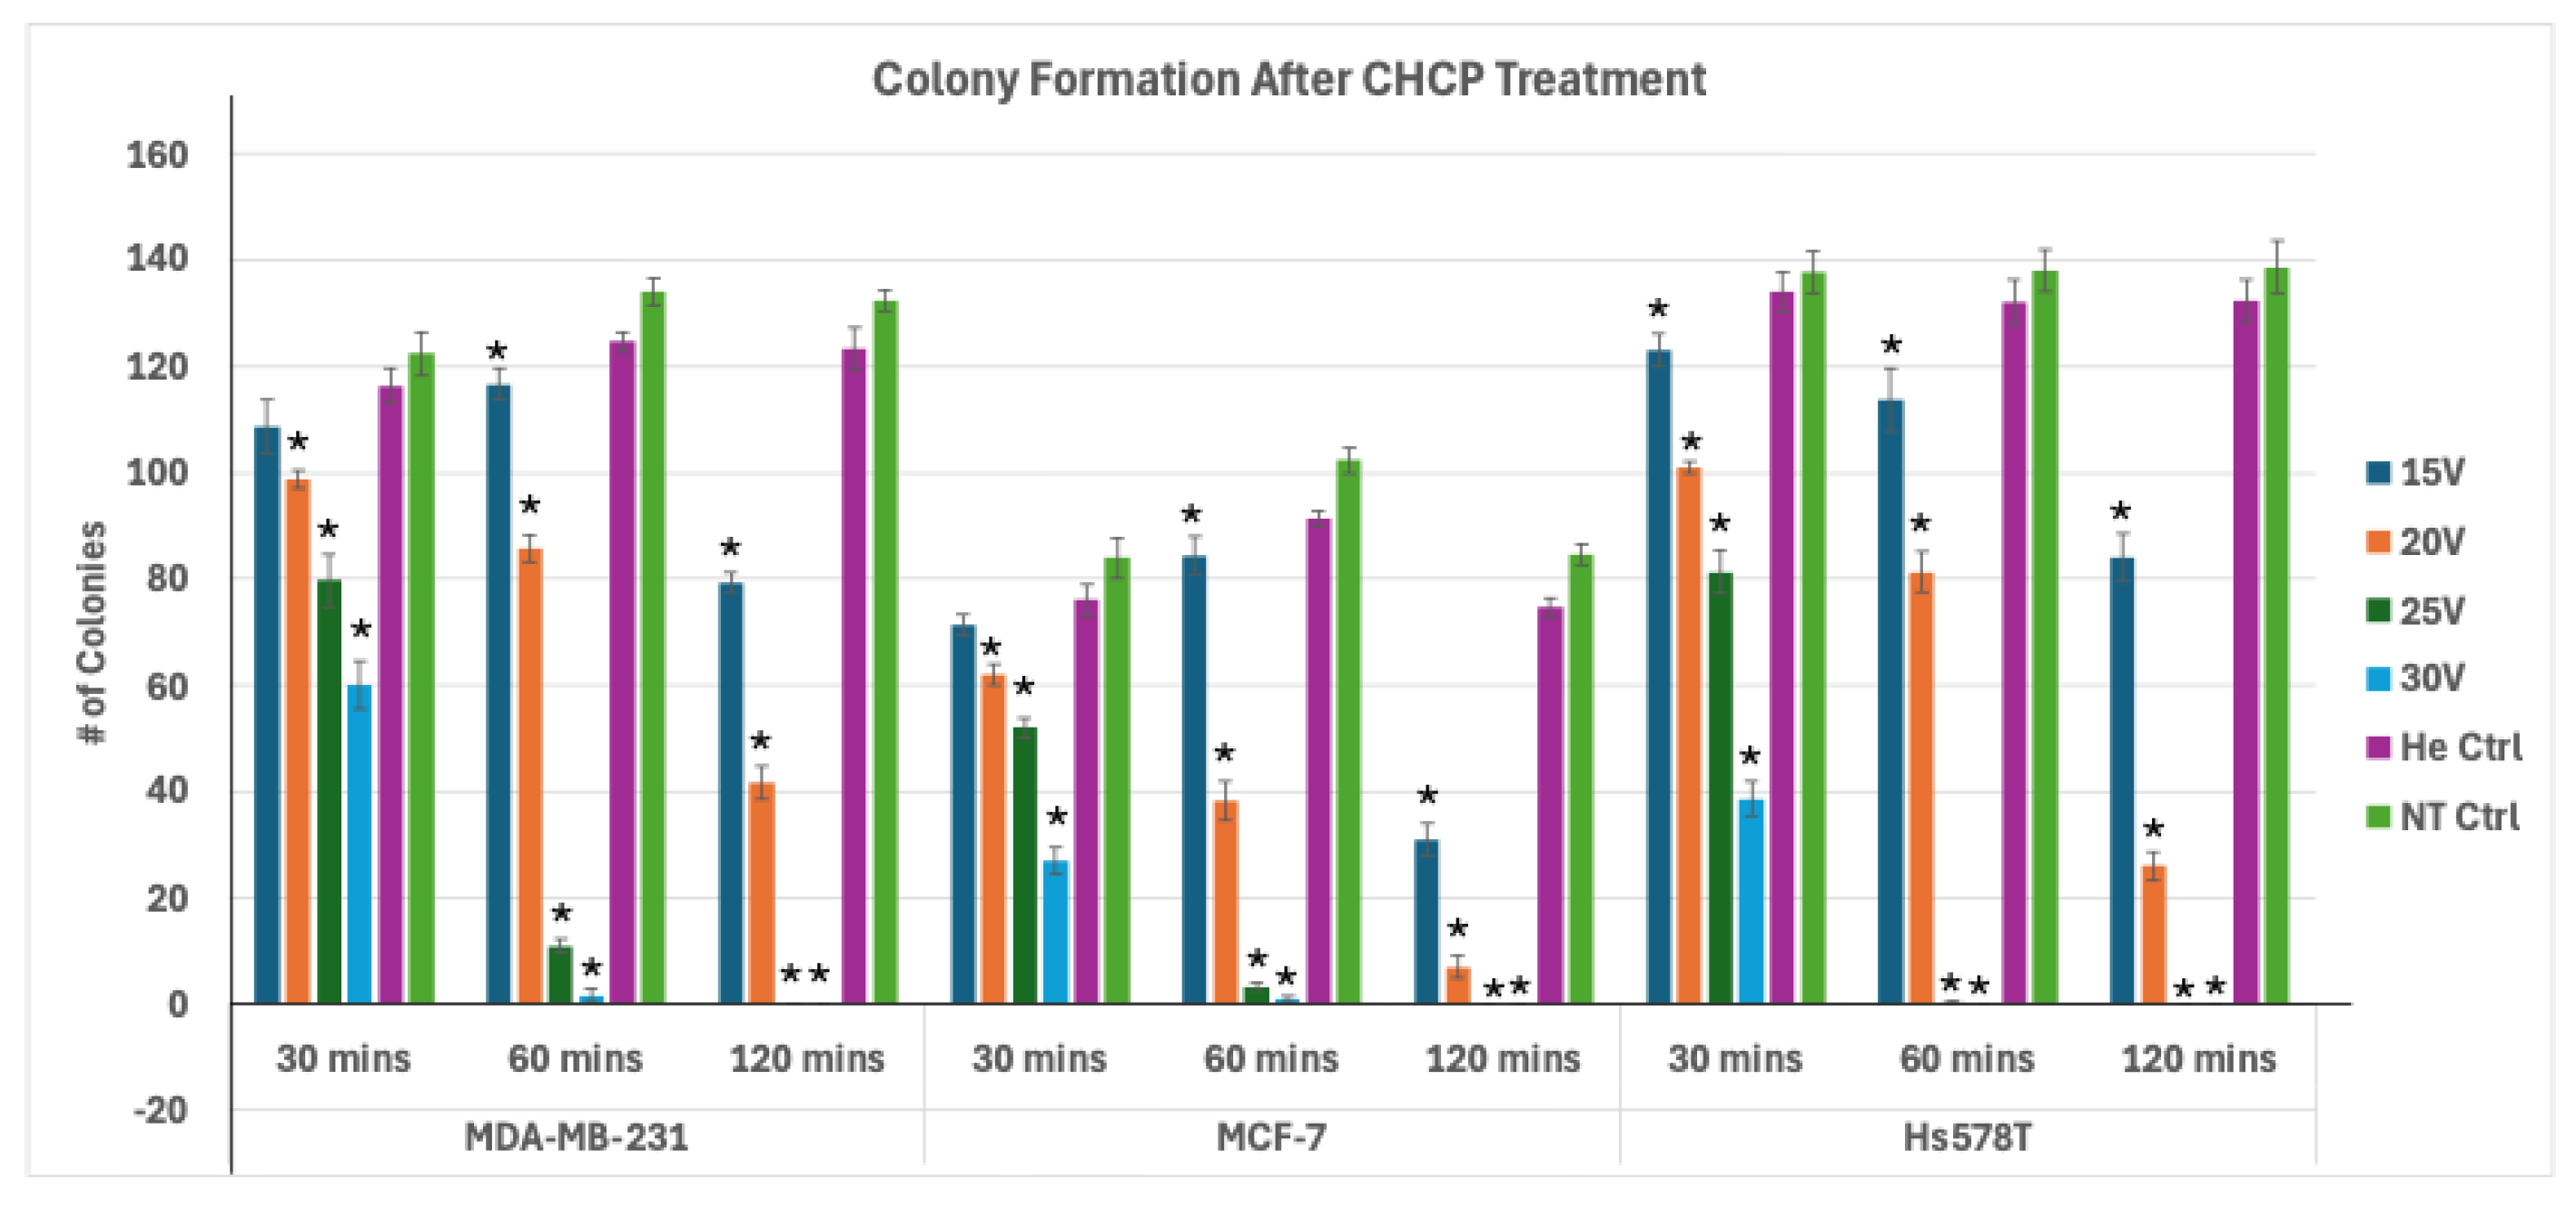
Figure 10.
Light micrographs of H&E-stained Zone 0 tissue samples from patient (A) R0009 (metastatic pleomorphic sarcoma of the left distal femur) and (B) R0004 (metastatic recurrent non-small cell lung adenocarcinoma of the left hip/proximal femur) with or without Canady Helios Cold Plasma (CHCP) treatment, imaged at 63× objective magnification. Black arrows indicate viable untreated tumor cells, red arrows denote CHCP-treated tumor cells exhibiting apoptosis with cellular cytosolic content leakage and while green arrows represent normal cells. Scale bars = 0.2 mm.
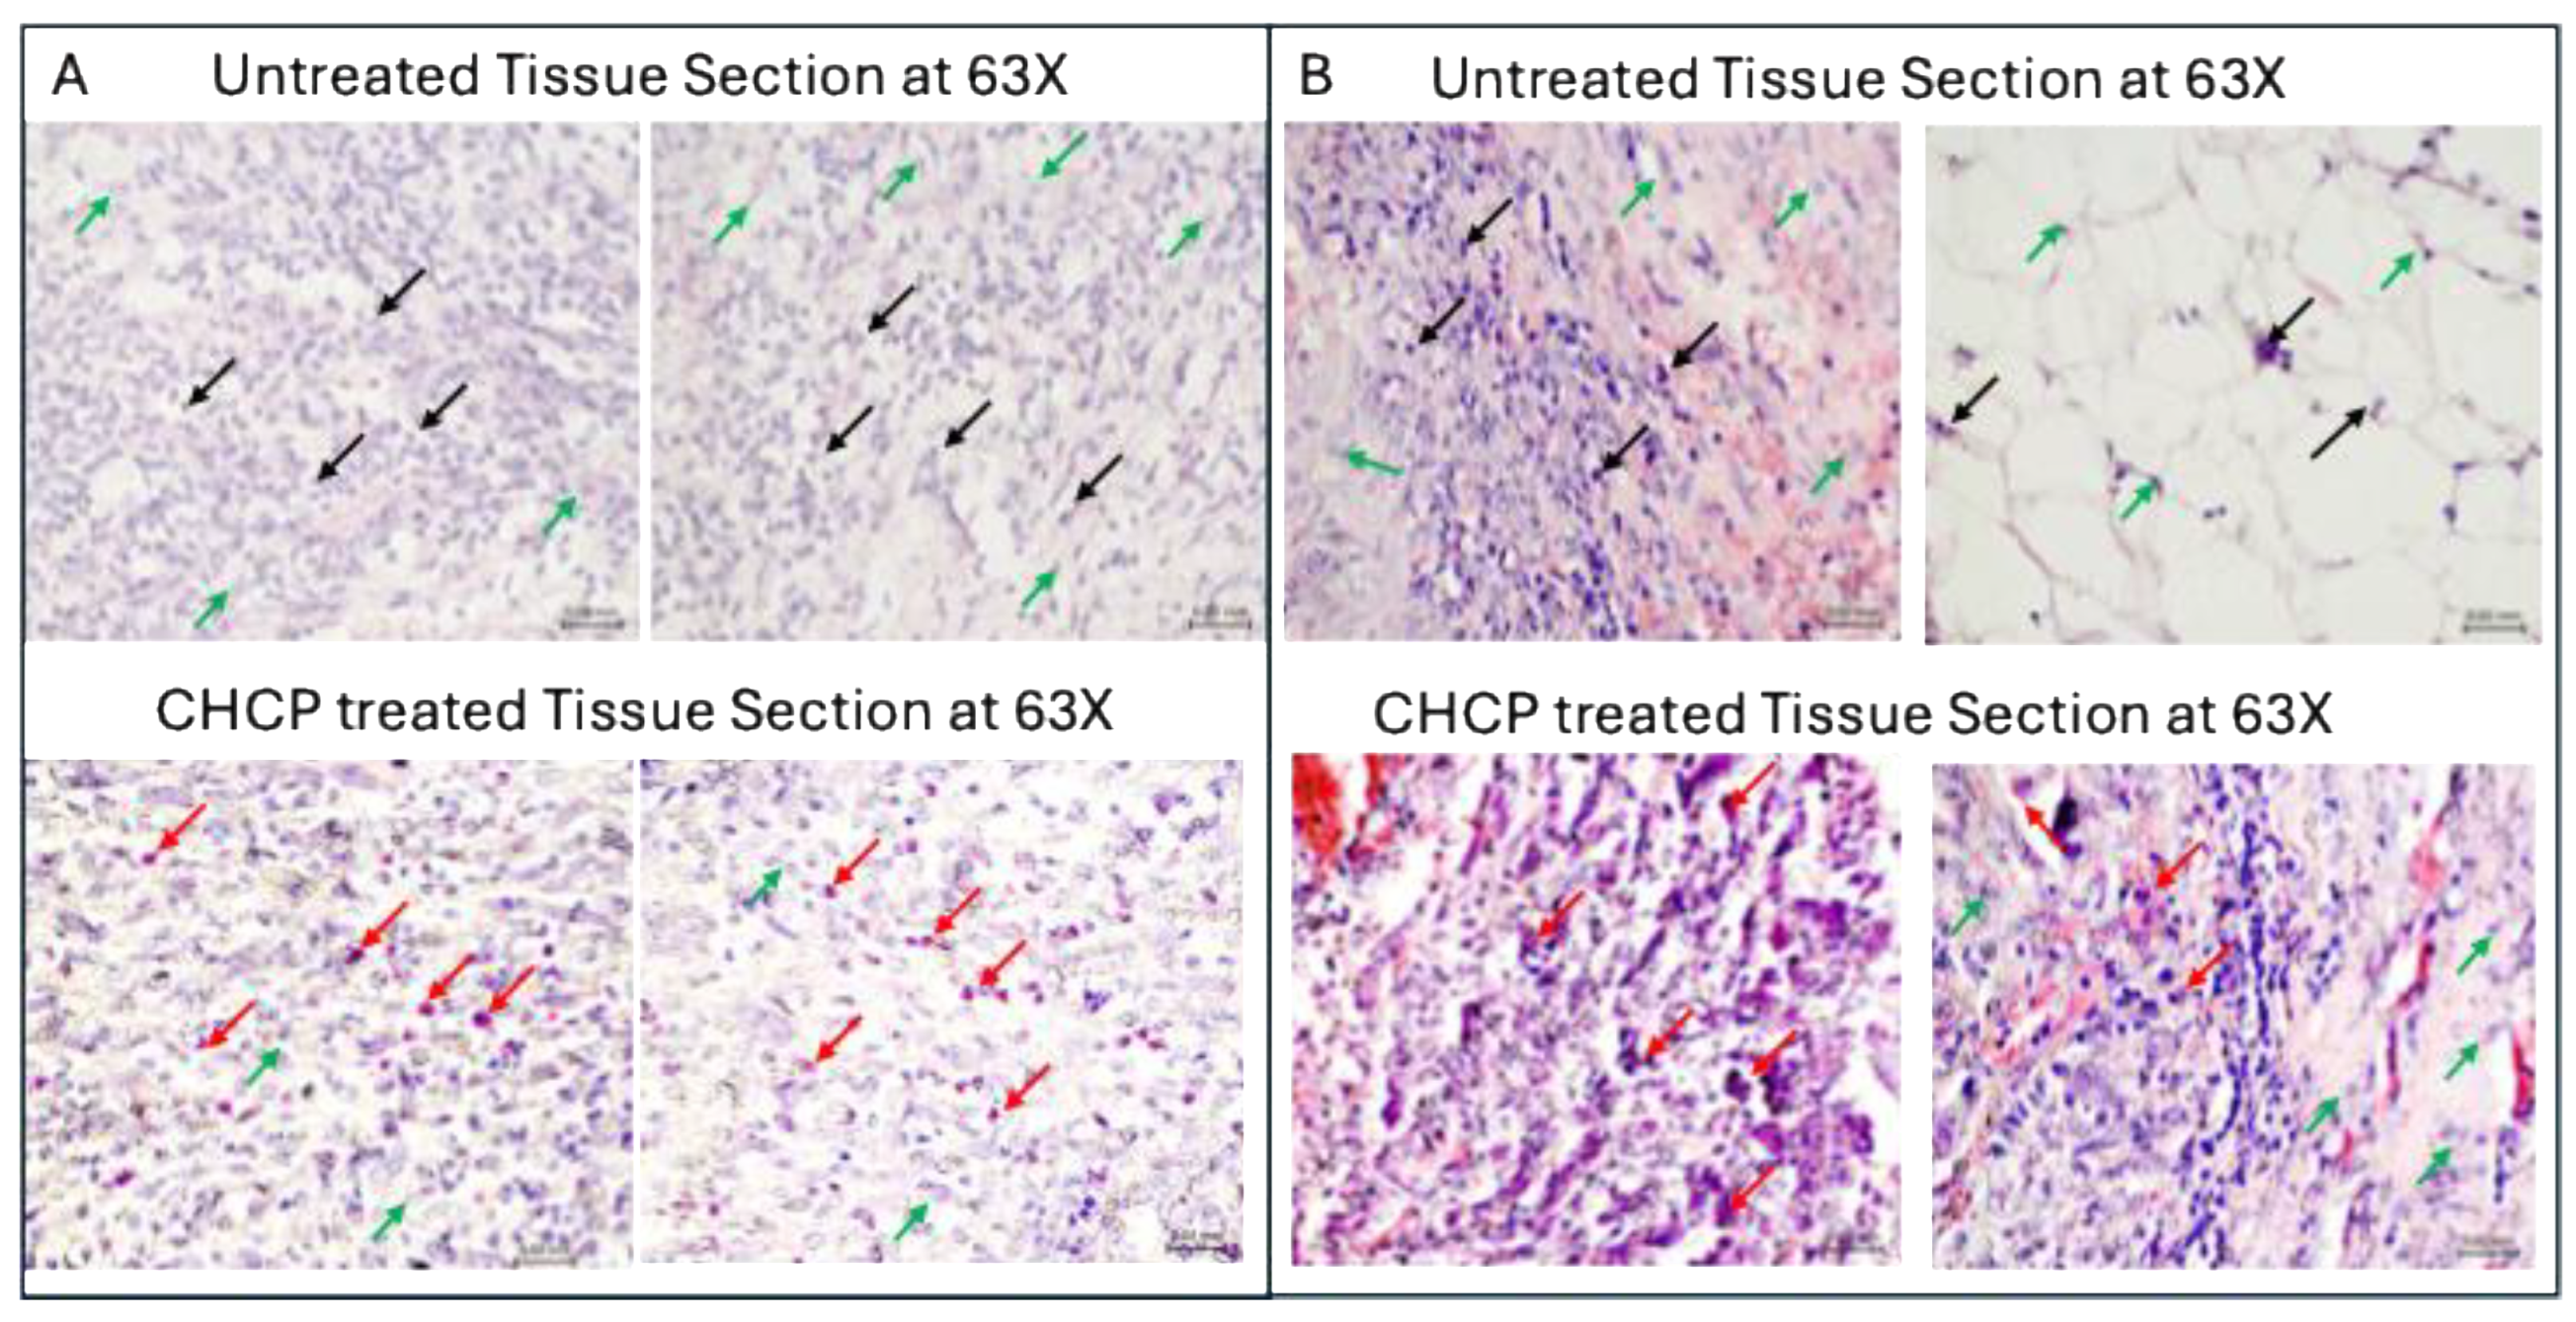

Table 1.
ANOVA Results for Colony Formation Across Cell Lines and Time Points.
| Cell Line | Time Point | F-statistic | p-value |
|---|---|---|---|
| MDA-MB-231 | 30 min | 33.3 | 1.23 × 10⁻⁶ |
| MDA-MB-231 | 60 min | 742.1 | 1.64 × 10⁻¹⁴ |
| MDA-MB-231 | 120 min | 626.3 | 4.52 × 10⁻¹⁴ |
| MCF-7 | 30 min | 63.1 | 3.38 × 10⁻⁸ |
| MCF-7 | 60 min | 353.2 | 1.37 × 10⁻¹² |
| MCF-7 | 120 min | 410.7 | 5.6 × 10⁻¹³ |
| Hs578T | 30 min | 131.1 | 4.84 × 10⁻¹⁰ |
| Hs578T | 60 min | 289.1 | 4.52 × 10⁻¹² |
| Hs578T | 120 min | 358.4 | 1.26 × 10⁻¹² |
Disclaimer/Publisher’s Note: The statements, opinions and data contained in all publications are solely those of the individual author(s) and contributor(s) and not of MDPI and/or the editor(s). MDPI and/or the editor(s) disclaim responsibility for any injury to people or property resulting from any ideas, methods, instructions or products referred to in the content. |
© 2025 by the authors. Licensee MDPI, Basel, Switzerland. This article is an open access article distributed under the terms and conditions of the Creative Commons Attribution (CC BY) license (https://creativecommons.org/licenses/by/4.0/).
Copyright: This open access article is published under a Creative Commons CC BY 4.0 license, which permit the free download, distribution, and reuse, provided that the author and preprint are cited in any reuse.


