
Submitted:
05 October 2025
Posted:
10 October 2025
You are already at the latest version
Abstract
The regulation of carbon dioxide (CO₂) concentration is a fundamental aspect of maintaining safety and habitability in isolated spacecraft environments. Elevated CO₂ levels are known to impair cognitive function, disrupt physiological homeostasis, and increase long-term health risks for crew members during extended missions but can be advantageous for photosynthetic organisms. This study introduces a computational modeling framework to predict CO₂ accumulation and removal dynamics in closed space habitats, integrating parameters such as human metabolic CO₂ production, ventilation performance, chemical scrubbing efficiency, and atmospheric leakage. Data from twelve analog missions conducted in confined habitat environments were analyzed to evaluate diverse operational and crew scenarios. Correlations between multiple environmental and physiological data were taken into consideration. The results demonstrate that variations in crew size, metabolic activity, and life support system efficiency substantially influence atmospheric stability. The findings provide quantitative guidance for defining safe operational thresholds, optimizing scrubber deployment, and establishing redundancy strategies in Environmental Control and Life Support Systems (ECLSS), thereby contributing to the development of resilient life support architectures for future long-duration human spaceflight missions.
Keywords:
analog missions
; circadian rhythms
; carbon dioxide
Introduction
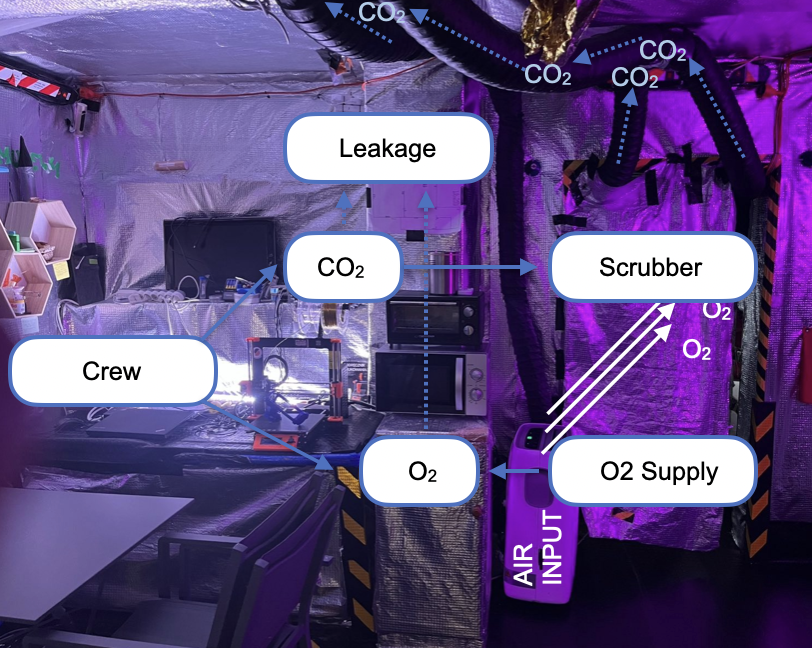
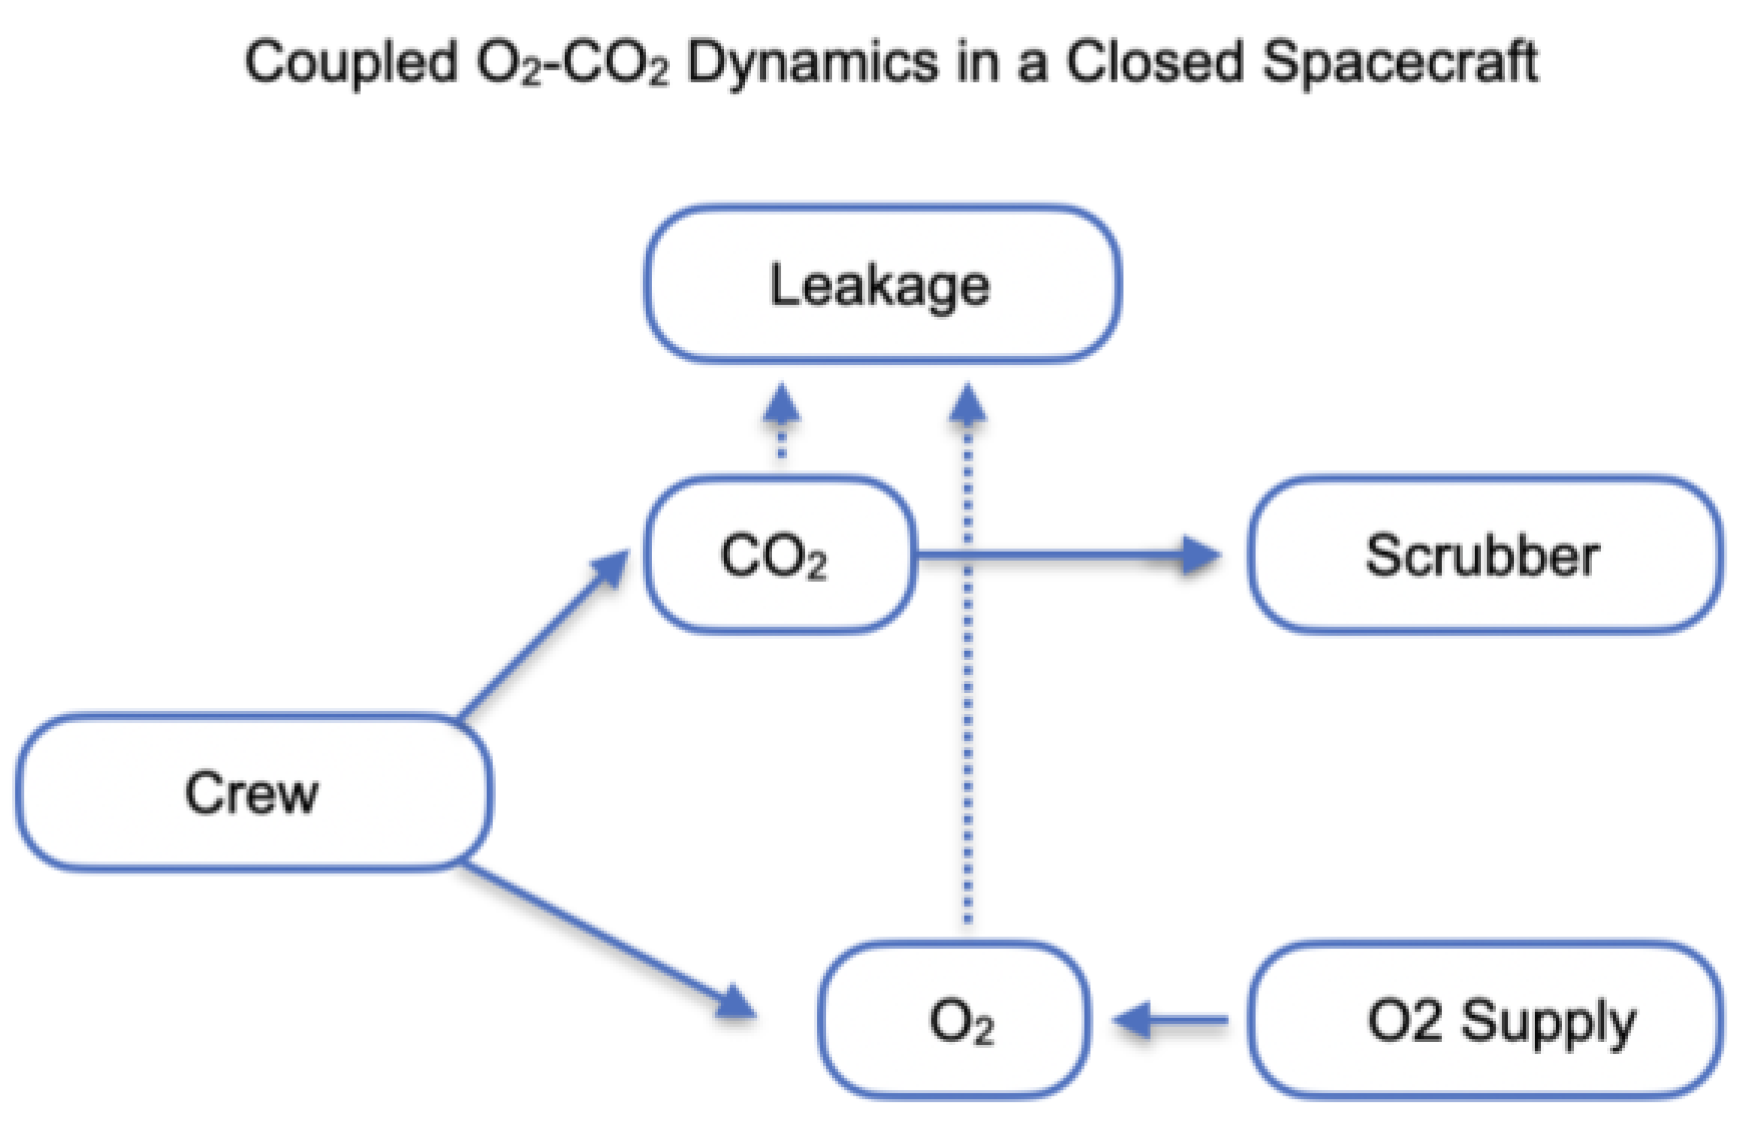
Keeping carbon dioxide (CO₂) at safe levels is one of the most important challenges for human survival in closed space vessels. In such environments, CO₂ naturally builds up from crew breathing, and if not carefully managed, it can reduce alertness, impair health, and threaten mission success (Law et al., 2014; Norcross et al., 2013). By simulating different scenarios—such as varying crew sizes, activity levels, or equipment performance—modeling helps identify conditions where CO₂ could reach unsafe levels and what systems are needed to prevent this. The findings can guide the design and operation of life support systems to make future long-duration missions safer and more reliable for astronauts (Anderson et al., 2018; Perry et al., 2020). Maintaining atmospheric stability in closed spacecraft is vital for crew health and mission success. In particular, carbon dioxide (CO₂) accumulation and oxygen (O₂) depletion must be modelled together, since both arise from metabolic processes and interact with life support systems (Figure 1) (Anderson et al., 2017; Hodgson et al., 2019). The governing equations are formulated as:
where
C(CO₂) and C(O₂) are cabin concentrations, P(CO₂,crew) represent metabolic production/consumption rates dependent on workload and crew size, R(scrubber) is the concentration-dependent CO₂ removal by chemical or physical systems, R(O2, supply) is oxygen resupply (e.g., tanks or electrolysis) and nQ(leak) denotes volumetric leakage. Coupling arises because human respiration links O₂ consumption directly to CO₂ generation, approximately in a fixed ratio given by the respiratory exchange ratio (RER) (Guyton & Hall, 2016; Gunga, 2015). Simulations investigate how variations in RER, metabolic load, scrubber degradation, and oxygen generation efficiency influence overall cabin atmosphere stability. Model outputs are benchmarked against International Space Station (ISS) telemetry and ground-based chamber studies (NASA, 2016; Perry et al., 2020). Results highlight the emergence of critical thresholds, where small perturbations in life support efficiency can destabilise both O₂ and CO₂ levels. The framework provides quantitative guidance for Environmental Control and Life Support System (ECLSS) design, redundancy requirements, and operational safety margins in long-duration exploration-class missions (Hodkinson & Andrus, 2003; Perry et al., 2019; Anderson et al., 2018).
Figure 1.
Environmental dynamics of the fluctuating atmosphere in the isolated habitat.
Human habitation in confined and isolated environments such as spacecraft, submarines, or future lunar and Martian habitats requires precise management of atmospheric composition, particularly with regard to carbon dioxide (CO₂) and oxygen (O₂). In these settings, human respiration continuously increases CO₂ concentrations while depleting O₂, and without intervention, atmospheric quality can rapidly reach levels detrimental to health, sleep quality, and cognitive performance (Law et al., 2014; Norsk, 2020). Traditional physicochemical methods for CO₂ removal, including liquid absorption, solid sorbents, and catalytic reduction through the Sabatier process, are technologically mature and widely applied on the International Space Station (ISS), but they remain energy intensive and dependent on consumables (Hemmeck et al., 2019; Perry et al., 2021). These limitations highlight the need for complementary and sustainable life support strategies. Although the main principles are known in general, there is a missing gap regarding the crew composition. In this work we focused particularly on this parameter to determine how biodiversity in humans, especially circadian rhythms in confined space affect levels of CO2 in isolated environments.
Materials and Methods
Twelve analog missions were performed in AATC habitat 57m2 (131 m3) designed in a way that ventilation was limited allowing observations of elevated CO2 levels inside. Fresh air was delivered in the central module of the base, while used air was removed through ventilation pipes assembled in each of 5 habitat's modules: bedroom, galley, geo-lab, gym, hygienic. 18 environmental sensors Netatmo were distributed as life support systems regularly in the habitat in order to collect temperature, humidity, noise, CO2 levels, power consumption and light intensity. Sensors were located 1m above ground level. Localisation of sensors is presented on Figure 2.
Figure 2.
Distribution of cameras and sensors in the AATC habitat for remote control. Green squares depict sensors used in this study. Orange circles show input for fresh air, and output for ventilation implemented in each module.
Figure 2.
Distribution of cameras and sensors in the AATC habitat for remote control. Green squares depict sensors used in this study. Orange circles show input for fresh air, and output for ventilation implemented in each module.
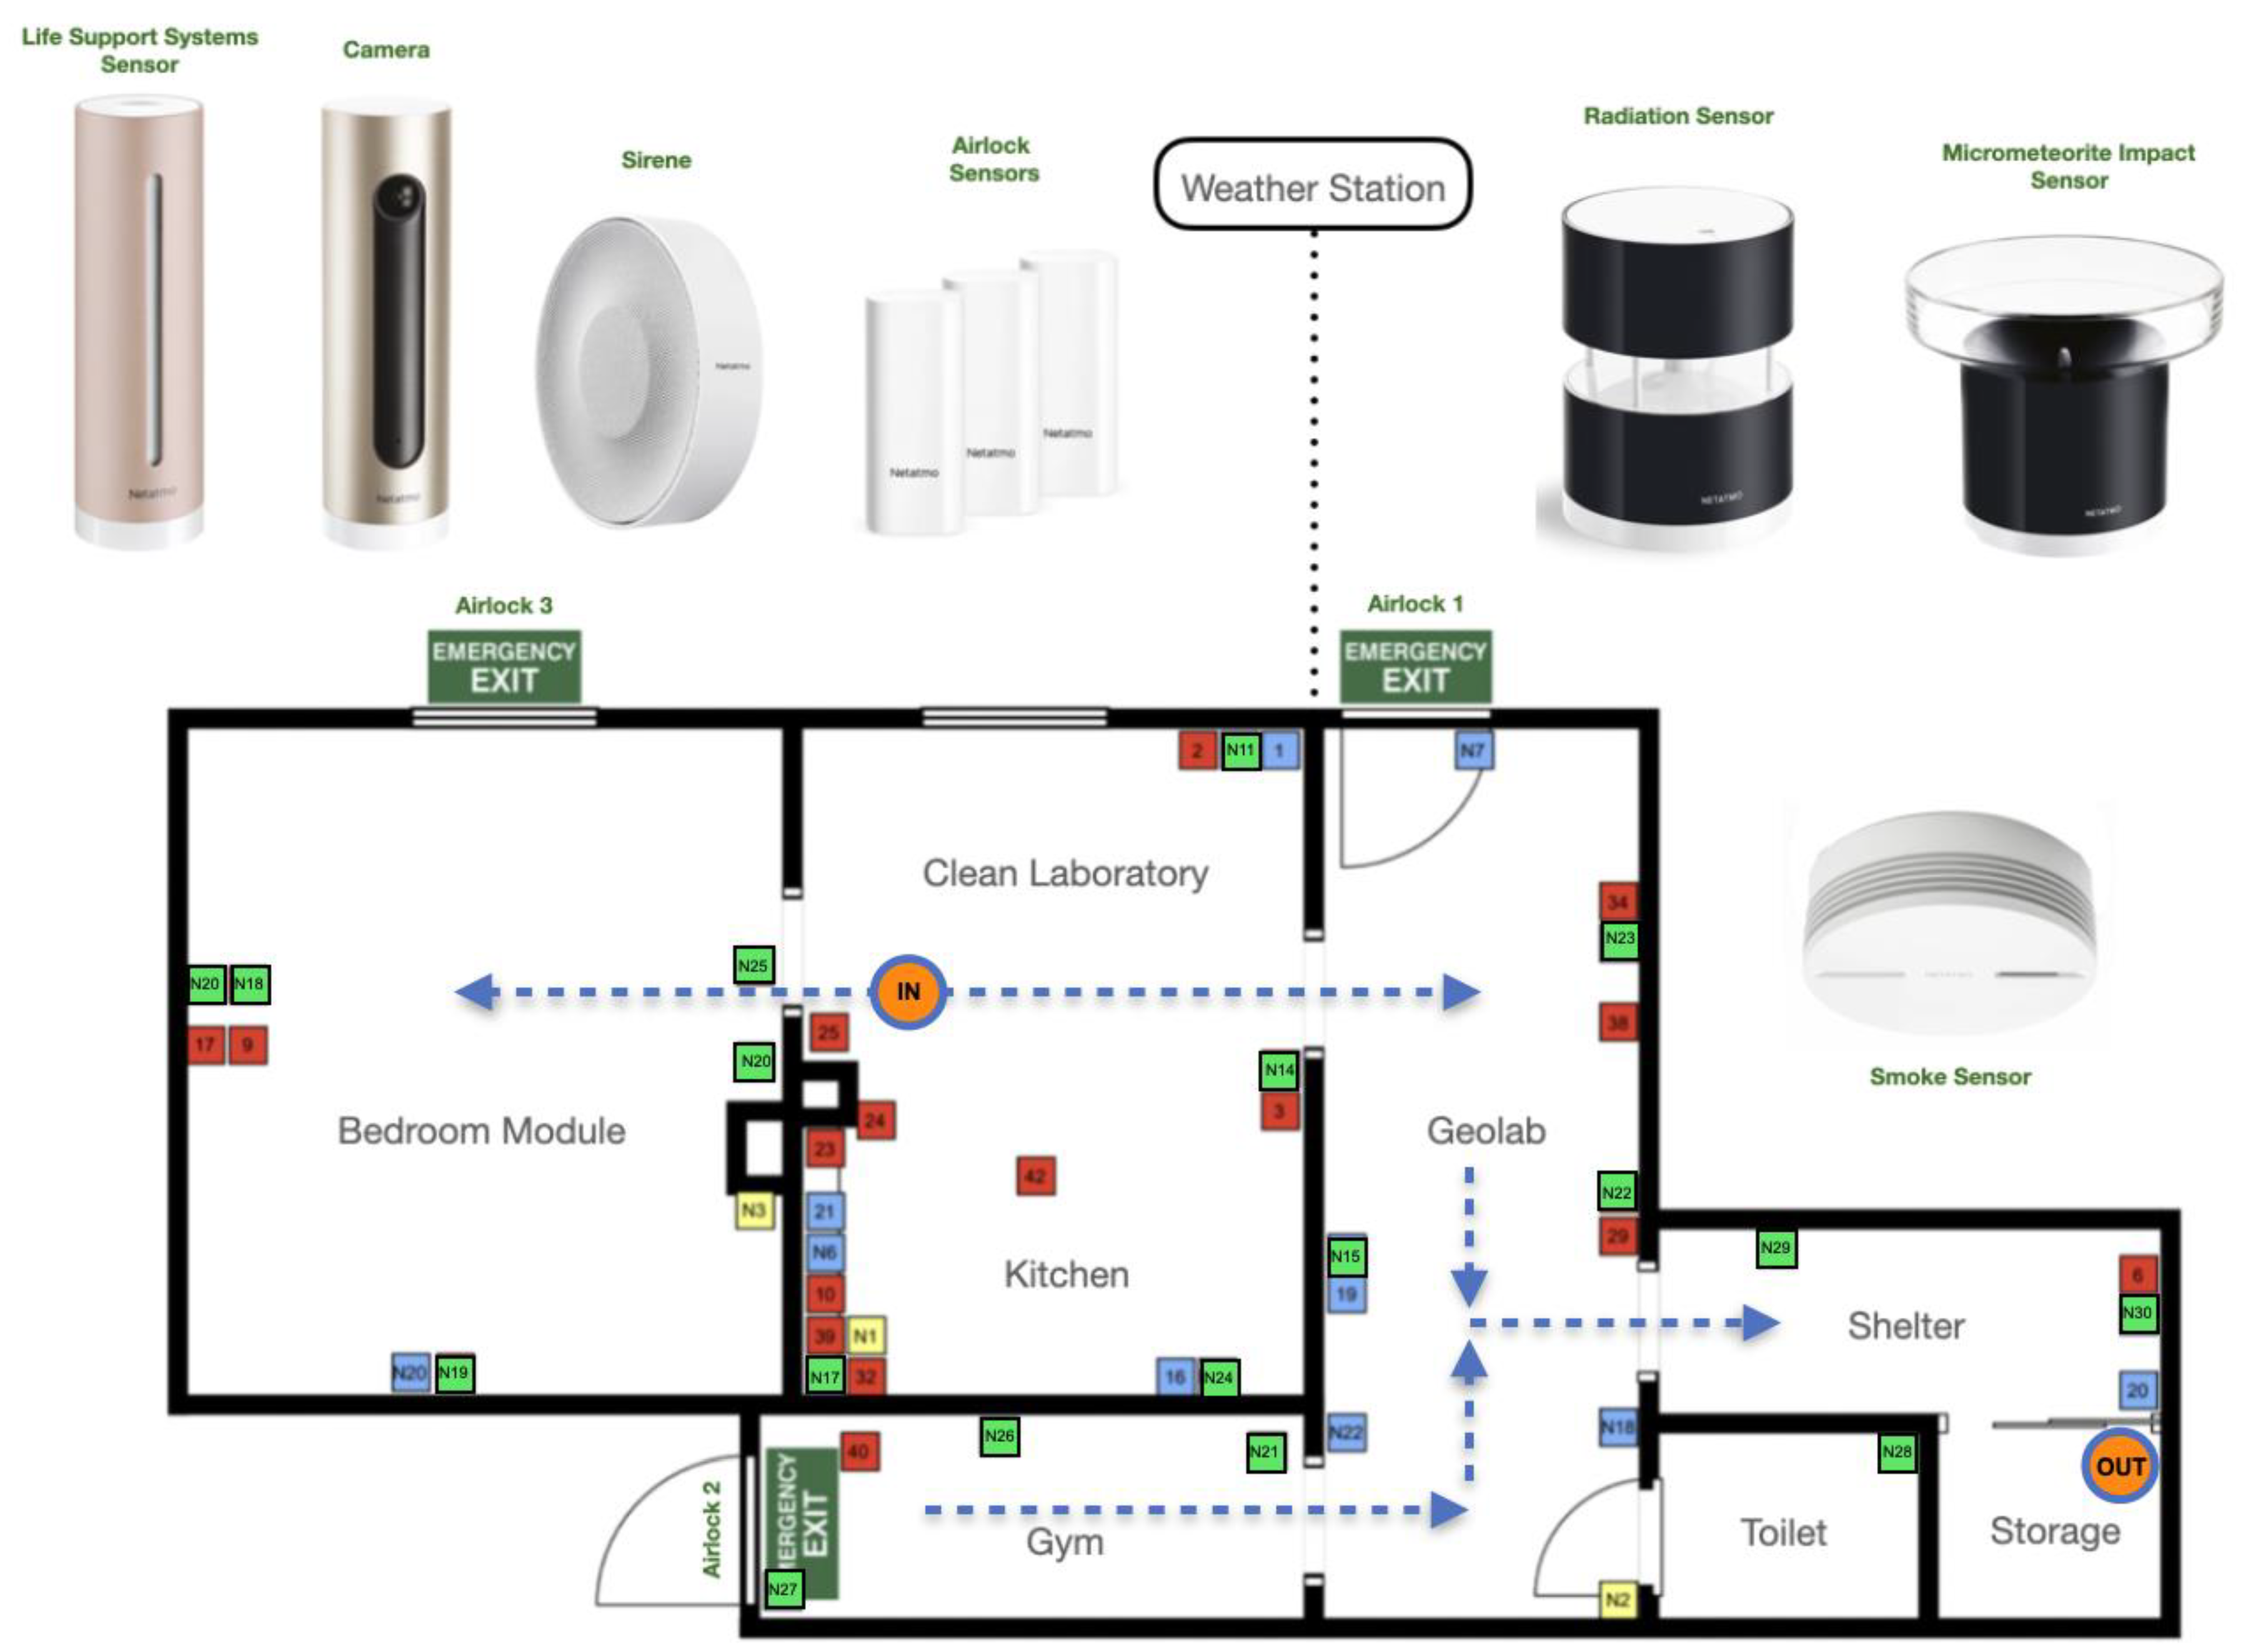
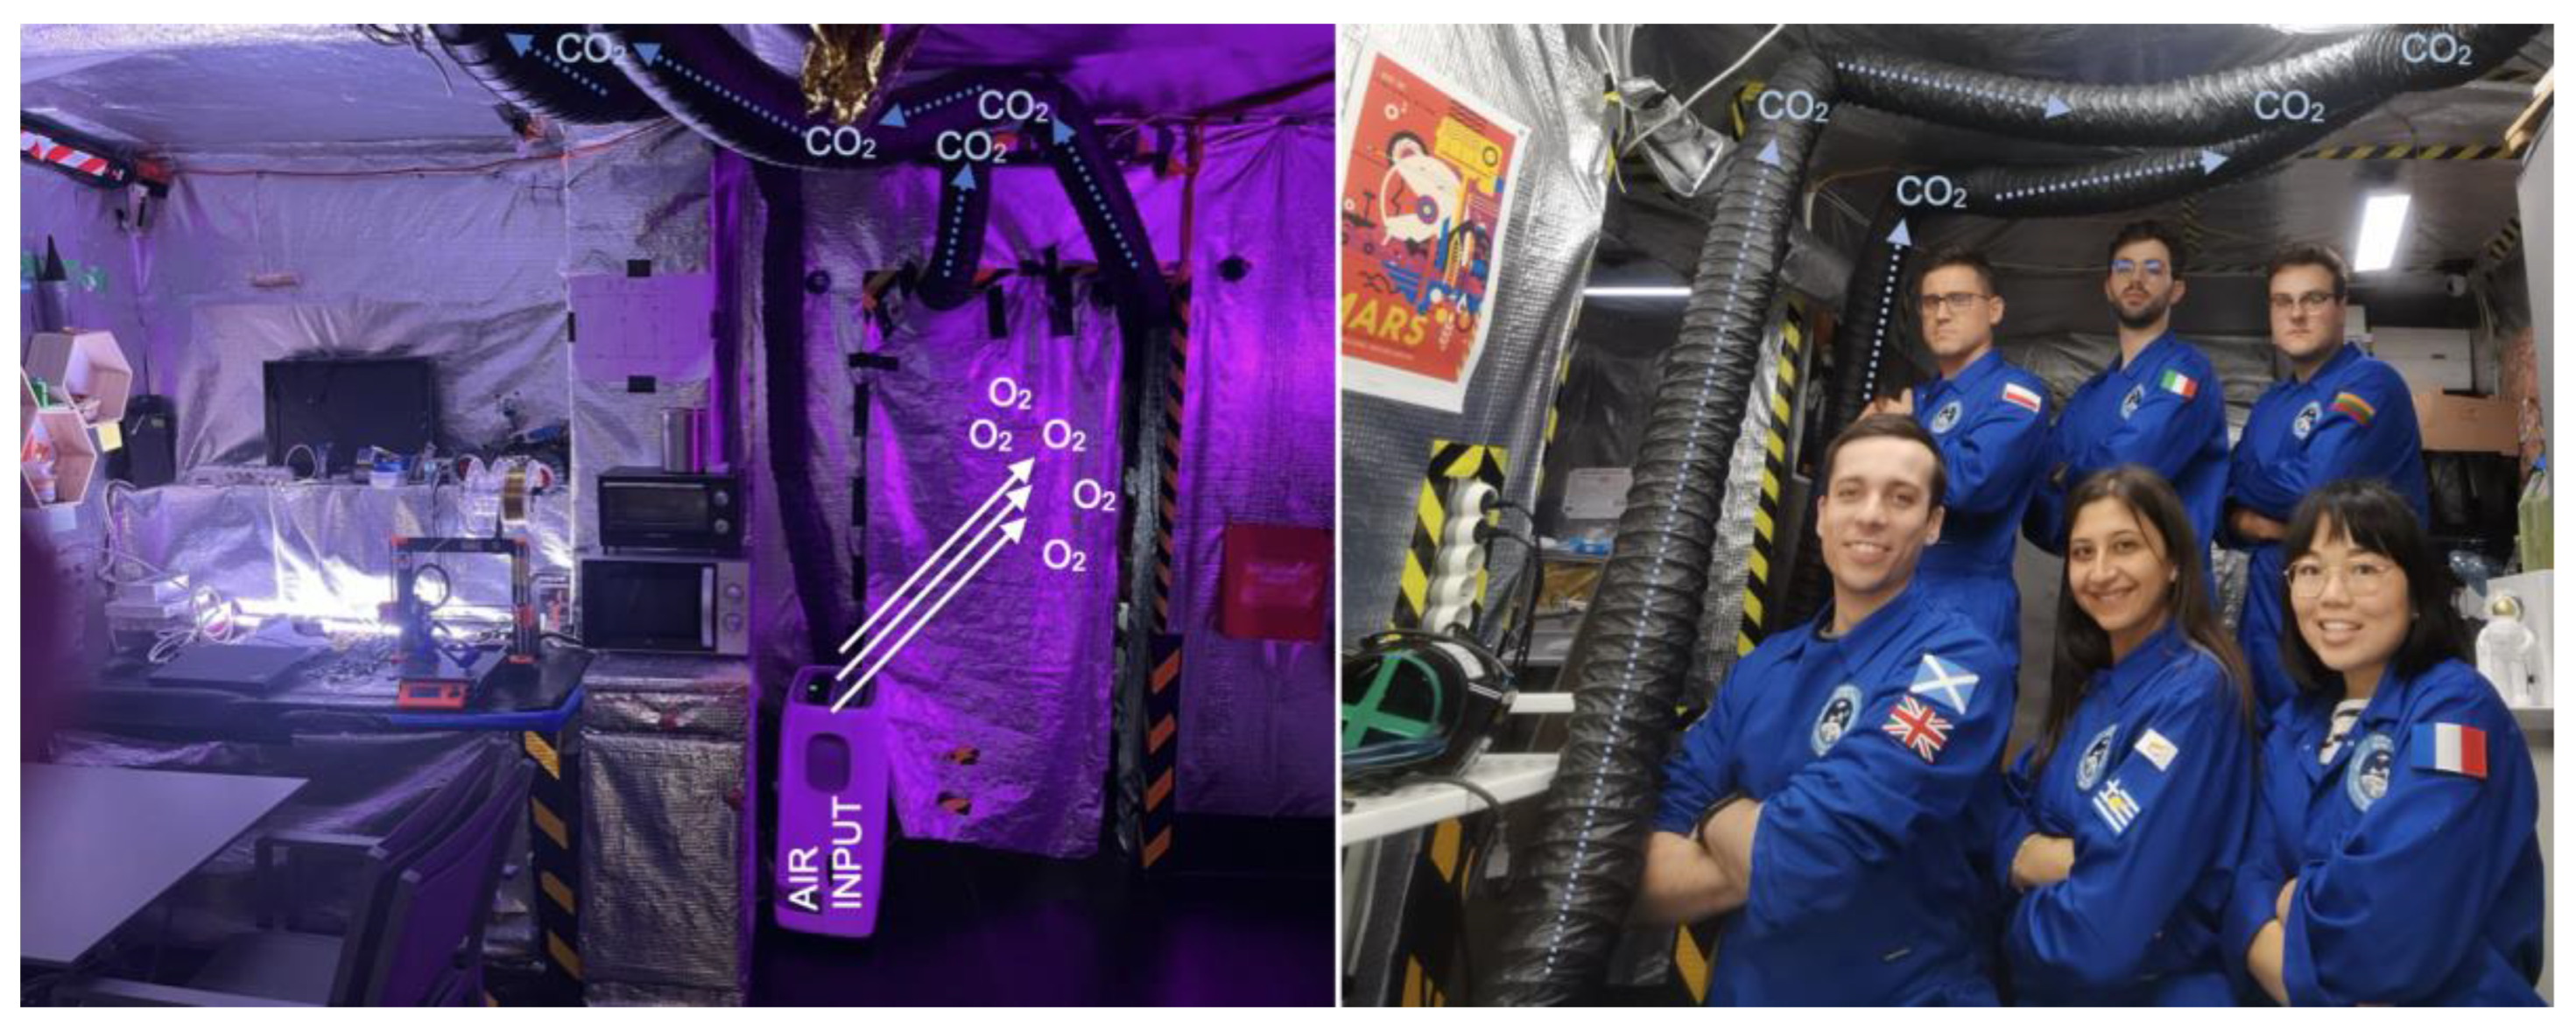
Figure 3.
Photographies from organized missions with assembled ventilation pipes. Fresh air was provided by the air conditioner (Climative) connected to the ventilation shaft. EXP40 Crew - Yurija.
Figure 3.
Photographies from organized missions with assembled ventilation pipes. Fresh air was provided by the air conditioner (Climative) connected to the ventilation shaft. EXP40 Crew - Yurija.
60 international volunteers aged 19-29 participated in standardized analog missions organized by AATC. Each mission was 7 days long and had a similar schedule and procedures. For this study we selected for comparison 3 types of missions having on board 4, 5 and 6 people crews.
Crew composition was different not only regarding number of participants, but also regarding gender and physical activity levels. Details of crew characteristics are listed in Table 1.
Statistical Analysis
Environmental parameters monitored during the analog missions (e.g., temperature, humidity, CO₂ concentration, and light intensity) were statistically analyzed to assess temporal variability and inter-mission differences. All data analyses were performed using Python (version 3.10) with the libraries pandas, scipy.stats, numpy, and matplotlib for data processing, hypothesis testing, and visualization. Prior to analysis, datasets were examined for normality using the Shapiro–Wilk test and for homogeneity of variances using Levene’s test. For parameters meeting the assumptions of normality and homoscedasticity, a one-way Analysis of Variance (ANOVA) was applied to evaluate whether statistically significant differences existed among mission groups or time intervals. Post-hoc pairwise comparisons were performed using the Tukey’s Honestly Significant Difference (HSD) test to identify specific group differences. In cases where normality or homogeneity assumptions were violated, the Kruskal–Wallis H-test, a non-parametric alternative to ANOVA, was employed to compare median values across groups. When significant differences were detected (p < 0.05), Dunn’s post-hoc test with Bonferroni correction was used to determine which pairs of missions or time points differed significantly. In addition, Spearman’s rank correlation coefficient (ρ) was calculated to assess the strength and direction of monotonic relationships between environmental variables, providing insights into interdependencies (e.g., between CO₂ concentration and humidity or temperature). All results were expressed as mean ± standard deviation (for normally distributed data) or median with interquartile range (for non-normally distributed data). Statistical significance was accepted at p < 0.05. Graphical representations, including boxplots, correlation matrices, and error-bar plots, were generated to illustrate trends, associations, and variability in the environmental parameters across mission scenarios.
Results
CO2 Levels Change According to Synchronised Circadian Rhythms of the Astronaut Crew
Human CO₂ production (i.e., the rate of metabolic CO₂ output) varies with circadian phase, reflecting underlying rhythms in metabolism, body temperature, and energy expenditure. These fluctuations persisted under constant environmental conditions, showing that they were endogenously driven by the body’s internal clock. Resting metabolic rate (RMR) and CO₂ production (V̇CO₂) were lowest during the biological night (typically around 2–6 a.m.) and highest during the biological afternoon or early evening (around 4–8 p.m.). Studies in constant routine protocols (no sleep–wake or light–dark cues) confirm that this rhythm is circadian, not just behavioral. The amplitude of variation is modest — typically 5–15% difference between circadian trough and peak. The rhythm parallels changes in core body temperature, oxygen consumption (V̇O₂), and CO₂ production rate, indicating coupling to the circadian metabolic system. In confined space-analog habitats, this rhythm very often was phase-shifted or attenuated due to altered light exposure, sleep timing, and atmospheric CO₂ accumulation (Figure 4).
Human circadian physiology exhibits a biphasic pattern of alertness, characterized by two predictable declines within a 24-hour cycle: a major nadir occurring in the early morning hours (approximately 02:00–04:00) and a secondary reduction in alertness during the early afternoon (approximately 12:00–15:00), commonly referred to as the post-lunch dip or siesta period. This biphasic rhythm persists under controlled laboratory or habitat conditions in which participants are maintained under constant environmental factors—such as fixed light exposure, ambient temperature, and food availability—indicating that it is an endogenous circadian phenomenon rather than a product of behavioral or environmental influences (Cajochen et al., 2002; Monk, 2005; Dijk & Czeisler, 1995). The master circadian pacemaker located in the suprachiasmatic nucleus (SCN) orchestrates daily rhythms in alertness and metabolism through multiple physiological pathways, including regulation of core body temperature, hormonal secretion (e.g., cortisol, melatonin, and insulin sensitivity), and autonomic activity. During the midday-to-early-afternoon period, a transient decline in core body temperature is typically observed, corresponding with reduced activity in arousal-promoting regions of the hypothalamus and brainstem, a decrease in metabolic rate, and diminished vigilance. This thermoregulatory cooling phase represents a conserved circadian mechanism facilitating temporary energy conservation prior to the evening activity phase (Czeisler et al., 1999; Kräuchi & Wirz-Justice, 1994). Recognition of these intrinsic physiological oscillations has potential implications for the design of bioregenerative life support systems in space habitats. Specifically, circadian-based modulation of ventilation rates could be synchronized with the human metabolic rhythm to optimize carbon dioxide transfer toward plant cultivation modules during periods of elevated CO₂ production.
Larger Crews Tend to Exhibit More Consistent Behavioural Patterns in Activity and Sleep Cycles
The sleep phases of the participants were monitored using Xiaomi smart bands. An intriguing behavioural pattern was observed, the nature of which appeared to be contingent upon the number of crewmates present. In smaller teams, the rhythm of the day was more individualised, whereas in larger teams, synchronised rhythms and adaptation for limited, confined space were detected (Figure 5).
Distribution of Environmental Parameters During Confined Analog Missions
Time pacemakers are not only light-dependent. In the case of performing 12 analog missions, crews were exposed to other factors influencing circadian rhythmicity such as social interactions, common meals and temperature fluctuations. Figure 6 presents the distribution of environmental parameters during the experimental period.
Data revealed variations in environmental parameters induced by the crew presence inside confined space. Therefore the next step was to analyze possible correlations and determinants of observed phenomena. Figure 7 shows a diagram from all missions for CO2 distribution during the mission.
Overall, the fluctuations in CO₂ concentration between missions did not differ significantly; however, variations were observed even among missions with identical crew size and gender composition. For instance, missions consisting of four female crew members exhibited distinct mean CO₂ levels. Pearson correlations: CO2 vs Male_quantity [r=0.0987, p=0.4451 (<0.05)], CO2 vs TotalBiomass [(r=0.2734, p=0.0315 (<0.05)] and Male_quantity vs TotalBiomass [ r=0.2734, p=0.1359 (>0.05). In conclusion, there is a weak but significant relationship between TotalBiomass and CO2.
Discussion
Bioregenerative life support systems (BLSS) offer a promising alternative by integrating photosynthetic organisms into the habitat architecture (Drysdale et al., 2003; Wheeler, 2010). Plants naturally consume CO₂ during photosynthesis, releasing O₂ as a byproduct, while simultaneously providing food production and psychological benefits to the crew. Controlled-environment agriculture studies have demonstrated that plants grow more efficiently under elevated CO₂ compared to Earth’s ambient 400–600 ppm, with enrichment to approximately 1000–2000 ppm leading to increased photosynthetic rates, biomass accumulation, and improved water-use efficiency (Kimball, 1983; Tubiello et al., 1999; Long et al., 2006). These findings suggest that in confined habitats, where CO₂ levels often exceed terrestrial norms, plant modules could serve not only as food production systems but also as natural gas regulators.
However, there exists a fundamental divergence between human and plant responses to CO₂ exposure. For humans, concentrations above ~1000 ppm are linked to reduced sleep quality, impaired cognition, and headaches (Strøm-Tejsen et al., 2016; Basner et al., 2021). More severe impairments appear beyond 2500 ppm, while occupational safety limits set 5000 ppm as the maximum permissible long-term exposure (OSHA, 2012). In contrast, many crop species achieve their optimal growth performance near 1500–2000 ppm (Leakey et al., 2009; Körner, 2016). This discrepancy necessitates the development of controlled gas-exchange interfaces between crew habitats and plant growth modules, ensuring that elevated CO₂ can be exploited for plant productivity without endangering human health.
One practical engineering solution is the implementation of low-energy ventilation systems designed to selectively transfer CO₂- rich air from the habitat into plant modules while returning O₂- enriched air back to the crew quarters. Such systems could be coupled with sensors and control algorithms to maintain human CO₂ exposure below recommended thresholds while simultaneously supporting photosynthetic efficiency in crops. This approach aligns with the principles of closed ecological life support (CES), reducing the operational burden on physicochemical scrubbers and transforming metabolic waste into a valuable resource (Gitelson et al., 2003; Nelson et al., 2018). The integration of ventilation-controlled plant modules thus represents not only an environmental management strategy but also a pathway toward sustainable and resilient long-duration human missions beyond Earth. To reduce CO₂ concentration from 2000 ppm to 500 ppm in a 25 m³ sealed habitat (e.g. bedroom module), the plants (or other scrubbers) must remove approximately 1.5 mol CO₂, or ≈ 67 grams of CO₂ from the air. Microalgae in well-designed photobioreactors (high cell densities, continuous illumination, forced mixing) can achieve much higher CO₂ fixation per unit ground area or volume than typical higher-plant leaf area, potentially reducing footprint by an order of magnitude. Exact numbers depend on culture productivity (g dry biomass·m⁻²·day⁻¹ or g·L⁻¹·day⁻¹) and engineering design. Effective carbon dioxide (CO₂) control is essential for maintaining atmospheric stability in closed or semi-closed environments such as spacecraft, planetary habitats, and analog research modules. One of the most established approaches for CO₂ reduction and partial oxygen recovery in space systems is the Sabatier process, which catalytically reduces CO₂ using hydrogen (H₂) to produce methane (CH₄) and water (H₂O). The resulting water can be electrolyzed to regenerate oxygen, thus creating a closed-loop oxygen recovery system when integrated with electrolysis units (Anderson et al., 2018; Perry et al., 2019). While the reaction itself does not directly yield O₂, coupling it with electrolysis allows for partial O₂ recovery from metabolically generated CO₂, significantly improving the resource efficiency of the Environmental Control and Life Support System (ECLSS). Operational on the International Space Station (ISS) since the early 2010s, the Sabatier Reactor achieves CO₂ conversion efficiencies of approximately 50–75% per pass, yielding an overall oxygen recovery rate of 50–60% when integrated with electrolysis (Anderson et al., 2017; Perry et al., 2020). Though theoretical efficiencies exceeding 90% are possible, real-world constraints—including energy demand, catalyst degradation, and system integration losses—limit performance. Consequently, the Sabatier system functions primarily as a CO₂ management and water recovery technology, rather than a primary oxygen generator (Law et al., 2014). In habitat-scale modeling, the potential O₂ recovery from ambient CO₂ concentrations (e.g., reducing CO₂ from 2000 ppm to 600 ppm) is negligible relative to human metabolic oxygen demand, underscoring the need for complementary or hybrid scrubbing technologies. Beyond the Sabatier process, several alternative and emerging CO₂ scrubbing strategies are applicable for confined habitats. Physicochemical methods such as amine absorption, zeolite or metal-organic framework (MOF) adsorption, and lithium hydroxide (LiOH) chemical absorption remain the most reliable options for short- to medium-duration missions (Hodkinson & Andrus, 2003; Perry et al., 2019). Electrochemical and catalytic systems, including regenerative membrane pumps and electrolysis-coupled CO₂ reduction, are under active development to improve energy efficiency (Hodgson et al., 2019). Bioregenerative systems, such as algal photobioreactors or higher-plant growth chambers, offer CO₂ sequestration coupled with O₂ production and food generation, as demonstrated in the ESA MELiSSA project and BIOS-3 experiments (Gitelson et al., 2003; Lasseur et al., 2010). Probably the most sustainable solution are hybrid configurations—combining physicochemical scrubbers, catalytic CO₂ reduction, and biological systems for long-duration, sustainable life-support architectures on the Moon or Mars.
Data Management and Quality Control
Data was stored in encrypted cloud and USB backups.
Declarations
The study was approved by the Bioethical Committee at the Medical University of Kraków (685/17) and the AATC program director, consistent with the Helsinki Declaration. Signed Informed Consent Statement from all volunteers who participated in the study was obtained. The authors report no competing interests.
References
- Anderson, M. S., Bagdigian, R. M., & Knox, J. C. (2017). Life Support Baseline Values and Assumptions Document. NASA Technical Report NASA/TP-2017-219462.
- Anderson, M. S., Perry, J. L., & Knox, J. C. (2018). Advances in NASA's Environmental Control and Life Support (ECLSS) Systems for Exploration Missions. NASA Johnson Space Center.
- Gunga, H.-C. (2015). Human Physiology in Extreme Environments. Academic Press.
- Guyton, A. C., & Hall, J. E. (2016). Textbook of Medical Physiology (13th ed.). Elsevier.
- Hodgson, E. , Perry, J. L., & Anderson, M. S. Atmospheric Monitoring on the International Space Station. Acta Astronautica, 2019, 157, 230–239. [Google Scholar]
- Hodkinson, J. R. , & Andrus, J. F. Atmospheric Revitalization for Manned Spacecraft. Journal of Spacecraft and Rockets, 2003, 40, 842–853. [Google Scholar]
- Law, J., Watkins, S., Alexander, D. (2014). In-Flight Carbon Dioxide Exposures and Related Symptoms: Association, Susceptibility, and Operational Implications. NASA Technical Report NASA/TP–2014–218556.
- Norcross, J. R., et al. (2013). CO₂ Exposure on the International Space Station: Physiological and Operational Implications. NASA Johnson Space Center, JSC-65795.
- Perry, J. L., Knox, J. C., & Bilardo, V. J. (2019). Recent Developments in Atmospheric Revitalization for Spacecraft. 46th International Conference on Environmental Systems (ICES), Vienna, Austria.
- Perry, J. L. , Knox, J. C., & Anderson, M. S. Integrated Atmosphere Revitalization System Modeling for Long-Duration Space Missions. Acta Astronautica, 2020, 171, 324–334. [Google Scholar]
- NASA. (2016). International Space Station Environmental Control and Life Support (ECLSS) Overview. NASA Fact Sheet FS-2016-09-088-JSC.
- Anderson, M. S., Bagdigian, R. M., & Knox, J. C. (2017). Life Support Baseline Values and Assumptions Document. NASA Technical Report NASA/TP–2017–219462.
- Anderson, M. S., Perry, J. L., & Knox, J. C. (2018). Advances in NASA’s Environmental Control and Life Support Systems for Exploration Missions. NASA Johnson Space Center.
- Gitelson, J. I. , Terskov, I. A., Kovrov, B. G., et al. Long-term experiments on man’s stay in biological life-support systems: Bios-3. Advances in Space Research, 2003, 31, 1699–1704. [Google Scholar]
- Hodkinson, J. R. , & Andrus, J. F. Atmospheric Revitalization for Manned Spacecraft. Journal of Spacecraft and Rockets, 2003, 40, 842–853. [Google Scholar]
- Hodgson, E. , Perry, J. L., & Anderson, M. S. Atmospheric Monitoring on the International Space Station. Acta Astronautica, 2019, 157, 230–239. [Google Scholar]
- Lasseur, C. , et al. The MELiSSA Project: Towards Artificial Ecosystems for Space. Planetary and Space Science, 2010, 58, 1099–1110. [Google Scholar]
- Law, J., Watkins, S., & Alexander, D. (2014). In-Flight Carbon Dioxide Exposures and Related Symptoms. NASA Technical Report NASA/TP–2014–218556.
- Perry, J. L., Knox, J. C., & Anderson, M. S. (2019). Recent Developments in Atmospheric Revitalization for Spacecraft. 46th International Conference on Environmental Systems (ICES), Vienna, Austria.
- Perry, J. L. , Knox, J. C., & Anderson, M. S. Integrated Atmosphere Revitalization System Modeling for Long-Duration Space Missions. Acta Astronautica, 2020, 171, 324–334. [Google Scholar]
- Cajochen, C. , et al. Role of homeostatic and circadian processes in sleep propensity and alertness. Journal of Sleep Research, 2002, 11, 81–91. [Google Scholar]
- Dijk, D.-J. , & Czeisler, C. A. Contribution of the circadian pacemaker and the sleep homeostat to sleep propensity, structure, and performance. PNAS, 1995, 92, 12020–12024. [Google Scholar]
- Kräuchi, K., & Wirz-Justice, A. Circadian rhythm of heat production, heart rate, and skin blood flow: Relationships to body temperature regulation. American Journal of Physiology, 1994, 267, R819–R829.
- Morris, C. J. , Aeschbach, D., & Scheer, F. A. J. L. Circadian system, sleep and endocrinology. Molecular and Cellular Endocrinology, 2015, 349, 91–104. [Google Scholar]
- Scheer, F. A. J. L. , Hilton, M. F., Mantzoros, C. S., & Shea, S. A. Adverse metabolic and cardiovascular consequences of circadian misalignment. PNAS, 2009, 106, 4453–4458. [Google Scholar] [PubMed]
- Monk, T. H. The post-lunch dip in performance. Chronobiology International, 2005, 22, 167–178. [Google Scholar] [CrossRef] [PubMed]
Figure 4.
Circadian oscillations of CO2 production during the mission 37 (5 people crew). The highest amplitude in oscillations is observed for the bedroom module and shelter - locations with the most limited ventilation. Yellow bars indicate increased activity correlated with two picks of CO2 concentration. Blue bars indicate lover activity synchronised with lower CO2 levels.
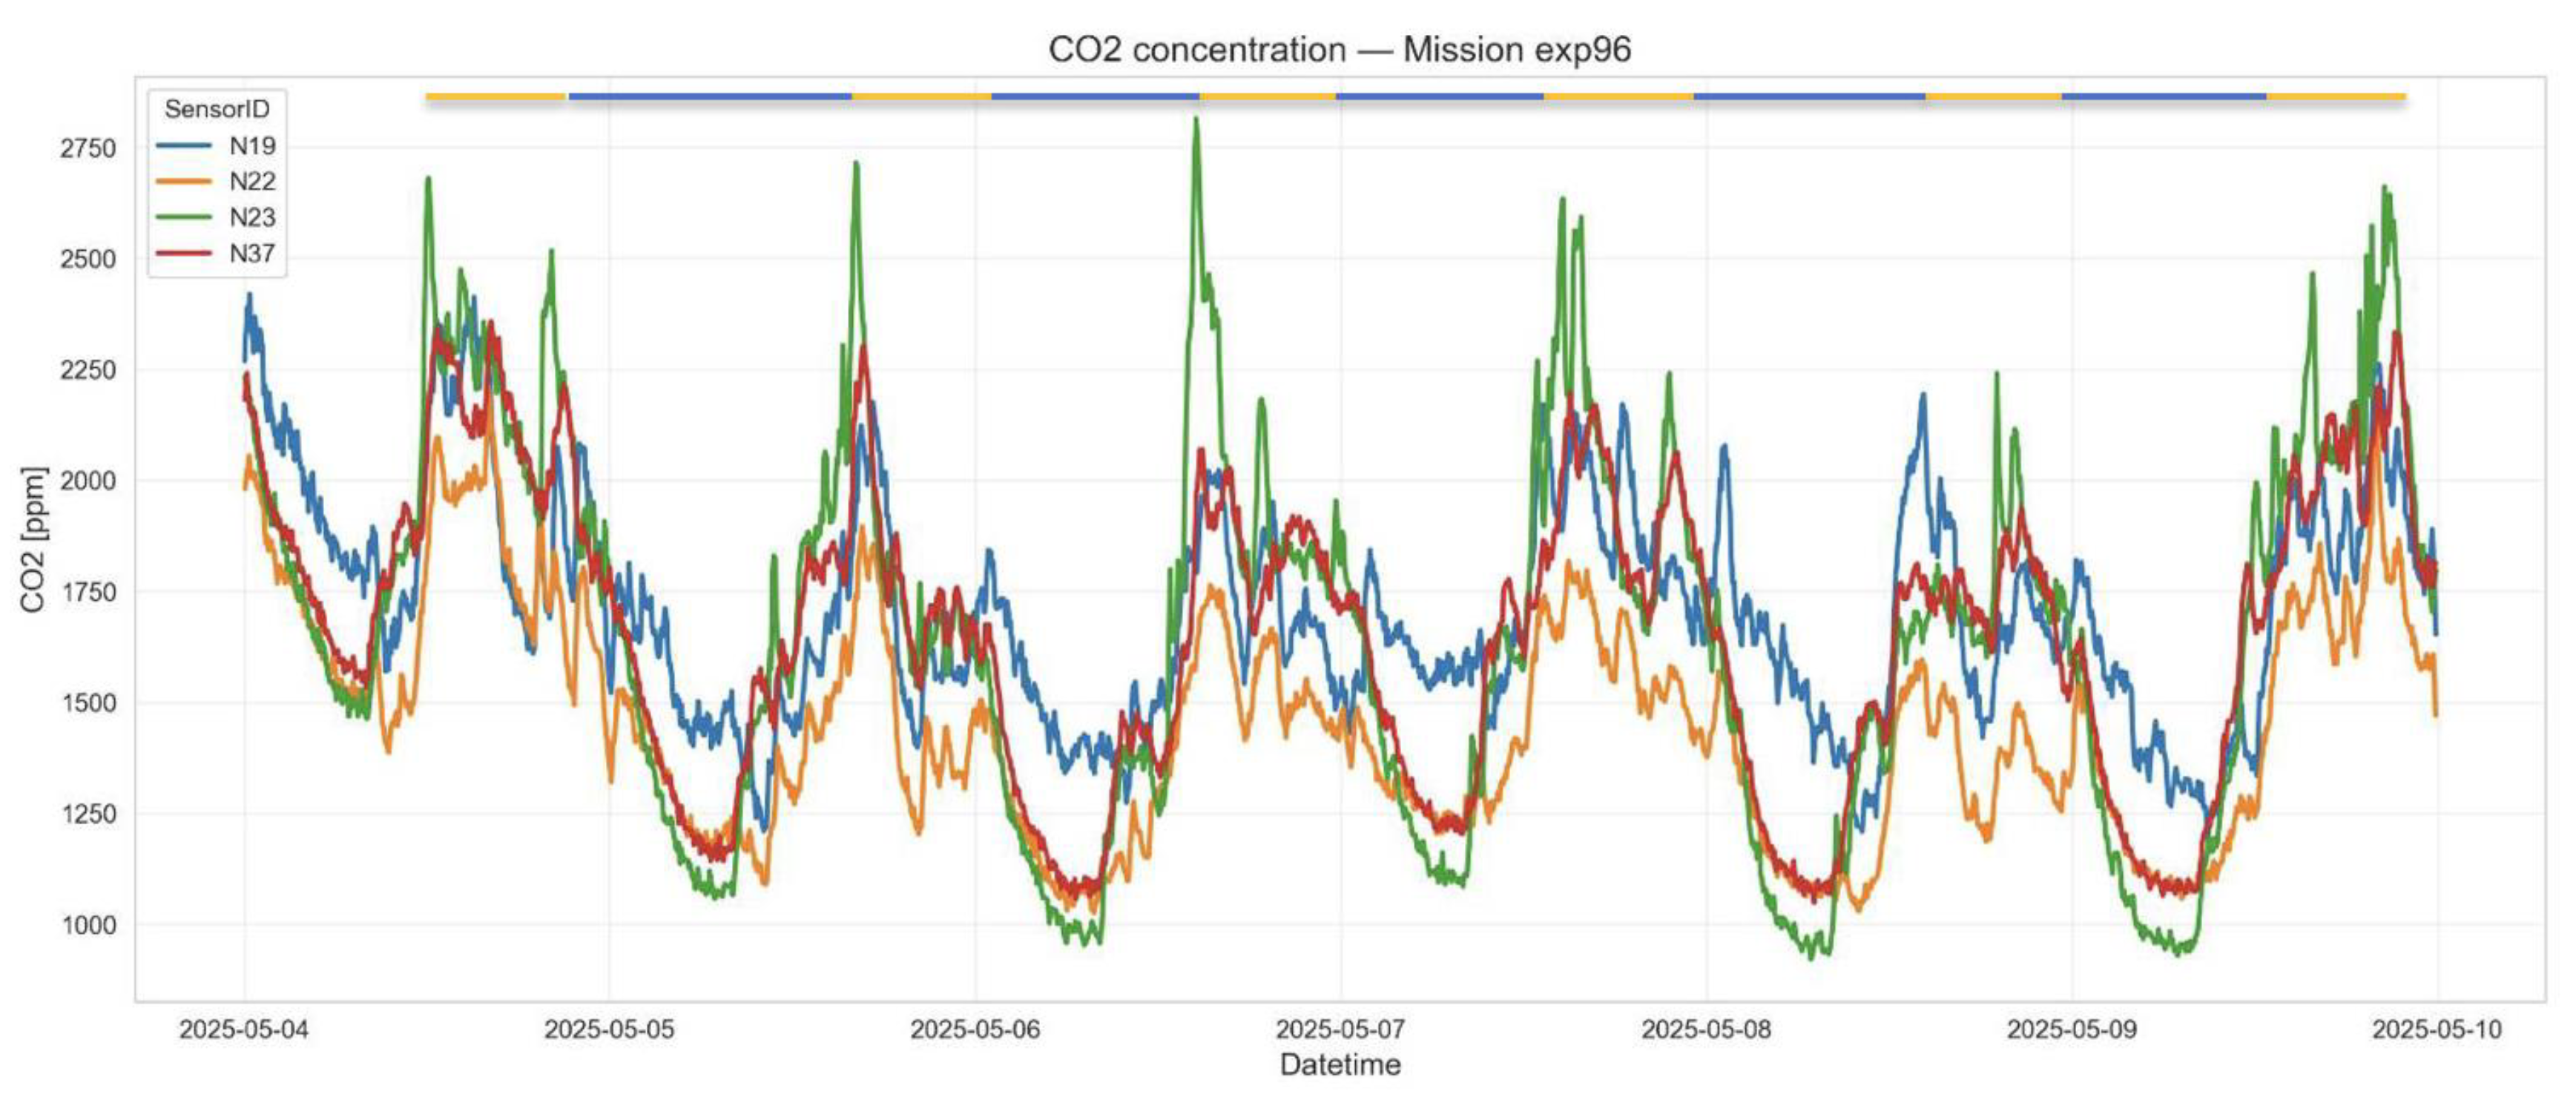
Figure 5.
Diagrams of activity (yellow) and sleep (dark blue) phases in subsequent days of the analog mission in natural light isolated conditions.
Figure 5.
Diagrams of activity (yellow) and sleep (dark blue) phases in subsequent days of the analog mission in natural light isolated conditions.
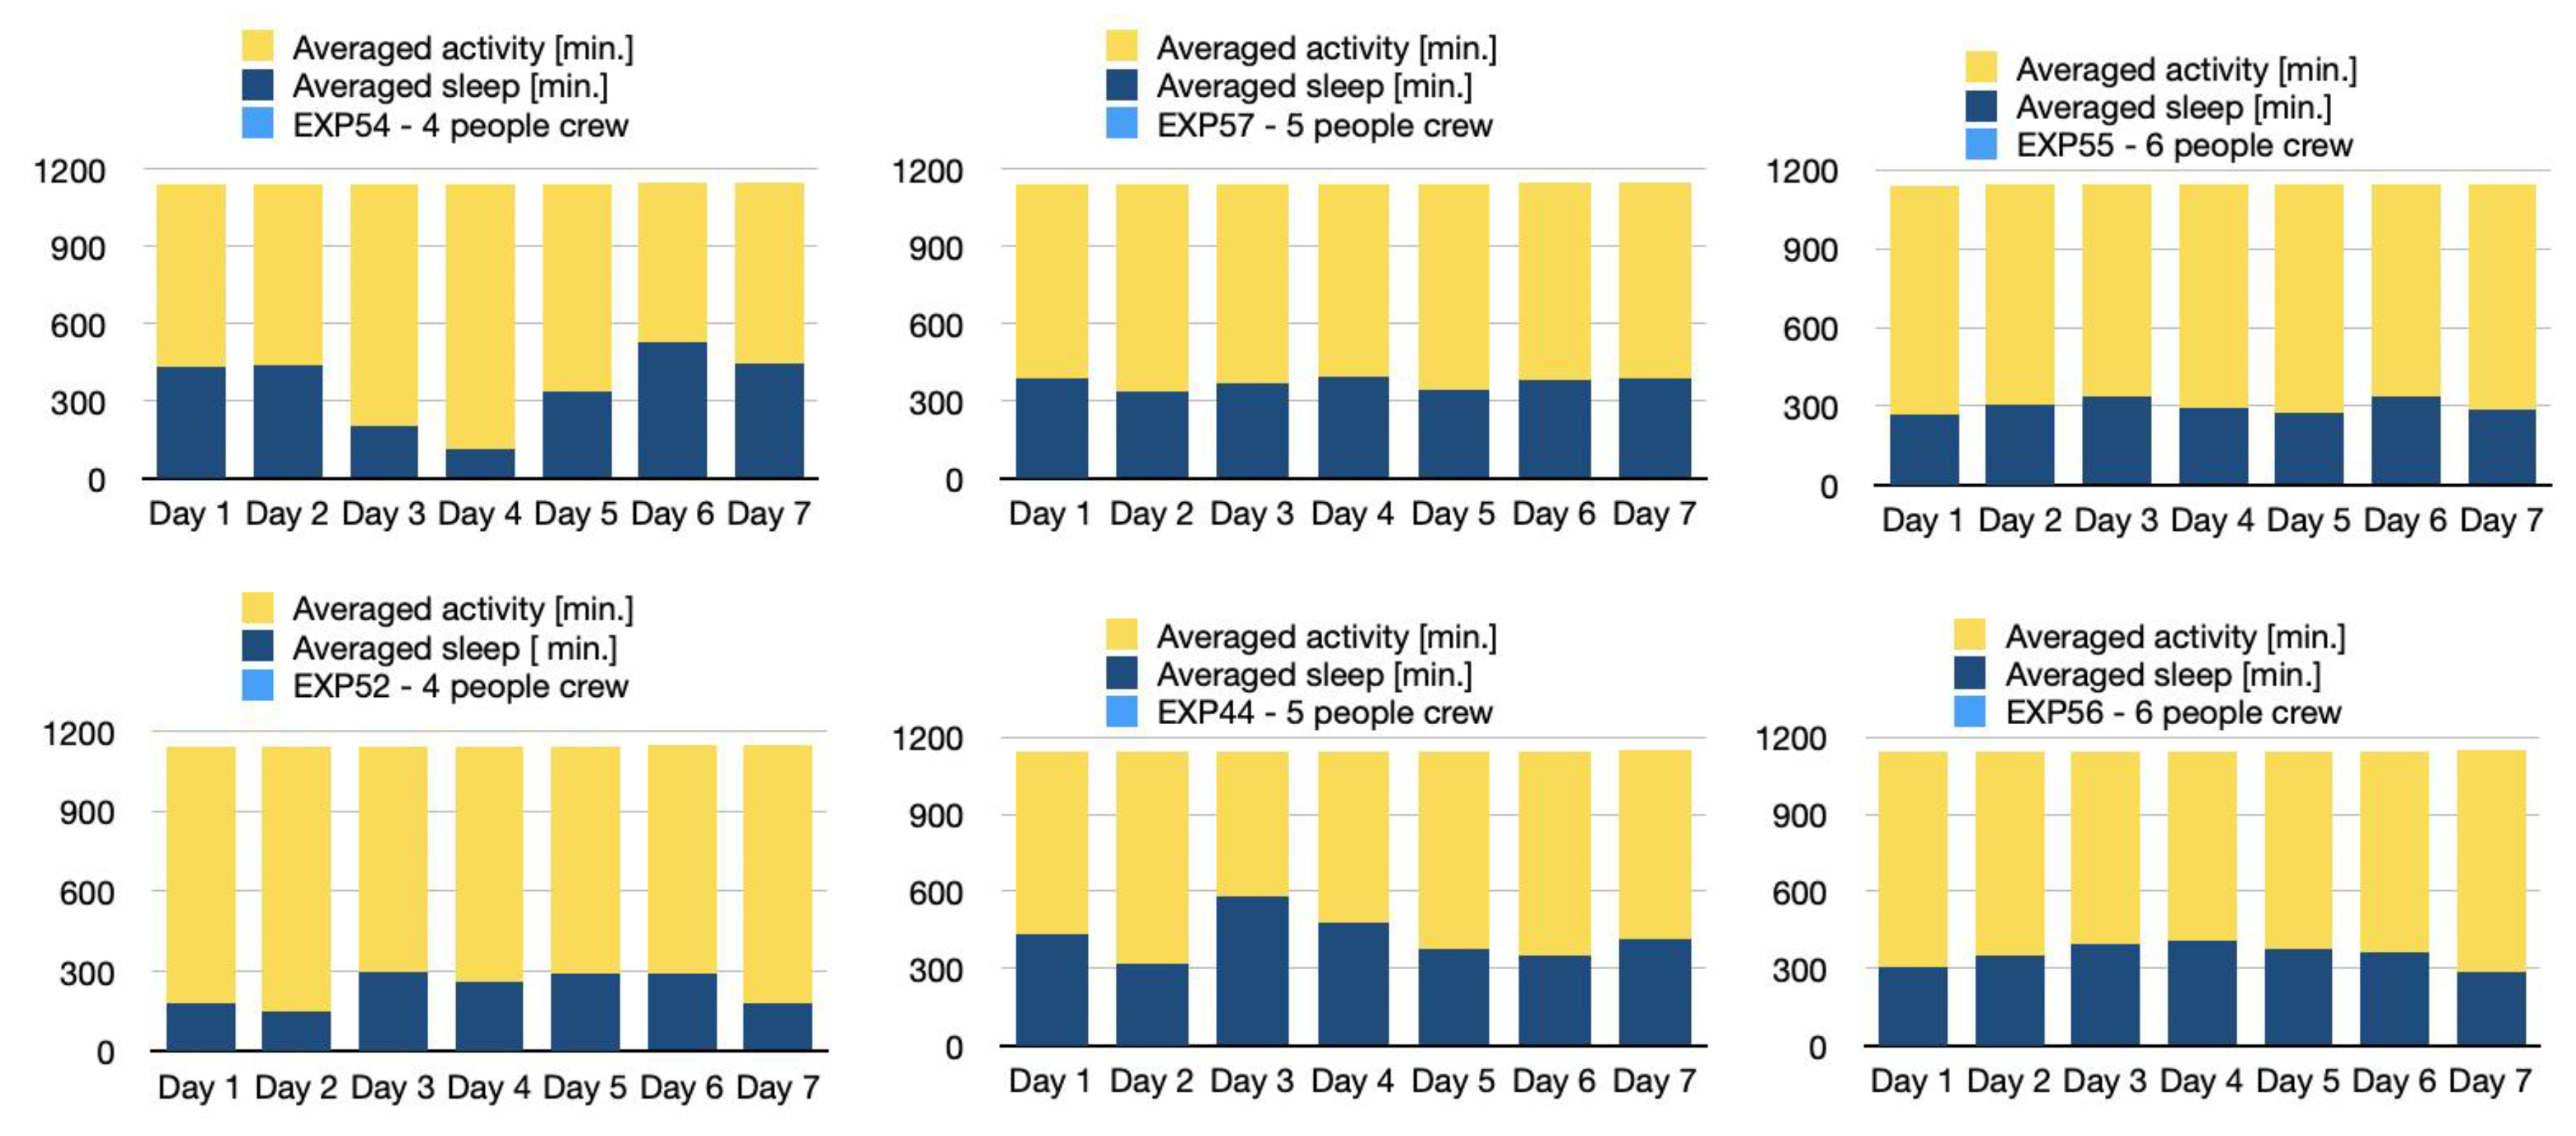
Figure 6.
Distribution of selected environmental conditions during 12 analog missions for humidity, noise, CO2 levels and temperature.Trends are similar but the amplitude is different among the missions.
Figure 6.
Distribution of selected environmental conditions during 12 analog missions for humidity, noise, CO2 levels and temperature.Trends are similar but the amplitude is different among the missions.
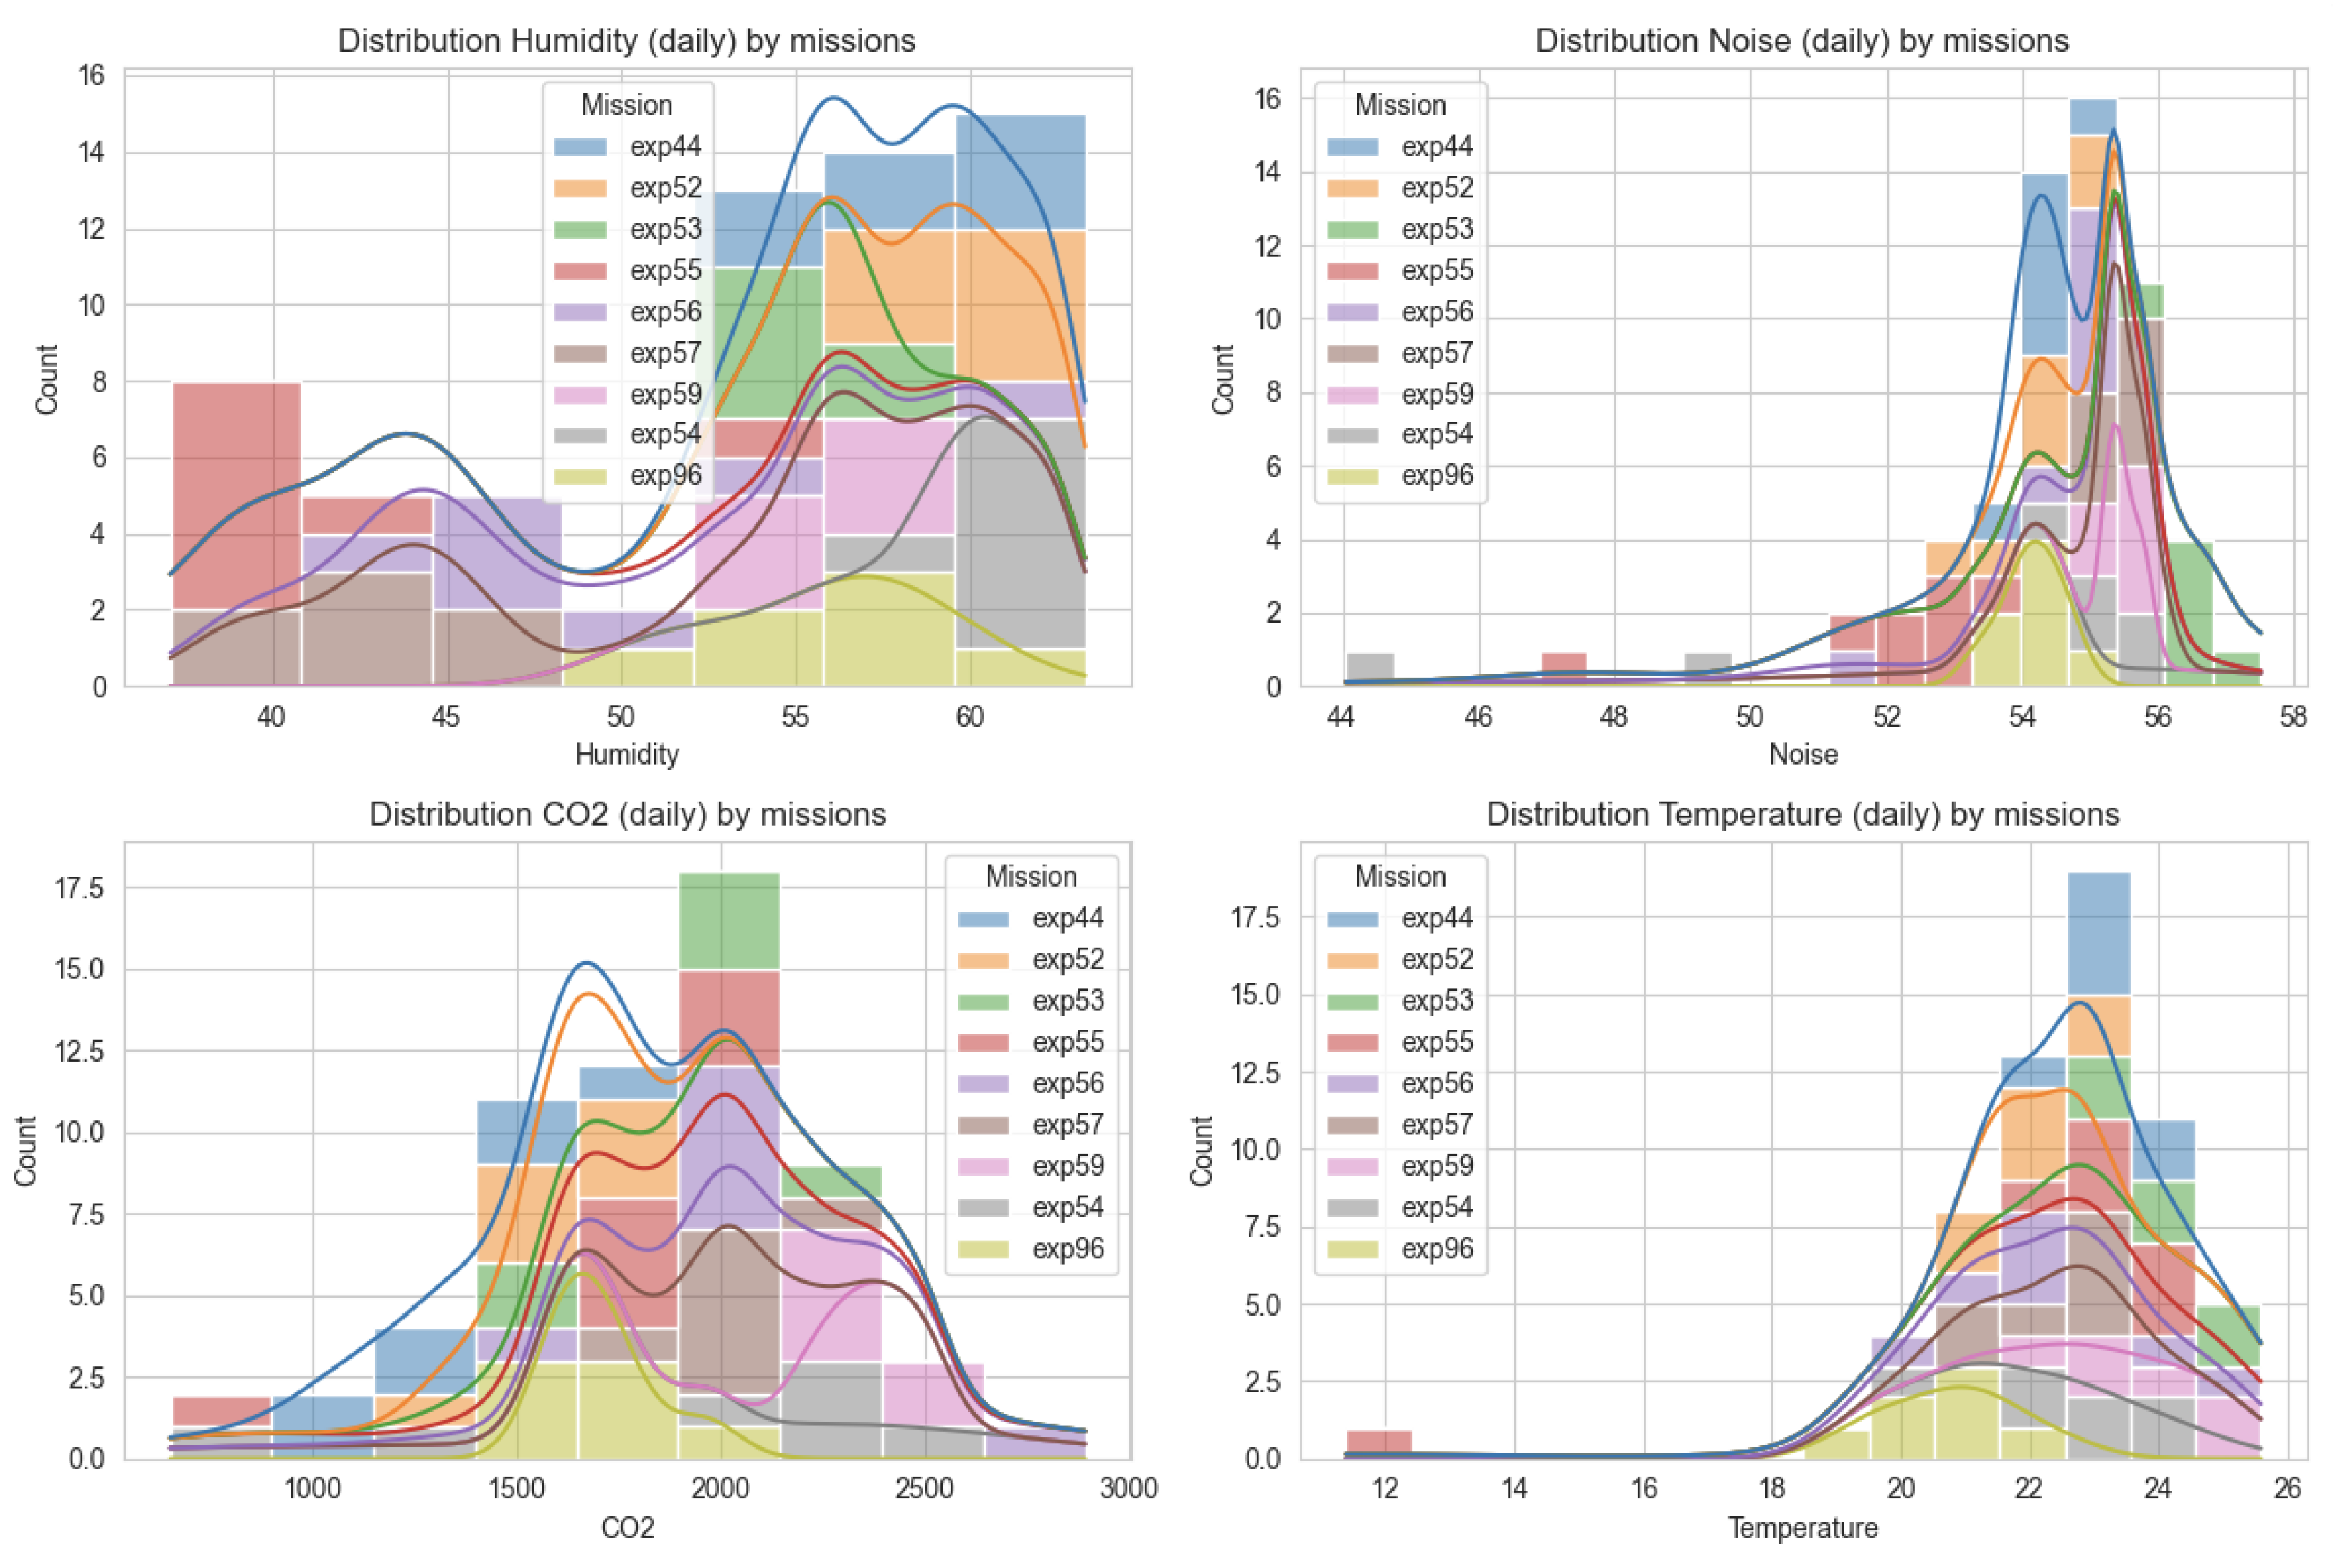
Figure 7.
Differences between crews regarding CO2 levels in the habitat through the entire period of the stay in the confinement. Brown - 4 people crew, blue - 5 people crew, violet - 6 people crew. Roman letters indicate months of the year, when the mission took place.Although the internal temperature in the habitat was similar, to summer time, various seasons could influence circadian rhythms and prolonged sleep phases compared to the summer time.
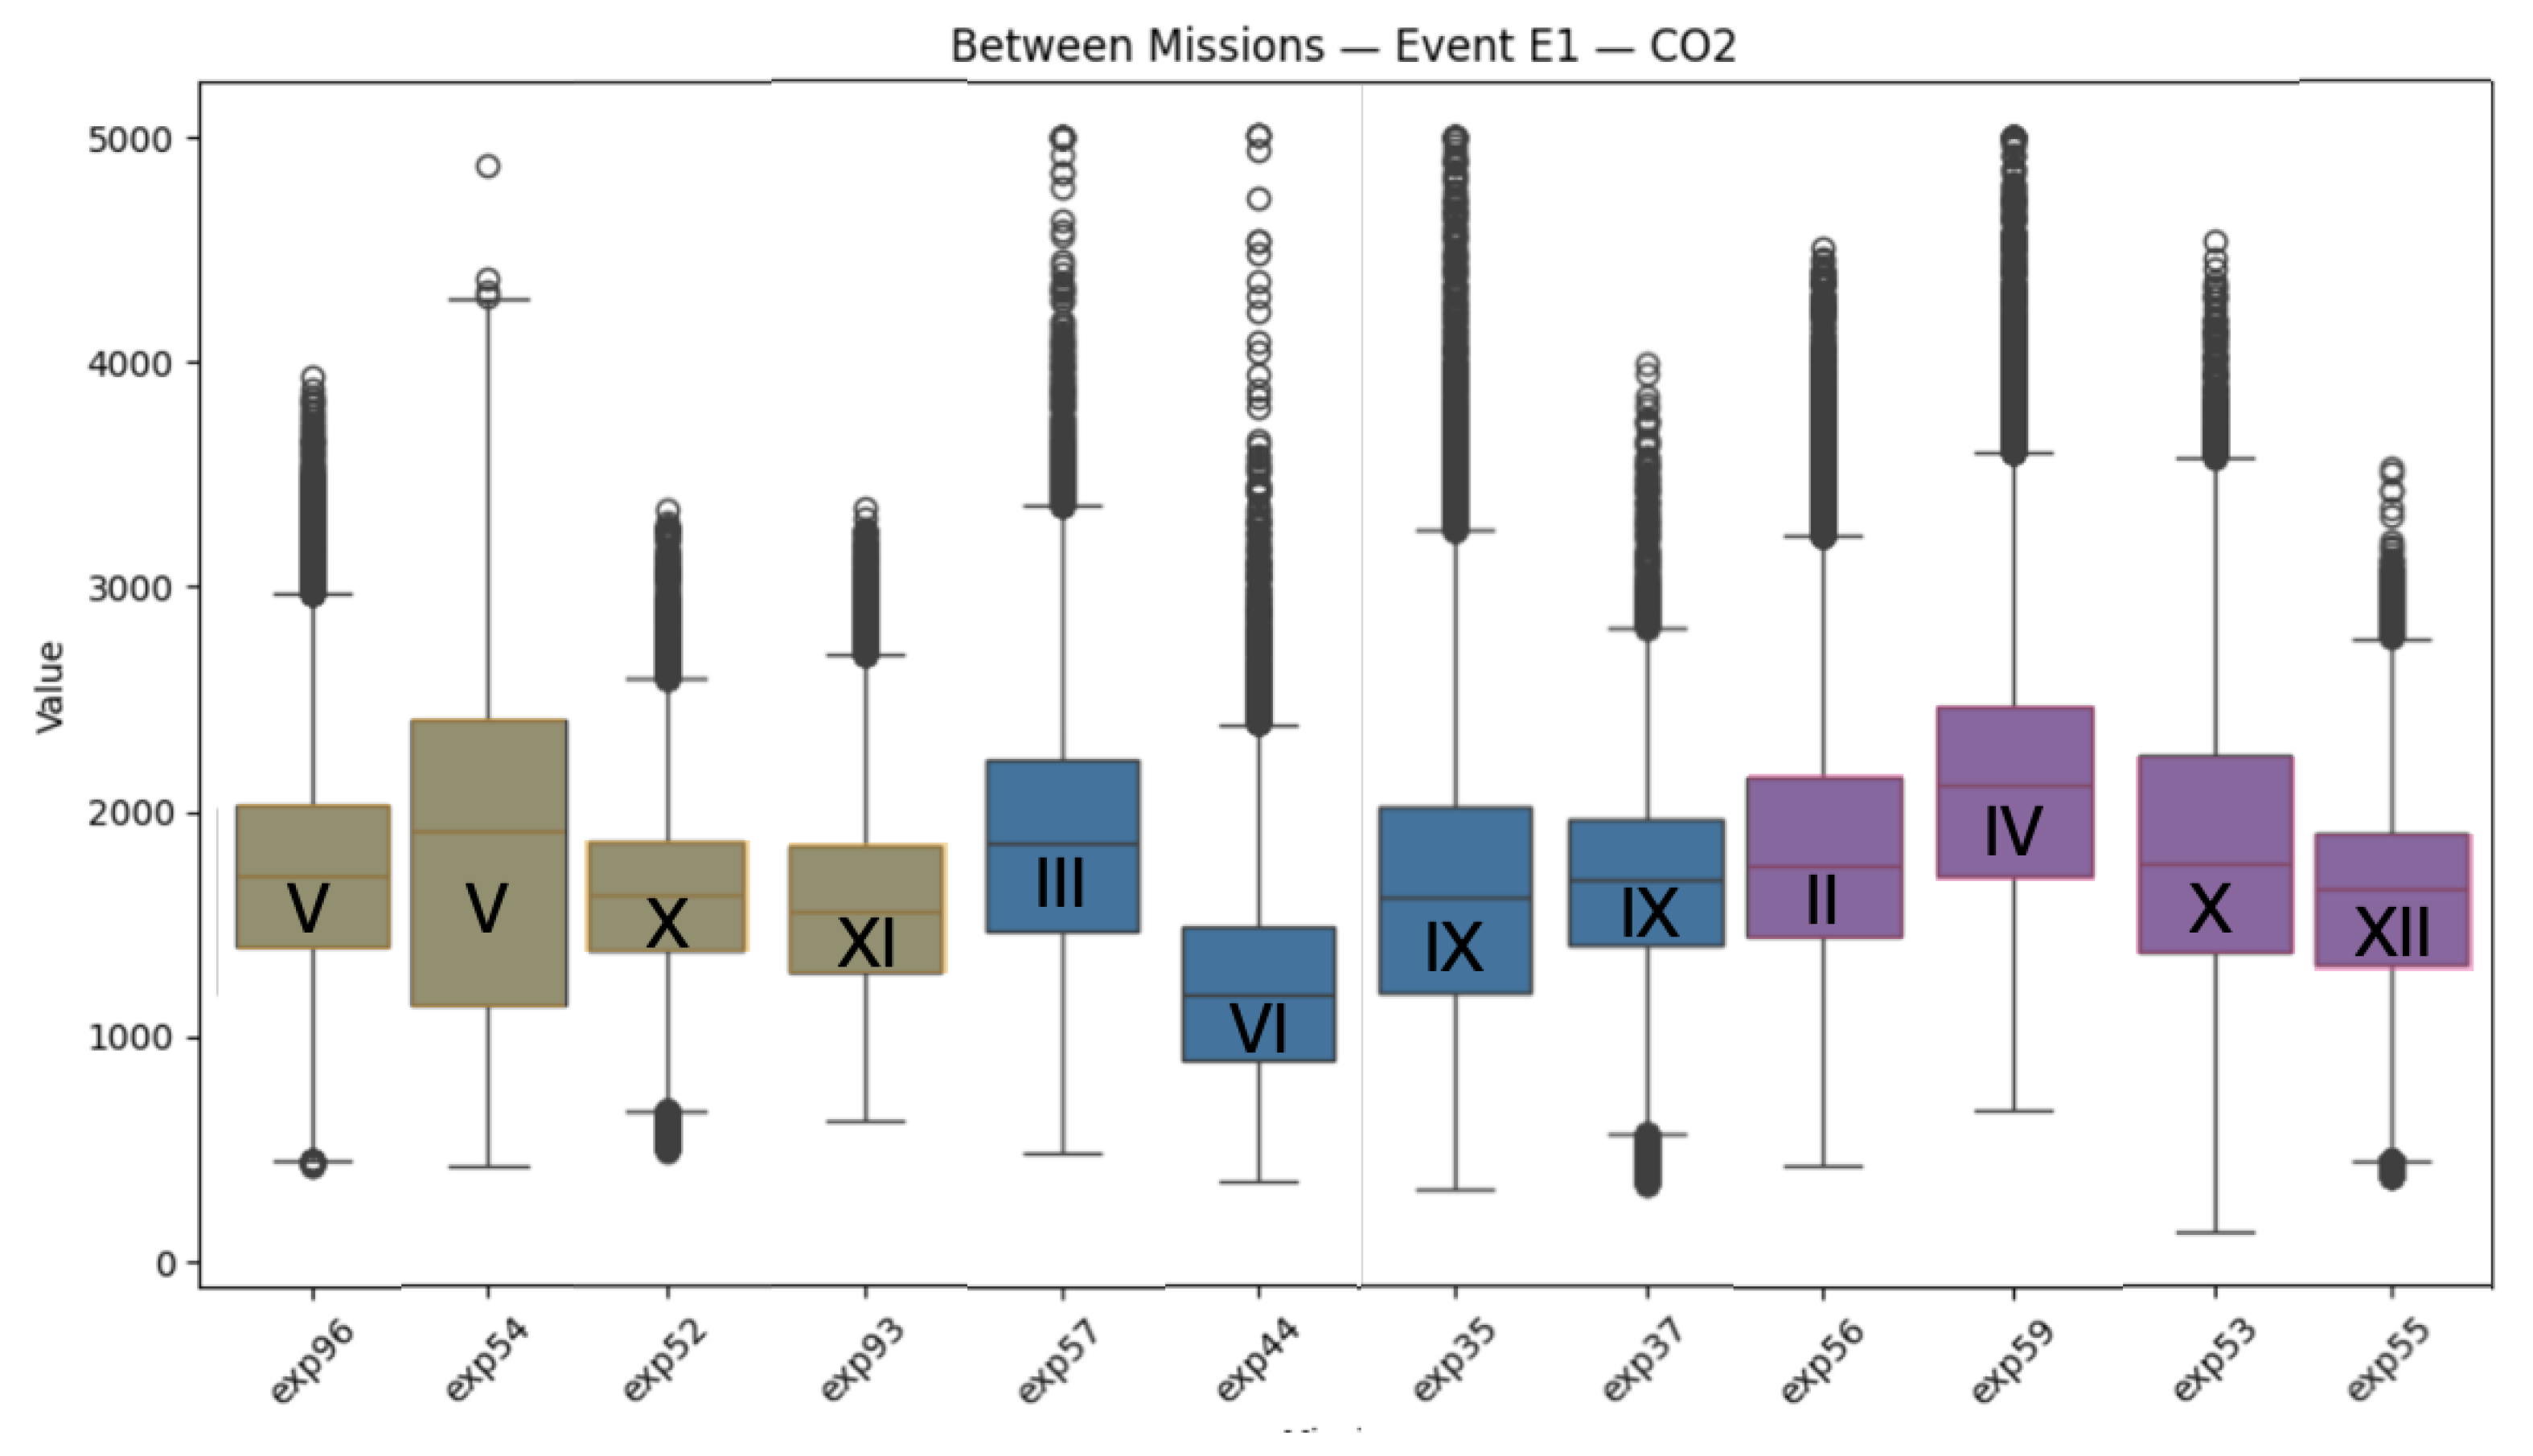

Table 1.
Analog astronaut crews included in the CO2 production experiments.
| 1 | EXP 52 | 4 crew, 4 ♂ | 1-7 October 2022 |
| 2 | EXP 54 | 4 crew, 4 ♂ | 16-22 May 2023 |
| 3 | EXP 93 | 4 crew 4 ♀ | 24-30 November 2024 |
| 4 | EXP 96 | 4 crew 4 ♀ | 3-9 May 2025 |
| 5 | EXP 35 | 5 crew 1♀, 4 ♂ | 28 Aug-2 Sept 2021 |
| 6 | EXP 37 | 5 crew 1♀, 4 ♂ | 9-15 September 2021 |
| 7 | EXP 44 | 5 crew 3♀, 2 ♂ | 1-7 June 2022 |
| 8 | EXP 57 | 5 crew 1♀, 4 ♂ | 2-8 March 2023 |
| 9 | EXP 53 | 6 crew 1♀, 5 ♂ | 12-17 October 2022 |
| 10 | EXP 55 | 6 crew 6♀ | 28 Nov-5 Dec 2022 |
| 11 | EXP 56 | 6 crew 4♀, 2 ♂ | 19-25 February 2023 |
| 12 | EXP 59 | 6 crew 4♀, 2 ♂ | 30 Apr - 5 May 2023 |
Disclaimer/Publisher’s Note: The statements, opinions and data contained in all publications are solely those of the individual author(s) and contributor(s) and not of MDPI and/or the editor(s). MDPI and/or the editor(s) disclaim responsibility for any injury to people or property resulting from any ideas, methods, instructions or products referred to in the content. |
© 2025 by the authors. Licensee MDPI, Basel, Switzerland. This article is an open access article distributed under the terms and conditions of the Creative Commons Attribution (CC BY) license (http://creativecommons.org/licenses/by/4.0/).
Copyright: This open access article is published under a Creative Commons CC BY 4.0 license, which permit the free download, distribution, and reuse, provided that the author and preprint are cited in any reuse.


