Submitted:
09 October 2025
Posted:
15 October 2025
You are already at the latest version
Abstract
Composite materials are extensively employed in aircraft due to their high specific strength and stiffness, superior impact resistance, and fatigue performance. Bird strikes can inflict severe damage to critical aircraft components such as the fuselage, engines, and wings, compromising flight safety. Certification regulations mandate that all components must demonstrate a specified level of bird strike resistance prior to aircraft installation. Consequently, this study focuses on carbon fiber composite laminates. By varying impact velocity, impact angle, and ply orientation, it investigates the resulting patterns of bird strike impact behaviors in these composites. The derived patterns provide theoretical reference for further research into the impact mechanics of composite materials subjected to bird strikes.
Keywords:
bird impact
; Puck standard
; composite materials
; lay-up direction
; (SPH)Smooth Particle Hydrodynamics model
1. Introduction
Bird impact during takeoff and landing are more common for private airplanes. Before being used on an aircraft, all components must meet certification requirements that guarantee a particular level of resistance to bird impact in order to assure aviation safety [1,2].High specific strength, high specific stiffness, good fatigue resistance, high temperature resistance, strong designability, and impact resistance are all benefits of the composite material [3,4,5]. It is widely utilized across numerous sectors including automotive, medical, sports, and aerospace [6,7]. Some researchers have looked into how mechanical characteristics like heat, humidity, UV light, salt spray, and wind sand affect the ecosystem; The layering technique has been refined by several academics. The π/4 stacking approach is applied in the aeronautical structure. Quad laminates with high strength and stiffness in particular positions and directions are created and produced by varying the quantity and placement of 0°, 90°, and ±45° stacking. This article examines the effects of various laminated composites on birds impact. Studying the simulation of composite materials is particularly crucial because composite experiments are expensive.
The progressive failure approach for composite materials gained popularity in the 1980s, and as a result of numerous researchers' investigation and application, progressive failure analysis is maturing. Given the impact of layup thickness on material strength, Catalanotti et al. [8] suggested a set of failure criteria that took into account the longitudinal failure mechanism and the transverse failure mechanism, respectively. The test results and the projected results agreed well. Numerous failure criteria have been established for composites made of fiber-reinforced polymers. Tsai and Wu [9] did not specify a specific failure mechanism when they first put up a secondary failure criterion for stress space. Hashin [10,11] put out the fiber and matrix failure criterion based on the Mohr-Coulomb failure hypothesis. Additionally, Chang-Chang [12] suggested stress-based transverse and longitudinal tension standards for substrates and fibers.
Numerous researchers have currently performed finite element numerical study on the damage mechanism and mechanical response of composite laminates at low speed impacts. Of these, the Tsai-Wu standard is used by Zhao and Cho [13], the Hashin standard is used by Riccio et al. [14] and Li et al. [15], the Chang-Chang standard is used by Meo et al. [16], the Donadon et al. [17], the Faggiani and Falzon [18], the Shi et al. [19], and the Feng and Aymerich [20] used Puck standard. All of the aforementioned failure standard are mostly true under quasi-static loads, although they have only been evaluated for dynamic loads and are not truly proven [21]. This article primarily uses experimental data to validate the finite element simulation model's results before using the model to conduct an exploratory simulation experiment; Carbon fiber composite fiber tension, compression, and matrix tension failure standard are all based on the three-dimensional Hashin standard, whereas matrix compression failure standard is based on the puck [22] standard.
2. Experimentation
2.1. Experimental Scheme
Using J3K-CT300 carbon fiber/epoxy composite material as the research object, 8 layers of ±45° twill braid material were employed to create a 300×300mm plate that was 2.5mm thick. Carbon fiber laminates were tested by exposing them to bird strike impacts at three distinct speeds—34, 36, and 38m/s. The three experimental groups created a contrast, but they also served to validate one another because of the tiny difference in speed intervals. The primary goal of using a strain gauge to gather laminate strain data is to supply accurate data support for the upcoming simulation model.
2.2. Experimental Method
The experiment uses a light-air cannon to simulate a bird impact and regulates the light-air gun's air pressure to control the bird bomb's speed. A homemade gelatin bird bomb with a mass of 115g, a diameter of 50mm, a height of 50mm, and a density of 1126kg/m3 was utilized in the test to more accurately replicate the features of a bird impact. The impact experiment platform for bird impact is depicted in Figure 1, and the super-dynamic strain gauge is primarily used to collect strain during the impact process.
2.3. Strain Gauge
The dynamic deformation process of carbon fiber laminate during the impact process is referred to as strain. First, the impact position is identified as the plate's center position after the clamping position is modified through pre-experiment. For carbon fiber laminates, a total of five measurement locations were established. Strain gauges should be attached 20mm apart. According to Figure 2, S3 is the impact center, and S1, S2, S4, and S5 are the impact edges.
2.4. Experimental Result
This section examines the strain fluctuation curves of the T300 carbon fiber/epoxy composite under low-speed impact at various speeds (Figure 3). The carbon fiber/epoxy composite strain curves for the three low-speed impact states show that the composite material experiences compressive strain initially, followed by tensile strain. At 34m/s, the highest compressive strain is 0.26% (Figure 3a). The maximum compressive strain of 36m/s is 0.37% (Figure 3b). At 38m/s, the compressive strain is 0.47% (Figure 3c). The strain at 36m/s was 0.11% higher than that at 34m/s, while the strain at 38m/s was 0.10% higher than that at 36m/s. Impact primarily shows elastic deformation at low speeds. Because the three groups' speed intervals are small, the strain data has a high repeat rate, indicating the true reliability of the three groups of data. As a result, the variation trend of the strain curves is the same for all three groups.
3. Simulation Methods
3.1. Bird Collision Impact Simulation Modeling
3.1.1. Bird Bullet Modeling
In the abaqus software, the simulation bird projectile is modeled as shown in Figure 4a. The diameter of the bird body is 50 mm, and its height is also 50 mm. In this paper, the gelatin bird projectile is self-made, with a density of 1126 kg/m3. The properties of the simulated bird body match those of the bird projectile used in the experiment. The bird projectile is then meshed, which involves discretizing continuous objects into a series of discrete elements, transforming the bird body into particles (SPH) as shown in Figure 4b. In this paper, the bird projectile uses a grid size of 5 mm, and since it is not an analysis object, the meshing is not very dense. The number of grids for the bird projectile in this paper is 960, and the number of nodes is 1243. The bird projectile is assigned velocity through predefined fields as shown in Figure 5, and finally assembled with the composite laminate.
3.1.2. Bird Body Constitutive State Equation
The SPH unit combined with the state equation to create the bird body can well describe the fluid of the bird in high-speed motion, and the SPH has no specific mesh restriction, which can solve the problem of mesh distortion and discontinuity. The Mie-Gruneisen state equation of the bird body is (1):
where the material's sound propagation speed is denoted by c0=1480m/s. The starting density is ρ0, and gamma =0, s=0.
3.1.3. Composite Laminate Modeling
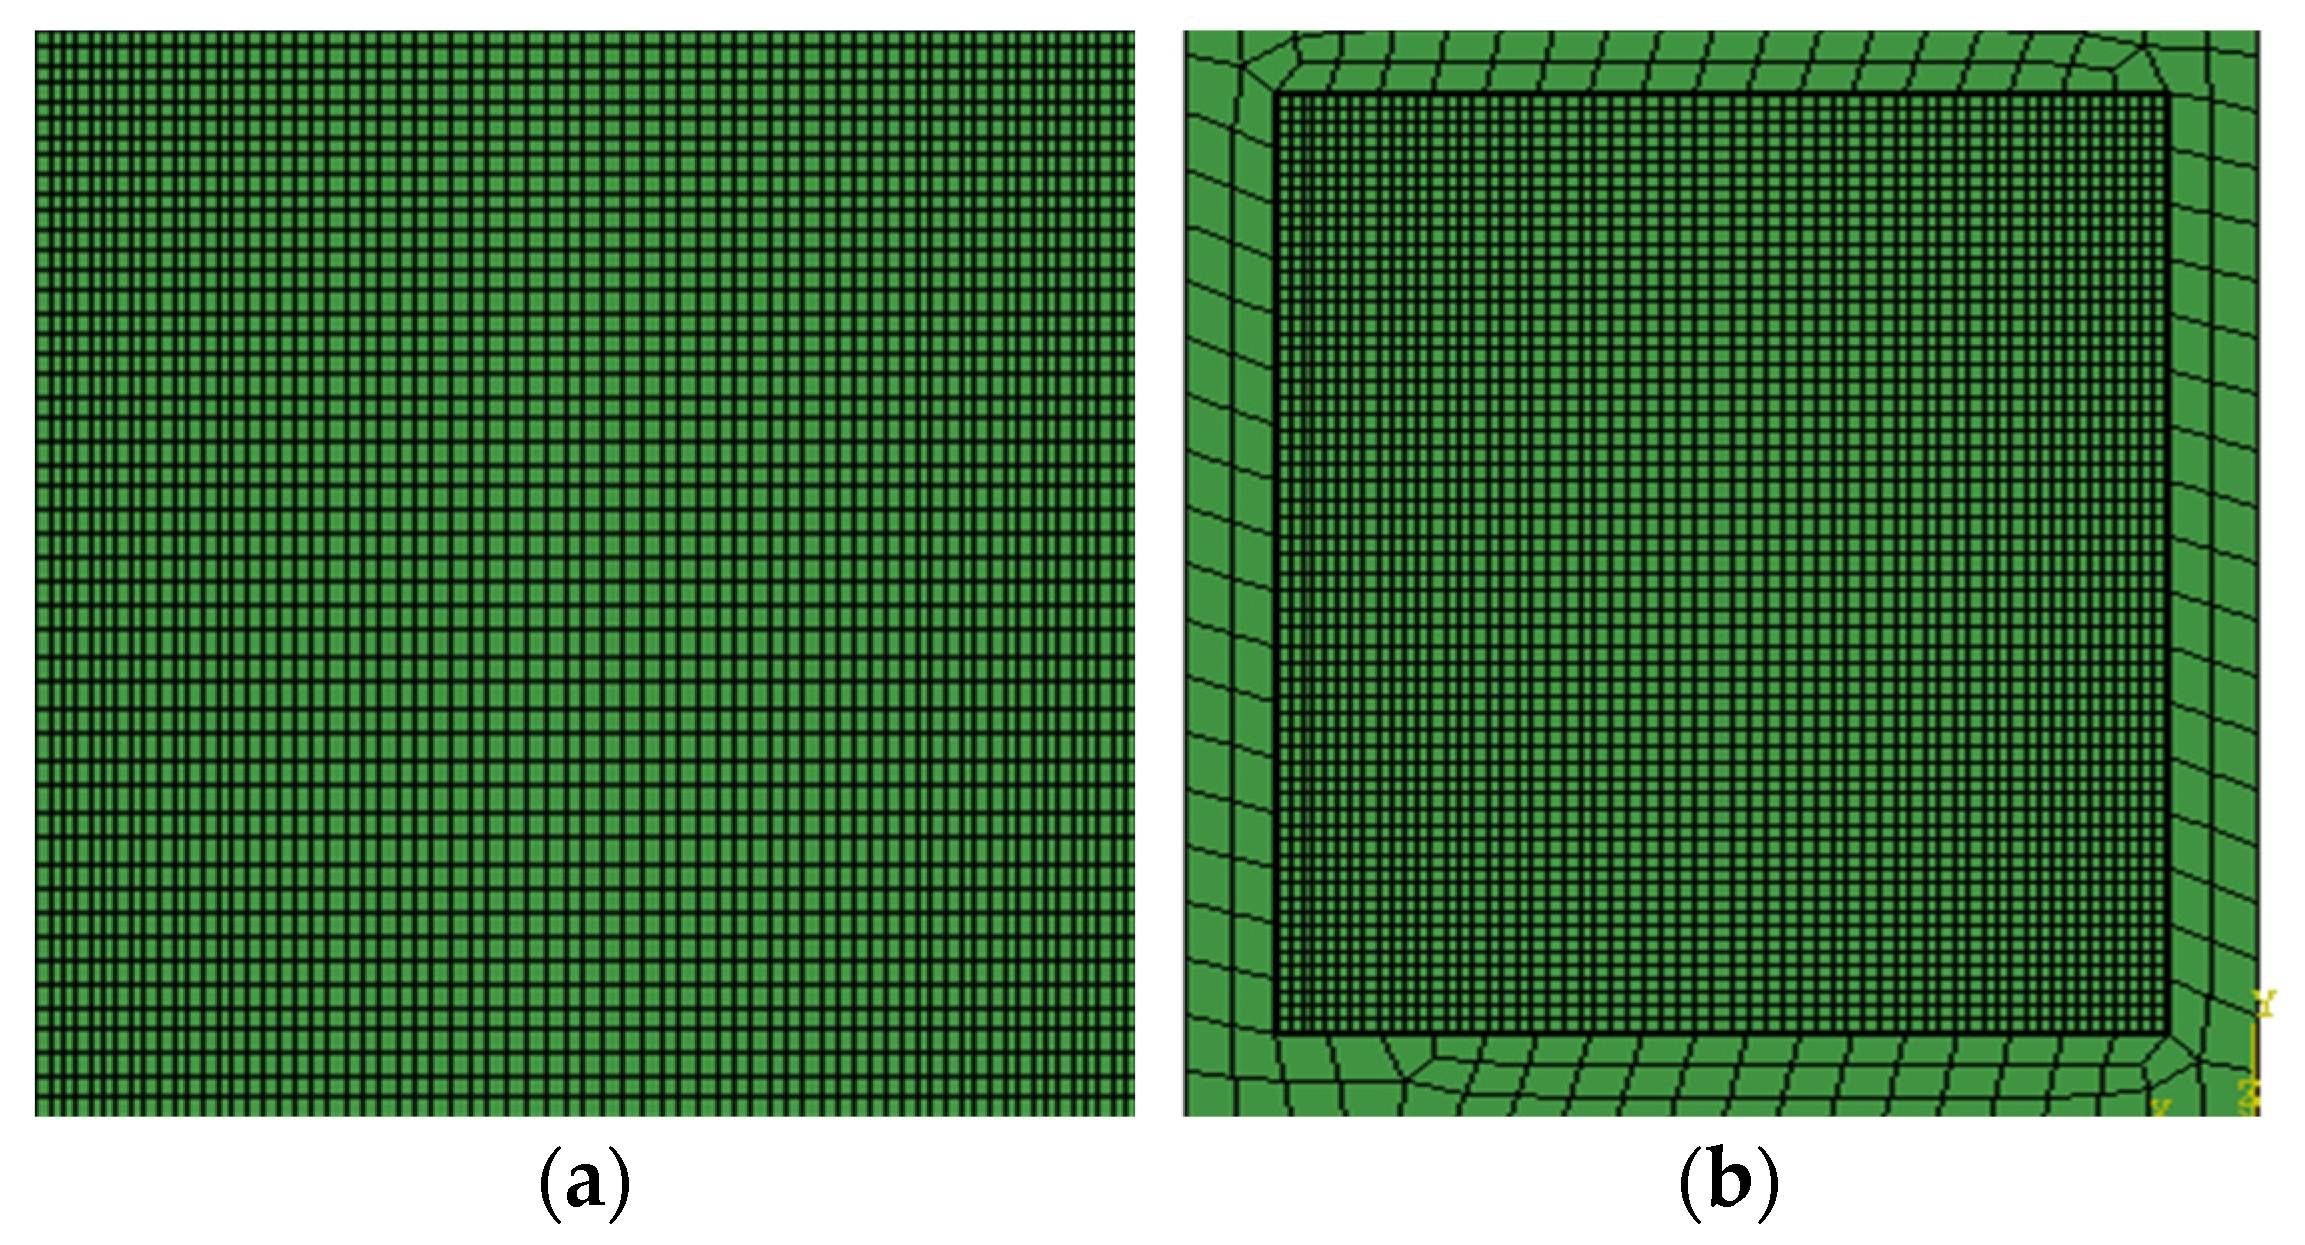
A solid modeling of the carbon fiber composite laminate with dimensions 300×300mm was conducted, and the material was divided into layers. The material is divided into 8 layers, and the material orientation is assigned in the properties. A finite thickness cohesive model between layers was created to simulate the interlayer properties of the composite material. Then, the composite laminate was meshed. In this article, the composite laminate is divided into a 3mm grid size as shown in Figure 7a. The laminate consists of 47,432 C3D8R elements and 41,503 COH3D8 elements, with a total of 97,344 nodes. The boundary of the composite material is constrained by creating boundary conditions. As shown in Figure 6, the four sides of the composite laminate are completely fixed. A rigid frame is added to the back of the composite laminate to constrain the composite laminate as shown in Figure 7b. Finally, it is assembled with the bird body.
Figure 6.
Boundary constraints of composite laminates.
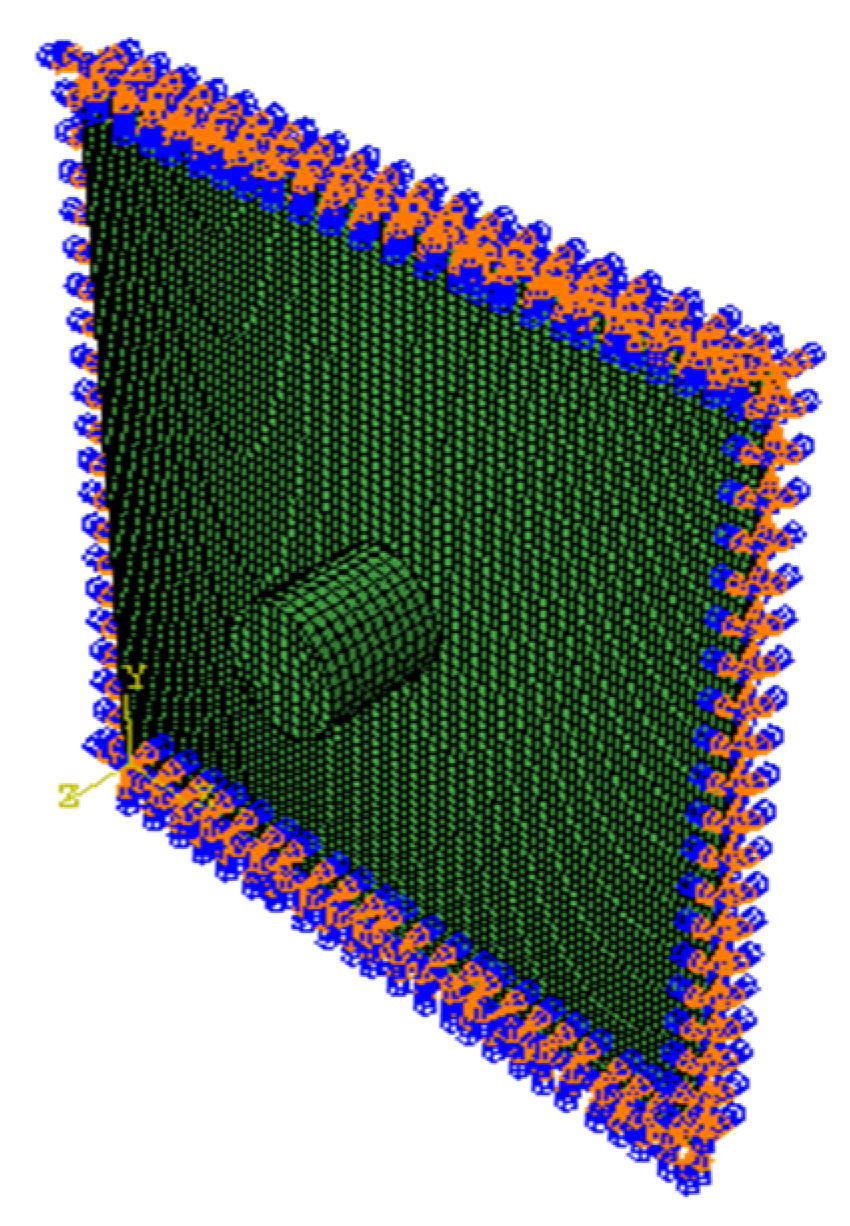
Figure 7.
Composite laminate model: (a) Grid division; (b) Rigid body constraints.
3.2. Composite Material Constitutive Model
Composites are harmed by bird impacts in two ways. One is fiber fracture-induced damage, or intralayer failure. The other is the occurrence of stratification or interlayer collapse between neighboring layers. The progressive damage model, which comprises the failure initiation criterion, damage evolution model, and continuous damage model, can be used to simulate the impact damage process [21].
In-Layer Stress-Strain Relationship
Formula (2) illustrates the initial stress-strain connection. A continuous damage model is introduced to describe the progressive failure behavior of composite materials [17] due to cumulative damage and property deterioration of composite laminates under impact load.
where 1, 2, and 3 at the lower corner mark stand for the three fiber directions, respectively, and σij, Cijkl and εkl (i,j,k,l=1,2,3) for engineering stress, stiffness matrix, and engineering strain, respectively. When the composite satisfies the requirements for damage initiation, the symmetric damage stiffness matrix can be written as follows using just five independent engineering constants:(3)(4). There are only five independent engineering constants (Eij, νij, Gij). The symmetric damage stiffness matrix can be written as follows when the composite satisfies the requirements for damage initiation [23]: (3)(4).
In equation (4) the damage variables of fiber and matrix, df and dm respectively, are derived from the corresponding damage variables dI. The fiber and matrix damage during stretching and compression are denoted by the subscripts “ft”, “fc”, “mt”, and “mc” of dI respectively. In this case, shear stiffness loss due to matrix damage from tensile and compression is controlled by the stiffness correction coefficients of fiber and matrix under tensile and compression, respectively, Smt and Smc [24]. According to the existing literature [24,25,26,27], it is assumed that the values of Smt and Smc are 0.9 and 0.5 respectively.
3.3. Failure Criterion and Damage Evolution Law of Composite Materials
Stress or strain can be used to establish the fiber and matrix failure criterion. Hashin suggested fiber and matrix criteria based on stress. Because strain is more continuous than stress during the damage evolution of composite materials, Huang and Lee's experiments [28] suggested that strain might be a better way to define failure. The Puck standard takes matrix compression-induced fracture surface into account in addition to the Hashin and Chang-Chang standard. The puck standard was used for the damage formula of matrix compression in this article because Donadon et al. [18] first used it in impact analysis. When Liu et al. [21] evaluated the three criteria, they discovered that, with the exception of matrix compression, the calculation formulas for fiber stretching, fiber compression, and matrix stretching were essentially the same.
3.3.1. Fibers Stretch and Compress
The following formulas (5) and (6) display the fibers' tensile and compressive failure criteria.
where formula (7) provides the initial values of the initial tensile failure strain (represented by ) and compressive failure strain (represented by ).
The evolution law of fiber tensile and compressive damage is considered to be as follows, with XT and XC representing the fibers' respective tensile and compressive strengths:
When the damage variable hits 1, the critical failure strain is represented by and .
Although a micro-buckling mechanism causes fiber compression, it does not result in total collapse even though it lowers the load carrying capacity. The residual strength, or the fiber's compressive strength, is equivalent to the matrix's compressive strength [29]. Consequently, it is widely accepted that the damage process caused by fiber compression and stretching is the same. There are various matrix tensile compression failure criteria, but the following are the matrix compression failure criteria and the evolution rules:(9)(10).
3.3.2. Matrix Stretch
where represents the matrix's initial tensile failure strain and YT represents its tensile strength.
The matrix's tensile damage development law is:
where represents the matrix tension's critical failure strain.
3.3.3. Matrix Compression
Shear failure of unidirectional composite laminates occurs under transverse compression, according to Puck and Schürmann's experimental [22] investigation, and the angle of the fracture plane created is θf=53±2° with regard to the thickness direction. It is proposed that the failure criterion based on Mohr-Coulomb theory is more appropriate since the fracture angle can be a composite of two or even three stress transitions [17,19]. In order to get more accurate data under the Puck failure standard, Liu et al. [21] selected three distinct failure criteria for matrix compression, compared the data's accuracy, and confirmed the findings. Consequently, the Puck failure standard formula, as shown in (11) and (12) below, was used as the matrix compression failure criterion in this research.
where A and L are tangential with respect to the fracture surface's direction, and N is normal. The transverse compressive strength is denoted by YC. The Piola-Kirch-hoff rotational stress Sij(i=1,2,3) is transmitted to the fracture surface, and the transformation matrix T(α) yields the stress Sij(i=L, T, N). is the transverse shear strength of the fracture surface, which is determined by the transverse compressive strength YC and the material friction Angle .
The damage evolution law is stated as follows following the application of a bilinear model to the fracture surface:
where the initial and critical combined shear strains are denoted by and , respectively. Strain γNT and γNL are related to stress SNT and SNL, and is the shear stress at initial failure. is the matrix compressive fracture energy.
3.4. Interlayer Cracking Model
The binding zone element based on the bilinear tractor-separation relationship is used to model the interlayer delamination at the interface of adjacent layers in the composite layer. Mixed mode loading determines hierarchical initiation and the associated restoration behavior. Consequently, we forecast the beginning and spread of stratified damage using the secondary failure standard and the B-K standard [30], which are represented in equations.
N, S, and T stand for normal and shear strength, respectively, whereas tn, ts and tt for normal and shear tractive force. The total, normal, and tangential critical fracture energies are denoted by the letters GC, and , respectively. The energy wasted out of plane is denoted by GS. The total energy wasted in three directions is known as GT. In the B-K formula, η is the pertinent material coefficient.
3.5. Material Parameter
Using a simplified integral element (C3D8R), the impacts of various damage start standard, evolution techniques, and numerical modeling methods of the interface model on the prediction of low-speed impact behavior of carbon fiber composite layers were examined. The Puck standard and finite thickness clustering model combo has the highest computation accuracy among the various modeling techniques [24]. The finite thickness bilinear cohesive unit (COH3D8) was used to simulate the interlayer delamination. The parameters are shown in Table 1. One frequent way that laminates fail is through lamination damage, which significantly reduces the laminates' bearing capacity. In stratified damage analysis, the technique of creating interlayer bonding contact or inserting a bonding device with zero/finite thickness (0.001mm) is frequently employed. This article's model grid is made up of 35,000 COH3D8 units and 40,000 C3D8R units. The cohesive contact with traction separation rule between layers is developed in the cohesive contact model to describe the composite's delamination damage.
4. Simulation Results
4.1. Comparison Between Experiment and Simulation
By comparing strain, displacement, stress, and other parameters that represent the impact resistance of carbon fiber composites, the deformation of these materials can be more accurately represented. When the strain data from the simulation and test in the S3 position are compared, Figure 8 displays the results. The carbon fiber composite plate's simulation and test data both display compressive strain first, followed by tensile strain. The simulation model's ability to accurately replicate test results is demonstrated by the fact that the maximum compressive strain peak value is essentially the same.
4.2. 115 g Bird Impacts Different Carbon Fiber Layering
The mass of a 115g bird impact is employed to affect the carbon fiber laminate in these set of experiments, where the direction of layup is the variable. However, carbon fiber laminates are expensive and testing is too costly, this work uses the simulation method to model how various pavement layers may affect birds.
The strain (Figure 9a), displacement (Figure 9b), and stress (Figure 9c) curves are displayed at the S3 point of the L1[45/-45/45/-45]2S layup, respectively, in Figure 9. The S3 point is the impact's central location; the subsequent layup spots are chosen similarly. The impact velocities are 38m/s, 58m/s, 78m/s, 98m/s and 118m/s respectively. The strain is 0.39% and 0.83% at 38m/s and 58m/s, respectively. The stresses were 319.64MPa and 419.03MPa, respectively. The displacements were 5.63mm and 7.24mm, respectively. The strain changes to 1.94% at 78m/s. The stress is 487.93MPa; The displacement is 8.52mm. The slight delamination failure between the composite's layers is essentially insignificant when combined with the impact state of the 78m/s composite in Figure 9d. The strain is 3.10% at 98m/s, and the stratification is more noticeable at 98m/s and 118m/s. The displacement is 9.97mm, and the stress is 523.40MPa. The displacement rises from 9.97mm of 98m/s to 10.97mm, the stress is 637.98MPa, and the maximum strain of 118m/s reaches 7.85%. It may be concluded that the L1 laminated carbon fiber sheet starts to experience delamination failure at 98m/s when combined with the impact shape of 98m/s in Figure 9d.
The changes of strain, displacement and stress under L2[45/0/45/0]2S are shown in Figure 10. The speed of strain mutation of L2 paving is 58m/s, and its strain reaches 3.90%(Figure 10a), stress 309.88MPa(Figure 10c), and displacement is 8.30mm(Figure 10b). When paired with Figure 9, it is evident that the displacement is 1.06mm greater than that of the L1 layer and the strain L2 at 58m/s is four times that of the L1 layer. When combined with Figure 10d's impact form, it is evident that there is no discernible delamination at 58m/s. However, at 78m/s, 98m/s, and 118m/s, delamination failure is evident, and the corresponding stresses are 398.60MPa, 527.01MPa, and 619.40MPa (Figure 10c). At 78m/s, the L2 layer began to fail at 78m/s. The strain was distributed rather uniformly between 4% and 5.5%(Figure 10a).
The strain and displacement of L2 are compared with those of L1. The displacement of the 118m/s L2 layer is greater than that of L1, but the strain is smaller. Its stress exceeds the tensile strength of the matrix but does not exceed the tensile strength of the fibers, indicating that the matrix has failed. At other speeds, the displacement and strain under the L2 layer are both greater than those under the L1 layer, suggesting that this layer has a poorer ability to absorb impact energy compared to the L1 layer. The recovery speed from displacement also shows that the composite under the L2 layer recovers less well than under the L1 layer, further confirming that the L1 layer has better stiffness
The strain (Figure 11a), displacement (Figure 11b), and stress (Figure 11c) change curves during L3[45/0/-45/90]2S layup are displayed in Figure 11. When affected by the velocity of 78m/s, the strain of this layup abruptly changes; it is 4.21%, the displacement is 8.22mm, and the stress is 586.7MPa. If the displacement is 0.08mm less than that of the L1 layer, it can be disregarded, and the strain is more than twice that of the L1 layer at 78m/s. However, the stress of L1 paving is lower, and when paired with the impact state Figure 11d and Figure 9d, it is evident that the two pavement layers' delamination failure at 78m/s is negligible and may be disregarded. L3 layering failure is more obvious at 98m/s, 118m/s layering. Nearly all of the plate is layered in the middle position, and the degree of delamination failure is greater than that of L1 layering. While the displacement of L3 layering is 10.9mm and the displacement of L3 layering is 118m/s, the stress under L3 layering is 674.5MPa, making it more susceptible to fiber fracture and other failure forms. It demonstrates that the L1 fiber layering technique has superior impact energy absorption and superior substrate and matrix stress and strain energy transfer. Furthermore, the carbon fiber layer and substrate beneath the L1 layer are better bonded and that lamination failure is difficult to achieve.
The strain (Figure 12a), displacement (Figure 12b), and stress (Figure 12c) change curves under L4[0/90/0/90]2S layup are displayed in Figure 12. At 78m/s, the layup strain abruptly changes, reaching 4.21%, with a displacement of 9.25mm and a stress of 527.6MPa. In comparison to the L1 layer, the strain is doubled, the displacement is 0.75mm greater, and the stress is 41.6MPa greater. The laminates exhibit noticeable delamination at 78m/s when combined with the impact condition, as seen in Figure 8d, and the delamination failure degree of L4 is higher. With maximum strains of 5.60% and 5.71%, maximum displacements of 10.7mm and 12.06mm, and maximum stresses of 723.88MPa and 810.59MPa, respectively, the delamination failure of L4 is exacerbated at 98m/s and 118m/s. L4 should vary little at 118m/s, yet the stress and displacement are greater than those of L1, according to a comparison of L4's strain, displacement, and stress.L1 pavement has a lower failure degree than L4 when strain, stress, and delamination conditions of 78m/s and 98m/s are taken into account.
Based on the examination of the four data sets mentioned above, it can be inferred that the failure speed is essentially 78m/s, with the L1 layer's layup failure being the only one that is 98m/s. The four layup groups' maximum stress, strain, and displacement of 78m/s are contrasted. Of the four bedding groups, L2 bedding has the least amount of stress and the greatest strain and displacement. The stratification is rather clear, as evidenced by the 78m/s impact form of L2 in Figure 10d. Although L4 pavement's layered impact morphology is also evident, as seen in Figure 12d, its peak strain and displacement rank second out of the four paving groups, and its stress is comparatively low. The strain and displacement of L1 and L3 bedding are less than those of the other two groups, as shown by the fluctuation trend in Figure 13a. However, stress Figure 13b shows the opposite pattern of change. Given that the 78m/s impact state diagram in Figure 9d and Figure 11d shows a very small degree of delamination failure, it can be inferred that the carbon fiber composite's failure state is correlated with the values of strain and displacement. From good to bad, the four paving groups can be ranked as follows: L1, L3, L4, and L2.
4.3. Influence of Different Impact Angles on Bird Impact
The purpose of the simulation is to examine how various paving layers react dynamically to bird impacts from various perspectives. This study examines which layering sequence performs better against bird impacts when many layering sequences are affected by the same angle. Determine the best layup for impact at various angles.
This section examines the dynamic response of carbon fiber composite laminates to a 115g gelatin birdshot impact at an impact velocity of 78 m/s. Figure 14 illustrates the varied angles at which carbon fiber composite laminates and birdshot laminates are created. Since the laminates' normal vector is 0°, four angles are set: 0°, 22.5°, 45°, and 67.5°. At various impact angles of 0°, 22.5°, 45°, and 67.5°, the strain, displacement, and stress curves of L1[45/-45/45/-45]2S pavement impacting the carbon fiber laminates are displayed in Figure 15. The S3 point is the impact's central location. After simulating all the layers being struck at several speeds, it was determined that nearly all of the layers were unable to stratify at 78m/s when struck by a 115g bird. It is evident from strain curve Figure 15a that the maximum strain is produced when the normal vector is at 0°. The highest impact strain for 22.5°, 45°, and 67.5° is 0.57%. The highest tensile strain for L1 paving group are: 1.94% at 0°, 0.57% at 22.5°, 0.46% at 45° and 0.29% at 67.5°. Figure 15b displays the displacement change curve under impact at each angle. When the laminate is oriented normally, the maximum displacement of birdshot impact at 0° is 8.52mm; at 22.5°, it is 7.75mm; at 45°, it is 6.63mm; and at 67.5°, it is 4.33mm. The stress change curve is displayed in Figure 15c, where the displacement of 67.5° is 247.28MPa, the stress at 0° is 490.54MPa, the stress at 22.5° is 450.91MPa, and the stress at 45° is 305.89MPa. According to Figure 15d of impact morphology at all angles, there is no obvious delamination failure or fiber fracture failure at all angles, indicating that L1 layering failure is not significantly related to Angle.
L2[45/0/45/0]2S layer-strain curve Figure 16a shows that the strain caused by bird is greatest at 0° with the normal vector and gradually diminishes with the oblique angle. As the impact angle increases, the displacement (Figure 16b) likewise reduces; however, at 67.5°, the change in displacement rapidly diminishes. At 0°, 22.5°, and 45°, the maximum stress (Figure 16c) varies minimally, but at 67.5°, it rapidly drops. The strain associated with each angle of the L2 paving group is as follows: the maximum tensile strain at 0°, 22.5°, 45° and 67.5° angles is 4.79%, 1.86%, 1.35% and 0.46%. Figure 16b displays the displacement change curve under impact at each angle. Maximum displacement of birdshot impact at 0° with the laminate's normal direction is 9.59 mm; at 22.5°, it is 8.92mm; at 45°, it is 7.80 mm; and at 67.5°, it is 5.21 mm. The stress change curve is displayed in Figure 16c, where the displacement of 67.5° is 208.53MPa, the stress corresponding to 0° is 398.18MPa, the stress corresponding to 22.5° is 340.71MPa, and the stress corresponding to 45° is 295.85MPa. Delamination failure in the L2 layer occurs at 0° impact when combined with the impact morphology of Figure 16d. However, at 22.5°, 45°, and 67.5° angles, the impact delamination failure vanishes, suggesting that the impact damage of carbon fiber composite impact laminates is minimized at these angles. It also demonstrates how the angle of the birdshot and composite laminates affects the extent of impact damage.
The strain caused by bird is greatest at 0° with the normal vector, as shown by L3[45/0/-45/90]2S layer-strain curve 17a, and the inclined strain rapidly declines with the angle. The displacement (Figure 17b) also decreases as the impact Angle increases. However, when the impact angle is 67.5°, the displacement rapidly reduces, and the impact at other angles barely affects the displacement. At 0°, 22.5°, and 45°, the maximum stress (Figure 17c) barely changes, but at 67.5°, it rapidly drops, and a fairly noticeable negative stress also manifests. The strain associated with each angle of the L3 paving group is as follows: the maximum tensile strain at 0°, 22.5°, and 45° angles is 4.28%, 0.62%, and 0.53%, respectively. At a 67.5° angle, the maximum tensile strain is 0.28%. Figure 17b displays the displacement change curve under impact at each angle. With the laminates oriented normally, the maximum displacement of birdshot impact at 0° is 8.23mm; at 22.5°, it is 7.49mm; at 45°, it is 6.43mm; and at 67.5°, it is 4.12mm. Figure 17c displays the stress change curve. The stress at 0° is 588.71MPa, the stress at 22.5° is 537.17MPa, the stress at 45° is 512.34MPa, and the displacement at 67.5° is 181.23MPa. When combined with the impact morphology shown in Figure 17d, it is evident that the four sets of angles under the L3 paving layer do not cause any discernible delamination failure or other failure modes.
The strain produced by bird is greatest when it forms 0° with the normal vector, and the inclined strain rapidly declines with the angle, according to the L4[0/90/0/90]2S lay-up strain curve Figure 18a. However, the strain curves at 22.5° and 45° have a greater degree of overlap. As the impact angle increases, the displacement (Figure 18b) likewise reduces, and it is nearly equal at 22.5° and 67.5°. At 0°, 22.5°, and 45°, the maximum stress (Figure 18c) varies slightly; however, at 67.5°, it rapidly declines, and the coincidence degree of the stress curve at 22.5° and 45° is higher. The maximum tensile strain for the L4 pavement group is 4.21% when struck at 0°, 0.55% when struck at 22.5°, and 0.55% when struck at 45°.
These strains correspond to each of the following angles. At a 67.5° angle, the maximum tensile strain is 0.33%. The displacement change curve under impact at each Angle is shown in Figure 14b1. The maximum displacement of bird impact at 0° with the normal direction of the laminates is 9.25mm; the maximum displacement of bird impact at 22.5° is 8.50mm; the maximum displacement of birdshot impact at 45° is 7.10mm; and the maximum displacement of birdshot impact at 67.5° is 4.33mm. Figure 18c displays the stress change curve. The displacement of 67.5° is 238.87MPa, the stress corresponding to 0° is 654.76MPa, the stress corresponding to 22.5° is 570.27MPa, and the stress corresponding to 45° is 549.37MPa. The carbon fiber composite laminates exhibit varying degrees of delamination failure under impact of 0° and 22.5° when combined with the impact state shown in Figure 18d. The layer and plate of L4 layering have the weakest impact resistance, and it is the only group that experiences delamination failure under the impact of bird at 22.5°. This is demonstrated by the fact that no delamination failure occurred in the four groups of Angle impact morphology Figure 18 22.5° combined with the three groups of layering mentioned above.
The displacement, strain, and stress are essentially the maximum values of 0° with the normal direction of the composite material, according to the analysis of the four sets of data above. The maximum strain values of four sets of distinct bedding layers affected by birdshot at various angles are displayed in Figure 19a. Figure 19a shows that the peak value of strain is greatly impacted by changes in the impact angle, with the L1 bedding strain being the only one that is least impacted. The other three bedding layers are all susceptible to changes in the impact angle. It is evident from the displacement (Figure 19b) that the displacement evenly diminishes as the impact angle increases. The maximum displacement decreases dramatically around 67.5°, whereas the displacement reduction of the four groups of distinct pavement layers is quite close. L1 and L3 paving have superior anti-bird impact performance because their displacement is less than that of L2 and L4. Angle affects the stress beneath the four paving layers (Figure 19c). At 45° and 67.5°, the stress of the L1 paving layer dramatically drops, but the stress of the L2 paving layer remains rather constant with angle. At 0°, 22.5°, and 45°, the stress values of the L3 and L4 pavement layers are larger, and at 67.5° impact angle, the stress decreases off significantly. L1 pavement offers the best impact resistance, according to the data above.
5. Conclusions
This article mainly analyzes the simulation data of carbon fiber composites with four different fiber orientations. The simulation primarily investigates the impact angle as a variable. Simulate bird impacts of 115g against carbon fiber composite panels with different fiber orientations: L1, L2, L3 and L4. Vary the bird impact angle by striking the panels at 22.5°,45°,67.5°, and 90° relative to the normal vector of the carbon fiber composite panel.
Four sets of carbon fiber composite laminates with varying fiber orientations were hit with a 115g bird bullet. Stress, strain, displacement, and the laminates' impact state diagram were combined to study the properties. Comparing results reveals that the L1 layer has a higher delamination failure rate than the other layers, suggesting that it has superior impact resistance. Out of the four groups of layers, the L2 layer has the lowest performance in terms of bird impact resistance.
The failure state of carbon fiber composites is associated with the values of strain and displacement, but has a weaker association with the values of stress, according to a comparison of the strain and displacement values under the four layering groups with the delamination failure. The order of the four sets of layers, from best to worst, is L1, L3, L4 and L2, according to the data analysis of the 115g bird projectile impact laminate.
The impact angle significantly influences the force exerted during bird collisions. The strain value varies considerably depending on the angle impact. The strain value varies very little under the effects of various angles, with the maximum strain value occurring at 0°. Displacement evenly diminishes as the impact angle rises. Angular variations exert influence on the stress distribution beneath the four layers, yet no clear patterns or characteristics manifest. As a result, it is more trustworthy to examine their anti-bird impact performance from the viewpoints of strain and displacement.
Author Contributions
Methodology, R.W.; Validation, F.L.; Date curation, X.Z. and L.J.; Writing-original draft, B.C.; Writing-review and editing, C.S.; All authors have read and agreed to the published version of the manuscript.
Funding
This research was funded by the National Natural Science Foundation of China(51005228); the Education Department of Liaoning Province of China(JYTMS20230228); and the Open Fund of the Key Laboratory of the State Administration for Market Regulation(2023KF003).
Data Availability Statement
The original contributions presented in this study are included in the article. Further inquiries can be directed to the corresponding author.
Conflicts of Interest
The authors declare no conflicts of interest.
References
- Georgiadis, A.J.; Gunnion, R.S., Thomson. Bird-strike simulation for certification of the Boeing 787 composite moveable trailing edge. Composite Structures, 2008, 86(1): 258-268. [CrossRef]
- Sebastian, H., Computational methods for bird strike simulations: A review. Computers & Structures, 2011, 89(23): 2093-2112. [CrossRef]
- Li, X.; Wu, L.; Ma, L.; Yan, X., Compression and shear response of carbon fiber composite sandwich panels with pyramidal truss cores after thermal exposure. Mechanics of Advanced Materials and Structures, 2019, 26(1): 866-877. [CrossRef]
- Rahmani, H.; Mahmoudi Najafi, S. H.; Ashori, A., Elastic Properties of Carbon Fibre-Reinforced Epoxy Composites. Polymers and Polymer Composites. 2015, 23(7). [CrossRef]
- Shams, SS.; El-Hajjar, RF., Overlay patch repair of scratch damage in carbon fiber/epoxy laminated composites. Compos Part A Appl Sci Manuf. 2013, 49: 148–56. [CrossRef]
- Yashiro, S.; Ogi, K., Fracture Behavior in CFRP Cross-Ply Laminates with Initially Cut Fibers. Composites: Part A, 2009, 40: 938-947. [CrossRef]
- Tserpes, K.I.; Labeas, G.N., Mesomechanical analysis of non-crimp fabric composite structural parts. Compos. Struct. 2009, 87: 358–369. [CrossRef]
- Catalanotti, G.; Camanho, p.p.; Marques, A.T., Three-dimensional failure criteria for fiber reinforced laminates. Composite Structures, 2013, 95: 63-79. [CrossRef]
- Tsai, S.; Wu, E., A general theory of strength for anisotropic materials. Compos Mater 1971, 5: 58–80. [CrossRef]
- Hashin, Z.; Rotem, A., A fatigue failure criterion for fiber reinforced materials. Compos Mater 1973, 7: 448–464. [CrossRef]
- Hashin, Z. Fatigue failure criteria for unidirectional fiber composites. Appl Mech 1980, 48: 846–852. [CrossRef]
- Chang, F.; Chang, K., A progressive damage model for laminated composites containing stress concentrations. Compos Mater 1987, 21: 834–855. [CrossRef]
- Zhao, G.; Cho, C., Damage initiation and propagation in composite shells subjected to impact. Composite Structures, 2007 ,78(1): 91-100. [CrossRef]
- Riccio, A.; De Luca, A.; Di Felice, G.; Caputo, F., Modelling the simulation of impact induced damage onset and evolution in composites (Article). Composites Part B: Engineering, 2014, 66: 340-347. [CrossRef]
- Li, D.; Liu, Y.; Zhang, X., Low-velocity impact responses of the stiffened composite laminated plates based on the progressive failure model and the layer wise/solid-elements method. Composite Structures, 2014, 110(1): 249-275. [CrossRef]
- Meo, M.; Morris, A.J.; Vignjevic, R.; marengo, G., Numerical simulations of low-velocity impact on an aircraft sandwich panel. Composite Structures, 2003, 62(3): 353-360. [CrossRef]
- Donadon, M.V.; Iannucci, L.; Falzon, B.G.; Hodgkinson, J.M.; de Almeida, S.F.M., A progressive failure model for composite laminates subjected to low velocity impact damage. Computers and Structures, 2008, 86(11): 1232-1252. [CrossRef]
- Faggiani, A.; Falzon, B.G., Predicting low-velocity impact damage on a stiffened composite panel. Composites Part A: Applied Science and Manufacturing, 2010, 41(6): 737-749. [CrossRef]
- Shi, Y.; Swait, T.; Soutis, C., Modelling damage evolution in composite laminates subjected to low velocity impact[J]. Composite Structures, 2012, 94(9): 2902-2913. [CrossRef]
- Feng, D.; Aymerich, F., Finite element modelling of damage induced by low-velocity impact on composite laminates (Article)[J]. Composite Structures, 2014, 108(1): 161-171. [CrossRef]
- Liu, P.; Liao, B.; Jia, L.; Peng, X., Finite element analysis of dynamic progressive failure of carbon fiber composite laminates under low velocity impact[J]. Composite Structures, 2016, 149 (Aug): 408-422. [CrossRef]
- Puck, A.; Schürmann, H., Failure analysis of FRP laminates by means of physically based phenomenological models (Article)[J]. Composites Science and Technology, 2002, 62(12): 1633-1662. [CrossRef]
- Huang, L.; Tao, Y.; Sun, J.; Zhang, D.; Zhao J., Assessment of numerical modeling approaches for thin composite laminates under low-velocity impact. Thin-Walled Structures, 2023, 191(000): 14. [CrossRef]
- Miao, H.; Wu, Z.; Ying, Z.; Hu, X., The numerical and experimental investigation on low-velocity impact response of composite panels: Effect of fabric architecture. Composite Structures, 2019, 227: 111343. [CrossRef]
- Rezasefat, M.; Gonzalez-Jimenez, A.; Giglio, M.; Manes, A., Numerical study on the dynamic progressive failure due to low-velocity repeated impacts in thin CFRP laminated composite plates. Thin-Walled Structures, 2021, 167: 108220. [CrossRef]
- Ren, R.; Zhong, J.; Le, G.; Ma, W., Research on intralaminar load reversal damage modeling for predicting composite laminates' low velocity impact responses. Composite Structures, 2019, 220: 481-493. [CrossRef]
- Wu, Z.; Zhang, L.; Ying, Z.; Ke, J.; Wu, X., Low-velocity impact performance of hybrid 3D carbon/glass woven orthogonal composite: Experiment and simulation. Composites: Part B, Engineering, 2020, 196: 108098. [CrossRef]
- Huang, C.H.; Lee, Y.J., Experiments and simulation of the static contact crush of composite laminated plates. Composite Structures, 2003, 61(3): 265-270. [CrossRef]
- Ouyang, T.; Bao, R.; Sun, W.; Guan, Z.; Tan, R., A fast and efficient numerical prediction of compression after impact (CAI) strength of composite laminates and structures. Thin-Walled Struct 2020, 148: 106588. [CrossRef]
- Benzeggagh, M.L., Kenane, M., Measurement of mixed-mode delamination fracture toughness of unidirectional glass/epoxy composites with mixed-mode bending apparatus. Composites Science and Technology, 1996, 56(4): 439-449. [CrossRef]
Figure 1.
Experiment instrument.
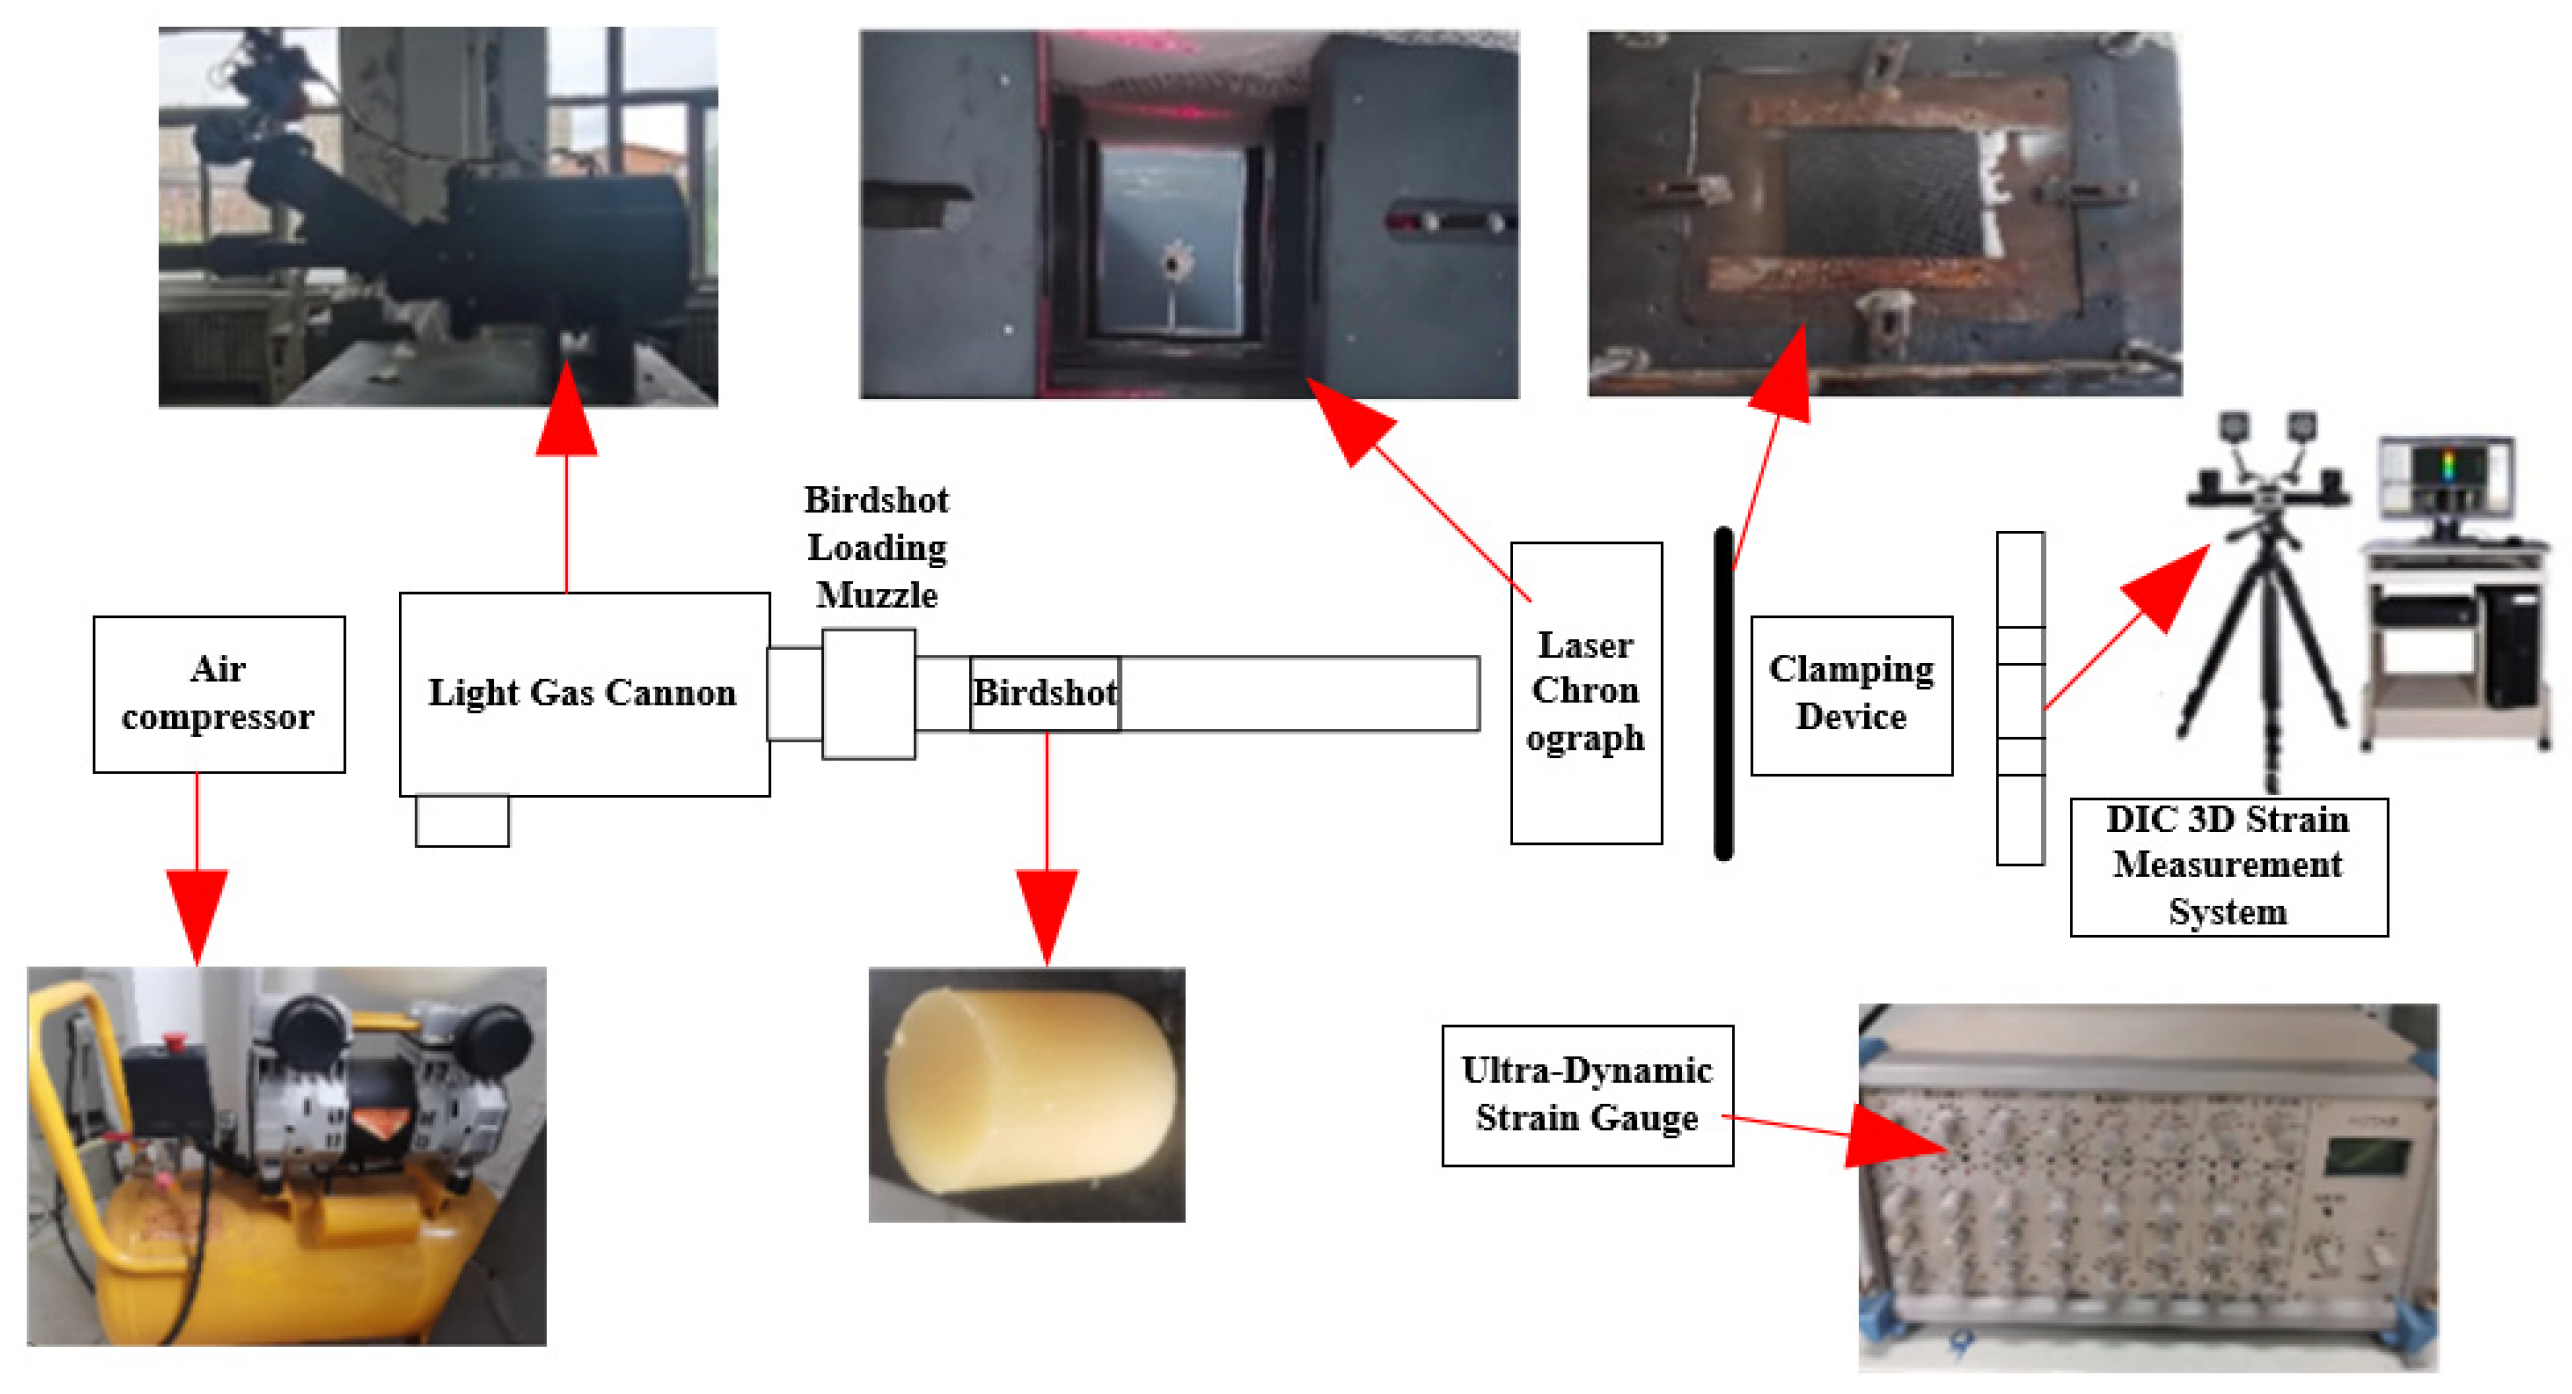
Figure 2.
Strain gauge paste position.
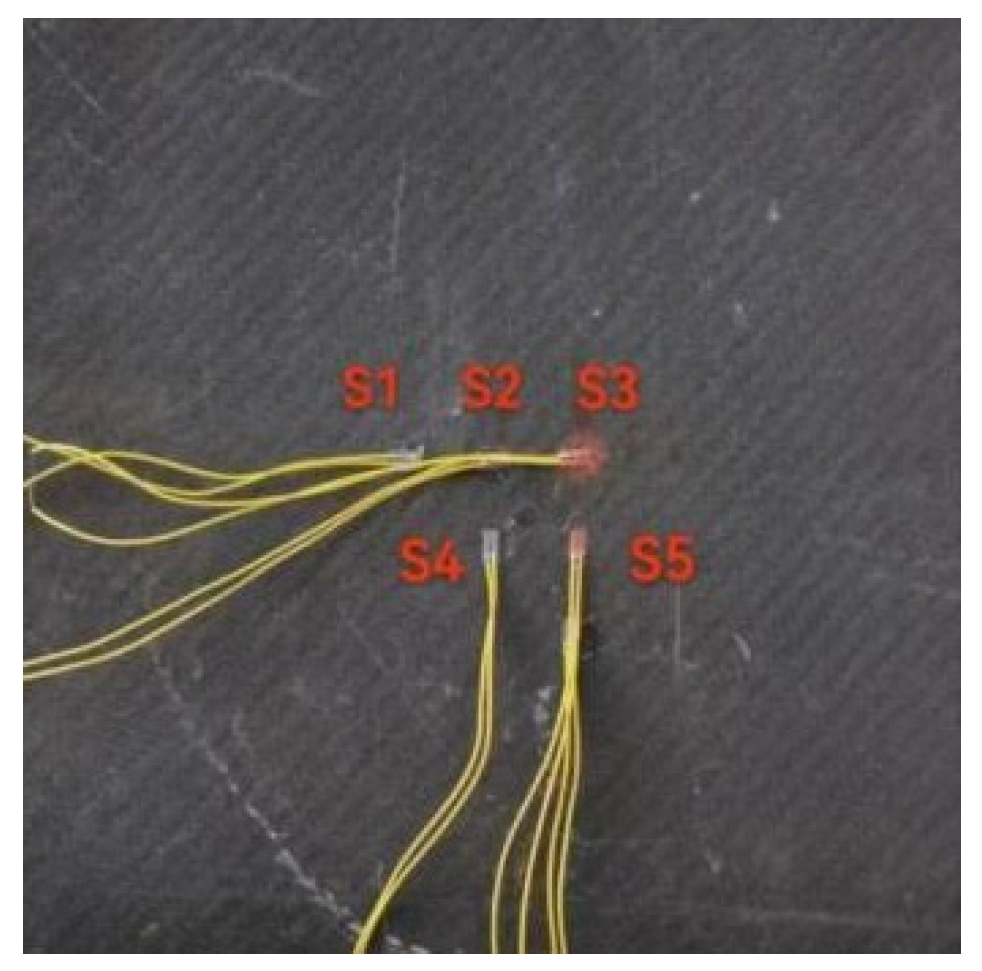
Figure 3.
Experiment the strain curve under different velocity impact (a) Strain curve of each channel at 34m/s; (b) Stain curve of each channel at 36m/s; (c) Strain curve of each channel at 38m/s.
Figure 3.
Experiment the strain curve under different velocity impact (a) Strain curve of each channel at 34m/s; (b) Stain curve of each channel at 36m/s; (c) Strain curve of each channel at 38m/s.
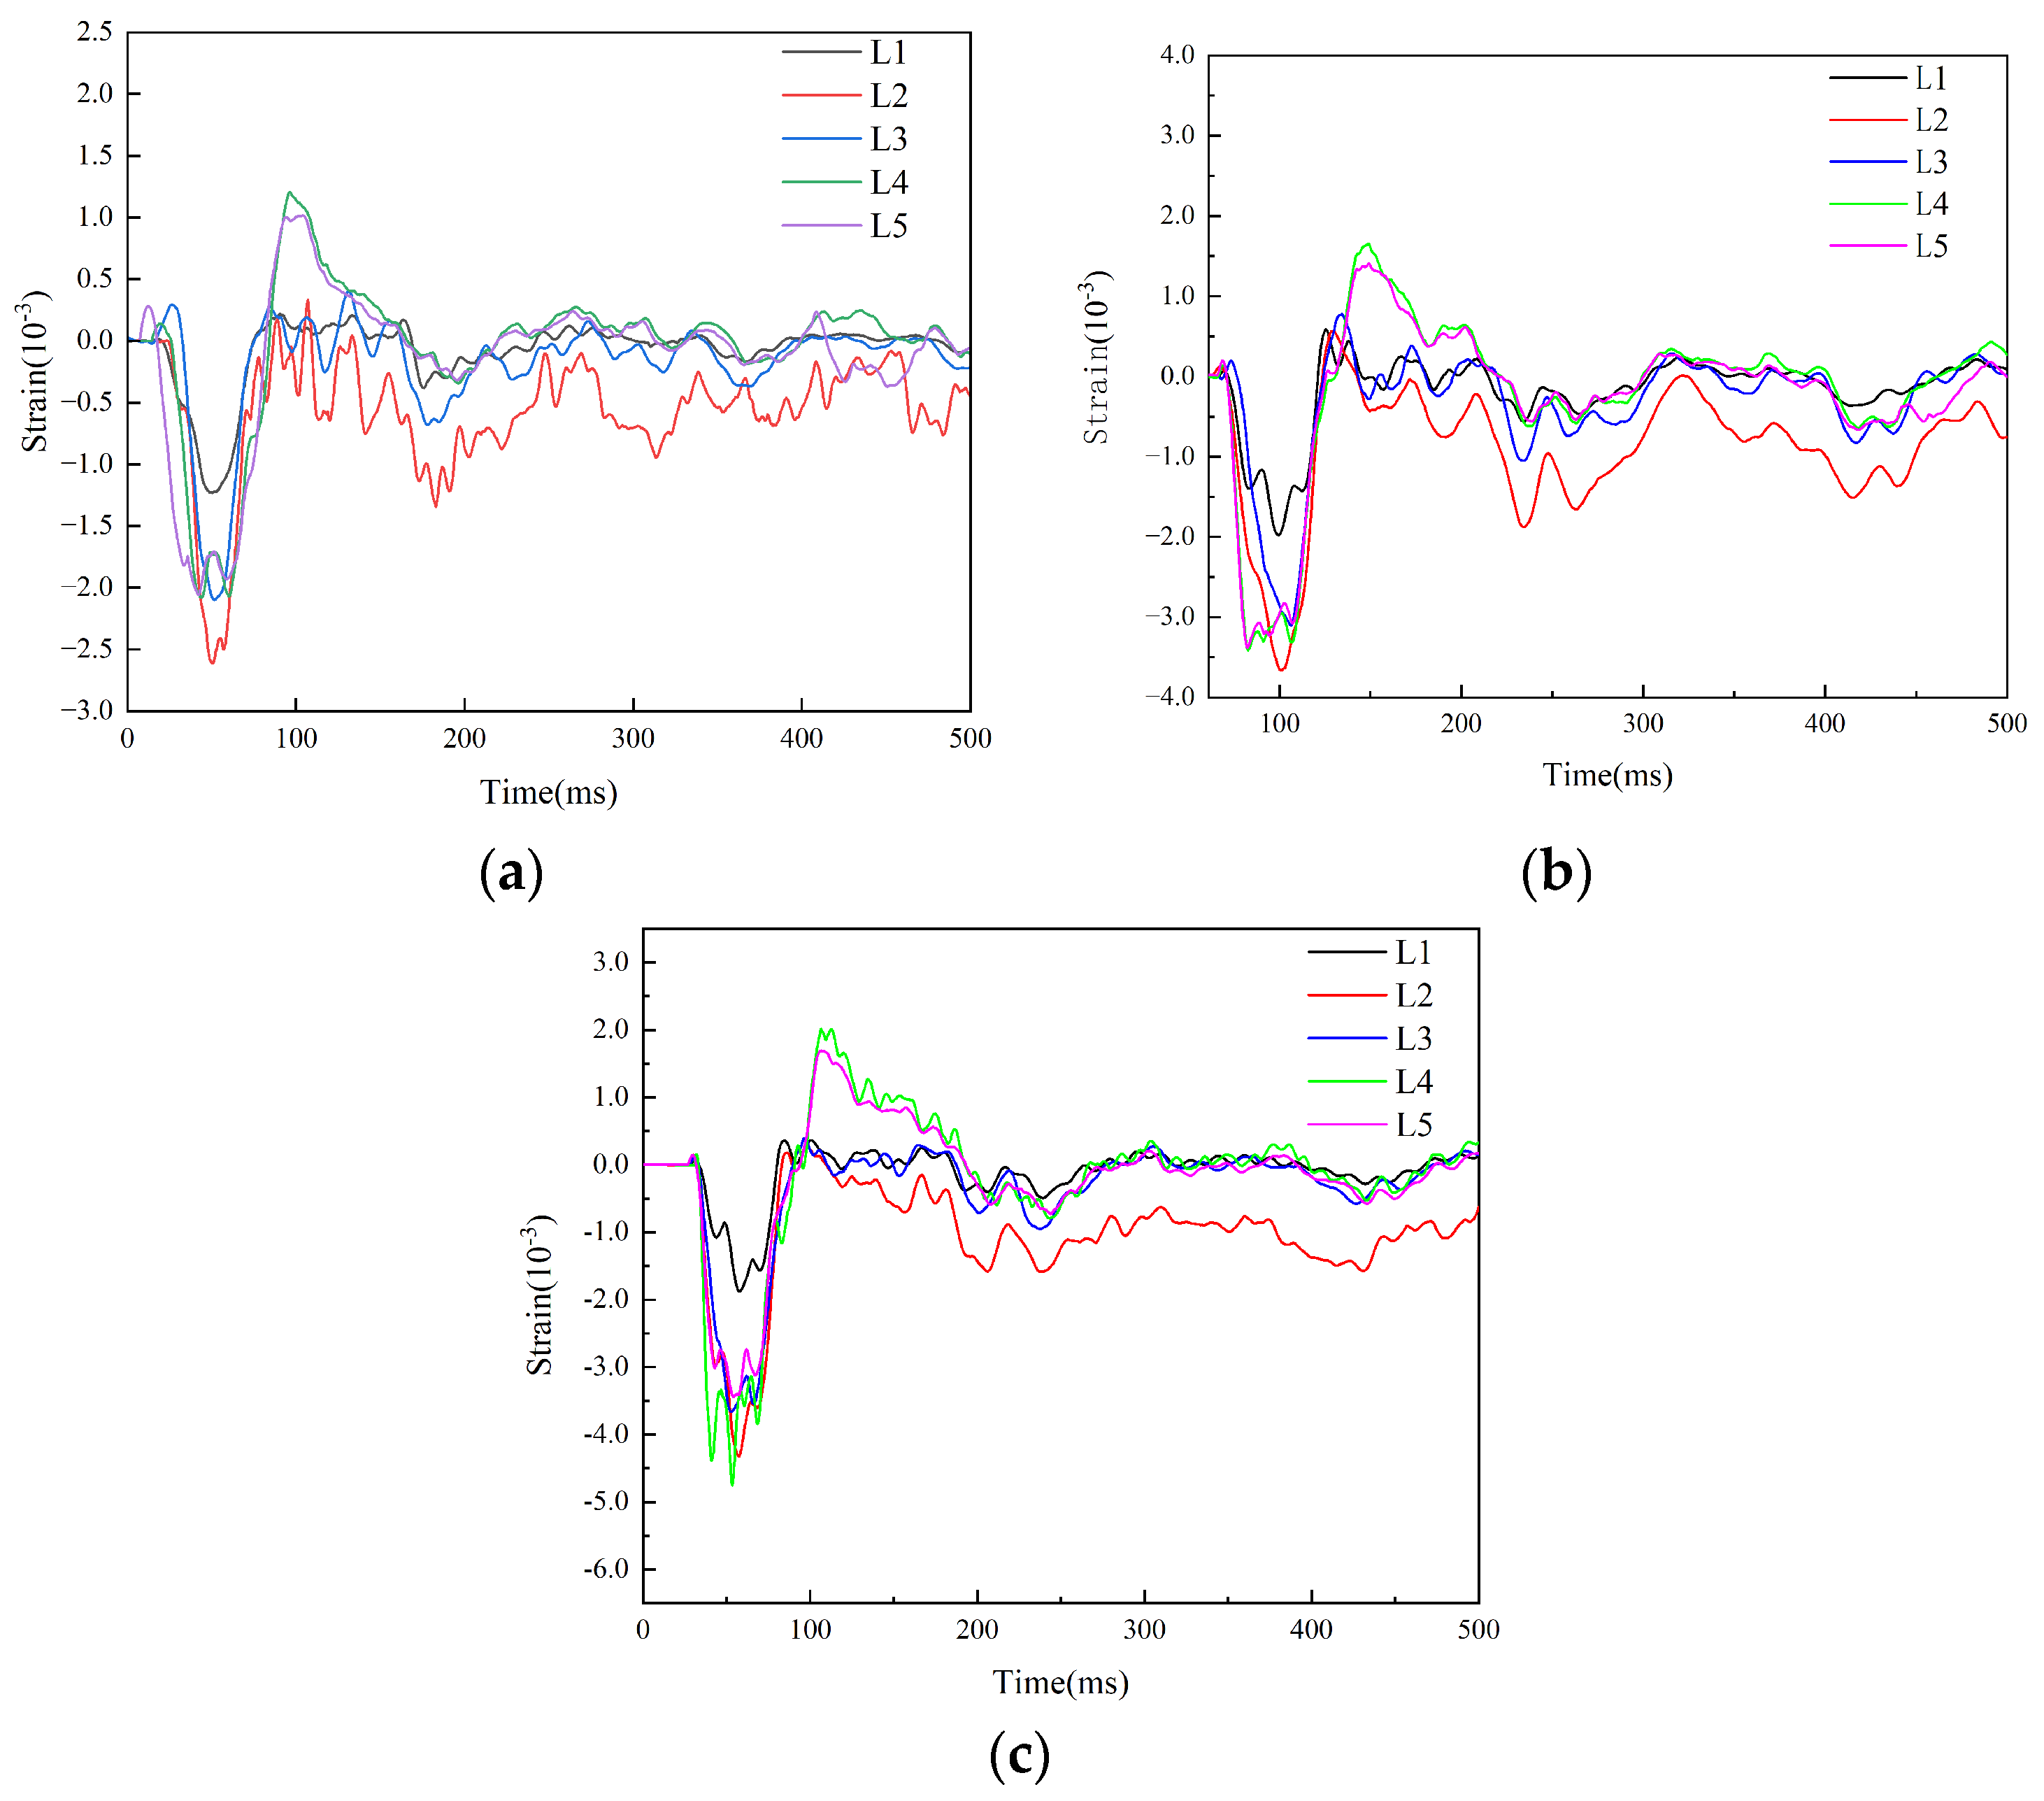
Figure 4.
Bird model: (a) Bird entity model; (b) Bird SPH model.
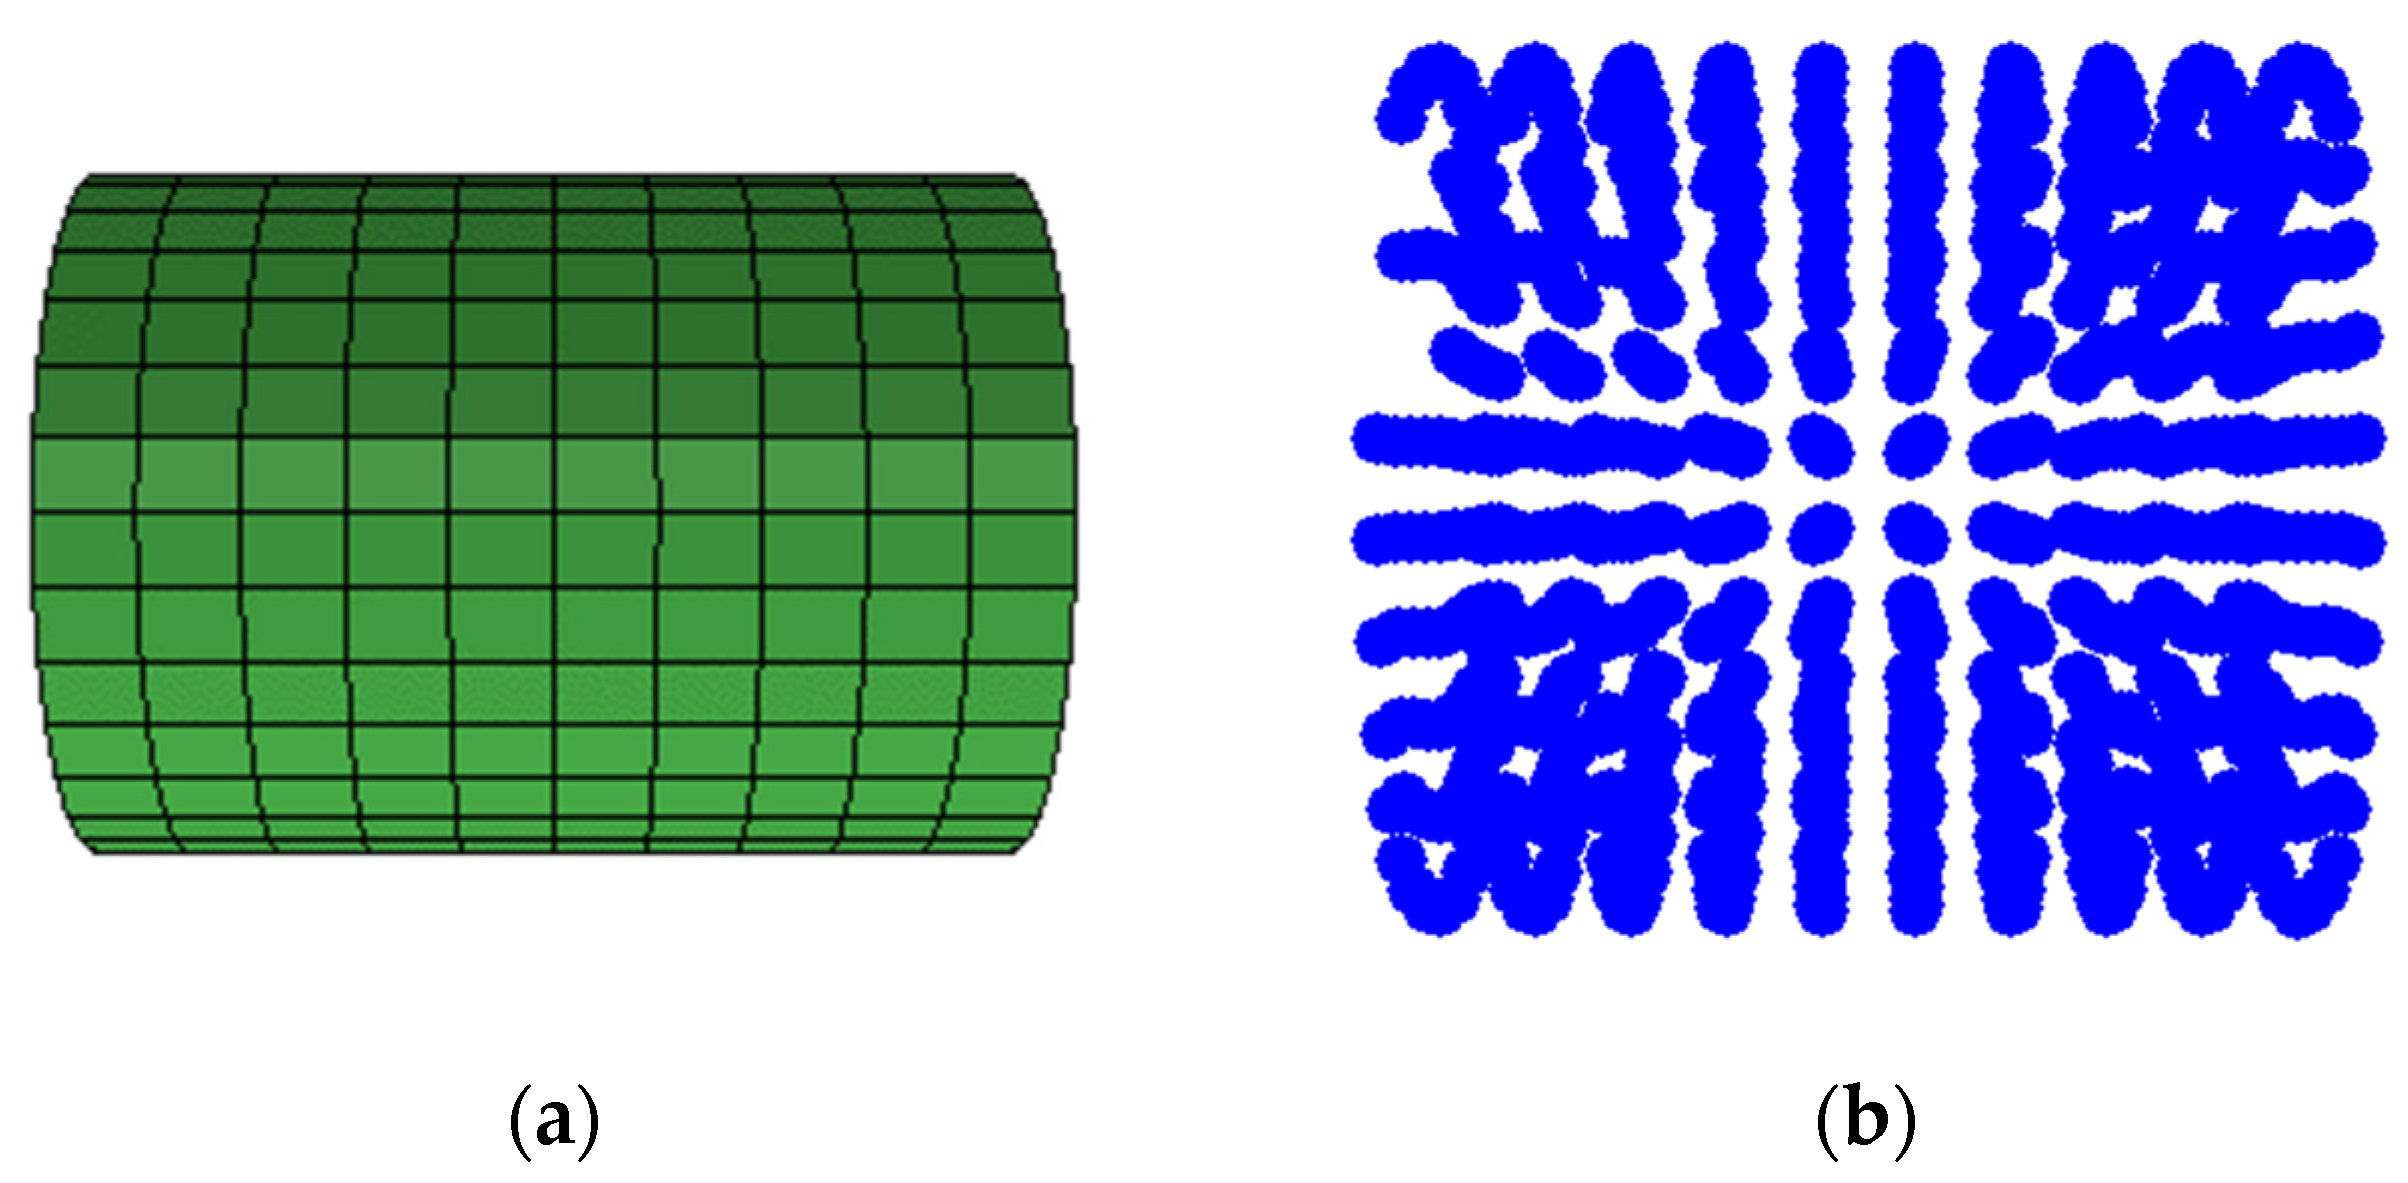
Figure 5.
Bird speed settings.
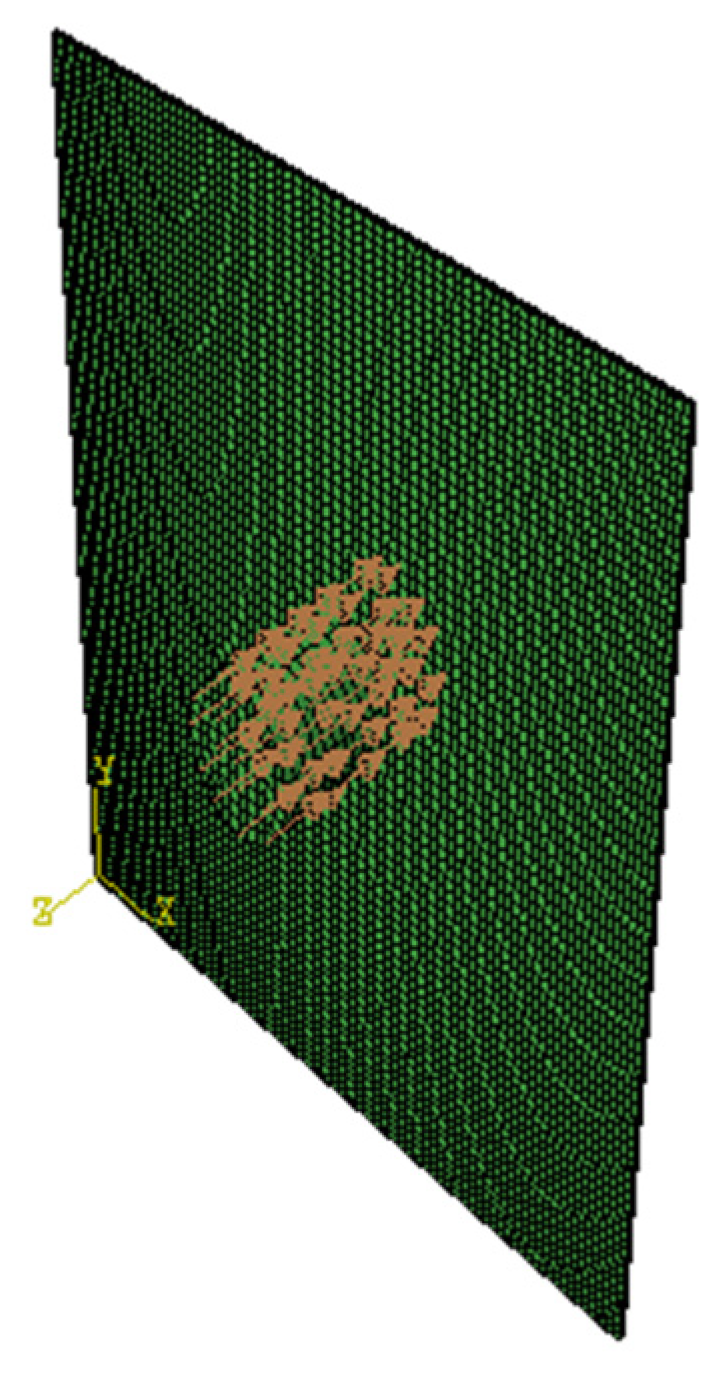
Figure 8.
Comparison of experimental and simulated strain of 3 groups at different speeds: (a) 34m/s test and simulation strain; (b) 36m/s test and simulation strain; (c) 38m/s test and simulation strain.
Figure 8.
Comparison of experimental and simulated strain of 3 groups at different speeds: (a) 34m/s test and simulation strain; (b) 36m/s test and simulation strain; (c) 38m/s test and simulation strain.
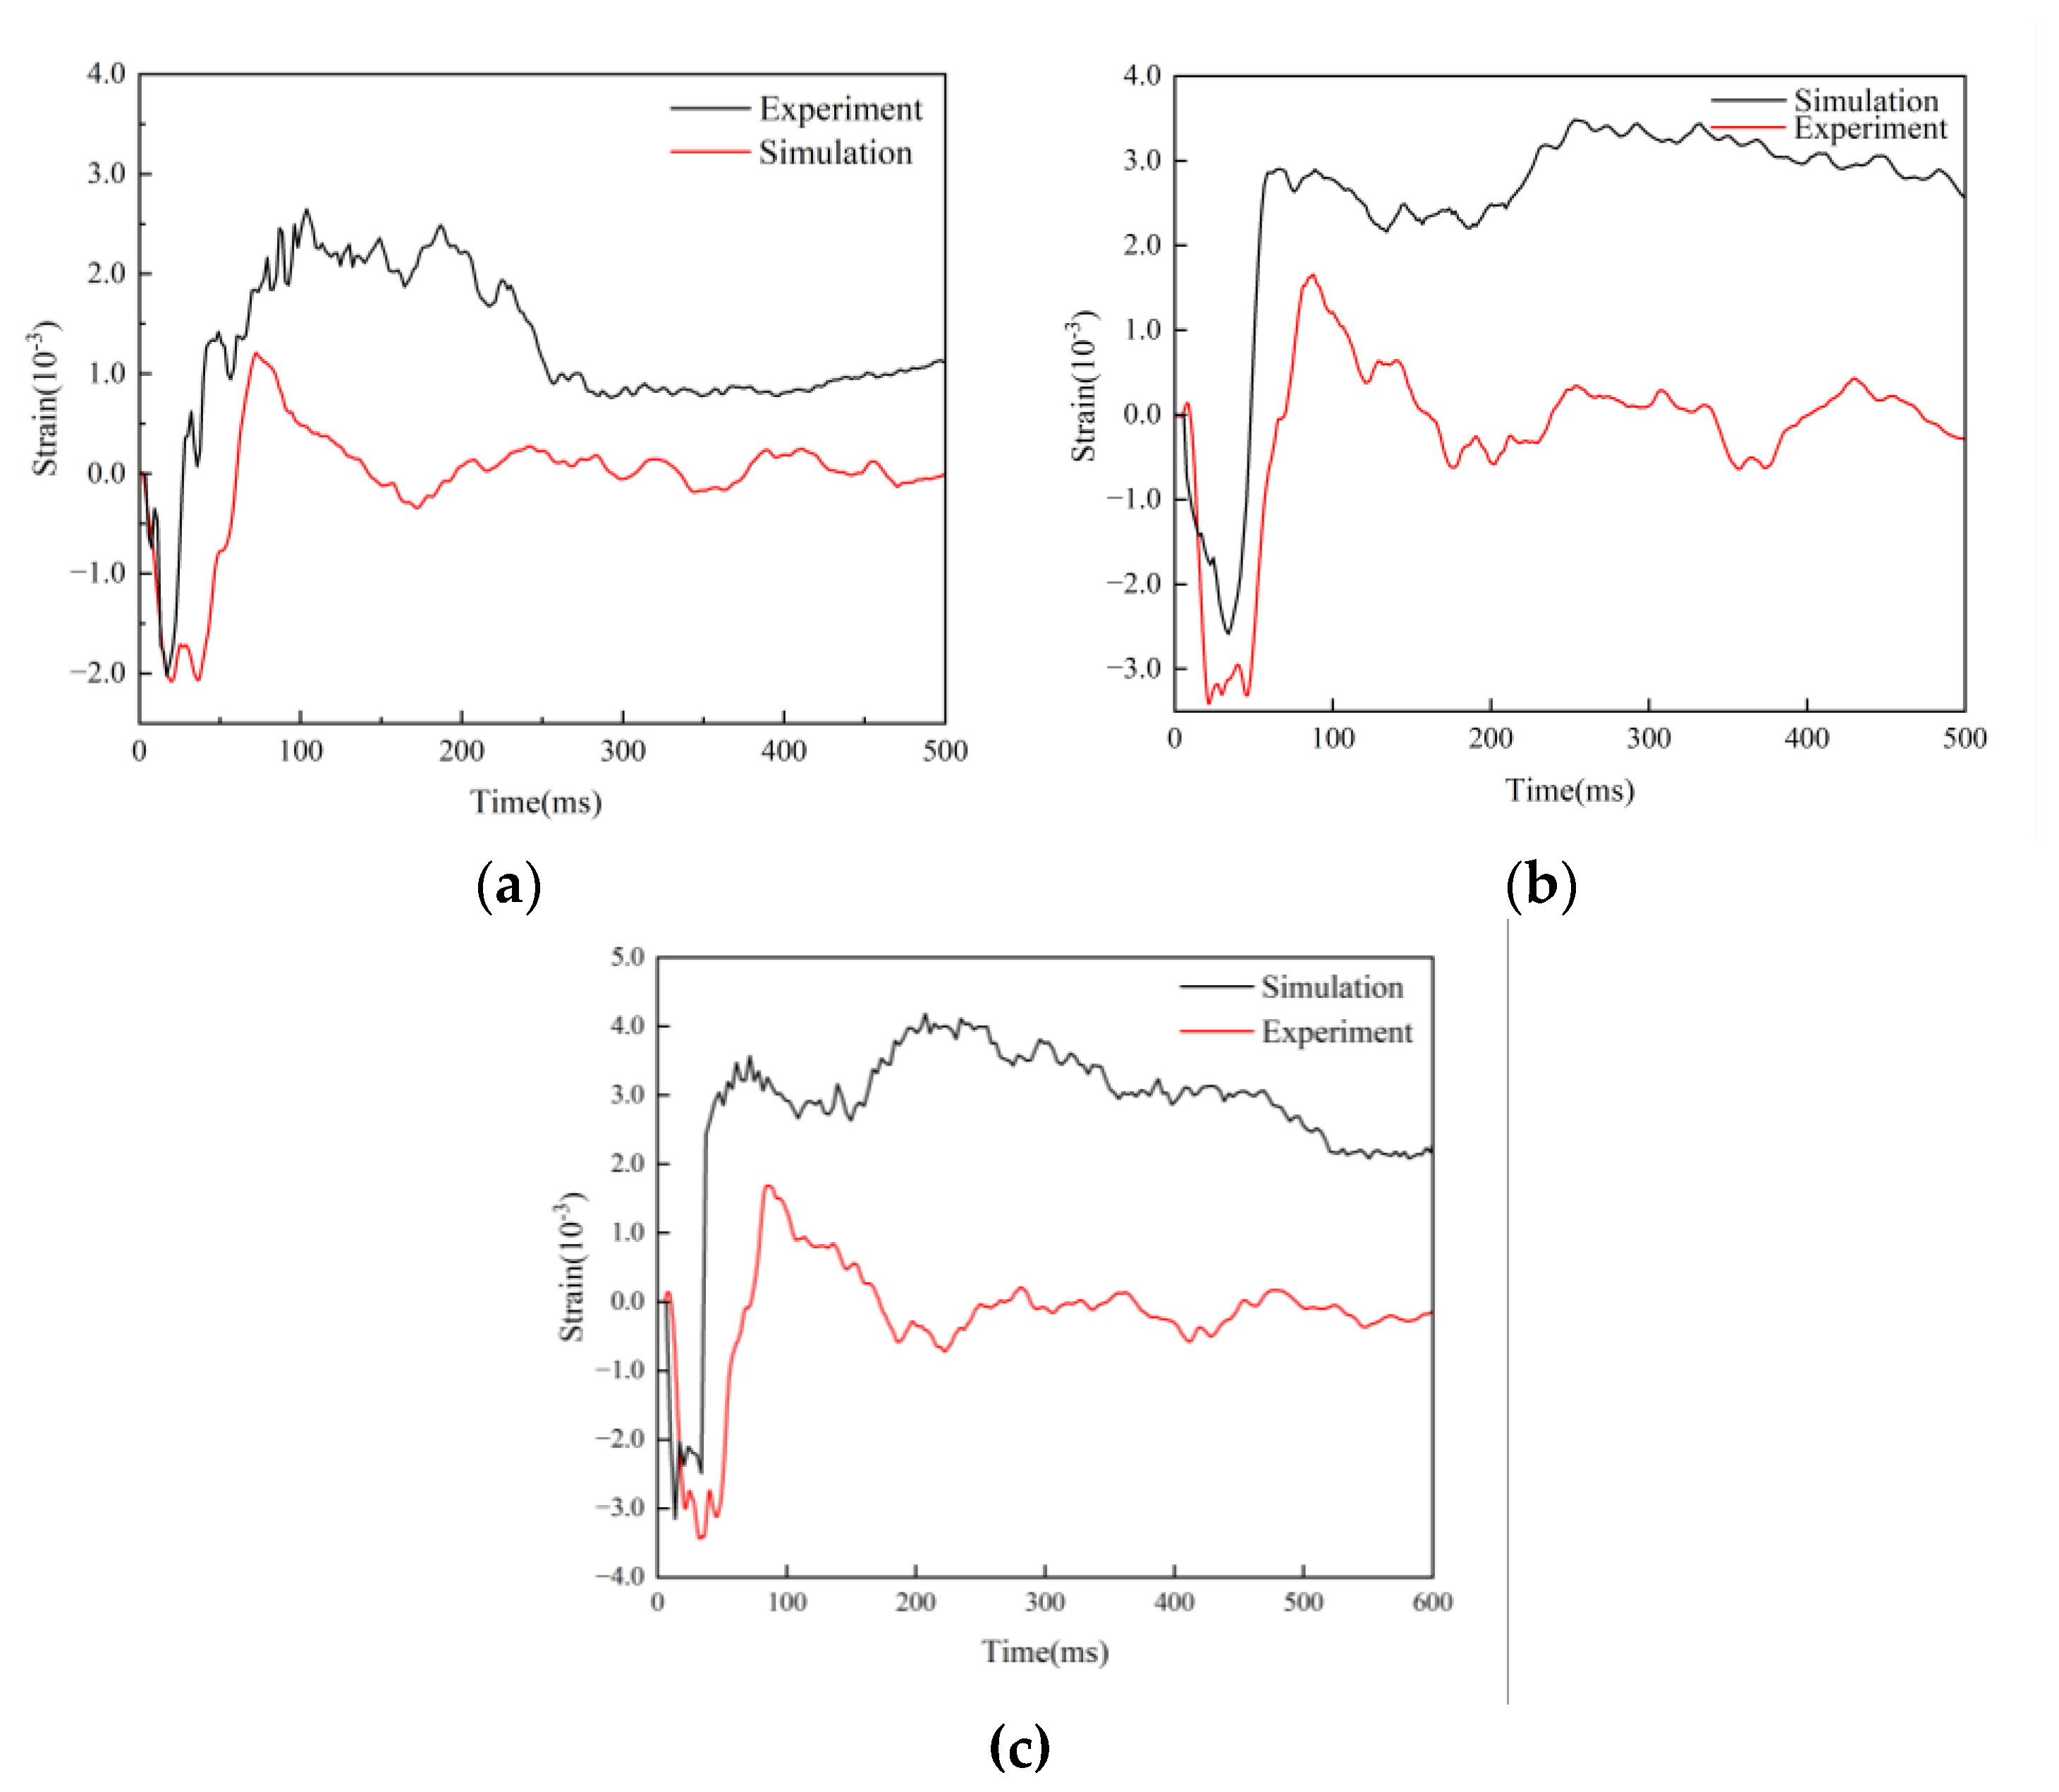
Figure 9.
The curve of strain, displacement and stress of L1 layering and schematic diagram of laminate shape: (a) Strain; (b) Displacement; (c) Stress; (d) The morphology of L1 laminates.
Figure 9.
The curve of strain, displacement and stress of L1 layering and schematic diagram of laminate shape: (a) Strain; (b) Displacement; (c) Stress; (d) The morphology of L1 laminates.
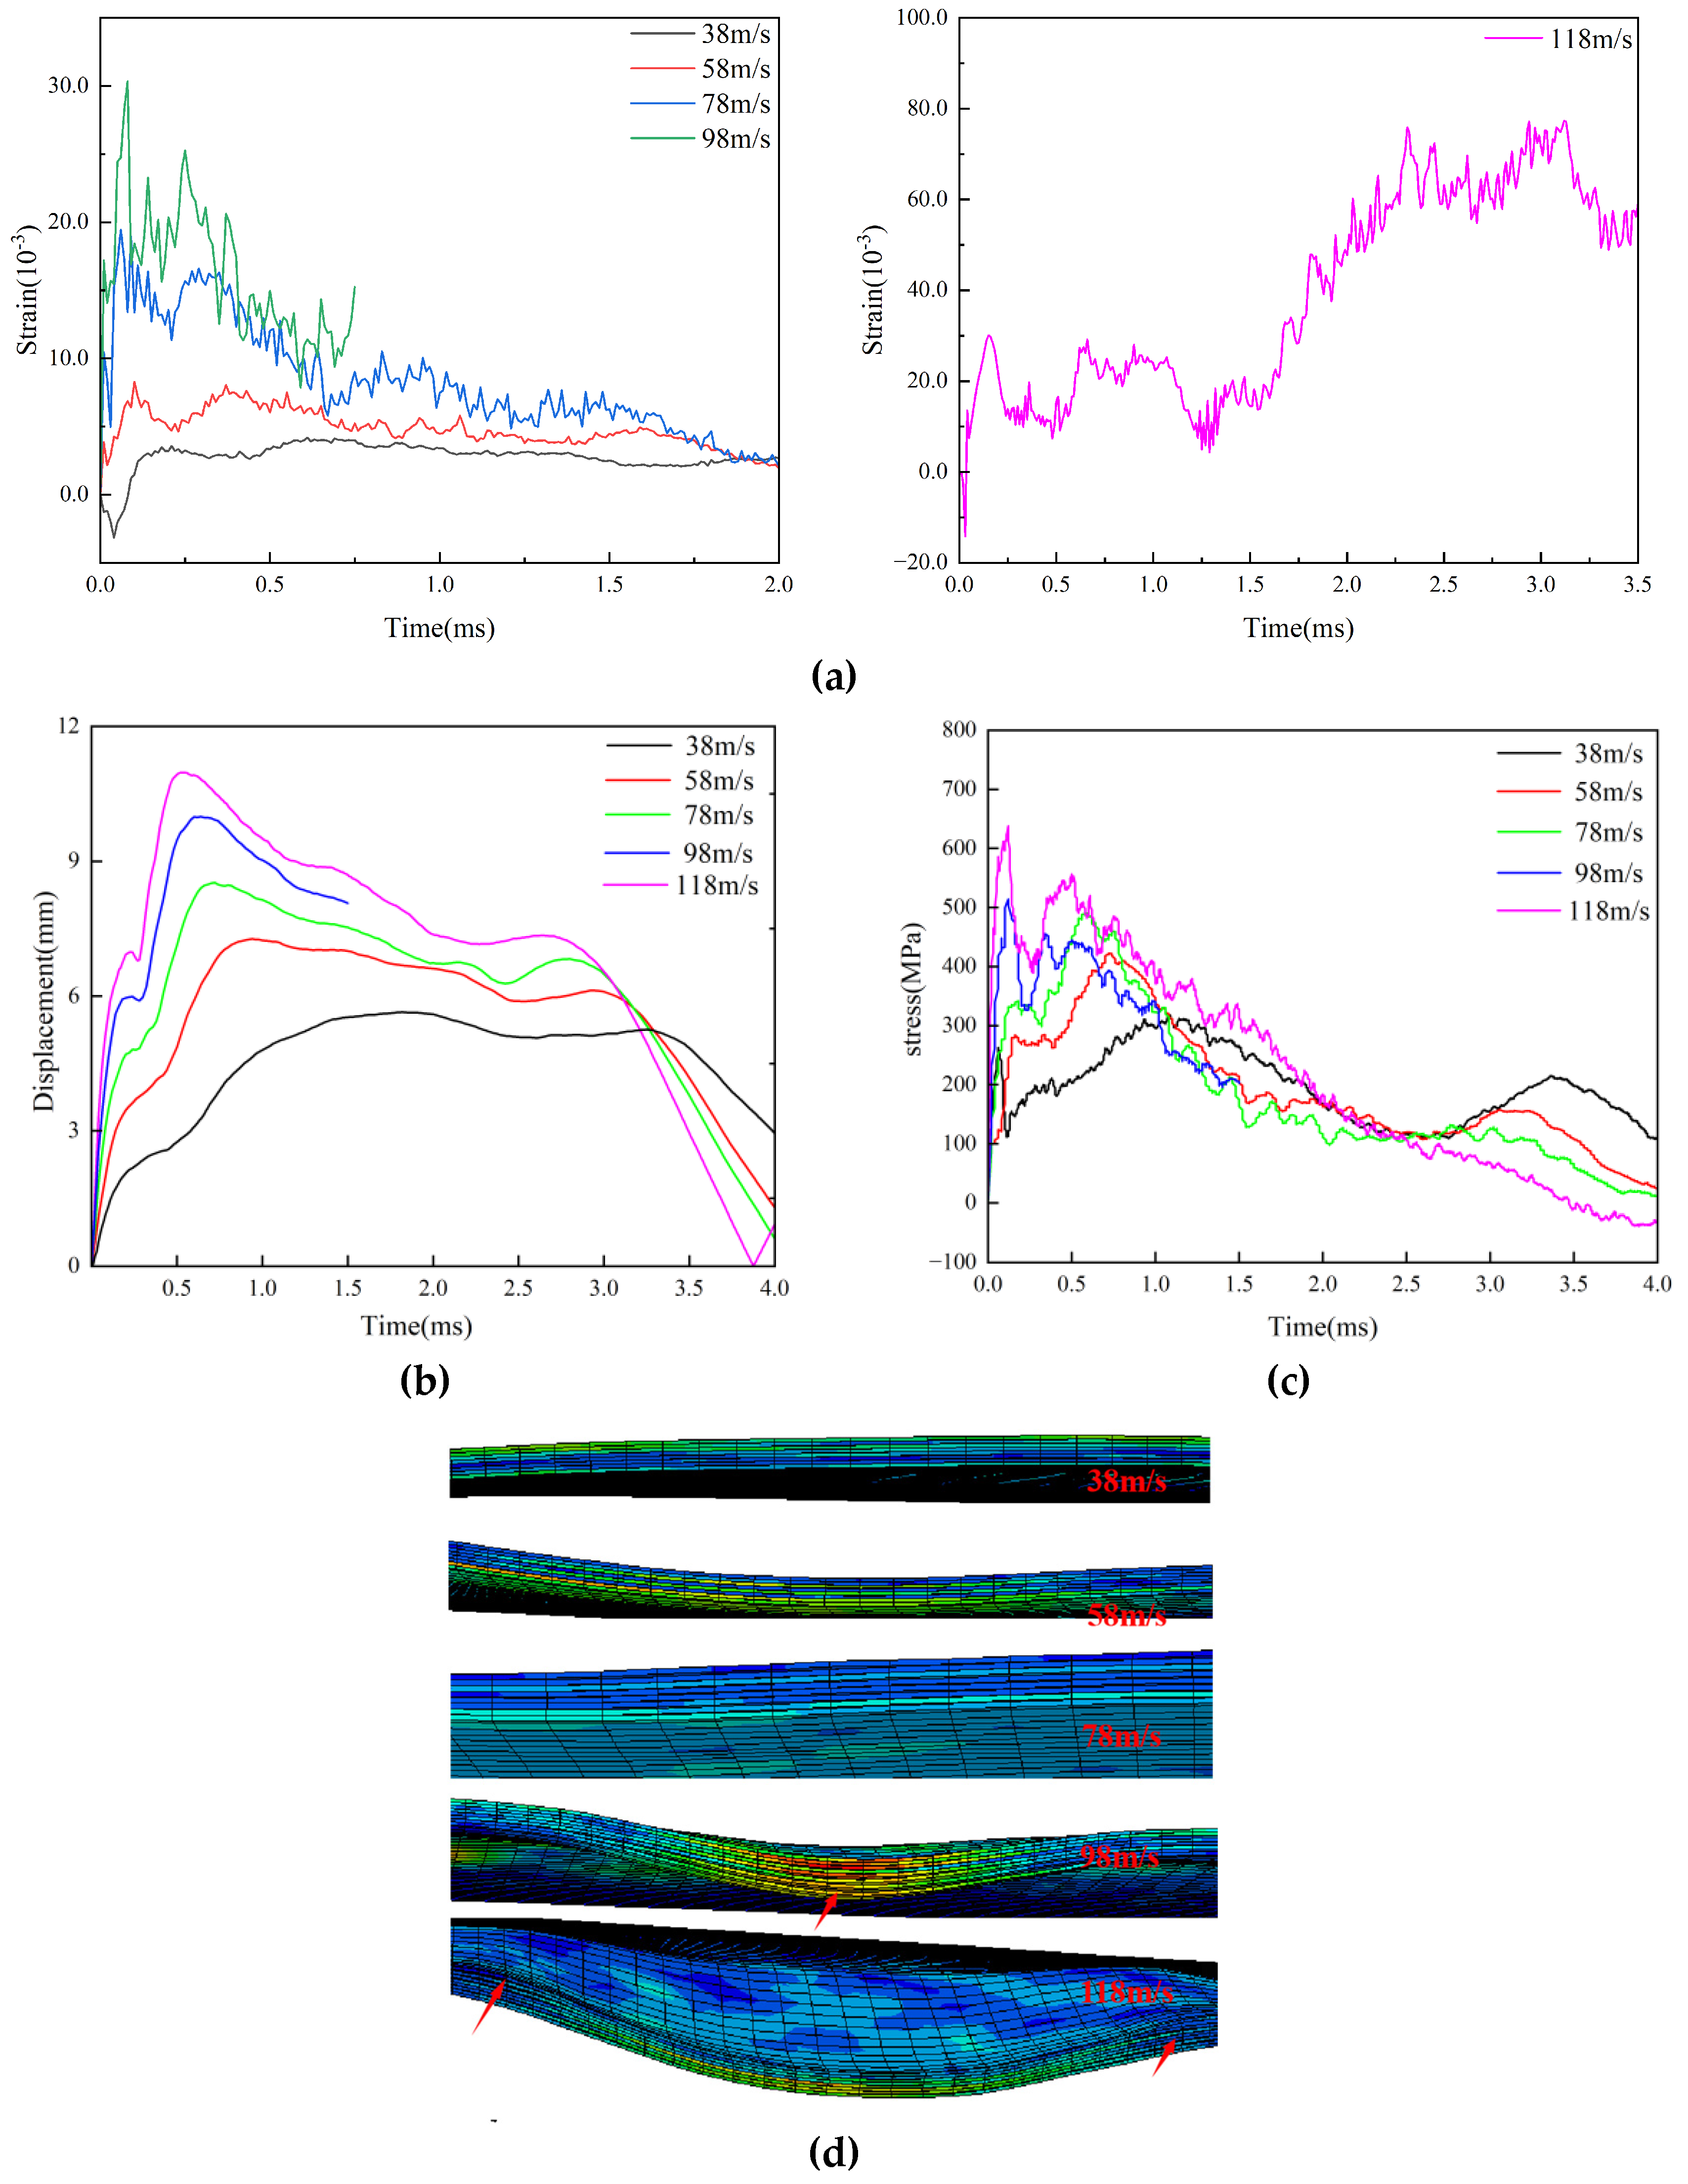
Figure 10.
The curve of strain, displacement and stress of L2 layering and schematic diagram of laminate shape: (a) Strain; (b) Displacement; (c) Stress; (d) The morphology of L2 laminates.
Figure 10.
The curve of strain, displacement and stress of L2 layering and schematic diagram of laminate shape: (a) Strain; (b) Displacement; (c) Stress; (d) The morphology of L2 laminates.
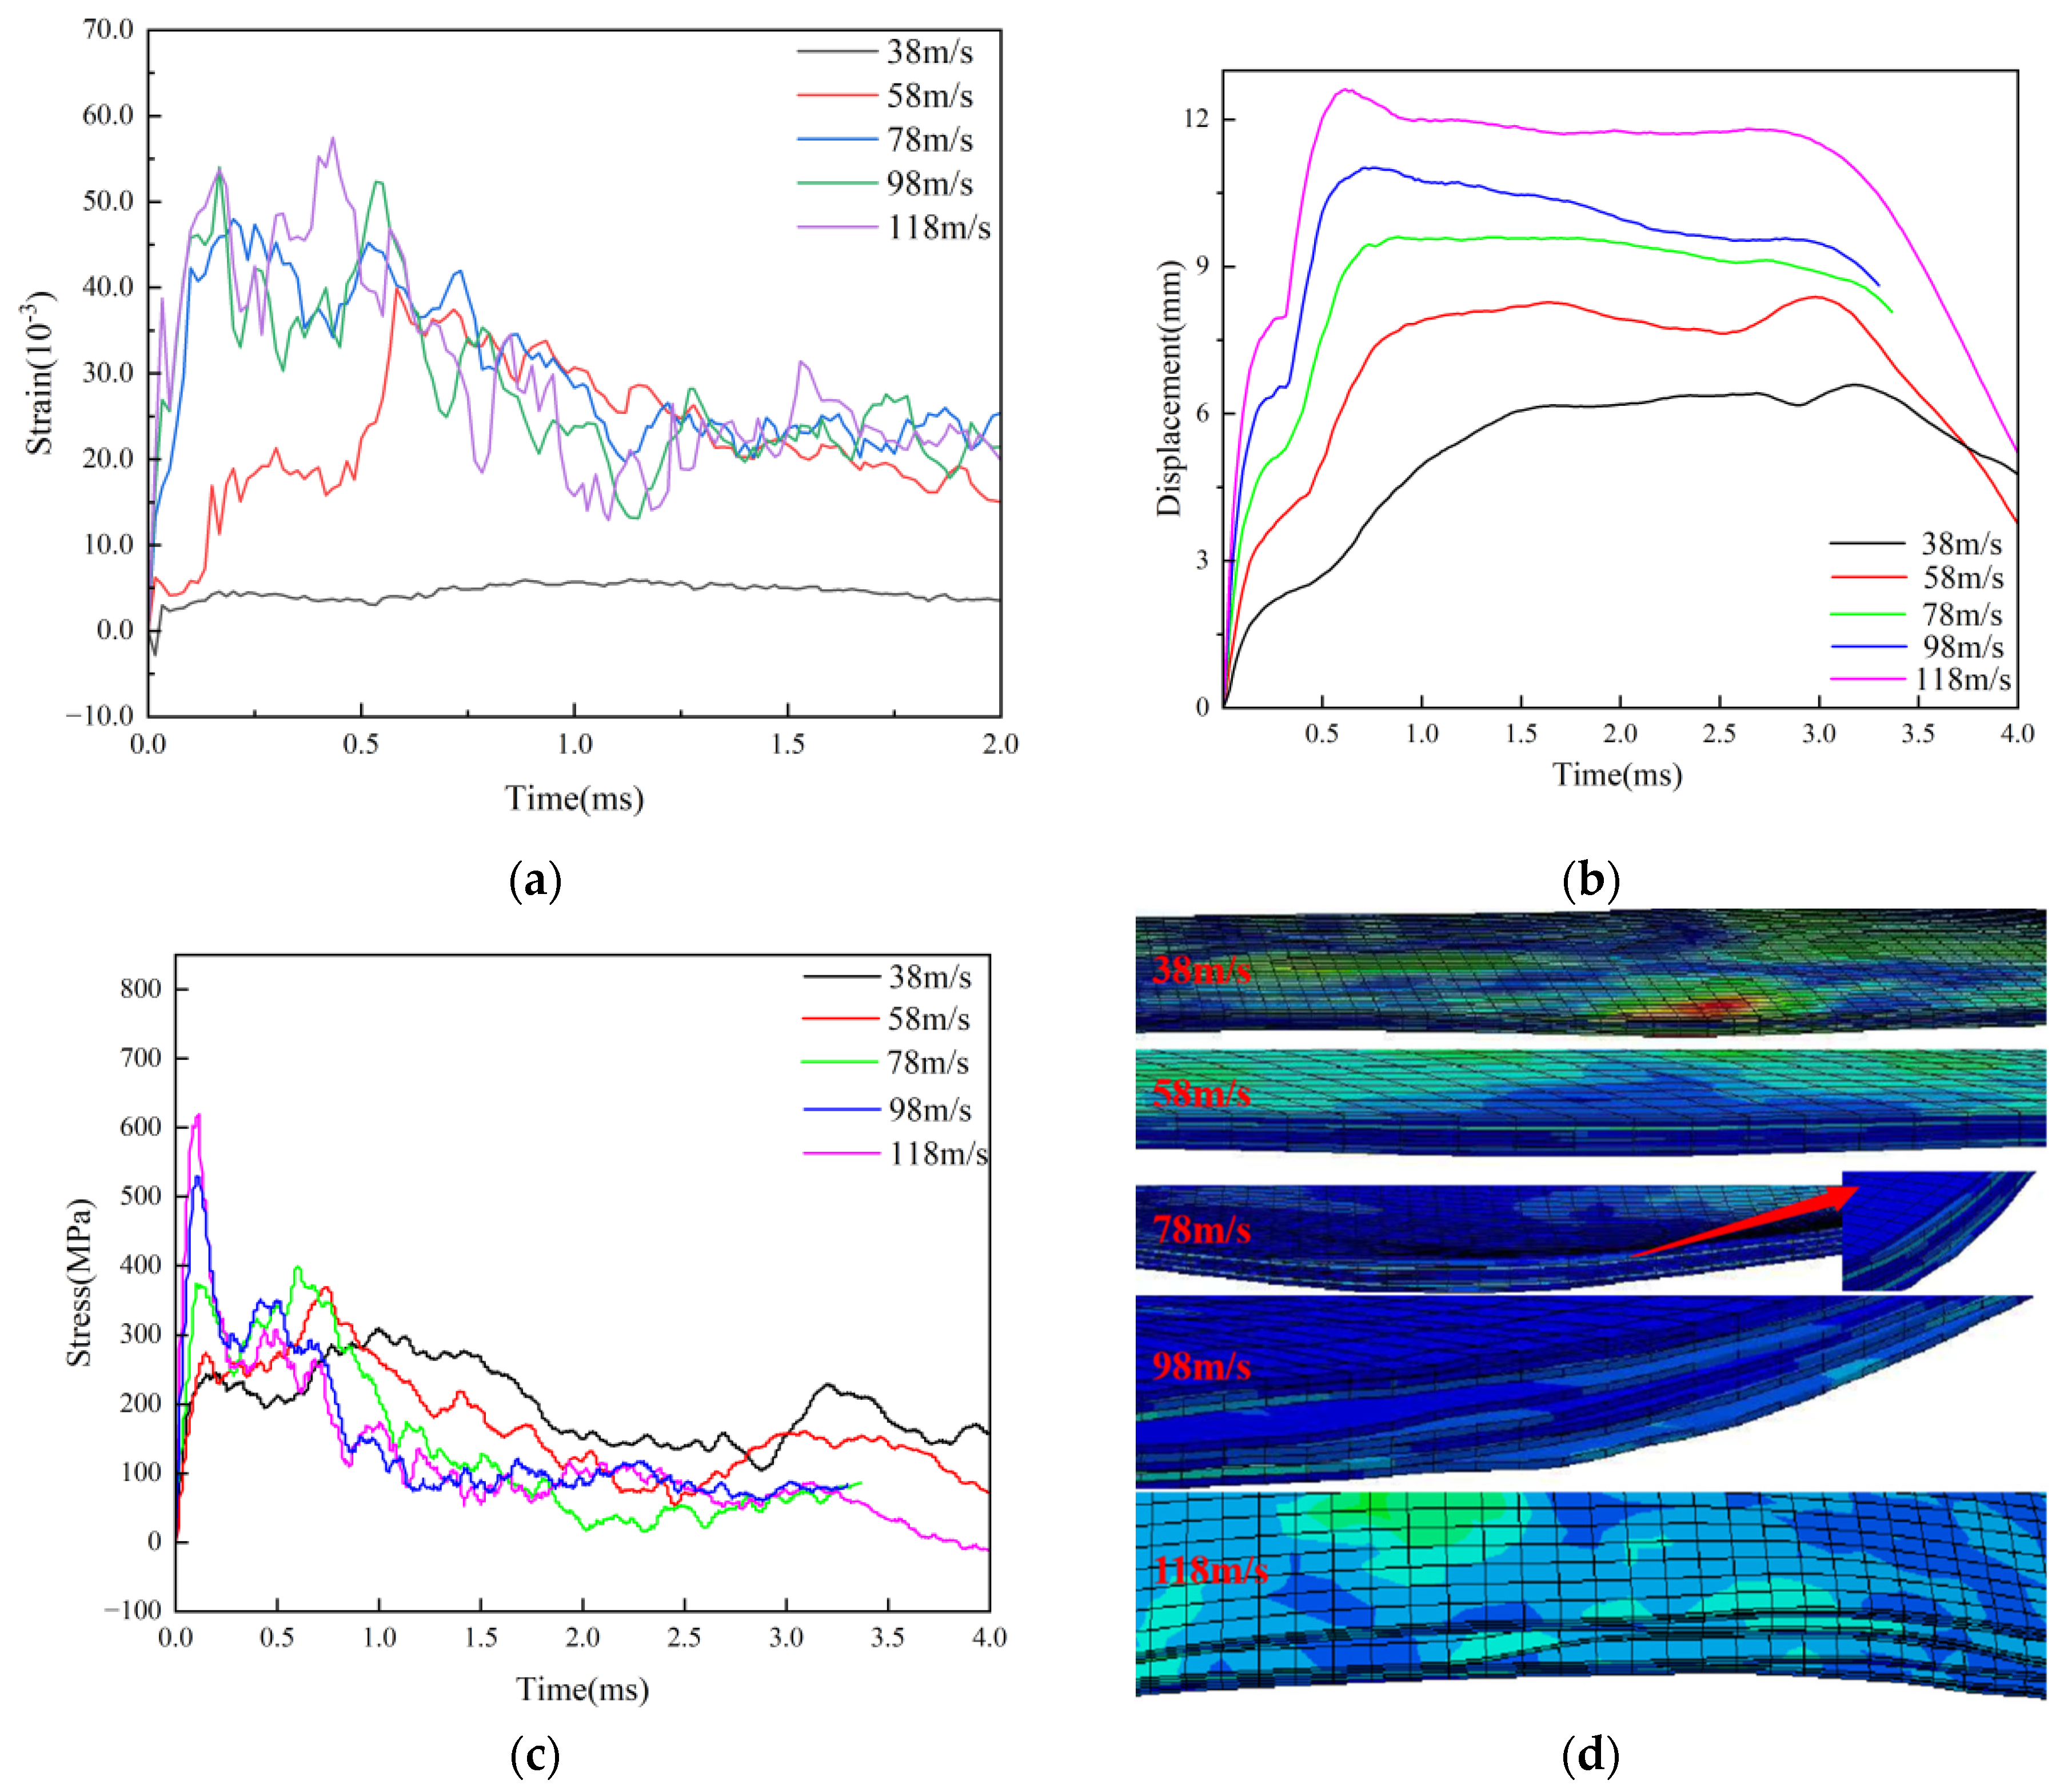
Figure 11.
The curve of strain, displacement and stress of L3 layering and schematic diagram of laminate shape: (a) Strain; (b) Displacement; (c) Stress; (d) The morphology of L3 laminates.
Figure 11.
The curve of strain, displacement and stress of L3 layering and schematic diagram of laminate shape: (a) Strain; (b) Displacement; (c) Stress; (d) The morphology of L3 laminates.
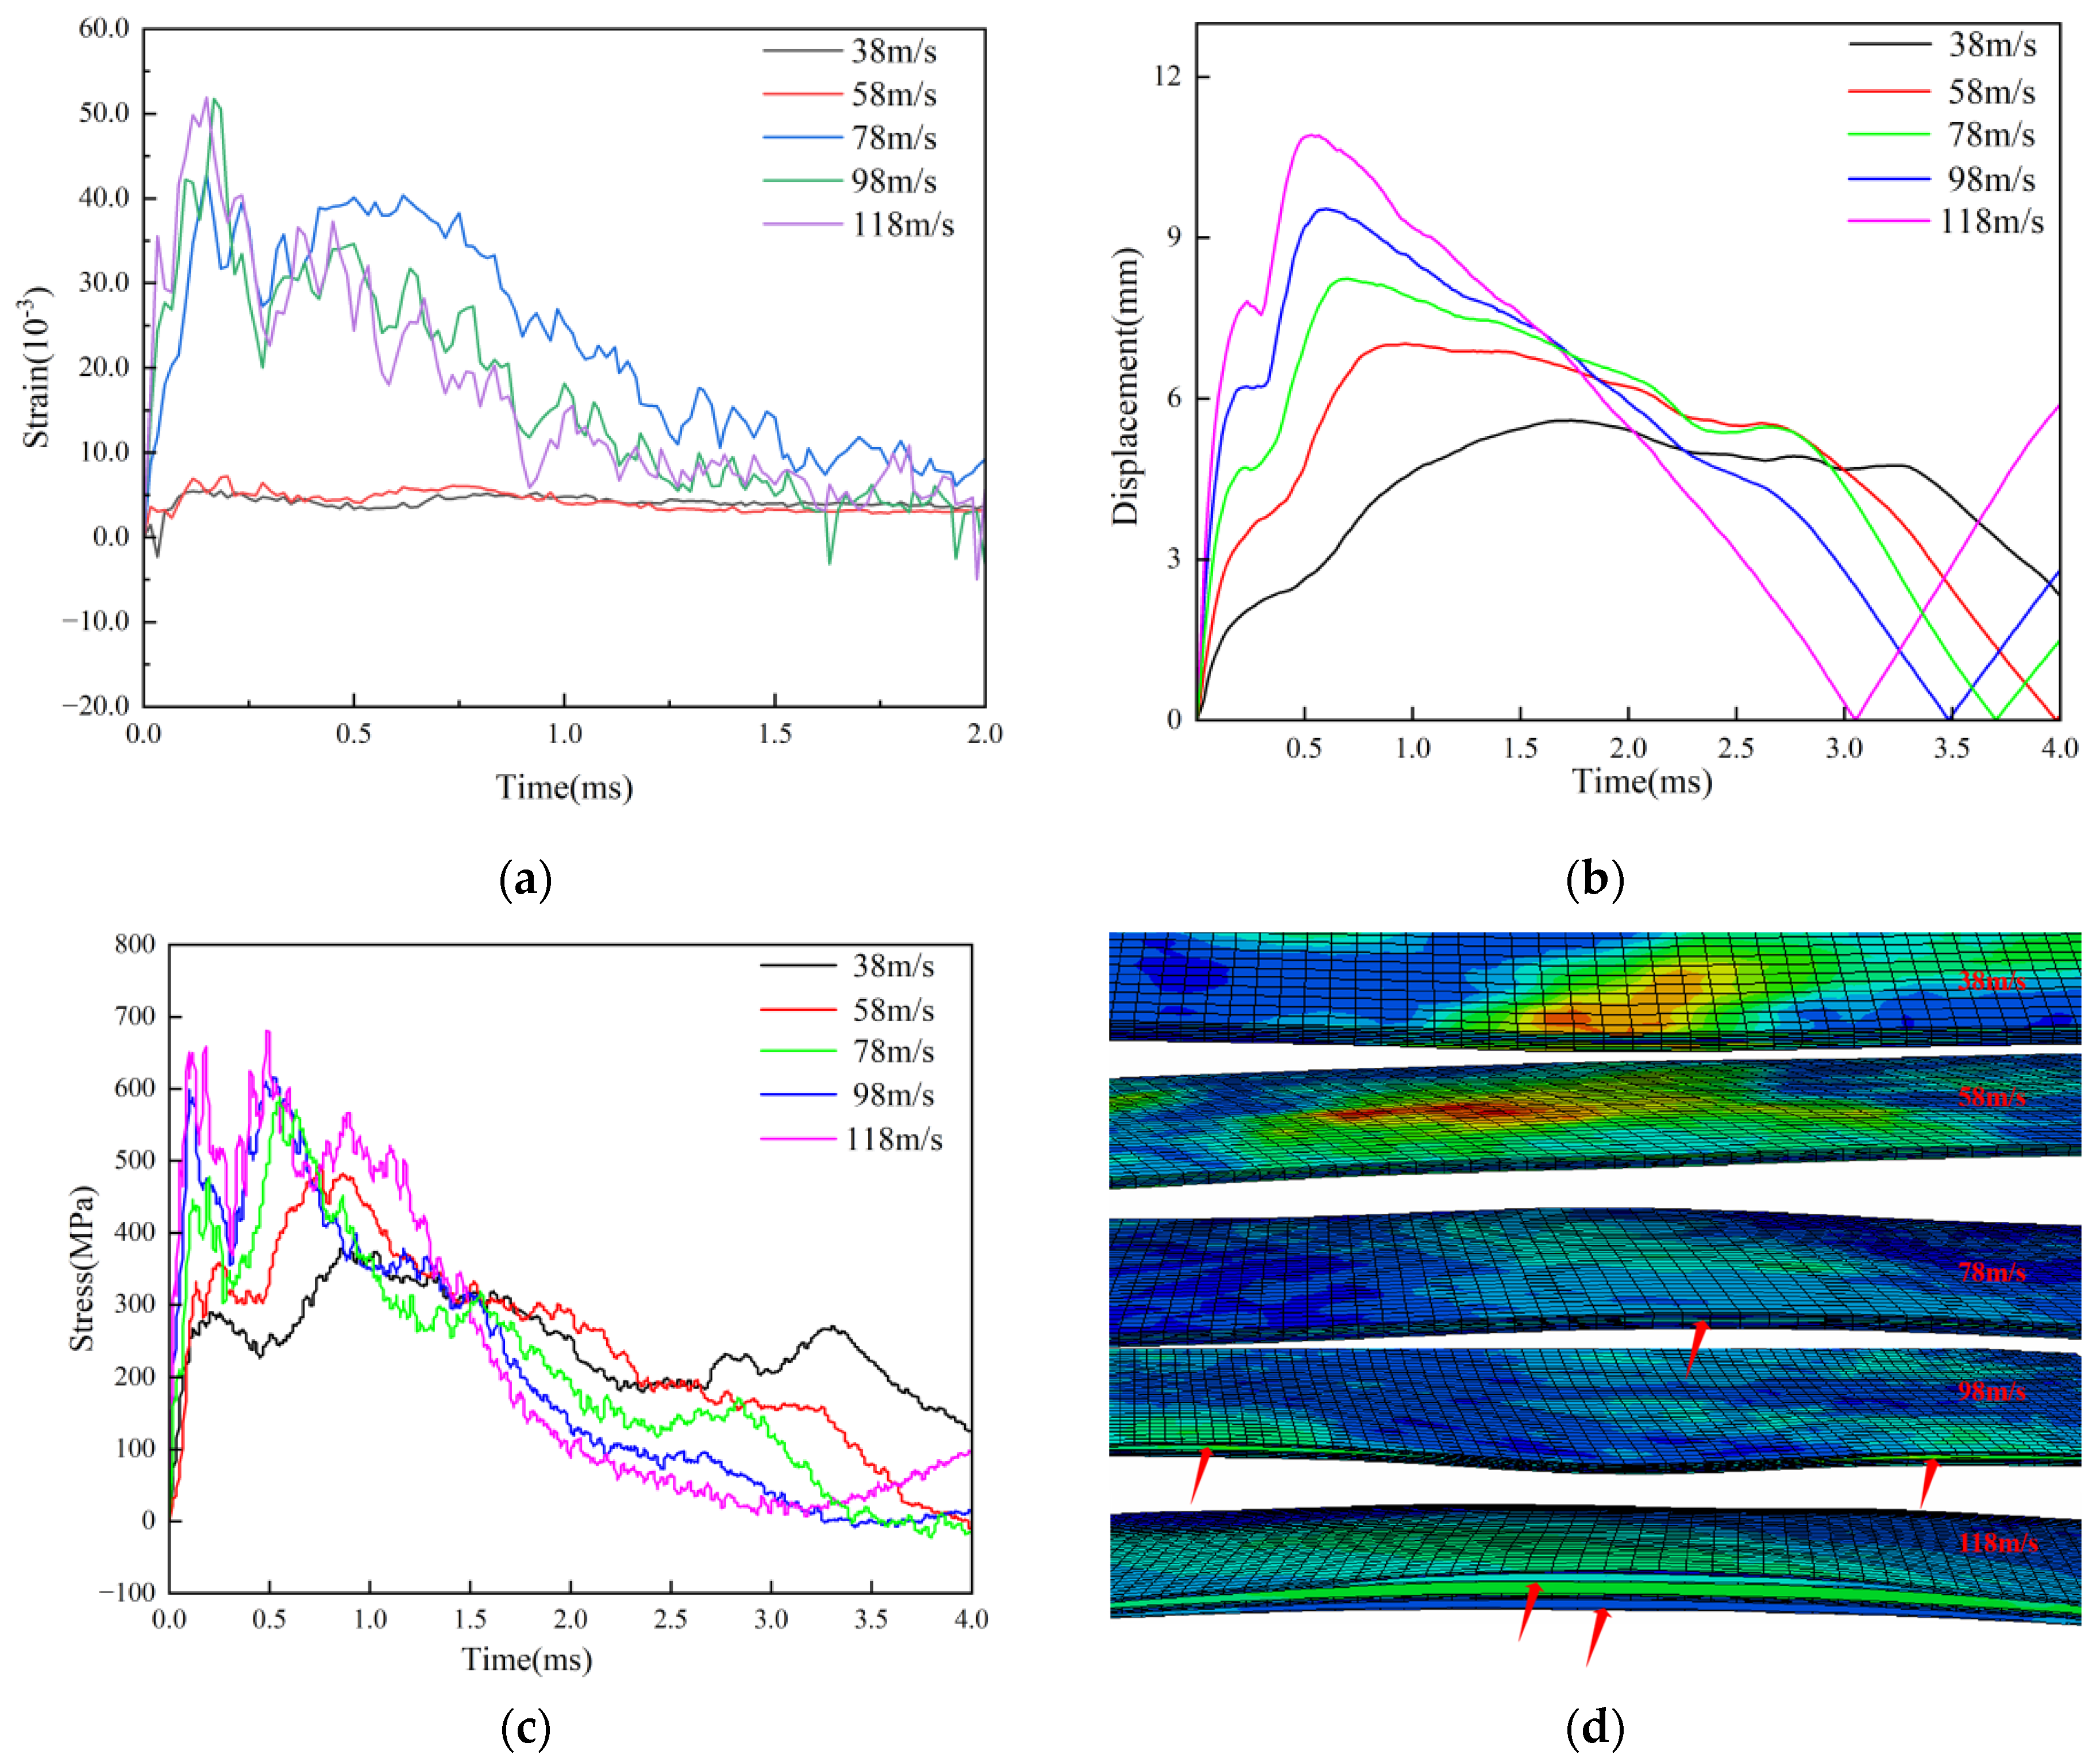
Figure 12.
The curve of strain, displacement and stress of L4 layering and schematic diagram of laminate shape: (a) Strain; (b) Displacement; (c) Stress; (d) The morphology of L4 laminates.
Figure 12.
The curve of strain, displacement and stress of L4 layering and schematic diagram of laminate shape: (a) Strain; (b) Displacement; (c) Stress; (d) The morphology of L4 laminates.
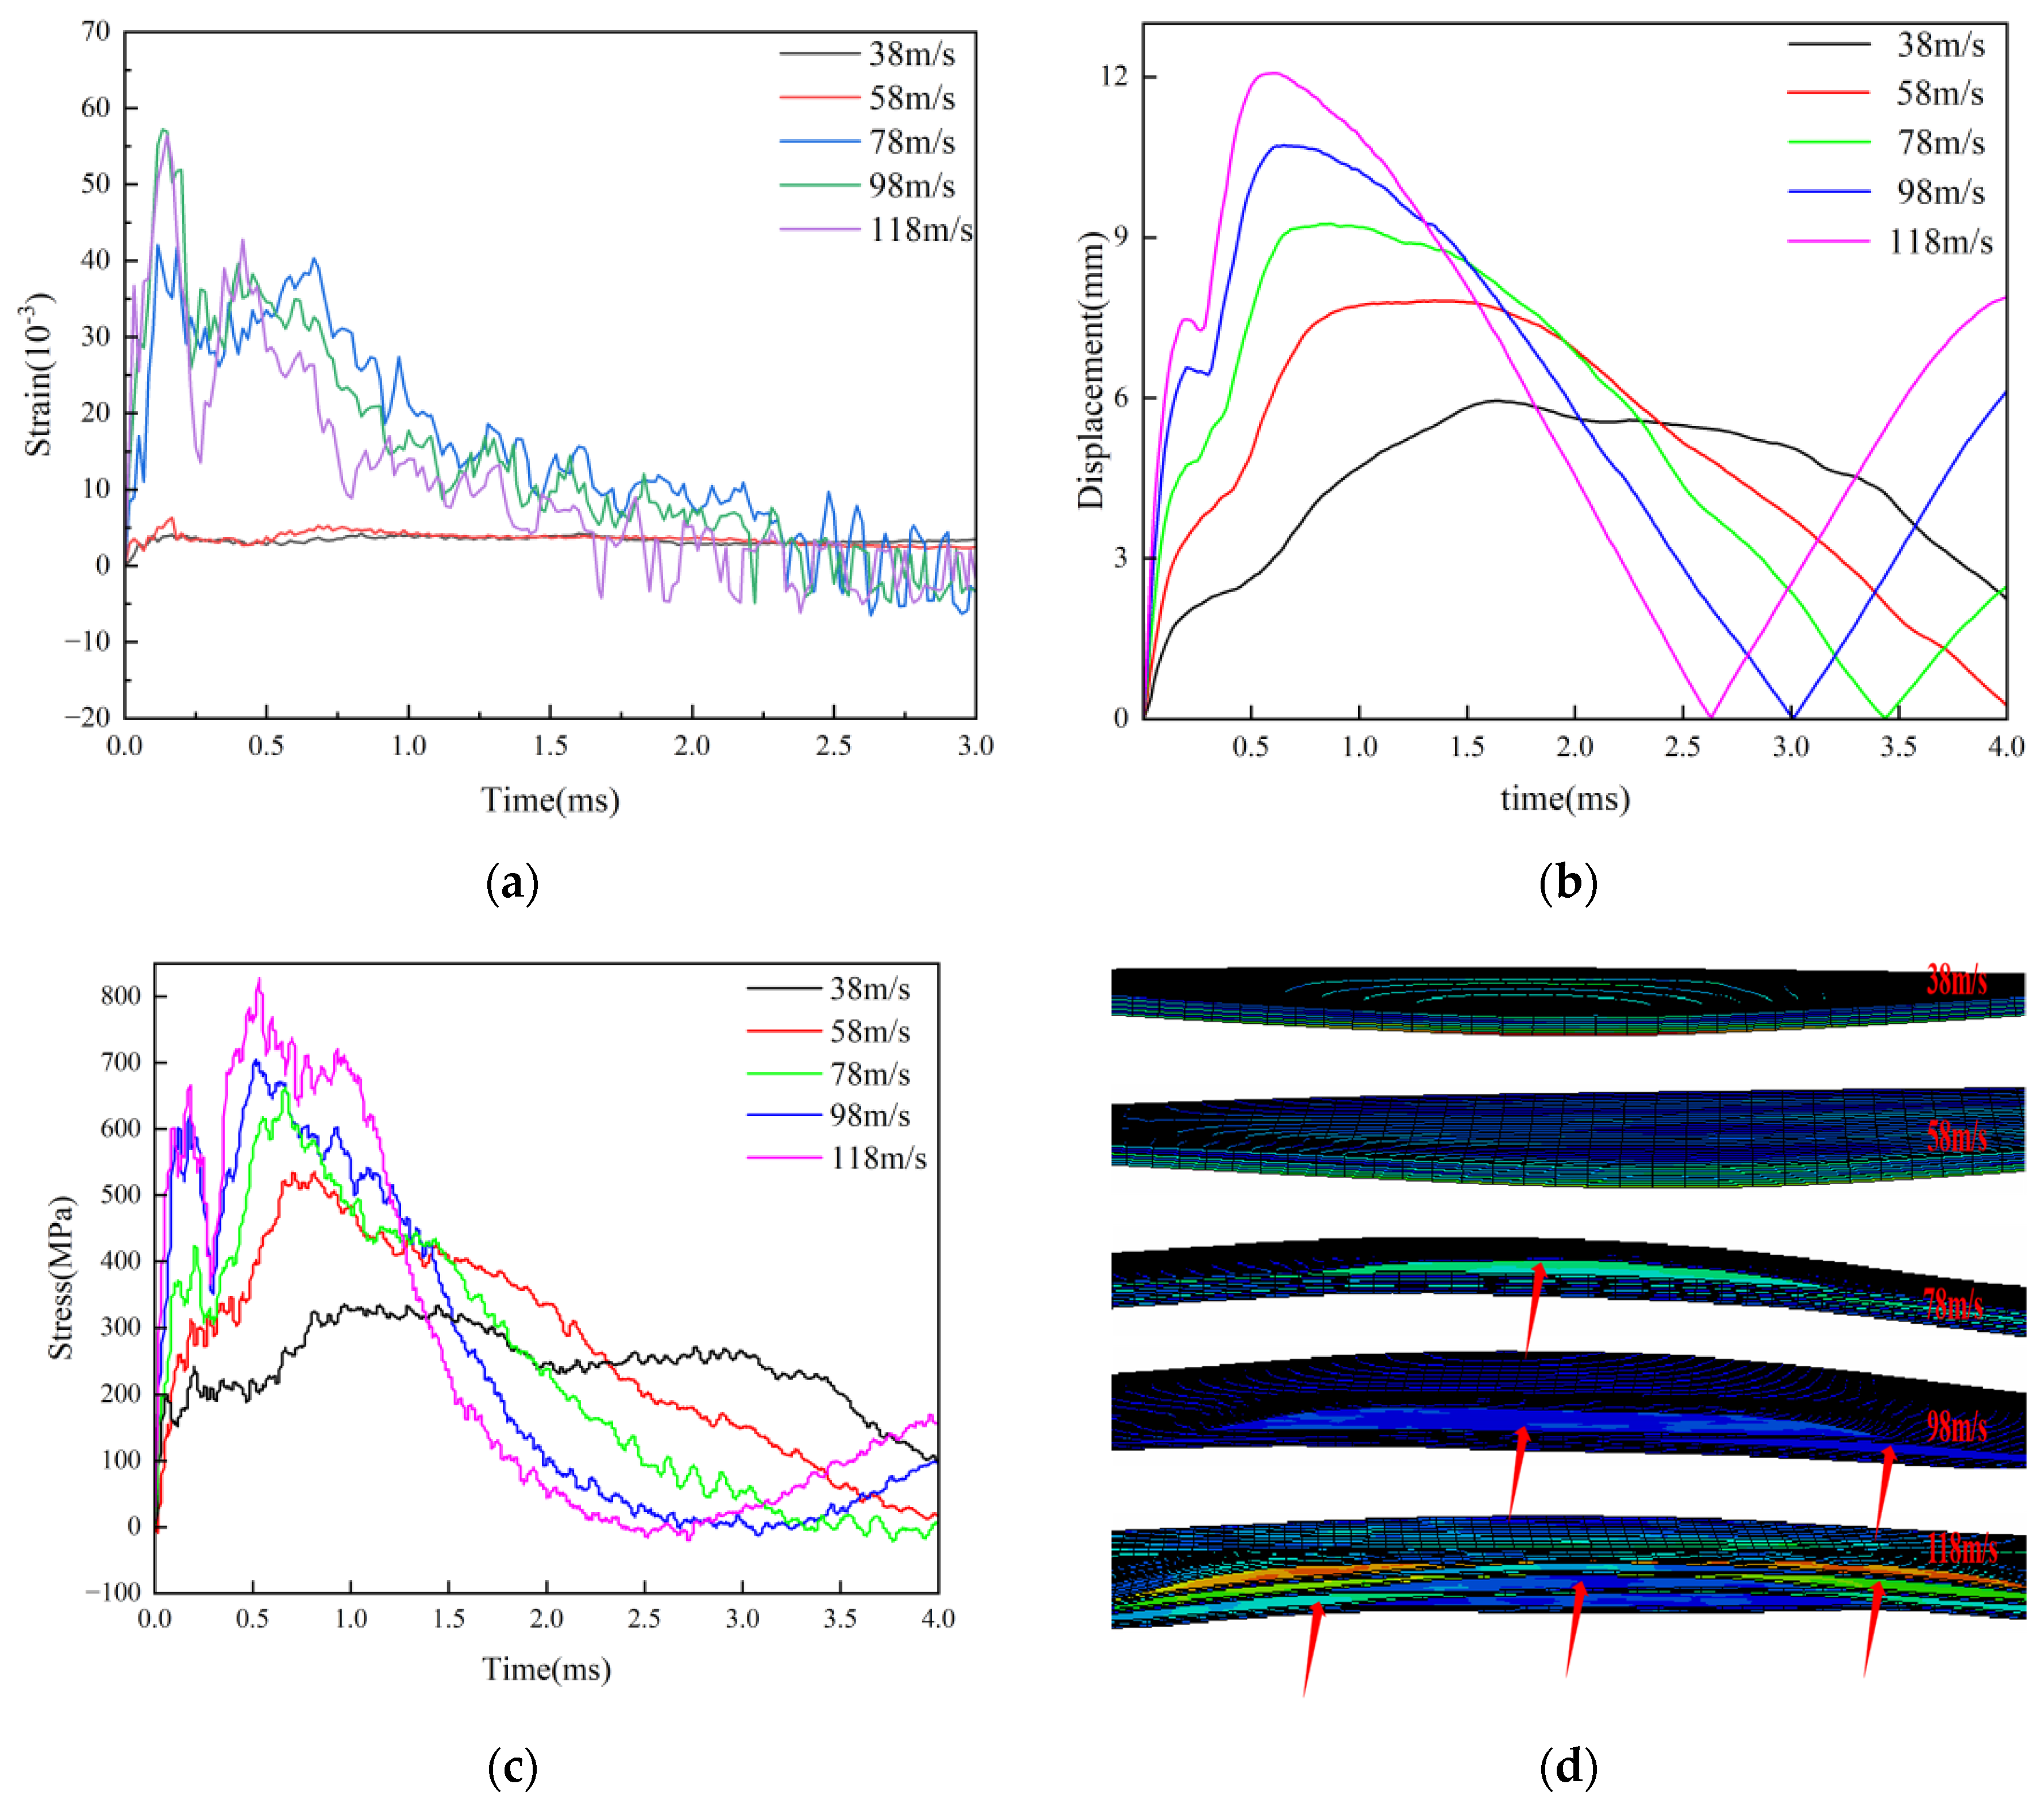
Figure 13.
Comparison of stress-strain displacements of four different bedding groups at 78m/s: (a) Strain and displacement; (b) Stress variation diagram.
Figure 13.
Comparison of stress-strain displacements of four different bedding groups at 78m/s: (a) Strain and displacement; (b) Stress variation diagram.
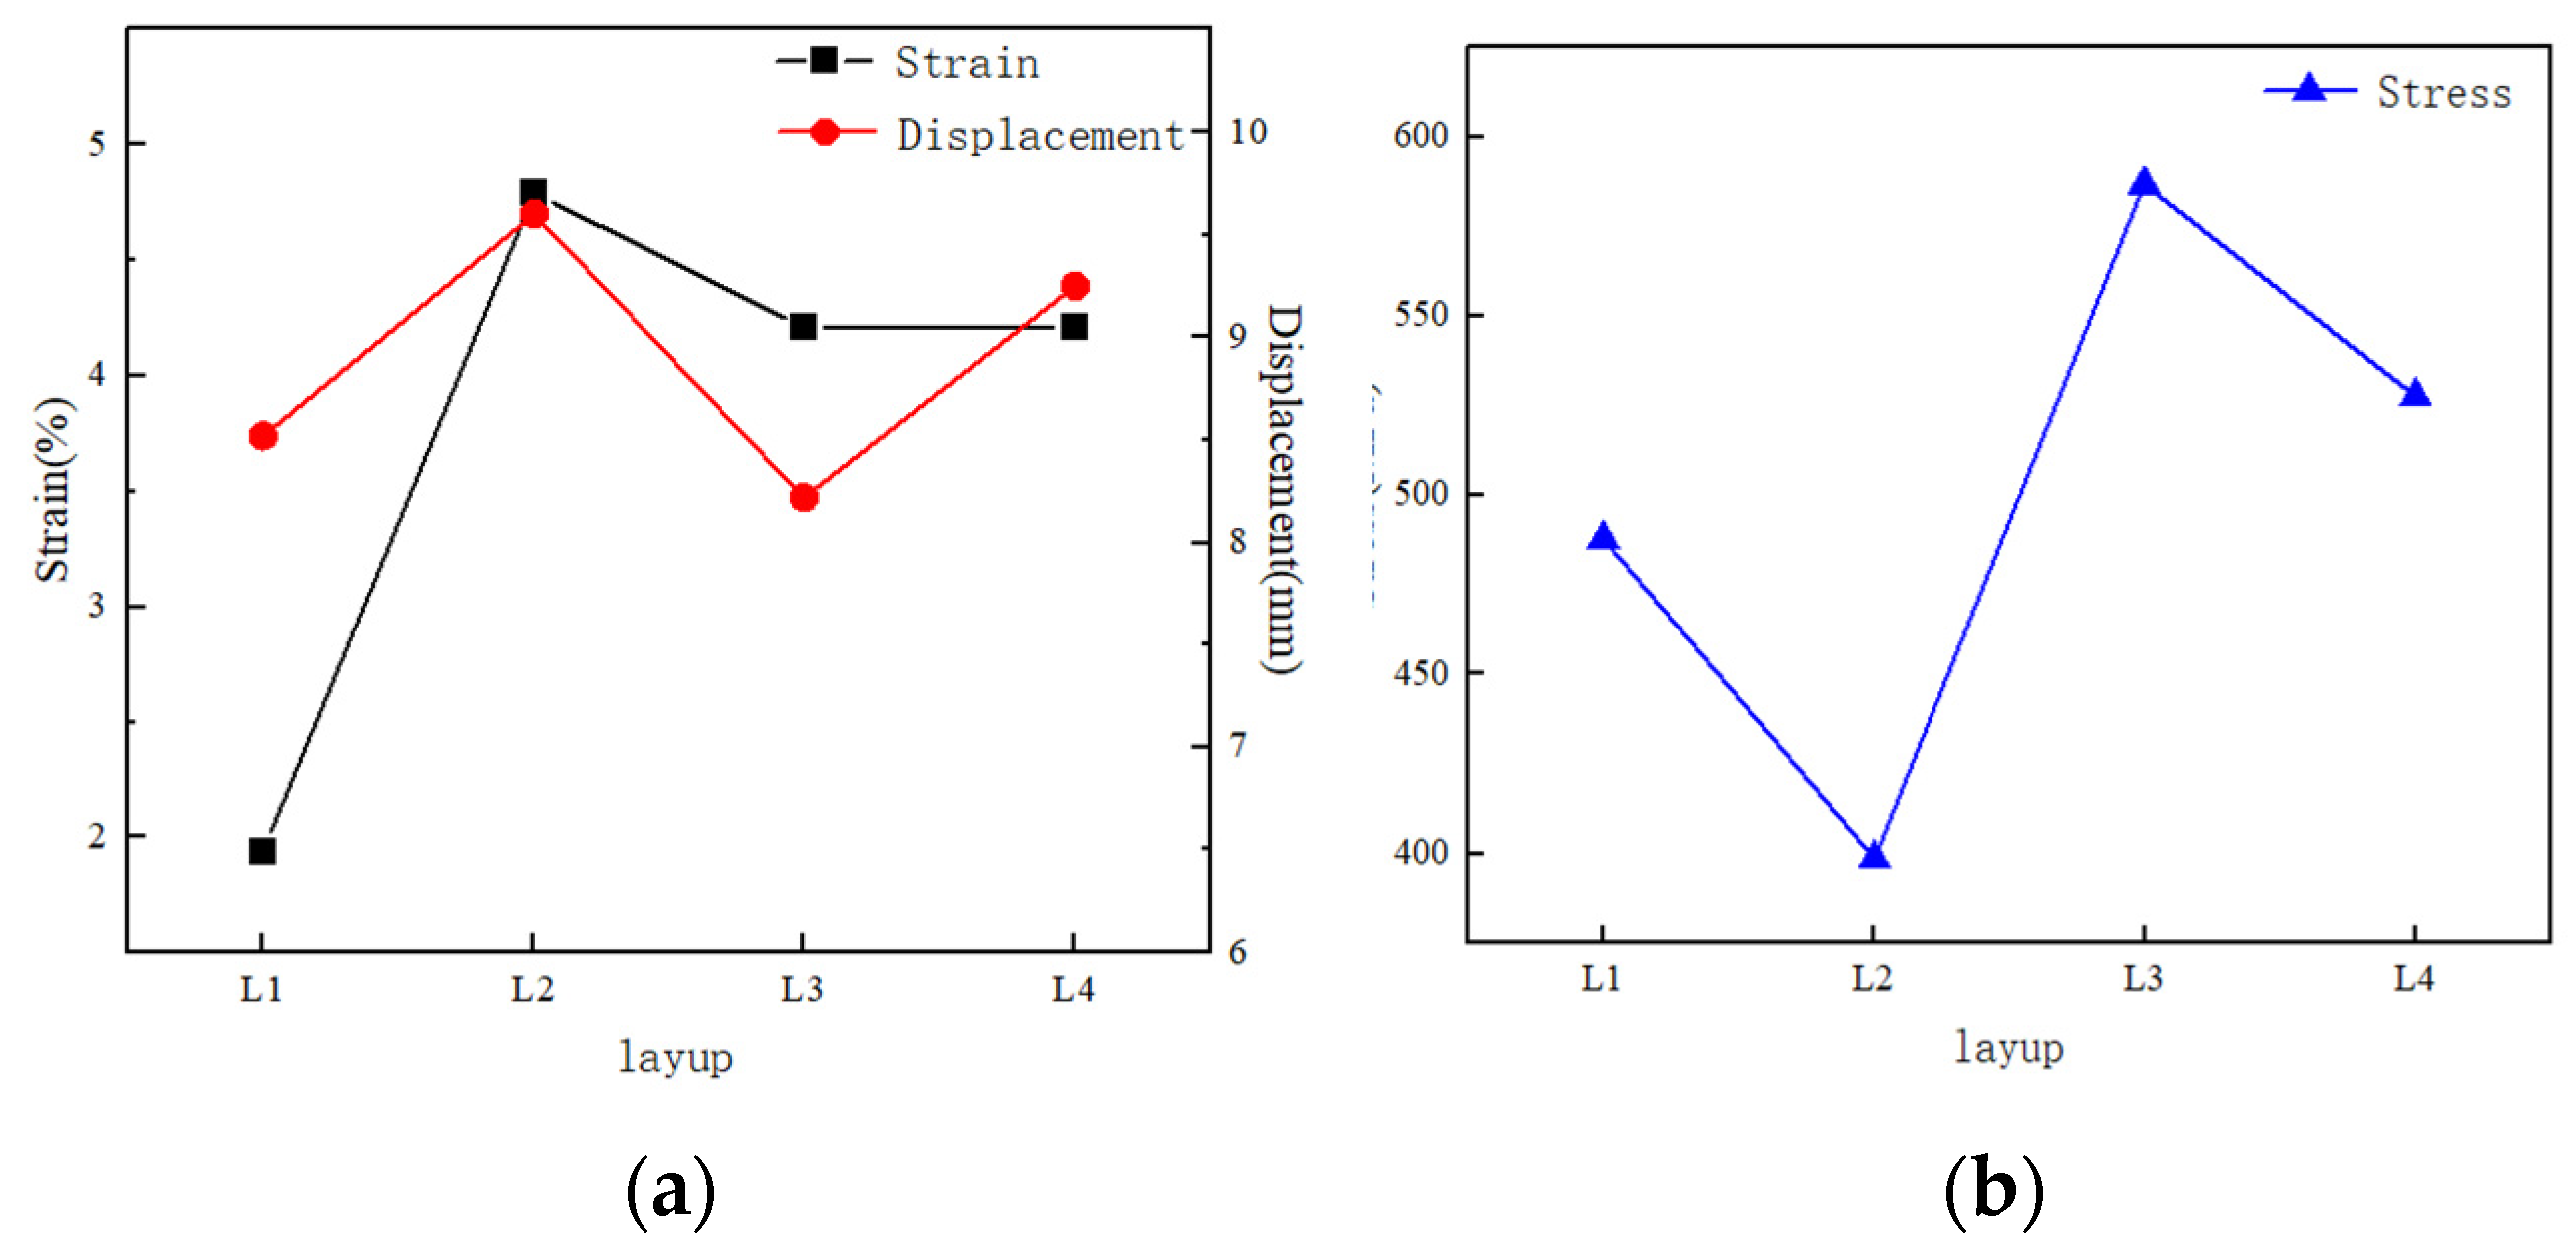
Figure 14.
Diagram of the Angle between birdshot and laminate.
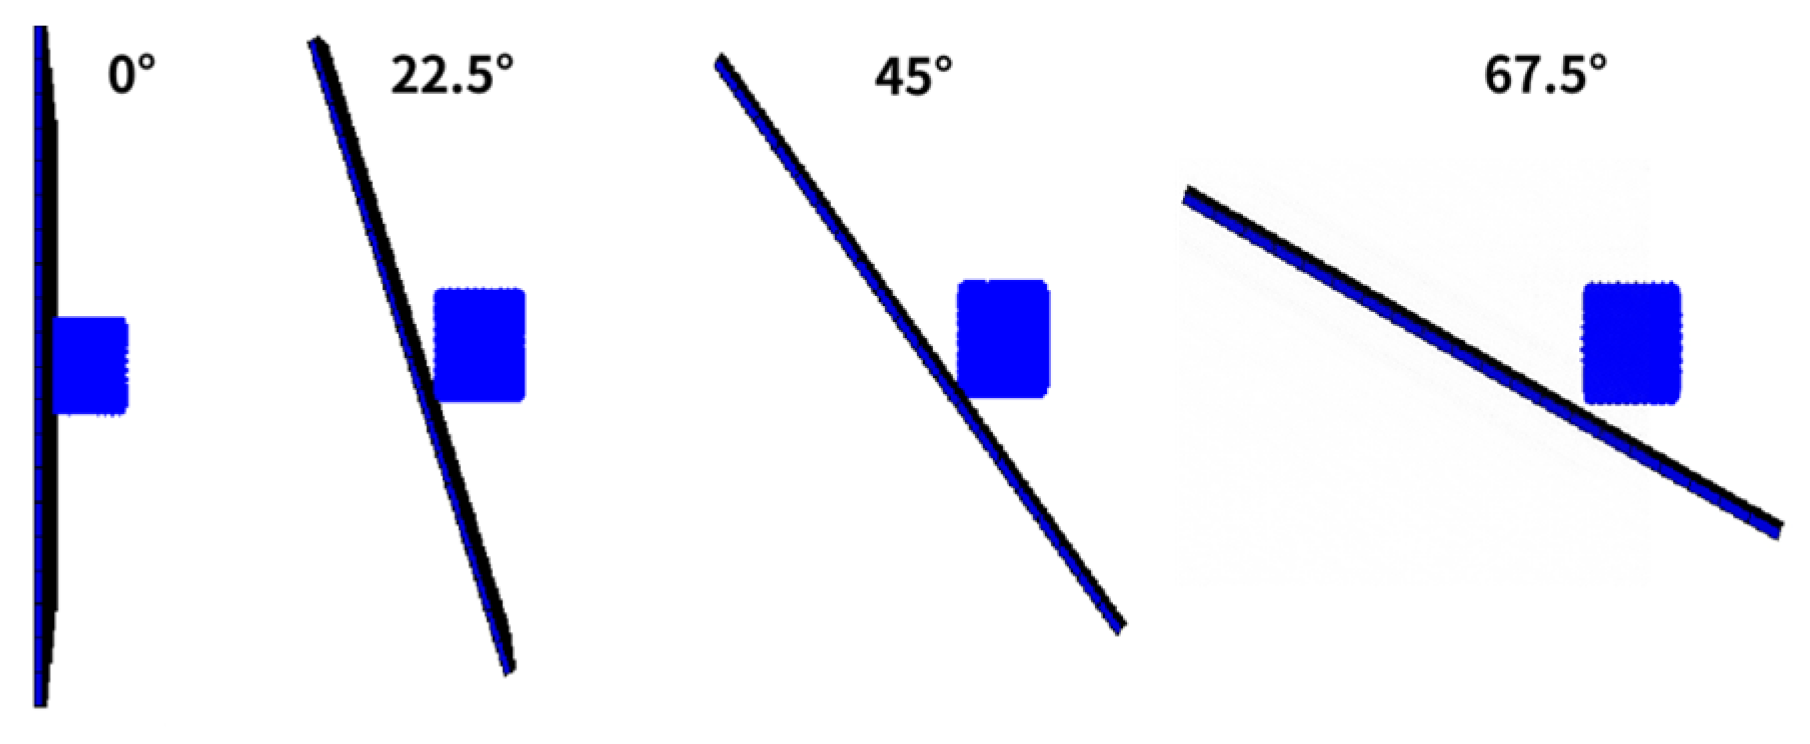
Figure 15.
Data of different impact angles and impact forms of L1 layering: (a) strain; (b) Displacement; (c) Stress; (d) The morphology of L1 laminates.
Figure 15.
Data of different impact angles and impact forms of L1 layering: (a) strain; (b) Displacement; (c) Stress; (d) The morphology of L1 laminates.
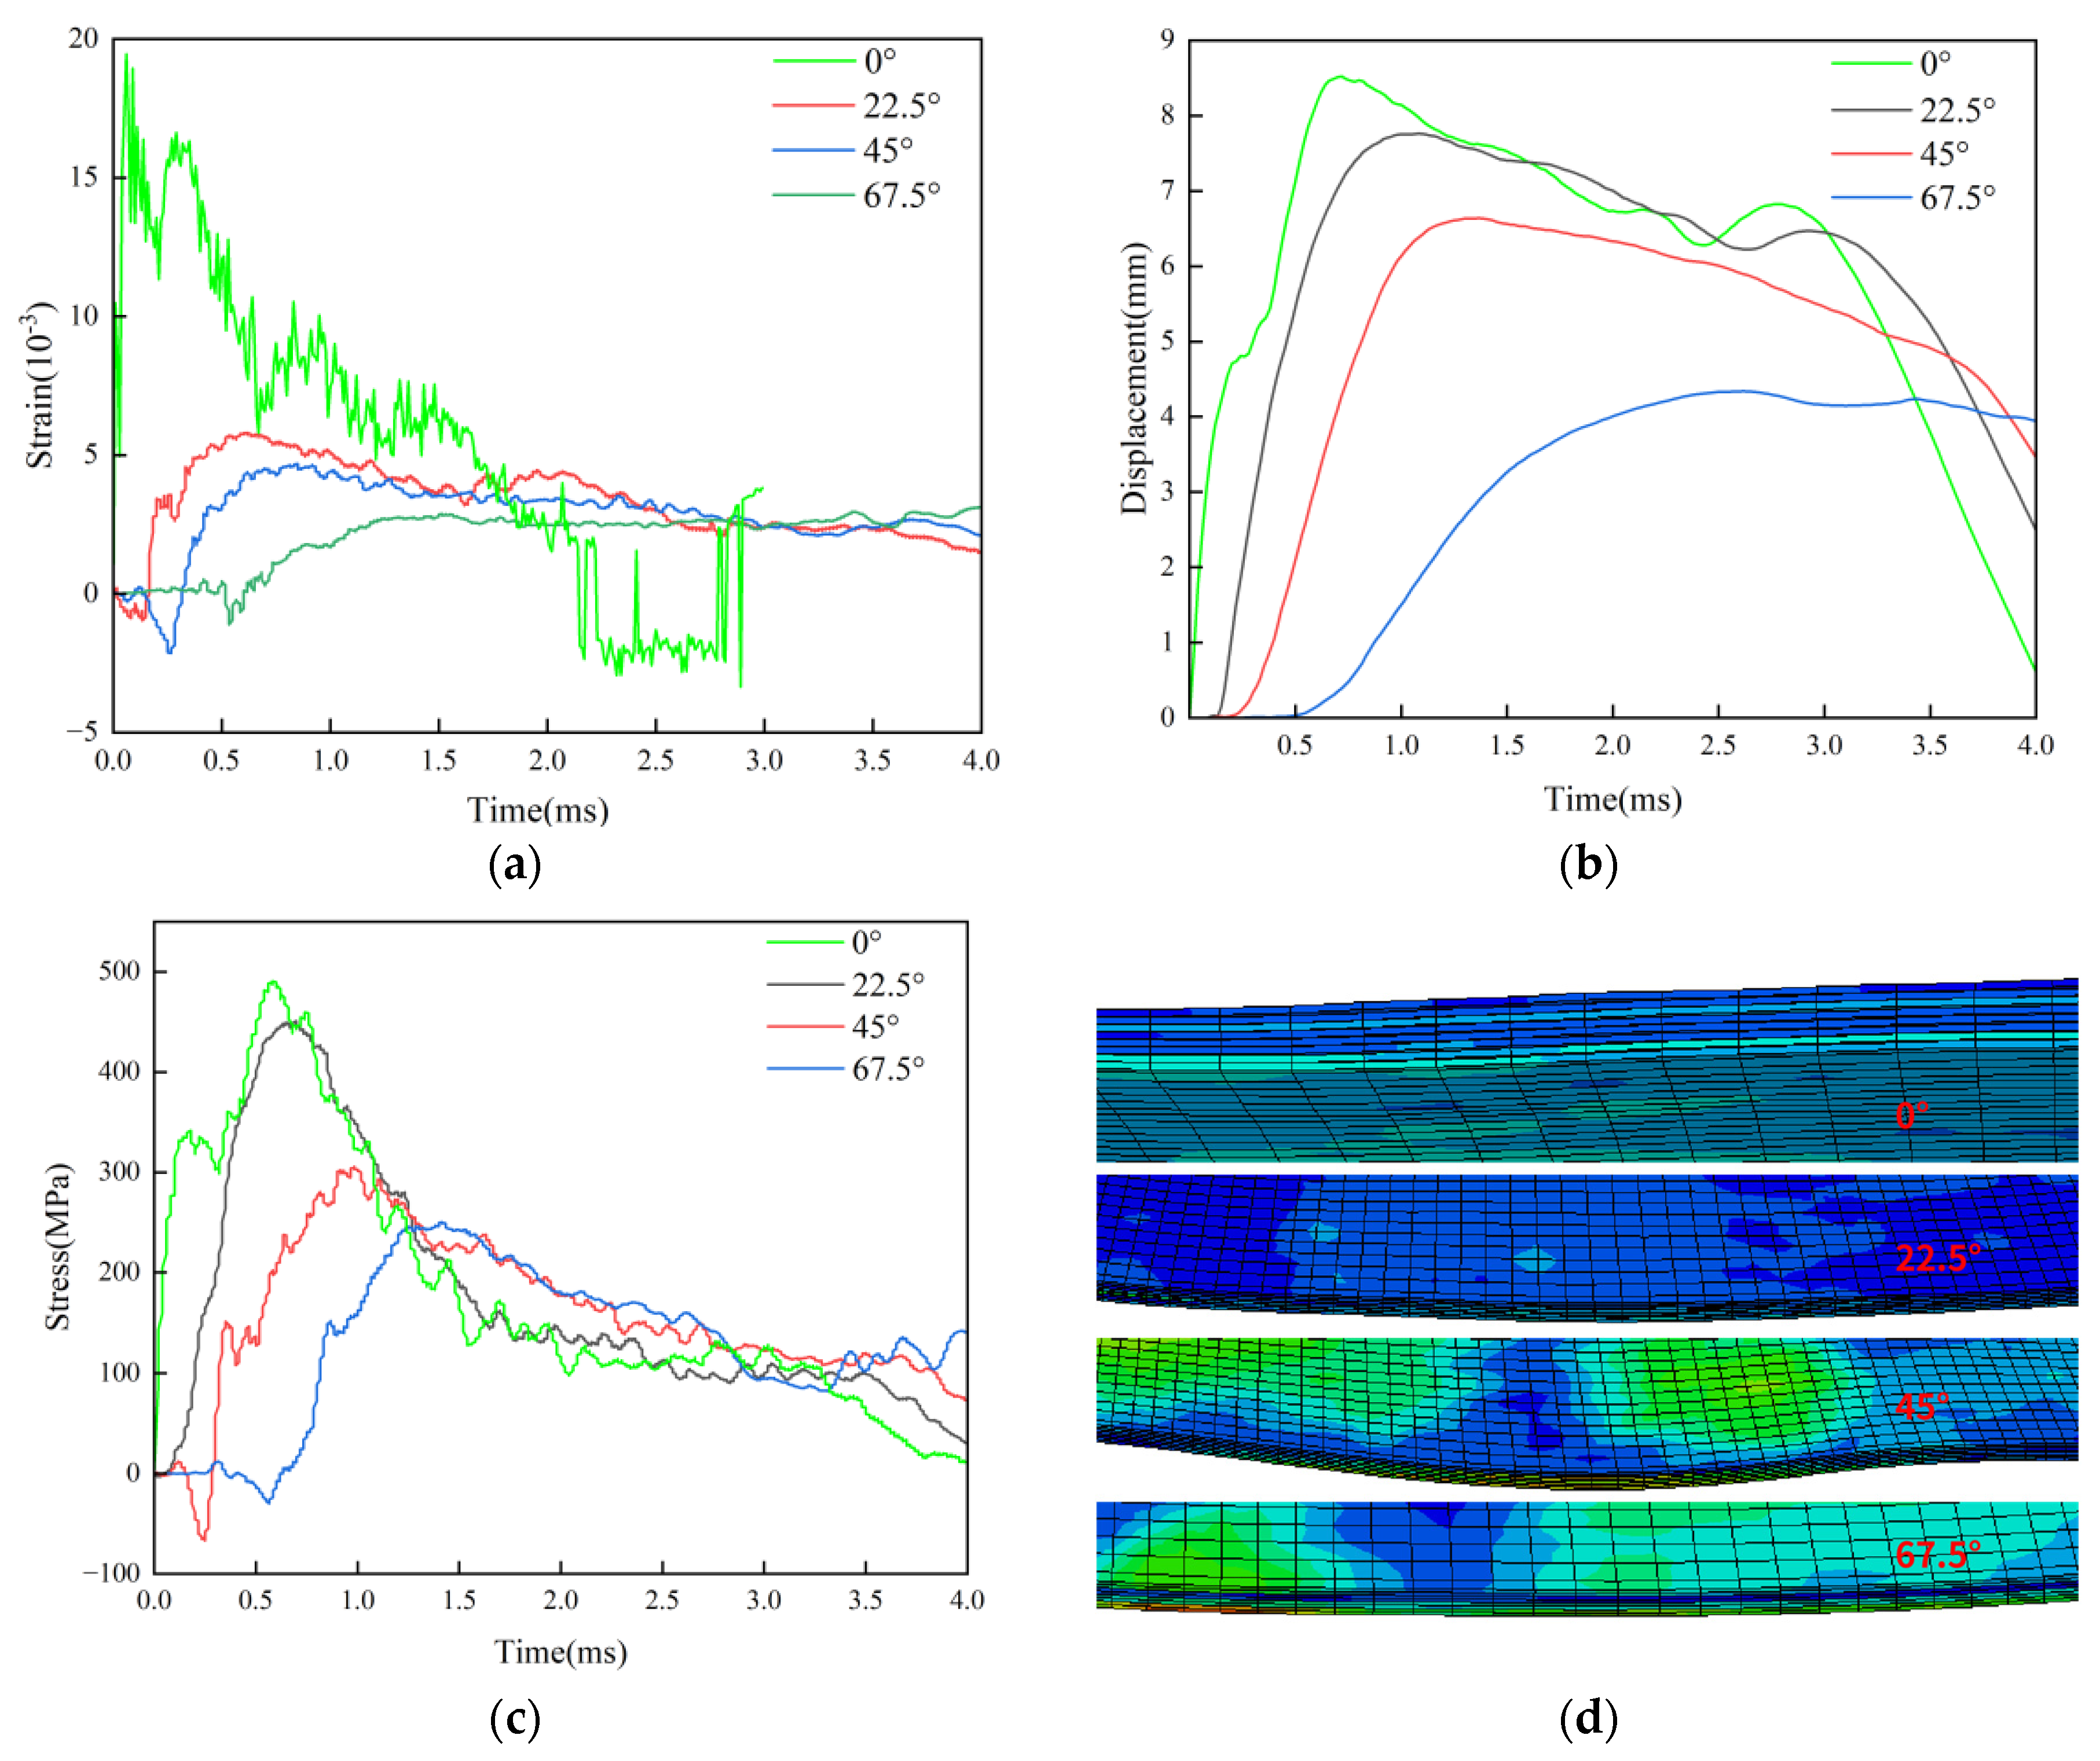
Figure 16.
Data and impact forms of L2 paving at different impact angles: (a) strain; (b) Displacement; (c) Stress; (d) The morphology of L2 laminates.
Figure 16.
Data and impact forms of L2 paving at different impact angles: (a) strain; (b) Displacement; (c) Stress; (d) The morphology of L2 laminates.
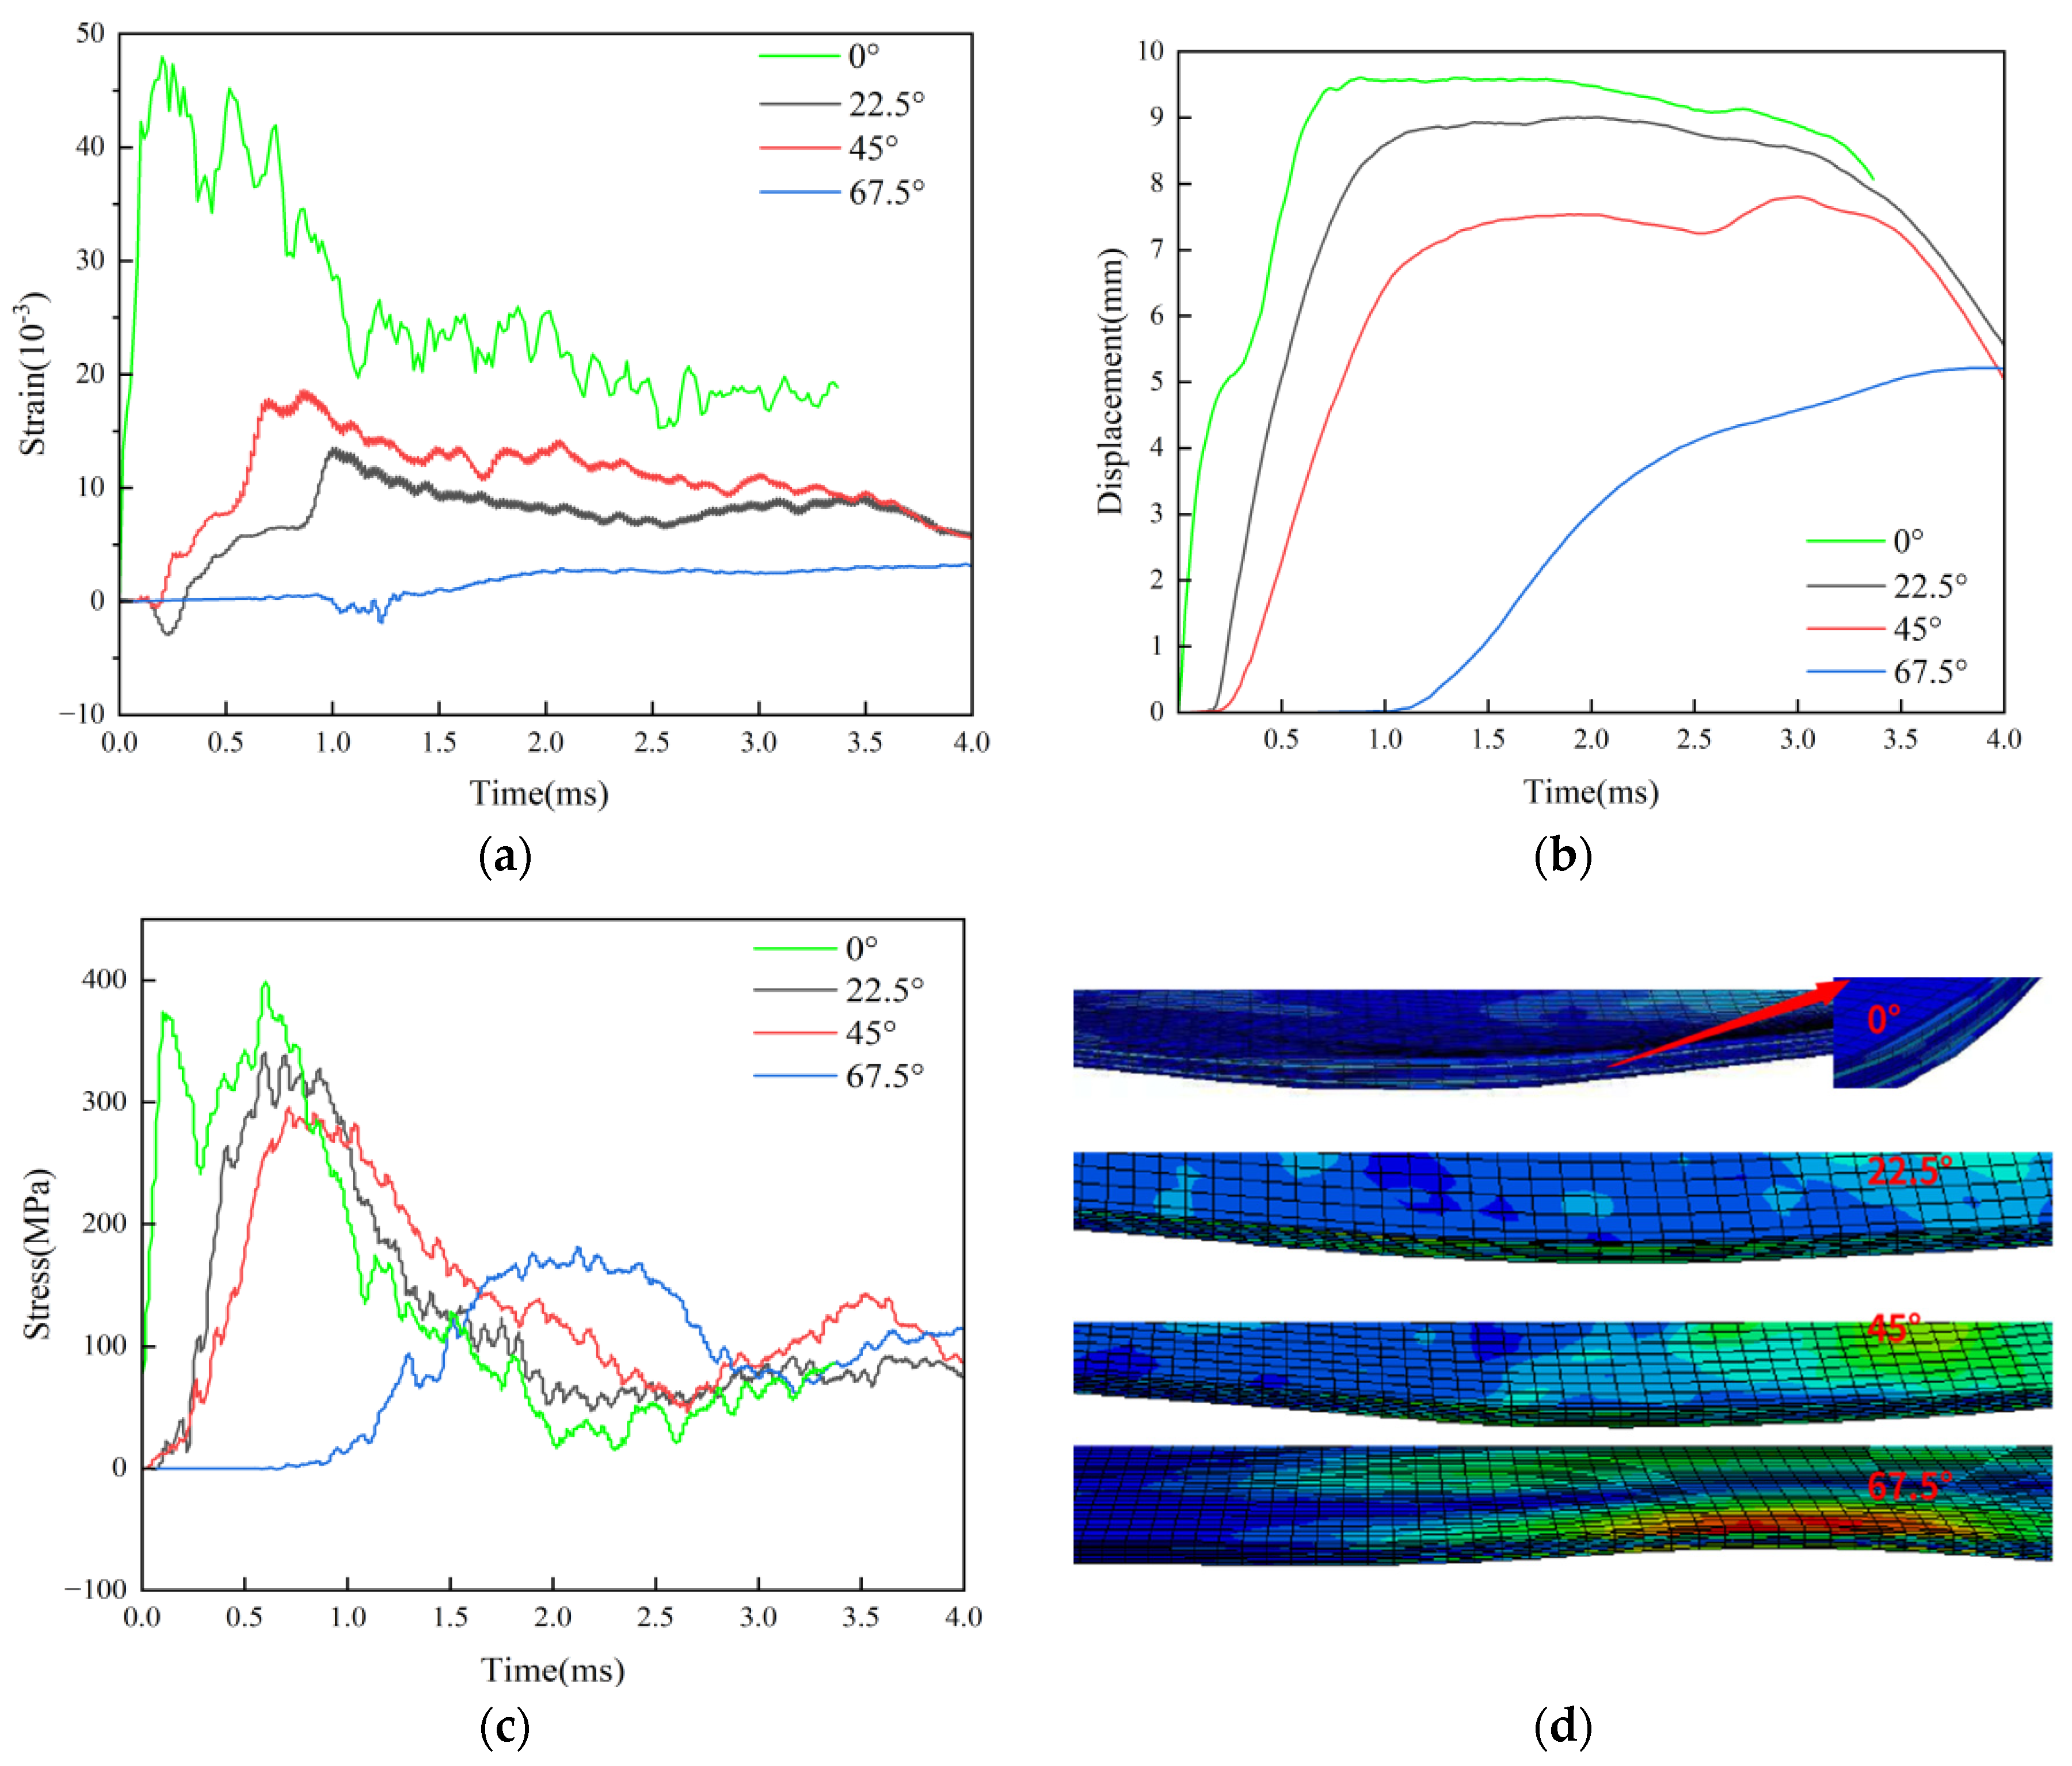
Figure 17.
Data and impact forms of L3 paving at different impact angles: (a) strain; (b) Displacement; (c) Stress; (d) The morphology of L3 laminates.
Figure 17.
Data and impact forms of L3 paving at different impact angles: (a) strain; (b) Displacement; (c) Stress; (d) The morphology of L3 laminates.
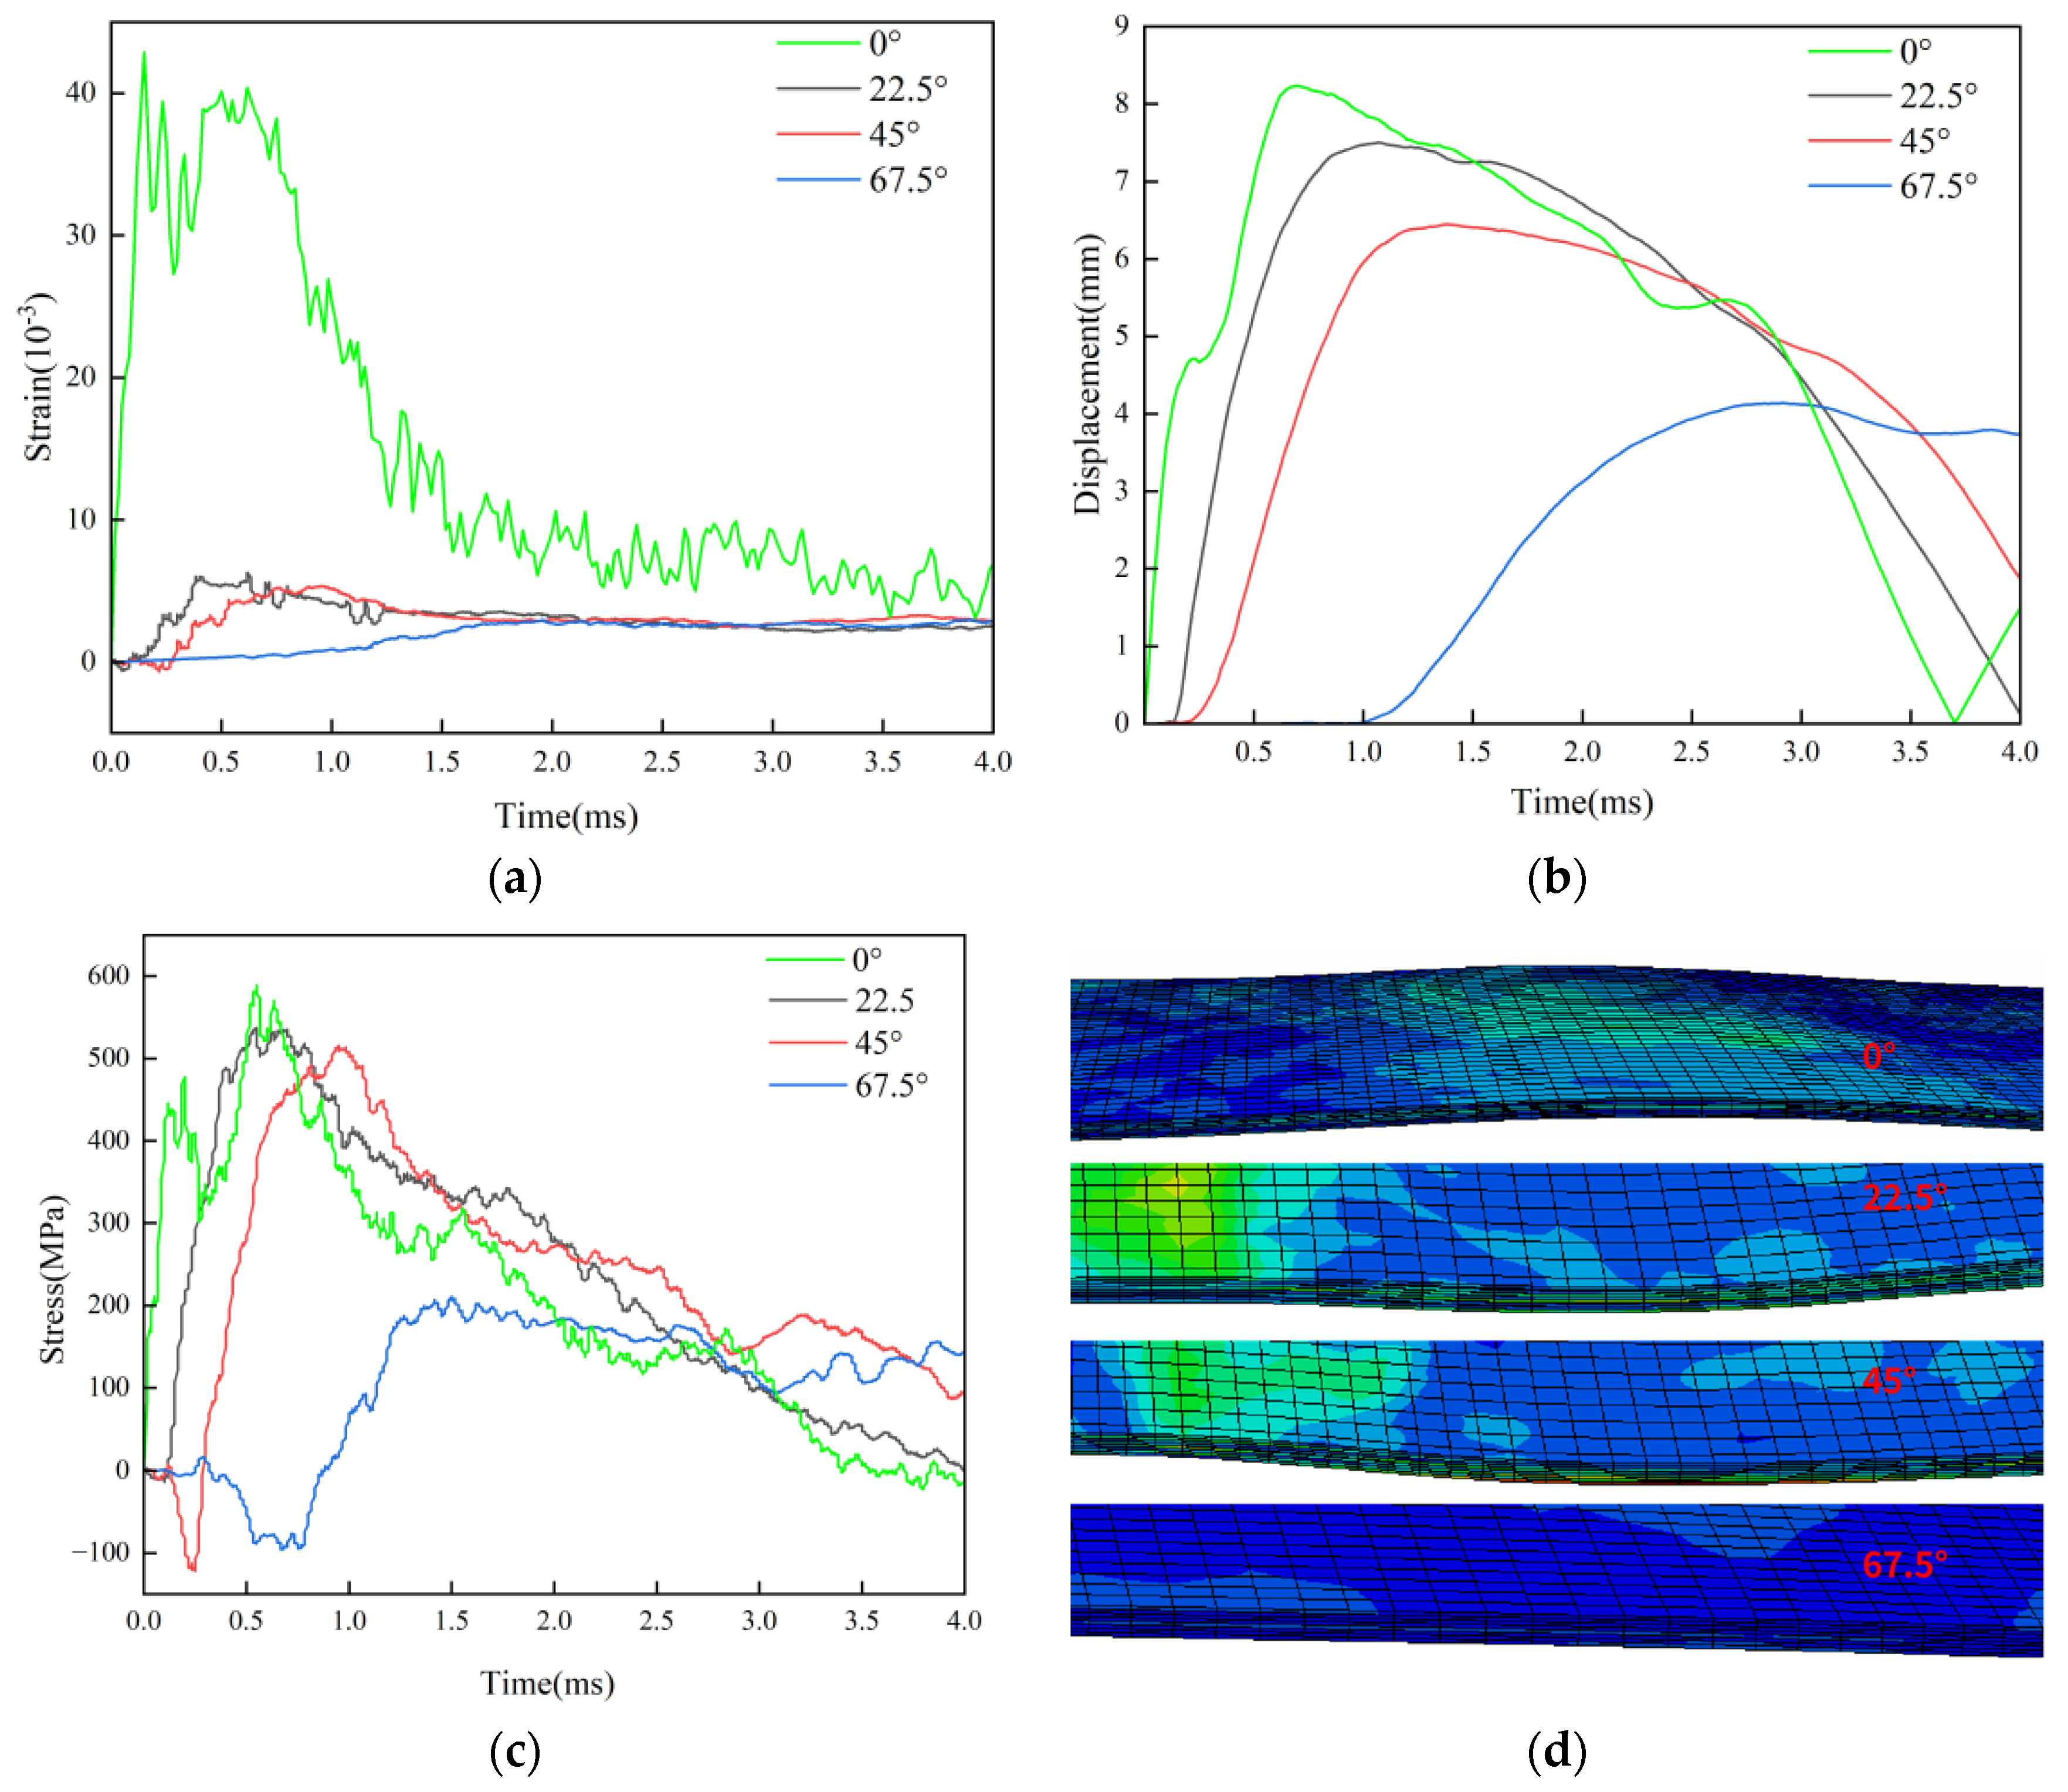
Figure 18.
Data and impact forms of L4 paving at different impact angles: (a) strain; (b) Displacement; (c) Stress; (d) The morphology of L4 laminates.
Figure 18.
Data and impact forms of L4 paving at different impact angles: (a) strain; (b) Displacement; (c) Stress; (d) The morphology of L4 laminates.
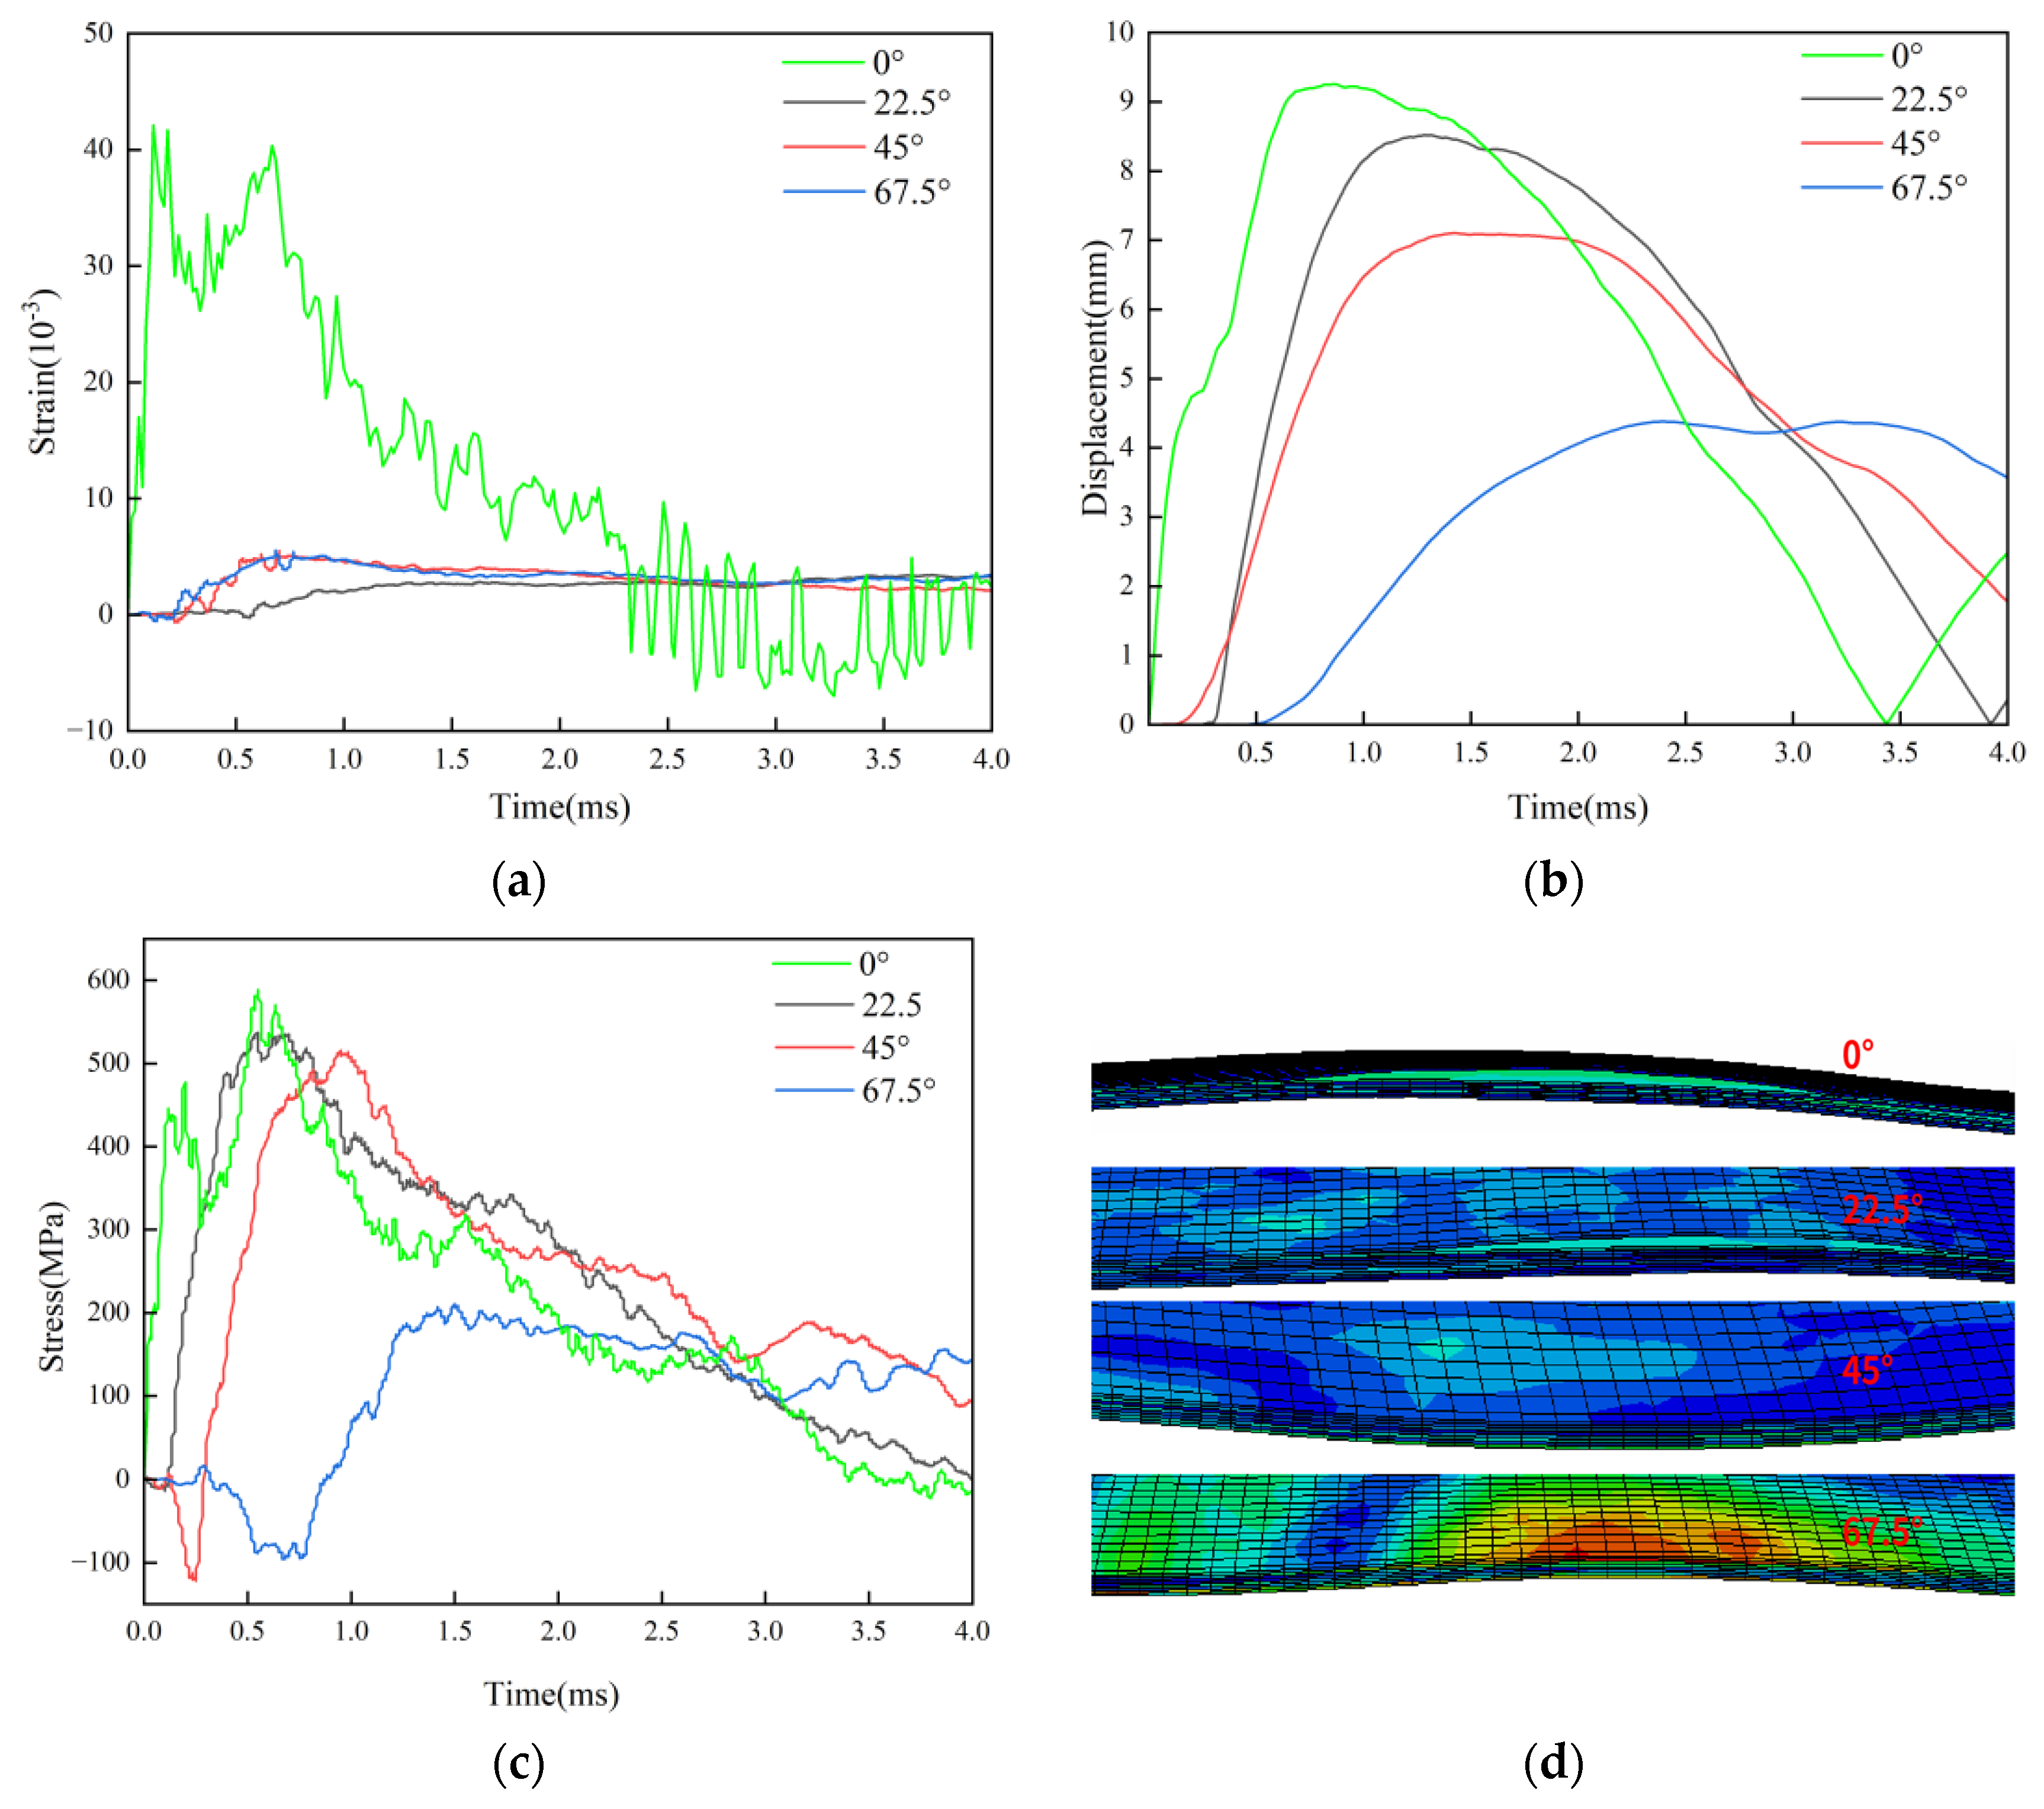
Figure 19.
Comparison of impact data from different angles of four groups of layering: (a) Strain; (b) Displacement; (c) Stress.
Figure 19.
Comparison of impact data from different angles of four groups of layering: (a) Strain; (b) Displacement; (c) Stress.
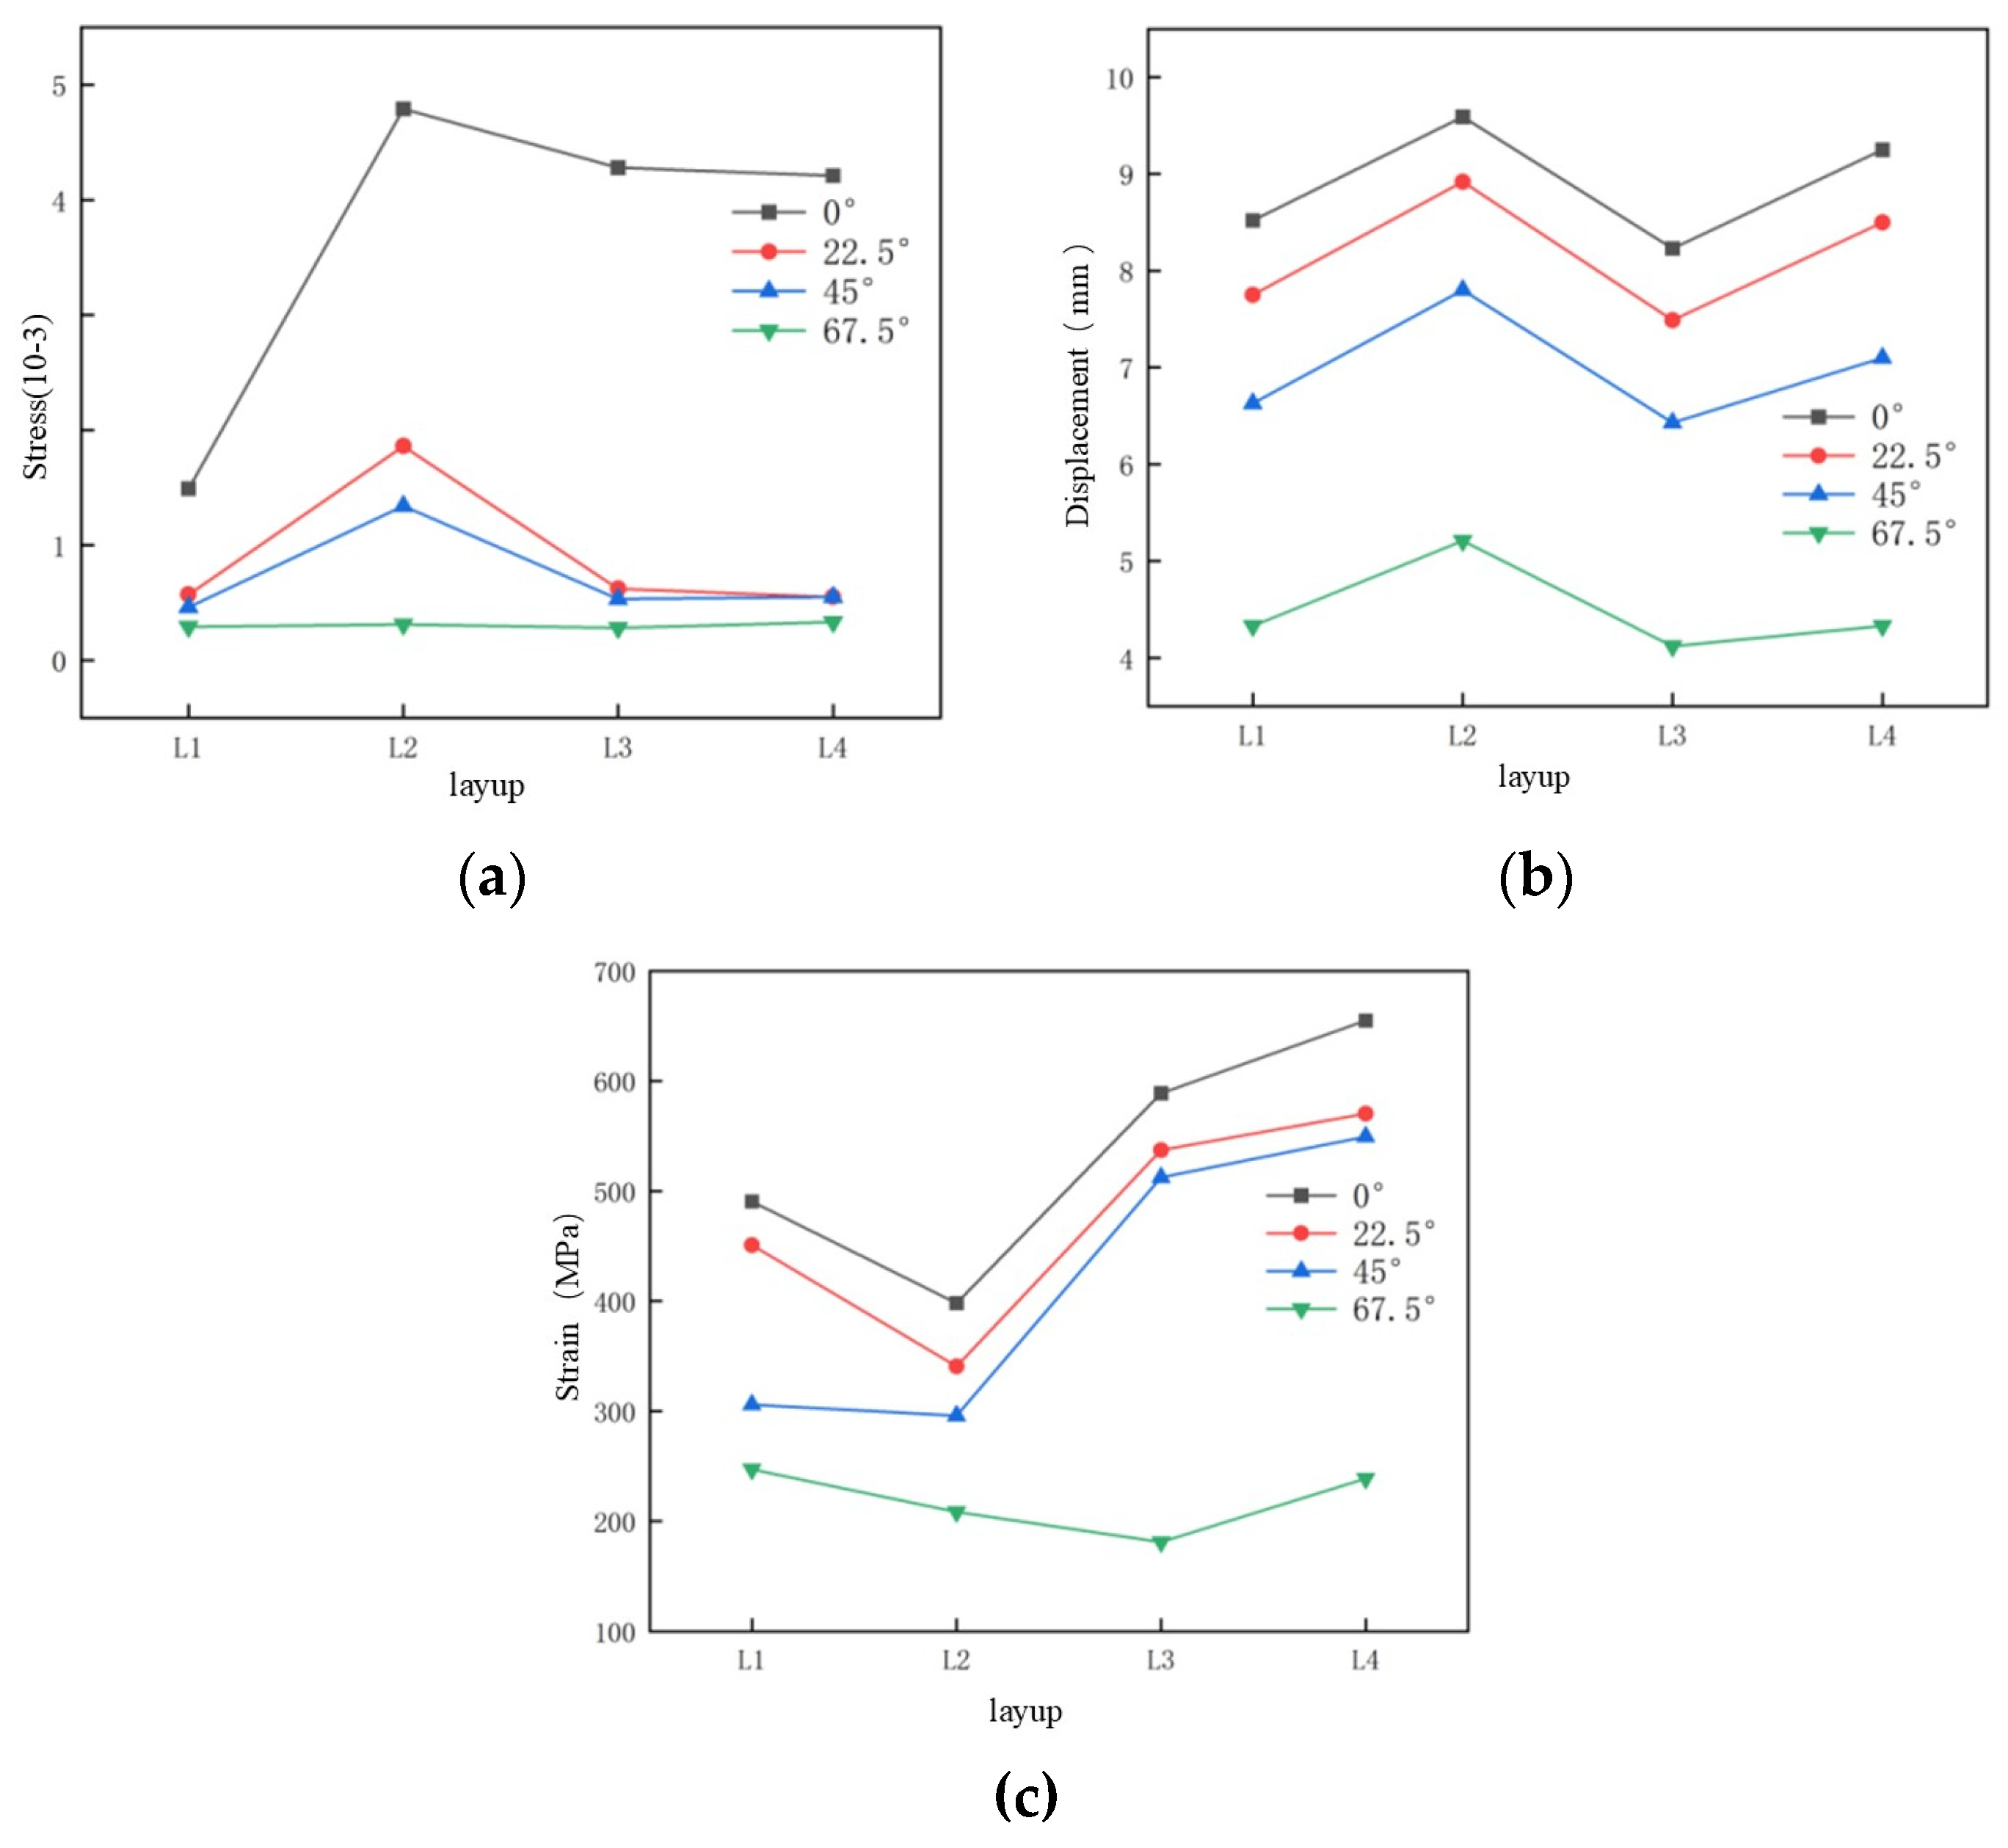

Table 1.
Modeling attribute parameters of carbon fiber laminates.
| Name | Parameter |
|---|---|
| Properties of carbon fiber composite material layers |
E1=130GPa, E2=E3=7.7GPa; G23=3.8GPa, G12=G13=4.8GPa; υ12=υ13=0.33, υ23=0.35; XT=2080MPa, XC=1250MPa; YT=60MPa, YC=140MPa; ===110MPa, =133N/mm, =0.6N/mm; =40N/mm, =2.1N/mm |
| Interlayer properties |
En=Es=Et=10GPa/mm N=S=T=30MPa =0.6N/mm; =2.1N/mm η=1.45 |
Disclaimer/Publisher’s Note: The statements, opinions and data contained in all publications are solely those of the individual author(s) and contributor(s) and not of MDPI and/or the editor(s). MDPI and/or the editor(s) disclaim responsibility for any injury to people or property resulting from any ideas, methods, instructions or products referred to in the content. |
© 2025 by the authors. Licensee MDPI, Basel, Switzerland. This article is an open access article distributed under the terms and conditions of the Creative Commons Attribution (CC BY) license (http://creativecommons.org/licenses/by/4.0/).
Copyright: This open access article is published under a Creative Commons CC BY 4.0 license, which permit the free download, distribution, and reuse, provided that the author and preprint are cited in any reuse.


