Submitted:
09 October 2025
Posted:
09 October 2025
You are already at the latest version
Abstract
Photoactivatable nitric oxide donors (photoNORMs) are promising agents for con-trolled NO release and real-time optical tracking in biomedical theranostics. Here, we report a comprehensive density functional theory (DFT) and time-dependent DFT (TDDFT) study on a series of hybrid ruthenium–gold nanocluster systems of the gen-eral formula [(L)Ru(NO)(SH)@Au₂₀], where L = salen, bpb, porphyrin, or phthalocya-nine. Structural and bonding analyses reveal that the Ru–NO bond maintains a formal {RuNO}⁶ configuration with pronounced Ru→π*(NO) backbonding, leading to partial reduction of the NO ligand and an elongated N–O bond. NBO, NEDA, and ETS–NOCV analyses confirm that Ru–NO bonding is dominated by charge-transfer and polariza-tion components, while Ru–S and Au–S linkages exhibit delocalized, donor–acceptor character coupling the molecular chromophore with the metallic cluster. TDDFT re-sults reproduce visible–NIR absorption features arising from mixed metal-to-ligand and cluster-mediated charge-transfer transitions. The calculated zero–zero transition and reorganization energies predict NIR-II emission (1.8–3.8 μm), a region of high bi-omedical transparency, making these systems ideal candidates for luminescence-based NO sensing and therapy. This study establishes fundamental design principles for next-generation Ru-based photoNORMs integrated with plasmonic gold nanoclusters, highlighting their potential as multifunctional, optically trackable theranostic platforms.
Keywords:
ruthenium nitrosyl complexes
; gold nanoclusters
; DFT
; TDDFT
; NBO
; ETS–NOCV
; NO photorelease
; NIR emission
; theranostics
1. Introduction
Nitric Oxide (NO), although known to be a very reactive [1] and toxic gas [2], plays a crucial role in many biological processes including cardiovascular regulation [3], antimicrobial treatments [4], and cancer therapy [5,6,7,8,9]. The controlled, photo-triggered release of NO has motivated the development of photo-activatable NO-releasing molecules, the so-called photoNORMs [10,11,12]. Early examples, such as Sodium Nitroprusside (SNP), suffered from limited photostability, degrading upon irradiation to yield toxic photoproducts [13]. Ruthenium complexes have emerged as more robust photoNORM candidates, offering enhanced stability and better biological tolerance [14,15,16,17]. Despite these advantages, conventional Ru–NO complexes face intrinsic limitations: low stability of the Ru–NO bond under physiological conditions, modest quantum yields, and the requirement for high-energy UV light to induce NO release [13]. To address these limitations, various strategies have been explored, including the use of dye-sensitized ligands to extend absorption into the visible range [18,19,20,21], and dinuclear Ru(II) systems with pyrazine bridging ligands [22,23]. These approaches enhance photorelease efficiency, yet challenges remain in fully optimizing quantum yields, spectral overlap, and biocompatibility. An emerging and largely unexplored strategy involves hybridizing Ru complexes with nanoparticles (TMC/NP materials), in which a transition metal complex is anchored to a nanoparticle via a suitable ligand [24]. This design can facilitate electronic interactions between the MLCT bands of the complex and the localized surface plasmon resonance (LSPR) of the nanoparticle, leading to phenomena such as enhanced two-photon absorption [25], increased singlet oxygen generation [26], and elevated fluorescence quantum yields [27]. Such hybrid systems have shown promise in multi-channel luminescence imaging [28] and photodynamic therapy, where nanoparticles act as carriers for photosensitizing TMCs [29]. Their water solubility, tunable coordination environment, and low toxicity make them attractive candidates for biomedical applications, including as photoNORMs [25,30]. A critical limitation in NO-based therapies remains the lack of real-time monitoring of NO release and distribution. Here, the photophysical properties of TMC/NP hybrids present a unique opportunity for luminescence-based imaging, offering insight into molecular location, activation, and functionality during therapy. Atomically defined gold nanoclusters provide a particularly suitable platform for these hybrids [31]. Au20 clusters are computationally tractable and chemically meaningful: they serve as prototypical models of extended Au surfaces [32,33] and have been experimentally isolated and functionalized [34,35]. Their stability, well-defined icosahedral geometry, and amenability to thiol-based anchoring allow the design of discrete, hybrid Ru–Au20 complexes that are both theoretically insightful and potentially synthesizable. Guided by these considerations, we investigated a series of Ru–NO/Au20 hybrid complexes of the general formula [(L)Ru(NO)(SH)@Au20], where L = N,N′-bis(salicylidene)ethylenediamine (Salen), 1,2-bis(pyridine-2-carboxamido)benzenate (bpb), Porphyrin (Porph), or Phthalocyanine (Pc). These complexes exemplify the emerging class of hybrid transition-metal complex/nanoparticle (TM/NP) materials [24], where molecular photoactive units are anchored directly to gold clusters via thiolate bridges. Our objectives were to (i) study the electronic structure of these hybrids using DFT/TDDFT calculations, and (ii) analyze their luminescence properties to assess their potential for real-time imaging. By addressing these aspects, we aim to provide DFT-guided design principles for next-generation luminescence-based theranostic photoNORMs.
2. Results and Discussion
2.1. Structural Properties
To rationalize the photophysical and sensing behavior of the [(L)Ru(NO)(SH)@Au20] hybrid complexes, we first examine their structural, bonding and electronic properties. In Figure 1 are depicted the optimized geometries of the Ru(II) under study, along with selected structural parameters. Based on the oxidation state of Ru(II) and the formal NO⁺ assignment, the complexes are best described as {RuNO}⁶ species according to the Enemark–Feltham notation.
As shown in Figure 1, the nearly linear Ru–N–O bond angles (169 – 178°) observed in these Ru(II) complexes support a formal NO⁺ assignment, consistent with a {RuNO}⁶ configuration as defined by the Enemark–Feltham notation. This is further corroborated by the relatively short N-O bond lengths, falling in the range 1.137 – 1.146 Å, usually observed for cationic, NO+ coordinated to low-spin d6 Ru(II) complexes. Figure S1 in the Supplementary Information (SI) presents the simulated IR spectra of the Ru(II) nitrosyl - complexes studied. The most intense absorption band, observed in the 1970 – 2020 cm⁻¹ region, is attributed to the symmetric stretching vibration of the N–O bond νₛ(N–O) of the nitrosyl ligand. This feature is characteristic of a linearly coordinated NO⁺ moiety, indicative of strong N–O multiple bonding. Notice that, there is an excellent correlation between the Re(N-O) bond length and the νₛ(N–O) for the four Ru(II) complexes under study as expected.
Thus, the Re(N-O) bond lengths follow the order [(Salen)Ru(NO)(SH)] < [(bpb)Ru(NO)(SH)] < [(Porph)Ru(NO)(SH)] < [(Pc)Ru(NO)(SH)] while the νₛ(N–O) stretching frequencies follow the opposite order. Nevertheless, the effect of the equatorial ligand on the Re(N-O) and νₛ(N–O) is relatively minor. The same is also observed for the νₛ(N–O) frequency intensity where again, the effect of the equatorial ligand is only minor. Nevertheless, in all cases the N-O bond length in the Ru(II) complexes under study is found to be elongated as compared to that found for the free NO+ cation at the same level of theory (1.07 Å). Also, the νₛ(N–O) frequency calculated for the free NO+ cation is found to be much higher (2555 cm-1) than those found for the Ru(II) – Au20 hybrid complexes, consistent with the elongated N-O bond length of the axial NO ligand observed for the latter.
2.2. Electronic and Bonding Properties
The electronic and bonding properties of the [(L)Ru(NO)(SH)@Au20] Ru(II) hybrid octahedral complexes were further scrutinized upon employing a multitude of methods such as Natural Bond Orbital (NBO) analysis, Natural Energy Decomposition Analysis (NEDA) and Extended Transition State - Natural Orbitals for Chemical Valence (ETS-NOCV).
2.2.1. NBO Analysis
In Figure 2 are depicted the 3D surfaces of the NBOs, relevant to the bonding properties in the representative [(Salen)Ru(NO)(SH)] complex. Similar NBOs are observed also for the rest of the Ru hybrid complexes under study. Also, in Table 1 are given selected, NBO derived, parameters describing the electronic properties of the Ru hybrids under study.
In terms of NBO analysis, the Ru–NO bond in the [(Salen)Ru(NO)(SH)] complex is described by two σ bonding (BD) NBOs namely the σ(Ru–NO) and the σ(HS-Ru–NO) and one π BD NBO, π(Ru–NO). The σ(Ru–NO) orbital arises from a linear combination of an spd-type hybrid orbital (hRu) on Ru and an sp-type hybrid orbital (hN) on the N atom of the axial nitrosyl ligand. However, the Ru-NO bond exhibits a relatively weak covalent component as reflected by the small WBI value being less than 0.5 (Table 1). Obviously, the nature of the Ru-NO bond is complex, arising also from electrostatic or even donor – acceptor dative interactions. The existence of the former are clearly verified by the opposite natural charges calculated for the Ru metal center, QRu and the N donor atom, QN of the NO ligand being 0.695 ∣e∣ and -0.464 ∣e∣ respectively (Table 1). The dative nature of the Ru-NO bond is also verified based upon the NEDA and ETS-NOCV analysis method (vide infra). Notice also that, the σ(HS-Ru–NO) BD NBO is delocalized over the entire HS-Ru-NO framework, probably due to the presence of the Au20 NP. On the other hand, the π(Ru–NO) DB NBO (Figure 2) is a linear combination of d-type hRu with p-type hN.
Remarkably, no explicit two-center Ru–S or Au–S bonding NBOs were detected, consistent with a delocalized nature of these linkages. In the σ(Ru–SH) and σ(Au–SH) BD NBOs (Figure 2) the sulfur lone pairs act as donors toward low-lying metal-centered acceptor orbitals on Ru and the Au₂₀ cluster, producing strong LP(S) → RY*(Ru/Au) delocalization interactions with stabilization energies of several tens of kilocalories per mole. This pattern indicates that the Ru–S and Au–S connections are dative and multicenter rather than classical shared-electron bonds. The electron density associated with the Au₂₀ cluster is further delocalized over multiple Au atoms, forming a quasi-metallic manifold that electronically couples the Ru–NO chromophore to the gold surface. It should be notice, however, that the Ru–S bond is expected to have a significant electrostatic component, analogous to that observed for the Ru-NO bond since the natural charge, QS on the S donor atom amounts to -0.474. In contrast, the electrostatic component of the S-Au bond, connecting the Au20 NP to the Ru metal center, should be marginal due to the very small positive natural charge on Au atom, QAu directly connected to S atom amounting to only 0.003 (Table 1).
Finally, inspection of Table 1 reveals that the N–O bond in the coordinated axial nitrosyl ligand is significantly weakened relative to free NO⁺: the WBI(N-O) decreases from 2.792 (free NO⁺, same level of theory) to <2 in the complexes, consistent with substantial Ru→π*(NO) backbonding. This is accompanied by increased π*(NO) occupancy and LP(Ru)→π*(NO) donor–acceptor stabilization, in accordance with the elongation of the N–O distance and the red-shift of the computed νs(N-O) observed for these Ru hybrid complexes (vide supra), all indicative of partial reduction (non-innocent behavior) of the NO ligand.
In general, the nature of the equatorial ligand L does not affect siginificantly the electronic and bonding properties as this could be deduced from the results of the NBO analysis tabulated in Table 1 as well as from the BD NBOs observed for the rest of the [(L)Ru(NO)(SH)@Au20] complexes with L = bpb, porph or pc, being similar to that found for the [(salen)Ru(NO)(SH)@Au20] complexand depicted in Figure 2.
2.2.2. NEDA
To further probe the bonding in the Ru(II) [(L)Ru(NO)(SH)@Au20] hybrid complexes, we performed Natural Energy Decomposition Analysis (NEDA) on the Ru–NO, Ru–SH, and SH–Au interactions. Table 2 summarizes the NEDA energy components—electrostatics (ES), polarization (POL), charge transfer (CT), and exchange-correlation (XC)—along with the total interaction energy (ΔE) for [(L)Ru(NO)(SH)@Au20] hybrid complexes derived from NBO analysis at the PBE0/LanL2DZ(Ru)U6-31G(d,p)(E) level in water solvent. In all cases, the Ru–NO bond is dominated by charge transfer (CT), followed by polarization (POL) and electrostatics (ES), with exchange-correlation (XC) providing a modest contribution. The strength of this interaction is reflected in the highly negative ΔE values (ca. −200 to −224 kcal mol⁻¹). The Au–SH and Ag–SH interactions are considerably weaker (−28 and −18 kcal mol⁻¹, respectively), though they remain CT-dominated. Unlike the Ru–NO bond, the polarization contribution to Au–SH and Ag–SH is minimal, suggesting a more localized, donor–acceptor interaction at the nanoparticle–ligand interface.
A closer inspection of the NEDA results summarized in Table 2 provides deeper insight into the subtle electronic variations induced by the equatorial ligand and the Au₂₀ support. Across all [(L)Ru(NO)(SH)@Au₂₀] hybrids, the Ru–NO bond is unequivocally dominated by charge transfer (CT) contributions (≈ −500 kcal mol⁻¹), accompanied by substantial polarization (POL) energies (≈ −200 kcal mol⁻¹) and modest electrostatic (ES) terms. This CT ≫ POL > ES trend confirms the highly covalent, donor–acceptor character of the Ru–NO linkage, consistent with significant Ru → π*(NO) backbonding revealed by NBO and ETS–NOCV analyses. Among the four ligands, the bpb system exhibits the largest total interaction energy (ΔE ≈ −202 kcal mol⁻¹), suggesting slightly stronger Ru–NO coupling due to enhanced π-delocalization and ligand field stabilization. In contrast, the phthalocyanine analogue displays a smaller ΔE (≈ −181 kcal mol⁻¹), reflecting partial electron delocalization over the extended π-system that slightly attenuates direct Ru–NO donation.
For the Ru–S bonds, CT remains the principal stabilizing factor (−160 to −185 kcal mol⁻¹), though with a comparatively larger polarization and electrostatic component relative to Ru–NO, implying mixed covalent–ionic character. The magnitude of ΔE decreases in the order bpb > salen > pc > porph, in line with the increasing softness of the equatorial donor set. The Au–S interactions are considerably weaker (ΔE ≈ −22 to −28 kcal mol⁻¹) yet still governed by CT, underscoring the donor–acceptor nature of the thiolate–gold anchoring. Notably, the phthalocyanine complex shows the most attenuated Au–S interaction, consistent with greater charge delocalization across the macrocyclic π-manifold that diminishes localized donor capacity at sulfur. Overall, the NEDA analysis highlights a coherent bonding hierarchy—Ru–NO ≫ Ru–S ≫ Au–S—driven predominantly by charge transfer and polarization effects. These findings substantiate the picture of an electronically coupled Ru–S–Au framework that mediates efficient communication between the photoactive Ru–NO center and the plasmonic nanocluster, a prerequisite for the observed charge-transfer transitions and NIR emission behavior discussed below.
2.2.3. ETS-NOCV
A powerful approach for dissecting metal–ligand bonding is the ETS–NOCV (Extended Transition State – Natural Orbitals for Chemical Valence) method. We employed this technique to investigate the nature of the Ru–NO, Ru–SH, and Au–SH interactions within the representative [(Salen)Ru(NO)(SH)@Au₂₀] hybrid complex. Figure 3 displays the relevant NOCV deformation densities for these bonds. The Ru–NO interaction is characterized by three dominant NOCV pairs with associated orbital interaction energies of −70, −66, and −63 kcal mol⁻¹, respectively. These correspond to three principal channels of electron density deformation (Δρ1-3, Figure 3a), arising from donor–acceptor interactions between the NO ligand and the Ru center. The first two channels (Δρ₁ and Δρ₂) involve σ- and π-donation from the NO lone pair into vacant Ru d-orbitals, with integrated charge transfers of 1.020 and 0.960 electrons, respectively. The third channel (Δρ₃) represents π-backdonation from filled Ru dπ orbitals into the π* orbital of the NO ligand, with a charge flow of 0.545 |e|.
This combination of strong donation and backdonation supports a synergic bonding picture and aligns with the observed linear Ru–N–O geometry and slightly elongated N–O bond, consistent with a [Ru(II) ← NO⁺] description. Collectively, these three NOCV channels account for ~86% of the total orbital interaction energy (−232 kcal mol⁻¹), underscoring their dominant role in bond formation. Notably, the total deformation density (ΔρPauli+Orb = ΔρPauli + ΔρOrb) closely resembles the orbital-only term (ΔρOrb), indicating minimal Pauli repulsion and confirming a strongly donor–acceptor character (Figure 3a). We next examined the Ru–SH and Au–SH interactions, which play a key role in anchoring the complex to the nanoparticle surface and mediating electronic communication relevant for plasmon-enhanced Raman scattering and NO-based holographic response (vide infra). Each interaction is dominated by a single NOCV channel, with orbital stabilization energies of −50 and −29 kcal mol⁻¹ for Ru–SH and Au–SH, respectively. As shown in Figure 3b and Figure 3c, these deformation densities correspond to σ-donation from the sulfur lone pair into vacant d-orbitals on the Ru center and the surface-bound Au atom of the Au₂₀ cluster. The respective charge flows of 0.762 and 0.570 electrons reflect strong donor character at both metal–sulfur interfaces. No π-backdonation components were detected, indicating that both interactions are purely σ-type in nature. Comparable bonding features were observed in the rest [(L)Ru(NO)(SH)] complexes with L = bpb, porph or pc with similar NOCV pair types and deformation patterns. Only minor variations were found in charge flows and interaction energies suggesting that the overall bonding framework remains largely conserved across all systems studied.
2.3. Luminescence Based Detection
Luminescence of the proposed Ru–NP theranostic hybrids is a central feature offering ability to monitor them in real time. Accordingly, it is of importance to study in depth their photophysical properties pertaining either absorption or emission.
2.3.1. Absorption
To evaluate their optical response under physiologically relevant conditions, we performed TDDFT calculations of 30 singlet–singlet vertical excitations for the [(Salen)Ru(NO)(SH)] complex and its Au₂₀- and Ag₂₀-bound analogues in water solvent. The resulted simulated absorption spectra are depicted in Figure 4.
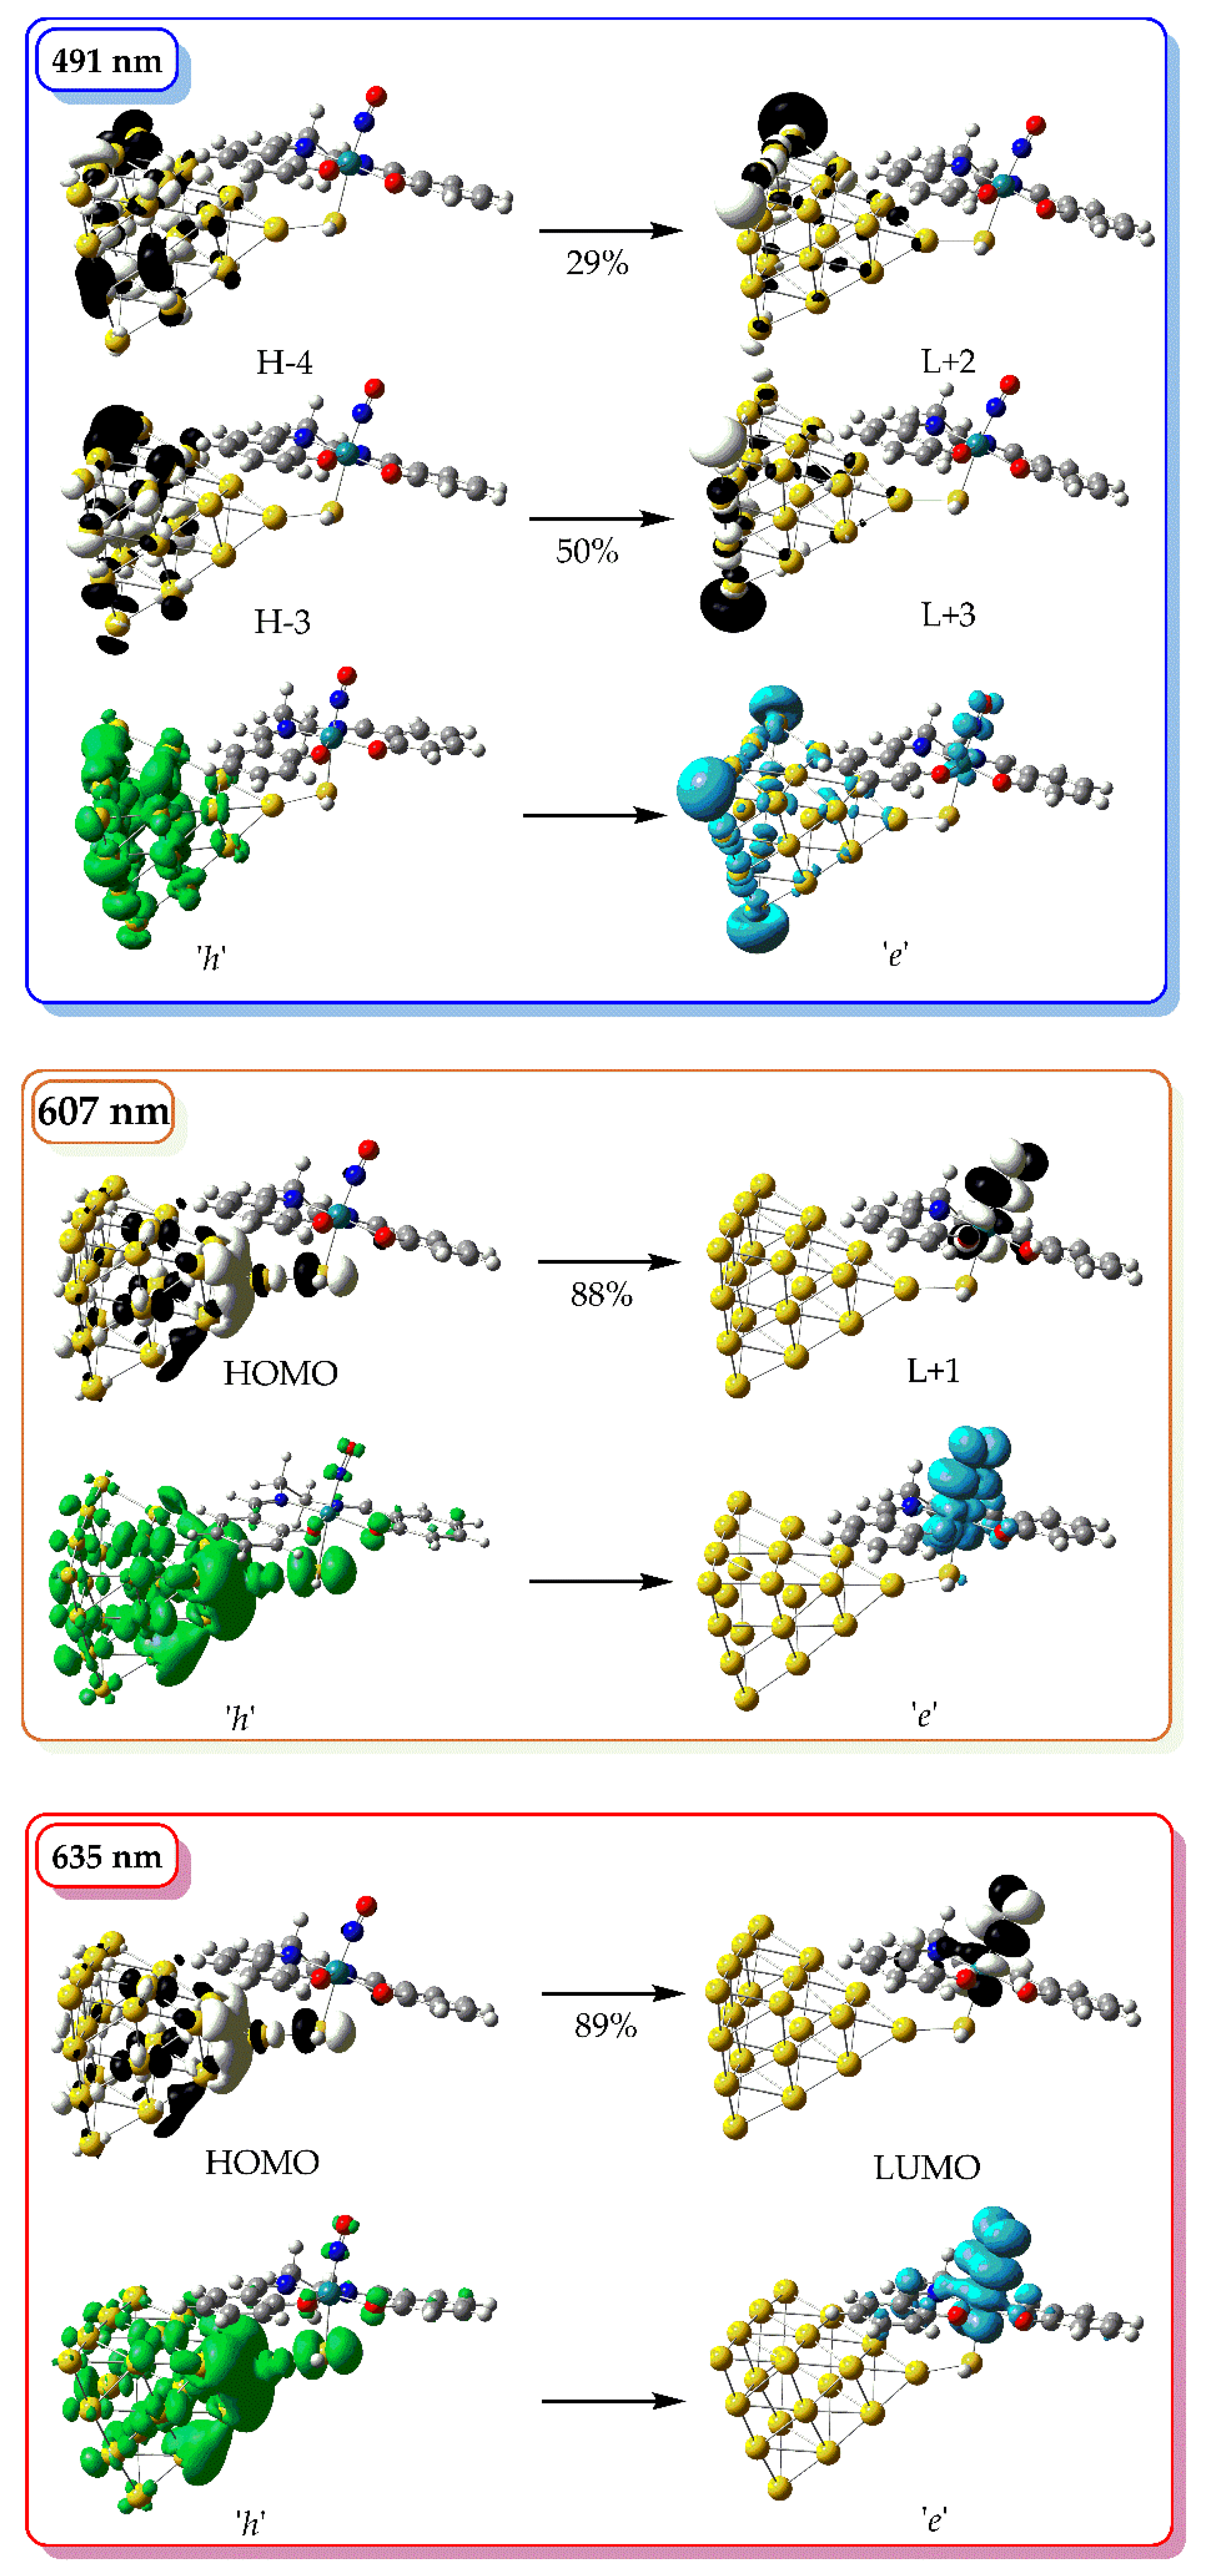
In the simulated absorption spectrum of [(Salen)Ru(NO)(SH)@Au₂₀], (blue line in Figure X) we observe two bands peaking around at 485 and 625 nm. The high-energy band is comprised of multiple transitions, with the most intense at 491 nm, originating from HOMO−4 → LUMO+2 and HOMO−3 → LUMO+3 excitations. All participating MOs are localized on the Au₂₀ nanoparticle (Figure 4), and the transition is therefore assigned as metal-centered (MC). The low-energy band is dominated by transitions at 607 and 635 nm, corresponding to HOMO → LUMO+1 and HOMO → LUMO excitations, respectively. Here, the HOMO is delocalized over the Au₂₀ NP and the thiol S atom, while the LUMO and LUMO+1 are localized on the Ru center and NO ligand, indicating a mixed metal-to-metal′ and ligand charge transfer (MM′LCT) character.
Upon replacing the Salen equatorial ligand with the bpb ligand, no significant changes could be observed in the simulated absorption spectrum (Figure 4, green line). Thus, the high energy at 485 nm is retained while the low energy band is blue shifted by about 15 nm, peaking around 610 nm. The high energy band in the simulated absorption spectrum of [(bpb)Ru(NO)(SH)@Au₂₀], comprise a multitude of electronic transitions with the dominant one found at 488 nm. The latter arises from a combination of electronic excitations i.e. H-4 → L+3 (42%), H-3 → L+2 (14%) and HOMO → L+5 (10%). The 3D surfaces of all MOs involved in these electronic excitations are depicted in Figure S2 of SI. Accordingly, H-4 and H-3 are located mainly on the Au20 NP while HOMO is located mainly on the bpb ligand. On the other hand, all unoccupied MOs involved in these excitations, namely L+2, L+3 and L+5 are located also on the Au20 NP. Therefore, the electronic transition at 488 nm and by extension the high energy band could be assigned as MC, similar to the respective band found in the simulated absorption spectrum of [(Salen)Ru(NO)(SH)@Au₂₀]. On the other hand, the low energy band peaking around
Figure 4.
3D surfaces of MOs relevant to the most important electronic transitions in the simulated absorption spectra of [(Salen)Ru(NO)(SH)] along with the respective hole, h (green surface) and electron, e (light blue surface) distributions.
Figure 4.
3D surfaces of MOs relevant to the most important electronic transitions in the simulated absorption spectra of [(Salen)Ru(NO)(SH)] along with the respective hole, h (green surface) and electron, e (light blue surface) distributions.
610 nm comprises two electronic transitions with the dominant one found at 612 nm. The latter is due to a combination of electronic excitations i.e. H-5 → L+1 (36%) and HOMO → L+1 (55%). The H-5 is mainly located on the Au20 NP (see Figure S2) while L+1 is located on the Ru-NO framework. Taking into account that HOMO is located on the bpb ligand we could assign the electronic transition at 612 nm and by extension the low energy band as having a complex MM’LCT/LM’L’CT character. Thus, upon changing the equatorial salen ligand with the bpb ligand the character of the low energy band is altered.
Next, the simulated absorption spectrum of [(Porph)Ru(NO)(SH)@Au₂₀] (red line, Figure 3) exhibits also two absorption bands, being very similar to those calculated for the salen and bpb hybrid Ru complexes. However, with respect to the latter, both bands are red-shifted by 15 – 25 nm, with the high energy band appearing around 500 nm and the low energy around 650 nm. The high energy band comprise a multitude of electronic transitions with the most dominant one found at 491 nm. This band is due to a combination of excitations namely H-4 → L+4 (16%), H-3 → L+3 (24%) and H-3 → L+5 (20%). Both H-4 and H-3 are located on the Au₂₀ NP while L+3, L+4 and L+5 are located on both Au₂₀ NP as well as on the porphyrin and NO ligands. Thus, the transition at 491 nm and in general by extension the respective band around 500 nm could be assign a complex MC/MLCT character. On the other hand, the low energy band comprise a group of electronic transitions, with the most dominant one found at 634 nm. The latter arises from the H-1 → L+1 (30%), HOMO → L+1 (41%) excitations combination. The H-1 is localized on the Au₂₀ NP and the HOMO on both Au₂₀ NP and the thiol ligand while L+1 is located on the Ru-NO framework (Figure S3) and thus the band around 650 nm could be described as MLCT/LL’CT/MM’CT.
Finally, the simulated absorption spectrum of [(Pc)Ru(NO)(SH)@Au₂₀] (black line, Figure 3) although being qualitatively similar to those observed for the rest of the Ru complexes under study, exhibiting two bands, it also features some striking differences as compared to them. Thus, a significant red shift is observed for both the high and low energy bands, ranging from 80 nm up to 95 nm for the former and from 170 up to 210 nm for the latter. Another remarkable difference is that the high energy band for the Ru complex bearing the phthalocycanine ligand, is a seven to eight fold increase in its intensity as compared to any of the rest Ru complexes under study bearing salen, bpb or the porphyrin ligands. The high energy band for the phthalocyanine Ru system peaks around 580 nm (Figure 3) and comprise a large group of electronic transitions. The most dominant one is at 582 nm, arising mainly from an H-1 → L+3 (80%) excitation. The H-1 is located on the Pc equatorial ligand while L+3 is located on both RU-NO framework as well as on the Pc ligand. Thus, the transition at 582 nm and by extension the band around 580 nm could be assigned as LMCT/LL’CT/IL. In addition, the low energy band, peaking around 820, within NIR, comprises four electronic transitions with the most dominant amongst them found at 793 nm. The latter arises from a HOMO → L+1 (89%) excitation where HOMO is located on the Au₂₀ NP and the thiol ligand while L+1 is located on Ru-NO framework and the Pc ligand as well (Figure S4). Therefore, the band, exhibited by the [(Pc)Ru(NO)(SH)@Au₂₀] complex, within the NIR region, could be assigned as MLCT/MM’CT/LL’CT.
2.3.2. Emission
Next, we will delve into the emission properties of the Ru complexes under investigation. Along these lines we have calculated a series of photophysical parameters related to emission. These parameters are: (a) the vibrational reorganization energy, λvib derived from the energy difference between the S0 state and the Franck – Condon S0 state and (b) the zero – zero transition energy, E0-0 calculated as the Zero Point Energy (ZPE) corrected total electronic energies of the T1 and S0 states and (c) the total electronic energy difference between the T1 and S0 states.
Perusal of Table 3 reveals that the vibrational reorganization energies λvib of 0.76–0.87 eV observed across the series point to pronounced structural relaxation between the singlet and triplet manifolds. This substantial reorganization is consistent with the flexible coordination environment of Ru–NO bound to Au₂₀ and the involvement of charge-transfer states. The consequence is a broad and red-shifted emission profile that naturally falls into the near-infrared region, a highly favorable feature for bioimaging applications where tissue penetration and low background are critical.
Next, the calculated zero–zero transition energies, E0-0 and the total electronic energy difference between the T1 and S0 states, ΔES0-T1 translate to emission wavelengths in the 1800–3800 nm range, confirming that the lowest-energy radiative processes in these Ru–Au₂₀ hybrids occur deep in the near-infrared. Such long-wavelength transitions arise from the stabilization of triplet states through extensive metal–cluster–ligand delocalization and charge-transfer contributions. Emission in this spectral region overlaps with the NIR-II biological window, which is highly advantageous for in vivo theranostics, providing superior tissue penetration and minimal autofluorescence compared to visible emitters. These zero–zero energies thus reinforce the conclusion that the Ru–Au₂₀ architectures are intrinsically predisposed to function as NIR-active platforms for combined imaging and therapeutic applications.
3. Conclusions
This theoretical investigation elucidates the structural, electronic, and photophysical features governing the behavior of hybrid Ru–NO/Au₂₀ systems relevant to photoresponsive theranostics. The Ru–NO fragment retains a linear geometry typical of {RuNO}⁶ species but exhibits clear signatures of metal-to-ligand π-backbonding, reducing the N–O bond order and enabling efficient photoactivation. The Au₂₀ nanocluster acts as an electronically active support that mediates long-range charge transfer through delocalized Ru–S–Au linkages. NBO, NEDA, and ETS–NOCV analyses consistently show that the bonding framework is dominated by charge-transfer and polarization interactions, confirming a strong donor–acceptor coupling between the Ru chromophore and the gold core. TDDFT-derived absorption spectra display visible and NIR charge-transfer bands that evolve systematically with the equatorial ligand environment. Calculated zero–zero transition energies and reorganization energies point to deep NIR-II emission, suggesting that these Ru–Au₂₀ assemblies could serve as luminescent sensors and NO-releasing agents under biologically transparent conditions. Overall, the results demonstrate that coupling molecular Ru–NO photoNORMs to plasmonic nanoclusters offers a rational route toward multifunctional, luminescent theranostic architectures, providing a theoretical foundation for future experimental realization and biomedical application.
4. Computational Details
Full geometry optimization of the Ru(II) complexes under study was performed without symmetry constraints, using the Gaussian16W, Rev. C.01 software [36]. The PBE0 functional of Perdew, Burke, and Ernzerhof was employed throughout the calculations [37,38,39,40,41,42]. The effective core potential, LanL2DZ basis set [43,44,45,46], was used for the Ru metal centre, while for all non-metal atoms, we employed the 6-31G(d,p) basis set as implemented in Gaussian16W, Rev. C.01 software. Local minima were verified upon calculating the vibrational modes, resulted in zero imaginary frequencies (NImag = 0). The computational method is abbreviated as PBE0/LanL2DZ(Ru)U6-31G(d,p)(E). Water solvent effects were taken into account employing the Polarizable Continuum Model (PCM) using the integral equation formalism variant (IEF-PCM), as implemented in the Gaussian16W, Rev. C.01 software [47]. The Natural Bond Orbital (NBO) method of Weinhold et al. was used [48]. Time-dependent density functional theory (TD-DFT) calculations [49,50,51,52] were done, upon taking into account the 30 lowest excited states. Multiwfn 3.8 [53] and GaussSum 2.2.6.1 [54] wave function analyzers were also used to visualize the results.
Supplementary Materials
The following supporting information can be downloaded at the website of this paper posted on Preprints.org, Figure S1: Simulated IR spectra calculated at PBE0/LanL2DZ(Ru)U6-31G(d,p)(E) level of theory, in water solvent.; Figure S2: 3D surfaces of MOs involved into the electronic excitations relevant to the most important electronic transitions in the simulated absorption spectrum of [(bpb)Ru(NO)(SH)@Au₂₀] in water solvent.; Figure S3: 3D surfaces of MOs involved into the electronic excitations relevant to the most important electronic transitions in the simulated absorption spectrum of [(porph)Ru(NO)(SH)@Au₂₀] in water solvent.; Figure S4: 3D surfaces of MOs involved into the electronic excitations relevant to the most important electronic transitions in the simulated absorption spectrum of [(pc)Ru(NO)(SH)@Au₂₀] in water solvent.; Table S1: Cartesian coordinates and energetic data.
Author Contributions
Conceptualization, A.C. and Y.Y.; methodology, A.C.; validation, A.C., A.C.; formal analysis, A.C. and N.C. ; investigation, A.C. and N.C.; resources, A.C. and N.C.; data curation, A.C. and N.C.; writing—original draft preparation, A.C. and N.C.; writing—review and editing, A.C. and N.C.; visualization, A.C. and N.C.; supervision, A.C.; project administration, A.C.; All authors have read and agreed to the published version of the manuscript.
Funding
This research received no external funding.
Institutional Review Board Statement
Not applicable.
Informed Consent Statement
Not applicable.
Conflicts of Interest
The authors declare no conflicts of interest.
References
- McCleverty, J.A. Chemistry of nitric oxide relevant to biology A. Chem. Rev. 2004, 104, 403–418. [Google Scholar] [CrossRef]
- Weinberger, B.; Laskin, D.L.; Heck, D.E.; Laskin, J.D. The Toxicology of Inhaled Nitric Oxide. Tox. Sci. 2001, 59, 5–16. [Google Scholar] [CrossRef]
- Toledo Jr., J.C.; Augusto, O. Connecting the Chemical and Biological Properties of Nitric Oxide. Chem. Res. Toxicol. 2012, 25, 975–989. [Google Scholar] [CrossRef]
- Carlström, M.; Weitzberg, E.; Lundberg, J.O. Nitric Oxide Signaling and Regulation in the Cardiovascular System: Recent Advances. Pharm. Rev. 2024, 76, 1038–1062. [Google Scholar] [CrossRef]
- Hall, J.R.; Rouillard, K.R.; Suchyta, D.J.; Brown, M.D.; Ahonen, M.J.R.; Schoenfisch, M.H. Mode of Nitric Oxide Delivery Affects Antibacterial Action ACS Biomater. Sci. Eng. 2020, 6, 433–441. [Google Scholar]
- Huerta, S. Nitric oxide for cancer therapy. Future Sci. 2015, 1, FSO44. [Google Scholar]
- Mintz, J.; Vedenko, A.; Rosete, O.; Shah, K.; Goldstein, G.; Hare, J.M.; Ramasamy, R.; Arora, H. Current Advances of Nitric Oxide in Cancer and Anticancer Therapeutics. Vaccines 2021, 9, 94–133. [Google Scholar] [CrossRef] [PubMed]
- Gordon, J.L.; Hinsen, K.J.; Reynolds, M.M.; Smith, T.A.; Tucker, H.O.; Brown, M.A. Anticancer potential of nitric oxide (NO) in neuroblastoma treatment. RSC Adv. 2021, 11, 9112–9120. [Google Scholar] [CrossRef] [PubMed]
- Li, Y.; Yoon, B.; Dey, A.; Nguyen, V.Q.; Park, J.H. Recent progress in nitric oxide-generating nanomedicine for cancer therapy. J. Contr. Rel. 2022, 352, 179–198. [Google Scholar] [CrossRef] [PubMed]
- Ford, P.C.; Bourassa, J.; Miranda, K.; Lee, B.; Lorkovic, I.; Boggs, S.; Kudo, S.; Laverman, L. Photochemistry of metal nitrosyl complexes. Delivery of nitric oxide to biological targets. Coord. Chem. Rev. 1998, 171, 185–202. [Google Scholar] [CrossRef]
- Ford, P.C. Polychromophoric Metal Complexes for Generating the Bioregulatory Agent Nitric Oxide by Single- and Two-Photon Excitation. Acc. Chem. Res. 2008, 41, 190–200. [Google Scholar] [CrossRef]
- Ostrowski, A.D.; Ford, P.C. Metal complexes as photochemical nitric oxide precursors: Potential applications in the treatment of tumors. Dalton Trans. 2009, 10660–10669. [Google Scholar] [CrossRef]
- Fry, N.L.; Mascharak, P.K. Photoactive Ruthenium Nitrosyls as NO Donors: How To Sensitize Them toward Visible Light. Acc. Chem. Res. 2011, 44, 289–298. [Google Scholar] [CrossRef]
- Levina, A.; Mitra, A.; Lay, P.A. Recent developments in ruthenium anticancer drugs. Metallomics 2009, 1, 458–470. [Google Scholar] [CrossRef] [PubMed]
- Miranda, K.M.; Bu, X.; Lorkovic, I.; Ford, P.C. Synthesis and Structural Characterization of Several Ruthenium Porphyrin Nitrosyl Complexes. Inorg. Chem. 1997, 36, 4838–4848. [Google Scholar] [CrossRef]
- Works, C.F.; Ford, P.C. Photoreactivity of the Ruthenium Nitrosyl Complex, Ru(salen)(Cl)(NO). Solvent Effects on the Back Reaction of NO with the Lewis Acid RuIII(salen)(Cl)1. J. Am. Chem. Soc. 2000, 122, 7592–7593. [Google Scholar] [CrossRef]
- Works, C.F.; Jocher, C.J.; Bart, G.D.; Bu, X.; Ford, P.C. Photochemical Nitric Oxide Precursors: Synthesis, Photochemistry, and Ligand Substitution Kinetics of Ruthenium Salen Nitrosyl and Ruthenium Salophen Nitrosyl Complexes1. Inorg. Chem. 2002, 41, 3728–3739. [Google Scholar] [CrossRef]
- Rose, M.J.; Mascharak, P.K. Photoactive ruthenium nitrosyls: Effects of light and potential application as NO donors Coord. Chem. Rev. 2008, 252, 2093–2114. [Google Scholar] [CrossRef]
- Rose, M.J.; Fry, N.L.; Marlow, R.; Hink, L.; Mascharak, P.K. Sensitization of Ruthenium Nitrosyls to Visible Light via Direct Coordination of the Dye Resorufin: Trackable NO Donors for Light-Triggered NO Delivery to Cellular Targets. J. Am. Chem. Soc. 2008, 130, 8834–8846. [Google Scholar] [CrossRef] [PubMed]
- Rose, M.J.; Olmstead, M.M.; Mascharak, P.K. Photosensitization via Dye Coordination: A New Strategy to Synthesize Metal Nitrosyls That Release NO under Visible Light. J. Am. Chem. Soc. 2007, 129, 5342–5343. [Google Scholar] [CrossRef] [PubMed]
- Rose, M.J.; Mascharak, P.K. Photosensitization of Ruthenium Nitrosyls to Red Light with an Isoelectronic Series of Heavy-Atom Chromophores: Experimental and Density Functional Theory Studies on the Effects of O-, S- and Se-Substituted Coordinated Dyes. Inorg. Chem. 2009, 48, 6904–6917. [Google Scholar] [CrossRef]
- Sauaia, M.G.; de Lima, R.G.; Tedesco, A.C.; da Silva, R.S. Photoinduced NO Release by Visible Light Irradiation from Pyrazine-Bridged Nitrosyl Ruthenium Complexes. J. Am. Chem. Soc. 2003, 125, 14718–14719. [Google Scholar] [CrossRef] [PubMed]
- Sauaia, M.G.; de Lima, R.G.; Tedesco, A.C.; da Silva, R.S. Nitric Oxide Production by Visible Light Irradiation of Aqueous Solution of Nitrosyl Ruthenium Complexes. Inorg. Chem. 2005, 44, 9946–9951. [Google Scholar] [CrossRef] [PubMed]
- Quintana, C.; Cifuentes, M.P.; Humphrey, M.G. Transition metal complex/gold nanoparticle hybrid materials. Chem. Soc. Rev. 2020, 49, 2316–2345. [Google Scholar] [CrossRef]
- Quintana, C.; Morshedi, M.; Wang, H.; Du, J.; Cifuentes, M.P.; Humphrey, M.G. Exceptional Two-Photon Absorption in Alkynylruthenium–Gold Nanoparticle Hybrids. Nano Lett. 2019, 19, 756–760. [Google Scholar] [CrossRef]
- Hone, D.C.; Walker, P.I.; Evans-Gowing, R.; Fitzgerald, S.; Beeby, A.; Chambrier, I.; Cook, M.J.; Russell, D.A. Generation of Cytotoxic Singlet Oxygen via Phthalocyanine-Stabilized Gold Nanoparticles: A Potential Delivery Vehicle for Photodynamic Therapy. Langmuir 2002, 18, 2985–2987. [Google Scholar] [CrossRef]
- D’Souza, S.; Moeno, S.; Antunes, E.; Nyokong, T. Effects of gold nanoparticle shape on the aggregation and fluorescence behaviour of water soluble zinc phthalocyanines. New J. Chem. 2013, 37, 1950–1958. [Google Scholar] [CrossRef]
- King, M.; Claire, S.; Teixeira, R.I.; Dosumu, A.N.; Carrod, A.J.; Dehghani, H.; Hannon, M.J.; Ward, A.D.; Bicknell, R.; Botchway, S.W.; Hodges, N.J.; Pikramenou, Z. Iridium Nanoparticles for Multichannel Luminescence Lifetime Imaging, Mapping Localization in Live Cancer Cells. J. Am. Chem. Soc. 2018, 140, 10242–10249. [Google Scholar] [CrossRef]
- Garcia Calavia, P.; Bruce, G.; Perez-Garcia, L.; Russell, D.A. Photosensitiser-gold nanoparticle conjugates for photodynamic therapy of cancer. Photochem. Photobiol. Sci. 2018, 17, 1534–1552. [Google Scholar] [CrossRef]
- Fernandez-Moreira, V.; Thorp-Greenwood, F.L.; Coogan, M.P. Application of d6 transition metal complexes in fluorescence cell imaging. Chem. Commun. 2010, 46, 186–202. [Google Scholar] [CrossRef] [PubMed]
- Jin, R.; et al. Chem. Rev. 2016, 116, 10346–10413. [CrossRef] [PubMed]
- Häkkinen, H. Chem. Soc. Rev. 2008, 37, 1847–1859. [CrossRef]
- Molina, B.; et al. Phys. Chem. Chem. Phys. 2019, 21, 16486–16494. [CrossRef]
- Li, J.; Li, X.; Zhai, H.-J.; Wang, L.-S. Science 2003, 299, 864–867. [CrossRef]
- Lopez-Acevedo, O.; et al. J. Am. Chem. Soc. 2009, 131, 12597–12604. [CrossRef] [PubMed]
- Gaussian 16, Revision C.01; Frisch, M.J., Trucks, G.W., Schlegel, H.B., Scuseria, G.E., Robb, M.A., Cheeseman, J.R., Scalmani, G., Barone, V., Petersson, G.A., Nakatsuji, H., et al., Eds.; Gaussian Inc.: Wallingford, CT, USA, 2016. [Google Scholar]
- Vetere, V.; Adamo, C.; Maldivi, P. Performance of theparameter free’PBE0 functional for the modeling of molecular properties of heavy metals. Chem. Phys. Lett. 2000, 325, 99. [Google Scholar] [CrossRef]
- Adamo, C.; Barone, V. Inexpensive and accurate predictions of optical excitations in transition-metal complexes: The TDDFT/PBE0 route. Theor. Chem. Acc. 2000, 105, 169. [Google Scholar] [CrossRef]
- Adamo, C.; Barone, V. Toward reliable density functional methods without adjustable parameters: The PBE0 model. J. Chem. Phys. 1999, 110, 6158. [Google Scholar] [CrossRef]
- Ernzerhof, M.; Scuseria, G.E. Assessment of the Perdew–Burke–Ernzerhof exchange-correlation functional. J. Chem. Phys. 1999, 110, 5029. [Google Scholar] [CrossRef]
- Adamo, C.; Scuseria, G.E.; Barone, V. Accurate excitation energies from time-dependent density functional theory: Assessing the PBE0 model. J. Chem. Phys. 1999, 111, 2889. [Google Scholar] [CrossRef]
- Perdew, J.P.; Burke, K.; Ernzerhof, M. Generalized Gradient Approximation Made Simple. Phys. Rev. Lett. 1996, 77, 3865. [Google Scholar] [CrossRef] [PubMed]
- Dunning, T.H., Jr.; Hay, P.J. Modern Theoretical Chemistry; Schaefer, H.F., III, Ed.; Plenum: New York, NY, USA, 1977; Volume 3, pp. 1–28. [Google Scholar]
- Hay, P.J.; Wadt, W.R. Ab initio effective core potentials for molecular calculations. Potentials for the transition metal atoms Sc to Hg. J. Chem. Phys. 1985, 82, 270. [Google Scholar] [CrossRef]
- Hay, P.J.; Wadt, W.R. Ab initio effective core potentials for molecular calculations. Potentials for main group elements Na to Bi. J. Chem. Phys. 1985, 82, 284. [Google Scholar] [CrossRef]
- Hay, P.J.; Wadt, W.R. Ab initio effective core potentials for molecular calculations. Potentials for K to Au including the outermost core orbitals. J. Chem. Phys. 1985, 82, 299. [Google Scholar] [CrossRef]
- Tomasi, J.; Mennucci, B.; Cammi, R. Quantum mechanical continuum solvation models. Chem. Rev. 2005, 105, 2999. [Google Scholar] [CrossRef]
- Reed, A.E.; Curtiss, L.A.; Weinhold, F. Intermolecular interactions from a natural bond orbital, donor-acceptor viewpoint. Chem. Rev. 1988, 88, 899. [Google Scholar] [CrossRef]
- Van Gisbergen, S.J.A.; Kootstra, F.; Schipper, P.R.T.; Gritsenko, O.V.; Snijders, J.G.; Baerends, E.J. Density-functional-theory response-property calculations with accurate exchange-correlation potentials. Phys. Rev. A At. Mol. Opt. Phys. 1998, 57, 2556. [Google Scholar] [CrossRef]
- Jamorski, C.; Casida, M.E.; Salahub, D.R. Dynamic polarizabilities and excitation spectra from a molecular implementation of time-dependent density-functional response theory: N2 as a case study. J. Chem. Phys. 1996, 104, 5134. [Google Scholar] [CrossRef]
- Bauernschmitt, R.; Ahlrichs, R. Treatment of electronic excitations within the adiabatic approximation of time dependent density functional theory. Chem. Phys. Lett. 1996, 256, 454. [Google Scholar] [CrossRef]
- Adamo, C.; Jacquemin, D. The calculations of excited-state properties with Time-Dependent Density Functional Theory. Chem. Soc. Rev. 2013, 42, 845. [Google Scholar] [CrossRef]
- Lu, T.; Chen, F. Multiwfn: A multifunctional wavefunction analyzer. J. Comp. Chem. 2012, 33, 580. [Google Scholar] [CrossRef] [PubMed]
- O’Boyle, N.M.; Tenderholt, A.L.; Langner, K.M. Cclib: A library for package-independent computational chemistry algorithms. J. Comp. Chem. 2008, 29, 839. [Google Scholar] [CrossRef] [PubMed]
Figure 1.
Optimized geometries of (a) [(Salen)Ru(NO)(SH)], (b) [(bpb)Ru(NO)(SH)], (c) [(Porph)Ru(NO)(SH)] and (d) [(Pc)Ru(NO)(SH)] along with selected structural parameters at the PBE0/LanL2DZ(Ru)U6-31G(d,p)(E) level in water solvent.
Figure 1.
Optimized geometries of (a) [(Salen)Ru(NO)(SH)], (b) [(bpb)Ru(NO)(SH)], (c) [(Porph)Ru(NO)(SH)] and (d) [(Pc)Ru(NO)(SH)] along with selected structural parameters at the PBE0/LanL2DZ(Ru)U6-31G(d,p)(E) level in water solvent.
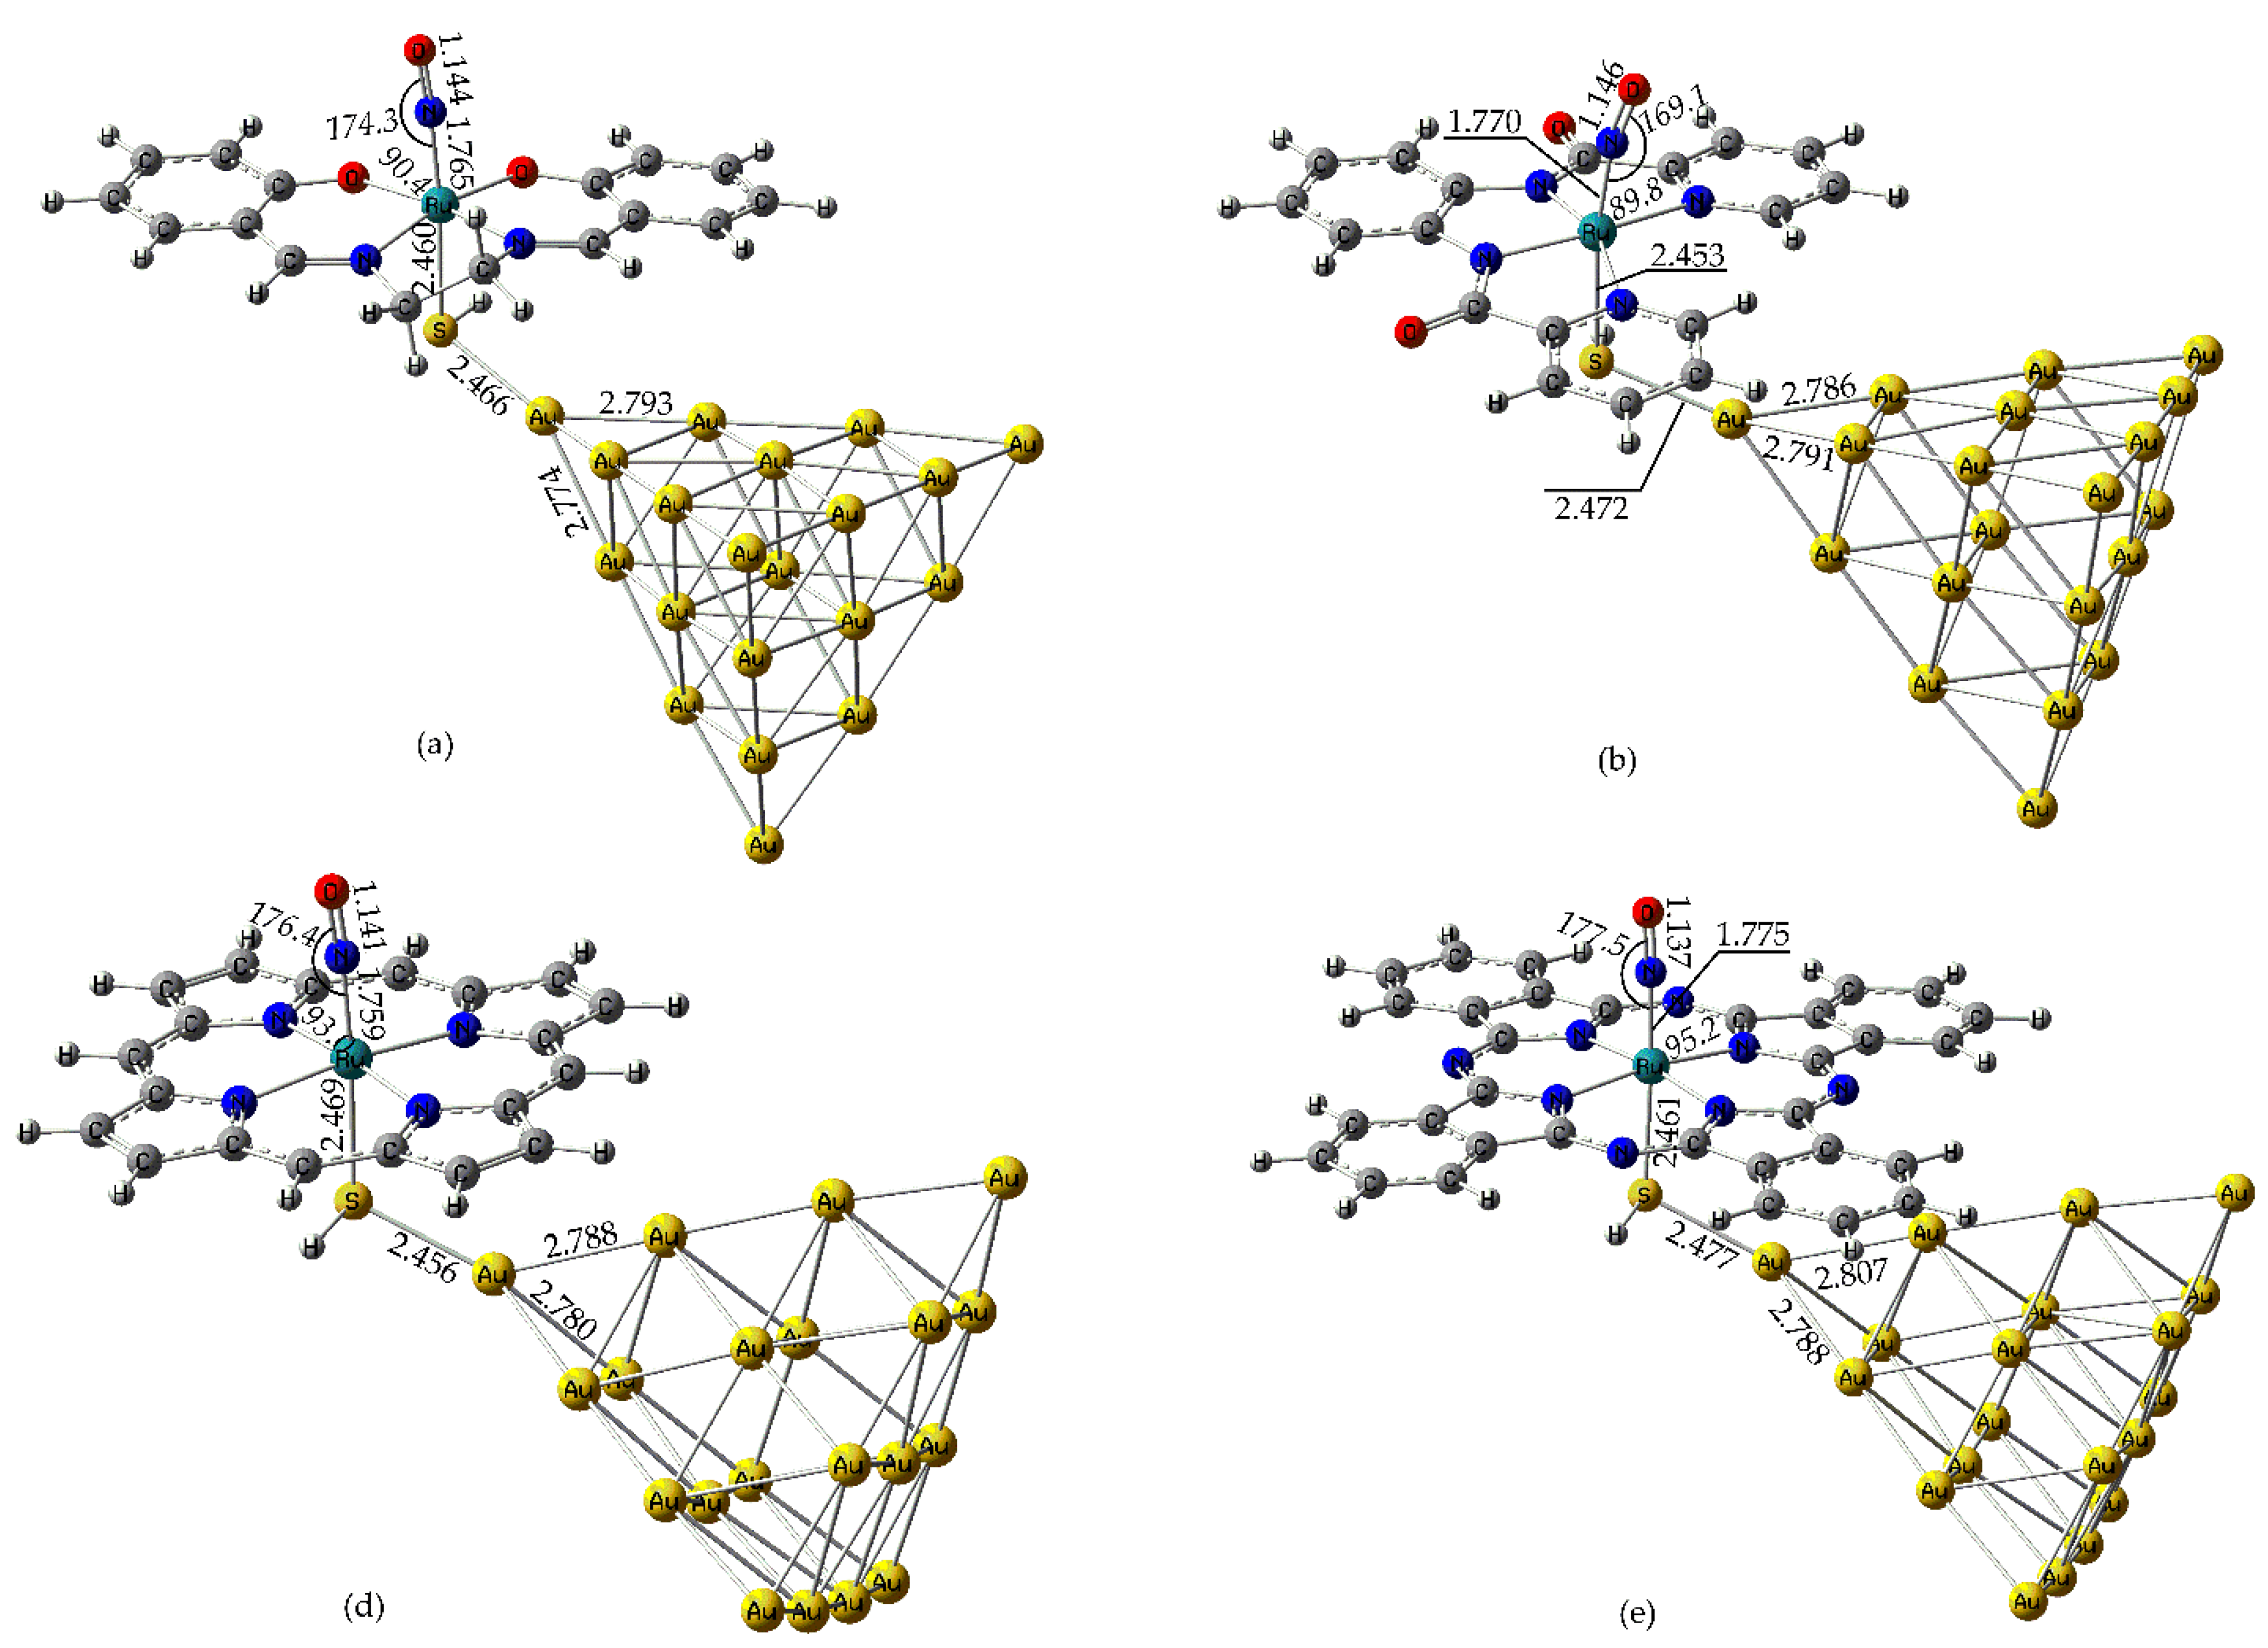
Figure 2.
3D surfaces of BD NBOs relevant to bonding in the Au20-(H)S-Ru-NO framework in [(Salen)Ru(NO)(SH)@Au20] complex.
Figure 2.
3D surfaces of BD NBOs relevant to bonding in the Au20-(H)S-Ru-NO framework in [(Salen)Ru(NO)(SH)@Au20] complex.
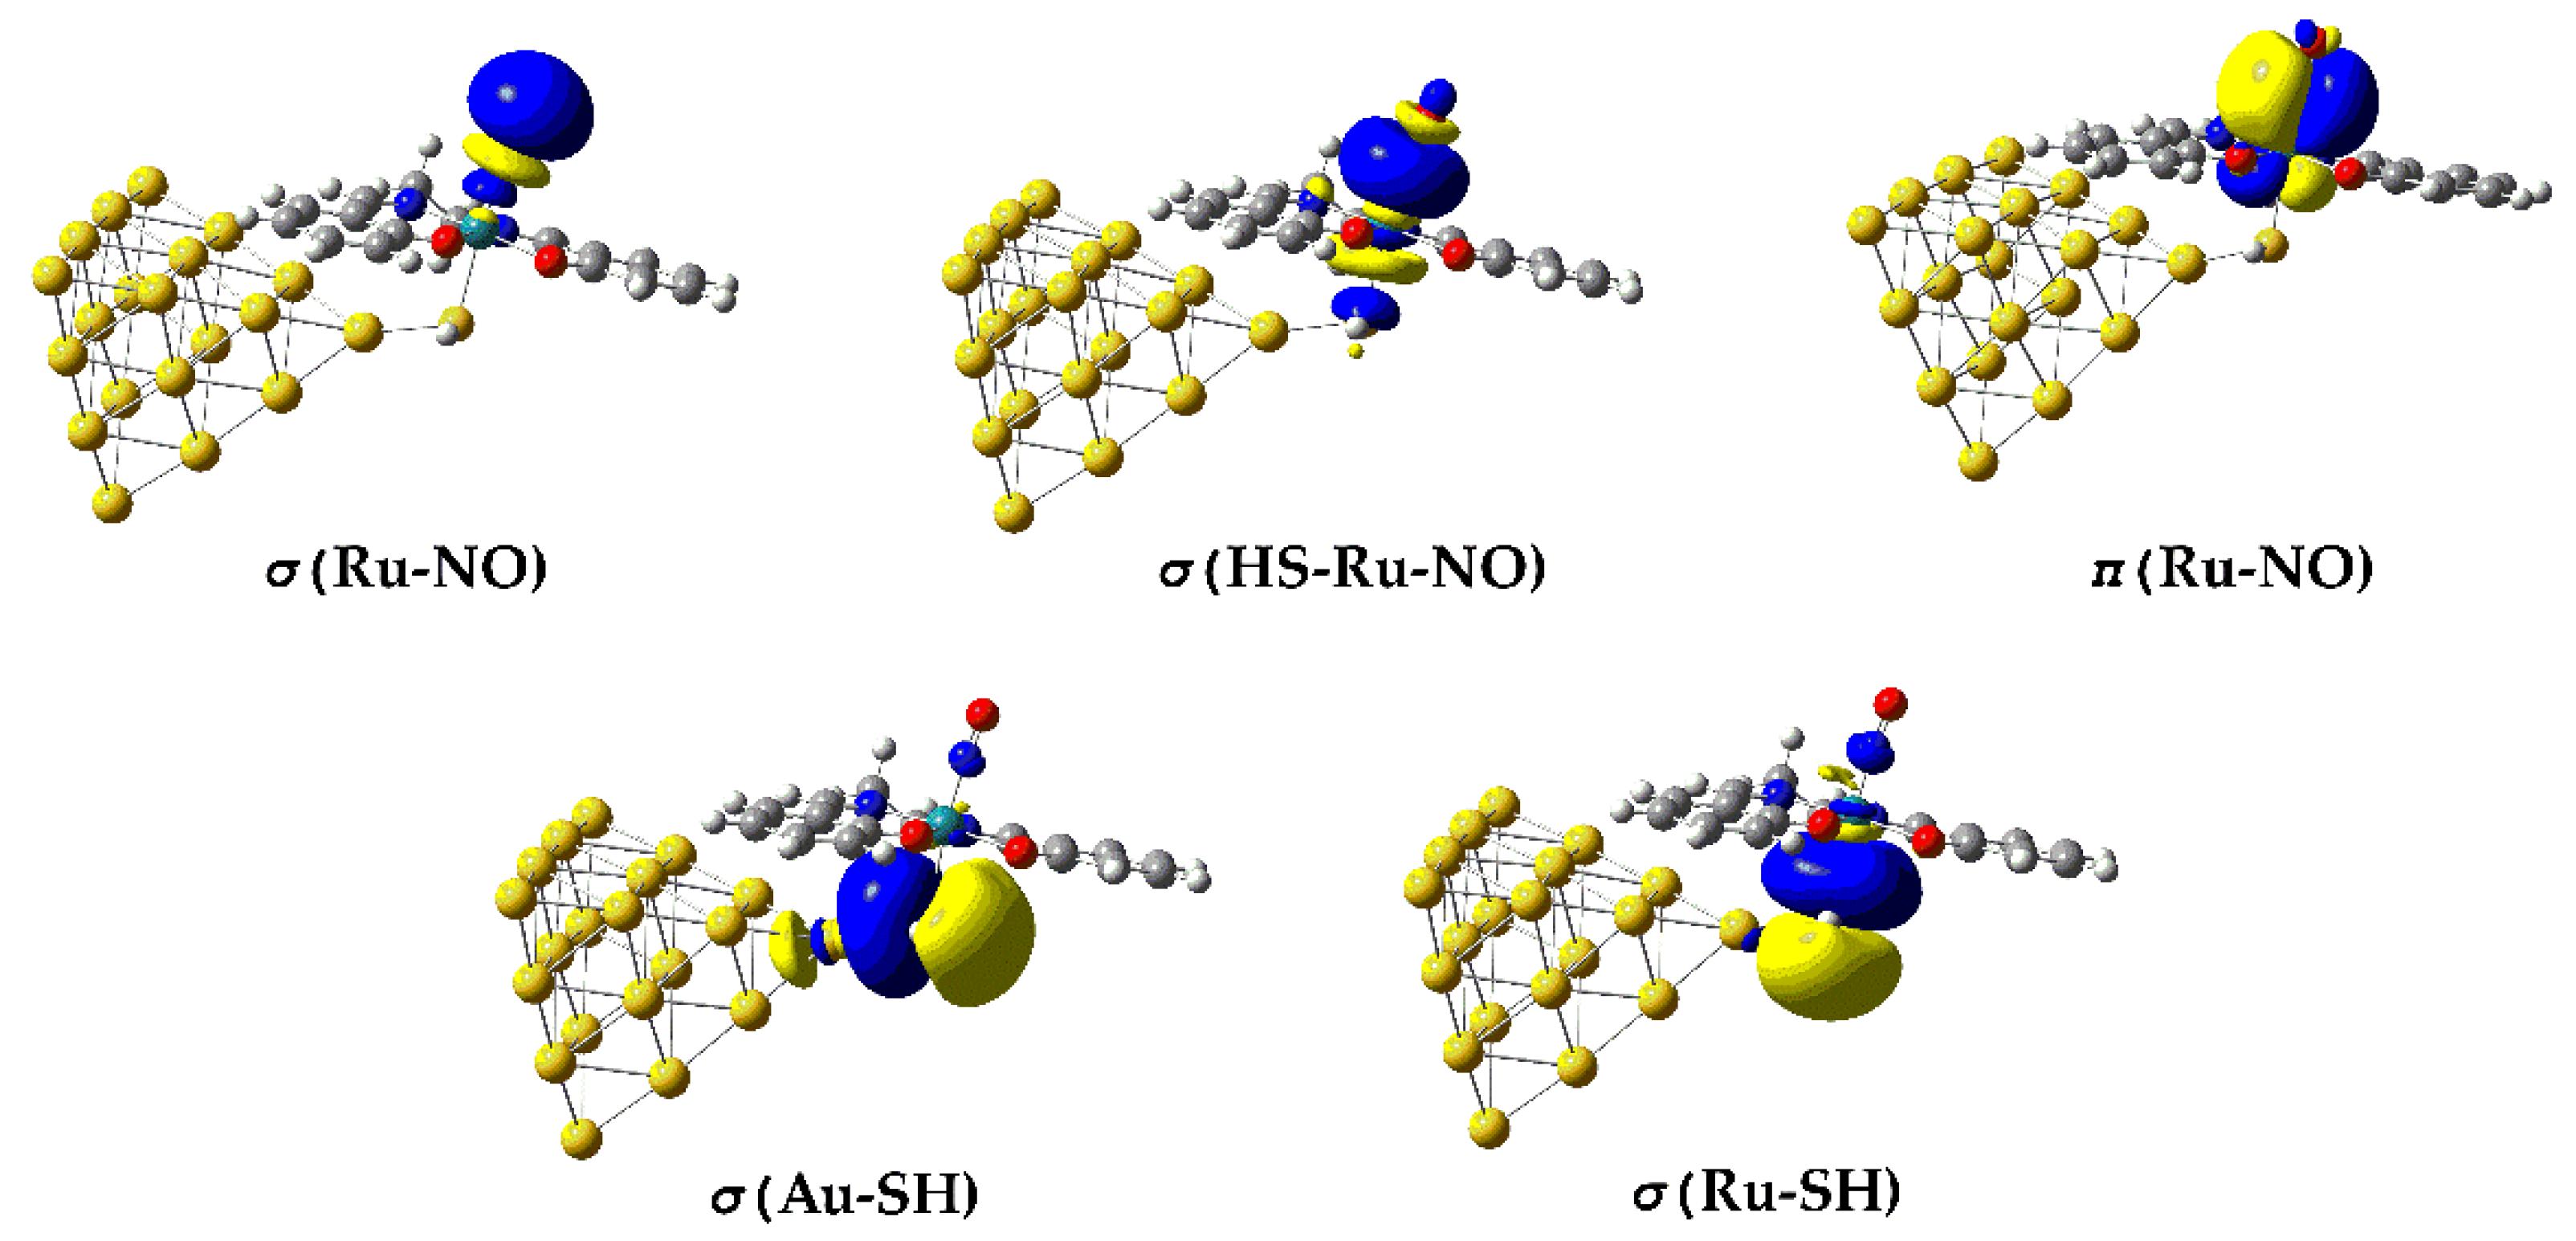
Figure 3.
3D isosurfaces of selected NOCV pairs and ΔρPauli, ΔρOrb, and Δρ deformation density terms calculated for (a) the Ru-NO, (b) the Ru-SH and (c) Au-SH interactions in [(Salen)Ru(NO)(SH)@Au20] hybrid complex (blue and green isosurfaces display decreased and increased electron density regions, respectively).
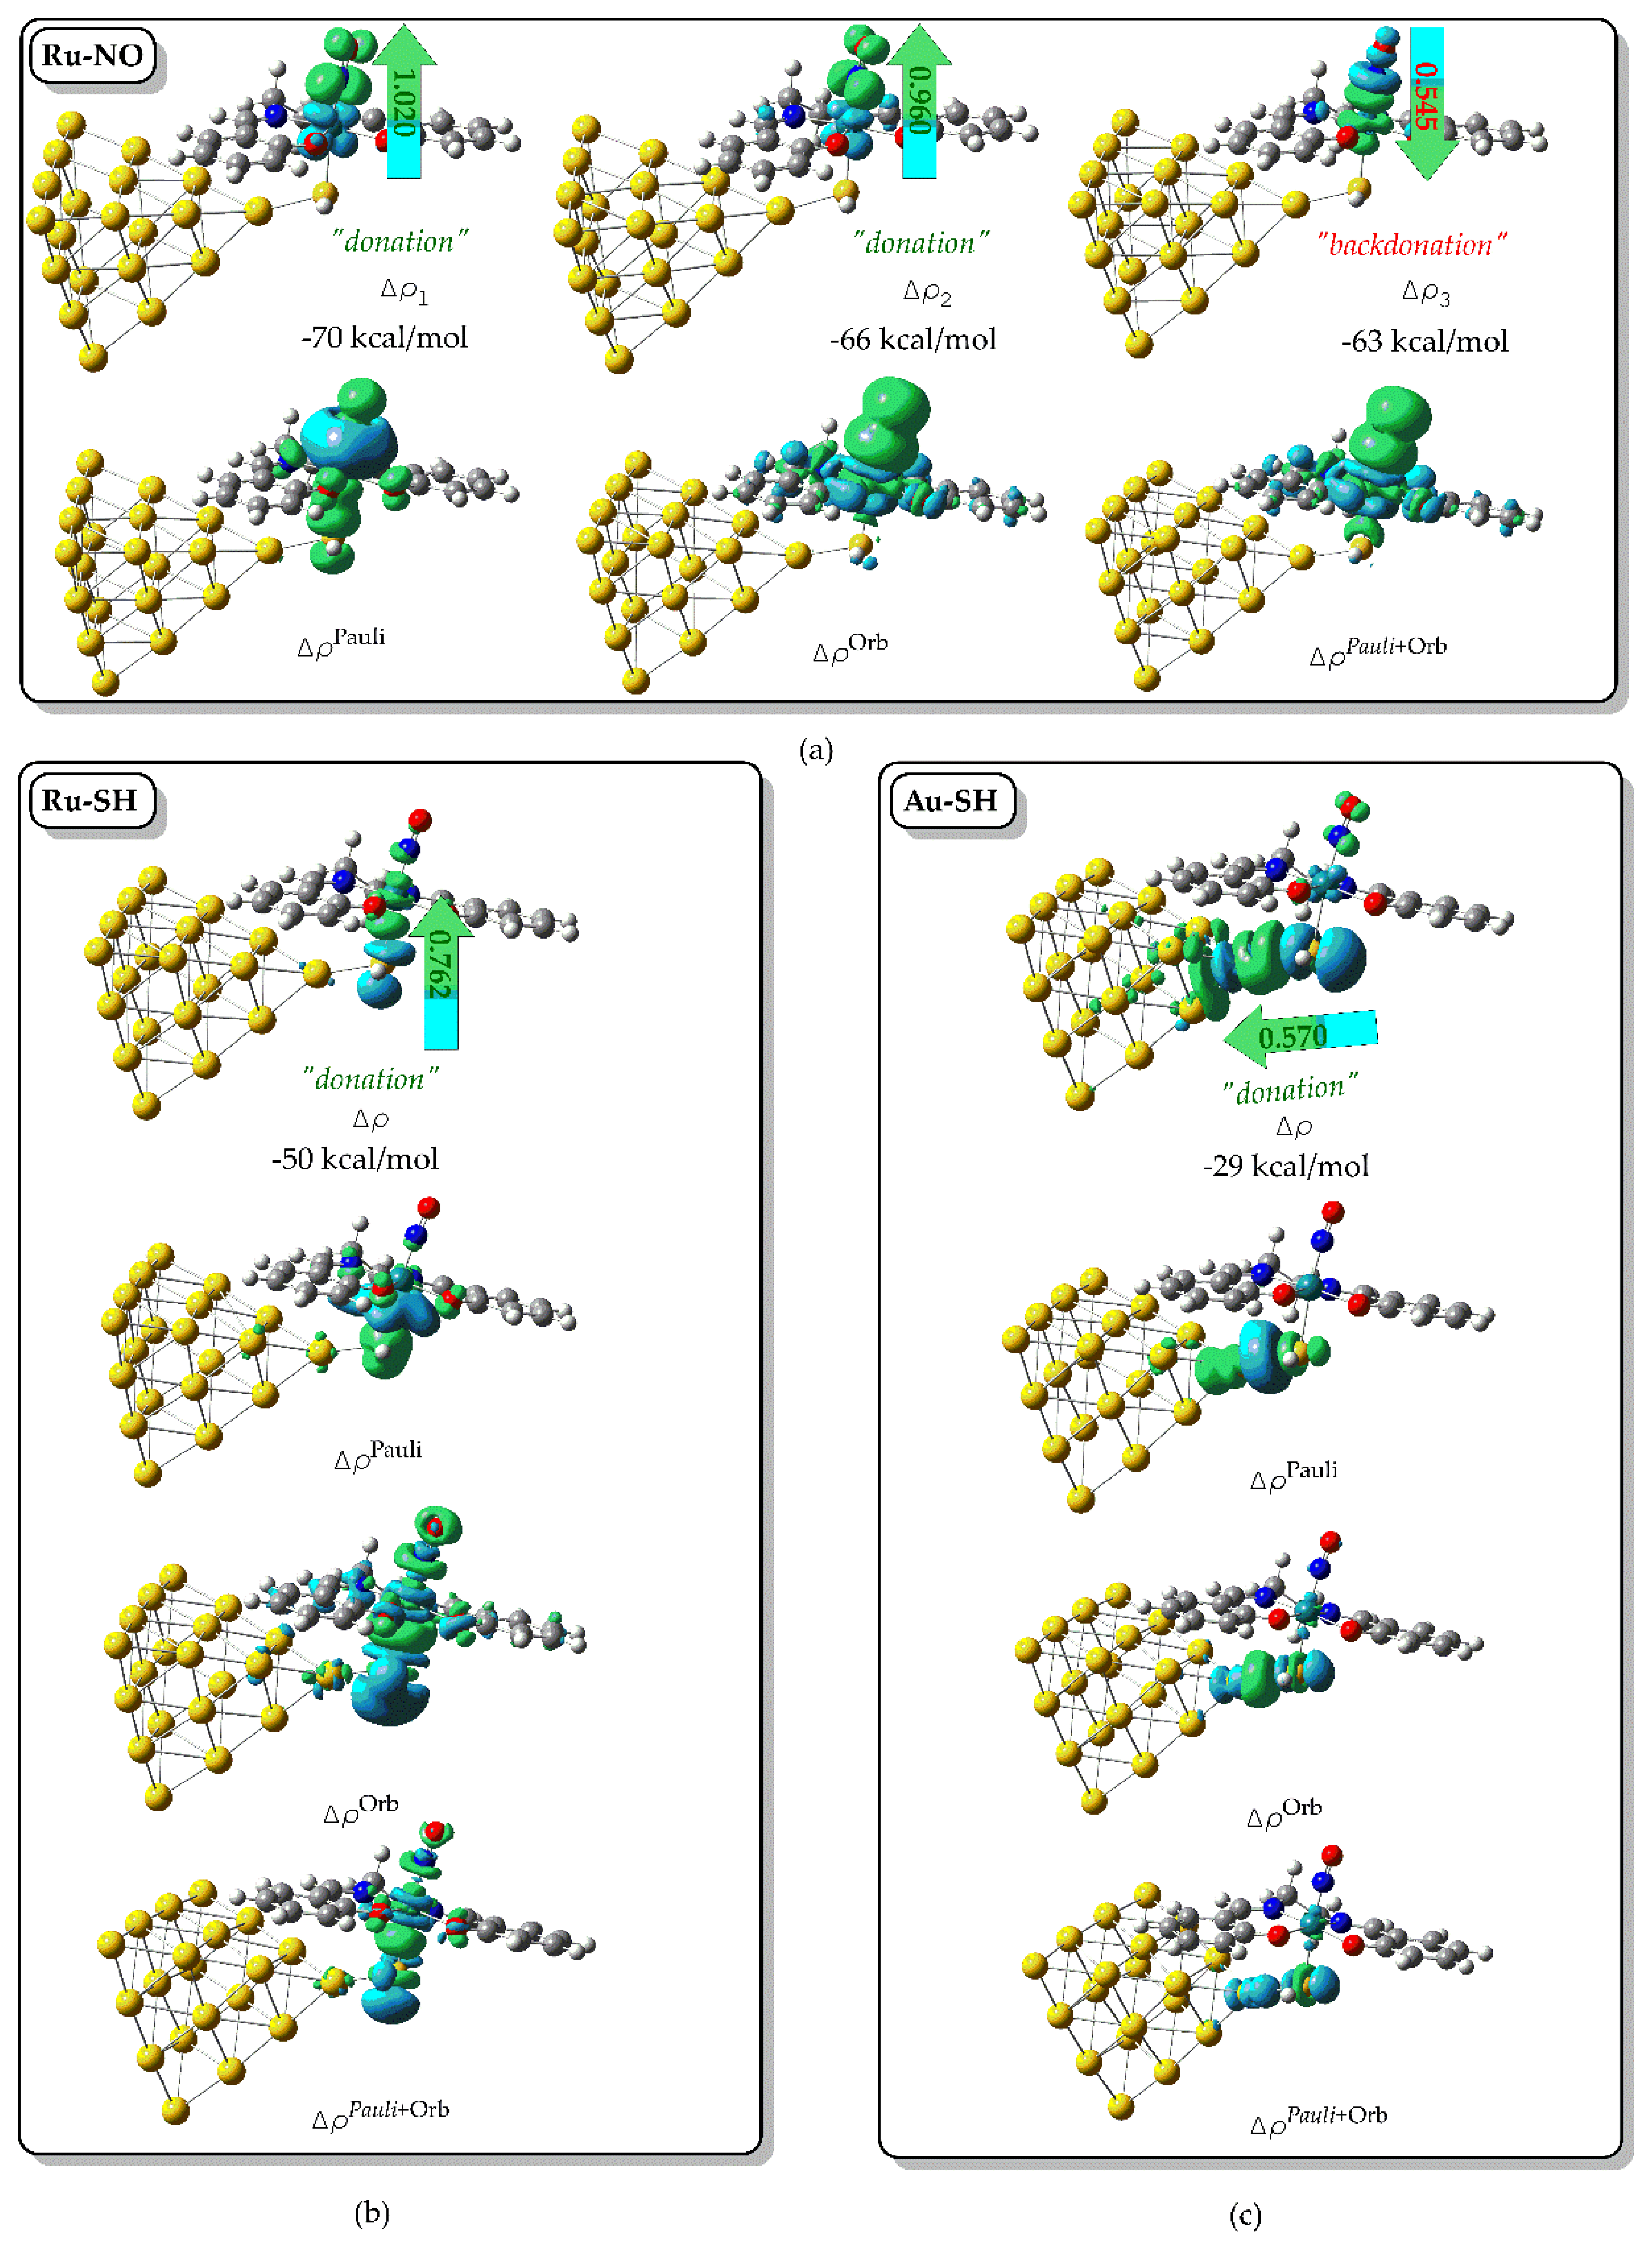
Figure 4.
Simulated absorption spectra of (a) [(Salen)Ru(NO)(SH)] (blue line), (b) [(bpb)Ru(NO)(SH)] (green line), (c) [(Porph)Ru(NO)(SH)] (red line) and (d) [(Pc)Ru(NO)(SH)] (black line) calculated at the PBE0/LanL2DZ(Ru)U6-31G(d,p)(E) level in water solvent.
Figure 4.
Simulated absorption spectra of (a) [(Salen)Ru(NO)(SH)] (blue line), (b) [(bpb)Ru(NO)(SH)] (green line), (c) [(Porph)Ru(NO)(SH)] (red line) and (d) [(Pc)Ru(NO)(SH)] (black line) calculated at the PBE0/LanL2DZ(Ru)U6-31G(d,p)(E) level in water solvent.
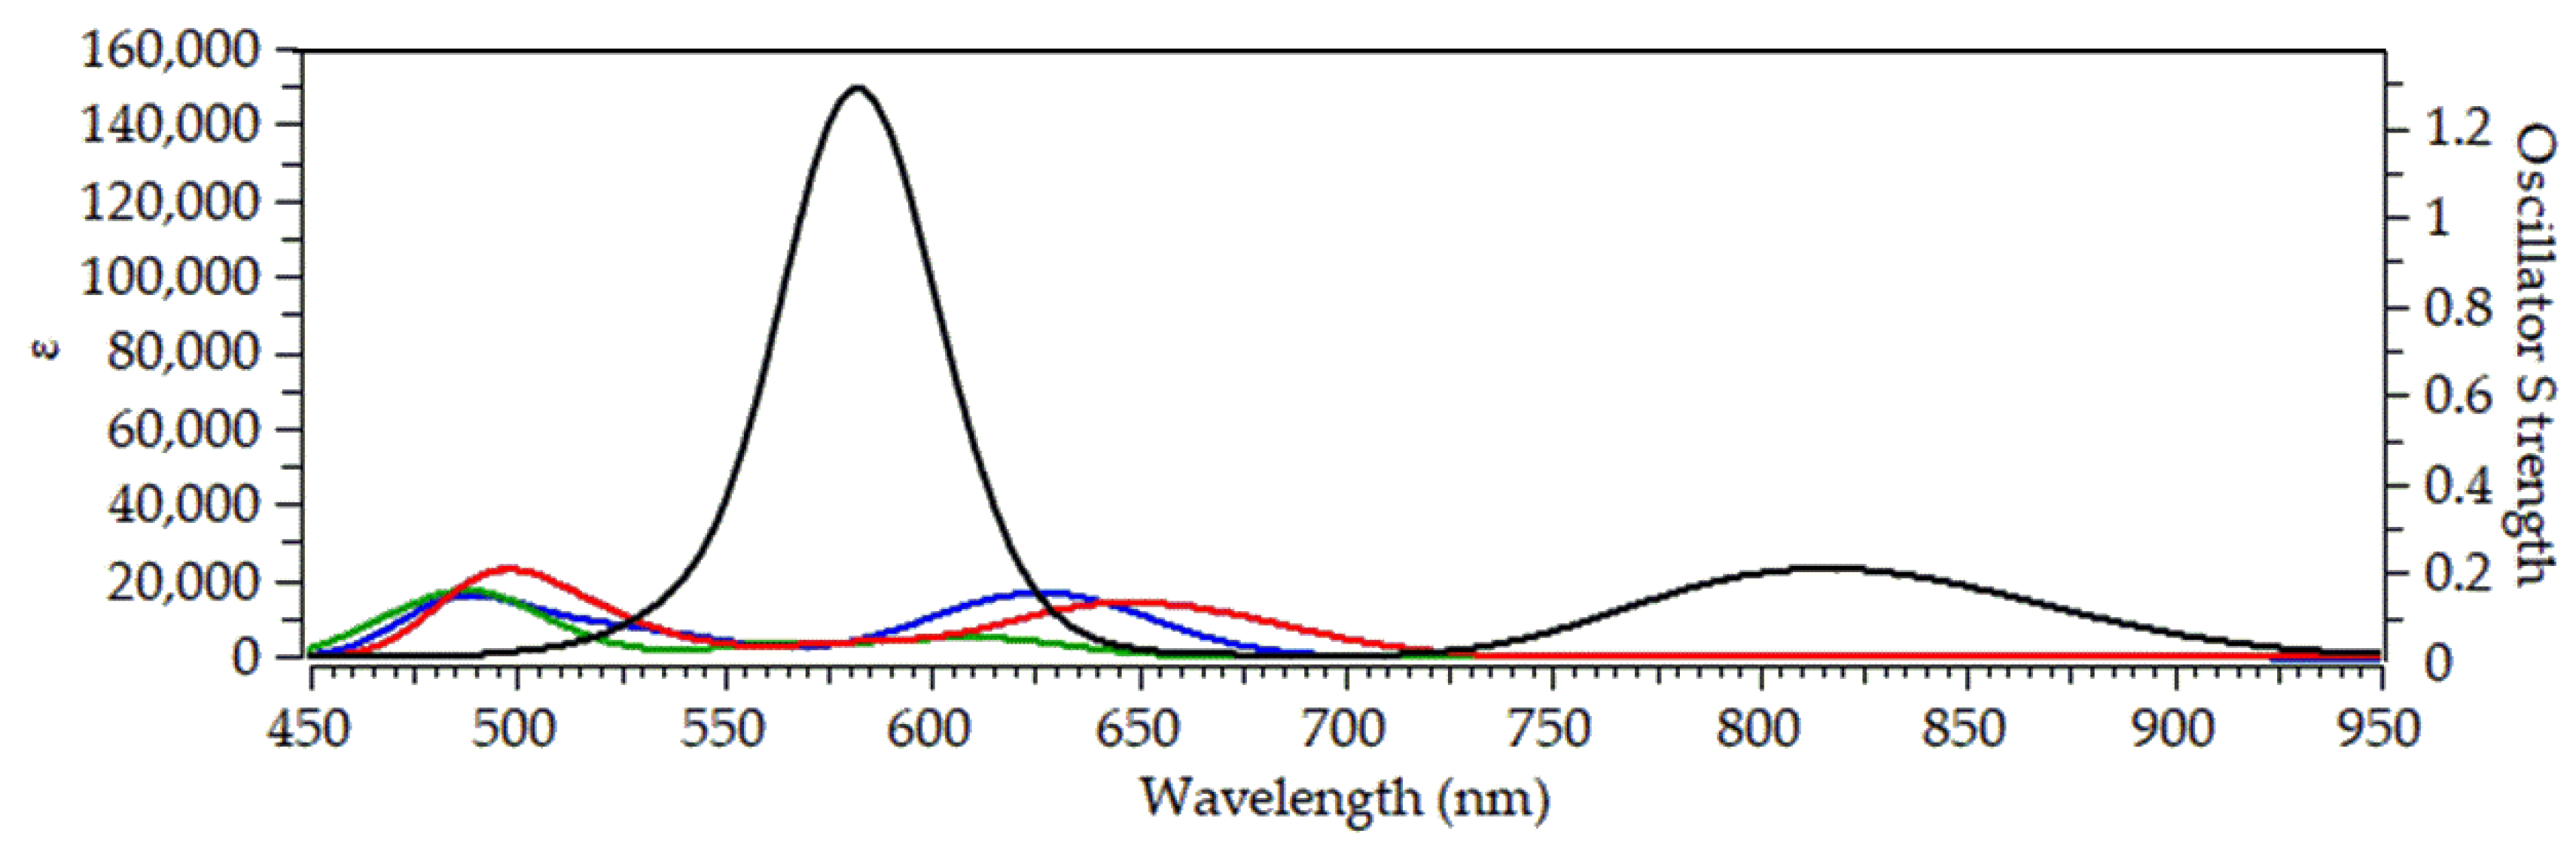

Table 1.
Natural Charges, Q and Wiberg Bond Indices, WBI derived from the NBO analysis on the [(L)Ru(NO)(SH)@Au₂₀] complexes at the PBE0/LanL2DZ(Ru)U6-31G(d,p)(E) level in water solvent.
Table 1.
Natural Charges, Q and Wiberg Bond Indices, WBI derived from the NBO analysis on the [(L)Ru(NO)(SH)@Au₂₀] complexes at the PBE0/LanL2DZ(Ru)U6-31G(d,p)(E) level in water solvent.
| Parameter | [(L)Ru(NO)(SH)@Au20] | |||
|---|---|---|---|---|
| L = Salen | L =bpb | L = porph | L = pc | |
| QRu | 0.695 | 0.582 | 0.597 | 0.552 |
| QN | 0.363 | 0.338 | 0.400 | 0.388 |
| QS | -0.474 | -0.446 | -0.452 | -0.441 |
| QAu | 0.065 | 0.061 | 0.083 | 0.059 |
| WBI(Ru-NO) | 1.242 | 1.216 | 1.252 | 1.204 |
| WBI(N-O) | 1.948 | 1.926 | 1.965 | 1.980 |
| WBI(Ru-S) | 0.485 | 0.481 | 0.479 | 0.493 |
| WBI(S-Au) | 0.272 | 0.265 | 0.266 | 0.246 |
Table 2.
NEDA energy components for selected bonds in the [(L)Ru(NO)(SH)@Au20] hybrid complexes. All values are given in kcal mol⁻¹.1.
Table 2.
NEDA energy components for selected bonds in the [(L)Ru(NO)(SH)@Au20] hybrid complexes. All values are given in kcal mol⁻¹.1.
| L | Bond | ES | POL | CT | XC | ΔE |
|---|---|---|---|---|---|---|
| Ru-N | -75.1 | -212.0 | -520.5 | -75.5 | -201.0 | |
| [(salen)Ru(NO)(SH)@Au20] | Ru-S | -119.6 | -130.7 | -161.6 | -67.6 | -96.7 |
| Au-S | -74.4 | -45.1 | -85.7 | -56.3 | -28.3 | |
| Ru-N | -95.7 | -187.5 | -525.2 | -76.5 | -202.0 | |
| [(bpb)Ru(NO)(SH)@Au20] | Ru-S | -127.0 | -128.0 | -165.3 | -66.9 | -102.2 |
| Au-S | -73.2 | -44.0 | -82.5 | -54.2 | -27.6 | |
| Ru-N | -79.2 | -220.7 | -521.7 | -78.2 | -195.8 | |
| [(porph)Ru(NO)(SH)@Au20] | Ru-S | -115.5 | -125.8 | -162.2 | -67.7 | -88.5 |
| Au-S | -74.4 | -47.9 | -85.1 | -56.9 | -27.4 | |
| Ru-N | -66.2 | -218.5 | -500.3 | -75.9 | -180.8 | |
| [(pc)Ru(NO)(SH)@Au20] | Ru-S | -119.1 | -139.6 | -184.9 | -75.2 | -93.5 |
| Au-S | -90.8 | -56.3 | -90.8 | -61.8 | -22.6 |
1 The Core (XC + deformation/self-exchange) component is not listed separately but is included in the reported ΔE values.
Table 3.
Selected photophysical parameters of the [(L)Ru(NO)(SH)@Au₂₀] complexes calculated at the PBE0/LanL2DZ(Ru)U6-31G(d,p)(E) level in water solvent.
Table 3.
Selected photophysical parameters of the [(L)Ru(NO)(SH)@Au₂₀] complexes calculated at the PBE0/LanL2DZ(Ru)U6-31G(d,p)(E) level in water solvent.
| Complex | λvib (eV) | E0-0 (nm) | ΔES0-T1 (nm) |
|---|---|---|---|
| [(salen)Ru(NO)(SH)@Au₂₀] | 0.790 | 1931 | 1733 |
| [(bpb)Ru(NO)(SH)@Au₂₀] | 0.837 | 1803 | 1643 |
| [(porph)Ru(NO)(SH)@Au₂₀] | 0.866 | 2232 | 1972 |
| [(pc)Ru(NO)(SH)@Au₂₀] | 0.760 | 3737 | 3010 |
Disclaimer/Publisher’s Note: The statements, opinions and data contained in all publications are solely those of the individual author(s) and contributor(s) and not of MDPI and/or the editor(s). MDPI and/or the editor(s) disclaim responsibility for any injury to people or property resulting from any ideas, methods, instructions or products referred to in the content. |
© 2025 by the authors. Licensee MDPI, Basel, Switzerland. This article is an open access article distributed under the terms and conditions of the Creative Commons Attribution (CC BY) license (http://creativecommons.org/licenses/by/4.0/).
Copyright: This open access article is published under a Creative Commons CC BY 4.0 license, which permit the free download, distribution, and reuse, provided that the author and preprint are cited in any reuse.


