
Submitted:
09 October 2025
Posted:
09 October 2025
You are already at the latest version
Abstract
Background/Objective: This study investigated the associations between dietary patterns and cognitive function among older Japanese adults and examined whether these associations differed according to sleep duration. Methods: This longitudinal cohort study was conducted using data from the Community Empowerment and Care study (2017–2020). Data were obtained from the Community Empowerment and Care Study of the T-Village, Aichi Prefecture, Japan. Latent class analysis was used to identify dietary patterns based on the intake frequencies of seven food groups. Logistic regression models assessed the associations between dietary patterns and cognitive function stratified by sleep duration (optimal: 7–8 h; unfavorable: <7 or >8 h). Results: The following three dietary patterns were identified: diverse, balanced, and restricted. Diverse (odds ratio [OR], 0.44) and balanced (OR, 0.39) diets were associated with lower odds of cognitive decline. Stratified analysis revealed stronger protective effects of these diets in those with unfavorable sleep. Conclusion: Dietary quality plays a key role in cognitive health and may be particularly beneficial for older adults with suboptimal sleep durations. The study findings underscore the need for integrated lifestyle interventions that target both nutrition and sleep in aging populations.
Keywords:
cognitive function
; dietary patterns
; sleep duration
; latent class analysis
; Japan
; older adults
; longitudinal study
1. Introduction
Cognitive decline in older adults is a critical concern because it undermines functional independence, reduces quality of life, and increases the need for long-term care services. It often coexists with physical frailty and tends to be more prevalent among those with lower income and education levels [1]. In addition to these sociodemographic risk factors, several modifiable contributors have been identified, including malnutrition, lack of physical activity, insufficient social interaction, and environmental stressors such as natural disasters [2,3,4,5]. These risks are especially concerning in aging societies, where a growing number of older adults live alone and face social isolation.
Mild cognitive impairment (MCI) is the early stage of cognitive decline that precedes the development of Alzheimer’s disease and other forms of dementia. Detecting and addressing MCI early offers an opportunity for preventive strategies to delay or halt its progression [6,7]. Evidence has increasingly pointed to the protective role of lifestyle factors in cognitive health, including dietary habits, physical activity, social engagement, and oral health [8,9]. Community-based interventions that combine multiple lifestyle domains have been shown to improve cognitive resilience and prolong independent living among older adults [10].
Japan is one of the most rapidly aging societies in the world. As of 2020, 29% of the country’s population was aged 65 years or older, and the percentage is projected to increase to 38.4% by 2065 [11]. This demographic shift has significant public health implications, particularly with regard to cognitive aging. Furthermore, the growing proportion of older adults is expected to increase the prevalence of age-related conditions such as dementia and frailty. Projections indicate that by 2043, nearly 29% of Japanese women aged 75 years or older with low educational attainment will live with both dementia and frailty, leading to a sharp increase in the demand for integrated care and contributing to a projected annual economic burden of over $125 billion for dementia alone [12]. In response to these challenges, the Japanese government initiated several public health strategies. These include promoting dementia-friendly communities, enhancing long-term care systems, and integrating social determinants of health into care planning [13]. However, the scale and complexity of age-related cognitive decline continue to outpace existing services, highlighting the need for scalable and evidence-based preventive approaches.
Among modifiable lifestyle factors, dietary patterns have gained increasing attention for their potential role in supporting cognitive functions. Adherence to the Mediterranean diet (MD) and the MIND diet (specifically designed to promote brain health by incorporating elements of both the MD and Dietary Approaches to Stop Hypertension diet), and greater dietary diversity are associated with better cognitive performance and a lower risk of cognitive decline. Meta-analyses have shown that the MD, characterized by a high consumption of vegetables, fruits, legumes, fish, and olive oil, is linked to improved global cognition and a reduced incidence of dementia [14,15]. The MIND diet has shown similarly positive results in Western and Asian cohorts [16,17,18].
Despite this growing body of evidence, most studies have been conducted in Western populations, leaving a notable research gap regarding traditional East Asian dietary patterns and their association with cognitive outcomes. This gap is important given the distinct food cultures in Asia, where staples such as soy products, fish, and green vegetables are common. Several observational studies have reported positive associations between these foods and cognitive function in older adults in Japan, China, and Taiwan [19,20,21]. These foods are rich in bioactive compounds (such as polyunsaturated fatty acids, isoflavones, and antioxidants) that may reduce inflammation and oxidative stress, both of which are implicated in cognitive decline. Moreover, emerging evidence suggests that whole-diet approaches, which capture the interactions among various nutrients, may offer better insights into diet–cognition relationships than those associated with single-nutrient analyses [22]. However, inconsistencies in the study design and outcome measures have led to mixed results, underscoring the need for more rigorous and culturally sensitive research [23].
Another increasingly recognized, yet underexplored, factor in cognitive health is sleep. A large body of epidemiological evidence has documented the U-shaped association between sleep duration and cognitive outcomes. Both short (<7 h) and long (>8 h) sleep durations have been linked to increased risks of cognitive impairment, cardiovascular disease, and mortality, whereas a sleep duration of 7–8 h is associated with the most favorable outcomes among older adults [24,25,26,27]. Sleep plays a vital role in memory consolidation, neural restoration, and metabolic regulation, and disrupted sleep may accelerate neurodegeneration [28]. In addition, recent studies have explored how sleep quality may mediate or moderate the effects of other lifestyle factors, such as diet, on cognitive function. For example, some evidence suggests that poor sleep may weaken the protective effects of good nutrition on cognition, emphasizing the need to consider the interactions between these factors [29].
Despite increasing awareness of the importance of diet and sleep, few longitudinal studies have examined their combined influence on cognitive health, particularly in Asian populations. Most existing research treats diet and sleep as independent variables, without exploring their potential synergistic or moderating effects. Furthermore, little is known regarding whether sleep duration alters the association between dietary patterns and cognitive function in older adults. These questions are particularly relevant in the Japanese context, where both dietary customs and sleep patterns differ from those of Western societies.
To address this research gap, this study aimed to identify the distinct dietary patterns among older adults in Japan, examine their associations with cognitive function, and explore whether these associations vary with sleep duration. Understanding how lifestyle factors interact may provide more effective and culturally relevant strategies for promoting cognitive health. This study offers an integrated, population-specific perspective that contributes novel evidence to the global discourse on aging and brain health.
2. Materials and Methods
2.1. Study Design and Data Source
This longitudinal study followed older adults living in the community between 2017 and 2020. Data were sourced from the “Community Empowerment and Care for Well-being and Healthy Longevity: Evidence from Cohort Study”, a project launched in 1991 aimed at uncovering factors influencing health and longevity in suburban populations [30]. The study was conducted in the T-Village, located in Aichi Prefecture, Japan, which is a suburban area with approximately 4,800 inhabitants. With an aging rate of 28.2% in 2017 and 28.5% in 2020, the village provides a suitable context for examining demographic shifts in areas undergoing rural-to-urban transitions.
All residents aged 65 years or older were invited to participate in the study. Self-administered questionnaires gathered information on sociodemographic characteristics, lifestyle behaviors, chronic illnesses, and social engagement. The surveys were distributed and collected through home visits by local personnel and volunteers, who also assisted participants requiring help with survey completion.
2.2. Participants and Procedure
The inclusion criteria were community-dwelling individuals aged 65 years or older. Participants were excluded if they showed cognitive decline or had missing data on cognitive function status and dietary behavior. The participant selection was as follows. From an initial sample of 1,089 older adults, 820 were retained at baseline after excluding those who showed cognitive decline (n = 189) or had missing data (n = 80). By the 2020 follow-up, 456 participants remained, with 364 lost to death, hospitalization, or relocation.
2.3. Measures
2.3.1. Dietary Patterns
Dietary behavior was evaluated using a food frequency questionnaire covering seven major food groups: vegetables, fruits, meat, fish, eggs, soy-based foods (such as tofu), and dairy products (such as milk and yogurt). Participants indicated how often they consumed each item during the past week by using a 6-point Likert scale: (1) “almost never,” (2) “1–2 days per week,” (3) “3–4 days per week,” (4) “almost every day,” (5) “once daily,” and (6) “three times daily.”
In accordance with the 2020 edition of the Japanese Dietary Reference Intakes and national nutrition guidelines [31], intake frequencies were recoded into two categories: frequent and infrequent. For vegetables, fruits, and dairy products, frequent intake was defined as consuming the item at least “almost every day” (i.e., responses 4–6), in line with daily consumption recommendations. For protein-rich foods, i.e., meat, fish, eggs, and soy products, frequent intake was defined as “3–4 days per week” or more (i.e., responses 3–6), reflecting national guidance on protein variety and realistic dietary practices. This binary classification was used to assess adherence to dietary standards, while accommodating typical consumption patterns.
2.3.2. Functional Status
Cognitive status was evaluated using three items derived from the Kihon Checklist, a validated simple questionnaire primarily used to assess the health status and functional abilities of older adults in preventive care. The checklist is widely implemented by local governments across Japan and aims to evaluate levels of independence in daily life and facilitate the early identification of potential health risks [32].
The participants were asked whether they (1) had been told by others that they often forget things, (2) could independently look up and dial phone numbers, and (3) occasionally forget the current day of the week. Responses were coded as 1 for indications of cognitive difficulty and 0 otherwise. A total score ranging from 0 to 3 was calculated, with a score of 1 or higher indicating signs of cognitive decline.
2.3.3. Sleep Duration
Self-reported questions were used to assess participants’ sleep duration. The participants were asked to report their average night sleep duration based on a single self-administered questionnaire item. According to their responses, sleep duration was classified into two categories: Those who reported sleeping for 7 to 8 h per night were assigned to the “optimal sleep duration” group, while those reporting sleep for less than 7 h or more than 8 h per night were categorized into the “unfavorable sleep duration” group.
2.3.4. Covariates
Several self-reported covariates were included to control for potentially confounding variables. These included the participants’ age, sex, body mass index (BMI), living status, physical activity, alcohol consumption, smoking habits, and the presence of chronic health conditions (hypertension, heart disease, diabetes, hyperlipidemia, lung disease, stomach/liver/gallbladder disorders, kidney disorders, musculoskeletal disorders, cancer, immune disease, depression, and eye and ear disorders.).
2.4. Statistical Analysis
Latent class analysis was conducted using Mplus version 8.3 (Muthén & Muthén, Los Angeles, CA, USA) to identify dietary patterns based on the frequency of intake across the seven food groups. Several model fit criteria were examined to determine the optimal number of latent classes, including the Akaike Information Criterion (AIC), Bayesian Information Criterion (BIC), and adjusted BIC (aBIC). Lower values of these indices suggested a better model fit. The Lo–Mendell–Rubin adjusted likelihood ratio test and bootstrap likelihood ratio test were applied to determine whether a model with k classes provided a significantly better fit than one with k – 1 classes. Additionally, entropy values, ranging from 0 to 1, were used to evaluate classification accuracy, with higher scores indicating greater distinction between classes.
Binary logistic regression analyses were performed using the IBM SPSS Statistics software (version 29.0; Armonk, NY, USA). to examine the association between dietary patterns and cognitive function, adjusting for potential confounding variables, such as age, sex, BMI, health behaviors, and chronic conditions. Odds ratios (ORs) and 95% confidence intervals (CIs) were also determined.
Finally, stratified analyses were conducted by sleep duration (optimal vs. unfavorable) to explore whether the relationship between dietary patterns and cognitive outcomes differed according to sleep status. This step allowed the assessment of the potential effect modification by sleep duration. A significance level of P < 0.05 was established for all analyses.
2.5. Ethical Consideration
This study was approved by the Institutional Review Board of the University of Tsukuba (approval no. 1331-7). The municipality supplied data under formal agreement, and all records were anonymized. In accordance with ethical procedures, residents were informed of the study and given the opportunity to decline participation.
3. Results
Table 1 shows the baseline characteristics of the 456 participants. A total of 70.6% were aged 65–74 years, whereas 29.4% were aged 75 years or older. Female participants comprised 52.9% of the sample, and male participants accounted for 47.1%. The BMI was normal in 72.6% of the participants and abnormal in 27.4%. The majority (93.0%) lived with others and 7.0% lived alone. In terms of lifestyle, 63.6% were physically active and 26.4% were inactive. Regarding alcohol consumption, 78.1% reported never drinking alcohol, and 21.9% reported drinking alcohol. With respect to smoking, 64.9% were non-daily smokers and 35.1% smoked daily. Finally, 82.2% reported at least one chronic disease, whereas 17.8% reported none.
Latent class analysis was conducted to identify dietary patterns, and the model fit indices are presented in Table 2. Among the tested models, the three-class solution demonstrated the most favorable balance of fit and interpretability, as reflected by lower AIC (3765.98) and aBIC (3787.80) values compared with the two-class model and significant Lo–Mendell–Rubin adjusted likelihood ratio test (p = 0.001) and bootstrap likelihood ratio test (p < 0.001) values. Although the four-class model showed a slightly lower AIC, its fit indices were less robust, and the five- and six-class models did not achieve statistical significance. An entropy value of 0.957 further supported the adequacy of the three-class classification. Based on these results, a three-class model was selected, comprising a diverse group characterized by a high probability of consuming all food categories, a balanced group with moderate consumption, and a restricted group with limited intake across food types (Figure 1).
Table 3 shows the bivariate associations between participant characteristics, dietary patterns, and cognitive function. Significant differences were observed in sex (p = 0.036), drinking status (p = 0.036), and dietary pattern (p < 0.001). A higher proportion of individuals in the diverse dietary group exhibited high cognitive function, whereas those in the restricted group were more likely to report low cognitive performance. Table 4 summarizes the results of multivariate logistic regression. After adjusting for covariates, both the diverse dietary pattern (OR = 0.44, 95% CI: 0.19–0.76, p < 0.001) and balanced dietary pattern (OR = 0.39, 95% CI: 0.19–0.82, p = 0.012) were found to be significantly associated with reduced odds of low cognitive function compared with the restricted group. No other baseline characteristics, including age, sex, BMI, or chronic disease status, reached statistical significance.
Table 5 summarizes the bivariate associations between baseline characteristics, dietary patterns, and cognitive function stratified by sleep duration. Among participants with optimal sleep, only dietary pattern showed a significant association with cognitive function (p < 0.001). In the unfavorable sleep group, significant differences were observed in age (p = 0.014), drinking status (p = 0.039), and dietary pattern (p < 0.001). Participants with diverse dietary patterns consistently demonstrated higher cognitive function across both sleep groups.
Table 6 presents analyses stratified by sleep duration. Among participants with optimal sleep, only the diverse dietary pattern group was significantly associated with better cognitive outcomes (OR = 0.63, 95% CI: 0.33–0.92, p < 0.001). In contrast, for those with unfavorable sleep duration, both a diverse dietary pattern (OR = 0.81, 95% CI: 0.26–0.91, p < 0.001) and balanced dietary pattern (OR = 0.59, 95% CI: 0.52–0.71, p = 0.014) were protective. Additionally, age emerged as a significant predictor only in the unfavorable sleep group (p = 0.016), suggesting that dietary quality may play a compensatory role in mitigating cognitive risks associated with inadequate sleep.
4. Discussion
This study identified three typical dietary patterns in older adults—diverse, balanced, and restricted—using latent class analysis and evaluated their associations with cognitive function, while also examining the moderating role of sleep duration. The results showed that participants with higher dietary quality had better cognitive outcomes, and that among those with insufficient sleep, dietary patterns had protective effects against cognitive decline. These findings offer new evidence for understanding the role of lifestyle factors in older adults’ cognitive health.
The diverse dietary pattern showed the strongest positive association with cognition, with the participants with this dietary pattern showing a markedly lower risk of poor cognitive function. Epidemiological studies have consistently indicated that adherence to diverse diets rich in fruits, vegetables, whole grains, and fish helps reduce the risk of mild cognitive impairment and dementia [33] and slows age-related cognitive decline [34]. The findings of this study are consistent with these results and further suggest that diverse diets are beneficial for older adults in China as well. The underlying mechanisms may involve the comprehensive nutritional support provided to the nervous system. Adequate intake of vitamins B and E, minerals, and polyunsaturated fatty acids supports neuronal energy metabolism and synaptic transmission, thereby promoting learning and memory [35]. Omega-3 fatty acids such as docosahexaenoic acid play a key role in maintaining hippocampal structure and cognitive function [36]. Moreover, diverse diets rich in antioxidants can reduce free radical damage and neuroinflammation, thereby slowing neurodegenerative processes [37].
The balanced dietary pattern also showed protective effects in this study. Compared with the restricted group, participants in the balanced group had a significantly lower risk of poor cognition. This is consistent with longitudinal studies on middle-aged and older adults, which found that the clustering of healthy dietary behaviors was strongly associated with slower cognitive decline [38,39]. Balanced diets provide a steady supply of essential nutrients and antioxidants while also supporting anti-inflammatory functions in the brain. These effects may also be mediated through the gut–brain axis. A balanced dietary structure helps maintain healthy gut microbiota, which in turn influences central nervous system function through short-chain fatty acid metabolism and neurotransmitter regulation [40]. Dysbiosis of gut microbiota has been linked to pathological changes in Alzheimer’s disease [41], further supporting the role of a balanced diet in cognitive protection.
A stratified analysis of sleep duration indicated that the protective effects of diet on cognition were moderated by sleep. Among the participants with adequate sleep, only those with a diverse diet were significantly associated with better cognitive outcomes. In contrast, both diverse and balanced diets were protective among participants with poor sleep. This finding suggests that a high-quality diet may exert compensatory effects during adverse sleep conditions. Previous research has shown that insufficient sleep can lead to amyloid accumulation and elevated oxidative stress, thereby impairing brain plasticity and memory [42]. Diets rich in antioxidants and anti-inflammatory components can mitigate these adverse effects [43], thereby lowering the risk of cognitive decline. The present findings provide population-level evidence for this compensatory role.
From a practical perspective, these results highlight the importance of promoting diverse and balanced diets in older adults. Such dietary patterns not only provide comprehensive nutrition but also may offer protection under high-risk conditions, such as insufficient sleep. Public health strategies should integrate dietary- and sleep-related factors into comprehensive interventions to delay cognitive decline and reduce the burden of dementia.
Despite providing new evidence on the relationship between diet, sleep, and cognitive function, this study has some limitations. First, the use of self-reported dietary and lifestyle data may have introduced recall or reporting bias. Second, although a longitudinal design was used, causality could not be fully established, important potential confounders such as educational attainment, socioeconomic status, and social interaction, may still influence the results. Finally, the sample consisted primarily of health-conscious volunteers, which may limit generalizability.
Future research should integrate refined assessments to enhance accuracy, and incorporate other confounding factors such as social interaction and economic status to support a more comprehensive framework for understanding cognitive health.
5. Conclusions
This 3-year longitudinal study showed that diverse and balanced dietary patterns were associated with better cognitive outcomes in older adults, with sleep duration moderating these relationships. These findings highlight the potential of diet quality in mitigating cognitive risks, particularly under conditions of insufficient sleep. These results underscore the importance of promoting culturally appropriate evidence-based lifestyle interventions that integrate dietary improvements with sleep health strategies to support cognitive function in aging populations.
Author Contributions
JZ: Investigation, Data curation, Conceptualization, Methodology, Formal analysis, Writing-original draft, and Writing-review & editing. MQ, SL, RZ, and DJ: Investigation, Data curation, and Writing-review & editing. MC, YS, and AK: Investigation and Writing-review & editing. TA: Project administration, Supervision, Funding acquisition, Writing-review & editing.
Funding
This work was supported by JST SPRING (Grant Number, JPMJSP2124). The funders had no role in the design of the study; in the collection, analyses, or interpretation of data; in the writing of the manuscript; or in the decision to publish the results.
Institutional Review Board Statement
The study was conducted in accordance with the Declaration of Helsinki and approved by the Ethics Committee of the University of Tsukuba (No. 1331-7, August 29, 2025).
Informed Consent Statement
The requirement of written informed consent was waived according to the Ethical Guidelines for Medical and Health Research Involving Human Subjects in Japan.
Data Availability Statement
Not applicable.
Acknowledgments
We are grateful to all the participants and research members for their participation in this study.
Conflicts of Interest
The authors declare no conflicts of interest.
Abbreviations
The following abbreviations are used in this manuscript:
| OR | Odds ratio |
| CI | Confidence interval |
| MD | Mediterranean diet |
| MCI | Mild cognitive impairment |
| BMI | Body mass index |
| AIC | Akaike Information Criterion |
| BIC | Bayesian Information Criterion |
| MIND | Mediterranean diet combined with the Dietary Approaches to Stop Hypertension diet |
References
- Okamoto S. Socioeconomic factors and the risk of cognitive decline among the elderly population in Japan. Int J Geriatr Psychiatry. 2019;34:265-71. [CrossRef]
- Nishiguchi S, Yamada M, Fukutani N, Adachi D, Tashiro Y, Hotta T, et al. Differential association of frailty with cognitive decline and sarcopenia in community-dwelling older adults. J Am Med Dir Assoc. 2015;16:120-4. [CrossRef]
- Katayama O, Lee S, Bae S, Makino K, Shinkai Y, Chiba I, et al. Lifestyle activity patterns related to physical frailty and cognitive impairment in urban community-dwelling older adults in Japan. J Am Med Dir Assoc. 2021;22:583-9. [CrossRef]
- Yu R, Wang L, Liu Y, Hu Y, Zheng Z, Wang X, et al. Dual challenges in the context of healthy aging: A comprehensive exploration of the association between malnutrition and cognitive decline in disabled elderly. Aging Dis. 2025. [CrossRef]
- Yoshida S, Kashima S, Matsumoto M. The effect of the 2018 Japan Floods on cognitive decline among long-term care insurance users in Japan: a retrospective cohort study. Environ Health Prev Med. 2021;26:113. [CrossRef]
- Whitty E, Mansour H, Aguirre E, Palomo M, Charlesworth G, Ramjee S, et al. Efficacy of lifestyle and psychosocial interventions in reducing cognitive decline in older people: systematic review. Ageing Res Rev. 2020;62:101113. [CrossRef]
- Iadecola C, Duering M, Hachinski V, Joutel A, Pendlebury S, Schneider J, et al. Vascular cognitive impairment and dementia: JACC scientific expert panel. J Am Coll Cardiol. 2019;73:3326-44.
- Dominguez L, Veronese N, Vernuccio L, Catanese G, Inzerillo F, Salemi G, et al. Nutrition, physical activity, and other lifestyle factors in the prevention of cognitive decline and dementia. Nutrients. 2021;13:4080. [CrossRef]
- Hatta K, Gondo Y, Kamide K, Masui Y, Inagaki H, Nakagawa T, et al. Occlusal force predicted cognitive decline among 70- and 80-year-old Japanese: A 3-year prospective cohort study. J Prosthodont Res. 2020;64:175-81. [CrossRef]
- Song P, Tang W. The community-based integrated care system in Japan: health care and nursing care challenges posed by super-aged society. BioSci Trends. 2019;13:279-81. [CrossRef]
- Liu Y, Kobayashi S, Karako K, Song P, Tang W. The latest policies, practices, and hotspots in research in conjunction with the aging of Japan's population. BioSci Trends. 2024;18:219-23. [CrossRef]
- Kasajima M, Eggleston K, Kusaka S, Matsui H, Tanaka T, Son B, et al. Projecting prevalence of frailty and dementia and the economic cost of care in Japan from 2016 to 2043: a microsimulation modelling study. Lancet Public Health. 2022;7:e458-68. [CrossRef]
- Nakatani H. Population aging in Japan: policy transformation, sustainable development goals, universal health coverage, and social determinates of health. Glob Health Med. 2019;1:3-10. [CrossRef]
- Petersson S, Philippou E. Mediterranean diet, cognitive function, and dementia: A systematic review of the evidence. Adv Nutr. 2016;7:889-904. [CrossRef]
- Loughrey D, Lavecchia S, Brennan S, Lawlor B, Kelly M. The impact of the Mediterranean diet on the cognitive functioning of healthy older adults: A systematic review and meta-analysis. Adv Nutr. 2017;8:571-86. [CrossRef]
- Huang L, Tao Y, Chen H, Chen X, Shen J, Zhao C, et al. Mediterranean-Dietary Approaches to Stop Hypertension intervention for neurodegenerative delay (MIND) diet and cognitive function and its decline: A prospective study and meta-analysis of cohort studies. Am J Clin Nutr. 2023;118:174-82. [CrossRef]
- Kheirouri S, Alizadeh M. MIND diet and cognitive performance in older adults: a systematic review. Crit Rev Food Sci Nutr. 2022;62:8059-77. [CrossRef]
- Boumenna T, Scott TM, Lee JS, Zhang X, Kriebel D, Tucker KL, et al. MIND diet and cognitive function in Puerto Rican older adults. J Gerontol A Biol Sci Med Sci. 2022;77:605-13. [CrossRef]
- Okubo H, Inagaki H, Gondo Y, Kamide K, Ikebe K, Masui Y, et al. Association between dietary patterns and cognitive function among 70-year-old Japanese elderly: a cross-sectional analysis of the SONIC study. Nutr J. 2017;16:56. [CrossRef]
- Feng Y, Wang J, Zhang R, Wang Y, Wang J, Meng H, et al. Mediterranean diet related to 3-year incidence of cognitive decline: results from a cohort study in Chinese rural elders. Nutr Neurosci. 2024;27:1351-62. [CrossRef]
- Lin H, Peng C, Huang C, Chiou J. Soy-based foods are negatively associated with cognitive decline in Taiwan's elderly. J Nutr Sci Vitaminol (Tokyo). 2018;64:335-9. [CrossRef]
- Gutierrez L, Folch A, Rojas M, Cantero J, Atienza M, Folch J, et al. Effects of nutrition on cognitive function in adults with or without cognitive impairment: A systematic review of randomized controlled clinical trials. Nutrients. 2021;13:3728. [CrossRef]
- Tingö L, Bergh C, Rode J, Rubio M, Persson J, Johnson L, et al. The effect of whole-diet interventions on memory and cognitive function in healthy older adults – A systematic review. Adv Nutr. 2024;15:100291. [CrossRef]
- Hirshkowitz M, Whiton K, Albert S, Alessi C, Bruni O, Doncarlos L, et al. National Sleep Foundation’s updated sleep duration recommendations: Final report. Sleep Health. 2015;1:233-43. [CrossRef]
- Chaput J, Dutil C, Featherstone R, Ross R, Giangregorio L, Saunders T, et al. Sleep duration and health in adults: an overview of systematic reviews. Appl Physiol Nutr Metab = Appl Physiol Nutr Metab. 2020;45 (Suppl 2):S218-31. [CrossRef]
- Li J, Cao D, Huang Y, Chen Z, Wang R, Dong Q, et al. Sleep duration and health outcomes: an umbrella review. Sleep Breath. 2022;26:1479-501. [CrossRef]
- Kwok C, Kontopantelis E, Kuligowski G, Gray M, Muhyaldeen A, Gale C, et al. Self-reported sleep duration and quality and cardiovascular disease and mortality: A dose-response meta-analysis. J Am Heart Assoc. 2018;7:e008552.
- West R, Wong RTC, Park JE, Lee SW, Ekanayake Mudiyanselage D, Liu Z, et al. Sleep duration, chronotype, health and lifestyle factors affect cognition: a UK Biobank cross-sectional study. BMJ Public Health. 2024;2:e001000. [CrossRef]
- Xu X, Meng L, Wang Y, Luo Y, Dong M, Mo B, et al. Pathway linking nutritional status to cognitive function in older adults with chronic diseases: exploring the mediating role of sleep quality. Geriatr Nurs. 2025;62:122-8. [CrossRef]
- Anme T. Community empowerment and care for well-being and healthy longevity: evidence from cohort study (CEC); 2015. http://plaza.umin.ac.jp/~empower/cec/en/. Accessed September 21, 2025.
- Ministry of Health, Labour and Welfare of Japan. Dietary reference intakes for Japanese, 2020. Daiichi Shuppan; 2020. https://www.mhlw.go.jp/content/10904750/000586553.pdf.
- Satake S, Senda K, Hong Y, Miura H, Endo H, Sakurai T, et al. Validity of the Kihon Checklist for assessing frailty status. Geriatr Gerontol Int. 2016;16:709-15. [CrossRef]
- Wengreen H, Munger R, Cutler A, Quach A, Bowles A, Corcoran C, et al. Prospective study of Dietary Approaches to Stop Hypertension- and Mediterranean-style dietary patterns and age-related cognitive change: the Cache County Study on Memory, Health and Aging. Am J Clin Nutr. 2013;98:1263-71. [CrossRef]
- Singh B, Parsaik A, Mielke M, Erwin P, Knopman D, Petersen R, et al. Association of Mediterranean diet with mild cognitive impairment and Alzheimer's disease: A systematic review and meta-analysis. J Alzheimers Dis. 2014;39:271-82. [CrossRef]
- Gómez-Pinilla F. Brain foods: the effects of nutrients on brain function. Nat Rev Neurosci. 2008;9:568-78. [CrossRef]
- Yurko-Mauro K, McCarthy D, Rom D, Nelson E, Ryan A, Blackwell A, et al. Beneficial effects of docosahexaenoic acid on cognition in age-related cognitive decline. Alzheimers Dement. 2010;6:456-64. [CrossRef]
- Joseph J, Shukitt-Hale B, Casadesus G. Reversing the deleterious effects of aging on neuronal communication and behavior: beneficial properties of fruit polyphenolic compounds. Am J Clin Nutr. 2005;81 Suppl: Suppl:313S-6S. [CrossRef]
- Kesse-Guyot E, Andreeva V, Lassale C, Hercberg S, Galan P. Clustering of midlife lifestyle behaviors and subsequent cognitive function: a longitudinal study. Am J Public Health. 2014;104:e170-7. [CrossRef]
- Tangney C, Li H, Wang Y, Barnes L, Schneider J, Bennett D, et al. Relation of DASH- and Mediterranean-like dietary patterns to cognitive decline in older persons. Neurology. 2014;83:1410-6. [CrossRef]
- Cryan J, O'Riordan K, Sandhu K, Peterson V, Dinan T. The gut microbiome in neurological disorders. Lancet Neurol. 2019;19:179-94. [CrossRef]
- Shen L, Liu L, Ji H. Alzheimer’s disease histological and behavioral manifestations in transgenic mice correlate with specific gut Microbiome State. J Alzheimers Dis. 2017;56:385-90. [CrossRef]
- Winer J, Deters K, Kennedy G, Jin M, Goldstein-Piekarski A, Poston K, et al. Association of short and long sleep duration with amyloid-β burden and cognition in aging. JAMA Neurol. 2021;78:1187-96. [CrossRef]
- Rudrapal M, Khairnar S, Khan J, Dukhyil A, Ansari M, Alomary M, et al. Dietary polyphenols and their role in oxidative stress-induced human diseases: insights into protective effects, antioxidant potentials and mechanism(s) of action. Front Pharmacol. 2022;13:806470. [CrossRef]
Figure 1.
Three-class model for dietary patterns.
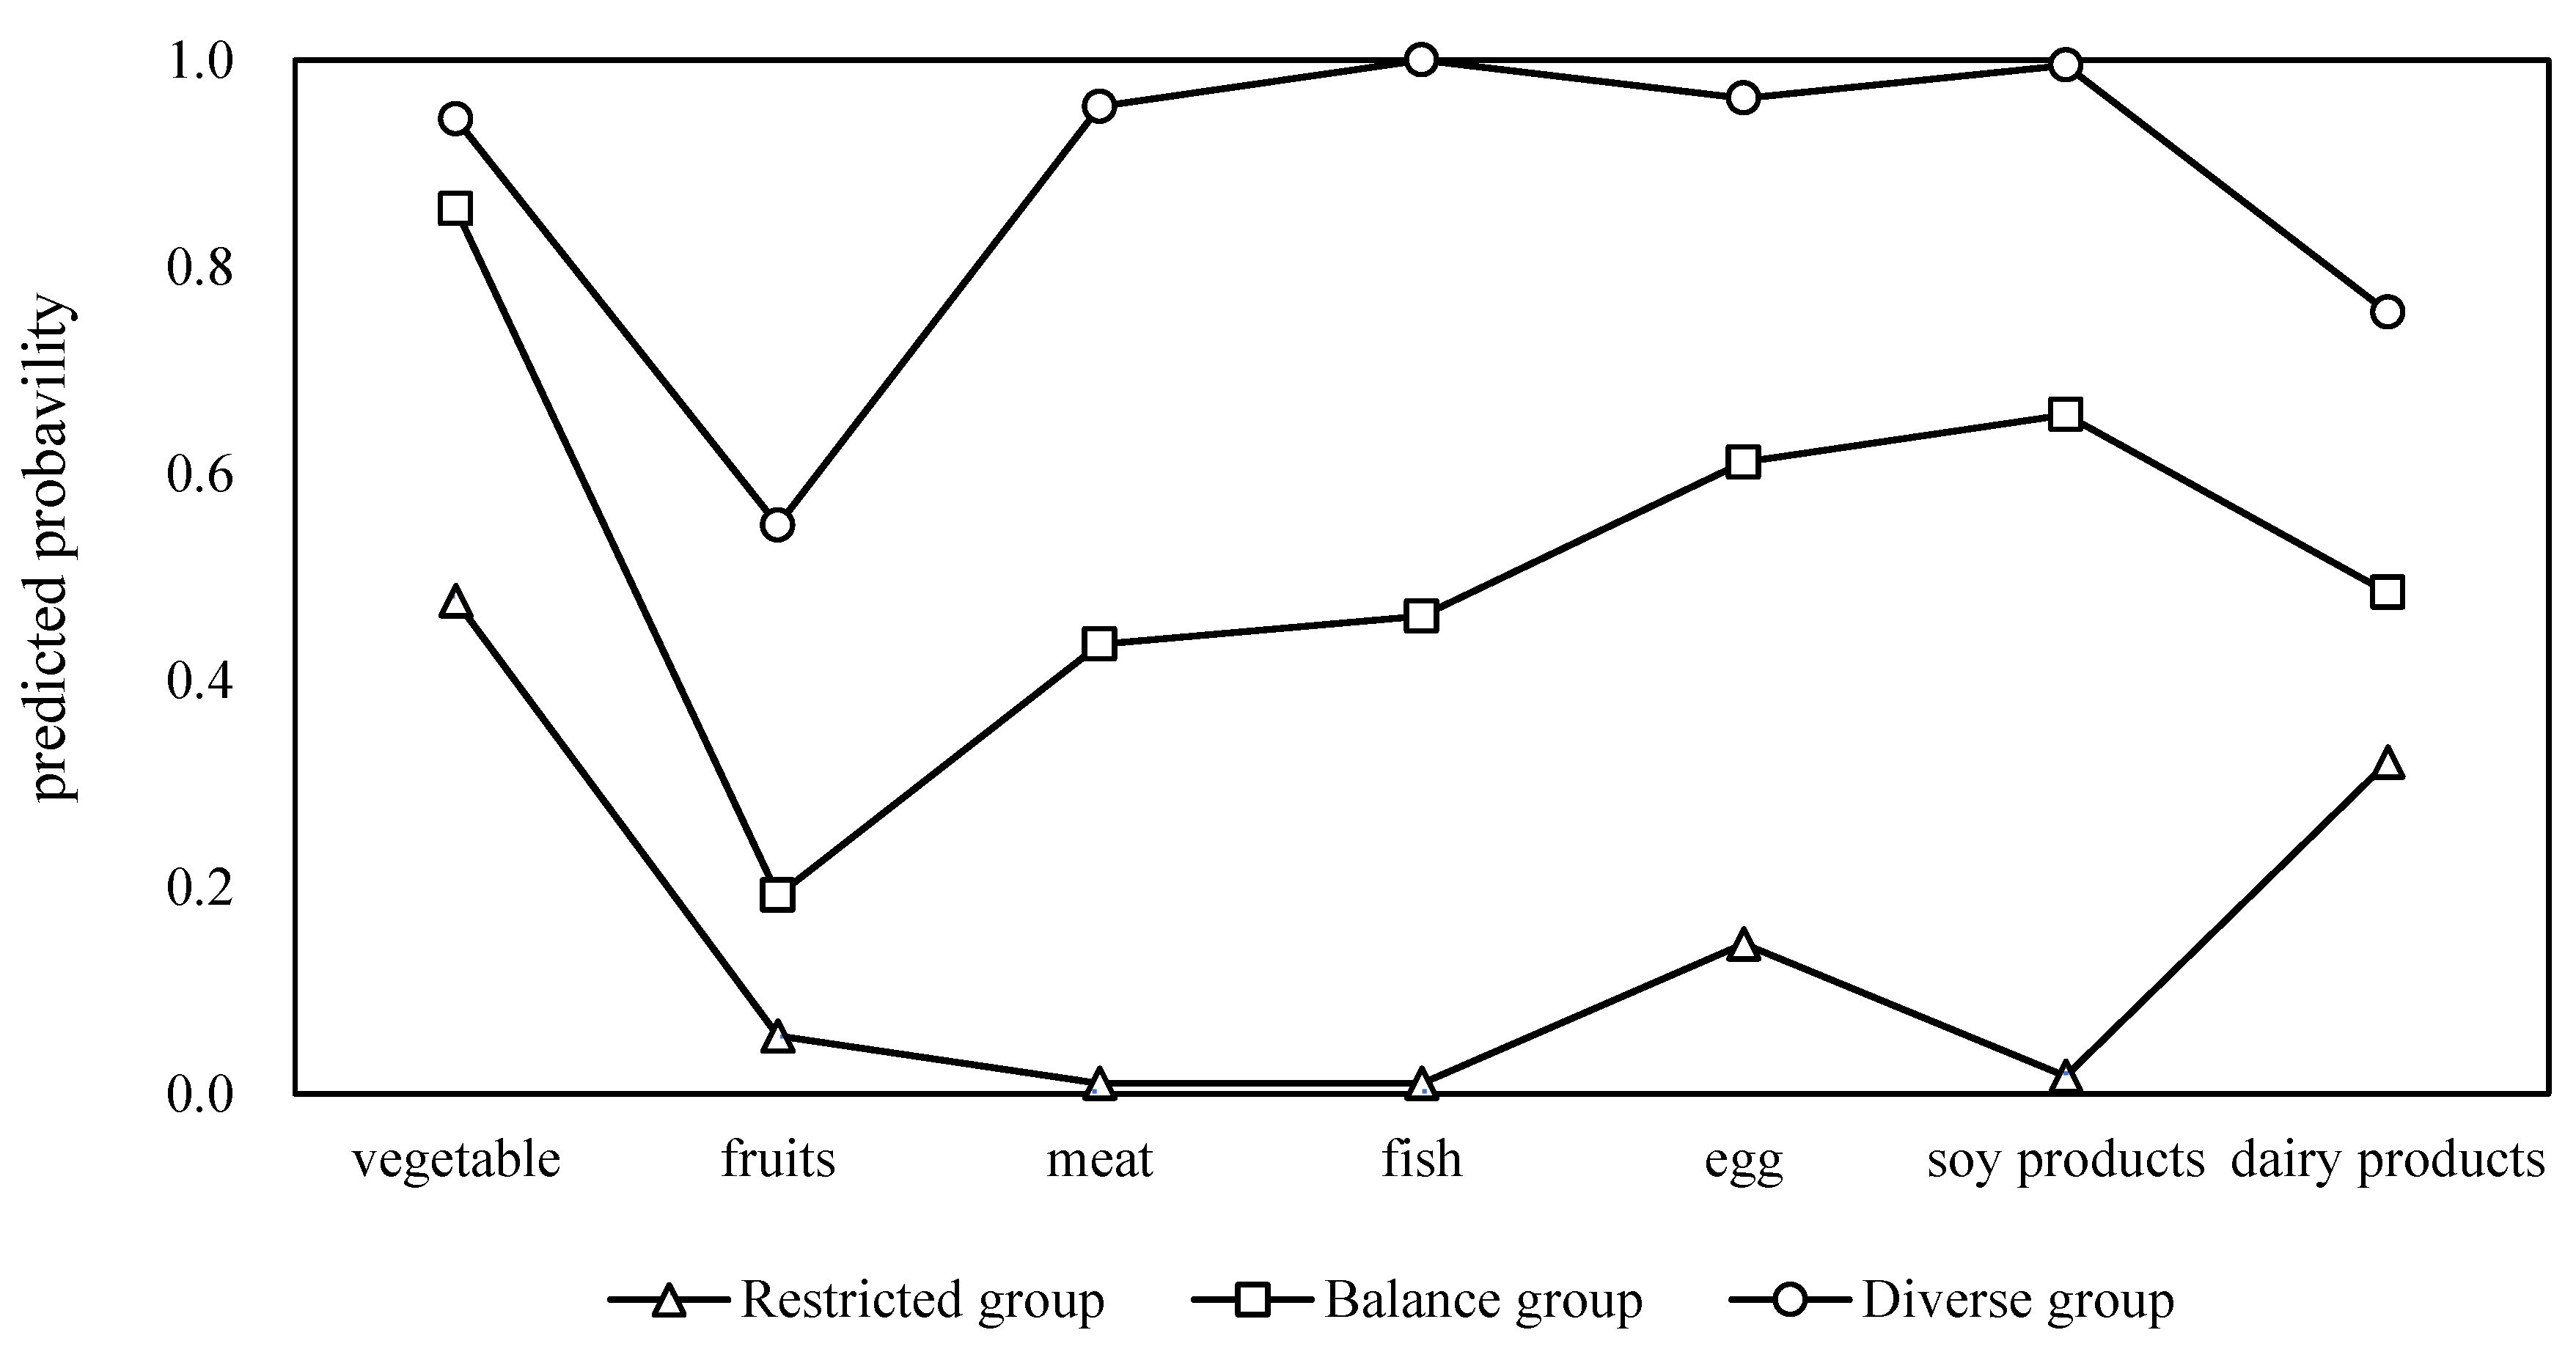

Table 1.
Baseline characteristics of the participants (N = 456).
| Variable | Category | n (%) |
| Age, years | 65-74 | 322 (70.6) |
| ≥75 | 134 (29.4) | |
| Sex | Male | 215 (47.1) |
| Female | 241 (52.9) | |
| BMI | Normal | 331 (72.6) |
| Abnormal | 125 (27.4) | |
| Living status | With others | 424 (93.0) |
| Alone | 32 (7.0) | |
| Exercise | Active | 290 (63.6) |
| Inactive | 166 (26.4) | |
| Drinking | Non-daily | 356 (78.1) |
| Daily | 100 (21.9) | |
| Smoking | Never | 296 (64.9) |
| Smoker | 160 (35.1) | |
| Chronic diseases | 0 | 81 (17.8) |
| ≥1 | 375 (82.2) |
BMI: body mass index.
Table 2.
Latent class model of dietary patterns.
| No. of classes | AIC | BIC | aBIC | LMRT P-value | Entropy | BLRT |
| 2 | 3806.88 | 3868.72 | 3821.11 | <0.001 | 0.850 | 0.000 |
| 3 | 3765.98 | 3860.80 | 3787.80 | 0.001 | 0.957 | 0.000 |
| 4 | 3745.23 | 3876.03 | 3777.65 | 0.043 | 0.927 | 0.088 |
| 5 | 3750.07 | 3910.84 | 3787.07 | 0.308 | 0.892 | 0.600 |
| 6 | 3755.97 | 3949.73 | 3800.56 | 0.446 | 0.825 | 0.667 |
AIC, Akaike information criterion; BIC, Bayesian information criterion; aBIC, adjusted Bayesian information criterion; BLRT, bootstrap likelihood ratio test; LMRT, Lo–Mendell–Rubin likelihood ratio test.
Table 3.
Bivariate analysis of baseline characteristics, dietary pattern, and cognitive function.
| High | Low | ||||||
| Items | Categories | n (%) | n (%) | X2 | P-value | ||
| Age, years | 65-74 | 130 (67.4) | 192 (73.0) | 1.710 | 0.115 | ||
| ≥75 | 63 (32.6) | 71 (27.0) | |||||
| Sex | Male | 81 (42.0) | 134 (51.0) | 3.604 | 0.036 | ||
| Female | 112 (58.0) | 129 (49.0) | |||||
| BMI | Normal | 144 (74.6) | 187 (71.1) | 0.689 | 0.235 | ||
| Abnormal | 49 (25.4) | 76 (28.9) | |||||
| Living status | With others | 177 (91.7) | 247 (93.9) | 0.831 | 0.233 | ||
| Alone | 16 (8.3) | 16 (6.1) | |||||
| Exercise | Active | 123 (63.7) | 167 (63.5) | 0.003 | 0.519 | ||
| Inactive | 70 (36.3) | 96 (36.5) | |||||
| Drinking | Non-daily | 159 (82.4) | 197 (74.9) | 3.636 | 0.036 | ||
| Daily | 34 (17.6) | 66 (25.1) | |||||
| Smoking | Never | 127 (65.8) | 169 (64.3) | 0.117 | 0.405 | ||
| Smoker | 66 (34.2) | 94 (35.7) | |||||
| Chronic diseases | 0 | 34 (17.6) | 47 (17.9) | 0.005 | 0.523 | ||
| ≥1 | 159 (82.4) | 216 (82.1) | |||||
| Dietary pattern | Diverse group | 130 (57.0) | 157 (73.4) | 6.012 | <0.001 | ||
| Balance group | 50 (36.3) | 59 (7.6) | |||||
| Restricted group | 13 (6.7) | 47 (19.0) |
BMI: body mass index.
Table 4.
Association among baseline characteristics, dietary patterns, and cognitive function.
| Predictor | OR [95% CI] | P-value |
| Dietary pattern [Diverse] | 0.44 [0.19, 0.76] | <0.001 |
| Dietary pattern [Balance] | 0.39 [0.19, 0.82] | 0.012 |
| Age | 0.78 [0.49, 1.25] | 0.295 |
| Sex | 0.66 [0.36, 1.20] | 0.171 |
| BMI | 0.98 [0.62, 1.59] | 0.960 |
| Living status | 0.70 [0.30, 1.63] | 0.409 |
| Exercise | 0.99 [0.63, 1.54] | 0.953 |
| Smoking | 1.29 [0.74, 2.27] | 0.368 |
| Drinking | 0.66 [0.36, 1.22] | 0.182 |
| Diseases | 1.02 [0.58, 1.76] | 0.948 |
Logistic regression analysis; BMI: body mass index.
Table 5.
Bivariate analysis of baseline characteristics, dietary pattern, and cognitive function stratified by sleep duration.
Table 5.
Bivariate analysis of baseline characteristics, dietary pattern, and cognitive function stratified by sleep duration.
|
Optimal sleep duration |
Unfavorable sleep duration |
||||||||
| Items | Categories | High | Low | X2 | P-value | High | Low | X2 | P-value |
| Age | 65-74 | 81 (75.0) | 92 (73.0) | 0.119 | 0.423 | 49 (57.6) | 100 (73.0) | 5.597 | 0.014 |
| ≥75 | 27 (25.0) | 34 (27.0) | 36 (42.4) | 37 (27.0) | |||||
| Sex | Male | 47 (43.5) | 69 (54.8) | 2.941 | 0.057 | 34 (40.0) | 65 (47.4) | 1.177 | 0.172 |
| Female | 61 (56.5) | 57 (45.2) | 51 (60.0) | 72 (52.6) | |||||
| BMI | Normal | 79 (73.1) | 87 (69.0) | 0.474 | 0.294 | 65 (76.5) | 100 (73.0) | 0.332 | 0.340 |
| Abnormal | 29 (26.9) | 39 (31.0) | 20 (23.5) | 37 (27.0) | |||||
| Living status | With others | 102 (94.4) | 120 (95.2) | 0.075 | 0.506 | 75 (88.2) | 127 (92.7) | 1.276 | 0.186 |
| Alone | 6 (5.6) | 6 (4.8) | 10 (11.8) | 10 (7.3) | |||||
| Exercise | Active | 64 (59.3) | 85 (67.5) | 1.691 | 0.122 | 59 (69.4) | 82 (59.9) | 2.068 | 0.097 |
| Inactive | 44 (40.7) | 41 (32.5) | 26 (30.6) | 55 (40.1) | |||||
| Drinking | Non-daily | 86 (79.6) | 94 (74.6) | 0.828 | 0.226 | 73 (85.9) | 103 (75.2) | 3.656 | 0.039 |
| Daily | 22 (20.4) | 32 (25.4) | 12 (14.1) | 34 (24.8) | |||||
| Smoking | Never | 65 (60.2) | 82 (65.1) | 0.596 | 0.262 | 62 (72.9) | 87 (63.5) | 2.117 | 0.095 |
| Smoker | 43 (39.8) | 44 (34.9) | 23 (27.1) | 50 (36.5) | |||||
| Chronic diseases | 0 | 14 (13.0) | 19 (15.1) | 0.215 | 0.393 | 20 (23.5) | 28 (20.4) | 0.296 | 0.351 |
| ≥1 | 94 (87.0) | 107 (84.9) | 65 (76.5) | 109 (79.6) | |||||
| Dietary pattern | Diverse group | 73 (67.6) | 75 (59.5) | 6.872 | <0.001 | 57 (67.1) | 82 (59.9) | 6.154 | <0.001 |
| Balance group | 28 (25.9) | 28 (22.2) | 22 (25.9) | 31 (22.6) | |||||
| Restricted group | 7 (6.5) | 23 (18.3) | 6 (7.1) | 24 (17.5) | |||||
BMI: body mass index
Table 6.
Association between dietary patterns and cognitive function stratified by sleep duration.
| Optimal sleep duration | Unfavorable sleep duration | |||||
| Predictor | OR [95% CI] | P-value | OR [95% CI] | P-value | ||
| Dietary pattern [Diverse] | 0.63 [0.33, 0.92] | <0.001 | 0.81 [0.26, 0.91] | <0.001 | ||
| Dietary pattern [Balance] | 0.99 [0.24, 1.65] | 0.348 | 0.59 [0.52, 0.71] | 0.014 | ||
| Age | 1.36 [0.69, 2.67] | 0.367 | 0.42 [0.21, 0.85] | 0.016 | ||
| Sex | 0.49 [0.22, 1.08] | 0.075 | 0.94 [0.36, 2.47] | 0.897 | ||
| BMI | 1.04 [0.55, 1.96] | 0.914 | 1.06 [0.50, 2.24] | 0.885 | ||
| Living status | 0.81 [0.23, 2.90] | 0.745 | 0.75 [0.23, 2.44] | 0.633 | ||
| Exercise | 0.68 [0.37, 1.24] | 0.208 | 1.57 [0.77, 3.20] | 0.210 | ||
| Smoking | 1.17 [0.56, 2.43] | 0.679 | 1.66 [0.65, 4.28] | 0.292 | ||
| Drinking | 0.41 [0.18, 0.93] | 0.032 | 1.22 [0.45, 3.33] | 0.701 | ||
| Diseases | 0.74 [0.31, 1.74] | 0.491 | 1.56 [0.68, 3.56] | 0.293 | ||
Logistic regression analysis; BMI: body mass index.
Disclaimer/Publisher’s Note: The statements, opinions and data contained in all publications are solely those of the individual author(s) and contributor(s) and not of MDPI and/or the editor(s). MDPI and/or the editor(s) disclaim responsibility for any injury to people or property resulting from any ideas, methods, instructions or products referred to in the content. |
© 2025 by the authors. Licensee MDPI, Basel, Switzerland. This article is an open access article distributed under the terms and conditions of the Creative Commons Attribution (CC BY) license (http://creativecommons.org/licenses/by/4.0/).
Copyright: This open access article is published under a Creative Commons CC BY 4.0 license, which permit the free download, distribution, and reuse, provided that the author and preprint are cited in any reuse.


