
Submitted:
07 October 2025
Posted:
08 October 2025
You are already at the latest version
Abstract
Orthoebolavirus zairense, or Zaire Ebola virus (EBOV) is a species within the virus family Filoviridae, a group of viruses that can cause severe disease in humans characterized by hemorrhagic shock, coagulation abnormalities, and severe inflammation. While tissue macrophages are critical targets early during EBOV infection, other cell types support viral replication as disease progresses. At late stages of infection, infectious EBOV is found on the surface of the skin, which may be a critical source of infectious virus transmitted be-tween individuals during outbreaks. Human skin contains a number of cellular targets of EBOV, including keratinocytes. Here, we demonstrate EBOV infection of telomerase-immortalized normal human skin keratinocytes (NHSK-1) as well as EBOVΔVP30 infection of NHSK-1 cells that were stably complemented with the EBOV transcription factor VP30. Infection with EBOVΔVP30 did not elicit detectable endogenous interferon responses, however, exogenous pre-treatment of NHSK-1 cells with type I, II, and III interferon (IFN) inhibited EBOVΔVP30 infection and infection of an additional low containment model of EBOV, rVSV/EBOV GP, in a dose-dependent manner. Analysis of the transcriptome of IFN-treated keratinocytes identified multiple genes unique to each IFN and a subset of ISGs upregulated by each IFN. Our results indicate that ISGs induced by IFN pre-treatment of keratinocytes can reduce infection, underlining possible anti-EBOV ISGs for development of EBOV-targeting therapeutics.
Keywords:
keratinocyte
; Ebola virus
; interferon-stimulated gene
; antiviral
; skin
; type I interferon
; type II interferon
; type III interferon
1. Introduction
Ebola virus (EBOV) is an enveloped, negative-sense RNA virus within the family Filoviridae that is responsible for devastating episodic outbreaks in equatorial Africa, with mortality rates ranging from 30-90% depending on the outbreak context [1,2,3]. The largest recorded outbreak occurred in West Africa in 2013-2016 and resulted in ~28,000 infections and ~11,000 deaths, inciting major global health concerns. Smaller episodic outbreaks have since occurred in the Democratic Republic of the Congo (DRC) with varied size and duration [3]. Infection with EBOV causes Ebola Virus Disease (EVD), an acute disease that is characterized by an aberrant and dysregulated immune response that destabilizes the vascular system. This results in a syndrome similar to fulminant septic shock, characterized by low blood pressure and widespread tissue ischemia along with high fever; patients usually succumb due to multiorgan failure [4,5]. Some cutaneous manifestations have been described in EBOV-infected humans and non-human primates (NHPs), including a maculopapular rash and petechiae [6,7].
Non-therapeutic containment measures currently employed during outbreaks includes disease surveillance, quarantine of infected individuals, and education on contact precautions [8]. Two vaccines, including an effective recombinant vesicular stomatitis virus vectored vaccine that encodes the EBOV glycoprotein (rVSV/EBOV GP), are now licensed and recommended for use by the World Health Organization (WHO) [9,10,11]. Two monoclonal antibody regimens are also currently approved for the treatment of EVD: the antibody cocktail REGN-EB312 and the single monoclonal antibody mAb11413. These treatments showed moderate efficacy in a large outbreak in the DRC [14] but can be prohibitively expensive in socio-disadvantaged areas where EVD outbreaks occur. Thus, efforts to identify additional therapies for treatment and control of viral transmission are ongoing.
Transmission of EBOV occurs through direct contact with an infected individual or their body fluids [15]. While mucosal transmission is considered to be the primary route [16], evidence suggests that direct skin-skin contact may also be an important route of transmission. During the 2013-2016 West Africa epidemic, studies demonstrated that infectious virus is present on the skin of infected individuals late during infection [16,17,18]. Detection of EBOV antigen and/or RNA in the skin at late stages of infection of humans and experimentally infected NHPs further suggest that infectious virus disseminates to the skin of infected individuals [6,19,20,21]. We previously explored EBOV permissive cell types in the skin using ex vivo infections of intact human skin explants and in vivo infections of NHPs and mice [22,23]. In these studies, we defined keratinocytes as a skin cell type that supports productive EBOV infection. Keratinocytes are the most abundant cell type found in the epidermis (the outermost layer of the skin) and are targets of multiple viruses, including human papillomavirus (HPV), beta- and gamma-herpesviruses, flaviviruses and alphaviruses [24,25,26,27,28]. The role of keratinocytes in replicating a broad array of viruses and the observation that EBOV directly infects human keratinocytes implicates these cells in transmission of EBOV through direct skin contact. Therapeutics targeting replication of EBOV in keratinocytes may have utility in controlling contact-transmission during outbreaks.
A number of studies suggest that interferons (IFN) may provide a protective response against filovirus infection and transmission [29,30,31]. There are three main types of IFN: type I (IFN-α and -β), type II (IFN-γ) and type III (IFN-λ), that elicit expression of large and partially overlapping sets of interferon stimulated genes (ISGs) [32]. Type I interferons bind to the heterodimeric interferon-α/β receptor (IFNAR), inducing a signaling pathway that results in formation of a trimeric complex that consists of Signal Transducers and Activators of Transcription 1 and 2 (STAT1 and STAT2) and Interferon Regulator Factor 9 (IRF9). While this canonical pathway is well established, STAT-independent pathways can also be elicited by type I IFNs and may elicit specific ISGs [33]. IFN-λ is the most structurally divergent from the other two classes of IFN and binds a different cell surface receptor consisting of heterodimeric interferon-gamma receptor (IFNGR) to elicit a STAT1-dependent production of ISGs [34]. IFN-λ is the least studied member of the IFN family but is highly structurally related to type I IFNs [34,35]. IFN-λ induces signaling through its own heterodimeric receptor that elicits formation of the STAT1-STAT2-IRF9 complex to drive transcription of ISGs. In the context of viral infections, IFN signaling stimulates the production of hundreds of ISGs, many of which have direct antiviral activity against a broad array of viruses [36,37,38]. A subset of these ISGs can modulate the activity of immune cells such as T cells, B cells, and/or dendritic cells (DCs) [39,40,41], bridging innate and adaptive immunity to enhance immune control of virus replication. Notably, these responses can also be pathologic and are implicated in multiple autoimmune disorders, including psoriasis and others that affect the skin [42,43,44,45,46].
Specific ISGs such as TRIM25, ISG15, and several IFITMs [47,48,49] have been shown to interfere with EBOV replication. A large screen of 400 ISGs showed that approximately 21 genes caused statistically significant decreases in replication of a low containment EBOV model in HEK 293T cells [50], emphasizing the diversity of genes that can directly impact EBOV infection. The expression and function of certain ISGs can be cell-type dependent [51,52,53,54], underlining the importance of exploring ISGs and their associated antiviral functions in different permissive cell types. To date, the ability of IFN to inhibit EBOV in human keratinocytes has not yet been studied.
Here, we demonstrate that telomerase-immortalized keratinocytes from adult human skin support EBOV infection and infection with a low-containment model of EBOV, EBOVΔVP30. EBOVΔVP30 infection elicited no detectable endogenous interferon responses in human keratinocytes, in contrast to robust innate immune responses elicited by a different low containment model of EBOV infection, rVSV/EBOV GP. We also show that IFN-β, IFN-γ, and IFN-λ elicit dose-dependent inhibition of EBOV replication in keratinocytes. Analysis of the transcriptome of IFN-treated keratinocytes identified a common subset of ISGs expressed in response to each treatment as well as ISGs uniquely stimulated by the specific IFN type. Further, we examined ISG production elicited by the IFNs at early (6h) and late (24h) time points. These findings identify an array of different ISGs that may serve as antivirals against EBOV in human keratinocytes and support the development of focused therapeutic strategies to reduce skin transmissible EBOV infection during future outbreaks.
2. Materials and Methods
2.1. Cell Lines
The telomerase-immortalized normal human skin keratinocyte-1 (TERT-NHSK-1, herein referred to as NHSK-1) cell line was derived from normal keratinocytes of healthy human adult skin and have been described [55,56]. NHSK-1 cells stably expressing VP30 were generated by transduction of a VP30 encoding pBABE-puromycin retrovirus into NHSK-1 cells. Cells were selected with puromycin (1 μg/ml) and individual colonies were cloned via a ring-cloning approach. VP30 expression in clones was confirmed by western blot using a rabbit α-EBOV VP30 polyclonal antisera (0301-048, IBT Bioservices, Rockville MD). A single clone was selected based on growth kinetics and support of EBOV GP-dependent infection. Keratinocytes were maintained at 37°C, 5% CO2 in keratinocyte serum-free media (K-SFM, Gibco, Waltham, MA) supplemented with 25 µg/mL bovine pituitary extract, 0.16 ng/mL epidermal growth factor, and 1% penicillin/streptomycin. Keratinocytes were utilized at 70-80% confluence.
VP30-expressing Vero cells have been previously described [57] and were used for generation of EBOVΔVP30 stocks. Vero E6 cells were utilized for generation of EBOV stocks. Both Vero E6 and Vero-VP30 cells were maintained at 37°C, 5% CO2 in Dulbecco’s modified Eagle’s medium (DMEM, ThermoFisher) supplemented with 10% fetal bovine serum (FBS) and 1% penicillin/streptomycin.
2.2. Virus Stocks
EBOV: Experiments with replication-competent EBOV encoding green fluorescent protein (EBOV-GFP) were performed in the BSL-4 laboratory at Texas Biomedical Research Institute (Texas Biomed, San Antonio TX) according to approved standard operating procedures and protocols approved by the Institutes Biohazard and Safety and Recombinant DNA Committees. The NCBI accession number for EBOV-GFP used in these studies is KF990213. EBOV-GFP was amplified in Vero cells in DMEM supplemented with 2% FBS for 7 days. The culture supernatant was clarified of cell debris, then overlaid over a 20% sucrose cushion in PBS and centrifuged at 28,000 rpm at 4C for 2 hours. The virus pellet was resuspended in PBS, and the virus was titrated by incubating serial dilutions of the stock on Vero cells for 24 hours to determine fluorescent foci units per ml (FFU/ml).
EBOVΔVP30: To amplify EBOVΔVP30 encoding GFP (EBOVΔVP30-GFP), Vero-VP30 cells were infected with a low MOI (~0.005). Infected cells were scraped and homogenized by pipetting up and down at 120 hours following infection when robust GFP was observed. Supernatants containing virus and cell homogenates were then centrifuged at 1500xg for 5 minutes and passed through a 0.45 µ filter to remove cell debris. Filtered supernatants were either aliquoted and frozen at -80C or layered over a 25% sucrose/PBS cushion and ultracentrifuged at 28,000xg for 2 hours for a sucrose-purified viral stock. Pellets were thoroughly resuspended in PBS on ice, aliquoted and frozen at -80C until use. For some studies, filtered cell supernatants containing EBOVΔVP30 were used for infection, whereas other studies utilized sucrose-purified virus as noted. Viral stocks were titrated by serial dilution on to Vero-VP30 cells and evaluation of GFP-positive wells at 120 hours following infection to obtain TCID50.
rVSV/EBOV GP: To amplify rVSV/EBOV GP encoding GFP (rVSV/EBOV GP-GFP), Vero E6 cells were infected with a low MOI (~0.005). At 48 hours post infection, the virus-containing supernatant was centrifuged at 1500xg for 5 minutes and passed through a 0.45 µm filter to remove cell debris. Filtered supernatants were layered over a 25% sucrose/PBS cushion and ultracentrifuged at 28,000xg for 2 hours. Sucrose purified pellets were thoroughly resuspended in PBS, aliquoted and frozen at -80C until use. Viral stocks were titered by serial dilution of virus on to Vero E6 cells and evaluation of GFP-positive wells at 120 hours following infection to obtain TCID50.
2.3. Infections
EBOV: NHSK-1 cells were seeded into 48 well plates at 105 cells/well and were left uninfected or incubated with EBOV at a multiplicity of infection (MOI) of 0.1, 1, or 10 (as titrated on Vero cells). After 1 hour, cells were washed twice with PBS, then incubated with fresh medium for 24, 48, 72, or 96 hours. At each time point, cells were fixed, and supernatants were titrated on Vero cells. All cells were stained with Hoescht dye (Thermo Fisher) to stain nuclei and photographed using an automated Nikon Ti-Eclipse microscope (Nikon, Tokyo, Japan). The number of cell nuclei and infected (GFP-positive) cells were counted using Cell Profiler software (Broad Institute). Infection efficiency in keratinocyte monolayers was quantified as the ratio of infected cells and cell nuclei. Virus titer in cell supernatants was determined in Vero cells and is represented as FFU/ml.
EBOVΔVP30 and rVSV/EBOV GP: NHSK-1-VP30 cells were seeded in 48-well plates at a density of 105 cells/well and left uninfected or incubated with EBOVΔVP30 or rVSV/EBOV GP at an MOI of 0.1, 1, or 10 for 24 or 48 hours at 37°C, 5% CO2. In some studies, inoculum was replaced with fresh media at 4 hpi, and media containing virus was collected and titrated as described above on Vero-VP30 cells to assess TCID50. For assessing percent infection, cells were washed with sterile PBS and detached with 0.05% Trypsin-EDTA (37°C for 15 minutes). PBS supplemented with 2% FBS was added to inactivate Trypsin-EDTA. Cells were centrifuged at 700xg for 5 minutes, resuspended in 4% paraformaldehyde (PFA) and incubated at 4°C for 30 minutes to inactivate residual EBOVΔVP30. Cells were then washed in FACS buffer (2% FBS/PBS) and resuspended in FACS buffer. Frequency of GFP+ cells was assessed via flow cytometry on a BD FACSVerse instrument and data analyzed using FlowJo software (BD Biosciences, Franklin Lakes NJ). For representative images, cells were fixed on coverslips with 4% PFA, then stained with anti-GFP-AF488 (Invitrogen) and DAPI for 1 hour at room temperature. Cells were washed, mounted on slides and imaged with an Axio Observer 7 microsope (Carl Zeiss AG, Oberkochen, Germany).
2.4. Treatment with IFN
Human IFN-α (PBL Assay Science, Piscataway NJ), human IFN-β (R&D Systems, Minneapolis MN), human IFN-γ (PBL Assay Science), or human IFN-λ (PBL Assay Science) was used in these studies. Semi-confluent (70-80%) cultures of HTERT-N-HSK-1-VP30s were treated with the concentration and type of IFN noted in each figure legend or K-SFM alone (control) for 6 or 24 hours, washed gently with sterile PBS, and media was replaced. Cultures were either infected with EBOVΔVP30 or rVSV/EBOV GP as described above or RNA was isolated for transcriptomic studies.
2.5. Endogenous Antiviral Response to Infection
NHSK-1 VP30 cells were seeded at a density of 7x10⁵ cells/well in a 6 well format. When 90% confluent, media was replaced with either media alone (uninfected) or media containing purified EBOVΔVP30 at an MOI=10 or rVSV/EBOV GP at an MOI=10. At 24 hpi, media was removed, and cellular RNA was isolated using a Qiagen RNeasy® Mini Kit as described by the manufacturer. In parallel wells, infection was assessed via flow cytometry as described above. Antiviral genes were analyzed using real-time PCR with Human Antiviral Response RT2Profiler™ PCR array plates from Qiagen (PAHS-122ZC-24). RT-qPCR was performed using a QuantStudio3 cycler (Applied Biosystems, Waltham MA), with cycling conditions described by the manufacturer. Analysis was done using data analysis spreadsheet provided by the manufacturer.
2.6. Transcriptomic Analysis of IFN-Treated NHSK-1 Cells
Two individual sets of studies were performed using parental NHSK-1 cells. Cells were plated to semi-confluency (70-80%) in a 6 well format and subsequently received one of the following treatments: 100 ng/mL of IFN-β, 100 ng/mL of IFN-γ, 2.47 ng/mL IFN-α, or 18.8 ng/mL IFN-λ. All treatments were carried out for 6 and 24 hours. Non-treated cells were included as controls for each set of experiments and all treatments were performed in quadruplicate at each time point. RNA was extracted from cells utilizing the RNeasy® Mini Kit from Qiagen as described by the manufacturer. High quality RNA samples were verified by Bioanalyzer (Agilent) used as input to generate mRNA-seq libraries for the Illumina platform performed at the Iowa Institute of Human Genetics (IIHG), Genomic Division. Libraries were sequenced on a Novaseq 6000 (Illumina) system utilizing two lanes on an SP flow cell. Paired-end reads were utilized at a read depth of ~400M. All downstream processing of RNAseq reads and bioinformatic analysis were conducted utilizing RStudio (v. R 4.1.1) accessed through the University of Iowa Interactive Data Analysis Service utilizing the high-performance computing cluster as needed. Adapter sequences from raw FASTQ files were trimmed utilizing Trim Galore! (v. 0.0.6; Babraham Bioinformatics - Trim Galore!) as well as analyzed with the included FastQC program. All samples met the quality control measure of a Phred score of ≥20. Utilizing Salmon [58] (v.1.5.2), we created a decoy-aware transcriptome utilizing the whole human genome as a decoy (Selective Alignment (combine-lab.github.io)) using Homo Sapiens genome and annotated files from Gencode (GRCh38.p13; Gencode.v.38.annotatio.gtf). Gene counts were obtained utilizing aligned reads utilizing the Salmon quant feature. All samples resulted in ≥80% of reads mapped to our generated index and were utilized in differential gene expression (DEG) analysis. DEG analyses were conducted utilizing DESeq2 [59] (v.1.34.0). We attempted to mitigate batch effects by comparing individual interferon treatments to the untreated control that was initially performed with each RNA isolation. Unless otherwise noted we have set genes that are significantly regulated to be -2≤ or ≥2 in their Log2Fold Change values and have a p-adjusted value of ≤10-32. Gene Ontology plots were created utilizing ClusterProfiler [60,61] (v.4.2.2). Volcano plots were created utilizing Enhanced Volcano (v.1.12.0; GitHub - kevinblighe/EnhancedVolcano: Publication-ready volcano plots with enhanced coloring and labeling).
2.7. RNA Isolation and RT-qPCR
For RNA isolation, cells were harvested in TRIzol reagent (Invitrogen) followed by RNA extraction according to the manufacturer’s specifications. 1 μg of RNA from each sample was coverted to cDNA using a High-Capacity cDNA RevTrans Kit (Applied Biosystems). Quantitative PCR was performed using POWER SYBR Green Master Mix (Applied Biosystems) according to the manufacturer’s specifications. Data were collected on a QuantStudio 3 Real Time PCR instrument and Ct values determined with the QuantStudio Data Analysis software (Applied Biosystems). Averages from duplicate wells for each gene were used to calculate abundance of transcripts relative to the housekeeping gene (Gapdh) and represented as represented as 2-ΔCt. Primers were obtained (Integrated DNA Technologies, Coralville IA) and sequences are as follows; SLC15A3 fwd 5’-TGGCGTTTATTCAGCAGAACA-3’, SLC15A3 rev 5’-TCTCTGGCCGAGTGTCGTT-3’, CMPK2 fwd 5’-CCAGGTTGTTGCCATCGAAG-3’, CMPK2 rev 5’-CAAGAGGGTGGTGACTTTAAGAG-3’, BATF2 fwd 5’-AGACCCCAAGGAGCAACA-3’, BATF2 rev 5’-CAGGGCGAGGTTGTCTTT-3’, GAPDH fwd 5’-TTAAAAGCAGCCCTGGTGAC-3’, GAPDH rev 5’-CTCTGCTCCTCCTGTTCGAC-3’.
2.8. Quantification and Statistical Analysis
All statistical analysis was done using GraphPad Prism v9.4.1 (GraphPad, San Diego CA). Statistical analysis for RNA sequencing datasets is described above. Quantification of flow cytometry data was done using FlowJo v10.8.0 (Becton, Dickinson & Company, Ashland OR). Where indicated, statistical significance is defined as *p<0.05, **p<0.01, ***p<0.001, ****p<0.0001, ns = not significant. Specific details regarding the statistical tests used and n values for each experiment can be found in the corresponding figure legends.
3. Results
3.1. Human Keratinocytes Support EBOV and EBOVΔVP30 Infection
We have previously shown that primary human keratinocytes are permissive to EBOV infection [22]. A telomerase-immortalized human keratinocyte cell line derived from adult human skin (normal human skin keratinocyte-1 (NHSK-1)) [55] was utilized previously to study EBOV GP-mediated viral entry to keratinocytes [22]. To demonstrate that this cell line is permissive to authentic EBOV replication, NHSK-1 cells were infected with increasing doses of EBOV encoding GFP [62]. NHSK-1 cells supported dose-dependent infection with EBOV (Figure 1A), and spread of infection throughout the monolayer was observed from 24- to 96-hpi (Figure 1B). Production of infectious EBOV was also evident in supernatants of infected cells at each time point (Figure 1C), further demonstrating that NHSK-1 cells are permissive for productive EBOV infection.
We evaluated whether NHSK-1 cells could support infection of an established low-containment model virus of EBOV that lacks the viral transcriptional activator, VP30 (EBOVΔVP30) [57]. Deletion of VP30 from the viral genome restricts viral replication to VP30-expressing cell lines, resulting in a biologically contained virus that is a low-risk approach to studying viral replication and cell intrinsic immune responses to infection. A GFP reporter is expressed in place of VP30, allowing easy readout of viral replication. NHSK-1 cells that stably expressed VP30 (NHSK-1-VP30) supported dose-dependent infection with EBOVΔVP30 (Figure 1D) and resulted in both viral antigen and infectious virus in the supernatant (Fig 1E-F). While spread of EBOVΔVP30 infection within the monolayer was observed between 24- to 48-hpi (Figure 1E), these increases were modest. Notably, infection as detected by GFP was greater in EBOVΔVP30-infected cells at 24-hpi (Figure 1E) than observed in EBOV-infected cells (Figure 1B) at all MOI’s used. Given the high percentage of infected cells and substantial viral gene expression as indicated by GFP, EBOVΔVP30 is a useful low-containment approach for studying various aspects of the EBOV lifecycle as well as cellular innate immune responses to EBOV in keratinocytes.
Together, these studies demonstrate that human keratinocytes support productive replication of EBOV and EBOVΔVP30.
3.2. EBOVΔVP30 Infection Does Not Stimulate Innate Antiviral Responses in Human Keratinocytes
EBOV encodes two proteins with IFN antagonistic activity, VP24 and VP35, to circumvent innate immune recognition and induction of endogenous antiviral responses [63,64,65,66]. Although these proteins effectively block IFN responses, it is plausible that the IFN pathway in some cell types may not be effectively inhibited, given that in vivo infections can elicit early innate immune responses [67,68]. We leveraged the EBOVΔVP30 model to determine whether EBOV infection elicits cell-intrinsic antiviral responses in human keratinocytes. NHSK-1 cells were infected with EBOVΔVP30 or another low containment virus model, vesicular stomatitis virus encoding EBOV GP and GFP in place of native G glycoprotein (rVSV/EBOV GP GP). We previously demonstrated that rVSV/EBOV GP productively infects NHSK-1 cells as well as primary human keratinocytes and keratinocytes within the epidermis of human skin explants [22]. As rVSV/EBOV GP elicits protective innate immunity against EBOV [69,70], we anticipated that it would elicit strong IFN responses. At 24 hpi when approximately 40-50% of cells were infected (Figure 2A-B), RNA was isolated and 84 genes associated with antiviral responses were evaluated via RT-qPCR. Visualization of these data via volcano plot analysis showed that rVSV/EBOV GP infection elicited robust expression of IFN-β and multiple ISGs such as CXCL10, MX1, and OAS2 (Figure 2A, S1) as well as a significant decrease in expression of TLR7 RNA. In contrast, EBOVΔVP30 infection elicited no significant alteration in expression of these genes (Figure 2B, S2). Comparison of the most highly upregulated genes in rVSV/EBOV GP-infected cells with their expression in EBOVΔVP30-infected cells further demonstrated that there is little antiviral response in NHSK-1 cells to EBOVΔVP30 by 24-hpi (Figure 2C). Although not significant, we observed small trending increases in several genes such as CCL5, PYDC1, and APOBEC3G in EBOVΔVP30 infected cells (Figure S2).
These studies demonstrate that EBOVΔVP30 infection of and replication in NHSK-1-VP30 cells is immunological quiescent at 24-hpi, indicating that EBOV is effective at blocking the initiation of innate immune responses in keratinocytes.
3.3. Exogenous Treatment with IFN-β, IFN-γ, and IFN-λ Inhibits EBOV Replication in Human Keratinocytes
While both type I and II IFNs have been demonstrated to inhibit EBOV replication [30,71], the ability of IFNs to inhibit EBOV infection of human keratinocytes has not been examined. Therefore, we evaluated the effect of recombinant IFN treatments on EBOVΔVP30 infection of NHSK-1-VP30 cells. We included IFN-λ, as it’s activity has not been evaluated in the context of EBOV infection. Cells were pre-treated with increasing concentrations of IFN-β, IFN-γ, or IFN-λ for 6 or 24 hours. After treatment, media without cytokines was refreshed and the cultures were infected with EBOVΔVP30 (MOI = 10). Treatment for 6 hours with IFN-β, IFN-γ, or IFN-λ caused significant dose-dependent decreases in EBOVΔVP30 infection (Figure 3A). Both IFN-β and IFN-γ were similarly inhibitory at 6 hours, while IFN-λ was significantly less inhibitory. Dose-dependent decreases in EBOVΔVP30 infection were also observed for all three IFNs when treatment was extended to 24 hours (Figure 3B), with IFN-β and IFN-λ both conferring similar levels of inhibition. Notably, IFN-β was significantly more inhibitory than IFN-γ with a 24-hour treatment. Pre-treatment for 24 hours with all IFNs caused a dose-dependent inhibition of rVSV/EBOV GP as well (Figure S3). IFN-γ also had a decreased ability to inhibit rVSV/EBOV GP compared to type I and III IFNs, highlighting that keratinocytes may be weakly responsive to IFN-γ in the context of EBOV GP-mediated infection.
We directly compared EBOVΔVP30 inhibition by treatment duration for each IFN (Figure 3C-E). Treatment for 24 hours significantly enhanced the inhibition conferred by IFN-β and IFN-λ (Figure 3C, E), suggesting an increase in EBOV-inhibitory ISG expression between 6 and 24 hours. Inhibition conferred by IFN-γ was similar between 6 and 24 hours (Figure 3D), suggesting that expression of EBOV-inhibitory ISGs has already occurred by 6 hours.
Together, these data highlight the ability of type I, II, and III IFNs to inhibit EBOVΔVP30 infection of NHSK-1-VP30 cells and demonstrate a differential impact of treatment duration on EBOVΔVP30 inhibition with either type I/III or type II IFNs.
3.4. Interferons Elicit a Range of Overlapping and Unique ISGs in Human Keratinocytes
With the appreciation that all three IFN types significantly reduced EBOVΔVP30 infection, we sought to investigate the breadth of IFN responses in human keratinocytes via bulk transcriptomic sequencing. We included type I IFNs, IFN-β and IFN-α, in these analyses as well as IFN-γ and IFN-λ and NHSK-1 cells were treated for 6 or 24 hours. In the first set of studies, cells were treated with 100 ng/ml of IFN-β or IFN-γ and, in a separate experiment, cells were treated with IFN-λ (18.8 ng/ml) or IFN-α (2.47 ng/ml). Concentrations of IFN are equivalent based on specific activity units/ml (U/ml) and have been converted to ng/ml concentrations for this study. The transcriptome of untreated cells was used as the baseline for gene expression, allowing identification of differentially expressed genes (DEGs) elicited by each IFN. Expression changes were initially compared independent of treatment duration. DEGs were identified using highly stringent criteria: only genes with a log2fold change ≥ 2 and a p-value ≤ 10-32 were selected. The pooled 6 and 24 h transcriptomes of cells treated with each of the IFNs were distinct from the baseline untreated cells, indicating that NHSK-1 cells are highly responsive to all IFNs tested (Figure 4A). These data show upregulation of ISGs typically associated with type I and III IFN treatment such as CMPK2, IFIT1, and RSAD2, and several well-known type II IFN-elicited genes such as IRF1 and TAP1 (Figure 4A). Many of the same genes were upregulated by IFN-α, IFN-β, and IFN-λ. This was also evident in a heatmap analysis, where we aligned the top 100 upregulated genes upregulated by IFN-β and compared these findings to expression changes by other IFN treatments (Figure 4B). Several of the most robust hits in IFN-β were also upregulated by IFN-α and IFN-λ. By principal component analysis (PCA), gene expression observed in the untreated samples clustered closely in the first dimension that accounted for 56% of the expression variation and was distant from the IFN-treated cells (Figure 4C). However, clustering of the untreated cells from two experiments in the second dimension was distinct, suggesting differences in the baseline values between these two experiments. This may also have contributed to the separation of the IFN-β and IFN-γ clusters in the second dimension from the IFN-α and IFN-λ clusters. IFN-α and IFN-λ treated cells were overlapping in the PCA, demonstrating similar gene expression patterns changes under these two conditions. IFN-β was proximally clustered with IFN-α and IFN-λ, while IFN-γ was further separated by the second dimension. This pattern of clustering is not unexpected, given the similarities between type I and type III IFN signaling that are distinct from IFN-γ signaling [34,35]. These data also demonstrate that the transcriptome differed more between types of IFN, as opposed to the differences caused by treatment duration.
In this analysis, sixteen DEGs were found to be significantly upregulated by all interferon treatments (Figure 4D). These include genes encoding RNA sensors (DDX58, IFIH1) and well-established antiviral effector proteins (MX1, IFIT3, OAS1, and TRIM22). Several of these shared genes, such as SLC15A3, CMPK2, and BATF2 have not been explored in the context of EBOV infection. These genes were confirmed to be highly upregulated by 24-hour treatment with a range of different IFN-β and IFN-γ concentrations (Figure S4A-C).
In each IFN treatment, a biological pathways analysis revealed “response to virus”, “defense response to virus”, and “defense response to symbiont” as the top upregulated biological processes (Figure 4E). While all IFNs stimulated overlapping pathways involved in defense responses and regulation of viral replication, IFN-γ stimulated a lower percentage of genes involved in the top three antiviral pathways than the three other IFN types, as indicated by a lower GeneRatio value. IFN-γ also uniquely elicited pathways unique among the 4 IFN types tested, including “antigen processing and presentation”, which is consistent with the well-defined role of IFN-γ in orchestration of adaptive immune responses [72]. Molecular function analysis also demonstrated a unique pattern for IFN-γ, identifying enhanced nucleoside binding pathways and regulation of signaling receptors (Figure S4D). In contrast, IFN-β, IFN-α, and IFN-λ treatments upregulated genes involved in double stranded RNA binding and RNA helicase activity.
In total, these analyses confirm that NHSK-1 cells exhibit robust and somewhat overlapping ISG responses to IFN-α, IFN-β, IFN-γ, and IFN-λ.
3.4. IFN Elicits Differential Gene Expression Patterns Between 6- and 24-Hours of Treatment
Given that IFN-β and IFN-λ-mediated control of EBOVΔVP30 replication was dependent on treatment duration (Figure 3), we examined the differential expression of genes between 6 and 24 hours of IFN treatment. Based on the observation that IFN-α-stimulated ISGs composed a subset of those stimulated by IFN-β treatment, IFN-β was leveraged as the representative type I IFN. We performed an analysis of type I, II, and III IFNs on keratinocyte gene expression at 6 or 24 hours of treatment. We again used stringent criteria (log2fold change of 2 or greater and a p-value ≤ 10-32) to identify the most strongly upregulated DEGs at each treatment duration. In IFN-β-treated keratinocytes, we found 146 DEGs upregulated at both 6 and 24 hours of IFN treatment (Figure 5A, Table S1). We also identified 22 unique DEGs expressed at 6 hours and 59 unique DEGs expressed following 24 hours of treatment. Both IFN-γ and IFN-λ showed a substantial percentage of shared DEGs expressed at both 6 hours and 24 hours, with a smaller subset of DEGs that were unique to either 6- or 24-hour IFN treatment (Figure 5B-C, Table S2 and Table S3).
Given that 24-hour treatment with IFN-β and IFN-λ enhanced inhibition of EBOVΔVP30 infection over 6-hour treatment, DEGs uniquely expressed between 6 and 24 hours of treatment may directly or indirectly inhibit EBOV infection. When comparing each IFN treatment, we found 44 DEGs were shared by all three IFNs at 6 hours of treatment (Figure 5D) and 59 DEGs shared by all three IFN at 24 hours of treatment (Figure 5E).
Using a volcano plot analysis, we compared DEGs expressed at 24 hours to those expressed at 6 hours of IFN treatment (Figure 5F), finding unique sets of DEGs in each IFN treatment that were only expressed after 24-hour treatment. Three genes with the greatest differential upregulation following 24 hours of IFN-β and IFN-λ were the common ISGs, IFI27, C1R, and BST2, whereas the most significantly upregulated genes by IFN-γ were distinct and primarily involved genes that stimulate antigen presentation (CD74, HLA-B, HLA-DRB1 and HLA-DRA). Genes that were elevated at 6 hours, but significantly downregulated at 24 hours, differed for each IFN type. This demonstrates that in keratinocytes, a significant percentage of DEGs elicited by IFN have markedly different timing of upregulation.
4. Discussion
The skin serves as both a physical and immunological barrier to the entry and egress of pathogens, and both anecdotal and experimental evidence have demonstrated that skin is permissive to EBOV infection [6,7,15,20,21,22]. We show here that telomerase-immortalized NHSK-1 cells support productive EBOV infection. We similarly show that NHSK-1 cells that have stable VP30 expression support infection with EBOVΔVP30 and serve as a useful low containment model for studying keratinocyte-virus interactions.
As a central component of the skin barrier, epidermal keratinocytes are known to possess potent innate immune defenses against viral pathogens [26,27,73]. We show that EBOVΔVP30 infection does not elicit endogenous antiviral responses after 24 hpi, consistent with the well-established IFN antagonistic functions of EBOV proteins VP24 and VP35 [63,64,65,66,74]. Although not statistically significant, the ISG, PYDC1, was most upregulated by EBOVΔVP30 infection (Figure 2 and S2). PYDC1 is a negative regulator of the inflammasome [75], a pathogen recognition apparatus that elicits pyroptotic cell death and the release of pro-inflammatory cytokines. Human expression of PYDC1 is almost exclusively restricted to epithelial cells [76]. Although EBOV can stimulate inflammasome activation via the NLRP3 pathway to result in production of IL-1β [77], a role for the inflammasome in control of EBOV replication has not been demonstrated. Our study suggests that further exploration of cell-type specific inflammasome activation may reveal a role for this pathway in EBOV infection.
In contrast to EBOVΔVP30, rVSV/EBOV GP elicited strong IFN responses. This is consistent with the importance of innate immune responses to rVSV/EBOV GP in its function as an effective vaccine [69,78]. In human keratinocytes, a wide range of ISGs was upregulated including several chemokines such as CCL5 and CXCL10. IFN-β was the most upregulated gene, which would promulgate innate immune responses. In an in vivo setting, upregulation of these chemokines along with other pro-inflammatory mediators would likely result in recruitment of immune cells and downstream orchestration of protective adaptive immunity. Together with our previous report that rVSV/EBOV GP targets multiple cell types in human skin explants [22], these data suggest topical or subcutaneous administration of rVSV/EBOV GP as a straightforward alternative vaccine administration route to elicit protective vaccine-elicited responses against EBOV infection. In vivo exploration of EBOV-specific adaptive immunity following topical or subcutaneous administration of rVSV/EBOV GP is warranted.
Keratinocytes are responsive to type I and type II IFNs, which has largely been established in the context of autoimmune diseases [44,45,46]. This includes cutaneous lupus erythematosus (CLE), where keratinocytes derived from diseased skin are hyperresponsive to type I and type II IFNs [79]. However, no study has directly compared the ISGs elicited by type I, II, and III IFNs in human keratinocytes and their comparative ability to inhibit viral replication. We found that IFN-β elicited the strongest response with the greatest number of DEGs, while a subset of these was stimulated by IFN-α and IFN-λ. This overlap in gene expression is not surprising, given that ISGs stimulated by type I and type III IFNs are driven by STAT1/STAT2/IRF9 complexes [35,36]. While it has been suggested that differential activation of non-classical IFN signaling pathways such as those mediated through MAPK signaling may cause divergent ISG upregulation between type I and type III IFNs [35,80], we show this is likely not the case in human keratinocytes. DEGs upregulated by IFN-β and IFN-γ overlapped to a lesser extent, which is consistent with IFN-γ-elicited responses being driven by STAT1 homodimers [36].
While a large number of ISGs are elicited by IFNs, specific small subsets of ISGs may be effective against any given viral infection [81]. Notably, the EBOV inhibition observed in IFN-treated keratinocytes is relatively modest compared to IFN-mediated inhibition in other cell types. For example, prior studies from our lab have showed that 0.2 ng/ml of murine IFN-γ caused a 4-fold decrease in percent infection of murine peritoneal macrophages [30]. This concentration caused no apparent inhibition in human keratinocytes in our study, where only 20 and 200 ng/ml concentrations were inhibitory and caused a modest 2-fold decrease in infection (Figure 3). In another study, IFN-β caused over 50% inhibition of EBOV infection in Vero E6, Huh7, and human monocyte derived macrophages at low concentrations relative to those used in our study [82]. These results support previous findings that keratinocytes have differential cell-type specific ISG expression patterns compared to macrophages that influence their antiviral capabilities [54]. Our study highlights that the most effective anti-EBOV ISGs upregulated by IFN treatment of macrophages and other cell types may be either lowly expressed or differentially functional in IFN-treated keratinocytes.
Even so, IFN-β, IFN-γ, and IFN-λ all significantly inhibit EBOV infection in keratinocytes, and our parallel transcriptomic studies allowed us to generate a focused array of candidate ISGs (Figure 4) that might play a role in IFN-mediated inhibition of EBOV in keratinocytes. This list includes several classical ISGs and pathogen recognition receptors consistent with broad innate immune activation, such as MX1, DDX58, OAS1, and NLRC5. Several other ISGs that we identified, such as SLC15A3 and CMPK2, are known to play indirect inhibitory roles in other viral infections [83,84] but have not been studied in the context of EBOV infection. Additionally, the dependency of treatment duration on magnitude of inhibition by IFN-β and IFN-λ may highlight ISGs unique to 24 hours as important for anti-EBOV IFN responses (Tables S1 and S3). Overall, these approaches allowed us to identify an array of several ISG candidates that may be inhibitory against EBOV and lend new insight into the responsiveness of keratinocytes to IFN during viral infection.
Interferons have been tested as clinical therapeutics against viral infections with some success. Chronic hepatitis C virus (HCV) and hepatitis B virus (HBV) infections have been treated with type I IFNs for more than 30 years [85,86,87]. While IFN-γ alone was not efficacious against HBV, IFN-γ pretreatment followed by IFN-α enhanced immune responses and were associated with increased viral clearance [88]. For respiratory infections such as SARS-CoV-2, a recent meta-analysis of clinical trials concluded that type I and III IFNs were effective in some studies and were reasonably well tolerated and safe [89]. Efficacy of IFNs against Ebola virus infection has been explored in animal models. Early studies in EBOV-challenged NHPs demonstrated that IFN-α2a treatment resulted in a modest delay in viremia and time to death [90]. Separate studies found that adenovirus vectored IFN-α alone was not protective, but it was robustly effective in both guinea pigs and NHPs when combined with a cocktail of anti-EBOV monoclonal antibodies [91]. Prophylactic delivery of adenovirus vectored porcine IFN-α, but not IFN-λ3, one day prior to EBOV challenge strongly reduced viral loads and protected animals against disease [92]. IFN-β was also therapeutically efficacious with treatment of EBOV- or Marburg virus-infected rhesus macaques 18 hours post infection significantly enhancing survival [93]. Similarly, IFN-γ treatment of mice up to 24 hours after mouse-adapted EBOV challenge reduced viral loads and prevented mortality [30]. Finally, during the West African epidemic, nine EVD patients treated with IFN-β appeared to have more rapid virus clearance and faster resolution of the disease compared to an untreated retrospective cohort [29]. Combined with our new findings, we speculate that administration of topical IFN-containing creams might serve to reduce or prevent transmission of EBOV from the skin’s surface. However, caution should be exercised in the application of findings to humans based on a prior report demonstrating that elevated levels of IFN-α and IFN-γ in EBOV-infected humans correlated with worse outcomes [94]. Overall, these findings suggest that the therapeutic value of IFNs, particularly as a combination therapy, should be explored further.
Supplementary Materials
The following supporting information can be downloaded at the website of this paper posted on Preprints.org
Author Contributions
JE – Conceptualization, investigation, data curation-formal analysis, writing-original draft, writing-review, editing and revision. HVE – conceptualization, investigation, data curation-formal analysis, writing-review, editing and revision. KS – investigation, data curation-formal analysis, writing-review, editing and revision. MAD – investigation, data curation-formal analysis, writing-review, editing and revision. DR – investigation, data curation-formal analysis, writing-review, editing and revision. FG – writing-review, editing and revision. AK – writing-review, editing and revision. OS – data curation-formal analysis, writing-review, editing and revision. WM – conceptualization, data curation-formal analysis, writing-review, editing and revision.
Funding
This research was supported by the National Institutes of Health (NIH, USA) grants R01AI134733 and R21AI139902 to WM; R21 AI154336 and R21AI151717 to OS. JE was supported by NIH T32AI007485 and F30AI181340-01A1. HVE was supported by NIH T32AI007485 and F30AI174686.
Institutional Review Board Statement
Not applicable.
Informed Consent Statement
Not applicable.
Data Availability Statement
The raw sequencing data are available on the NCBI Gene Expression Omnibus (GEO) with the accession number: GSE309699. Further inquiries can be directed to the corresponding author.
Conflicts of Interest
The authors declare no conflicts of interest.
Abbreviations
The following abbreviations are used in this manuscript:
| EBOV | Orthoebolavirus zairense or Zaire Ebolavirus |
| EBOVΔVP30 | EBOV lacking expression of VP30 |
| rVSV/EBOV GP | Recombinant vesicular stomatitis virus encoding EBOV GP |
| IFN | Interferon |
| NHSK-1 | Normal Human Skin Keratinocyte 1 |
| ISG | Interferon stimulated gene |
| DRC | Democratic Republic of the Congo |
| NHP | Non-human primate |
| WHO | World Health Organization |
| EVD | Ebola virus disease |
| HPV | Human papillomavirus |
| IFNAR | Interferon-α/β receptor |
| STAT | Signal transducer and activator of transcription |
| IRF | Interferon regulatory factor |
| DC | Dendritic cell |
| GFP | Green fluorescent protein |
| MOI | Multiplicity of infection |
| RT-qPCR | Real time quantitative polymerase chain reaction |
| DEG | Differentially expressed gene |
| PCA | Principal component analysis |
| CLE | Cutaneous lupus erythematosus |
| MAPK | Mitogen-activated protein kinase |
| HSV-1 | Herpes simplex virus 1 |
| HCV | Hepatitis C virus |
| HBV | Hepatitis B virus |
References
- Leroy, E.M.; Gonzalez, J.-P.; Baize, S. Ebola and Marburg haemorrhagic fever viruses: major scientific advances, but a relatively minor public health threat for Africa. Clin. Microbiol. Infect. 2011, 17, 964–976. [Google Scholar] [CrossRef]
- Weyer, J.; Grobbelaar, A.; Blumberg, L. Ebola Virus Disease: History, Epidemiology and Outbreaks. Curr. Infect. Dis. Rep. 2015, 17, 1–8. [Google Scholar] [CrossRef] [PubMed]
- Izudi, J.; Bajunirwe, F. Case fatality rate for Ebola disease, 1976–2022: A meta-analysis of global data. J. Infect. Public Heal. 2024, 17, 25–34. [Google Scholar] [CrossRef] [PubMed]
- Feldmann, H.; Sprecher, A.; Geisbert, T.W. Ebola. New Engl. J. Med. 2020, 382, 1832–1842. Available from: http://www.nejm.org/doi/10.1056/NEJMra1901594. [CrossRef]
- Matson, M.J.; Chertow, D.S.; Munster, V.J. Ebola Virus Disease: Uniquely Challenging Amongst the Viral Hemorrhagic Fevers. Open Forum Infect. Dis. 2025, 12, ofaf464. [Google Scholar] [CrossRef] [PubMed]
- Nkoghe, D.; Leroy, E.M.; Toung-Mve, M.; Gonzalez, J.P. Cutaneous manifestations of filovirus infections. Int. J. Dermatol. 2012, 51, 1037–1043. [Google Scholar] [CrossRef]
- Baskerville, A.; Bowen, E.T.W.; Platt, G.S.; McArdell, L.B.; Simpson, D.I.H. The pathology of experimental Ebola virus infection in monkeys. J. Pathol. 1978, 125, 131–138. [Google Scholar] [CrossRef]
- Gupta, S.; Gupta, N.; Yadav, P.; Patil, D. Ebola virus outbreak preparedness plan for developing Nations: Lessons learnt from affected countries. J. Infect. Public Health. 2021, 14, 293–305. [Google Scholar] [CrossRef]
- Meakin, S.; Nsio, J.; Camacho, A.; Kitenge, R.; Coulborn, R.M.; Gignoux, E.; Johnson, J.; Sterk, E.; Musenga, E.M.; Mustafa, S.H.B.; et al. Effectiveness of rVSV-ZEBOV vaccination during the 2018–20 Ebola virus disease epidemic in the Democratic Republic of the Congo: a retrospective test-negative study. Lancet Infect. Dis. 2024, 24, 1357–1365. [Google Scholar] [CrossRef]
- Henao-Restrepo, A.M.; Camacho, A.; Longini, I.M.; Watson, C.H.; Edmunds, W.J.; Egger, M.; Carroll, M.W.; Dean, N.E.; Diatta, I.; Doumbia, M.; et al. Efficacy and effectiveness of an rVSV-vectored vaccine in preventing Ebola virus disease: final results from the Guinea ring vaccination, open-label, cluster-randomised trial (Ebola Ça Suffit!). Lancet 2017, 389, 505–518. [Google Scholar] [CrossRef]
- Shukarev, G.; Callendret, B.; Luhn, K.; Douoguih, M. A two-dose heterologous prime-boost vaccine regimen eliciting sustained immune responses to Ebola Zaire could support a preventive strategy for future outbreaks. Hum. Vaccines Immunother. 2017, 13, 266–270. [Google Scholar]
- nbsp; Pascal, K. E.; Dudgeon, D.; Trefry, J.C.; Anantpadma, M.; Sakurai, Y.; Murin, C.D.; Turner, H.L.; Fairhurst, J.; Torres, M.; Rafique, A.; et al. Development of Clinical-Stage Human Monoclonal Antibodies That Treat Advanced Ebola Virus Disease in Nonhuman Primates. J. Infect. Dis. 2018, 218, S612–S626. [Google Scholar]
- Corti, D.; Misasi, J.; Mulangu, S.; Stanley, D.A.; Kanekiyo, M.; Wollen, S.; Ploquin, A.; Doria-Rose, N.A.; Staupe, R.P.; Bailey, M.; et al. Protective monotherapy against lethal Ebola virus infection by a potently neutralizing antibody. Science 2016, 351, 1339–1342. Available from: https://www.science.org. [CrossRef] [PubMed]
- Mulangu, S.; Dodd, L.E.; Davey, R.T., Jr.; Tshiani Mbaya, O.; Proschan, M.; Mukadi, D.; Lusakibanza Manzo, M.; Nzolo, D.; Tshomba Oloma, A.; Ibanda, A.; et al. A Randomized, Controlled Trial of Ebola Virus Disease Therapeutics. N. Engl. J. Med. 2019, 381, 2293–2303. [Google Scholar]
- Rewar, S.; Mirdha, D. Transmission of Ebola Virus Disease: An Overview. Ann. Glob. Heal. 2015, 80, 444–51. [Google Scholar] [CrossRef]
- Bausch, D.G.; Towner, J.S.; Dowell, S.F.; Kaducu, F.; Lukwiya, M.; Sanchez, A.; Nichol, S.T.; Ksiazek, T.G.; Rollin, P.E. Assessment of the Risk of Ebola Virus Transmission from Bodily Fluids and Fomites. J. Infect. Dis. 2007, 196, S142–S147. [Google Scholar] [CrossRef] [PubMed]
- Gire, S.K.; Goba, A.; Andersen, K.G.; GSealfon, R.S.; Park, D.J.; Kanneh, L.; et al. Genomic surveillance elucidates Ebola virus origin and transmission during the 2014 outbreak [Internet]. Available from: https://www.science.org.
- Ericson, A.D.; Claude, K.M.; Vicky, K.M.; Lukaba, T.; Richard, K.O.; Hawkes, M.T. Detection of Ebola virus from skin ulcers after clearance of viremia. J. Clin. Virol. 2020, 131, 104595. [Google Scholar] [CrossRef]
- Uyeki, T.M.; Mehta, A.K.; Davey, R.T., Jr.; Liddell, A.M.; Wolf, T.; Vetter, P.; Schmiedel, S.; Grünewald, T.; Jacobs, M.; Arribas, J.R.; et al. Clinical Management of Ebola Virus Disease in the United States and Europe. N. Engl. J. Med. 2016, 374, 636–646. [Google Scholar]
- Twenhafel, N.A.; Mattix, M.E.; Johnson, J.C.; Robinson, C.G.; Pratt, W.D.; Cashman, K.A.; Wahl-Jensen, V.; Terry, C.; Olinger, G.G.; Hensley, L.E.; et al. Pathology of Experimental Aerosol Zaire Ebolavirus Infection in Rhesus Macaques. Veter- Pathol. 2013, 50, 514–529. [Google Scholar] [CrossRef]
- Zaki, S.R.; Shieh, W.J.; Greer, P.W.; Goldsmith, C.S.; Ferebee, T.; Katshitshi, J.; et al. A Novel Immunohistochemical Assay for the Detection of Ebola Virus in Skin: Implications for Diagnosis, Spread, and Surveillance of Ebola Hemorrhagic Fever [Internet]. Available from: https://academic.oup.com/jid/article/179/Supplement_1/S36/882144.
- Messingham, K.N.; Richards, P.T.; Fleck, A.; Patel, R.A.; Djurkovic, M.; Elliff, J.; et al. V I R O L O G Y Multiple cell types support productive infection and dynamic translocation of infectious Ebola virus to the surface of human skin [Internet]. Sci. Adv. 2025, 11. Available from: https://www.science.org.
- Richards, P.T.; Fleck, A.M.; Patel, R.; Fakhimi, M.; Bohan, D.; Geoghegan-Barek, K.; Honko, A.N.; Stolte, A.E.; Plescia, C.B.; Messingham, C.O.; et al. Ebola virus’ hidden target: virus transmission to and infection of skin. J. Virol. 2025, e0130025. Available from: https://journals.asm.org/doi/10.1128/jvi.01300-25. [CrossRef] [PubMed]
- Hamel, R.; Dejarnac, O.; Wichit, S.; Ekchariyawat, P.; Neyret, A.; Luplertlop, N.; Perera-Lecoin, M.; Surasombatpattana, P.; Talignani, L.; Thomas, F.; et al. Biology of Zika Virus Infection in Human Skin Cells. J. Virol. 2015, 89, 8880–8896. [Google Scholar] [CrossRef] [PubMed]
- Salomão, N.G.; Araújo, L.; de Souza, L.J.; Young, A.L.; Basílio-De-Oliveira, C.; Basílio-De-Oliveira, R.P.; de Carvalho, J.J.; Nunes, P.C.G.; Amorim, J.F.d.S.; Barbosa, D.V.D.S.; et al. Chikungunya virus infection in the skin: histopathology and cutaneous immunological response. Front. Microbiol. 2025, 16, 1497354. [Google Scholar] [CrossRef] [PubMed]
- Kiamba, E.W.; Goodier, M.R.; Clarke, E. Immune responses to human papillomavirus infection and vaccination. Front. Immunol. 2025, 16, 1591297. [Google Scholar] [CrossRef]
- Zhu, S.; Viejo-Borbolla, A. Pathogenesis and virulence of herpes simplex virus. Virulence 2021, 12, 2670–2702. [Google Scholar] [CrossRef]
- Cerimele, F.; Curreli, F.; Ely, S.; Friedman-Kien, A.E.; Cesarman, E.; Flore, O. Kaposi's Sarcoma-Associated Herpesvirus Can Productively Infect Primary Human Keratinocytes and Alter Their Growth Properties. J. Virol. 2001, 75, 2435–43. [Google Scholar] [CrossRef]
- Konde, M.K.; Baker, D.P.; Traore, F.A.; Sow, M.S.; Camara, A.; Barry, A.A.; Mara, D.; Barry, A.; Cone, M.; Kaba, I.; et al. Interferon β-1a for the treatment of Ebola virus disease: A historically controlled, single-arm proof-of-concept trial. PLOS ONE 2017, 12, e0169255. [Google Scholar] [CrossRef]
- A Rhein, B.; Powers, L.S.; Rogers, K.; Anantpadma, M.; Singh, B.K.; Sakurai, Y.; Bair, T.; Miller-Hunt, C.; Sinn, P.; A Davey, R.; et al. Interferon-γ Inhibits Ebola Virus Infection. PLOS Pathog. 2015, 11, e1005263. [Google Scholar] [CrossRef]
- Rogers, K.J.; Shtanko, O.; Vijay, R.; Mallinger, L.N.; Joyner, C.J.; Galinski, M.R.; Butler, N.S.; Maury, W. Acute Plasmodium Infection Promotes Interferon-Gamma-Dependent Resistance to Ebola Virus Infection. Cell Rep. 2020, 30, 4041–4051.e4. [Google Scholar] [CrossRef]
- Boehmer, D.; Zanoni, I. Interferons in health and disease. Cell. 2025, 188, 4480–4504. [Google Scholar] [CrossRef]
- Mazewski, C.; Perez, R.E.; Fish, E.N.; Platanias, L.C. Type I Interferon (IFN)-Regulated Activation of Canonical and Non-Canonical Signaling Pathways. Front. Immunol. 2020, 11, 606456. [Google Scholar] [CrossRef]
- Walter, M.R. The Role of Structure in the Biology of Interferon Signaling. Front. Immunol. 2020, 11, 606489. [Google Scholar] [CrossRef] [PubMed]
- Lazear, H.M.; Schoggins, J.W.; Diamond, M.S. Shared and Distinct Functions of Type I and Type III Interferons. Immunity 2019, 50, 907–923. [Google Scholar] [CrossRef] [PubMed]
- Schoggins, J.W. Interferon-Stimulated Genes: What Do They All Do? Annu. Rev. Virol. 2025, 22. [Google Scholar] [CrossRef]
- Schoggins, J.W.; Wilson, S.J.; Panis, M.; Murphy, M.Y.; Jones, C.T.; Bieniasz, P.; et al. A diverse range of gene products are effectors of the type i interferon antiviral response. Nature. 2011, 472, 481–485. [Google Scholar] [CrossRef] [PubMed]
- Schoggins, J.W.; MacDuff, D.A.; Imanaka, N.; Gainey, M.D.; Shrestha, B.; Eitson, J.L.; Mar, K.B.; Richardson, R.B.; Ratushny, A.V.; Litvak, V.; et al. Pan-viral specificity of IFN-induced genes reveals new roles for cGAS in innate immunity. Nature 2014, 505, 691–695. [Google Scholar] [CrossRef]
- Tough, D.F. Type I Interferon as a Link Between Innate and Adaptive Immunity through Dendritic Cell Stimulation. Leuk. Lymphoma 2004, 45, 257–264. [Google Scholar] [CrossRef]
- Dahlgren, M.W.; Plumb, A.W.; Niss, K.; Lahl, K.; Brunak, S.; Johansson-Lindbom, B. Type I Interferons Promote Germinal Centers Through B Cell Intrinsic Signaling and Dendritic Cell Dependent Th1 and Tfh Cell Lineages. Front. Immunol. 2022, 13, 932388. [Google Scholar] [CrossRef]
- Lee, A.J.; Ashkar, A.A. The Dual Nature of Type I and Type II Interferons. Front. Immunol. 2018, 9, 2061. [Google Scholar] [CrossRef]
- Mavragani, C.P.; Crow, M.K. Type I interferons in health and disease: molecular aspects and clinical implications. Physiol. Rev. 2025, 105, 2537–2587. [Google Scholar] [CrossRef]
- Turnier, J.L.; Kahlenberg, J.M. The Role of Cutaneous Type I IFNs in Autoimmune and Autoinflammatory Diseases. J. Immunol. 2020, 205, 2941–2950. [Google Scholar] [CrossRef] [PubMed]
- Pastore, S.; Corinti, S.; La Placa, M.; Didona, B.; Girolomoni, G. Interferon-γ promotes exaggerated cytokine production in keratinocytes cultured from patients with atopic dermatitis. J. Allergy Clin. Immunol. 1998, 101, 538–544. [Google Scholar] [CrossRef]
- Tian, J.; Shi, L.; Zhang, D.; Yao, X.; Zhao, M.; Kumari, S.; Lu, J.; Yu, D.; Lu, Q. Dysregulation in keratinocytes drives systemic lupus erythematosus onset. Cell. Mol. Immunol. 2024, 22, 83–96. [Google Scholar] [CrossRef]
- Shao, S.; Tsoi, L.C.; Sarkar, M.K.; Xing, X.; Xue, K.; Uppala, R.; et al. IFN-γ enhances cell-mediated cytotoxicity against keratinocytes via JAK2/STAT1 in lichen planus [Internet]. Sci. Transl. Med. 2019, 11. [Google Scholar] [CrossRef]
- Galão, R.P.; Wilson, H.; Schierhorn, K.L.; Debeljak, F.; Bodmer, B.S.; Goldhill, D.; Hoenen, T.; Wilson, S.J.; Swanson, C.M.; Neil, S.J.D. TRIM25 and ZAP target the Ebola virus ribonucleoprotein complex to mediate interferon-induced restriction. PLOS Pathog. 2022, 18, e1010530. [Google Scholar] [CrossRef]
- Okumura, A.; Pitha, P.M.; Harty, R.N. ISG15 inhibits Ebola VP40 VLP budding in an L-domain-dependent manner by blocking Nedd4 ligase activity. Proc. Natl. Acad. Sci. 2008, 105, 3974–3979. Available from: www.pnas.org/cgi/content/full/. [CrossRef]
- Wrensch, F.; Karsten, C.B.; Gnirß, K.; Hoffmann, M.; Lu, K.; Takada, A.; Winkler, M.; Simmons, G.; Pöhlmann, S. Interferon-Induced Transmembrane Protein–Mediated Inhibition of Host Cell Entry of Ebolaviruses. J. Infect. Dis. 2015, 212, S210–S218. [Google Scholar] [CrossRef]
- Kuroda, M.; Halfmann, P.J.; Hill-Batorski, L.; Ozawa, M.; Lopes, T.J.S.; Neumann, G.; Schoggins, J.W.; Rice, C.M.; Kawaoka, Y. Identification of interferon-stimulated genes that attenuate Ebola virus infection. Nat. Commun. 2020, 11, 1–14. [Google Scholar] [CrossRef]
- Muckenhuber, M.; Seufert, I.; Müller-Ott, K.; Mallm, J.-P.; Klett, L.C.; Knotz, C.; Hechler, J.; Kepper, N.; Erdel, F.; Rippe, K. Epigenetic signals that direct cell type–specific interferon beta response in mouse cells. Life Sci. Alliance 2023, 6, e202201823. [Google Scholar] [CrossRef] [PubMed]
- Pervolaraki, K.; Talemi, S.R.; Albrecht, D.; Bormann, F.; Bamford, C.; Mendoza, J.L.; Garcia, K.C.; McLauchlan, J.; Höfer, T.; Stanifer, M.L.; et al. Differential induction of interferon stimulated genes between type I and type III interferons is independent of interferon receptor abundance. PLOS Pathog. 2018, 14, e1007420. [Google Scholar] [CrossRef] [PubMed]
- Aybey, B.; Brors, B.; Staub, E. Expression signatures with specificity for type I and II IFN response and relevance for autoimmune diseases and cancer. J. Transl. Med. 2025, 23, 1–21. [Google Scholar] [CrossRef]
- Lum, K.K.; Reed, T.J.; Yang, J.; Cristea, I.M. Differential Contributions of Interferon Classes to Host Inflammatory Responses and Restricting Virus Progeny Production. J. Proteome Res. 2024, 23, 3249–3268. [Google Scholar] [CrossRef] [PubMed]
- Gourronc, F.A.; Robertson, M.M.; Herrig, A.K.; Lansdorp, P.M.; Goldman, F.D.; Klingelhutz, A.J. Proliferative defects in dyskeratosis congenita skin keratinocytes are corrected by expression of the telomerase reverse transcriptase, TERT, or by activation of endogenous telomerase through expression of papillomavirus E6/E7 or the telomerase RNA component, TERC. Exp. Dermatol. 2010, 19, 279–288. [Google Scholar] [CrossRef] [PubMed]
- Scorza, B.M.; Wacker, M.A.; Messingham, K.; Kim, P.; Klingelhutz, A.; Fairley, J.; Wilson, M.E. Differential Activation of Human Keratinocytes by Leishmania Species Causing Localized or Disseminated Disease. J. Investig. Dermatol. 2017, 137, 2149–2156. [Google Scholar] [CrossRef]
- Halfmann, P.; Kim, J.H.; Ebihara, H.; Noda, T.; Neumann, G.; Feldmann, H.; Kawaoka, Y. Generation of biologically contained Ebola viruses. Proc. Natl. Acad. Sci. 2008, 105, 1129–1133. Available from: www.pnas.orgcgidoi10.1073pnas.0708057105. [CrossRef]
- Patro, R.; Duggal, G.; Love, M.I.; Irizarry, R.A.; Kingsford, C. Salmon provides fast and bias-aware quantification of transcript expression. Nat. Methods 2017, 14, 417–419. [Google Scholar] [CrossRef] [PubMed]
- Love, M.I.; Huber, W.; Anders, S. Moderated estimation of fold change and dispersion for RNA-seq data with DESeq2. Genome Biol. 2014, 15. [Google Scholar] [CrossRef]
- Yu, G.; Wang, L.-G.; Han, Y.; He, Q.-Y. clusterProfiler: An R Package for Comparing Biological Themes Among Gene Clusters. OMICS J. Integr. Biol. 2012, 16, 284–287. [Google Scholar] [CrossRef]
- Wu, T.; Hu, E.; Xu, S.; Chen, M.; Guo, P.; Dai, Z.; Feng, T.; Zhou, L.; Tang, W.; Zhan, L.; et al. clusterProfiler 4.0: A universal enrichment tool for interpreting omics data. Innovation 2021, 2, 100141. [Google Scholar] [CrossRef]
- Hoenen, T.; Groseth, A.; Callison, J.; Takada, A.; Feldmann, H. A novel Ebola virus expressing luciferase allows for rapid and quantitative testing of antivirals. Antivir. Res. 2013, 99, 207–213. [Google Scholar] [CrossRef]
- Reid, S.P.; Leung, L.W.; Hartman, A.L.; Martinez, O.; Shaw, M.L.; Carbonnelle, C.; Volchkov, V.E.; Nichol, S.T.; Basler, C.F. Ebola Virus VP24 Binds Karyopherin α1 and Blocks STAT1 Nuclear Accumulation. J. Virol. 2006, 80, 5156–5167. [Google Scholar] [CrossRef]
- Zhang, A.P.; Bornholdt, Z.A.; Liu, T.; Abelson, D.M.; Lee, D.E.; Li, S.; Woods, V.L., Jr.; Saphire, E.O. The Ebola Virus Interferon Antagonist VP24 Directly Binds STAT1 and Has a Novel, Pyramidal Fold. PLOS Pathog. 2012, 8, e1002550. [Google Scholar] [CrossRef] [PubMed]
- Cárdenas, W.B.; Loo, Y.-M.; Gale, M.; Hartman, A.L.; Kimberlin, C.R.; Martínez-Sobrido, L.; Saphire, E.O.; Basler, C.F. Ebola Virus VP35 Protein Binds Double-Stranded RNA and Inhibits Alpha/Beta Interferon Production Induced by RIG-I Signaling. J. Virol. 2006, 80, 5168–5178. [Google Scholar] [CrossRef]
- Basler, C.F.; Mikulasova, A.; Martinez-Sobrido, L.; Paragas, J.; Mühlberger, E.; Bray, M.; Klenk, H.-D.; Palese, P.; García-Sastre, A. The Ebola Virus VP35 Protein Inhibits Activation of Interferon Regulatory Factor 3. J. Virol. 2003, 77, 7945–7956. [Google Scholar] [CrossRef]
- Kotliar, D.; Lin, A.E.; Logue, J.; Hughes, T.K.; Khoury, N.M.; Raju, S.S.; Wadsworth, M.H.; Chen, H.; Kurtz, J.R.; Dighero-Kemp, B.; et al. Single-Cell Profiling of Ebola Virus Disease In Vivo Reveals Viral and Host Dynamics. Cell 2020, 183, 1383–1401.e19. [Google Scholar] [CrossRef]
- Caballero, I.S.; Honko, A.N.; Gire, S.K.; Winnicki, S.M.; Melé, M.; Gerhardinger, C.; Lin, A.E.; Rinn, J.L.; Sabeti, P.C.; Hensley, L.E.; et al. In vivo Ebola virus infection leads to a strong innate response in circulating immune cells. BMC Genom. 2016, 17, 1–13. [Google Scholar] [CrossRef] [PubMed]
- Elnosary, M.E.; Salem, F.K.; Mohamed, O.; Elbas, M.A.; Shaheen, A.A.; Mowafy, M.T.; Ali, I.E.; Tawfik, A.; Hmed, A.A.; Refaey, E.E.; et al. Unlocking the potential: a specific focus on vesicular stomatitis virus as a promising oncolytic and immunomodulatory agent in cancer therapy. Discov. Med. 2024, 1, 1–18. [Google Scholar] [CrossRef]
- Menicucci, A.R.; Jankeel, A.; Feldmann, H.; Marzi, A.; Messaoudi, I. Antiviral Innate Responses Induced by VSV-EBOV Vaccination Contribute to Rapid Protection. mBio 2019, 10, e00597–19. [Google Scholar] [CrossRef]
- Dyall, J.; Hart, B.J.; Postnikova, E.; Cong, Y.; Zhou, H.; Gerhardt, D.M.; Freeburger, D.; Michelotti, J.; Honko, A.N.; DeWald, L.E.; et al. Interferon-β and Interferon-γ Are Weak Inhibitors of Ebola Virus in Cell-Based Assays. J. Infect. Dis. 2017, 215, 1416–1420. [Google Scholar] [CrossRef] [PubMed]
- De Benedetti, F.; Prencipe, G.; Bracaglia, C.; Marasco, E.; Grom, A.A. Targeting interferon-γ in hyperinflammation: opportunities and challenges. Nat. Rev. Rheumatol. 2021, 17, 678–691. [Google Scholar] [CrossRef]
- Surasombatpattana, P.; Hamel, R.; Patramool, S.; Luplertlop, N.; Thomas, F.; Desprès, P.; Briant, L.; Yssel, H.; Missé, D. Dengue virus replication in infected human keratinocytes leads to activation of antiviral innate immune responses. Infect. Genet. Evol. 2011, 11, 1664–1673. [Google Scholar] [CrossRef]
- Basler, C.F.; Wang, X.; Mü Hlberger †, E.; Volchkov, V.; Paragas, J.; Klenk, H.D.; et al. The Ebola virus VP35 protein functions as a type I IFN antagonist [Internet]. 2000. Available from: www.pnas.org.
- de Almeida, L.; Khare, S.; Misharin, A.V.; Patel, R.; Ratsimandresy, R.A.; Wallin, M.C.; Perlman, H.; Greaves, D.R.; Hoffman, H.M.; Dorfleutner, A.; et al. The PYRIN Domain-only Protein POP1 Inhibits Inflammasome Assembly and Ameliorates Inflammatory Disease. Immunity 2015, 43, 264–276. [Google Scholar] [CrossRef]
- Lachner, J.; Mlitz, V.; Tschachler, E.; Eckhart, L. Epidermal cornification is preceded by the expression of a keratinocyte-specific set of pyroptosis-related genes. Sci. Rep. 2017, 7, 1–11. [Google Scholar] [CrossRef]
- Halfmann, P.; Hill-Batorski, L.; Kawaoka, Y. The Induction of IL-1β Secretion Through the NLRP3 Inflammasome During Ebola Virus Infection. J. Infect. Dis. 2018, 218, S504–S507. [Google Scholar] [CrossRef]
- Menicucci, A.R.; Jankeel, A.; Feldmann, H.; Marzi, A.; Messaoudi, I. Antiviral Innate Responses Induced by VSV-EBOV Vaccination Contribute to Rapid Protection. mBio 2019, 10, e00597–19. [Google Scholar] [CrossRef]
- Tsoi, L.C.; A Hile, G.; Berthier, C.C.; Sarkar, M.K.; Reed, T.J.; Liu, J.; Uppala, R.; Patrick, M.; Raja, K.; Xing, X.; et al. Hypersensitive IFN Responses in Lupus Keratinocytes Reveal Key Mechanistic Determinants in Cutaneous Lupus. J. Immunol. 2019, 202, 2121–2130. [Google Scholar] [CrossRef]
- Pervolaraki, K.; Stanifer, M.L.; Münchau, S.; Renn, L.A.; Albrecht, D.; Kurzhals, S.; Senís, E.; Grimm, D.; Schröder-Braunstein, J.; Rabin, R.L.; et al. Type I and Type III Interferons Display Different Dependency on Mitogen-Activated Protein Kinases to Mount an Antiviral State in the Human Gut. Front. Immunol. 2017, 8, 459. [Google Scholar] [CrossRef] [PubMed]
- McDougal, M.B.; De Maria, A.M.; Ohlson, M.B.; Kumar, A.; Xing, C.; Schoggins, J.W. Interferon inhibits a model RNA virus via a limited set of inducible effector genes. Embo Rep. 2023, 24, e56901. [Google Scholar] [CrossRef] [PubMed]
- Dyall, J.; Hart, B.J.; Postnikova, E.; Cong, Y.; Zhou, H.; Gerhardt, D.M.; Freeburger, D.; Michelotti, J.; Honko, A.N.; DeWald, L.E.; et al. Interferon-β and Interferon-γ Are Weak Inhibitors of Ebola Virus in Cell-Based Assays. J. Infect. Dis. 2017, 215, 1416–1420. [Google Scholar] [PubMed]
- He, L.; Wang, B.; Li, Y.; Zhu, L.; Li, P.; Zou, F.; Bin, L. The Solute Carrier Transporter SLC15A3 Participates in Antiviral Innate Immune Responses against Herpes Simplex Virus-1. J. Immunol. Res. 2018, 2018, 1–10. [Google Scholar] [CrossRef]
- Pawlak, J.B.; Hsu, J.C.-C.; Xia, H.; Han, P.; Suh, H.-W.; Grove, T.L.; Morrison, J.; Shi, P.-Y.; Cresswell, P.; Laurent-Rolle, M. CMPK2 restricts Zika virus replication by inhibiting viral translation. PLOS Pathog. 2023, 19, e1011286. [Google Scholar] [CrossRef]
- Gerlich, W.H. Medical Virology of Hepatitis B: how it began and where we are now. Virol. J. 2013, 10, 239–239. [Google Scholar] [CrossRef]
- Harry, B. Greenberg. Effect of human leukocyte interferon on Hepatitis B virus infection in patients with chronic active hepatitis. 1976.
- Lmar, E.; Aeckel, J.; Arkus, M.; Ornberg, C.; Eresa, T.; Antantonio, S. , et al. TREATMENT OF ACUTE HEPATITIS C WITH INTERFERON ALFA-2b A BSTRACT Background In people who are infected with the [Internet]. N Engl J Med. 2001, 345. Available from: www.nejm.org.
- Chen, J.; Li, Y.; Lai, F.; Wang, Y.; Sutter, K.; Dittmer, U. , et al. Functional Comparison of Interferon-α Subtypes Reveals Potent Hepatitis B Virus Suppression by a Concerted Action of Interferon-α and Interferon-γ Signaling. 486 Hepatology. 2021, 73. [Google Scholar]
- Ryoo, S.; Koh, D.H.; Yu, S.Y.; Choi, M.; Huh, K.; Yeom, J.S. , et al. Clinical efficacy and safety of interferon (Type I and Type III) therapy in patients with COVID-19: A systematic review and meta-analysis of randomized controlled trials. PLoS One. 2023, 18. [Google Scholar]
- Jahrling, P.B.; Geisbert, T.W.; Geisbert, J.B.; Swearengen, J.R.; Bray, M.; Jaax, N.K. , et al. Evaluation of Immune Globulin and Recombinant Interferon-a2b for Treatment of Experimental Ebola Virus Infections [Internet]. Available from: https://academic.oup.com/jid/article/179/Supplement_1/S224/881508.
- Qiu, X.; Wong, G.; Fernando, L.; Audet, J.; Bello, A.; Strong, J.; et al. E B O L A mAbs and Ad-Vectored IFN-a Therapy Rescue Ebola-Infected Nonhuman Primates When Administered After the Detection of Viremia and Symptoms [Internet]. Available from: https://www.science.org.
- Senthilkumaran, C.; Kroeker, A.L.; Smith, G.; Embury-Hyatt, C.; Collignon, B.; Ramirez-Medina, E. , et al. Treatment with Ad5-Porcine Interferon-α Attenuates Ebolavirus Disease in Pigs. Pathogens. 2022, 11. [Google Scholar] [CrossRef]
- Smith, L.M.; Hensley, L.E.; Geisbert, T.W.; Johnson, J.; Stossel, A.; Honko, A. , et al. Interferon- therapy prolongs survival in rhesus macaque models of ebola and marburg hemorrhagic fever. Journal of Infectious Diseases. 2013, 208, 310–8. [Google Scholar] [CrossRef]
- Reynard, S.; Journeaux, A.; Gloaguen, E.; Schaeffer, J.; Varet, H.; Pietrosemoli, N. , et al. Immune parameters and outcomes during Ebola virus disease. Immune parameters and outcomes during Ebola virus disease. JCI Insight. 2019, 4. [Google Scholar]
Figure 1.
Immortalized keratinocytes support EBOV and EBOV∆VP30 infection. (A) Immortalized human keratinocytes (NHSK-1) were infected with increasing concentrations of EBOV-GFP (MOI=0.1, 1, and 10). Representative images of infected cells were obtained at 48-hpi. Green = EBOV-GFP, blue = DAPI, scale bar = 300 μm. (B,C) Quantification of GFP+ EBOV infected keratinocytes from image analysis (B) and supernatant EBOV titers (C) at 24-, 48-, 72-, and 96-hpi (n=3, data obtained from one experiment). (D) NHSK-1 cells were infected with increasing concentrations of EBOVΔVP30-GFP (MOI=0.1, 1, and 10). Representative images of infected cells were obtained at 48-hpi. Green = EBOVΔVP30-GFP, blue = DAPI, scale bar = 200 μm. (E,F) Quantification of GFP+ EBOVΔVP30 infected keratinocytes by flow cytometry (E) and supernatant EBOVΔVP30 titers (F) are shown at 24- and 48-hpi (n=4, data is representative of 2 independent experiments). Data in B, C, E, and F were analyzed using a two-way ANOVA with Tukey’s multiple comparisons test. Data shown on a log scale were log transformed prior to analysis. Data are represented as mean ± SD. *p<0.05, **p<0.01, ***p<0.001, ****p<0.0001, ns = not significant.
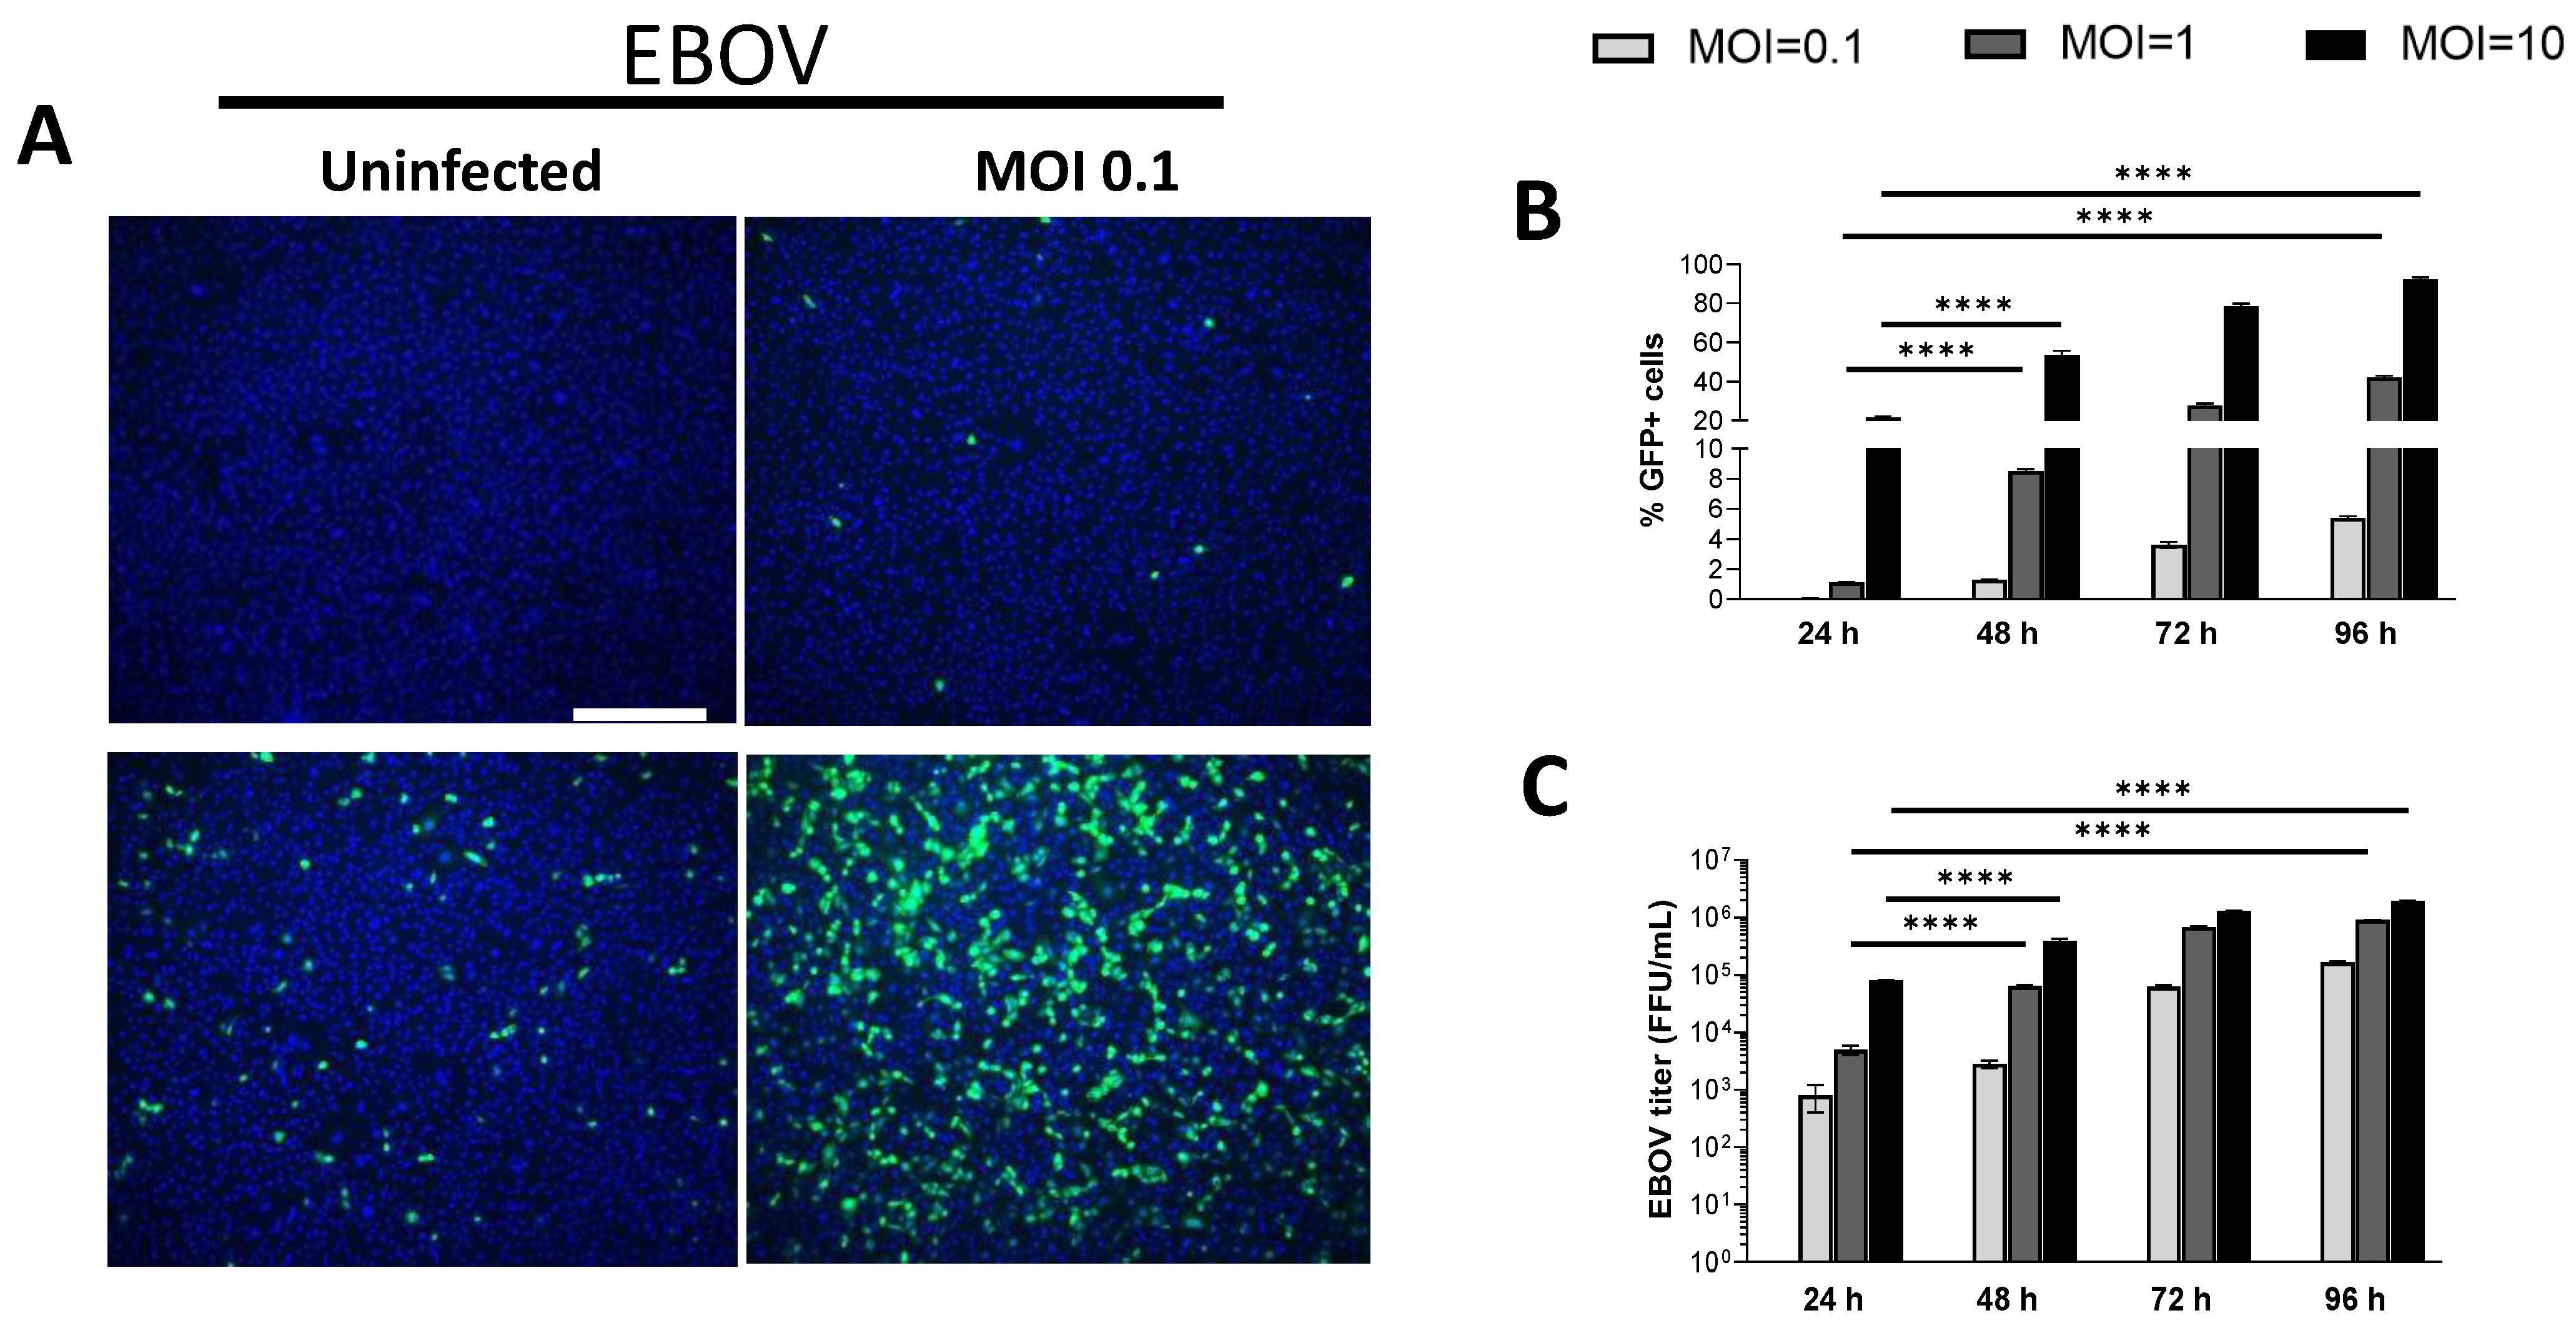
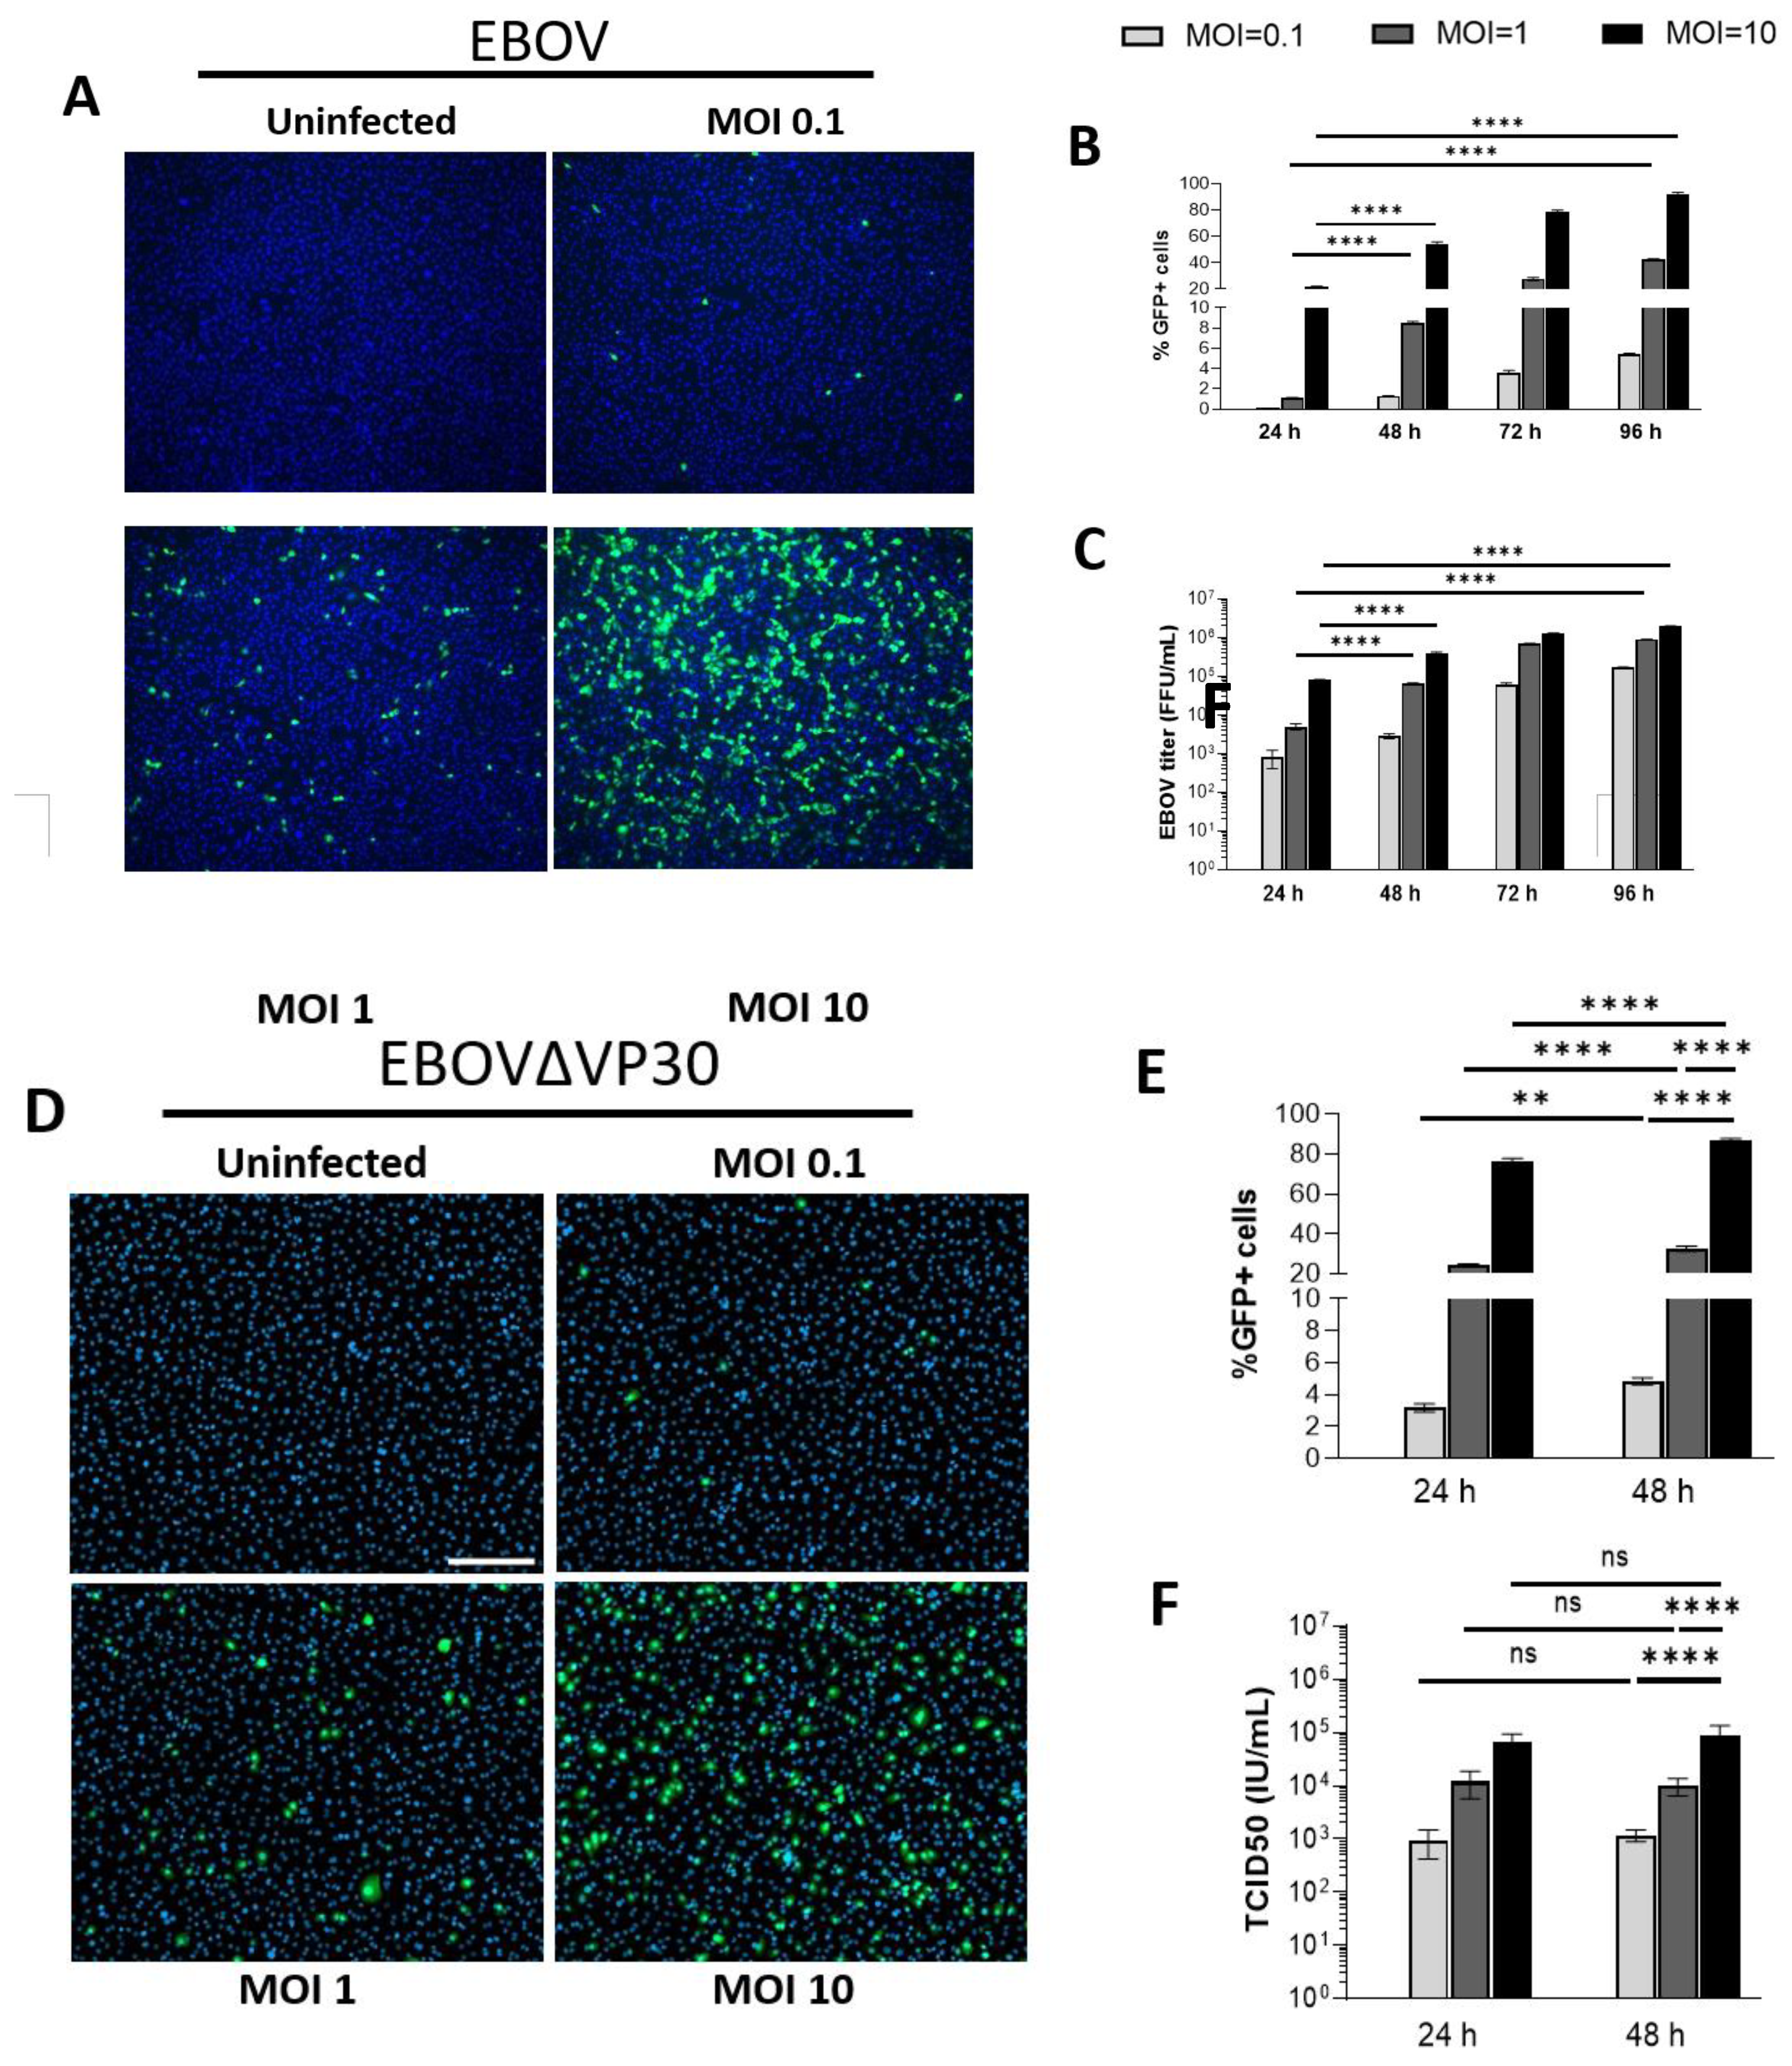
Figure 2.
EBOVΔVP30 infection does not stimulate innate antiviral responses in human keratinocytes. NHSK-1 cells expressing EBOV VP30 were infected with rVSV/EBOV or EBOV∆VP30 (MOI = 10) or left uninfected. The percent of virus infected cells were evaluated at 24-hpi as determined by flow cytometry of GFP+ cells. RNA was isolated from the cultures for assessment of antiviral gene expression via PCR. (n=3, representative of two independent experiments). (A,B) Volcano plot showing upregulation of genes in (A) rVSV/EBOV-infected cells or (B) EBOV∆VP30-infected cells over uninfected cells. Percentage of GFP+ cells was determined in parallel by flow cytometry. Significance cut-off is defined as p < 0.05 (vertical lines) and the cut-off for differential expression is defined as a log2fold > 1. (C) Heatmap showing the top 35 innate immune associated genes upregulated at 24 h by rVSV/EBOV compared with expression at 24 h with EBOV∆VP30 infection.
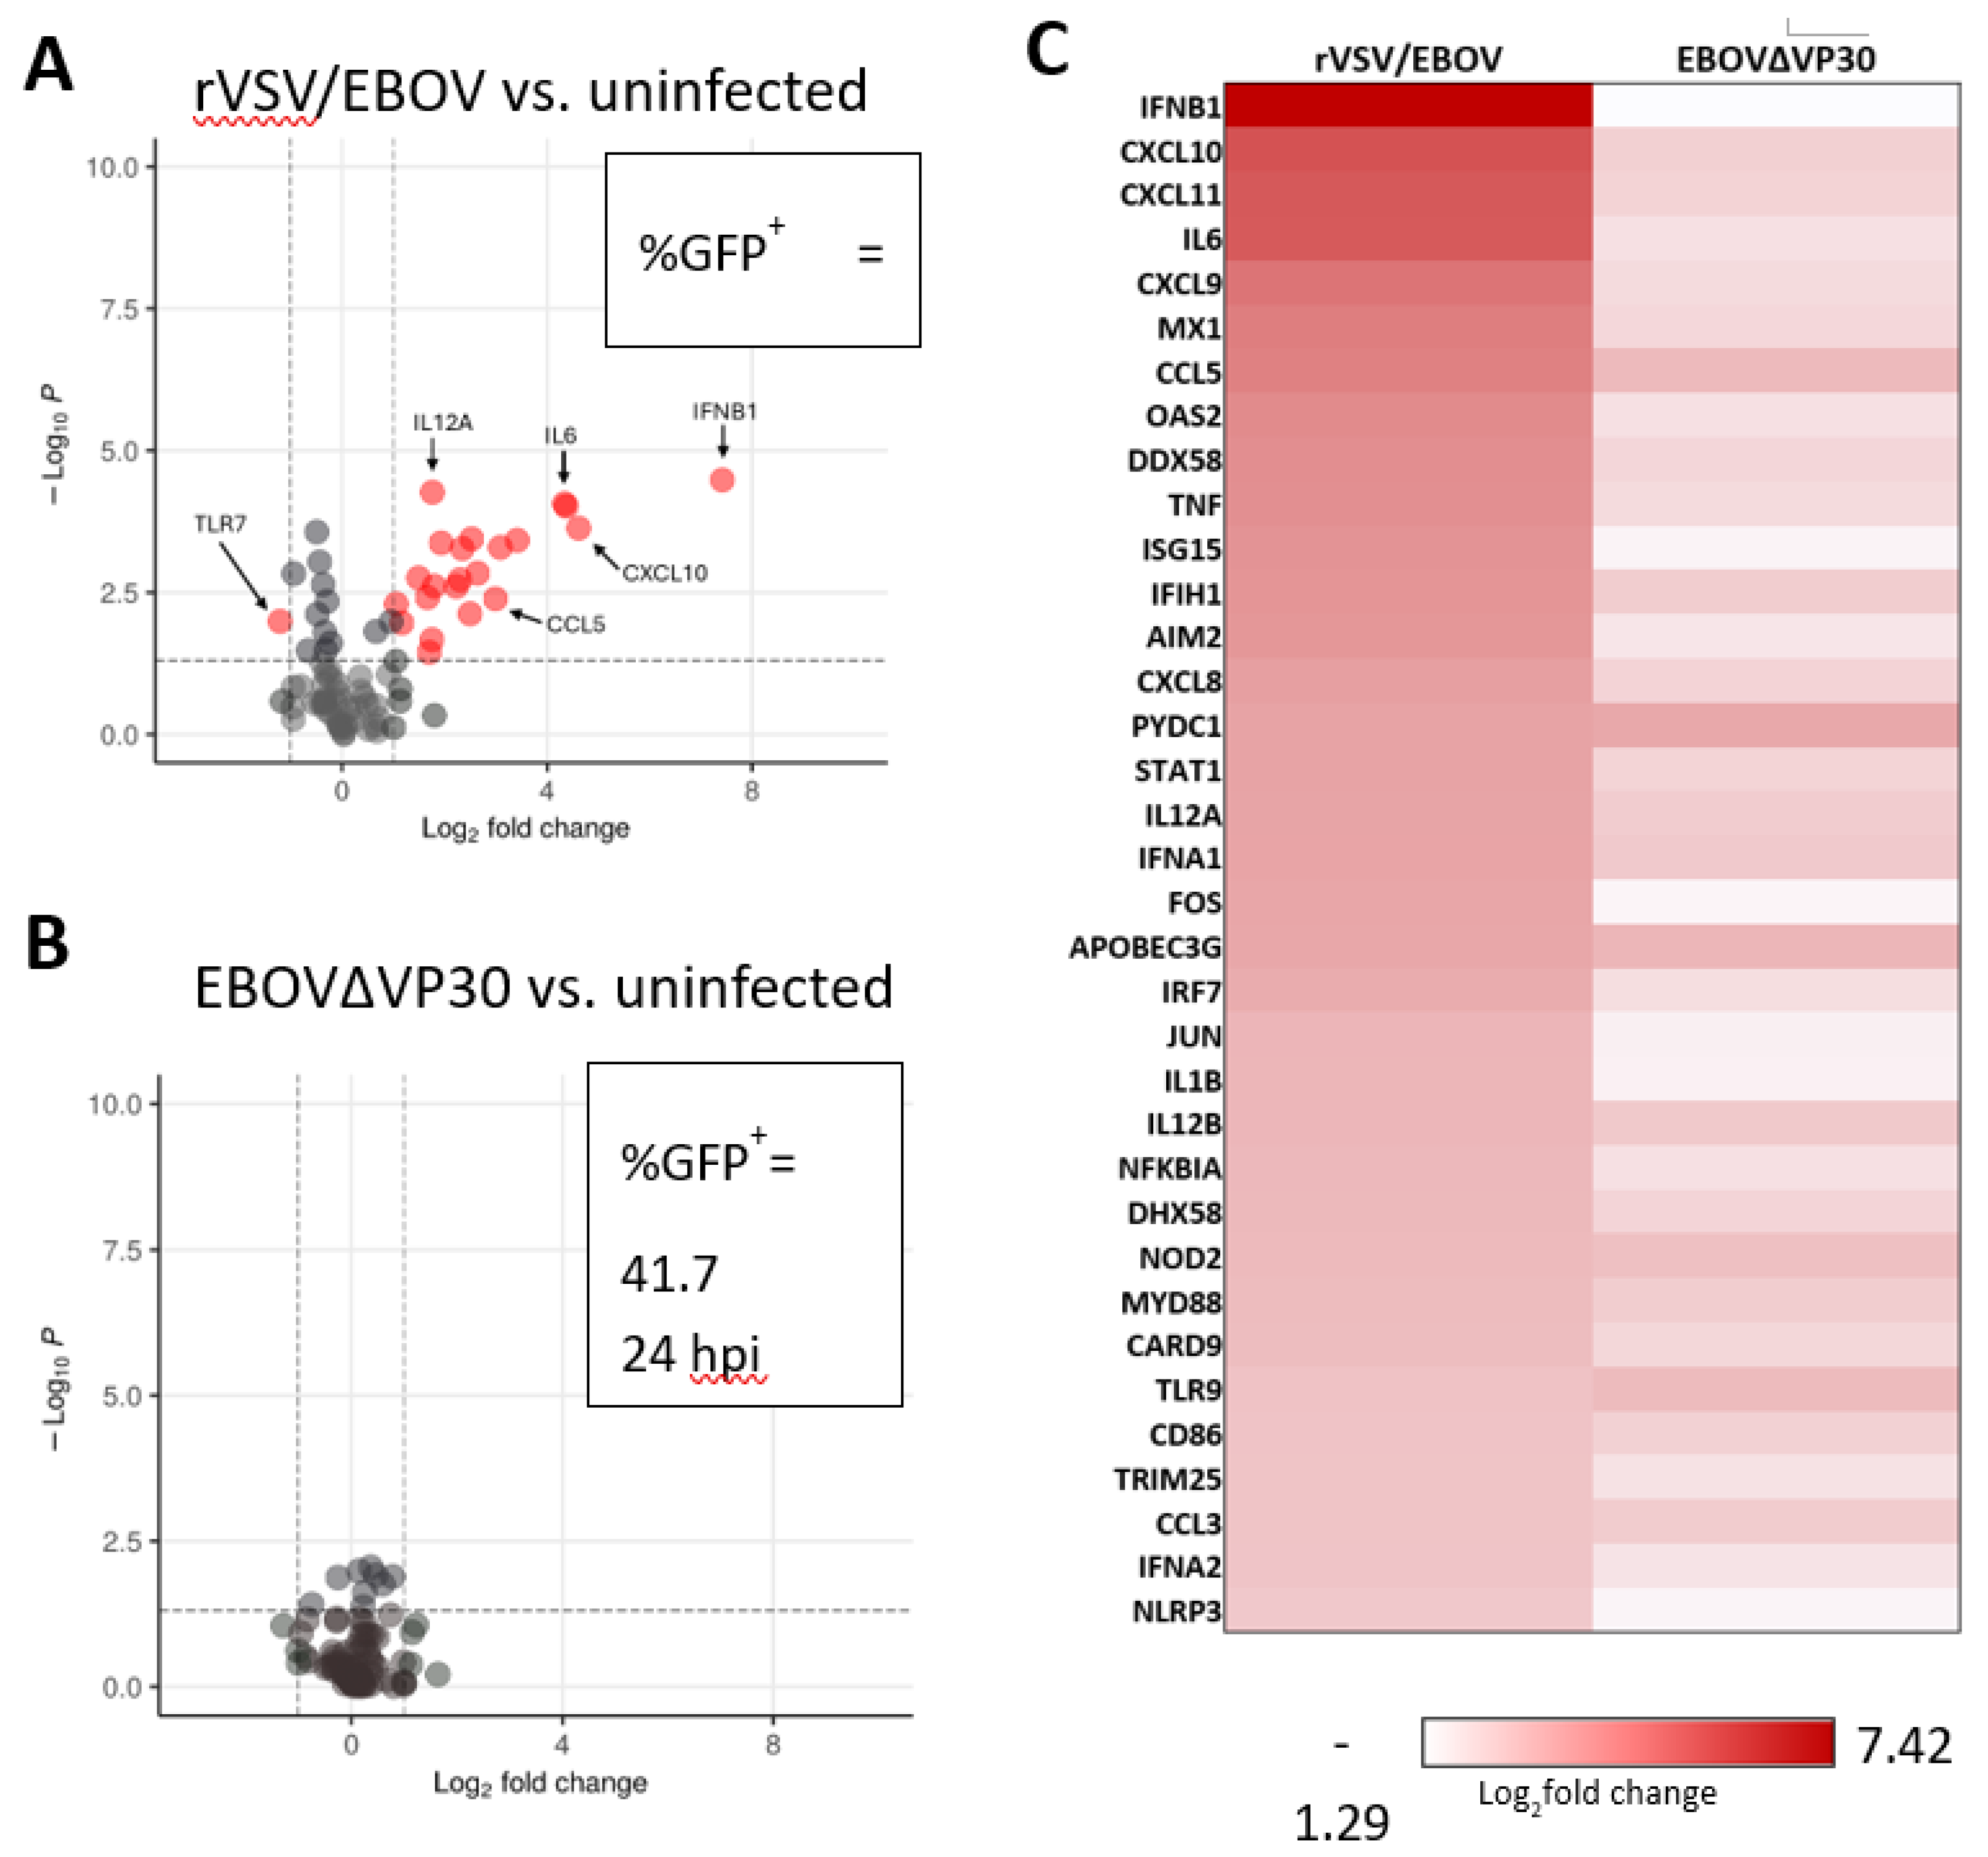
Figure 3.
Treatment with IFN-β, IFN-γ, and IFN-λ inhibits EBOV∆VP30 replication in human keratinocytes. NHSK-1 cells expressing EBOV VP30 were treated with indicated concentrations of IFN-β, IFN-γ, or IFN-λ for 6 or 24 hours, then infected with MOI=10 EBOV∆VP30. Infection was evaluated at 48-hpi. (A) EBOV∆VP30 infection of cells pre-treated for 6 hours with IFN-β, IFN-γ, or IFN-λ evaluated by flow cytometry and compared to infection of non-treated cells (dotted line). Area under the curve (AUC) is shown (right). (n=4, data pooled from 2 independent experiments). (B) EBOV∆VP30 infection of cells pre-treated for 24 hours (open squares) with IFN-γ evaluated by flow cytometry and compared to infection of non-treated cells (dotted line). AUC is shown (right). (n=4, data pooled from 2 independent experiments). (C-D) AUC values from A and B, comparing infection of keratinocytes treated with IFN-β (C), IFN-γ (D), or IFN-λ (E) for 6 or 24 hours. Percent infection in A and B was analyzed by two-way ANOVA with Tukey’s multiple comparisons test and are represented as mean ± SD. AUC values were analyzed by one-way ANOVA (A and B) or Student’s t-test (C-E) and are represented as mean ± SEM. *p<0.05, **p<0.01, ***p<0.001, ****p<0.0001, ns = not significant.
Figure 4.
Interferons elicit a range of overlapping and unique ISGs in human keratinocytes. NHSK-1 cells were treated with 100 ng/ml of IFN-β or IFN-γ, 18.8 ng/ml of IFN-λ, or 2.47 ng/ml of IFN-α. RNA was isolated at 6 or 24 hours of IFN treatment. Sequencing was performed twice with four technical replicates for each IFN treatment. (A) Volcano plot analysis showing the highest upregulated genes represented in each IFN treatment, regardless of time. (B) Heatmap analysis of highest upregulated genes in IFN-β-treated cells compared to IFN-γ and IFN-λ.Genes shown were identified based on a log2fold change of 2 or greater with a p-value of 10^-32. Grey boxes indicate that the gene did not meet these criteria in indicated IFN treatment. (C) PCA analysis of IFN treated cells for each IFN at 6 or 24 hours. (D) Sixteen ISGs highly upregulated by IFN-α, IFN-β, IFN-γ, and IFN-λ at a log2fold change ≥ 2 and a p-value ≤ 10-32. (E) Biological Function GO Pathway analysis results for IFN-α, IFN-β, IFN-γ, and IFN-λ.
Figure 5.
Timing of ISG upregulation following IFN treatment. NHSK-1 cells were treated with 100 ng/ml of IFN-β or IFN-γ, and 18.8 ng/ml of IFN-λ. RNA was isolated for sequencing at 6 or 24 hours of IFN treatment. Sequencing was performed twice with three technical replicates for each IFN treatment. (A-C) Venn diagram comparing the number of shared and unique ISGs at 6 or 24 hours of treatment with IFN-β (A), IFN-γ (B), or IFN-λ (C). Percentages show the fraction of unique DEGs at each time point out of total DEGs at each time point. (D) Venn diagram depicting the number of shared and unique ISGs between each IFN treatment at 6 hours only. (E) Venn diagram depicting the number of shared and unique ISGs between each IFN treatment at 24 hours only. (F) Volcano plots comparing top upregulated genes at 24 hours of treatment relative to 6-hour treatment with each individual IFN type (IFN-β, left; IFN-γ, middle; IFN-λ, right).
Disclaimer/Publisher’s Note: The statements, opinions and data contained in all publications are solely those of the individual author(s) and contributor(s) and not of MDPI and/or the editor(s). MDPI and/or the editor(s) disclaim responsibility for any injury to people or property resulting from any ideas, methods, instructions or products referred to in the content. |
© 2025 by the authors. Licensee MDPI, Basel, Switzerland. This article is an open access article distributed under the terms and conditions of the Creative Commons Attribution (CC BY) license (http://creativecommons.org/licenses/by/4.0/).
Copyright: This open access article is published under a Creative Commons CC BY 4.0 license, which permit the free download, distribution, and reuse, provided that the author and preprint are cited in any reuse.


