
Submitted:
30 September 2025
Posted:
08 October 2025
You are already at the latest version
Abstract
For many therapeutic agents to be effective against intracellular targets, they must first be able to penetrate the cell membrane. Current methodologies for assessing internalization, such as confocal microscopy and conventional flow cytometry, are limited by low throughput or an inability to provide precise spatial information on signal localization. Here, we present a comprehensive, semi-automated analytical pipeline for investigating compound internalization based on imaging flow cytometry, which is designed to ad-dress these limitations. Our workflow details the procedure from sample preparation and data acquisition on an Amnis FlowSight cytometer to analysis using IDEAS 6.2 software with a custom-designed template. Key features of our approach include the automated discrimination of signal between the plasma membrane and cytoplasmic compartments, the calculation of an internalization coefficient, and the introduction of a novel parame-ter—signal distribution entropy—to quantify the uniformity of compound distribution within cells. For statistical analysis, we developed FluoSta v1.0, a software tool that auto-mates descriptive statistics and analysis of variance (ANOVA with Tukey’s post hoc test) and facilitates data visualization. The pipeline’s utility was demonstrated in a series of model experiments, including a comparative assessment of the internalization efficiency of PS- versus PS/LNA-modified compounds in MT-4 cell cultures.
Keywords:
imaging flow cytometry
; internalization
; statistical pipeline
; cellular uptake
; FluoSta
1. Introduction
The efficacy of many contemporary therapeutic agents targeting intracellular targets (e.g., antisense oligonucleotides, siRNA, peptides, nanoparticles) is directly dependent on their ability to penetrate the cell membrane and reach the target internal compartment. For example, antisense oligonucleotides demonstrate high binding specificity to target nucleic acids [1,2]. However, they can degrade in endosomes under the action of enzymes without special chemical modifications (phosphorothioate, locked nucleic acid, etc.) [3], which can affect their bioavailability [4]. Similarly, many peptides and nanoparticles must traverse the plasma membrane barrier to exert their intended effects.
Conventional methods for evaluating internalization have their drawbacks. Confocal microscopy provides high resolution and allows for the visualization of specific cellular compartments; however, it analyzes a limited number of cells (low statistical power) and is time-consuming. Conventional flow cytometry allows for the analysis of hundreds of thousands of cells but only records fluorescence signal without information on its localization. To circumvent this limitation, enzymatic treatment of cells is used to remove molecules adsorbed on the cell surface [5]. Currently, no standardized procedure exists for evaluating internalization, and each method has its own strengths and shortcomings.
Imaging flow cytometry effectively addresses the limitations of the aforementioned techniques by integrating high-throughput capabilities, thereby ensuring robust statistical power, with detailed visualization of every individual cell. This allows for the simultaneous analysis of both quantitative flow parameters and morphology of intracellular probe distribution. The application of image masks facilitates the automated discrimination of signal localization to specific subcellular compartments, such as the plasma membrane, cytoplasm, or nucleus. Furthermore, integrated software features enable quantitative co-localization analysis, which is essential for verifying the delivery of compounds to their intended intracellular targets. This methodology has been successfully employed in related contexts; for instance, Ofir-Birin et al. utilized imaging flow cytometry to monitor the active uptake of extracellular vesicles generated during infection with Plasmodium falciparum [6]. Similarly, Smirnov et al. applied a comparable approach to investigate the binding and internalization of Neisseria gonorrhoeae into human neutrophils [7].
Herein, we present a comprehensive pipeline for the acquisition, processing, and statistical analysis of internalization data for fluorescently labeled chemical compounds using the Amnis imaging flow cytometry platform (Cytek, USA). We demonstrate its application in an experiment investigating the uptake of PS- and PS/LNA-modified antisense oligonucleotides into cells of the human immortalized lymphoid line MT-4, as previously described in a preprint by Gotfrid et al. [8].
2. Materials and Methods
2.1. Cell Culture
The human immortalized lymphoid cell line MT-4 was used in this study. The cell line was obtained from the collection of the State Research Center of Virology and Biotechnology “Vector” (Rospotrebnadzor, Russia). Cells were maintained in RPMI-1640 medium (Gibco, USA) supplemented with 10% heat-inactivated fetal bovine serum (Gibco, USA), 2 mM L-glutamine, and 20 μg/mL gentamicin. Cultures were grown in T-25 suspension flasks (Eppendorf, Germany) at 37 °C in a humidified atmosphere of 5% CO2. Cells were seeded at a density of 350,000 cells per mL of complete growth medium and subcultured every 3–4 days.
2.2. Antisense Oligonucleotides and Cell Treatment
Fully phosphorothioate-modified antisense oligonucleotides were studied, with select compounds containing LNA modifications at their 3′ and/or 5′ termini. All oligonucleotides were 5′-end labeled with a FAM fluorophore (Table 1).
Cells were seeded into culture flasks at 7 mL of growth medium per flask, with a concentration of 1×10⁶ cells/mL. The corresponding antisense oligonucleotides were added to each sample to a final concentration of 2×10⁻⁴ M. Incubation times were 1, 4, 12, 24, 36, and 48 hours.
2.3. Imaging Flow Cytometry
The internalization capacity of the oligonucleotides was assessed using imaging flow cytometry on an Amnis FlowSight platform (Cytek® Biosciences, USA). Excitation of the FAM fluorophore conjugated to the oligonucleotides, the vital dye propidium iodide (PI), and brightfield imaging were performed using a 488 nm laser operating at 60 mW (with filter configurations 532/55, 610/30, and 457/45, respectively). Images were acquired at a 20× overall magnification (objective numerical aperture = 0.6) and a pixel size of 1 × 1 μm.
2.4. Confocal Microscopy
Imaging was performed using an Olympus FV3000 laser scanning confocal microscope (Olympus, Japan). For image acquisition, 488 nm (AOS-FAM, 10% power) and 642 nm (CD4-AF700, BF, 50% power) lasers were employed. Detection was carried out using high-sensitivity detectors (HSD1 and HSD2) set at 500 V.
2.5. Required Reagents
- 1x DPBS, without Ca2+ and Mg2+ (Gibco, USA)—DPBS is preferred for working with live cells, although standard 1x PBS (Gibco, USA) can be used as an alternative.
- Propidium iodide (PI), 0.1 µg/mL working solution (Lumiprobe, Russia)
- 1.5 mL microcentrifuge tubes (Eppendorf, Germany)
- Antibodies against CD4 or other surface markers (optional), e.g., CD4 Monoclonal Antibody (RPA-T4), Alexa Fluor™ 700 (Thermo Fisher Scientific, USA)
- 0.4% Trypan Blue solution (Dia M, Russia)
2.6. Required Equipment
- Class II biological safety cabinet, model BMB-II-”Laminar-S”-1.2 NEOTERIC (Lamsystems, Russia)
- Microcentrifuge with a rotor for 1.5 mL tubes, model Mini Spin Plus (Eppendorf, Germany)
- CO2 incubator
- Automated cell counter, model LUNA-FL™ (Logos Biosystems, Inc., Republic of Korea)
- Imaging flow cytometer, model Amnis FlowSight (Cytek Biosciences, USA)
2.7. Required Software
- INSPIRE™ software (Cytek Biosciences, USA)—for data acquisition.
- IDEAS® 6.2 software (Cytek Biosciences, USA)—for imaging flow cytometry data analysis.
- FluoSta v.1.0—in-house developed software for statistical analysis of IDEAS reports (Supplementary Materials, https://github.com/SirenOmica/FluoSta).
- Microsoft Excel (Microsoft, Redmond, USA; optional)—for transfer and additional processing of statistical results.
2.8. Sample Preparation and Data Acquisition Using INSPIRE
- Incubate the test compound with cells in an appropriate culture medium. In this study, MT-4 cells were cultured in RPMI-1640 medium (Gibco, USA) supplemented with 10% FBS (Gibco, USA) and 0.001% PenStrep (Gibco, USA) for 48 hours. Aliquots (≈1 × 10⁶ cells) were collected after 1, 4, 12, 24, 36, and 48 hours of incubation.
- Power on the imaging flow cytometer and perform the initial startup and calibration procedures.
- Transfer a cell sample into a 1.5 mL microcentrifuge tube. Centrifuge at 300 RCF for 5 minutes (centrifugation conditions may require optimization).
- Carefully aspirate the supernatant. Resuspend the cell pellet in 500 µL of 1x DPBS (without Ca2+ and Mg2+).
- Centrifuge at 300 RCF for 5 minutes.
- Aspirate the supernatant. Resuspend the cell pellet in 500 µL of 1x DPBS.
- Centrifuge at 300 RCF for 5 minutes.
- Resuspend the final cell pellet in 100 µL of 1x DPBS containing 0.04% BSA.
- Optional: Add 5 µL of antibodies against surface antigens to the cell suspension. Incubate for 1 hour at room temperature (optimized staining conditions, as per the antibody manufacturer’s protocol, are strongly recommended). Add 400 µL of 1x DPBS to the cells and resuspend. Centrifuge at 300 RCF for 5 minutes. Aspirate the supernatant. Resuspend the cells in 100 µL of 1x DPBS with 0.04% BSA.
- Place all sample tubes at +4 °C. For data acquisition, remove tubes from the refrigerator one at a time to minimize the duration cells are exposed to room temperature.
- For acquisition, take one tube. Add 2 µL of PI (0.1 µg/mL working solution), mix gently, and incubate for 5 minutes protected from light.
- Place the tube containing the stained cell suspension into the Amnis sample loader. Acquire data for single, live cells (Figure 1). Live cells should exhibit no PI fluorescence signal (intensity level <1 × 10⁴). We recommend collecting 3-5 technical replicates per cell suspension sample.
Note 1: It is critical to remember that subsequent analysis in IDEAS 6.2 requires a compensation matrix, for which compensation controls are essential. At the beginning or in the middle of the experiment, allocate an additional sample for the experimental fluorophore control (e.g., cells stained with the fluorescent chemical compound only) and an additional sample for the PI control (cells stained with PI only).
2.9. Analysis of Results in IDEAS 6.2
Note 1: An analysis template for IDEAS 6.2 is provided in the Supplementary Materials. This template may require optimization for specific cell morphologies and other fluorescent labels used.
The provided template includes the following sequential gating steps:
- Gating of in-focus cells. Cells that are not in focus cannot be accurately analyzed for fluorescence intensity.
- Gating of the population passing through the interrogation point 20–30 seconds after the start of acquisition. This step excludes potential carryover events from the previous sample.
- Gating of single cells. Despite resuspension and a stable laminar flow, some events may represent two or more cells clumped together, which would be recorded as a single event with inaccurate fluorescence and morphology measurements.
- Gating of live cells. Dead cells often exhibit high autofluorescence and nonspecific uptake of chemical compounds.
- Gating of the population of cells that have internalized the chemical compound versus the non-internalized population.
- Creation of image masks to define the cytoplasmic region (AdaptiveErode (M01, Ch01, 70)) and the plasma membrane region (Object (M01, Ch01, Tight) And Not AdaptiveErode (M01, Ch01, 70)).
- Calculation of new parameters: Perimeter (M01, Ch01), Circularity (M01, Ch01), and Entropy (M02, Ch2, 1 µm).
- Gating of cells exhibiting a fluorescent signal specifically within the cytoplasmic mask region.
2.10. Analysis of Results in IDEAS 6.2
For statistical analysis of the results, software (FluoSta v1.0) was developed using the R language v. 4.4.2 (R Foundation for Statistical Computing, 2024; Vienna, Austria). This software enables comprehensive processing of tabular results (in txt format generated by IDEAS) and performs a standard set of statistical tests and visualizations. The software outputs descriptive statistics of the data (mean with standard deviation (SD)) and comparative statistics. FluoSta indicates the significance of differences between all studied substances (One-way ANOVA with reporting of Fisher’s criterion (F-statistic)), in this case—between antisense oligonucleotides with different chemical modifications, as well as pairwise comparisons between specific chemical modifications (Tukey HSD test). The contribution of modifications to changes in the studied trait is investigated using omega-squared (ω2). Effect size for the difference between two modifications is estimated using Cohen’s d. For comparisons of samples within a single chronological time point, Repeated Measures ANOVA (RM-ANOVA) is used, followed by pairwise comparisons between time points using pairwise t-tests. The contribution of incubation time to changes in the studied parameter is expressed using the generalized eta-squared (GES) measure. Effect size between two time points is assessed using Cohen’s dz. All pairwise comparisons are performed with the application of the Benjamini-Hochberg correction.
2.11. Procedure for Using FluoSta v.1.0
- Launch the installer (FluoStaInstaller.exe). Open the program and read the README file containing usage tips.
- In the pop-up menu, select the statistical reports (.txt) generated by IDEAS 6.2.
- Specify the incubation time for each .txt file. Run the program. If necessary, change the order of time points in the “Order of time points” section.
- The open window of FluoSta displays descriptive statistics, comparative analysis, and interactive graphs for data visualization. You can use the statistical analysis results to compare parameters of a single compound over time (tab RM-ANOVA & t-tests), as well as to compare different compounds at a single chronological time point (tab ANOVA & Tukey). In the output, you can download a file in .xlsx format with your statistical analysis. Two display modes are available for the graphs. If needed, graphs can be downloaded in PNG format by clicking the camera icon.
Note 1: Statistical tests for multiple comparisons may yield incorrect results with low data variance; therefore, we recommend using at least three biological replicates to avoid this situation.
Note 2: The statistical analysis will be incomplete if for any compound there is not at least two biological replicate present at each chronological time point (it is preferable to avoid complete absence of a compound at any time point).
Note 3: Flow cytometry output data files (.daf) must have the same name throughout the experiment so that the software can identify them as a single sample for statistical analysis. For example, files for the first biological replicate of cells incubated with the 3`LNA antisense oligonucleotide should be named 3`LNA_1 throughout the experiment, while the second biological replicate should be named 3`LNA_2, etc. Do not include space, incubation time in the .daf file name; instead, indicate the chronological point in the final TXT report. You will be able to assign the incubation time within the program via a pop-up window after loading the statistical reports (.txt).
3. Results
3.1. Data Acquisition in INSPIRE
The generation of raw image files (.rif) from cell imaging on the Amnis FlowSight is not the most labor-intensive stage; however, it can significantly streamline subsequent analysis and enhance the statistical power of the study through effective gating of cells relevant for downstream processing. This requires the acquisition of single cells, excluding debris and doublets. If compound toxicity is being assessed in your experiment by an independent method, such as an MTT assay, it is preferable to acquire single, live cells. The gating strategy for identifying single cells does not require a compensation matrix and is based on a plot of cell area versus aspect ratio (Figure 1).
It is preferable to acquire not just single cells, but single, live cells. An exception to this is situations where it is necessary to assess compound toxicity using imaging flow cytometry. Single, live cells can be gated with or without a PI compensation matrix (Figure 2).
In our experiment, visualizing the plots during acquisition of live cells with and without a compensation matrix had a negligible impact on the proportion of gated viable cells: 78.9% of all single cells without compensation versus 80.8% when using the compensation matrix (see Figure 2). However, we strongly recommend employing this matrix, as the difference may become more substantial when using a larger number of fluorophores.
3.2. Analysis of Results in IDEAS
Implementation of the developed imaging flow cytometry data analysis pipeline enabled robust differentiation between the localization of fluorescently labeled antisense oligonucleotides associated with the plasma membrane and signal residing within the cytoplasm. The provided analysis template for IDEAS (Supplementary Materials) can be adapted for specific cell types and fluorophores. We also provide tutorial materials, including several datasets featuring compound internalization studies and investigations of HIV cytopathic effects. While the template is specifically optimized for internalization research, the open-source statistical processing code is compatible with any experimental design.
Analysis of raw image files (.rif) quantifies: the number of viable single cells that have absorbed the compound (either membrane-associated or cytoplasmic), the proportion of cells with internalized probe, and the entropy of the compound’s distribution within the cytoplasm. The gating strategy is illustrated in Figure 3.
Based on the final parameter, an internalization coefficient is calculated, defined as the logarithmic ratio of fluorescence intensity in the cytoplasmic mask region to the fluorescence of the entire cell (base “Object” mask) [9]. To assess the distribution of the chemical compound within the cytoplasm, the Shannon entropy parameter is used: higher values indicate more uniform signal distribution—without areas where fluorescence intensity is markedly stronger than the average (see Figure 4).
The final step in IDEAS involves generating a statistical report. To accomplish this, navigate to the menu tabs Report > Define statistic report and select the parameters specified in the IDEAS template. These parameters include total cell count, count of viable single cells (Count, viable cells & single cells & time & focus) and their percentage, count of cells with signal absorption, percentage of cells with signal absorption, median entropy, etc. (Figure 5).
Once the statistical report is compiled, IDEAS generates a .txt file, which should be named according to the chemical compound and incubation period analyzed. Each .txt file must contain parameter data for all compounds studied at a single timepoint. As part of the developed pipeline, these .txt files are subsequently imported into the statistical analysis software.
In our internalization time-course study with PS- and PS/LNA-modified antisense oligonucleotides in the MT-4 cell line, the developed pipeline enabled detection of significant differences between the compounds. PS-modified antisense oligonucleotides demonstrated faster and more efficient internalization compared to PS/LNA-modified nucleotides (Figure 6).
These antisense oligonucleotides were not complexed with any delivery vehicles, so their bioavailability was determined exclusively by their chemical properties. It is recognized that LNA modification enhances cytoplasmic stability via improved nuclease resistance, though its stereochemical properties may also affect membrane permeability.
Additionally, high entropy values for the AOS-FAM fluorescent signal in our study revealed the ability of the AOS to spread throughout the cytoplasmic content, reflecting endocytic entry and subsequent partial degradation. Upon degradation, antisense oligonucleotides retain their fluorescent signal within endosomes, resulting in regions of locally elevated fluorescence intensity, and thus, low entropy. However, if the compound’s target is a specific cellular compartment or organelle, high entropy values indicate impaired delivery to the intended destination.
3.3. Validation of Imaging Flow Cytometry Results by Confocal Microscopy
To verify the results obtained with imaging flow cytometry, laser scanning confocal microscopy was employed using AOS-FAM and CD4-AF700 as fluorescent markers. Quantitative comparisons—including the number of cells absorbing the compound and the number exhibiting probe internalization—revealed no statistically significant differences (p > 0.05) between the two methods. For example, following a 4-hour incubation with the antisense oligonucleotide Int, the percentage of cells displaying probe internalization was 97.4% (SD ± 0.131) as measured by imaging flow cytometry, compared to 93.6% (SD ± 0.74) obtained by manual cell counting in confocal micrographs.
Confocal microscopy was also used to confirm probe internalization in cells that visually exhibited intracellular signal localization. For this purpose, we measured 1D fluorescence intensity profiles of cells with visually confirmed internalized signal and those without (Figure 7).
It should be noted that the fluorescent signal in cells without internalization does not extend beyond the “framework” of the fluorescent signal from AF700 conjugated to CD4 (Figure 7F,G). Furthermore, we quantified the colocalization of AOS-FAM and CD4-AF700 signals using Pearson’s correlation coefficient (R): in cells without compound internalization, this coefficient was positive, indicating that AOS molecules were located adjacent to CD4, i.e., near the cytoplasmic membrane. Conversely, cells exhibiting pronounced compound internalization showed negative R values, indicating fewer AOS-FAM fluorescent signals were adjacent to CD4-AF700 signals (Figure 7F,G).
3.4. Statistical Analysis in FluoSta v.1.0
The final stage of the pipeline involves utilizing the developed FluoSta software (v.1.0), which facilitates the generation of descriptive statistics, comparisons between different compounds at individual time points, and longitudinal comparisons of parameters for a single compound across multiple time points.
FluoSta is implemented in R (utilizing packages: shiny, shinybusy, openxlsx, ez, dplyr, effectsize, plotly, RColorBrewer) and is available in two formats: as a executable installer (incorporating the appropriate R version and all necessary libraries) or as an R script executable within RStudio.
Prior to launching the program, we recommend reviewing the README.txt file containing usage guidelines. This document includes information about training datasets, interpretation of calculated metrics, and the necessity of maintaining consistent naming conventions for compounds and their biological replicates throughout the experiment to enable FluoSta to identify them as a unified sample (refer to Materials and Methods, Statistical Analysis in Rstudio, Note 3). The program’s graphical interface (opens in a web browser) comprises several sections (Figure 8).
The application loads tabular *.txt files (one file per time point) containing a “File” column. This column contains entries with the expected object name in the format <object>_<Num>.daf, where <object> represents the object name (which must remain identical for each object throughout the experiment across all time points and text files; without space in name), and <Num> indicates the tube number. The software subsequently calculates statistical metrics and generates plots.
Descriptive statistics (under “Descriptive statistics” tab) include means and SD for each object×time combination. The “ANOVA & Tukey” tab performs comparisons between groups/modifications/objects at each investigated time point. This analysis calculates Fisher’s criterion from one-way ANOVA with effect significance estimation using ω2 (proportion of trait variance explained by the “modification” factor) with 95% confidence interval (CI). For pairwise comparisons between groups, statistical significance is assessed using Tukey HSD test, while effect size between groups is reported as Cohen’s d.
For comparisons of different time points within a single group, RM-ANOVA is employed with GES calculation (proportion of trait variation explained by the “incubation time” factor) with 95% CI. Comparisons between two time points utilize pairwise t-tests and Cohen’s dz as effect size measure.
The “Excluded tubes/samples” tab contains a list of tubes excluded from comparative analysis (with reasons for exclusion: absence of tubes at certain time points, zero variance, insufficient data, etc.). Analysis results are exported to Excel (Results.xlsx and Results_raw.xlsx).
The statistical analysis performed by FluoSta v.1.0 includes descriptive statistics reporting mean values with SD, ANOVA with Tukey HSD test for identifying differences between different compounds (samples), and RM-ANOVA with pairwise t-test for detecting differences in parameters of a single sample over time. Additionally, the program generates dot plots based on provided results, displaying means with SD and incubation time. FluoSta v.1.0 operates without requiring internet connection.
4. Discussion
The proposed analytical pipeline for investigating chemical compound internalization, based on imaging flow cytometry, integrates the complementary strengths of conventional flow cytometry (high statistical power through analysis of large cell populations) and microscopy (precise signal localization information). This methodological approach is consistent with several previously reported strategies. For instance, Smirnov et al. developed a protocol quantifying Neisseria gonorrhoeae uptake by neutrophils using imaging flow cytometry, where simultaneous intracellular and bacterial labeling enabled automated discrimination between cells without bacteria, cells with non-colocalized signals, and cells with colocalized signals indicating bacterial internalization [7]. Similarly, Ofir-Birin et al. employed imaging flow cytometry to monitor uptake of malaria parasite-derived exosomes by target cells, quantifying fluorescently labeled extracellular vesicles as intracellular “spots” and calculating the percentage of cells with internalization, using comparable gating strategies and biologically relevant features [6].
Our workflow expands upon these principles through the creation of cytoplasmic and membrane masks and calculation of the fluorescence ratio within the cytoplasmic mask relative to total cellular fluorescence. Furthermore, we introduce a novel signal distribution entropy parameter to quantitatively assess the uniformity of chemical compound distribution within the cytoplasm. Unlike conventional flow cytometry, imaging flow cytometry enables clear differentiation between surface-adsorbed and internalized signals. This capability has been demonstrated in nanoparticle uptake studies where computational separation of extracellular and intracellular regions allowed accurate calculation of internalization coefficients without requiring chemical surface washing [10], a principle similarly implemented in our approach.
Confocal microscopy provides superior spatial resolution for precise subcellular localization, making it ideal for detailed visualization of receptor internalization (e.g., G protein-coupled receptors) and subsequent intracellular trafficking in individual cells [11]. Imaging flow cytometry effectively bridges these methodologies by combining the statistical robustness of conventional flow cytometry with the spatial localization capabilities of microscopy.
A key feature of our pipeline is the developed FluoSta v1.0 application, which automates statistical analysis of imaging flow cytometry data. The software imports IDEAS-generated reports, computes descriptive statistics, performs ANOVA with pairwise post-hoc comparisons, and generates publication-quality visualizations. All processing occurs locally on standard personal computers without internet dependency, ensuring accessibility, reproducibility, and data security for users without programming expertise. FluoSta v1.0 significantly simplifies identification of statistically significant differences between experimental conditions while accounting for temporal dynamics and biological replication, thereby enhancing the interpretative power and scope of our analytical framework.
Notwithstanding these advantages, several limitations warrant consideration. The relatively limited availability of imaging flow cytometers in routine laboratory settings may restrict immediate widespread adoption. Additionally, the IDEAS analysis template may require optimization for specific cell morphologies, particularly regarding cytoplasmic mask generation. The entropy parameter additionally requires careful consideration of fluorescence spot dimensionality, which varies substantially between large molecular complexes (spanning multiple pixels) and small chemical compounds such as antisense oligonucleotides (exhibiting minimal fluorescence from individual molecules).
5. Conclusions
We developed an analytical pipeline for quantifying compound internalization using imaging flow cytometry. This approach is distinguished by its comprehensive and semi-automated analysis, uniquely combining the high statistical power of conventional flow cytometry (through analysis of thousands of cells) with high-content spatial information on fluorescent label localization. The proposed IDEAS analysis template, together with our dedicated FluoSta v.1.0 software for statistical processing, enables rapid and reliable data interpretation. This integrated solution ensures accessibility for early-career researchers who may not be fully familiar with the advanced functionalities of IDEAS or specialized statistical methods.
Supplementary Materials
The following supporting information can be downloaded at: https://disk.yandex.ru/d/E0WrvQNeCRCnAA (temporary measure due to technical issues with uploading heavy Amnis files to Zenodo), compensation matrix file for Example dataset 1: compensation_matrix_dataset1.ctm; compensation matrix file for Example dataset 2: compensation_matrix_dataset2; an IDEAS template for studying the internalization of chemical compounds: Main_template.ast; an IDEAS template Example dataset 2: template_dataset2.ast; raw .rif Amnis files from Example dataset1 and Example dataset 2; FluoSta .exe installer.
Author Contributions
Conceptualization, Kirill Elfimov; methodology, Kirill Elfimov, Ludmila Gotfrid, Alina Nokhova, Maria Gashnikova; software, Alina Nokhova; validation, Kirill Elfimov, Alina Nokhova, Aleksei Totmenin, Dmitriy Baboshko; formal analysis, Kirill Elfimov, Alina Nokhova, Aleksei Totmenin; investigation, Kirill Elfimov, Ludmila Gotfrid; resources, Aleksei Totmenin, Natalya Gashnikova; data curation, Natalya Gashnikova; writing—Kirill Elfimov, Alina Nokhova; writing—review and editing, Ludmila Gotfrid, Natalya Gashnikova; visualization, Kirill Elfimov, Alina Nokhova; supervision, Natalya Gashnikova; project administration, Aleksandr Agaphonov; funding acquisition, Natalya Gashnikova, Aleksandr Agaphonov. All authors have read and agreed to the published version of the manuscript.
Funding
Federal Service for Surveillance on Consumer Rights Protection and Human Wellbeing: State Assignment no. 1/23 (FBRI SRC VB ‘Vector’ Rospotrebnadzor) supported this research.
Institutional Review Board Statement
Not applicable.
Informed Consent Statement
Not applicable.
Data Availability Statement
Data is contained within the article or Supplementary Material.
Acknowledgments
The team of authors would like to express their gratitude to Grigory Alexandrovich Marchenko for consultations on the use of imaging flow cytometry.
Conflicts of Interest
The authors declare no conflicts of interest.
References
- Stincarelli, M.A.; Rocca, A.; Antonelli, A.; Rossolini, G.M.; Giannecchini, S. Antiviral Activity of Oligonucleotides Targeting the SARS-CoV-2 Genomic RNA Stem-Loop Sequences within the 3′-End of the ORF1b. Pathogens 2022, 11, 1286. [Google Scholar] [CrossRef] [PubMed]
- Mumcuoglu, D.; Sardan Ekiz, M.; Gunay, G.; Tekinay, T.; Tekinay, A.B.; Guler, M.O. Cellular Internalization of Therapeutic Oligonucleotides by Peptide Amphiphile Nanofibers and Nanospheres. ACS Appl. Mater. Interfaces 2016, 8, 11280–11287. [Google Scholar] [CrossRef] [PubMed]
- Crooke, S.T.; Wang, S.; Vickers, T.A.; Shen, W.; Liang, X. Cellular Uptake and Trafficking of Antisense Oligonucleotides. Nat Biotechnol 2017, 35, 230–237. [Google Scholar] [CrossRef] [PubMed]
- Bennett, C.F.; Swayze, E.E. RNA Targeting Therapeutics: Molecular Mechanisms of Antisense Oligonucleotides as a Therapeutic Platform. Annu. Rev. Pharmacol. Toxicol. 2010, 50, 259–293. [Google Scholar] [CrossRef] [PubMed]
- Illien, F.; Rodriguez, N.; Amoura, M.; Joliot, A.; Pallerla, M.; Cribier, S.; Burlina, F.; Sagan, S. Quantitative Fluorescence Spectroscopy and Flow Cytometry Analyses of Cell-Penetrating Peptides Internalization Pathways: Optimization, Pitfalls, Comparison with Mass Spectrometry Quantification. Sci Rep 2016, 6, 36938. [Google Scholar] [CrossRef] [PubMed]
- Ofir-Birin, Y.; Abou Karam, P.; Rudik, A.; Giladi, T.; Porat, Z.; Regev-Rudzki, N. Monitoring Extracellular Vesicle Cargo Active Uptake by Imaging Flow Cytometry. Front. Immunol. 2018, 9, 1011. [Google Scholar] [CrossRef]
- Smirnov, A.; Solga, M.D.; Lannigan, J.; Criss, A.K. High-Throughput Particle Uptake Analysis by Imaging Flow Cytometry. CP Cytometry 2017, 80, 11.22.1–11.22.17. [Google Scholar] [CrossRef]
- Gotfrid, L.G.; Elfimov, K.A.; Gashnikova, M.P.; Murzin, A.I.; Totmenin, A.V.; Gashnikova, N.M.; Gashnikova, N.M. Investigation of the Activity of LNA-Modified Phosphorothioate Oligonucleotides Against HIV-1; Biology and Life Sciences, 2025.
- García-Vallejo, J.J.; Bloem, K.; Knippels, L.M.J.; Garssen, J.; Van Vliet, S.J.; Van Kooyk, Y. The Consequences of Multiple Simultaneous C-Type Lectin–Ligand Interactions: DCIR Alters the Endo-Lysosomal Routing of DC-SIGN. Front. Immunol. 2015, 6, 87. [Google Scholar] [CrossRef] [PubMed]
- Vranic, S.; Boggetto, N.; Contremoulins, V.; Mornet, S.; Reinhardt, N.; Marano, F.; Baeza-Squiban, A.; Boland, S. Deciphering the Mechanisms of Cellular Uptake of Engineered Nanoparticles by Accurate Evaluation of Internalization Using Imaging Flow Cytometry. Part Fibre Toxicol 2013, 10, 2. [Google Scholar] [CrossRef] [PubMed]
- Yang, Y.; Chen, L.; Dong, M.; Huang, W.; Hao, X.; Peng, Y.; Gong, Z.; Qin, A.; Shang, S.; Yang, Z. Molecular Characterization of Bovine Leukemia Virus Reveals Existence of Genotype 4 in Chinese Dairy Cattle. Virol J 2019, 16, 108. [Google Scholar] [CrossRef] [PubMed]
Figure 1.
Event populations observed during data acquisition in INSPIRE. Debris, single cells, and cell doublets (clumps) are commonly observed. Subsequent analysis is based on the study of single cells; therefore, to analyze a greater number of these and increase statistical power, it is recommended to acquire only this population in INSPIRE (Cytek Biosciences, USA).
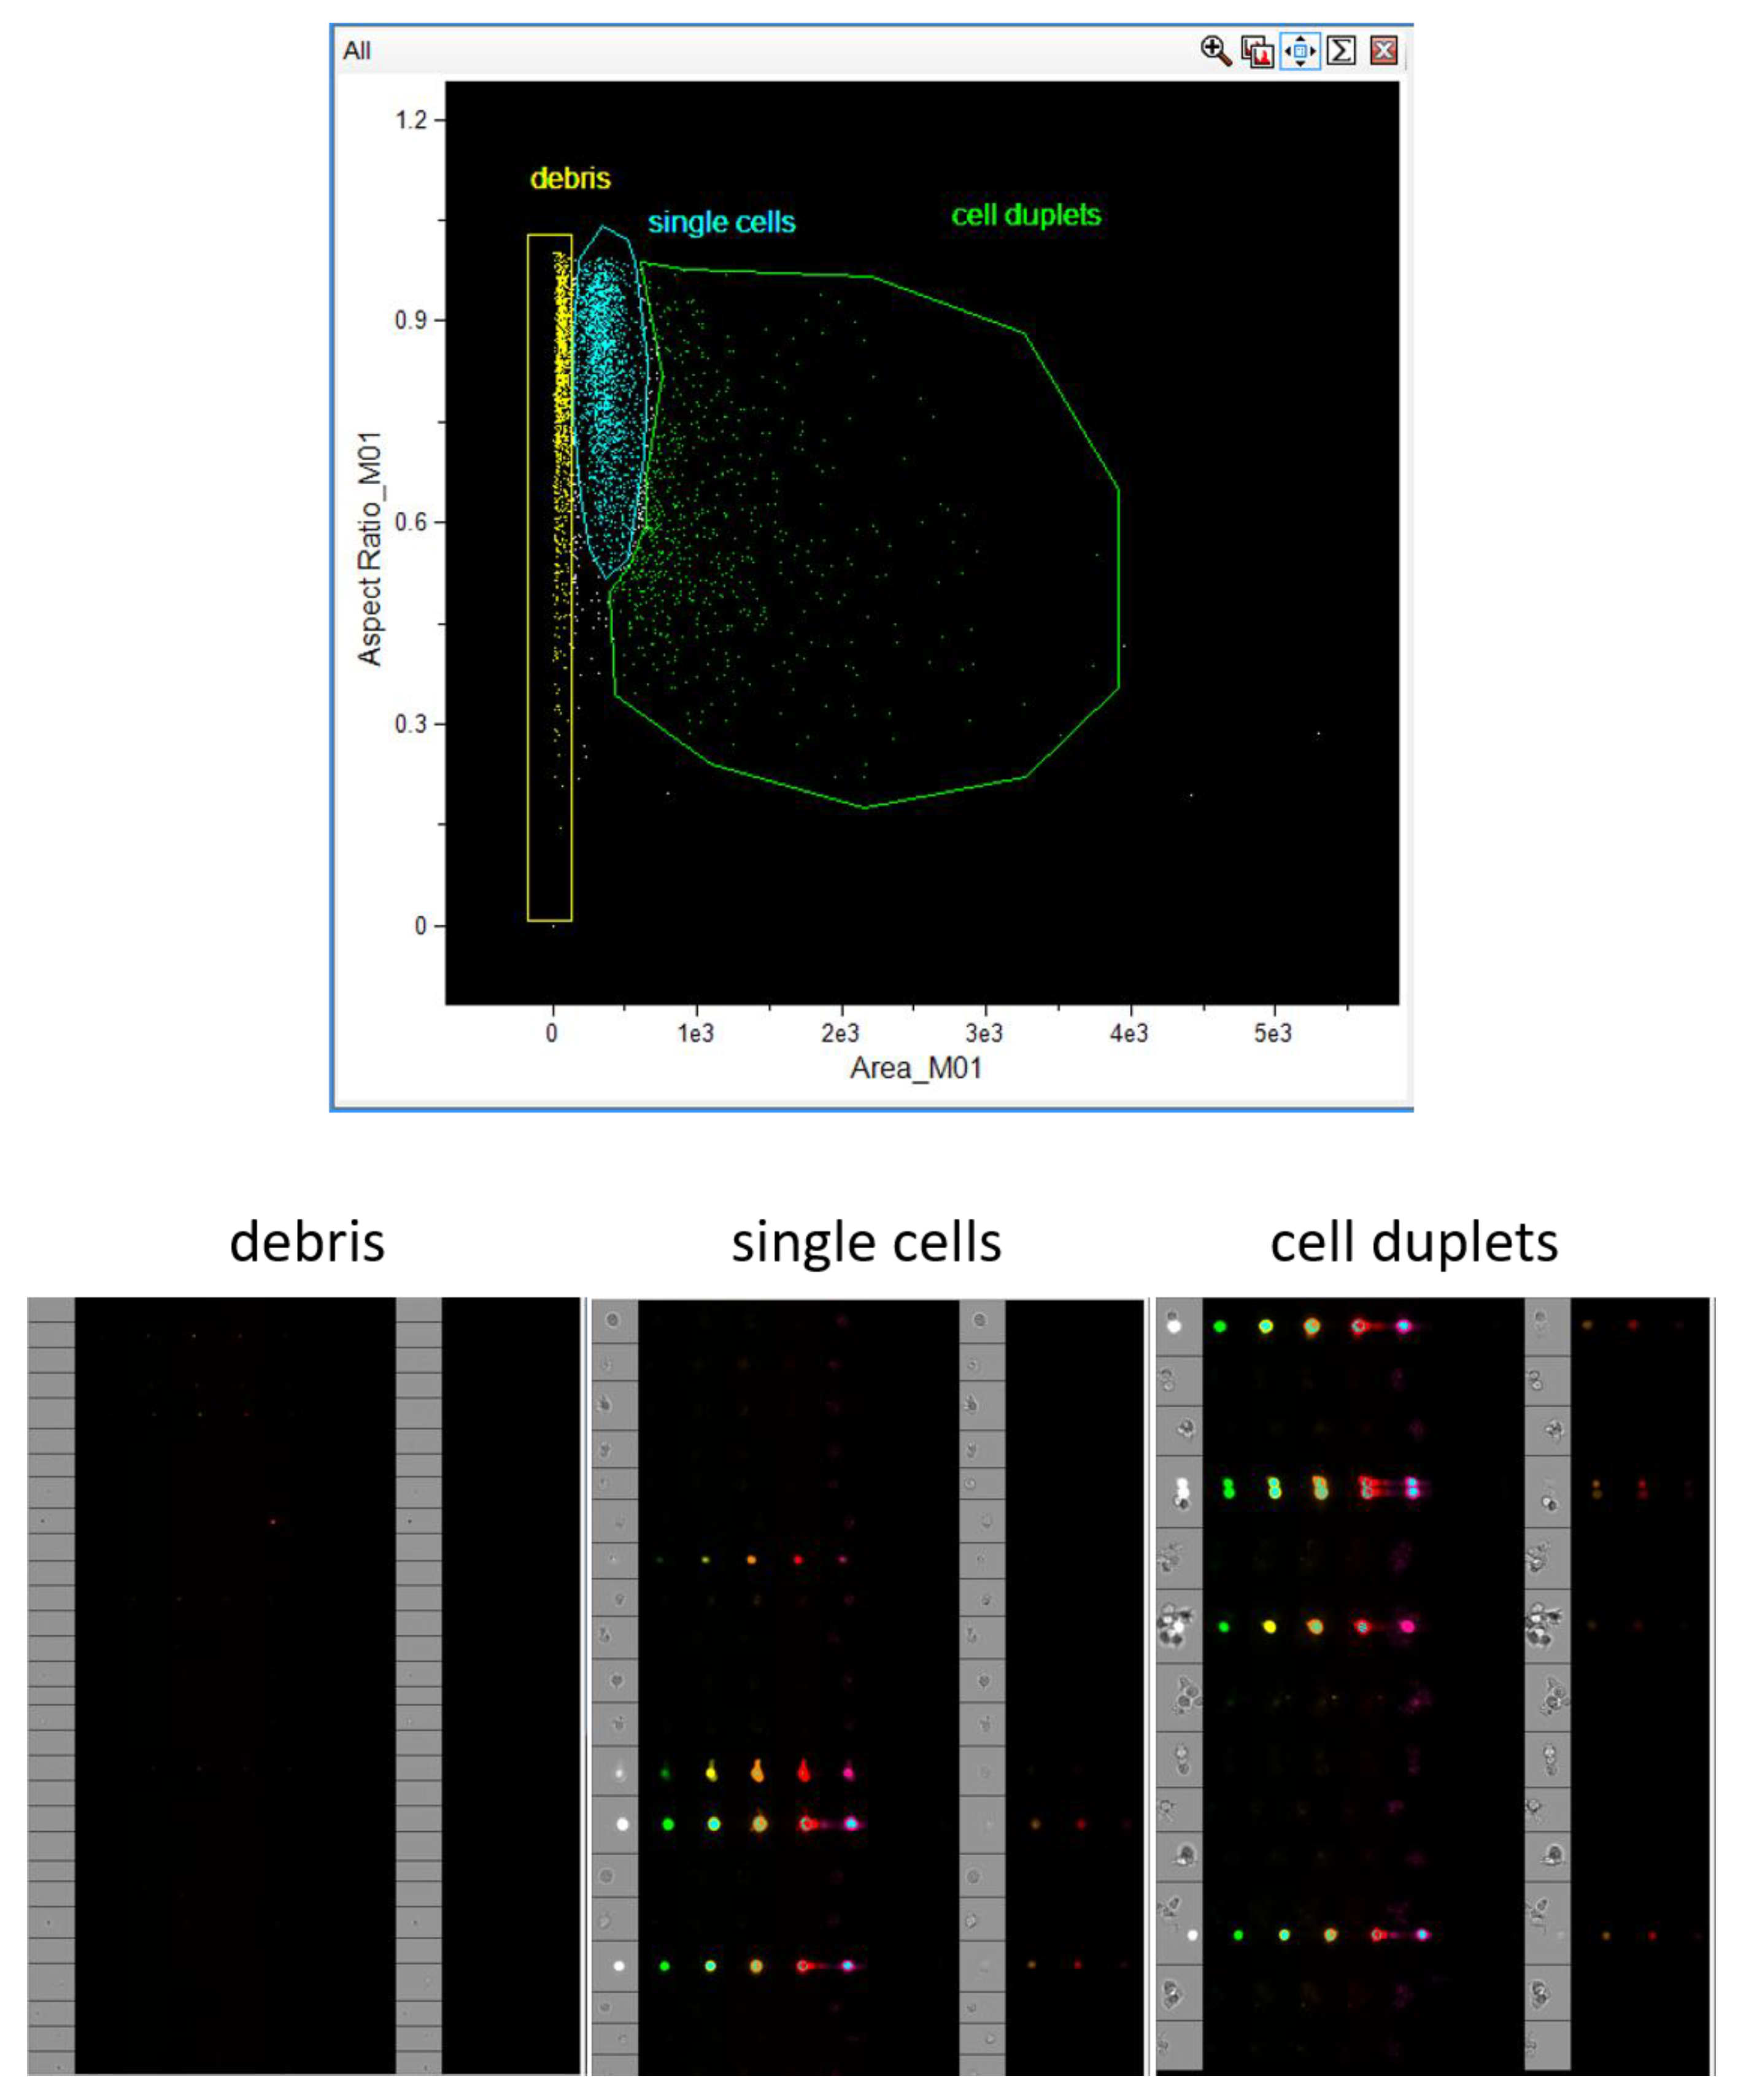
Figure 2.
Acquisition of single, live cells in INSPIRE (Cytek, USA): A—Gating of the live cell population (PI-negative) without a compensation matrix; B—Gating of the live cell population (PI-negative) using a compensation matrix; C—Image gallery of the single, live cell population acquired in INSPIRE; D—Image gallery of the dead cell population acquired in INSPIRE (Cytek Biosciences, USA).
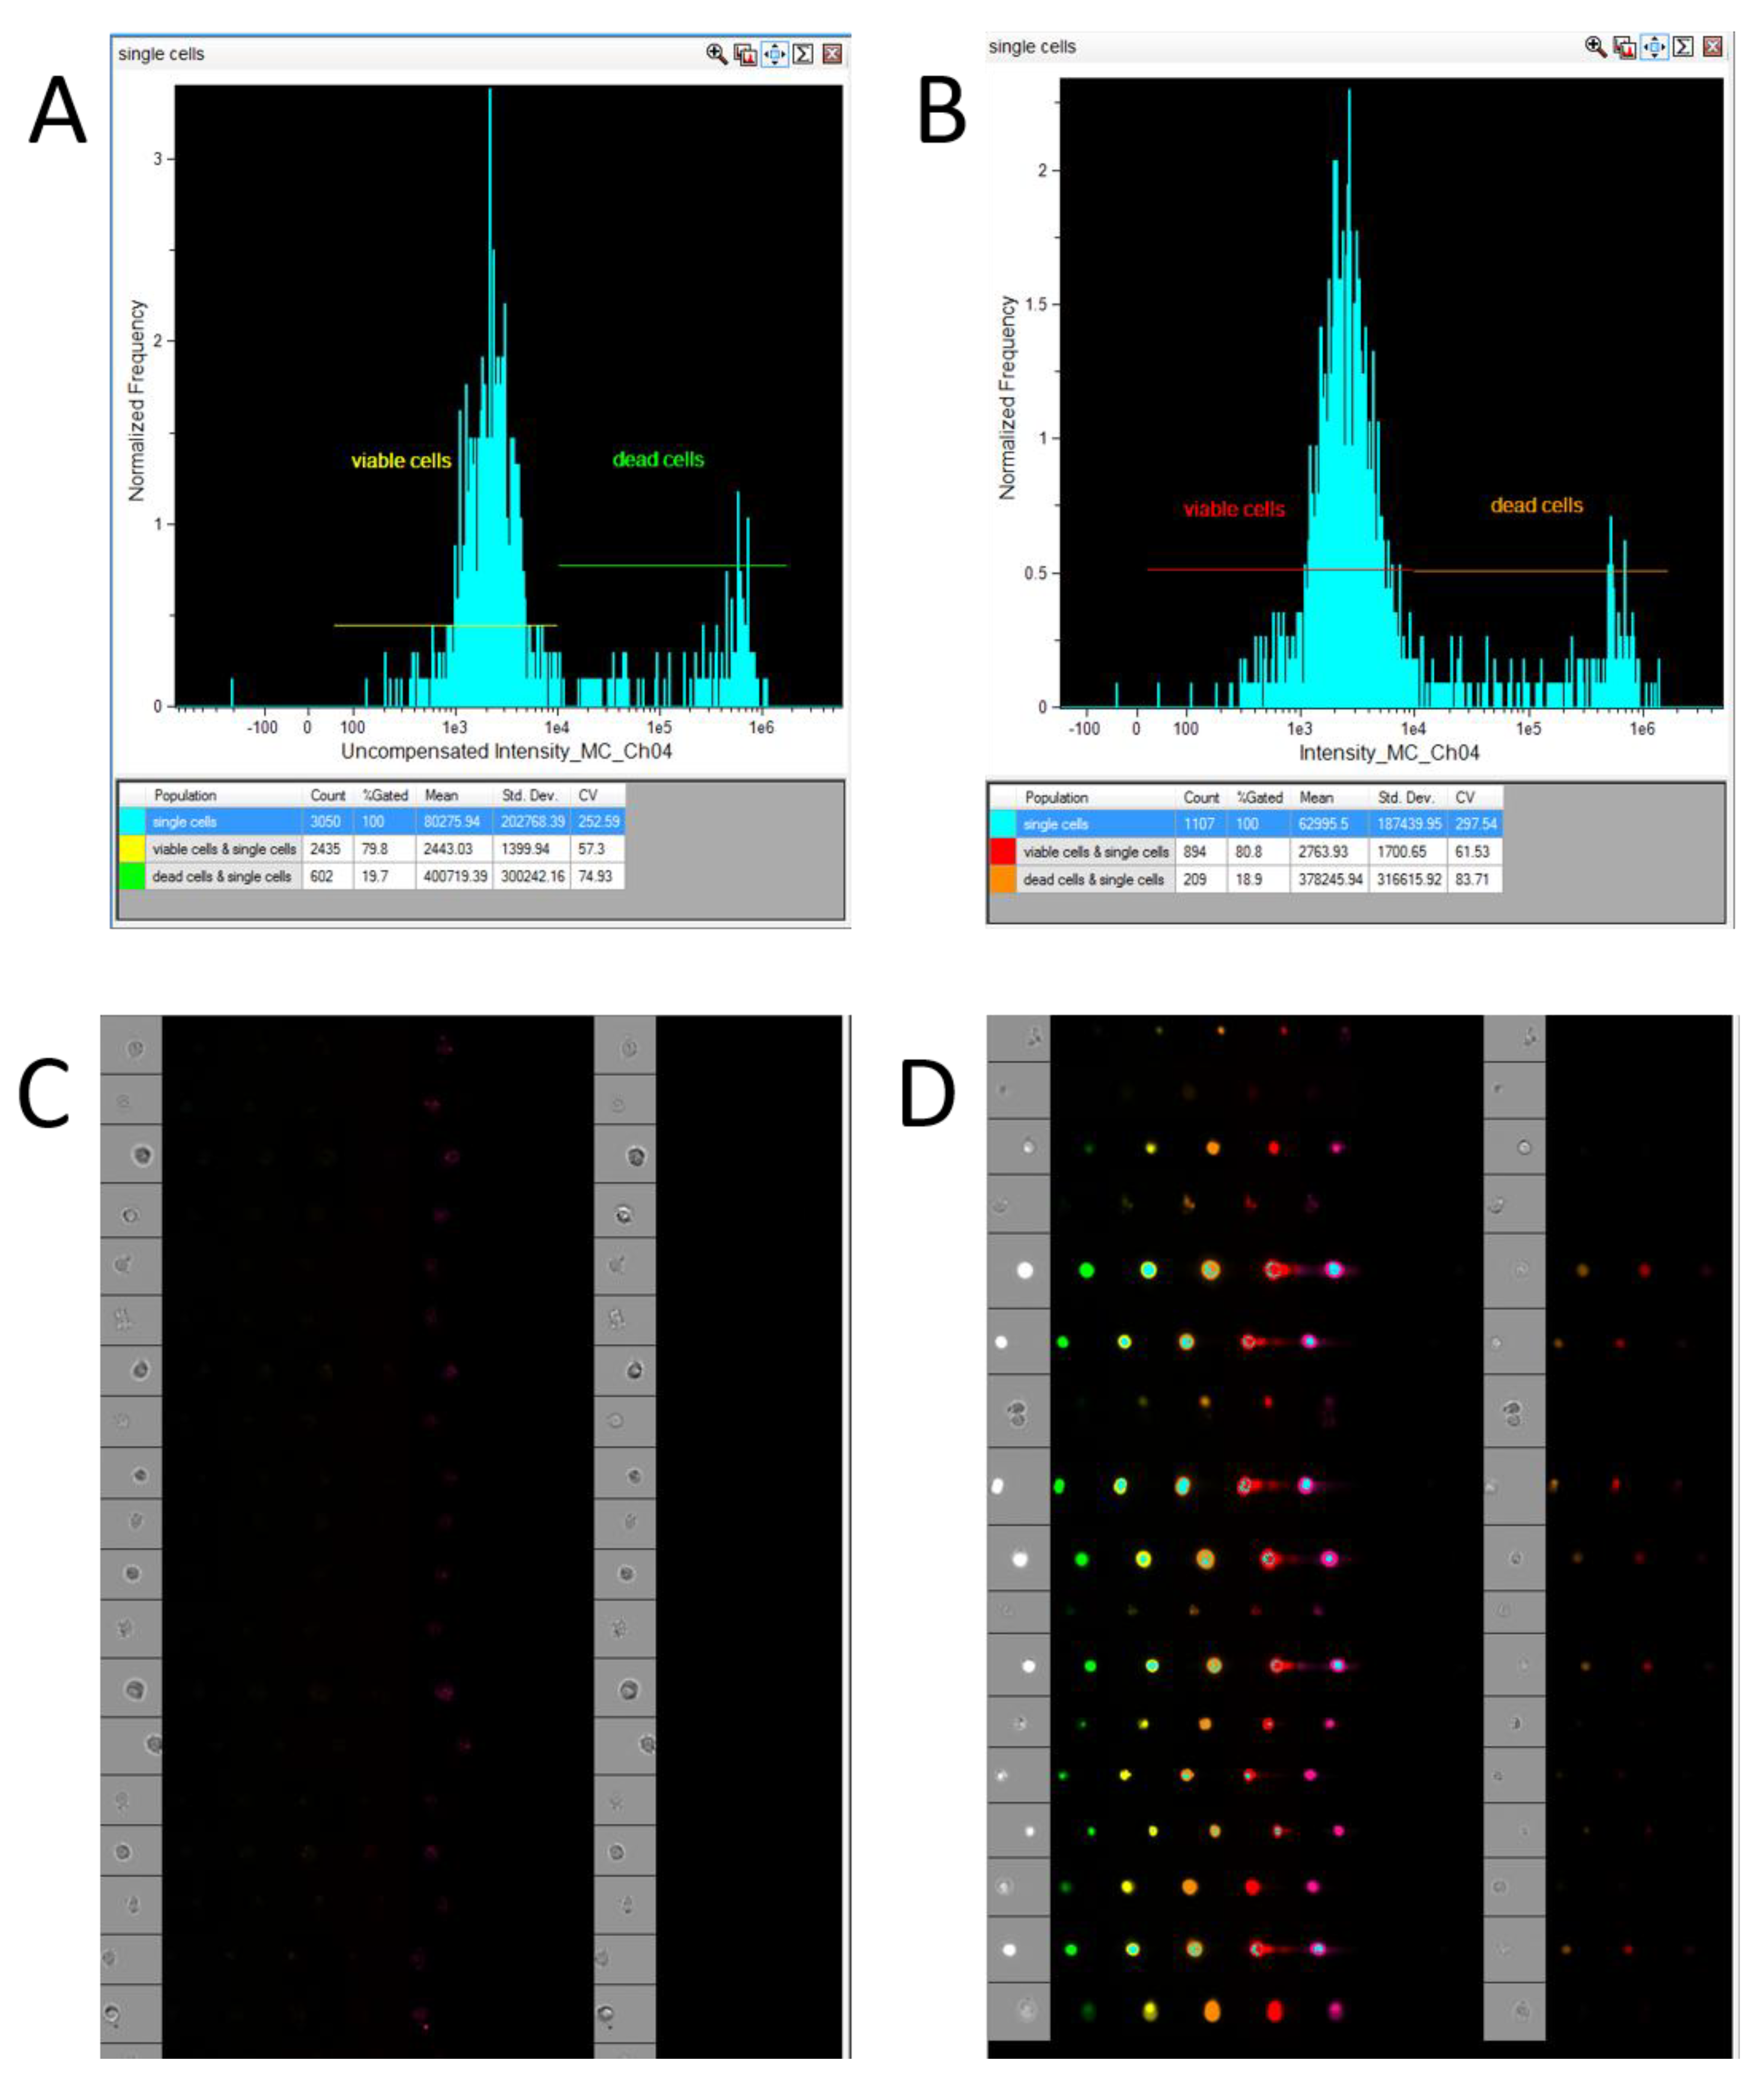
Figure 3.
Gating strategy for cell populations applied to analyze chemical compound internalization using the proposed IDEAS (Cytek Biosciences, USA) template: A—Selection of in-focus cells; B—Selection of cells passing through the flow cell after 20–30 seconds from the start of .rif file acquisition; C—Selection of single cells; D—Selection of viable cells; E—Selection of cells with compound absorption (membrane-associated or cytoplasmic); F—Selection of cells with compound internalization.
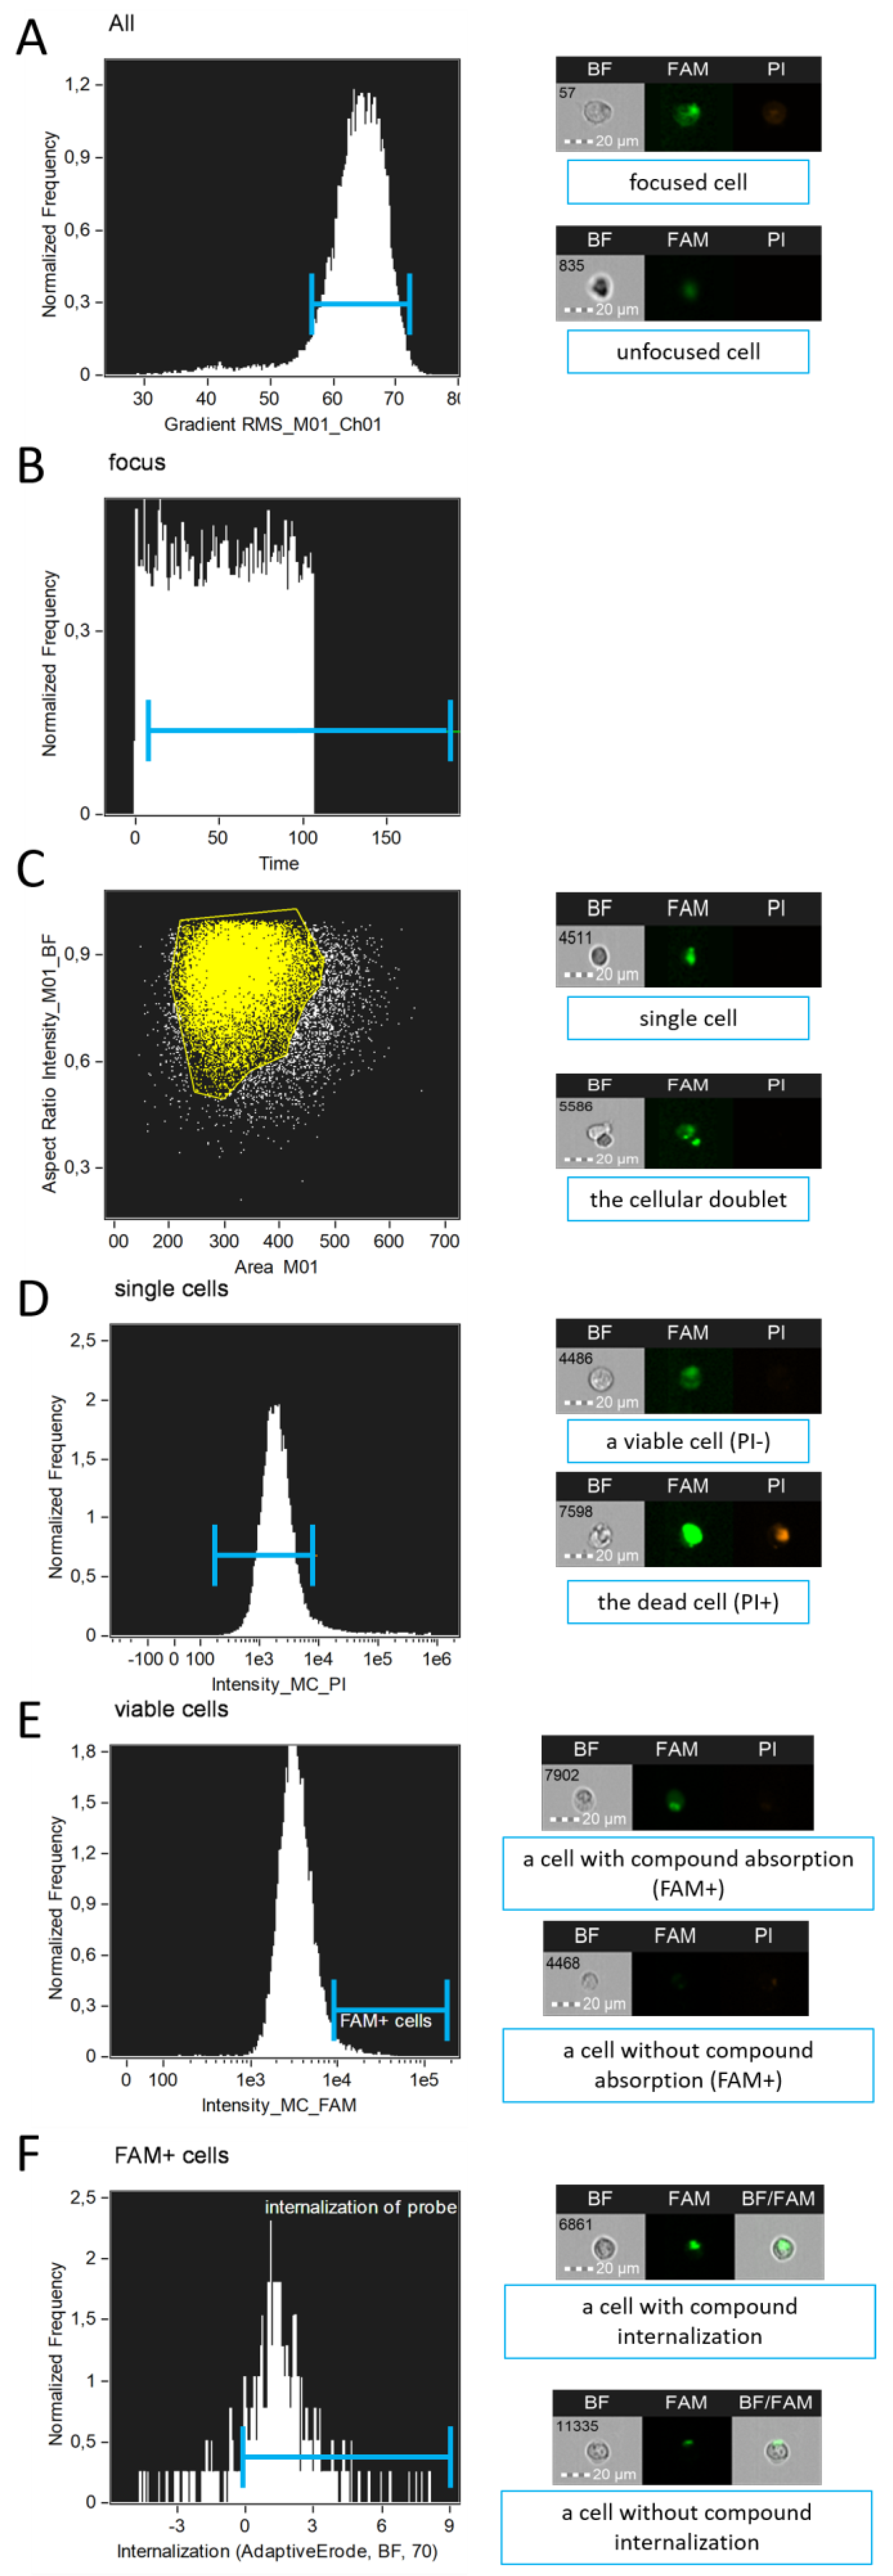
Figure 4.
Analysis of internalized compound entropy in MT-4 cell culture: A—Entropy plot generated using the Entropy parameter within the cytoplasmic mask, accompanied by representative imaging flow cytometry images of cells exhibiting low and high entropy. Images were acquired at 20x magnification (NA=0.6) on an Amnis FlowSight imaging flow cytometer (Cytek, USA); B—Confocal microscopy image of MT-4 cell culture following 4-hour incubation with a PS-modified antisense oligonucleotide (Int) conjugated to FAM. Image was acquired using an Olympus FV3000 confocal microscope with a UPLSAPO20X objective at 20x magnification (NA=0.75). Image acquisition utilized 488 nm (FAM, 10% power) and 642 nm (AF700, BF, 50% power) lasers. Detection was performed using high-sensitivity detectors (HSD1 and HSD2) at 500 V. Scale bar is located in the lower right corner of images (20 µm size). Cells with low and high AOS-FAM fluorescence entropy are indicated by arrows with corresponding labels.
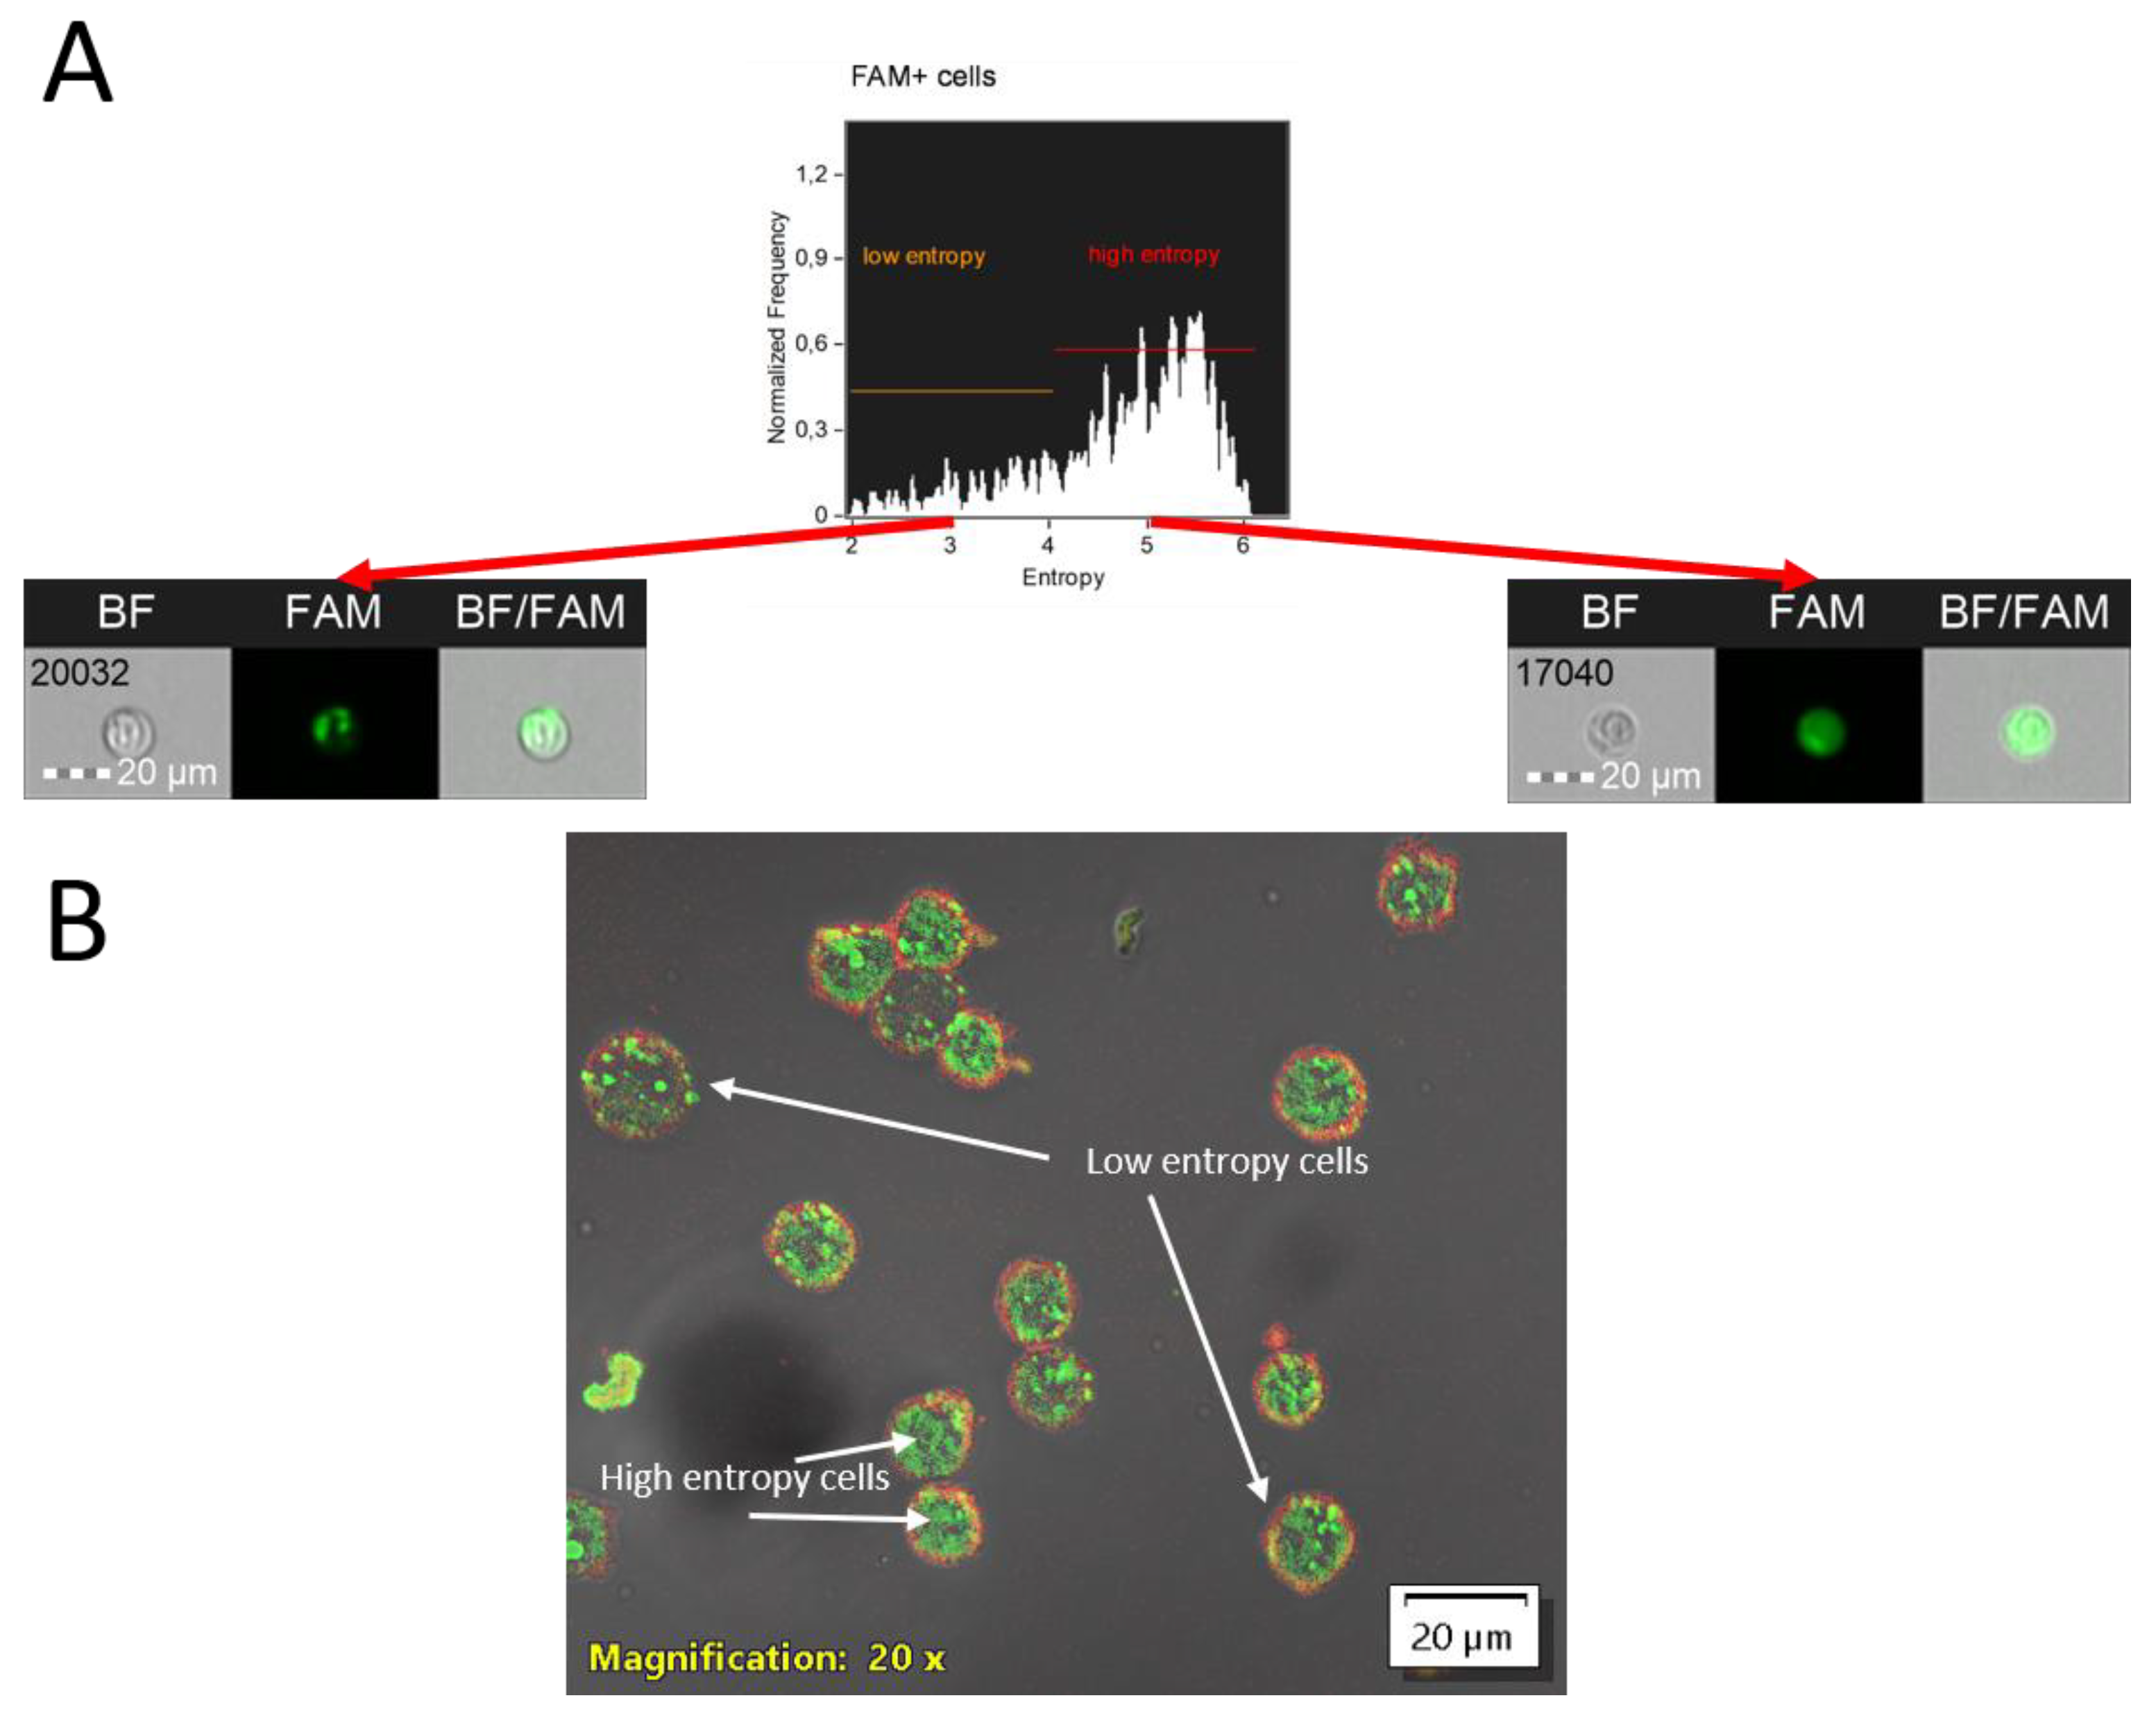
Figure 5.
The statistical report generation menu in IDEAS 6.2 (Cytek Biosciences, USA). In this menu, it is necessary to select parameters—such as the count and proportion of cells in various populations, morphological characteristics, and fluorescence intensity in specific populations—that will be meaningful for formulating biologically relevant conclusions.
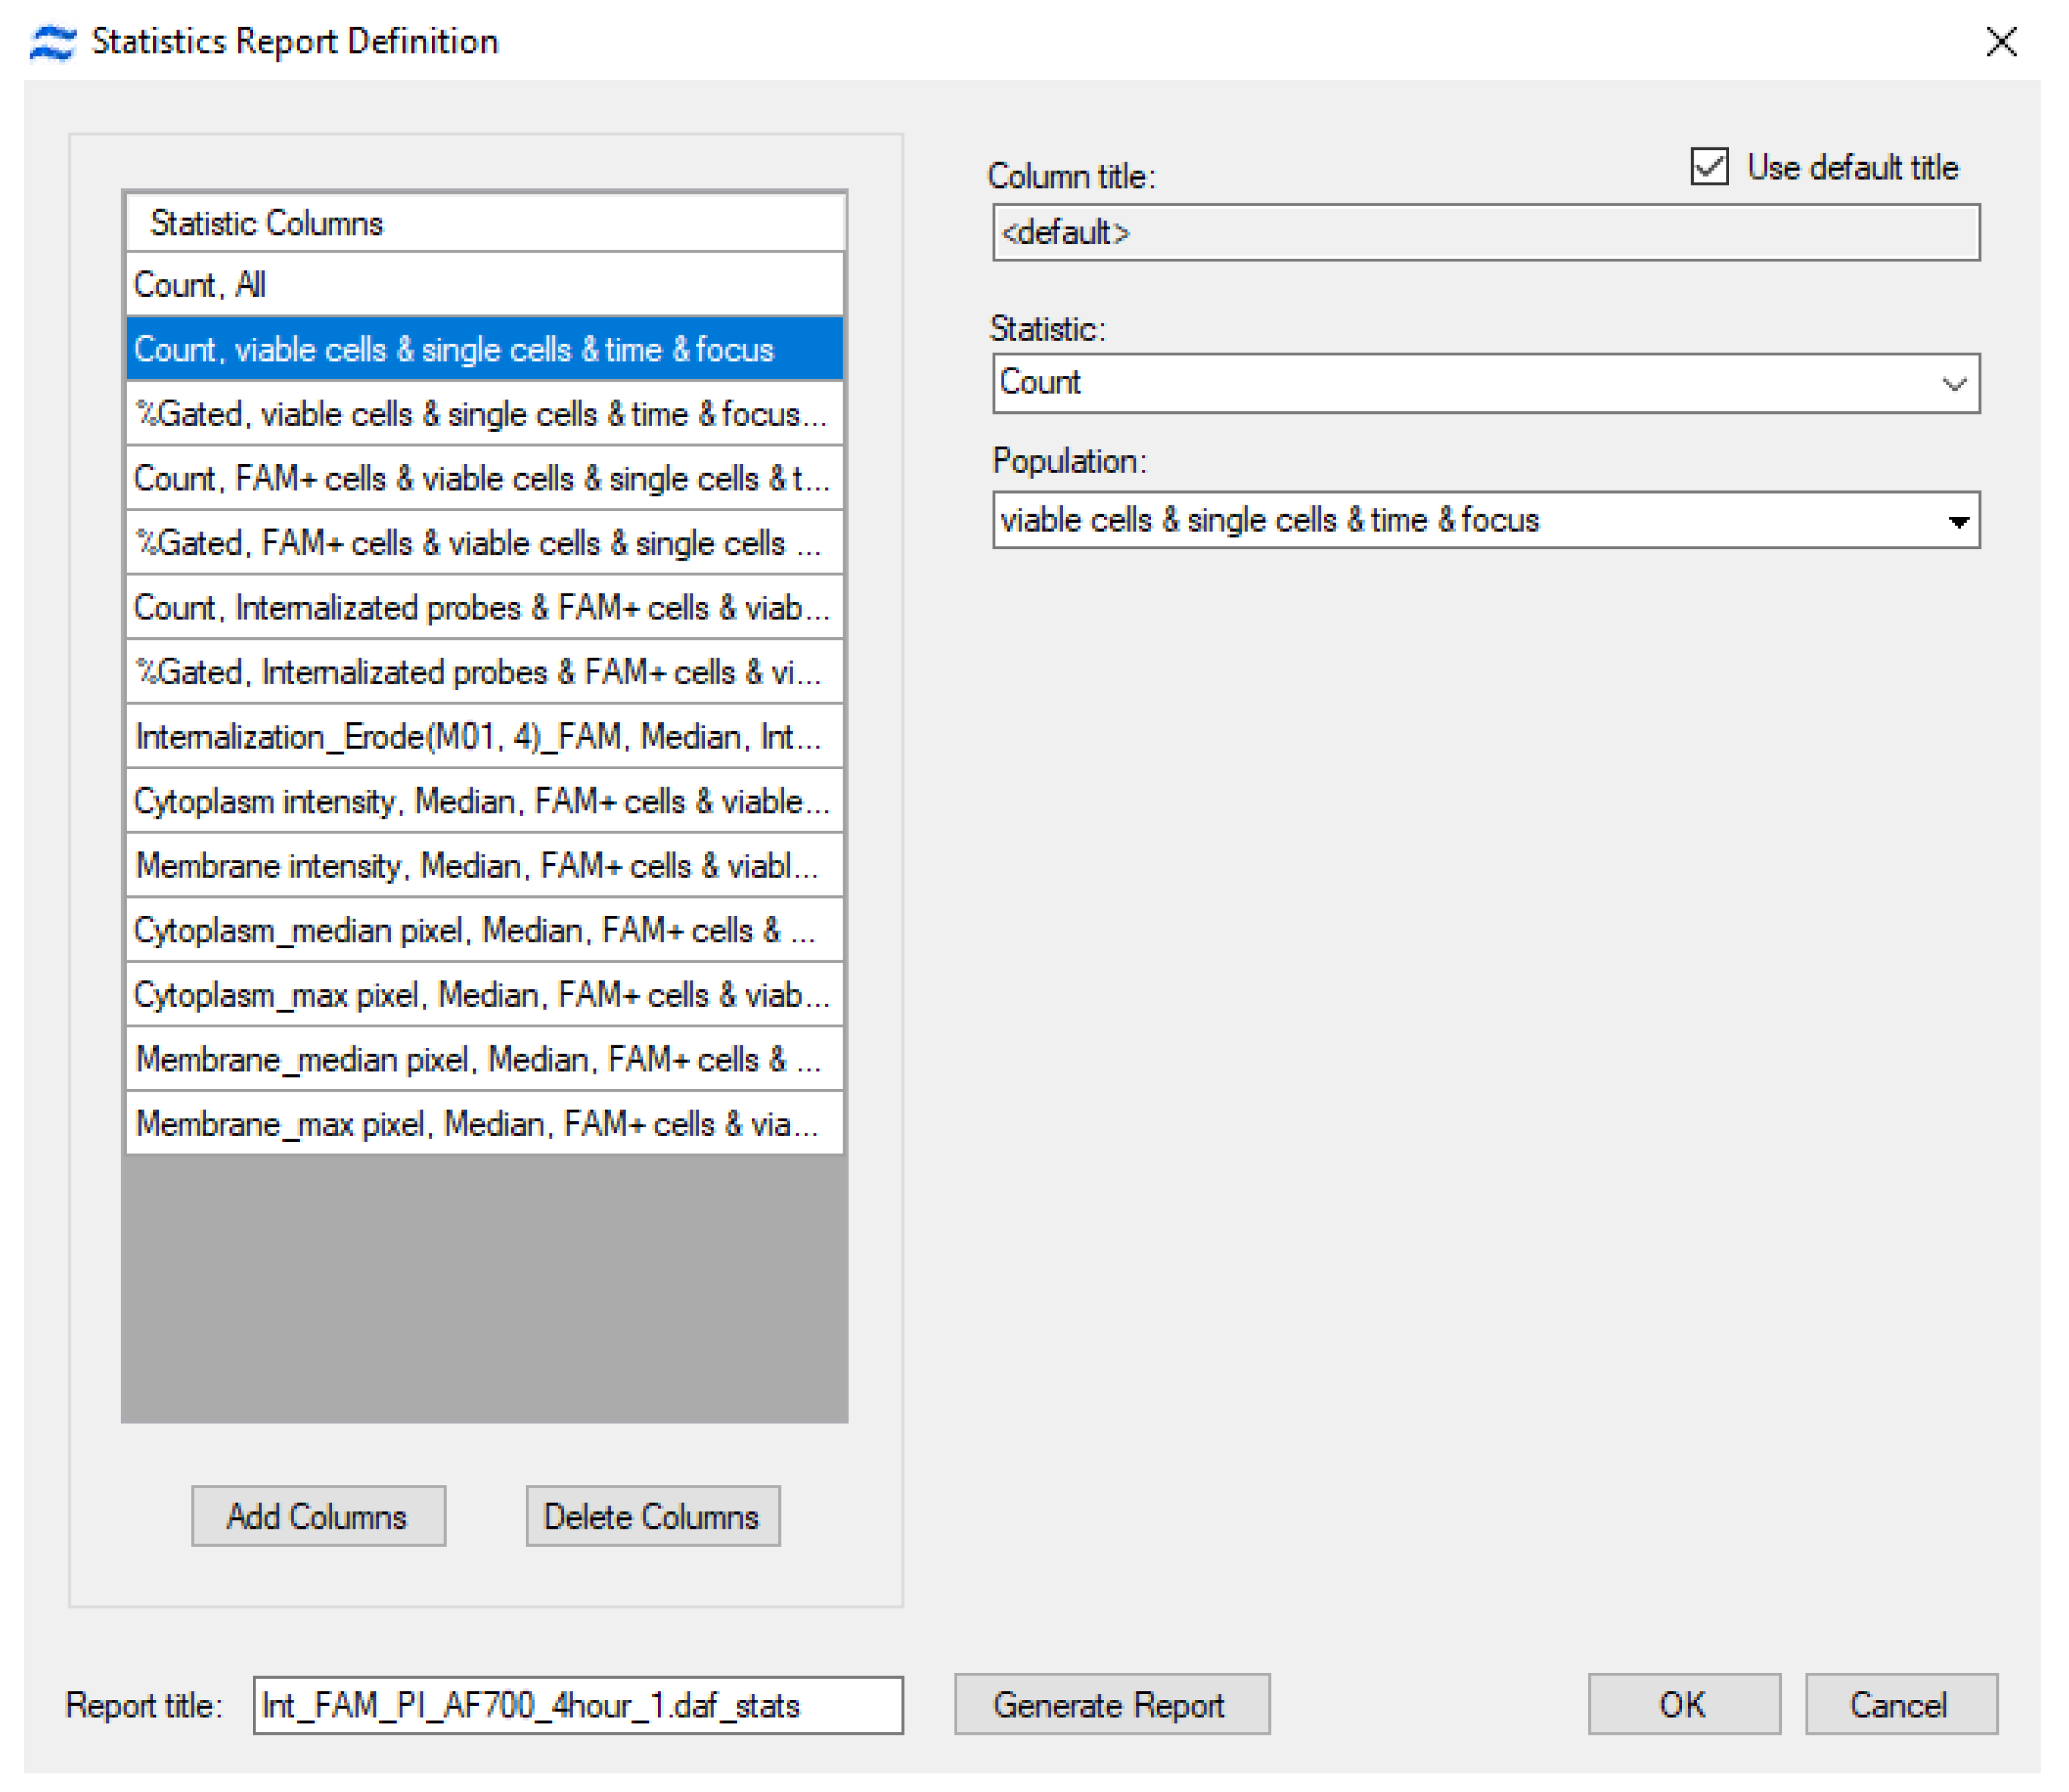
Figure 6.
The results of the assessment of cellular internalization of antisense oligonucleotides with antiretroviral activity obtained using the developed template for IDEAS (Cytek Biosciences, USA).
Figure 6.
The results of the assessment of cellular internalization of antisense oligonucleotides with antiretroviral activity obtained using the developed template for IDEAS (Cytek Biosciences, USA).
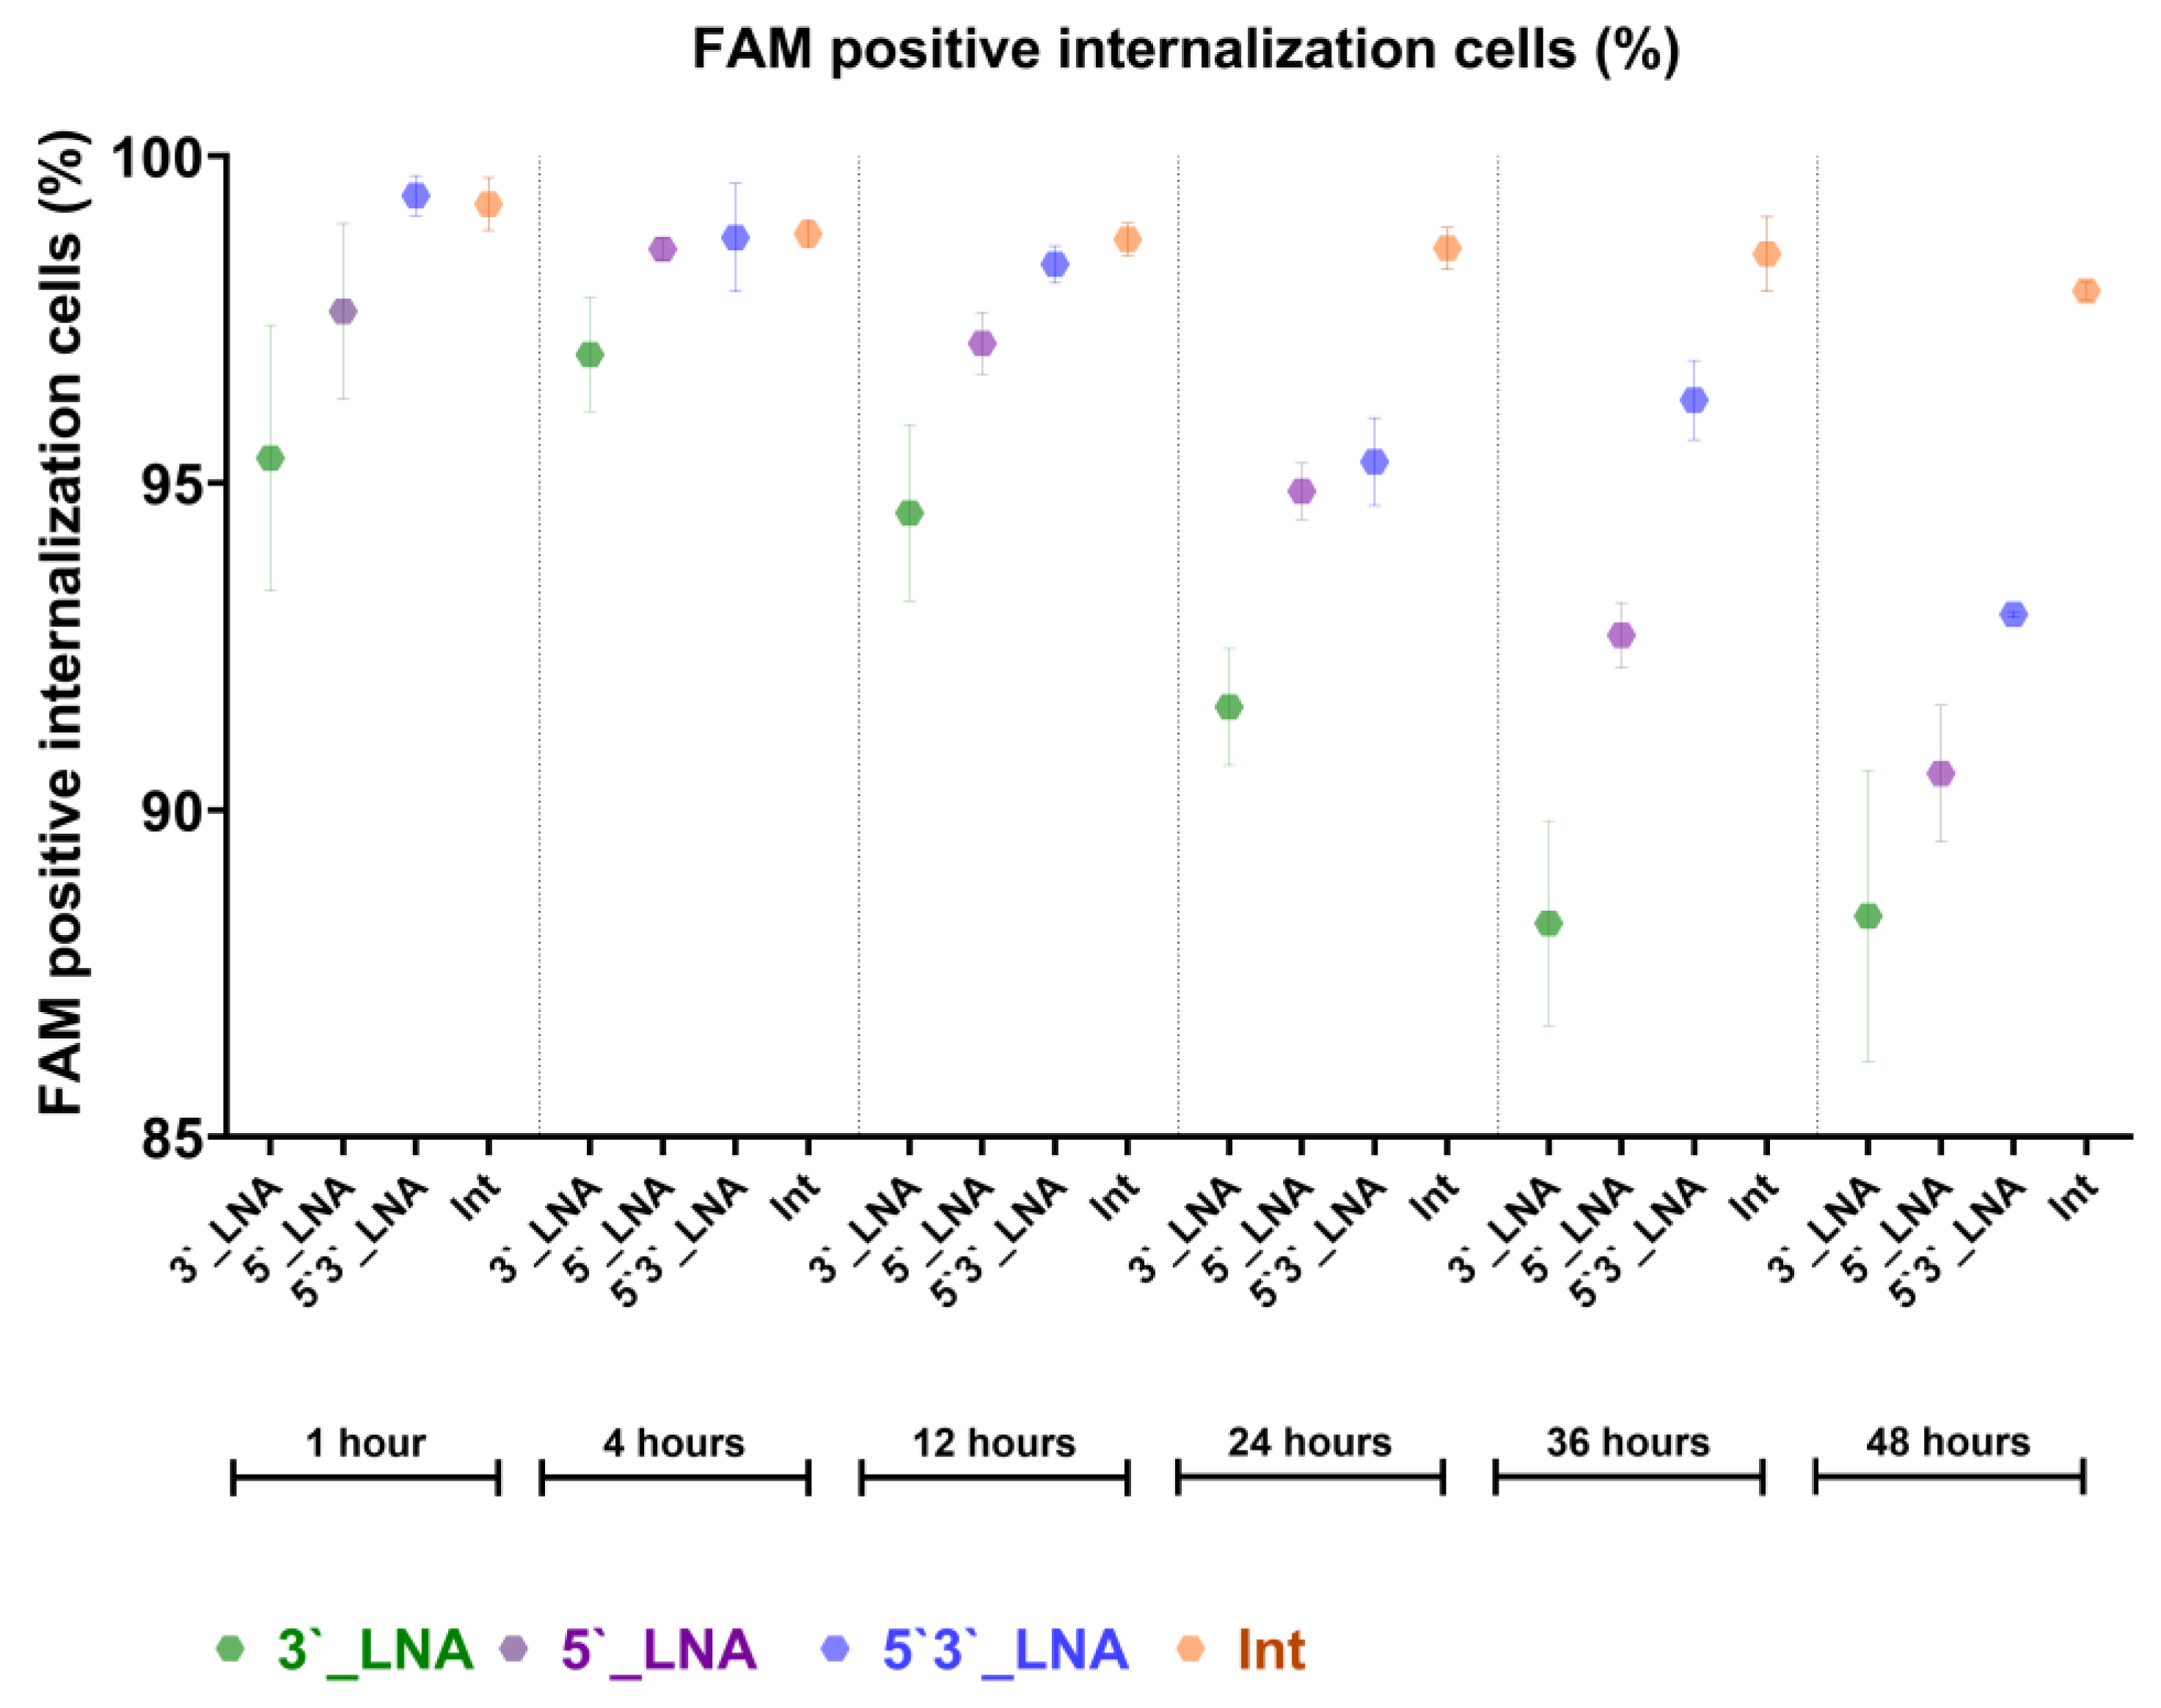
Figure 7.
Confocal microscopy of MT-4 cell culture following 4-hour incubation with PS-modified antisense oligonucleotide Int conjugated to FAM. Images were acquired using an Olympus FV3000 confocal microscope with a UPLSAPO20X objective at 20x magnification (NA=0.75). Image acquisition utilized 488 nm (AOS-FAM, 10% power) and 642 nm (CD4-AF700, BF, 50% power) lasers. Detection was performed using high-sensitivity detectors (HSD1 and HSD2) at 500 V. Scale bars are located in the lower right corner of images: 50 µm (images A–D) and 20 µm (image E). A—Pseudo-brightfield channel; B—AOS-FAM fluorescence channel; C—CD4-AF700 fluorescence channel; D—Composite image of BF, AOS-FAM, and CD4-AF700 channels; E—Image fragment with regions of interest (ROI) including a cell without probe internalization (ROI1), a cell with probe internalization (ROI2), and a cell with partial internalization of absorbed AOS (ROI3); F—One-dimensional fluorescence profile of the cell in ROI1 showing Pearson correlation coefficient R for AOS-FAM and CD4-AF700 colocalization; G—One-dimensional fluorescence profile of the cell in ROI2 showing Pearson correlation coefficient R for AOS-FAM and CD4-AF700 colocalization.

Figure 8.
Interface of the developed FluoSta v.1.0 software for statistical analysis of imaging flow cytometry results: A—Citation information; B—File upload menu (Browse button) with incubation time assignment for each statistical report (Time for <…>) and plot type selection (for each compound over time or for all compounds at individual time points); C—Menu containing descriptive statistics (Descriptive statistics), comparison results for all samples at individual time points (ANOVA & Tukey), comparison results for a single sample over time (RM-ANOVA & t-tests), excluded records (e.g., due to lack of variance or lack of data; Excluded tubes/samples), and scatter plots with standard deviation (Plots); D—Example plot of cell area parameter from the training dataset.


Table 1.
Oligonucleotides investigated for their cellular internalization capacity. S, phosphorothioate linkage; L, locked nucleic acid (LNA) modification; [FAM], 6-carboxyfluorescein fluorophore label.
Table 1.
Oligonucleotides investigated for their cellular internalization capacity. S, phosphorothioate linkage; L, locked nucleic acid (LNA) modification; [FAM], 6-carboxyfluorescein fluorophore label.
| Oligonucleotide designation | 5′-3′ Sequence |
|---|---|
| FAM- Int III | [FAM]-CSTSTSGSASCSTSTSTSGSGSGSGSASTSTSGSTSASGSGSG |
| FAM- Int III_3′-LNA | [FAM]-CSTSTSGSASCSTSTSTSGSGSGSGSASTSTSGLTLALGLGLG |
| FAM- Int III_5′-LNA | [FAM]- LCLTLTLGLACSTSTSTSGSGSGSGSASTSTSGSTSASGSGSG |
| FAM- Int III_5′/3′-LNA | [FAM]- LCLTLTLGLACSTSTSTSGSGSGSGSASTSTSGLTLALGLGLG |
Disclaimer/Publisher’s Note: The statements, opinions and data contained in all publications are solely those of the individual author(s) and contributor(s) and not of MDPI and/or the editor(s). MDPI and/or the editor(s) disclaim responsibility for any injury to people or property resulting from any ideas, methods, instructions or products referred to in the content. |
© 2025 by the authors. Licensee MDPI, Basel, Switzerland. This article is an open access article distributed under the terms and conditions of the Creative Commons Attribution (CC BY) license (http://creativecommons.org/licenses/by/4.0/).
Copyright: This open access article is published under a Creative Commons CC BY 4.0 license, which permit the free download, distribution, and reuse, provided that the author and preprint are cited in any reuse.


