Submitted:
07 October 2025
Posted:
08 October 2025
Read the latest preprint version here
Abstract
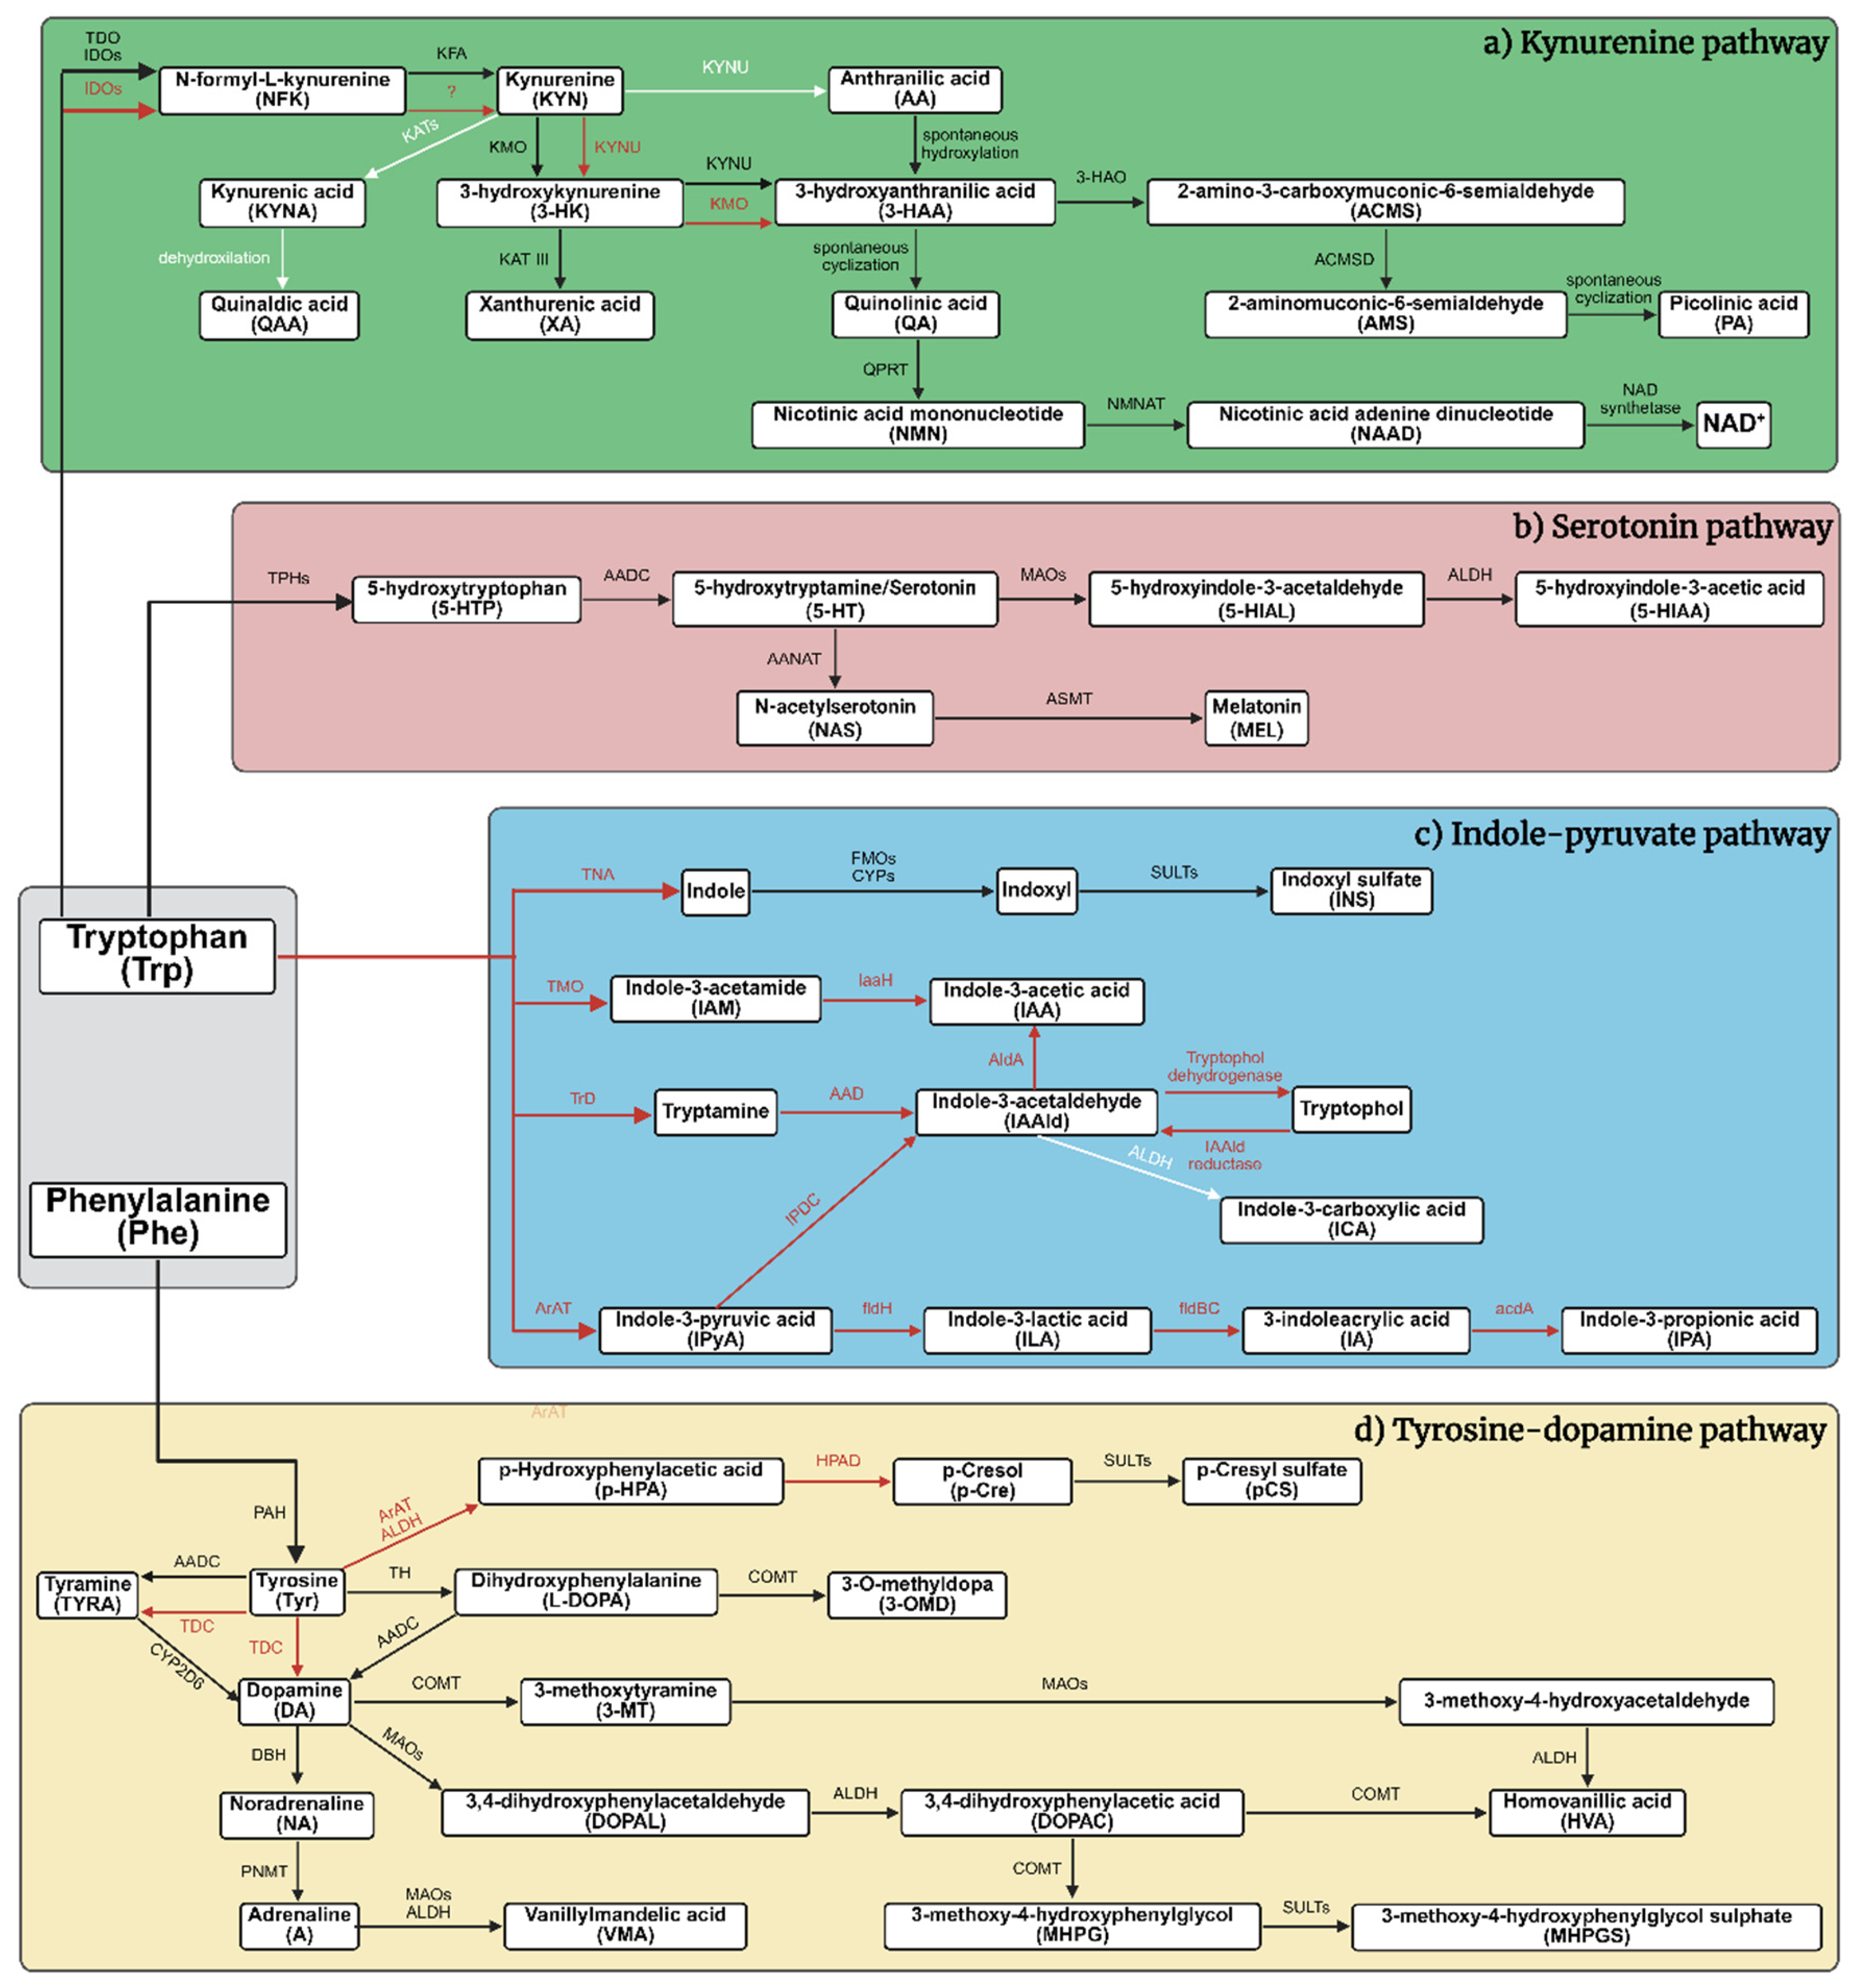
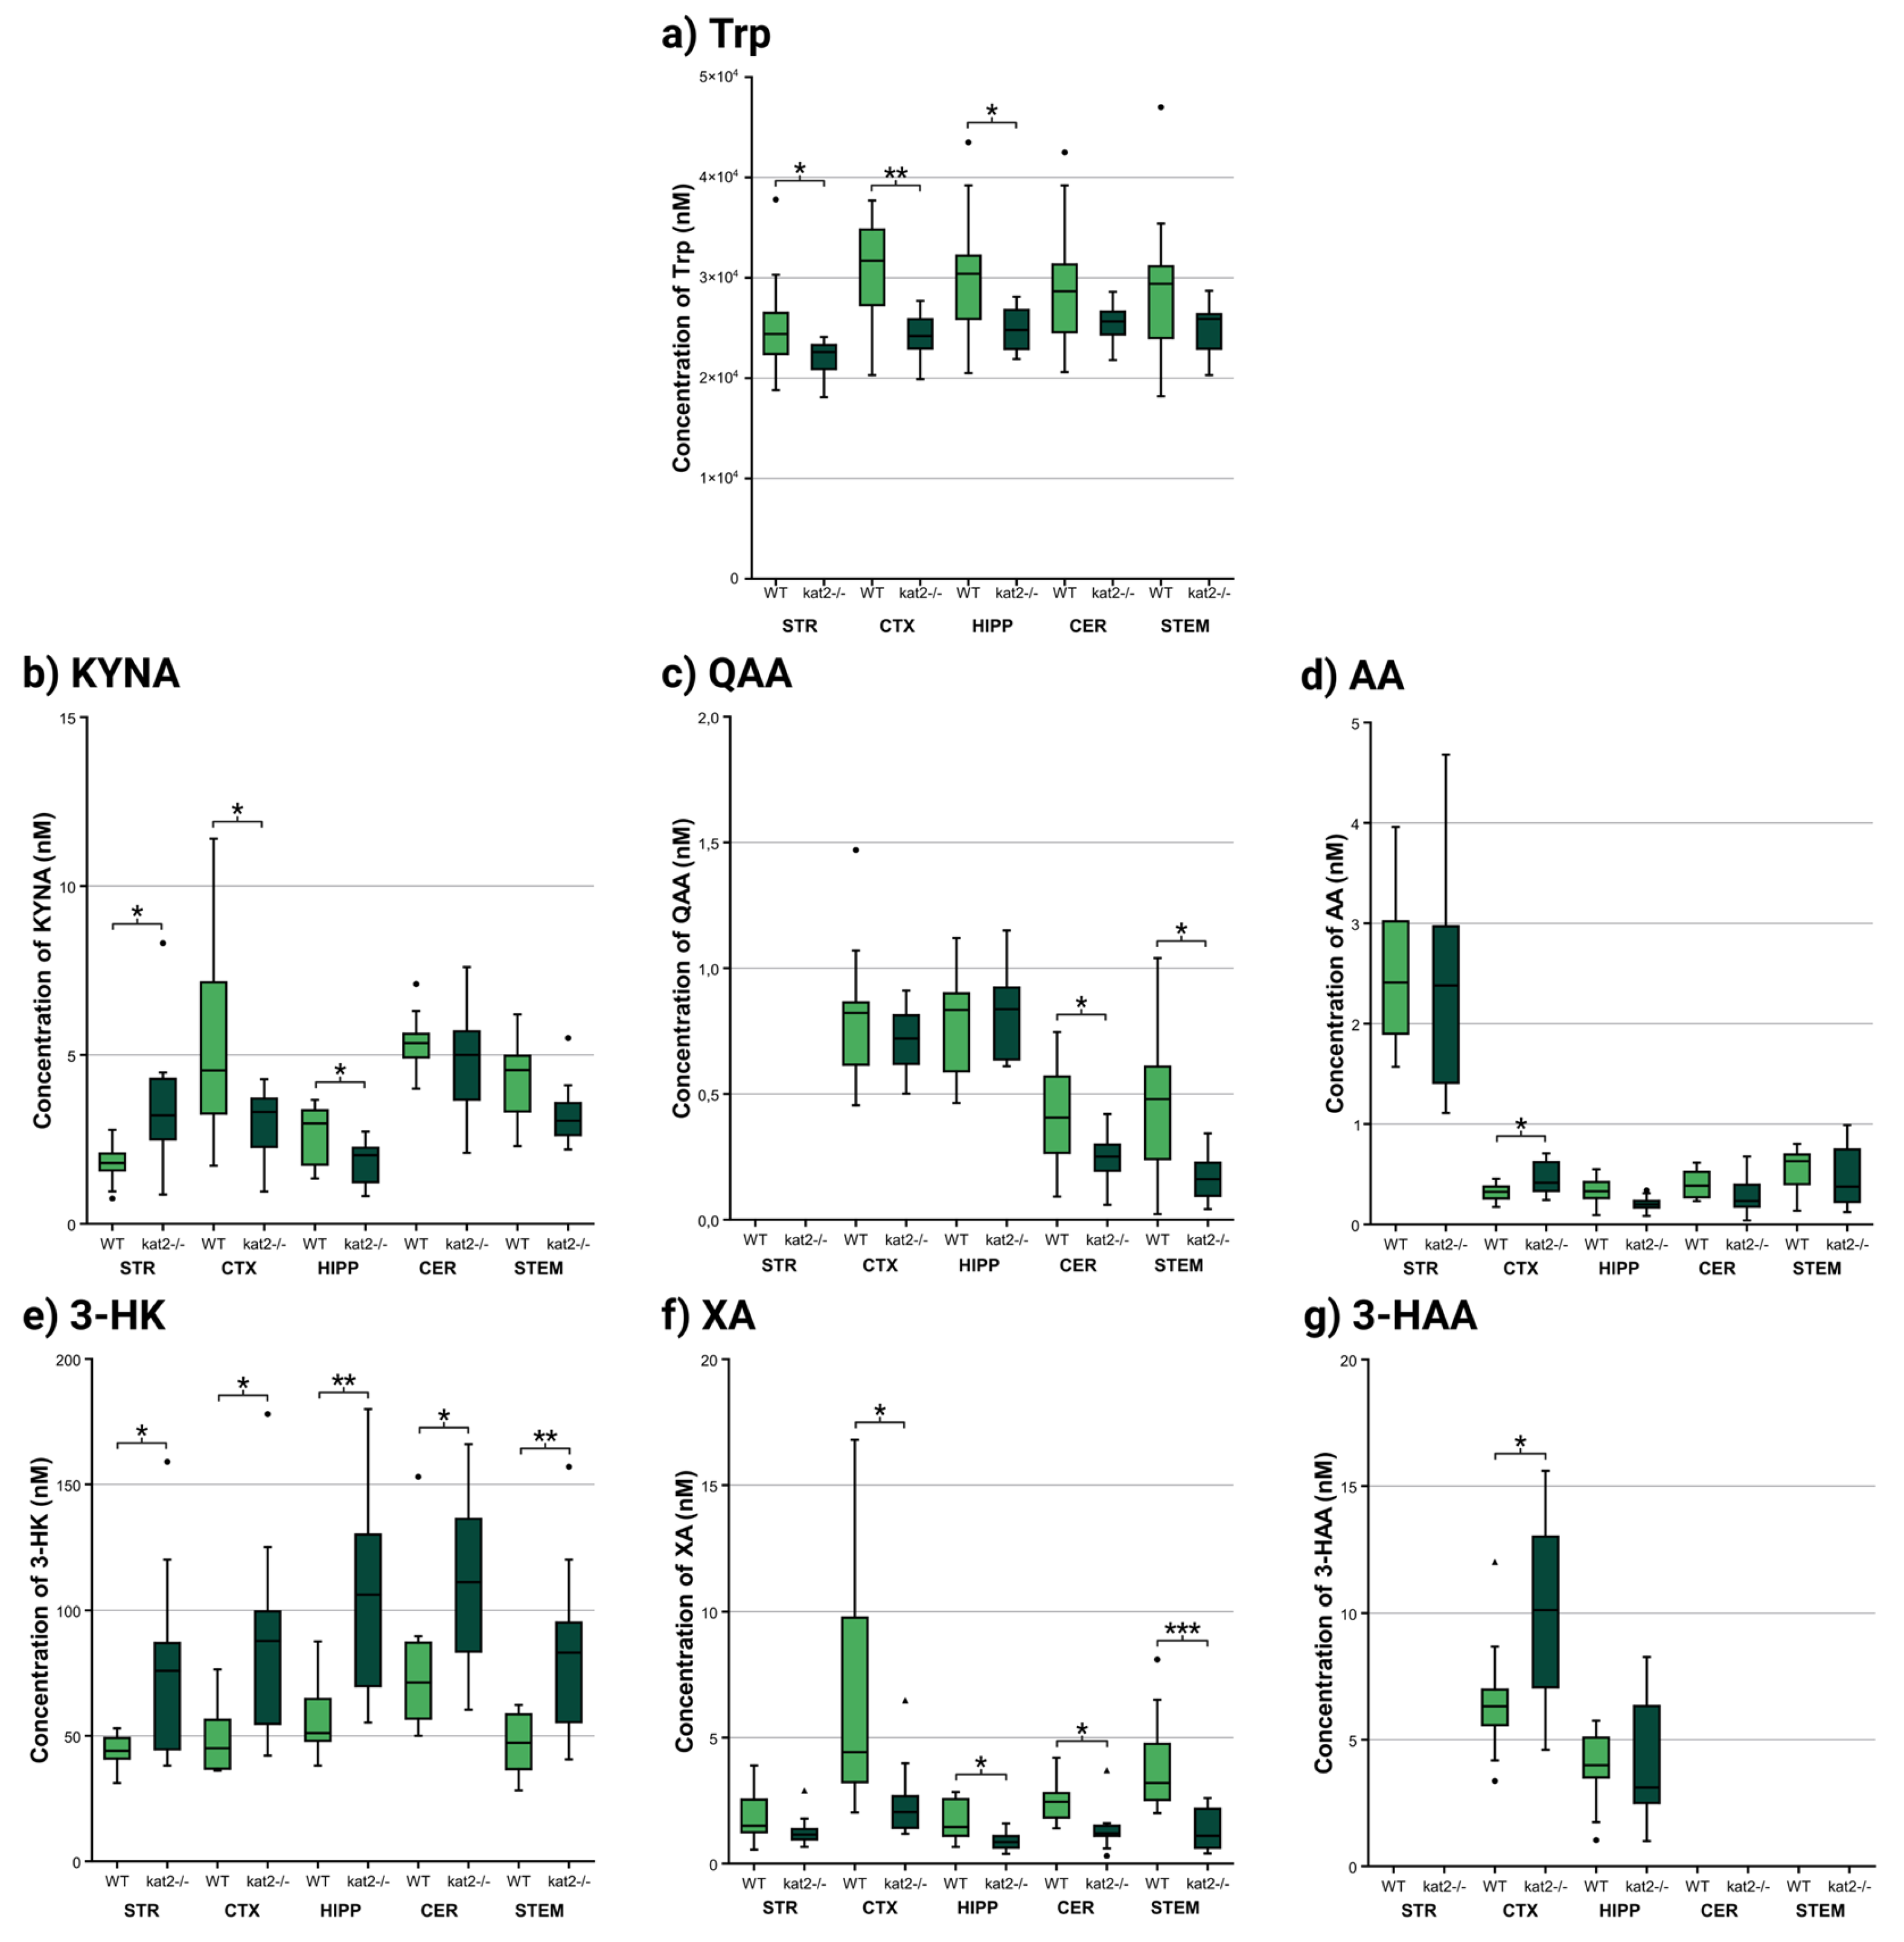
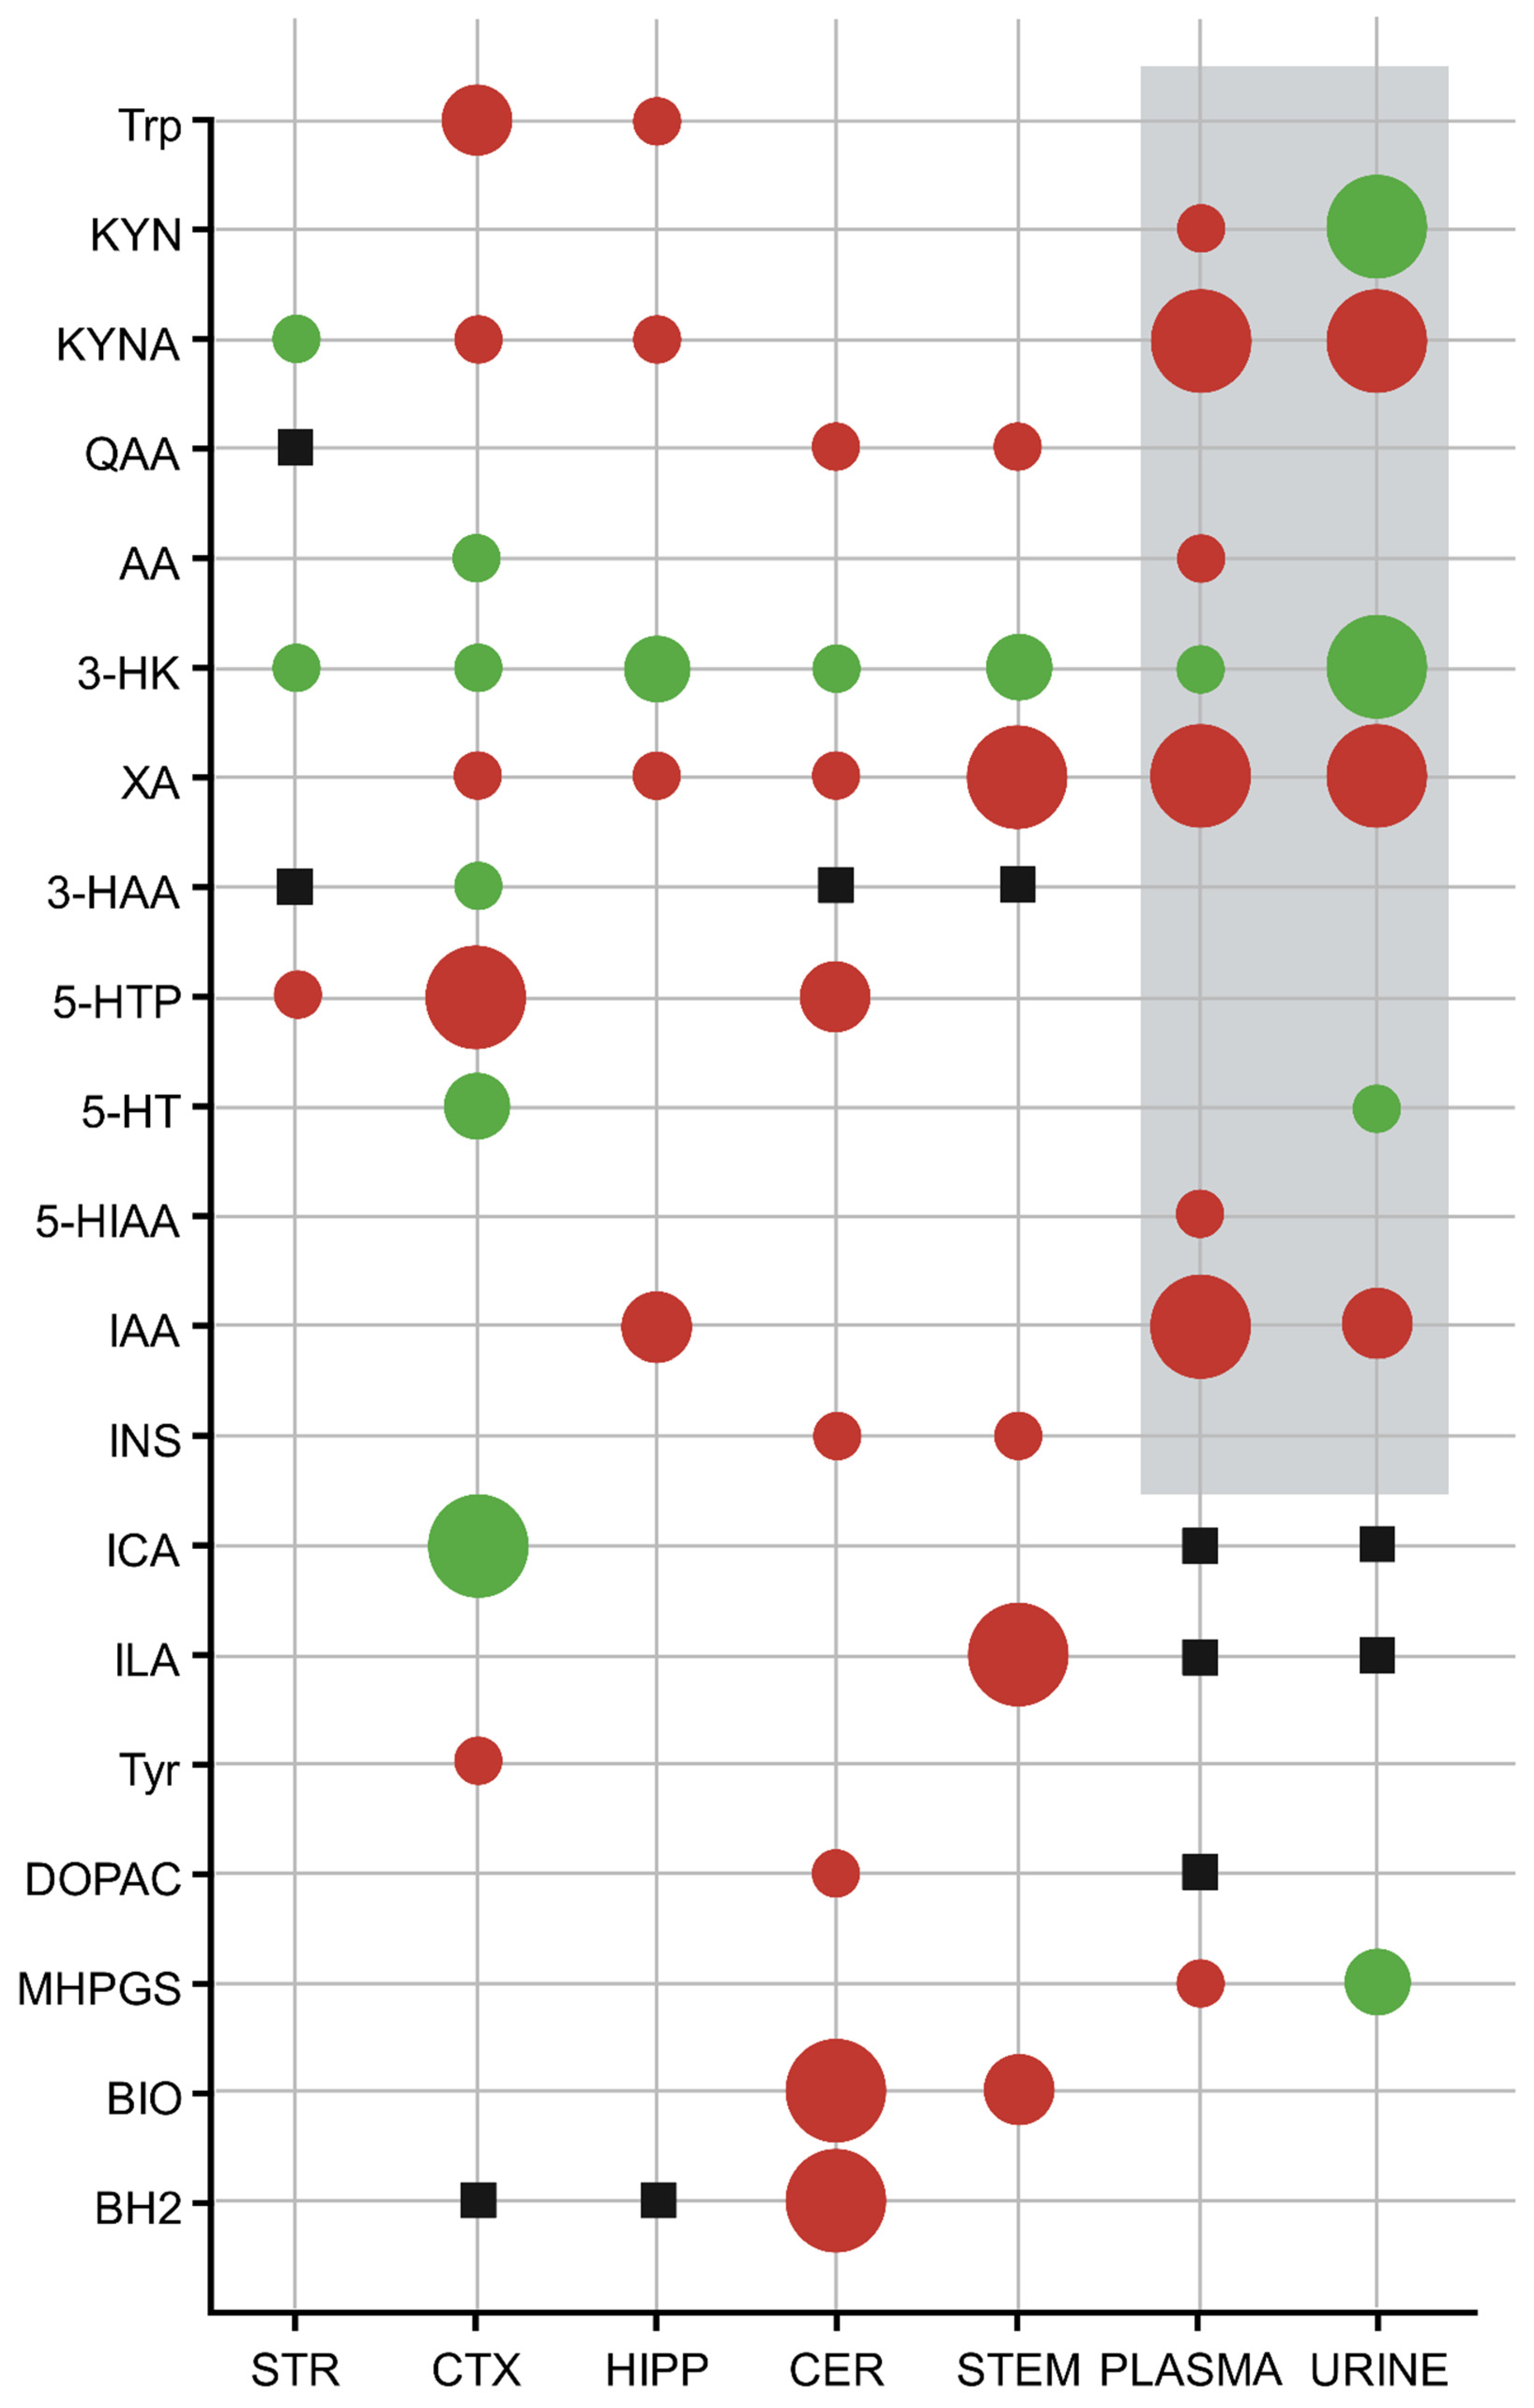
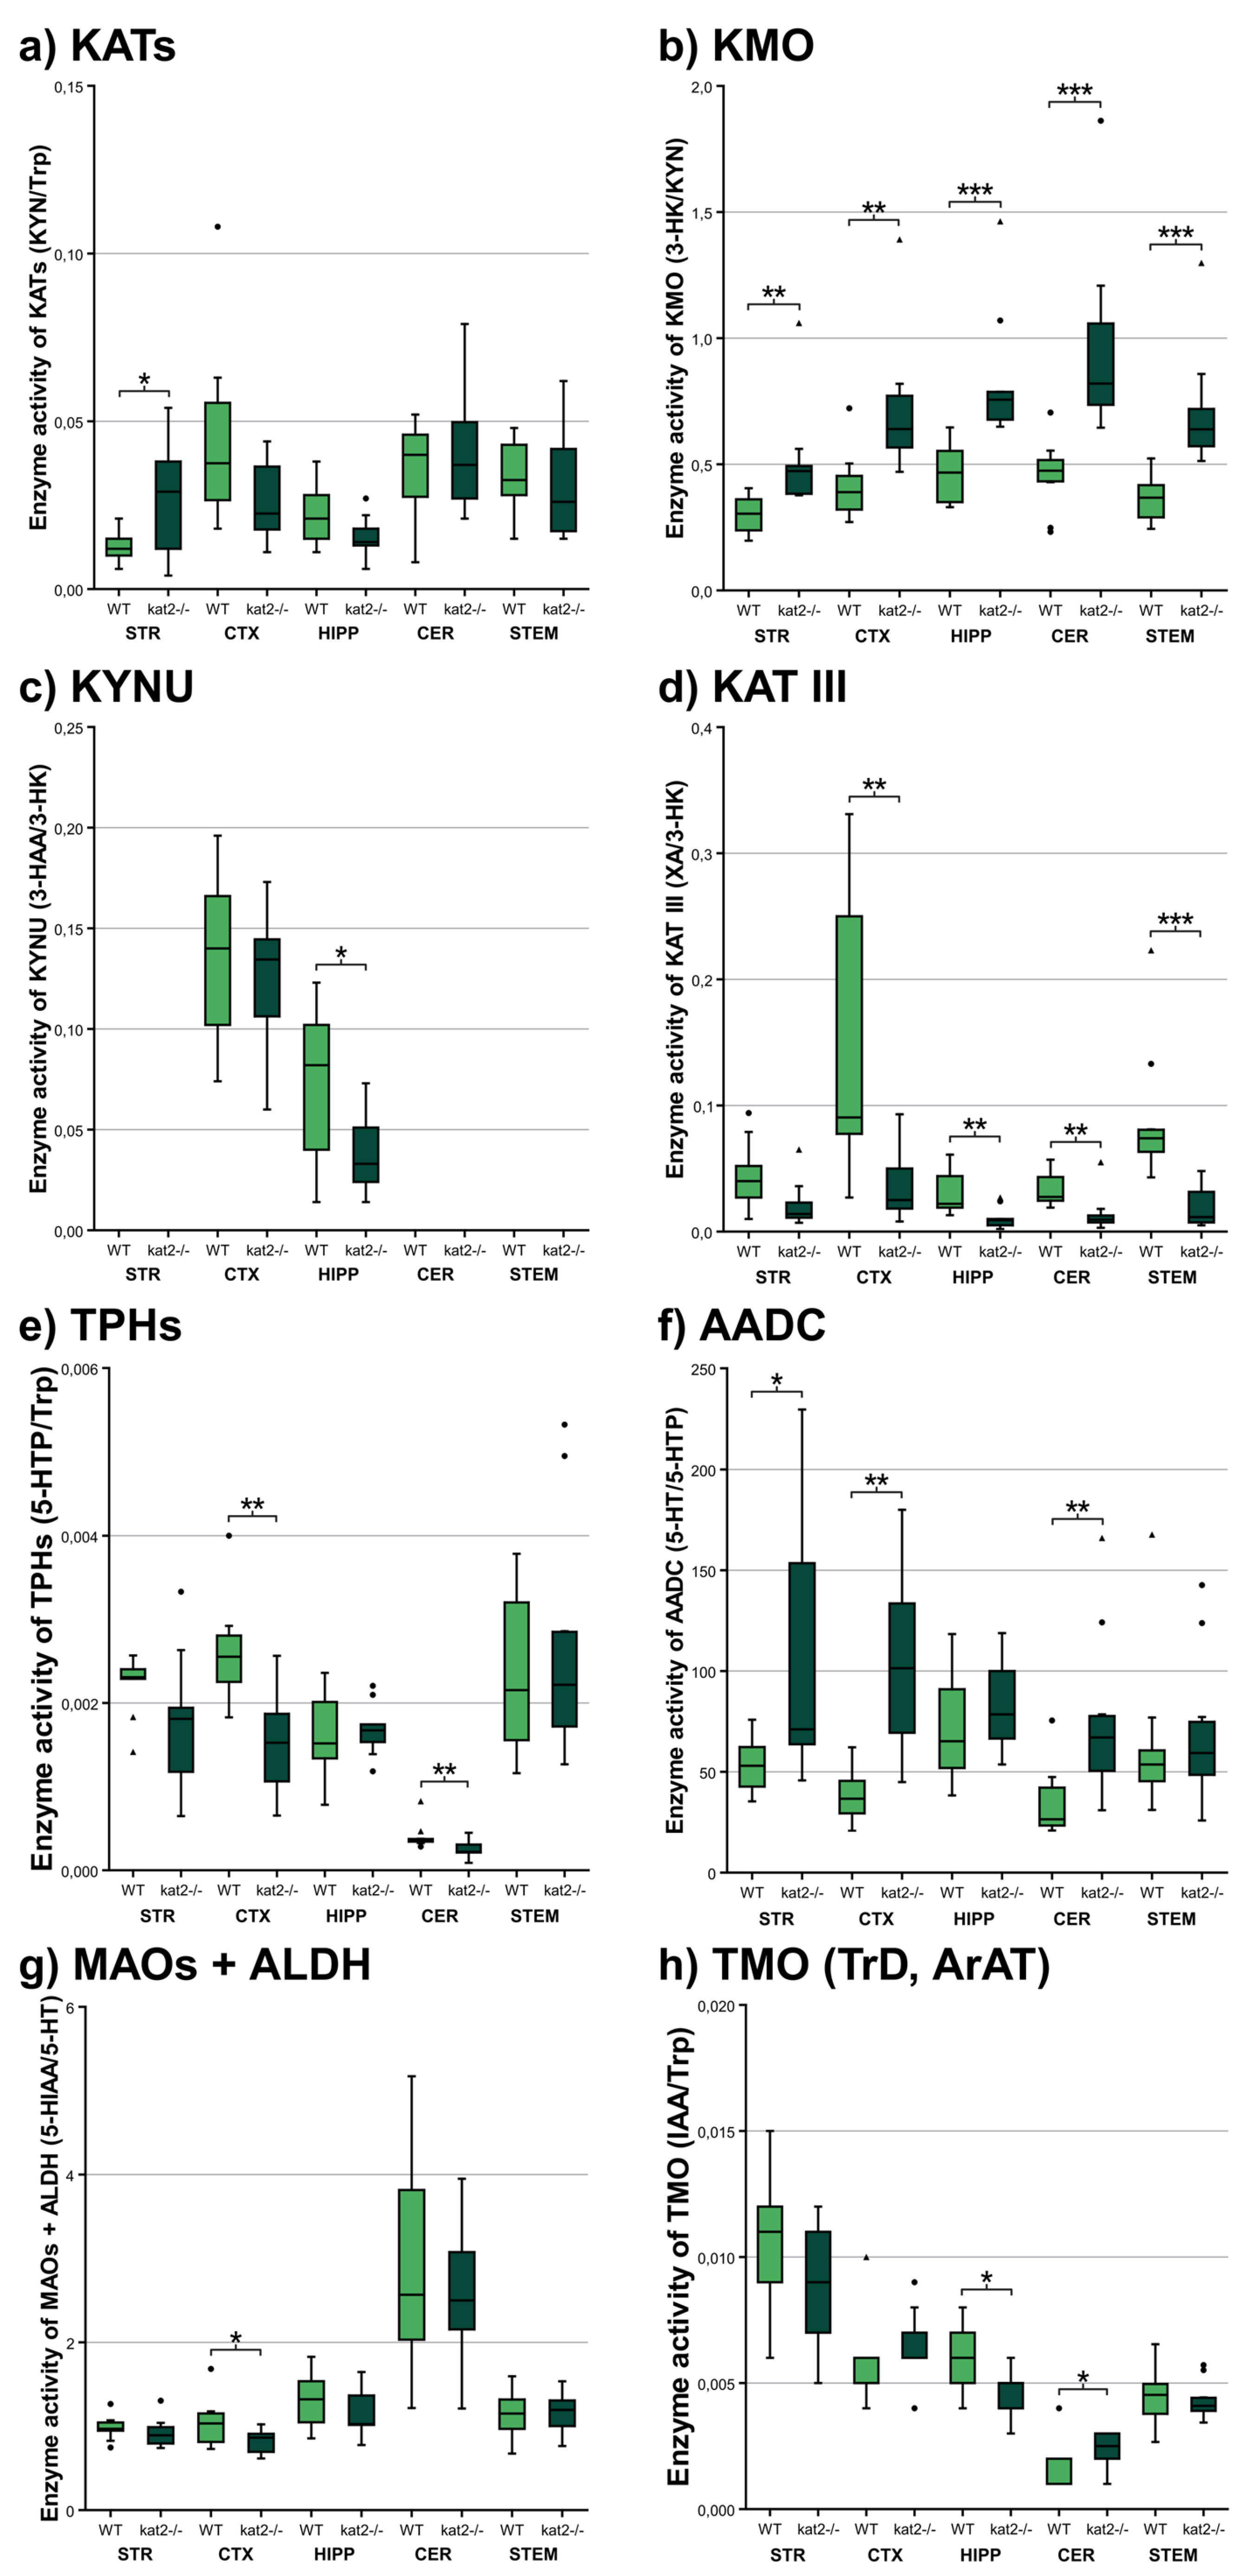
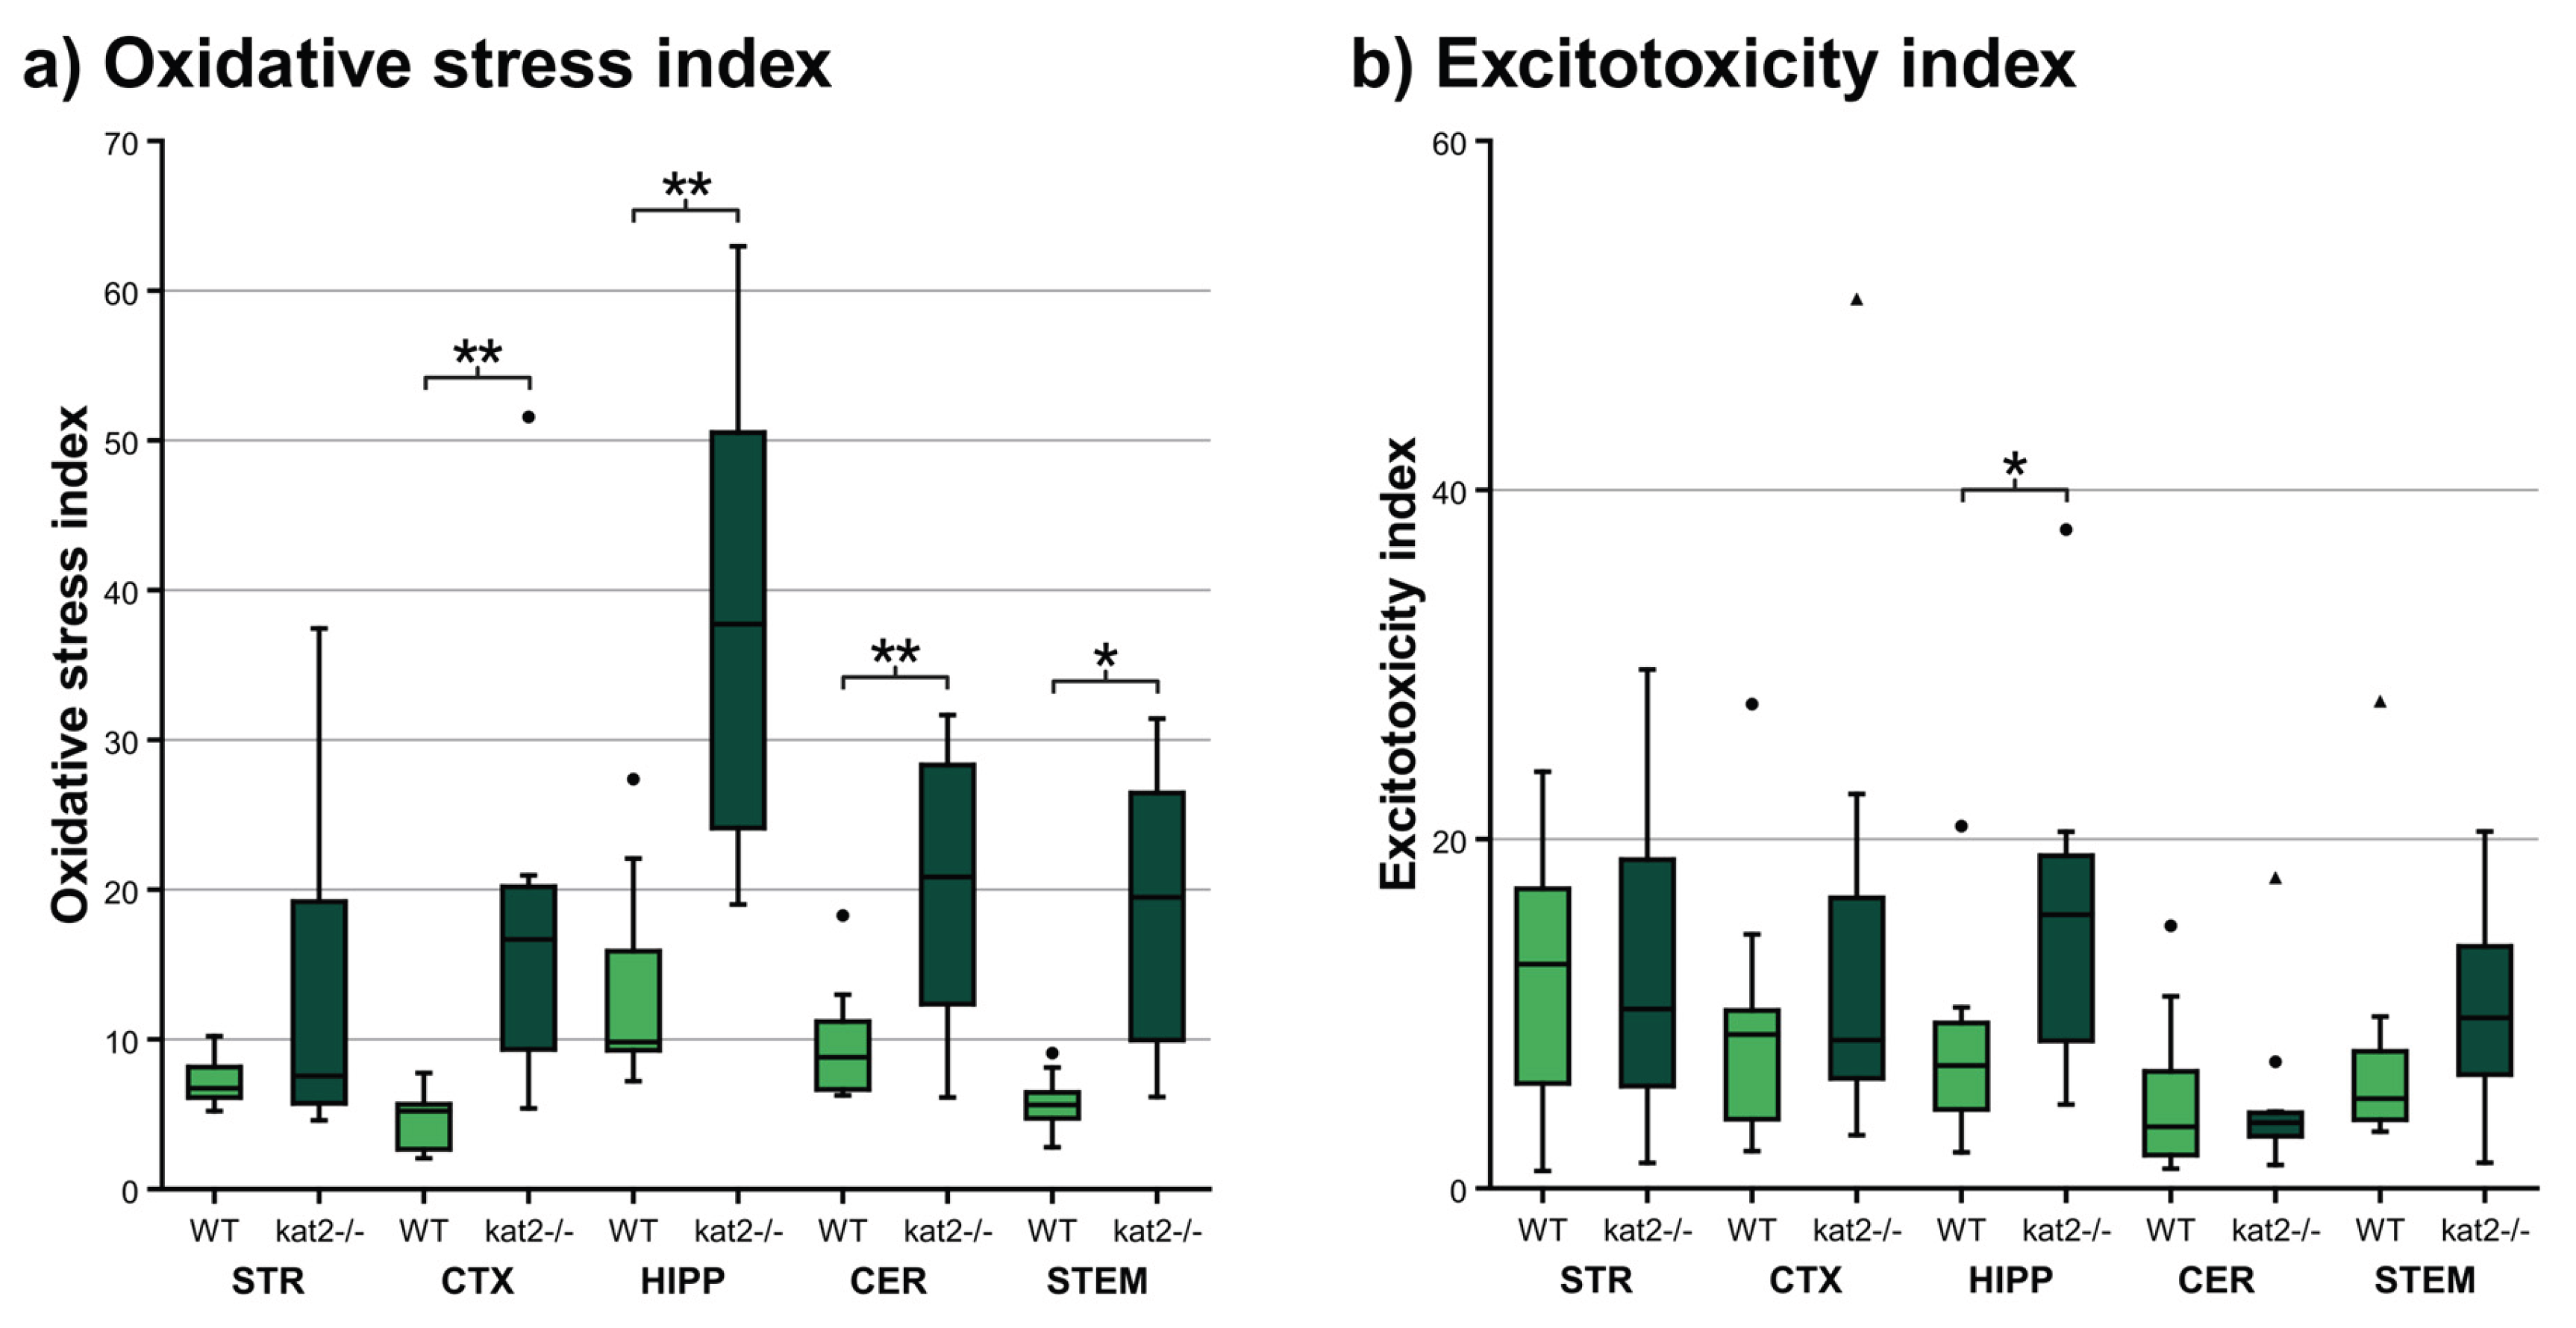
Background: Cognitive, emotional, and social dysfunctions pervade neuropsychiatric disorders; dysregulated tryptophan (Trp)–kynurenine signaling, notably kynurenic acid (KYNA) from kynurenine aminotransferases (KATs), is implicated in Alzheimer’ disease, Parkinson’s disease, depression, and post-traumatic stress disorder (PTSD), among others. In novel CRISPR/Cas9-generated KAT II knockout (aadat-/- aka. kat2-/-) mice, we observed despair-linked depression-like behavior with peripheral excitotoxicity and oxidative stress. KAT II’s role and its crosstalk with serotonin, indole-pyruvate, and tyrosine (Tyr)–dopamine remain unclear. It is unknown whether deficits extend to cognitive, emotional, motor, and social domains or whether brain tissues mirror peripheral stress. Objectives: Delineate domain-wide behaviors, brain oxidative/excitotoxic profiles, and pathway interactions attributable to KAT II. Results: Behavior was unchanged across strains. kat2-/- deletion remodeled Trp metabolic pathways: 3-hydroxykynurenine increased, xanthurenic acid decreased, KYNA fell in cortex and hippocampus but rose in striatum, quinaldic acid (QAA) decreased in cerebellum and brainstem. Such spatially restricted shifts delineate metabolic stress as a core transdiagnostic liability, converging with increased oxidative burden and amplified excitotoxic mechanisms. Conclusion: Here we show kat2 deletion reshapes regional Trp metabolism while reinforcing despair-linked emotional bias, this study highlights novel metabolic signatures as stratification biomarkers. These insights may foster double-hit animal models to dissect the convergence of depression and PTSD, ultimately informing targeted therapeutic approaches.
Keywords:
1. Introduction
2. Materials and Methods
2.1. Ethical Approval
2.2. Animals
2.3. Genotyping with Taqman Allelic Discrimination Assay
2.4. Behavioral Tests
2.4.1. Novel Object Recognition Test (NORT)
2.4.2. Object-Based Attention Test (OBAT)
2.4.3. Y-Maze Test
2.4.4. Marble Burying Test (MBT)
2.4.5. Three Chamber Test (3CT)
2.4.6. Rotarod Test
2.5. Ultra-High-Performance Liquid Chromatography with Tandem Mass Spectrometry (UHPLC-MS/MS)
2.5.1. Brain Samples
2.5.2. Plasma and Urine Samples
2.6. The Enzyme Activities of Tryptophan (Trp) Metabolism
2.7. Oxidative Stress and Excitotoxicity Indices
2.8. Statistical Analysis
3. Results
3.1. Behavioral Tests
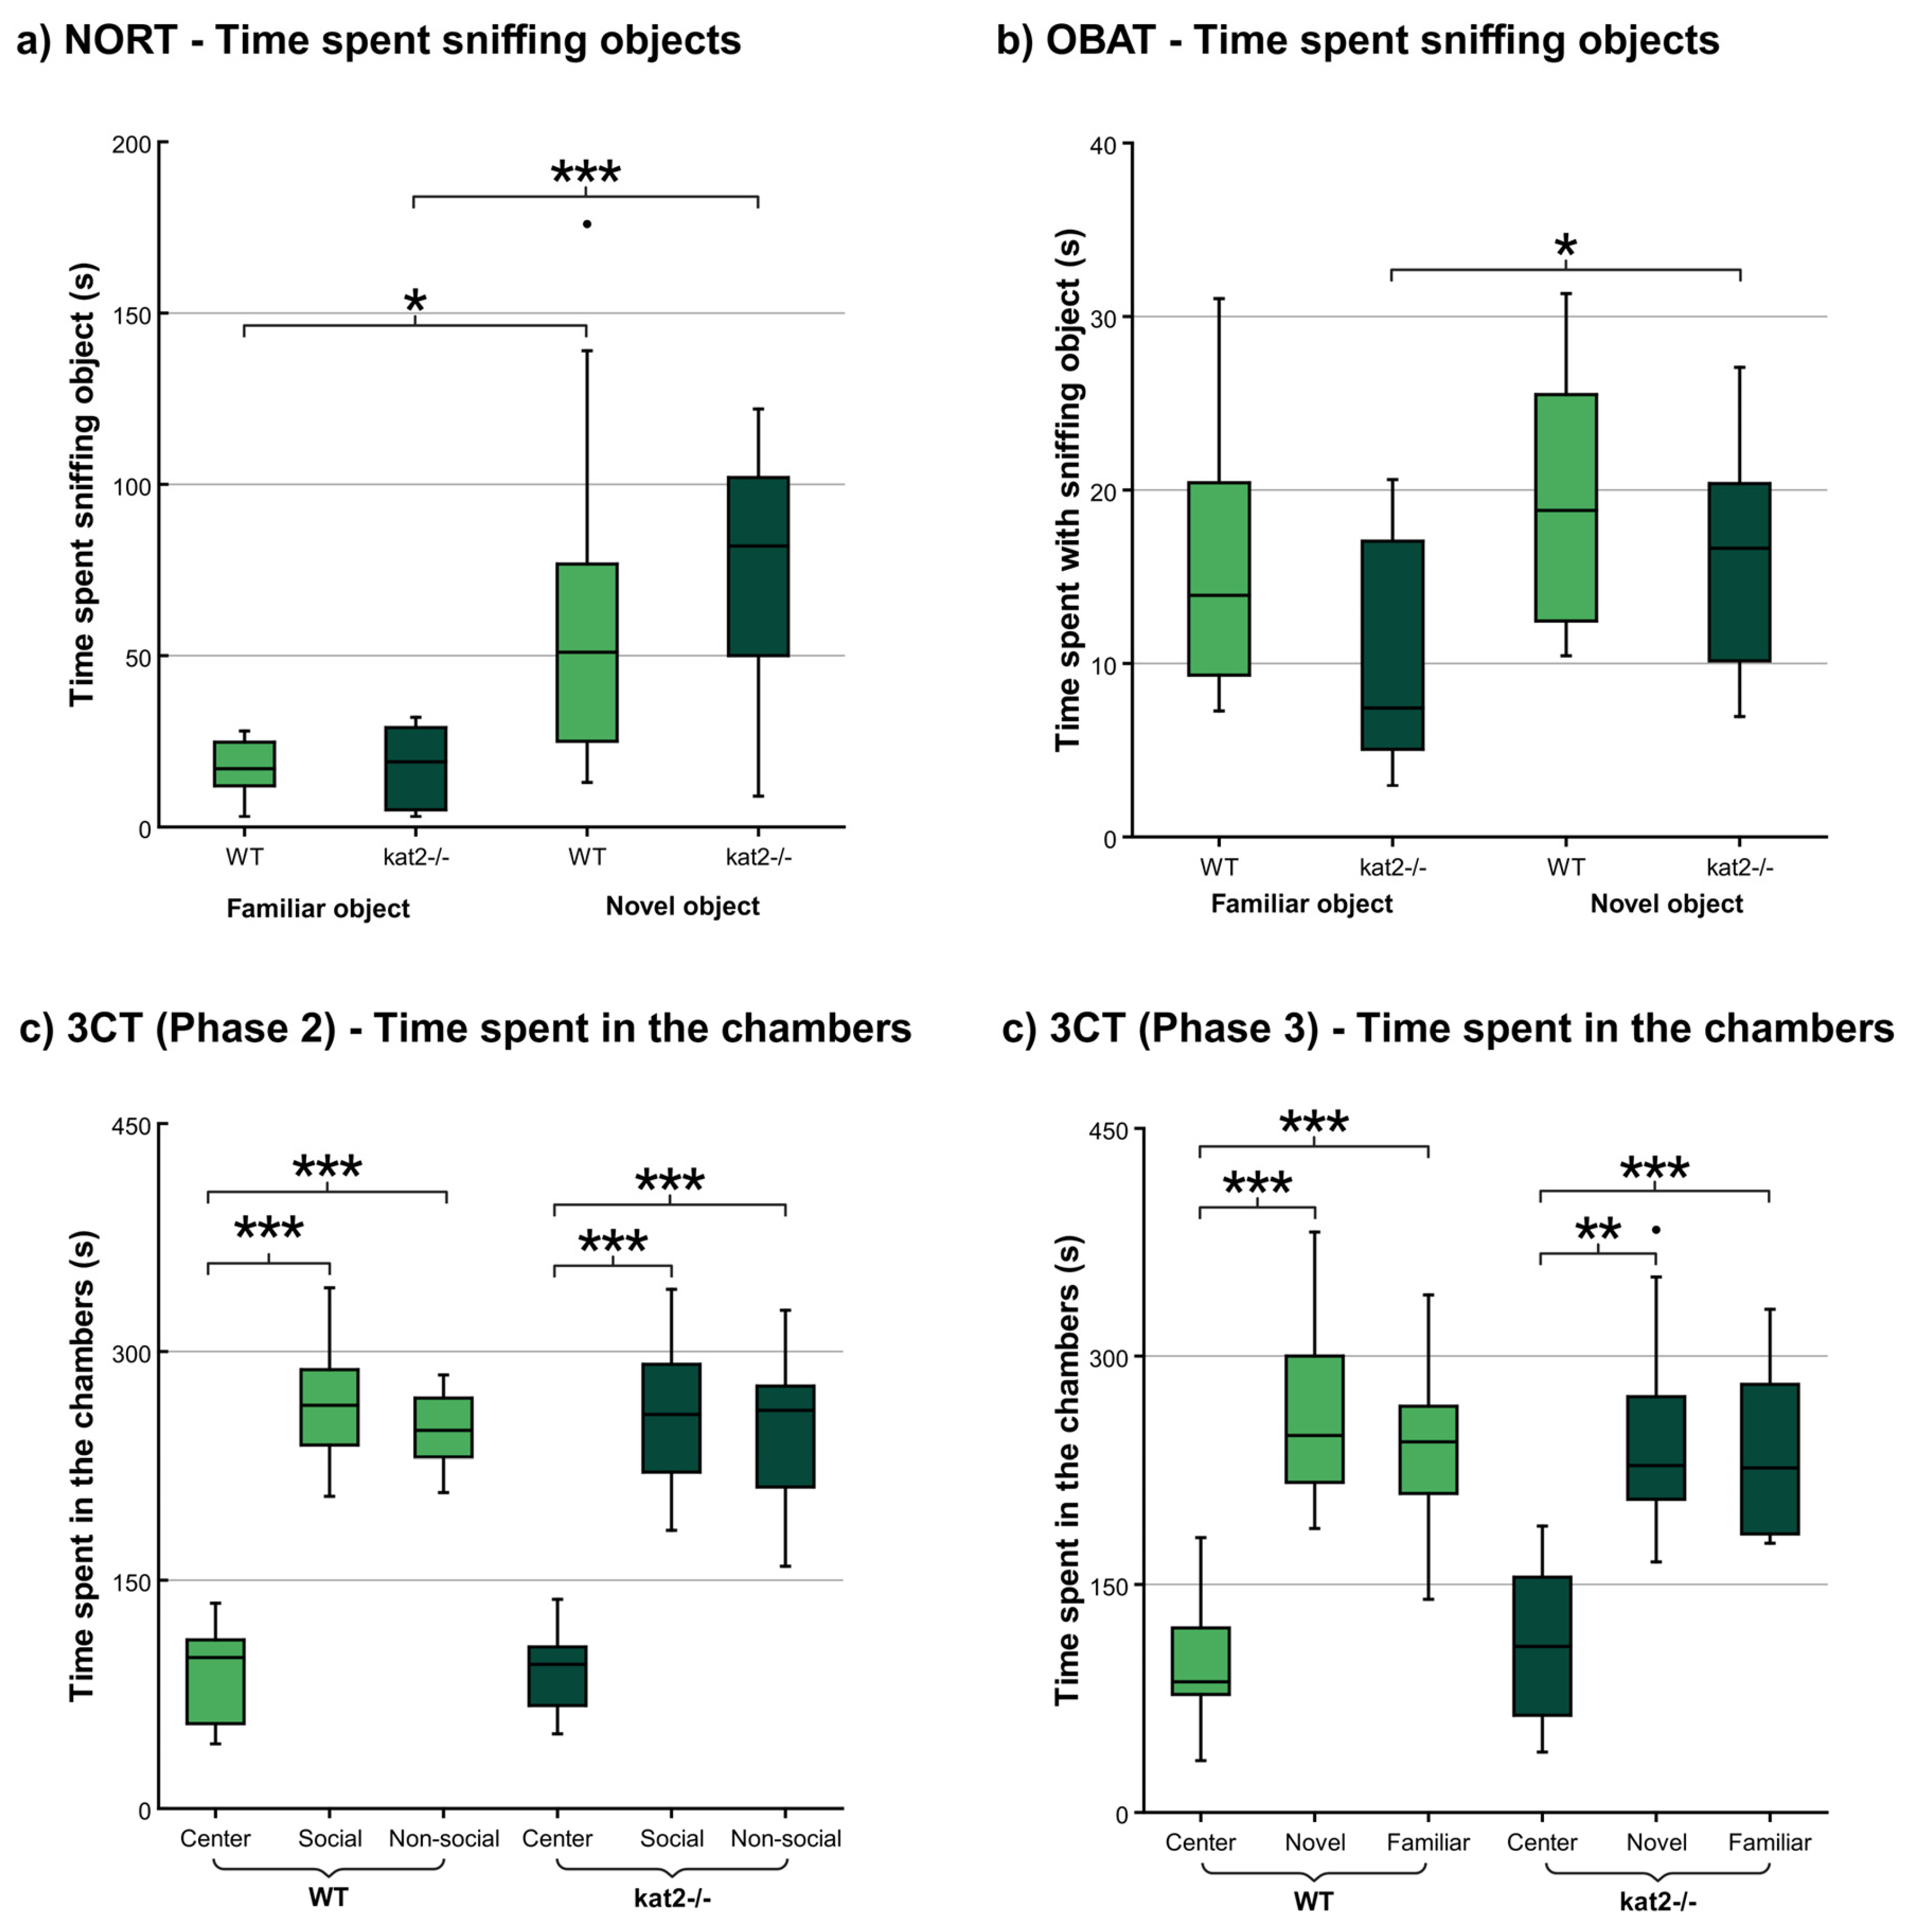
3.1.1. Novel Object Recognition Test (NORT)
3.1.2. Object-Based Attention Test (OBAT)
3.1.3. Three Chamber Test (3CT)
3.1.4. Other Behavioral Tests
3.2. Ultra-High-Performance Liquid Chromatography with Tandem Mass Spectrometry (UHPLC-MS/MS)
3.3. Enzyme Activities
3.4. Oxidative Stress and Ecitotoxicity Indices
4. Discussion
5. Conclusions
Author Contributions
Funding
Institutional Review Board Statement
Informed Consent Statement
Data Availability Statement
Acknowledgments
Conflicts of Interest
Abbreviations
| 3-HAA | 3-hydroxyanthranilic acid |
| 3-HK | 3-hydroxykynurenine |
| 3CT | three-chamber test |
| 5-HT | 5-hydroxytryptamine (serotonin) |
| 5-HTP | 5-hydroxytryptophan |
| 5-HIAA | 5-hydroxyindoleacetic acid |
| AA | anthranilic acid |
| AADC | aromatic L-amino acid decarboxylase |
| ALDH | aldehyde dehydrogenase |
| ARRIVE | animal research: reporting of in vivo experiments |
| ASD | autism spectrum disorder |
| BBB | blood-brain barrier |
| BH2 | dihydrobiopterin |
| BH4 | tetrahydrobiopterin |
| BIO | biopterin |
| CER | cerebellum |
| CNS | central nervous system |
| CTX | cortex |
| DA | dopamine |
| DI | discrimination index |
| DOPAC | 3,4-dihydroxyphenylacetic acid |
| GAD | generalized anxiety disorder |
| HIPP | hippocampus |
| IAA | indole-3-acetic acid |
| ICA | indole-3-carboxylic acid |
| INS | indoxyl sulfate |
| KAT | kynurenine aminotransferase |
| KMO | kynurenine 3-monooxygenase |
| KYN | kynurenine |
| KYNA | kynurenic acid |
| KYNU | kynureninase |
| L-DOPA | dihydroxyphenylalanine/levodopa |
| LC-MS | liquid chromatography–tandem mass spectrometry |
| MAO | monoamine oxidase |
| MBT | marble burying test |
| MDD | major depressive disorder |
| MEL | melatonin |
| MHPGS | 3-methoxy-4-hydroxyphenylglycol sulphate |
| NMDA | N-methyl-D-aspartate |
| NORT | novel object recognition test |
| OBAT | object-based attention test |
| PI | preference index |
| QA | quinolinic acid |
| QAA | quinaldic acid |
| SCZ | schizophrenia |
| STEM | brainstem |
| STR | striatum |
| Trp | tryptophan |
| TPH | tryptophan hydroxylase |
| Tyr | tyrosine |
| UHPLC-MS | ultra-high-performance liquid chromatography–tandem mass spectrometry |
| VMA | vanillylmandelic acid |
| WT | wild-type |
| XA | xanthurenic acid |
References
- Gupta, R.; Advani, D.; Yadav, D.; Ambasta, R.K.; Kumar, P. Dissecting the Relationship Between Neuropsychiatric and Neurodegenerative Disorders. Mol Neurobiol 2023, 60, 6476–6529. [Google Scholar] [CrossRef]
- Grezenko, H.; Rodoshi, Z.N.; Mimms, C.S.; Ahmed, M.; Sabani, A.; Hlaing, M.S.; Batu, B.J.; Hundesa, M.I.; Ayalew, B.D.; Shehryar, A.; et al. From Alzheimer’s Disease to Anxiety, Epilepsy to Schizophrenia: A Comprehensive Dive Into Neuro-Psychiatric Disorders. Cureus 2024, 16, e58776. [Google Scholar] [CrossRef]
- Nadeem, M.S.; Hosawi, S.; Alshehri, S.; Ghoneim, M.M.; Imam, S.S.; Murtaza, B.N.; Kazmi, I. Symptomatic, Genetic, and Mechanistic Overlaps between Autism and Alzheimer’s Disease. Biomolecules 2021, 11, 1635. [Google Scholar] [CrossRef]
- Cummings, J. The Role of Neuropsychiatric Symptoms in Research Diagnostic Criteria for Neurodegenerative Diseases. Am J Geriatr Psychiatry 2021, 29, 375–383. [Google Scholar] [CrossRef]
- Peralta, V.; Cuesta, M.J. Motor Abnormalities: From Neurodevelopmental to Neurodegenerative Through “Functional” (Neuro)Psychiatric Disorders. Schizophr Bull 2017, 43, 956–971. [Google Scholar] [CrossRef]
- Wang, S.; Jiang, Y.; Yang, A.; Meng, F.; Zhang, J. The Expanding Burden of Neurodegenerative Diseases: An Unmet Medical and Social Need. Aging Dis 2024, 16, 2937–2952. [Google Scholar] [CrossRef] [PubMed]
- Aarsland, D.; Batzu, L.; Halliday, G.M.; Geurtsen, G.J.; Ballard, C.; Ray Chaudhuri, K.; Weintraub, D. Parkinson disease-associated cognitive impairment. Nat Rev Dis Primers 2021, 7, 47. [Google Scholar] [CrossRef] [PubMed]
- de Lima, E.P.; Tanaka, M.; Lamas, C.B.; Quesada, K.; Detregiachi, C.R.P.; Araújo, A.C.; Guiguer, E.L.; Catharin, V.; de Castro, M.V.M.; Junior, E.B.; et al. Vascular Impairment, Muscle Atrophy, and Cognitive Decline: Critical Age-Related Conditions. Biomedicines 2024, 12, 2096. [Google Scholar] [CrossRef] [PubMed]
- Morella, I.M.; Brambilla, R.; Morè, L. Emerging roles of brain metabolism in cognitive impairment and neuropsychiatric disorders. Neurosci Biobehav Rev 2022, 142, 104892. [Google Scholar] [CrossRef]
- de Lima, E.P.; Laurindo, L.F.; Catharin, V.C.S.; Direito, R.; Tanaka, M.; Jasmin Santos German, I.; Lamas, C.B.; Guiguer, E.L.; Araújo, A.C.; Fiorini, A.M.R.; et al. Polyphenols, Alkaloids, and Terpenoids Against Neurodegeneration: Evaluating the Neuroprotective Effects of Phytocompounds Through a Comprehensive Review of the Current Evidence. Metabolites 2025, 15, 124. [Google Scholar] [CrossRef]
- Li, D.; Yu, S.; Long, Y.; Shi, A.; Deng, J.; Ma, Y.; Wen, J.; Li, X.; Liu, S.; Zhang, Y.; et al. Tryptophan metabolism: Mechanism-oriented therapy for neurological and psychiatric disorders. Front Immunol 2022, 13, 985378. [Google Scholar] [CrossRef] [PubMed]
- Davidson, M.; Rashidi, N.; Nurgali, K.; Apostolopoulos, V. The Role of Tryptophan Metabolites in Neuropsychiatric Disorders. Int J Mol Sci 2022, 23, 9968. [Google Scholar] [CrossRef] [PubMed]
- Muneer, A. Kynurenine Pathway of Tryptophan Metabolism in Neuropsychiatric Disorders: Pathophysiologic and Therapeutic Considerations. Clin Psychopharmacol Neurosci 2020, 18, 507–526. [Google Scholar] [CrossRef] [PubMed]
- Gostner, J.M.; Geisler, S.; Stonig, M.; Mair, L.; Sperner-Unterweger, B.; Fuchs, D. Tryptophan Metabolism and Related Pathways in Psychoneuroimmunology: The Impact of Nutrition and Lifestyle. Neuropsychobiology 2020, 79, 89–99. [Google Scholar] [CrossRef]
- Huang, Y.; Zhao, M.; Chen, X.; Zhang, R.; Le, A.; Hong, M.; Zhang, Y.; Jia, L.; Zang, W.; Jiang, C.; et al. Tryptophan Metabolism in Central Nervous System Diseases: Pathophysiology and Potential Therapeutic Strategies. Aging Dis 2023, 14, 858–878. [Google Scholar] [CrossRef]
- Xue, C.; Li, G.; Zheng, Q.; Gu, X.; Shi, Q.; Su, Y.; Chu, Q.; Yuan, X.; Bao, Z.; Lu, J.; et al. Tryptophan metabolism in health and disease. Cell Metab 2023, 35, 1304–1326. [Google Scholar] [CrossRef]
- Hestad, K.; Alexander, J.; Rootwelt, H.; Aaseth, J.O. The Role of Tryptophan Dysmetabolism and Quinolinic Acid in Depressive and Neurodegenerative Diseases. Biomolecules 2022, 12, 998. [Google Scholar] [CrossRef]
- Cervenka, I.; Agudelo, L.Z.; Ruas, J.L. Kynurenines: Tryptophan’s metabolites in exercise, inflammation, and mental health. Science 2017, 357, aaf9794. [Google Scholar] [CrossRef]
- Kennedy, P.J.; Cryan, J.F.; Dinan, T.G.; Clarke, G. Kynurenine pathway metabolism and the microbiota-gut-brain axis. Neuropharmacology 2017, 112, 399–412. [Google Scholar] [CrossRef]
- Lovelace, M.D.; Varney, B.; Sundaram, G.; Lennon, M.J.; Lim, C.K.; Jacobs, K.; Guillemin, G.J.; Brew, B.J. Recent evidence for an expanded role of the kynurenine pathway of tryptophan metabolism in neurological diseases. Neuropharmacology 2017, 112, 373–388. [Google Scholar] [CrossRef]
- Maddison, D.C.; Giorgini, F. The kynurenine pathway and neurodegenerative disease. Semin Cell Dev Biol 2015, 40, 134–141. [Google Scholar] [CrossRef] [PubMed]
- Tanaka, M.; Tóth, F.; Polyák, H.; Szabó, Á.; Mándi, Y.; Vécsei, L. Immune Influencers in Action: Metabolites and Enzymes of the Tryptophan-Kynurenine Metabolic Pathway. Biomedicines 2021, 9, 734. [Google Scholar] [CrossRef]
- Dehhaghi, M.; Kazemi Shariat Panahi, H.; Guillemin, G.J. Microorganisms, Tryptophan Metabolism, and Kynurenine Pathway: A Complex Interconnected Loop Influencing Human Health Status. Int J Tryptophan Res 2019, 12, 1178646919852996. [Google Scholar] [CrossRef]
- Stone, T.W.; Williams, R.O. Tryptophan metabolism as a ‘reflex’ feature of neuroimmune communication: Sensor and effector functions for the indoleamine-2, 3-dioxygenase kynurenine pathway. J Neurochem 2024, 168, 3333–3357. [Google Scholar] [CrossRef]
- Badawy, A.A. Kynurenine Pathway of Tryptophan Metabolism: Regulatory and Functional Aspects. Int J Tryptophan Res 2017, 10, 1178646917691938. [Google Scholar] [CrossRef]
- Sathyasaikumar, K.V.; Notarangelo, F.M.; Kelly, D.L.; Rowland, L.M.; Hare, S.M.; Chen, S.; Mo, C.; Buchanan, R.W.; Schwarcz, R. Tryptophan Challenge in Healthy Controls and People with Schizophrenia: Acute Effects on Plasma Levels of Kynurenine, Kynurenic Acid and 5-Hydroxyindoleacetic Acid. Pharmaceuticals 2022, 15, 1003. [Google Scholar] [CrossRef]
- Hasegawa, M.; Kunisawa, K.; Wulaer, B.; Kubota, H.; Kurahashi, H.; Sakata, T.; Ando, H.; Fujigaki, S.; Fujigaki, H.; Yamamoto, Y.; et al. Chronic stress induces behavioural changes through increased kynurenic acid by downregulation of kynurenine-3-monooxygenase with microglial decline. Br J Pharmacol 2025, 182, 1466–1486. [Google Scholar] [CrossRef]
- Fujigaki, H.; Yamamoto, Y.; Saito, K. L-Tryptophan-kynurenine pathway enzymes are therapeutic target for neuropsychiatric diseases: Focus on cell type differences. Neuropharmacology 2017, 112, 264–274. [Google Scholar] [CrossRef]
- Martos, D.; Tuka, B.; Tanaka, M.; Vécsei, L.; Telegdy, G. Memory Enhancement with Kynurenic Acid and Its Mechanisms in Neurotransmission. Biomedicines 2022, 10, 849. [Google Scholar] [CrossRef] [PubMed]
- Stone, T.W. Does kynurenic acid act on nicotinic receptors? An assessment of the evidence. J Neurochem 2020, 152, 627–649. [Google Scholar] [CrossRef] [PubMed]
- Rossi, F.; Miggiano, R.; Ferraris, D.M.; Rizzi, M. The Synthesis of Kynurenic Acid in Mammals: An Updated Kynurenine Aminotransferase Structural KATalogue. Front Mol Biosci 2019, 6, 7. [Google Scholar] [CrossRef]
- Nematollahi, A.; Sun, G.; Jayawickrama, G.S.; Church, W.B. Kynurenine Aminotransferase Isozyme Inhibitors: A Review. Int J Mol Sci 2016, 17, 946. [Google Scholar] [CrossRef]
- Mor, A.; Tankiewicz-Kwedlo, A.; Krupa, A.; Pawlak, D. Role of Kynurenine Pathway in Oxidative Stress during Neurodegenerative Disorders. Cells 2021, 10, 1603. [Google Scholar] [CrossRef]
- Castellano-Gonzalez, G.; Jacobs, K.R.; Don, E.; Cole, N.J.; Adams, S.; Lim, C.K.; Lovejoy, D.B.; Guillemin, G.J. Kynurenine 3-Monooxygenase Activity in Human Primary Neurons and Effect on Cellular Bioenergetics Identifies New Neurotoxic Mechanisms. Neurotox Res 2019, 35, 530–541. [Google Scholar] [CrossRef] [PubMed]
- Juhász, L.; Spisák, K.; Szolnoki, B.Z.; Nászai, A.; Szabó, Á.; Rutai, A.; Tallósy, S.P.; Szabó, A.; Toldi, J.; Tanaka, M.; et al. The Power Struggle: Kynurenine Pathway Enzyme Knockouts and Brain Mitochondrial Respiration. J Neurochem 2025, 169, e70075. [Google Scholar] [CrossRef] [PubMed]
- Tanaka, M.; Szabó, Á.; Vécsei, L. Redefining Roles: A Paradigm Shift in Tryptophan-Kynurenine Metabolism for Innovative Clinical Applications. Int J Mol Sci 2024, 25, 12767. [Google Scholar] [CrossRef]
- Comai, S.; Bertazzo, A.; Brughera, M.; Crotti, S. Tryptophan in health and disease. Adv Clin Chem 2020, 95, 165–218. [Google Scholar] [CrossRef] [PubMed]
- Roth, W.; Zadeh, K.; Vekariya, R.; Ge, Y.; Mohamadzadeh, M. Tryptophan Metabolism and Gut-Brain Homeostasis. Int J Mol Sci 2021, 22, 2973. [Google Scholar] [CrossRef]
- Höglund, E.; Øverli, Ø.; Winberg, S. Tryptophan Metabolic Pathways and Brain Serotonergic Activity: A Comparative Review. Front Endocrinol (Lausanne) 2019, 10, 158. [Google Scholar] [CrossRef]
- Platten, M.; Nollen, E.A.A.; Röhrig, U.F.; Fallarino, F.; Opitz, C.A. Tryptophan metabolism as a common therapeutic target in cancer, neurodegeneration and beyond. Nat Rev Drug Discov 2019, 18, 379–401. [Google Scholar] [CrossRef]
- Correia, A.S.; Vale, N. Tryptophan Metabolism in Depression: A Narrative Review with a Focus on Serotonin and Kynurenine Pathways. Int J Mol Sci 2022, 23. [Google Scholar] [CrossRef]
- Gibson, E.L. Tryptophan supplementation and serotonin function: genetic variations in behavioural effects. Proc Nutr Soc 2018, 77, 174–188. [Google Scholar] [CrossRef]
- Ribeiro, R.F.N.; Santos, M.R.; Aquino, M.; de Almeida, L.P.; Cavadas, C.; Silva, M.M.C. The Therapeutic Potential of Melatonin and Its Novel Synthetic Analogs in Circadian Rhythm Sleep Disorders, Inflammation-Associated Pathologies, and Neurodegenerative Diseases. Med Res Rev 2025, 45, 1515–1539. [Google Scholar] [CrossRef]
- Vasey, C.; McBride, J.; Penta, K. Circadian Rhythm Dysregulation and Restoration: The Role of Melatonin. Nutrients 2021, 13. [Google Scholar] [CrossRef]
- Kholghi, G.; Eskandari, M.; Shokouhi Qare Saadlou, M.S.; Zarrindast, M.R.; Vaseghi, S. Night shift hormone: How does melatonin affect depression? Physiol Behav 2022, 252, 113835. [Google Scholar] [CrossRef]
- Kałużna-Czaplińska, J.; Gątarek, P.; Chirumbolo, S.; Chartrand, M.S.; Bjørklund, G. How important is tryptophan in human health? Crit Rev Food Sci Nutr 2019, 59, 72–88. [Google Scholar] [CrossRef]
- Zhou, Y.; Chen, Y.; He, H.; Peng, M.; Zeng, M.; Sun, H. The role of the indoles in microbiota-gut-brain axis and potential therapeutic targets: A focus on human neurological and neuropsychiatric diseases. Neuropharmacology 2023, 239, 109690. [Google Scholar] [CrossRef] [PubMed]
- Generoso, J.S.; Giridharan, V.V.; Lee, J.; Macedo, D.; Barichello, T. The role of the microbiota-gut-brain axis in neuropsychiatric disorders. Braz J Psychiatry 2021, 43, 293–305. [Google Scholar] [CrossRef] [PubMed]
- Tran, S.M.; Mohajeri, M.H. The Role of Gut Bacterial Metabolites in Brain Development, Aging and Disease. Nutrients 2021, 13. [Google Scholar] [CrossRef] [PubMed]
- Gao, K.; Mu, C.L.; Farzi, A.; Zhu, W.Y. Tryptophan Metabolism: A Link Between the Gut Microbiota and Brain. Adv Nutr 2020, 11, 709–723. [Google Scholar] [CrossRef]
- Ma, Q.; Xing, C.; Long, W.; Wang, H.Y.; Liu, Q.; Wang, R.F. Impact of microbiota on central nervous system and neurological diseases: the gut-brain axis. J Neuroinflammation 2019, 16, 53. [Google Scholar] [CrossRef]
- Jaglin, M.; Rhimi, M.; Philippe, C.; Pons, N.; Bruneau, A.; Goustard, B.; Daugé, V.; Maguin, E.; Naudon, L.; Rabot, S. Indole, a Signaling Molecule Produced by the Gut Microbiota, Negatively Impacts Emotional Behaviors in Rats. Front Neurosci 2018, 12, 216. [Google Scholar] [CrossRef]
- Ahmed, H.; Leyrolle, Q.; Koistinen, V.; Kärkkäinen, O.; Layé, S.; Delzenne, N.; Hanhineva, K. Microbiota-derived metabolites as drivers of gut-brain communication. Gut Microbes 2022, 14, 2102878. [Google Scholar] [CrossRef]
- Giau, V.V.; Wu, S.Y.; Jamerlan, A.; An, S.S.A.; Kim, S.Y.; Hulme, J. Gut Microbiota and Their Neuroinflammatory Implications in Alzheimer’s Disease. Nutrients 2018, 10. [Google Scholar] [CrossRef]
- Chen, C.Y.; Wang, Y.F.; Lei, L.; Zhang, Y. Impacts of microbiota and its metabolites through gut-brain axis on pathophysiology of major depressive disorder. Life Sci 2024, 351, 122815. [Google Scholar] [CrossRef] [PubMed]
- Wang, Q.; Yang, Q.; Liu, X. The microbiota-gut-brain axis and neurodevelopmental disorders. Protein Cell 2023, 14, 762–775. [Google Scholar] [CrossRef] [PubMed]
- Figueiredo Godoy, A.C.; Frota, F.F.; Araújo, L.P.; Valenti, V.E.; Pereira, E.; Detregiachi, C.R.P.; Galhardi, C.M.; Caracio, F.C.; Haber, R.S.A.; Fornari Laurindo, L.; et al. Neuroinflammation and Natural Antidepressants: Balancing Fire with Flora. Biomedicines 2025, 13. [Google Scholar] [CrossRef] [PubMed]
- Ichinose, H.; Aida, R.; Nago-Iwashita, Y.; Moriya, Y.; Ide, S.; Ikeda, K. MODULATION OF THE DOPAMINERGIC NEUROTRANSMISSION BY CONTROLLING THE ACTIVITY OF TYROSINE HYDROXYLASE. International Journal of Neuropsychopharmacology 2025, 28. [Google Scholar] [CrossRef]
- Speranza, L.; di Porzio, U.; Viggiano, D.; de Donato, A.; Volpicelli, F. Dopamine: The Neuromodulator of Long-Term Synaptic Plasticity, Reward and Movement Control. Cells 2021, 10. [Google Scholar] [CrossRef]
- Oakes, M.; Law, W.J.; Komuniecki, R. Cannabinoids Stimulate the TRP Channel-Dependent Release of Both Serotonin and Dopamine to Modulate Behavior in C. elegans. J Neurosci 2019, 39, 4142–4152. [Google Scholar] [CrossRef]
- Marcos, J.; Renau, N.; Valverde, O.; Aznar-Laín, G.; Gracia-Rubio, I.; Gonzalez-Sepulveda, M.; Pérez-Jurado, L.A.; Ventura, R.; Segura, J.; Pozo, O.J. Targeting tryptophan and tyrosine metabolism by liquid chromatography tandem mass spectrometry. J Chromatogr A 2016, 1434, 91–101. [Google Scholar] [CrossRef]
- Ney, D.M.; Murali, S.G.; Stroup, B.M.; Nair, N.; Sawin, E.A.; Rohr, F.; Levy, H.L. Metabolomic changes demonstrate reduced bioavailability of tyrosine and altered metabolism of tryptophan via the kynurenine pathway with ingestion of medical foods in phenylketonuria. Mol Genet Metab 2017, 121, 96–103. [Google Scholar] [CrossRef] [PubMed]
- Ma, Z.; Stork, T.; Bergles, D.E.; Freeman, M.R. Neuromodulators signal through astrocytes to alter neural circuit activity and behaviour. Nature 2016, 539, 428–432. [Google Scholar] [CrossRef] [PubMed]
- Baik, J.H. Stress and the dopaminergic reward system. Exp Mol Med 2020, 52, 1879–1890. [Google Scholar] [CrossRef] [PubMed]
- Maleeva, G.; Matera, C.; Roda, S.; Colleoni, A.; De Amici, M.; Gorostiza, P. Molecular Tools to Study and Control Dopaminergic Neurotransmission With Light. Med Res Rev 2025, 45, 1407–1422. [Google Scholar] [CrossRef]
- Tanaka, M.; He, Z.; Han, S.; Battaglia, S. Editorial: Noninvasive brain stimulation: a promising approach to study and improve emotion regulation. Front Behav Neurosci 2025, 19, 1633936. [Google Scholar] [CrossRef]
- Szabó, Á.; Galla, Z.; Spekker, E.; Szűcs, M.; Martos, D.; Takeda, K.; Ozaki, K.; Inoue, H.; Yamamoto, S.; Toldi, J.; et al. Oxidative and Excitatory Neurotoxic Stresses in CRISPR/Cas9-Induced Kynurenine Aminotransferase Knockout Mice: A Novel Model for Despair-Based Depression and Post-Traumatic Stress Disorder. Front Biosci (Landmark Ed) 2025, 30, 25706. [Google Scholar] [CrossRef]
- Li, Y.T.; Zhang, C.; Han, J.C.; Shang, Y.X.; Chen, Z.H.; Cui, G.B.; Wang, W. Neuroimaging features of cognitive impairments in schizophrenia and major depressive disorder. Ther Adv Psychopharmacol 2024, 14, 20451253241243290. [Google Scholar] [CrossRef]
- Luo, W.; Luo, L.; Wang, Q.; Li, Y.; Zhang, Y.; Hu, Y.; Yu, Y.; Yu, S.; Lu, F.; Chen, J.; et al. Disorder-specific impaired neurocognitive function in major depression and generalized anxiety disorder. J Affect Disord 2022, 318, 123–129. [Google Scholar] [CrossRef]
- Rhee, T.G.; Shim, S.R.; Manning, K.J.; Tennen, H.A.; Kaster, T.S.; d’Andrea, G.; Forester, B.P.; Nierenberg, A.A.; McIntyre, R.S.; Steffens, D.C. Neuropsychological Assessments of Cognitive Impairment in Major Depressive Disorder: A Systematic Review and Meta-Analysis with Meta-Regression. Psychother Psychosom 2024, 93, 8–23. [Google Scholar] [CrossRef]
- Bora, E. Peripheral inflammatory and neurotrophic biomarkers of cognitive impairment in schizophrenia: a meta-analysis. Psychol Med 2019, 49, 1971–1979. [Google Scholar] [CrossRef] [PubMed]
- MacQueen, G.M.; Memedovich, K.A. Cognitive dysfunction in major depression and bipolar disorder: Assessment and treatment options. Psychiatry Clin Neurosci 2017, 71, 18–27. [Google Scholar] [CrossRef] [PubMed]
- Martin, D.M.; Wollny-Huttarsch, D.; Nikolin, S.; McClintock, S.M.; Alonzo, A.; Lisanby, S.H.; Loo, C.K. Neurocognitive subgroups in major depressive disorder. Neuropsychology 2020, 34, 726–734. [Google Scholar] [CrossRef]
- Ramos-Chávez, L.A.; Roldán-Roldán, G.; García-Juárez, B.; González-Esquivel, D.; Pérez de la Cruz, G.; Pineda, B.; Ramírez-Ortega, D.; García Muñoz, I.; Jiménez Herrera, B.; Ríos, C.; et al. Low Serum Tryptophan Levels as an Indicator of Global Cognitive Performance in Nondemented Women over 50 Years of Age. Oxid Med Cell Longev 2018, 2018, 8604718. [Google Scholar] [CrossRef] [PubMed]
- Hammar, Å.; Ronold, E.H.; Rekkedal, G. Cognitive Impairment and Neurocognitive Profiles in Major Depression-A Clinical Perspective. Front Psychiatry 2022, 13, 764374. [Google Scholar] [CrossRef] [PubMed]
- Barbalho, S.M.; Laurindo, L.F.; de Oliveira Zanuso, B.; da Silva, R.M.S.; Gallerani Caglioni, L.; Nunes Junqueira de Moraes, V.B.F.; Fornari Laurindo, L.; Dogani Rodrigues, V.; da Silva Camarinha Oliveira, J.; Beluce, M.E.; et al. AdipoRon’s Impact on Alzheimer’s Disease-A Systematic Review and Meta-Analysis. Int J Mol Sci 2025, 26. [Google Scholar] [CrossRef]
- Nunes, Y.C.; Mendes, N.M.; Pereira de Lima, E.; Chehadi, A.C.; Lamas, C.B.; Haber, J.F.S.; Dos Santos Bueno, M.; Araújo, A.C.; Catharin, V.C.S.; Detregiachi, C.R.P.; et al. Curcumin: A Golden Approach to Healthy Aging: A Systematic Review of the Evidence. Nutrients 2024, 16. [Google Scholar] [CrossRef]
- Gebreegziabhere, Y.; Habatmu, K.; Mihretu, A.; Cella, M.; Alem, A. Cognitive impairment in people with schizophrenia: an umbrella review. Eur Arch Psychiatry Clin Neurosci 2022, 272, 1139–1155. [Google Scholar] [CrossRef]
- van Hal, R.; Geurts, D.; van Eijndhoven, P.; Kist, J.; Collard, R.M.; Tendolkar, I.; Vrijsen, J.N. A transdiagnostic view on MDD and ADHD: shared cognitive characteristics? J Psychiatr Res 2023, 165, 315–324. [Google Scholar] [CrossRef]
- Martos, D.; Lőrinczi, B.; Szatmári, I.; Vécsei, L.; Tanaka, M. Decoupling Behavioral Domains via Kynurenic Acid Analog Optimization: Implications for Schizophrenia and Parkinson’s Disease Therapeutics. Cells 2025, 14. [Google Scholar] [CrossRef]
- Dounay, A.B.; Tuttle, J.B.; Verhoest, P.R. Challenges and Opportunities in the Discovery of New Therapeutics Targeting the Kynurenine Pathway. J Med Chem 2015, 58, 8762–8782. [Google Scholar] [CrossRef] [PubMed]
- Li, S.; Chen, Y.; Chen, G. Cognitive disorders: Potential astrocyte-based mechanism. Brain Research Bulletin 2025, 220, 111181. [Google Scholar] [CrossRef]
- Tanaka, M.; Szatmári, I.; Vécsei, L. Quinoline Quest: Kynurenic Acid Strategies for Next-Generation Therapeutics via Rational Drug Design. Pharmaceuticals (Basel) 2025, 18. [Google Scholar] [CrossRef]
- Yang, W.; Chen, X.; Li, S.; Li, X.J. Genetically modified large animal models for investigating neurodegenerative diseases. Cell Biosci 2021, 11, 218. [Google Scholar] [CrossRef] [PubMed]
- Verbitsky, A.; Dopfel, D.; Zhang, N. Rodent models of post-traumatic stress disorder: behavioral assessment. Transl Psychiatry 2020, 10, 132. [Google Scholar] [CrossRef]
- Pan, M.-T.; Zhang, H.; Li, X.-J.; Guo, X.-Y. Genetically modified non-human primate models for research on neurodegenerative diseases. Zoological Research 2024, 45, 263. [Google Scholar] [CrossRef]
- Tanaka, M. From Serendipity to Precision: Integrating AI, Multi-Omics, and Human-Specific Models for Personalized Neuropsychiatric Care. Biomedicines 2025, 13. [Google Scholar] [CrossRef]
- Tanaka, M. Beyond the boundaries: Transitioning from categorical to dimensional paradigms in mental health diagnostics. Adv Clin Exp Med 2024, 33, 1295–1301. [Google Scholar] [CrossRef]
- Truett, G.E.; Heeger, P.; Mynatt, R.L.; Truett, A.A.; Walker, J.A.; Warman, M.L. Preparation of PCR-quality mouse genomic DNA with hot sodium hydroxide and tris (HotSHOT). Biotechniques 2000, 29, 52–54. [Google Scholar] [CrossRef]
- Lueptow, L.M. Novel Object Recognition Test for the Investigation of Learning and Memory in Mice. J Vis Exp 2017. [Google Scholar] [CrossRef] [PubMed]
- Grayson, B.; Leger, M.; Piercy, C.; Adamson, L.; Harte, M.; Neill, J.C. Assessment of disease-related cognitive impairments using the novel object recognition (NOR) task in rodents. Behav Brain Res 2015, 285, 176–193. [Google Scholar] [CrossRef]
- Cohen, S.J.; Stackman, R.W., Jr. Assessing rodent hippocampal involvement in the novel object recognition task. A review. Behav Brain Res 2015, 285, 105–117. [Google Scholar] [CrossRef]
- Denninger, J.K.; Smith, B.M.; Kirby, E.D. Novel Object Recognition and Object Location Behavioral Testing in Mice on a Budget. J Vis Exp 2018. [Google Scholar] [CrossRef] [PubMed]
- Chao, O.Y.; Nikolaus, S.; Yang, Y.M.; Huston, J.P. Neuronal circuitry for recognition memory of object and place in rodent models. Neurosci Biobehav Rev 2022, 141, 104855. [Google Scholar] [CrossRef]
- Wulaer, B.; Kunisawa, K.; Kubota, H.; Suento, W.J.; Saito, K.; Mouri, A.; Nabeshima, T. Prefrontal cortex, dorsomedial striatum, and dentate gyrus are necessary in the object-based attention test in mice. Molecular brain 2020, 13, 171. [Google Scholar] [CrossRef]
- Wulaer, B.; Kunisawa, K.; Kubota, H.; Suento, W.J.; Saito, K.; Mouri, A.; Nabeshima, T. Prefrontal cortex, dorsomedial striatum, and dentate gyrus are necessary in the object-based attention test in mice. Mol Brain 2020, 13, 171. [Google Scholar] [CrossRef] [PubMed]
- Thiele, A.; Bellgrove, M.A. Neuromodulation of Attention. Neuron 2018, 97, 769–785. [Google Scholar] [CrossRef] [PubMed]
- Věchetová, G.; Nikolai, T.; Slovák, M.; Forejtová, Z.; Vranka, M.; Straková, E.; Teodoro, T.; Růžička, E.; Edwards, M.J.; Serranová, T. Attention impairment in motor functional neurological disorders: a neuropsychological study. J Neurol 2022, 269, 5981–5990. [Google Scholar] [CrossRef] [PubMed]
- Barone, V.; van Dijk, J.P.; Debeij-van Hall, M.; van Putten, M. A Potential Multimodal Test for Clinical Assessment of Visual Attention in Neurological Disorders. Clin EEG Neurosci 2023, 54, 512–521. [Google Scholar] [CrossRef] [PubMed]
- Kraeuter, A.-K.; Guest, P.C.; Sarnyai, Z. The Y-maze for assessment of spatial working and reference memory in mice. In Pre-clinical models: Techniques and protocols; Springer, 2018; pp. 105–111. [Google Scholar]
- Kraeuter, A.K.; Guest, P.C.; Sarnyai, Z. The Y-Maze for Assessment of Spatial Working and Reference Memory in Mice. Methods Mol Biol 2019, 1916, 105–111. [Google Scholar] [CrossRef]
- Prieur, E.A.K.; Jadavji, N.M. Assessing Spatial Working Memory Using the Spontaneous Alternation Y-maze Test in Aged Male Mice. Bio Protoc 2019, 9, e3162. [Google Scholar] [CrossRef] [PubMed]
- Melbiarta, R.R.; Kalanjati, V.P.; Herawati, L.; Salim, Y.; Othman, Z. Analysis of spatial working memory using the Y-maze on rodents treated with high-calorie diet and moderate-intensity exercise. Folia Medica Indonesiana 2022, 59, 40–45. [Google Scholar] [CrossRef]
- Dixit, P.V.; Sahu, R.; Mishra, D.K. Marble-burying behavior test as a murine model of compulsive-like behavior. Journal of pharmacological and toxicological methods 2020, 102, 106676. [Google Scholar] [CrossRef] [PubMed]
- Dixit, P.V.; Sahu, R.; Mishra, D.K. Marble-burying behavior test as a murine model of compulsive-like behavior. J Pharmacol Toxicol Methods 2020, 102, 106676. [Google Scholar] [CrossRef]
- Taylor, G. Marble burying as compulsive behaviors in male and female mice. Acta Neurobiologiae Experimentalis 2017, 77, 254–260. [Google Scholar] [CrossRef]
- de Brouwer, G.; Wolmarans, W. Back to basics: A methodological perspective on marble-burying behavior as a screening test for psychiatric illness. Behav Processes 2018, 157, 590–600. [Google Scholar] [CrossRef]
- Langer, E.; Einat, H.; Stukalin, Y. Similarities and dissimilarities in the effects of benzodiazepines and specific serotonin reuptake inhibitors (SSRIs) in the defensive marble burying test: A systematic review and meta-analysis. Eur Neuropsychopharmacol 2020, 36, 38–49. [Google Scholar] [CrossRef]
- Yang, M.; Silverman, J.L.; Crawley, J.N. Automated three-chambered social approach task for mice. Curr Protoc Neurosci, 2011; 8, Unit 8.26. [Google Scholar] [CrossRef]
- Oliver, L.D.; Moxon-Emre, I.; Lai, M.C.; Grennan, L.; Voineskos, A.N.; Ameis, S.H. Social Cognitive Performance in Schizophrenia Spectrum Disorders Compared With Autism Spectrum Disorder: A Systematic Review, Meta-analysis, and Meta-regression. JAMA Psychiatry 2021, 78, 281–292. [Google Scholar] [CrossRef]
- Fernandes, J.M.; Cajão, R.; Lopes, R.; Jerónimo, R.; Barahona-Corrêa, J.B. Social Cognition in Schizophrenia and Autism Spectrum Disorders: A Systematic Review and Meta-Analysis of Direct Comparisons. Front Psychiatry 2018, 9, 504. [Google Scholar] [CrossRef]
- Morrison, K.E.; Pinkham, A.E.; Penn, D.L.; Kelsven, S.; Ludwig, K.; Sasson, N.J. Distinct profiles of social skill in adults with autism spectrum disorder and schizophrenia. Autism Res 2017, 10, 878–887. [Google Scholar] [CrossRef]
- Pinkham, A.E.; Morrison, K.E.; Penn, D.L.; Harvey, P.D.; Kelsven, S.; Ludwig, K.; Sasson, N.J. Comprehensive comparison of social cognitive performance in autism spectrum disorder and schizophrenia. Psychol Med 2020, 50, 2557–2565. [Google Scholar] [CrossRef]
- Arakawa, H. Revisiting sociability: Factors facilitating approach and avoidance during the three-chamber test. Physiol Behav 2023, 272, 114373. [Google Scholar] [CrossRef]
- Kaidanovich-Beilin, O.; Lipina, T.; Vukobradovic, I.; Roder, J.; Woodgett, J.R. Assessment of social interaction behaviors. J Vis Exp 2011. [Google Scholar] [CrossRef]
- Rein, B.; Ma, K.; Yan, Z. A standardized social preference protocol for measuring social deficits in mouse models of autism. Nat Protoc 2020, 15, 3464–3477. [Google Scholar] [CrossRef]
- Moy, S.S.; Nadler, J.J.; Perez, A.; Barbaro, R.P.; Johns, J.M.; Magnuson, T.R.; Piven, J.; Crawley, J.N. Sociability and preference for social novelty in five inbred strains: an approach to assess autistic-like behavior in mice. Genes Brain Behav 2004, 3, 287–302. [Google Scholar] [CrossRef]
- Lubrich, C.; Giesler, P.; Kipp, M. Motor behavioral deficits in the cuprizone model: validity of the rotarod test paradigm. International journal of molecular sciences 2022, 23, 11342. [Google Scholar] [CrossRef] [PubMed]
- Shan, H.M.; Maurer, M.A.; Schwab, M.E. Four-parameter analysis in modified Rotarod test for detecting minor motor deficits in mice. BMC Biol 2023, 21, 177. [Google Scholar] [CrossRef] [PubMed]
- Lubrich, C.; Giesler, P.; Kipp, M. Motor Behavioral Deficits in the Cuprizone Model: Validity of the Rotarod Test Paradigm. Int J Mol Sci 2022, 23. [Google Scholar] [CrossRef] [PubMed]
- Keane, S.P.; Chadman, K.K.; Gomez, A.R.; Hu, W. Pros and cons of narrow- versus wide-compartment rotarod apparatus: An experimental study in mice. Behav Brain Res 2024, 463, 114901. [Google Scholar] [CrossRef] [PubMed]
- Cording, K.R.; Bateup, H.S. Altered motor learning and coordination in mouse models of autism spectrum disorder. Front Cell Neurosci 2023, 17, 1270489. [Google Scholar] [CrossRef]
- Galla, Z.; Rajda, C.; Rácz, G.; Grecsó, N.; Baráth, Á.; Vécsei, L.; Bereczki, C.; Monostori, P. Simultaneous determination of 30 neurologically and metabolically important molecules: A sensitive and selective way to measure tyrosine and tryptophan pathway metabolites and other biomarkers in human serum and cerebrospinal fluid. J Chromatogr A 2021, 1635, 461775. [Google Scholar] [CrossRef]
- Galla, Z.; Rácz, G.; Grecsó, N.; Baráth, Á.; Kósa, M.; Bereczki, C.; Monostori, P. Improved LC-MS/MS method for the determination of 42 neurologically and metabolically important molecules in urine. J Chromatogr B Analyt Technol Biomed Life Sci 2021, 1179, 122846. [Google Scholar] [CrossRef] [PubMed]
- Fathi, M.; Vakili, K.; Yaghoobpoor, S.; Tavasol, A.; Jazi, K.; Hajibeygi, R.; Shool, S.; Sodeifian, F.; Klegeris, A.; McElhinney, A.; et al. Dynamic changes in metabolites of the kynurenine pathway in Alzheimer’s disease, Parkinson’s disease, and Huntington’s disease: A systematic Review and meta-analysis. Front Immunol 2022, 13, 997240. [Google Scholar] [CrossRef] [PubMed]
- Tanaka, M.; Bohár, Z.; Vécsei, L. Are Kynurenines Accomplices or Principal Villains in Dementia? Maintenance of Kynurenine Metabolism. Molecules 2020, 25. [Google Scholar] [CrossRef] [PubMed]
- Kim, Y.K.; Jeon, S.W. Neuroinflammation and the Immune-Kynurenine Pathway in Anxiety Disorders. Curr Neuropharmacol 2018, 16, 574–582. [Google Scholar] [CrossRef]
- Imbeault, S.; Gubert Olivé, M.; Jungholm, O.; Erhardt, S.; Wigström, H.; Engberg, G.; Jardemark, K. Blockade of KAT II Facilitates LTP in Kynurenine 3-Monooxygenase Depleted Mice. Int J Tryptophan Res 2021, 14, 11786469211041368. [Google Scholar] [CrossRef]
- Blanco Ayala, T.B.; Ramírez Ortega, D.R.; Ovalle Rodríguez, P.O.; Pineda, B.; Pérez de la Cruz, G.P.; González Esquivel, D.G.; Schwarcz, R.; Sathyasaikumar, K.V.; Jiménez Anguiano, A.J.; Pérez de la Cruz, V.P. Subchronic N-acetylcysteine Treatment Decreases Brain Kynurenic Acid Levels and Improves Cognitive Performance in Mice. Antioxidants (Basel) 2021, 10. [Google Scholar] [CrossRef]
- Ovalle Rodríguez, P.; Ramírez Ortega, D.; Blanco Ayala, T.; Roldán Roldán, G.; Pérez de la Cruz, G.; González Esquivel, D.F.; Gómez-Manzo, S.; Sánchez Chapul, L.; Salazar, A.; Pineda, B.; et al. Modulation of Kynurenic Acid Production by N-acetylcysteine Prevents Cognitive Impairment in Adulthood Induced by Lead Exposure during Lactation in Mice. Antioxidants (Basel) 2023, 12. [Google Scholar] [CrossRef]
- Bai, M.Y.; Lovejoy, D.B.; Guillemin, G.J.; Kozak, R.; Stone, T.W.; Koola, M.M. Galantamine-Memantine Combination and Kynurenine Pathway Enzyme Inhibitors in the Treatment of Neuropsychiatric Disorders. Complex Psychiatry 2021, 7, 19–33. [Google Scholar] [CrossRef]
- Nikolaus, S.; Fazari, B.; Chao, O.Y.; Almeida, F.R.; Abdel-Hafiz, L.; Beu, M.; Henke, J.; Antke, C.; Hautzel, H.; Mamlins, E.; et al. 2,5-Dimethoxy-4-iodoamphetamine and altanserin induce region-specific shifts in dopamine and serotonin metabolization pathways in the rat brain. Pharmacol Biochem Behav 2024, 242, 173823. [Google Scholar] [CrossRef]
- Tanaka, M.; Battaglia, S.; Liloia, D. Navigating Neurodegeneration: Integrating Biomarkers, Neuroinflammation, and Imaging in Parkinson’s, Alzheimer’s, and Motor Neuron Disorders. Biomedicines 2025, 13. [Google Scholar] [CrossRef]
- Qin, Y.; Hu, X.; Zhao, H.-L.; Kurban, N.; Chen, X.; Yi, J.-K.; Zhang, Y.; Cui, S.-Y.; Zhang, Y.-H. Inhibition of indoleamine 2, 3-dioxygenase exerts antidepressant-like effects through distinct pathways in prelimbic and infralimbic cortices in rats under intracerebroventricular injection with streptozotocin. International Journal of Molecular Sciences 2024, 25, 7496. [Google Scholar] [CrossRef]
- Barbalho, S.M.; Leme Boaro, B.; da Silva Camarinha Oliveira, J.; Patočka, J.; Barbalho Lamas, C.; Tanaka, M.; Laurindo, L.F. Molecular Mechanisms Underlying Neuroinflammation Intervention with Medicinal Plants: A Critical and Narrative Review of the Current Literature. Pharmaceuticals (Basel) 2025, 18. [Google Scholar] [CrossRef]
- Nicosia, N.; Giovenzana, M.; Misztak, P.; Mingardi, J.; Musazzi, L. Glutamate-Mediated Excitotoxicity in the Pathogenesis and Treatment of Neurodevelopmental and Adult Mental Disorders. Int J Mol Sci 2024, 25. [Google Scholar] [CrossRef] [PubMed]
- Pastor, V.; Medina, J.H. α7 nicotinic acetylcholine receptor in memory processing. Eur J Neurosci 2024, 59, 2138–2154. [Google Scholar] [CrossRef] [PubMed]
- Pocivavsek, A.; Baratta, A.M.; Mong, J.A.; Viechweg, S.S. Acute Kynurenine Challenge Disrupts Sleep-Wake Architecture and Impairs Contextual Memory in Adult Rats. Sleep 2017, 40. [Google Scholar] [CrossRef] [PubMed]
- Young, K.D.; Drevets, W.C.; Dantzer, R.; Teague, T.K.; Bodurka, J.; Savitz, J. Kynurenine pathway metabolites are associated with hippocampal activity during autobiographical memory recall in patients with depression. Brain Behav Immun 2016, 56, 335–342. [Google Scholar] [CrossRef]
- Savitz, J.; Dantzer, R.; Wurfel, B.E.; Victor, T.A.; Ford, B.N.; Bodurka, J.; Bellgowan, P.S.; Teague, T.K.; Drevets, W.C. Neuroprotective kynurenine metabolite indices are abnormally reduced and positively associated with hippocampal and amygdalar volume in bipolar disorder. Psychoneuroendocrinology 2015, 52, 200–211. [Google Scholar] [CrossRef]
- Chmiel-Perzyńska, I.; Perzyński, A.; Olajossy, B.; Gil-Kulik, P.; Kocki, J.; Urbańska, E.M. Losartan Reverses Hippocampal Increase of Kynurenic Acid in Type 1 Diabetic Rats: A Novel Procognitive Aspect of Sartan Action. J Diabetes Res 2019, 2019, 4957879. [Google Scholar] [CrossRef]
- Sánchez Chapul, L.; Pérez de la Cruz, G.; Ramos Chávez, L.A.; Valencia León, J.F.; Torres Beltrán, J.; Estrada Camarena, E.; Carillo Mora, P.; Ramírez Ortega, D.; Baños Vázquez, J.U.; Martínez Nava, G. Characterization of redox environment and tryptophan catabolism through kynurenine pathway in military divers’ and swimmers’ serum samples. Antioxidants 2022, 11, 1223. [Google Scholar] [CrossRef]
- Ostapiuk, A.; Urbanska, E.M. Kynurenic acid in neurodegenerative disorders—unique neuroprotection or double--edged sword? CNS neuroscience & therapeutics 2022, 28, 19–35. [Google Scholar]
- Jomova, K.; Raptova, R.; Alomar, S.Y.; Alwasel, S.H.; Nepovimova, E.; Kuca, K.; Valko, M. Reactive oxygen species, toxicity, oxidative stress, and antioxidants: chronic diseases and aging. Archives of toxicology 2023, 97, 2499–2574. [Google Scholar]
- Kubota, H.; Kunisawa, K.; Niijima, M.; Hirakawa, M.; Mori, Y.; Hasegawa, M.; Fujigaki, S.; Fujigaki, H.; Yamamoto, Y.; Saito, K. Deficiency of kynurenine 3-monooxygenase exacerbates impairment of prepulse inhibition induced by phencyclidine. Biochemical and Biophysical Research Communications 2022, 629, 142–151. [Google Scholar] [CrossRef]
- Fanet, H.; Capuron, L.; Castanon, N.; Calon, F.; Vancassel, S. Tetrahydrobioterin (BH4) pathway: from metabolism to neuropsychiatry. Current neuropharmacology 2021, 19, 591–609. [Google Scholar]
- Vasquez-Vivar, J.; Shi, Z.; Tan, S. Tetrahydrobiopterin in cell function and death mechanisms. Antioxidants & redox signaling 2022, 37, 171–183. [Google Scholar]
- Feng, Y.; Feng, Y.; Gu, L.; Liu, P.; Cao, J.; Zhang, S. The critical role of tetrahydrobiopterin (BH4) metabolism in modulating radiosensitivity: BH4/NOS axis as an angel or a devil. Frontiers in Oncology 2021, 11, 720632. [Google Scholar] [CrossRef] [PubMed]
- Tanaka, M.; Battaglia, S. Dualistic Dynamics in Neuropsychiatry: From Monoaminergic Modulators to Multiscale Biomarker Maps. Biomedicines 2025, 13. [Google Scholar] [CrossRef]
- Sun, J.; Zhang, Y.; Kong, Y.; Ye, T.; Yu, Q.; Kumaran Satyanarayanan, S.; Su, K.P.; Liu, J. Microbiota-derived metabolite Indoles induced aryl hydrocarbon receptor activation and inhibited neuroinflammation in APP/PS1 mice. Brain Behav Immun 2022, 106, 76–88. [Google Scholar] [CrossRef] [PubMed]
- Czapski, G.A.; Strosznajder, J.B. Glutamate and GABA in Microglia-Neuron Cross-Talk in Alzheimer’s Disease. Int J Mol Sci 2021, 22. [Google Scholar] [CrossRef]
- Basilico, B.; Ferrucci, L.; Ratano, P.; Golia, M.T.; Grimaldi, A.; Rosito, M.; Ferretti, V.; Reverte, I.; Sanchini, C.; Marrone, M.C.; et al. Microglia control glutamatergic synapses in the adult mouse hippocampus. Glia 2022, 70, 173–195. [Google Scholar] [CrossRef]
- Li, C.C.; Jiang, N.; Gan, L.; Zhao, M.J.; Chang, Q.; Liu, X.M.; Pan, R.L. Peripheral and cerebral abnormalities of the tryptophan metabolism in the depression-like rats induced by chronic unpredicted mild stress. Neurochem Int 2020, 138, 104771. [Google Scholar] [CrossRef] [PubMed]
- Peng, Y.; Gao, P.; Shi, L.; Chen, L.; Liu, J.; Long, J. Central and Peripheral Metabolic Defects Contribute to the Pathogenesis of Alzheimer’s Disease: Targeting Mitochondria for Diagnosis and Prevention. Antioxid Redox Signal 2020, 32, 1188–1236. [Google Scholar] [CrossRef]
- Correia, A.S.; Cardoso, A.; Vale, N. Oxidative Stress in Depression: The Link with the Stress Response, Neuroinflammation, Serotonin, Neurogenesis and Synaptic Plasticity. Antioxidants (Basel) 2023, 12. [Google Scholar] [CrossRef] [PubMed]
- Ferreira, A.; Harter, A.; Afreen, S.; Kanai, K.; Batori, S.; Redei, E.E. The WMI Rat of Premature Cognitive Aging Presents Intrinsic Vulnerability to Oxidative Stress in Primary Neurons and Astrocytes Compared to Its Nearly Isogenic WLI Control. Int J Mol Sci 2024, 25. [Google Scholar] [CrossRef]
- Sathyasaikumar, K.V.; Pérez de la Cruz, V.; Pineda, B.; Vázquez Cervantes, G.I.; Ramírez Ortega, D.; Donley, D.W.; Severson, P.L.; West, B.L.; Giorgini, F.; Fox, J.H.; et al. Cellular Localization of Kynurenine 3-Monooxygenase in the Brain: Challenging the Dogma. Antioxidants (Basel) 2022, 11. [Google Scholar] [CrossRef]
- Brown, S.J.; Brown, A.M.; Purves-Tyson, T.D.; Huang, X.F.; Shannon Weickert, C.; Newell, K.A. Alterations in the kynurenine pathway and excitatory amino acid transporter-2 in depression with and without psychosis: Evidence of a potential astrocyte pathology. J Psychiatr Res 2022, 147, 203–211. [Google Scholar] [CrossRef]
- Wu, P.; Wang, W.; Huang, C.; Sun, L.; Wu, X.; Xu, L.; Xiao, P. A rapid and reliable targeted LC-MS/MS method for quantitative analysis of the Tryptophan-NAD metabolic network disturbances in tissues and blood of sleep deprivation mice. Anal Chim Acta 2024, 1328, 343125. [Google Scholar] [CrossRef]
- Bellot, M.; Espinosa-Velasco, M.; López-Arnau, R.; Escubedo, E.; Gómez-Canela, C. Characterization of monoaminergic neurochemicals in cortex and striatum of mouse brain. J Pharm Biomed Anal 2022, 217, 114844. [Google Scholar] [CrossRef]
- Gomez-Gomez, A.; Olesti, E.; Montero-San-Martin, B.; Soldevila, A.; Deschamps, T.; Pizarro, N.; de la Torre, R.; Pozo, O.J. Determination of up to twenty carboxylic acid containing compounds in clinically relevant matrices by o-benzylhydroxylamine derivatization and liquid chromatography-tandem mass spectrometry. J Pharm Biomed Anal 2022, 208, 114450. [Google Scholar] [CrossRef]
- Patel, V.D.; Shamsi, S.A.; Miller, A.; Liu, A.; Powell, M. Simultaneous separation and detection of nine kynurenine pathway metabolites by reversed-phase liquid chromatography-mass spectrometry: Quantitation of inflammation in human cerebrospinal fluid and plasma. Anal Chim Acta 2023, 1278, 341659. [Google Scholar] [CrossRef] [PubMed]
- Herb, B.R.; Glover, H.J.; Bhaduri, A.; Colantuoni, C.; Bale, T.L.; Siletti, K.; Hodge, R.; Lein, E.; Kriegstein, A.R.; Doege, C.A.; et al. Single-cell genomics reveals region-specific developmental trajectories underlying neuronal diversity in the human hypothalamus. Sci Adv 2023, 9, eadf6251. [Google Scholar] [CrossRef]
- Pokhilko, A.; Handel, A.E.; Curion, F.; Volpato, V.; Whiteley, E.S.; Bøstrand, S.; Newey, S.E.; Akerman, C.J.; Webber, C.; Clark, M.B.; et al. Targeted single-cell RNA sequencing of transcription factors enhances the identification of cell types and trajectories. Genome Res 2021, 31, 1069–1081. [Google Scholar] [CrossRef] [PubMed]
- Steyn, C.; Mishi, R.; Fillmore, S.; Verhoog, M.B.; More, J.; Rohlwink, U.K.; Melvill, R.; Butler, J.; Enslin, J.M.N.; Jacobs, M.; et al. A temporal cortex cell atlas highlights gene expression dynamics during human brain maturation. Nat Genet 2024, 56, 2718–2730. [Google Scholar] [CrossRef] [PubMed]
- Zhang, P.; Omanska, A.; Ander, B.P.; Gandal, M.J.; Stamova, B.; Schumann, C.M. Neuron-specific transcriptomic signatures indicate neuroinflammation and altered neuronal activity in ASD temporal cortex. Proceedings of the National Academy of Sciences 2023, 120, e2206758120. [Google Scholar] [CrossRef]
- Swift, J.; Greenham, K.; Ecker, J.R.; Coruzzi, G.M.; Robertson McClung, C. The biology of time: dynamic responses of cell types to developmental, circadian and environmental cues. Plant J 2022, 109, 764–778. [Google Scholar] [CrossRef] [PubMed]
- Pocivavsek, A.; Schwarcz, R.; Erhardt, S. Neuroactive Kynurenines as Pharmacological Targets: New Experimental Tools and Exciting Therapeutic Opportunities. Pharmacol Rev 2024, 76, 978–1008. [Google Scholar] [CrossRef]
- Cheng, D.; Qin, Z.S.; Zheng, Y.; Xie, J.Y.; Liang, S.S.; Zhang, J.L.; Feng, Y.B.; Zhang, Z.J. Minocycline, a classic antibiotic, exerts psychotropic effects by normalizing microglial neuroinflammation-evoked tryptophan-kynurenine pathway dysregulation in chronically stressed male mice. Brain Behav Immun 2023, 107, 305–318. [Google Scholar] [CrossRef]
- Tanaka, M. Parkinson’s Disease: Bridging Gaps, Building Biomarkers, and Reimagining Clinical Translation. Cells 2025, 14. [Google Scholar] [CrossRef]
- Chen, Y.; Zhang, J.; Yang, Y.; Xiang, K.; Li, H.; Sun, D.; Chen, L. Kynurenine-3-monooxygenase (KMO): From its biological functions to therapeutic effect in diseases progression. J Cell Physiol 2022, 237, 4339–4355. [Google Scholar] [CrossRef]
- Mouri, A.; Hasegawa, M.; Kunisawa, K.; Saito, K.; Nabeshima, T. [Diagnoses and new therapeutic strategy focused on physiological alteration of tryptophan metabolism]. Nihon Yakurigaku Zasshi 2023, 158, 233–237. [Google Scholar] [CrossRef]
- Ramirez Ortega, D.; Ovalle Rodríguez, P.; Pineda, B.; González Esquivel, D.F.; Ramos Chávez, L.A.; Vázquez Cervantes, G.I.; Roldán Roldán, G.; Pérez de la Cruz, G.; Díaz Ruiz, A.; Méndez Armenta, M.; et al. Kynurenine Pathway as a New Target of Cognitive Impairment Induced by Lead Toxicity During the Lactation. Sci Rep 2020, 10, 3184. [Google Scholar] [CrossRef]
- Milosavljevic, S.; Piroli, M.V.; Sandago, E.J.; Piroli, G.G.; Smith, H.H.; Beggiato, S.; Frizzell, N.; Pocivavsek, A. Parental kynurenine 3-monooxygenase genotype in mice directs sex-specific behavioral outcomes in offspring. Biol Sex Differ 2025, 16, 22. [Google Scholar] [CrossRef]
- Leigh, S.J.; Uhlig, F.; Wilmes, L.; Sanchez-Diaz, P.; Gheorghe, C.E.; Goodson, M.S.; Kelley-Loughnane, N.; Hyland, N.P.; Cryan, J.F.; Clarke, G. The impact of acute and chronic stress on gastrointestinal physiology and function: a microbiota-gut-brain axis perspective. J Physiol 2023, 601, 4491–4538. [Google Scholar] [CrossRef]
- Kuijer, E.J.; Steenbergen, L. The microbiota-gut-brain axis in hippocampus-dependent learning and memory: current state and future challenges. Neurosci Biobehav Rev 2023, 152, 105296. [Google Scholar] [CrossRef]
- Huang, T.T.; Tseng, L.M.; Chen, J.L.; Chu, P.Y.; Lee, C.H.; Huang, C.T.; Wang, W.L.; Lau, K.Y.; Tseng, M.F.; Chang, Y.Y.; et al. Kynurenine 3-monooxygenase upregulates pluripotent genes through β-catenin and promotes triple-negative breast cancer progression. EBioMedicine 2020, 54, 102717. [Google Scholar] [CrossRef]
- Rutsch, A.; Kantsjö, J.B.; Ronchi, F. The Gut-Brain Axis: How Microbiota and Host Inflammasome Influence Brain Physiology and Pathology. Front Immunol 2020, 11, 604179. [Google Scholar] [CrossRef] [PubMed]
- Interino, N.; Vitagliano, R.; D’Amico, F.; Lodi, R.; Porru, E.; Turroni, S.; Fiori, J. Microbiota-Gut-Brain Axis: Mass-Spectrometry-Based Metabolomics in the Study of Microbiome Mediators-Stress Relationship. Biomolecules 2025, 15. [Google Scholar] [CrossRef] [PubMed]
- Deng, Y.; Zhou, M.; Wang, J.; Yao, J.; Yu, J.; Liu, W.; Wu, L.; Wang, J.; Gao, R. Involvement of the microbiota-gut-brain axis in chronic restraint stress: disturbances of the kynurenine metabolic pathway in both the gut and brain. Gut Microbes 2021, 13, 1–16. [Google Scholar] [CrossRef] [PubMed]
- Góralczyk-Bińkowska, A.; Szmajda-Krygier, D.; Kozłowska, E. The Microbiota-Gut-Brain Axis in Psychiatric Disorders. Int J Mol Sci 2022, 23. [Google Scholar] [CrossRef]
- Tanaka, M.; Vécsei, L. Revolutionizing our understanding of Parkinson’s disease: Dr. Heinz Reichmann’s pioneering research and future research direction. J Neural Transm (Vienna) 2024, 131, 1367–1387. [Google Scholar] [CrossRef]
- Verma, A.; Inslicht, S.S.; Bhargava, A. Gut-Brain Axis: Role of Microbiome, Metabolomics, Hormones, and Stress in Mental Health Disorders. Cells 2024, 13. [Google Scholar] [CrossRef] [PubMed]
- Heidari, H.; Lawrence, D.A. An integrative exploration of environmental stressors on the microbiome-gut-brain axis and immune mechanisms promoting neurological disorders. J Toxicol Environ Health B Crit Rev 2024, 27, 233–263. [Google Scholar] [CrossRef] [PubMed]

| Behavioral test type |
Number of animals (WT/kat2-/-) |
Phase of the test |
Parameter of the test |
WT mean ± SD |
kat2-/- mean ± SD |
p-value |
|---|---|---|---|---|---|---|
| NORT | 12/12 | Testing phase |
Time spent with familiar object (s) |
17.500 ± 8.635 | 18.556 ± 11.886 | p < 0.839 |
| Time spent with novel object (s) |
66.250 ± 59.461 | 72.444 ± 38.730 | p < 0.596 | |||
| Discrimination index |
0.455 ± 0.321 | 0.592 ± 0.141 | p < 0.294 | |||
| Preference index |
72.760 ± 16.032 | 79.604 ± 7.061 | p < 0.293 | |||
| OBAT | 12/12 | Testing phase |
Time spent with familiar object (s) |
15.362 ± 7.437 | 10.729 ± 6.786 | p < 0.905 |
| Time spent with novel object (s) |
19.747 ± 7.820 | 15.796 ± 6.372 | p < 0.268 | |||
| Discrimination index |
0.136 ± 0.239 | 0.239 ± 0.287 | p < 0.428 | |||
| Preference index (%) |
56.802 ± 11.943 | 61.944 ± 14.355 | p < 0.428 | |||
| Y-maze | 12/12 | - | Spontaneous alternations (%) |
52.833 ± 27.996 | 66.500 ± 18.880 | p < 0.175 |
| Number of total entries |
15.583 ± 11.579 | 18.000 ± 15.788 | p < 0.954 | |||
| MBT | 10/13 | - | Buried marbles |
5.467 ± 4.207 | 6.133 ± 4.121 | p < 0.738 |
| Partially buried marbles |
4.267 ± 2.344 | 4.533 ± 2.326 | p < 0.757 | |||
| Displaced marbles |
1.733 ± 1.870 | 1.333 ± 1.345 | p < 0.731 | |||
| Intact marbles |
4.533 ± 3.248 | 4.000 ± 2.976 | p < 0.643 | |||
| 3CT | 12/12 | Testing sociability |
Time in social chamber (s) |
265.717 ± 40.368 | 260.658 ± 54.993 | p < 0.799 |
| Time in non-social chamber (s) |
247.748 ± 25.751 | 247.988 ± 56.056 | p < 0.989 | |||
| Time in center chamber (s) |
86.536 ± 32.148 | 91.355 ± 28.005 | p < 0.699 | |||
| Sniffing social cage (s) |
145.955 ± 39.690 | 136.336 ± 37.149 | p < 0.546 | |||
| Sniffing non-social cage (s) |
114.603 ± 33.637 | 117.447 ± 33.452 | p < 0.837 | |||
| Total sniffing time (s) |
260.558 ± 38.784 | 253.783 ± 47.129 | p < 0.704 | |||
| Social chamber entries (number) | 12.667 ± 3.725 | 13.417 ± 4.621 | p < 0.666 | |||
| Non-social chamber entries (number) | 13.167 ± 4.174 | 12.833 ± 4.687 | p < 0.855 | |||
| Total entries (number) | 25.833 ± 7.673 | 26.250 ± 9.245 | p < 0.905 | |||
| Testing novelty preference |
Time in novel chamber (s) |
263.188 ± 60.124 | 253.058 ± 68.641 | p < 0.704 | ||
| Time in familiar chamber (s) |
238.687 ± 55.961 | 237.654 ± 56.502 | p < 0.964 | |||
| Time in center chamber (s) |
98.126 ± 40.008 | 109.288 ± 53.470 | p < 0.568 | |||
| Sniffing novel animal’s cage (s) |
129.261 ± 50.164 | 109.373 ± 44.085 | p < 0.313 | |||
| Sniffing familiar animal’s cage (s) |
95.015 ± 51.306 | 92.903 ± 62.090 | p < 0.928 | |||
| Total sniffing time (s) |
224.276 ± 75.342 | 202.276 ± 79.270 | p < 0.493 | |||
| Novel chamber entries (number) | 9.917 ± 3.450 | 11.083 ± 3.679 | p < 0.431 | |||
| Familiar chamber entries (number) | 10.250 ± 3.279 | 11.167 ± 4.764 | p < 0.589 | |||
| Total entries (number) | 20.167 ± 6.548 | 22.250 ± 7.979 | p < 0.492 | |||
| Rotarod | 12/12 | - | Mean time spent on the rod |
100.428 ± 35.017 | 89.708 ± 41.453 | p < 0.501 |
| Test type |
Phase of the test | WT | kat2-/- | ||||
|---|---|---|---|---|---|---|---|
| NORT | Testing phase |
Sniffing familiar object (s) |
Sniffing novel object (s) |
p-value |
Sniffing familiar object (s) |
Sniffing novel object (s) |
p-value |
| 17.500 ± 8.635 | 66.250 ± 59.461 | p < 0.018 * | 18.556 ± 11.886 | 72.444 ± 38.730 | p < 0.001 *** | ||
| OBAT | Testing phase |
Sniffing familiar object (s) |
Sniffing novel object (s) |
Sniffing familiar object (s) |
Sniffing novel object (s) |
||
| 15.362 ± 7.437 | 19.747 ± 7.820 | p < 0.081 | 10.729 ± 6.786 | 15.796 ± 6.372 | p < 0.039 * | ||
| 3CT | Testing sociability |
Time in social chamber (s) |
Time in center chamber (s) |
Time in social chamber (s) |
Time in center chamber (s) |
||
| 265.717 ± 40.368 | 86.536 ± 32.148 | p < 0.001 *** | 260.658 ± 54.993 | 91.355 ± 28.005 | p < 0.001 *** | ||
|
Time in non-social chamber (s) |
Time in center chamber (s) |
Time in non-social chamber (s) |
Time in center chamber (s) |
||||
| 247.748 ± 25.751 | 86.536 ± 32.148 | p < 0.001 *** | 247.988 ± 56.056 | 91.355 ± 28.005 | p < 0.001 *** | ||
|
Time in social chamber (s) |
Time in non-social chamber (s) |
Time in social chamber (s) |
Time in non-social chamber (s) |
||||
| 265.717 ± 40.368 | 247.748 ± 25.751 | p < 0.319 | 260.658 ± 54.993 | 247.988 ± 56.056 | p < 0.691 | ||
|
Sniffing social cage (s) |
Sniffing non-social cage (s) |
Sniffing social cage (s) |
Sniffing non-social cage (s) |
||||
| 145.955 ± 39.690 | 114.603 ± 33.637 | p < 0.110 | 136.336 ± 37.149 | 117.447 ± 33.452 | p < 0.240 | ||
|
Social chamber entries (number) |
Non-social chamber entries (number) |
Social chamber entries (number) |
Non-social chamber entries (number) |
||||
| 12.667 ± 3.725 | 13.167 ± 4.174 | p < 0.389 | 13.417 ± 4.621 | 12.833 ± 4.687 | p < 0.089 | ||
| Testing novelty preference |
Time in novel chamber (s) |
Time in center chamber (s) |
Time in novel chamber (s) |
Time in center chamber (s) |
|||
| 263.188 ± 60.124 | 98.126 ± 40.008 | p < 0.001 *** | 253.058 ± 68.641 | 109.288 ± 53.470 | p < 0.002 ** | ||
|
Time in familiar chamber (s) |
Time in center chamber (s) |
Time in familiar chamber (s) |
Time in center chamber (s) |
||||
| 238.687 ± 55.961 | 98.126 ± 40.008 | p < 0.001 *** | 237.654 ± 56.502 | 109.288 ± 53.470 | p < 0.001 *** | ||
|
Time in novel chamber (s) |
Time in familiar chamber (s) |
Time in novel chamber (s) |
Time in familiar chamber (s) |
||||
| 263.188 ± 60.124 | 238.687 ± 55.961 | p < 0.453 | 253.058 ± 68.641 | 237.654 ± 56.502 | p < 0.754 | ||
|
Sniffing novel animal’s cage (s) |
Sniffing familiar animal’s cage (s) |
Sniffing novel animal’s cage (s) |
Sniffing familiar animal’s cage (s) |
||||
| 129.261 ± 50.164 | 95.015 ± 51.306 | p < 0.109 | 109.373 ± 44.085 | 92.903 ± 62.090 | p < 0.530 | ||
|
Novel chamber entries (number) |
Familiar chamber entries (number) |
Novel chamber entries (number) |
Familiar chamber entries (number) |
||||
| 9.917 ± 3.450 | 10.250 ± 3.279 | p < 0.474 | 11.083 ± 3.679 | 11.167 ± 4.764 | p < 0.681 | ||
| Metabolite | Striatum (nM) | Cortex (nM) | Hippocampus (nM) | Cerebellum (nM) | Brainstem (nM) | ||||||||||
|---|---|---|---|---|---|---|---|---|---|---|---|---|---|---|---|
| Mean ± SD | p-value | Mean ± SD | p-value | Mean ± SD | p-value | Mean ± SD | p-value | Mean ± SD | p-value | ||||||
| WT | kat2-/- | WT | kat2-/- | WT | kat2-/- | WT | kat2-/- | WT | kat2-/- | ||||||
| Trp | 25511.111 ± 5688.243 | 21988.889 ± 1940.647 | p < 0.098 | 30780.000 ± 5921.674 | 24090.000 ± 2431.026 | p < 0.004 ** | 30433.333 ± 7230.664 | 25000.000 ± 2256.103 | p < 0.047 * | 29530.000 ± 6997.468 | 25410.000 ± 2154.814 | p < 0.092 | 29210.000 ± 8273.579 | 24730.000 ± 2685.786 | p < 0.121 |
| KYN | 146.444 ± 32.423 | 152.000 ± 45.031 | p < 0.768 | 123.880 ± 27.763 | 121.230 ± 40.829 | p < 0.867 | 126.822 ± 25.699 | 124.600 ± 38.033 | p < 0.886 | 204.000 ± 173.369 | 129.880 ± 56.356 | p < 0.215 | 132.130 ± 37.311 | 119.560 ± 41.100 | p < 0.483 |
| KYNA | 1.757 ± 0.623 | 3.561 ± 2.124 | p < 0.026 * | 5.428 ± 3.032 | 2.963 ± 1.108 | p < 0.027 * | 2.683 ± 0.885 | 1.787 ± 0.647 | p < 0.026 * | 5.347 ± 0.925 | 4.832 ± 1.728 | p < 0.417 | 4.315 ± 1.303 | 3.273 ± 0.974 | p < 0.058 |
| QAA | no data | no data | no data | 0.812 ± 0.298 | 0.714 ± 0.127 | p < 0.349 | 0.765 ± 0.216 | 0.807 ± 0.188 | p < 0.671 | 0.416 ± 0.210 | 0.249 ± 0.113 | p < 0.040 * | 0.469 ± 0.323 | 0.171 ± 0.102 | p < 0.012 * |
| AA | 2.534 ± 0.771 | 2.431 ± 1.145 | p < 0.825 | 0.320 ± 0.089 | 0.461 ± 0.176 | p < 0.036 * | 0.323 ± 0.136 | 0.213 ± 0.077 | p < 0.050 | 0.400 ± 0.148 | 0.296 ± 0.193 | p < 0.192 | 0.554 ± 0.209 | 0.477 ± 0.308 | p < 0.523 |
| 3-HK | 43.078 ± 7.418 | 78.644 ± 40.163 | p < 0.019 * | 50.230 ± 15.967 | 87.210 ± 42.381 | p < 0.019 * | 57.667 ± 15.585 | 104.467 ± 41.026 | p < 0.006 ** | 77.460 ± 30.378 | 118.100 ± 51.104 | p < 0.044 * | 47.070 ± 12.161 | 83.740 ± 35.505 | p < 0.006 ** |
| XA | 1.906 ± 1.161 | 1.342 ± 0.662 | p < 0.224 | 7.316 ± 5.644 | 2.516 ± 1.631 | p < 0.019 * | 1.698 ± 0.800 | 0.885 ± 0.406 | p < 0.015 * | 2.402 ± 0.838 | 1.349 ± 0.903 | p < 0.015 * | 3.945 ± 2.037 | 1.324 ± 0.854 | p < 0.001 *** |
| 3-HAA | no data | no data | no data | 6.581 ± 2.409 | 10.128 ± 3.732 | p < 0.021 * | 3.820 ± 1.574 | 3.994 ± 2.532 | p < 0.863 | no data | no data | no data | no data | no data | no data |
| QA | 20.337 ± 11.449 | 32.537 ± 15.421 | p < 0.075 | 35.650 ± 11.656 | 32.946 ± 20.266 | p < 0.719 | 18.296 ± 7.872 | 24.667 ± 11.260 | p < 0.183 | 27.057 ± 21.057 | 20.015 ± 12.182 | p < 0.372 | 28.390 ± 16.309 | 30.201 ± 13.870 | p < 0.792 |
| PA | 223.877 ± 45.544 | 233.296 ± 67.819 | p < 0.734 | 146.707 ± 43.541 | 171.643 ± 46.369 | p < 0.231 | 165.885 ± 81.710 | 146.251 ± 46.419 | p < 0.540 | 213.970 ± 57.567 | 291.345 ± 135.202 | p < 0.152 | 220.273 ± 63.283 | 246.122 ± 89.874 | p < 0.467 |
| Serotonin pathway | |||||||||||||||
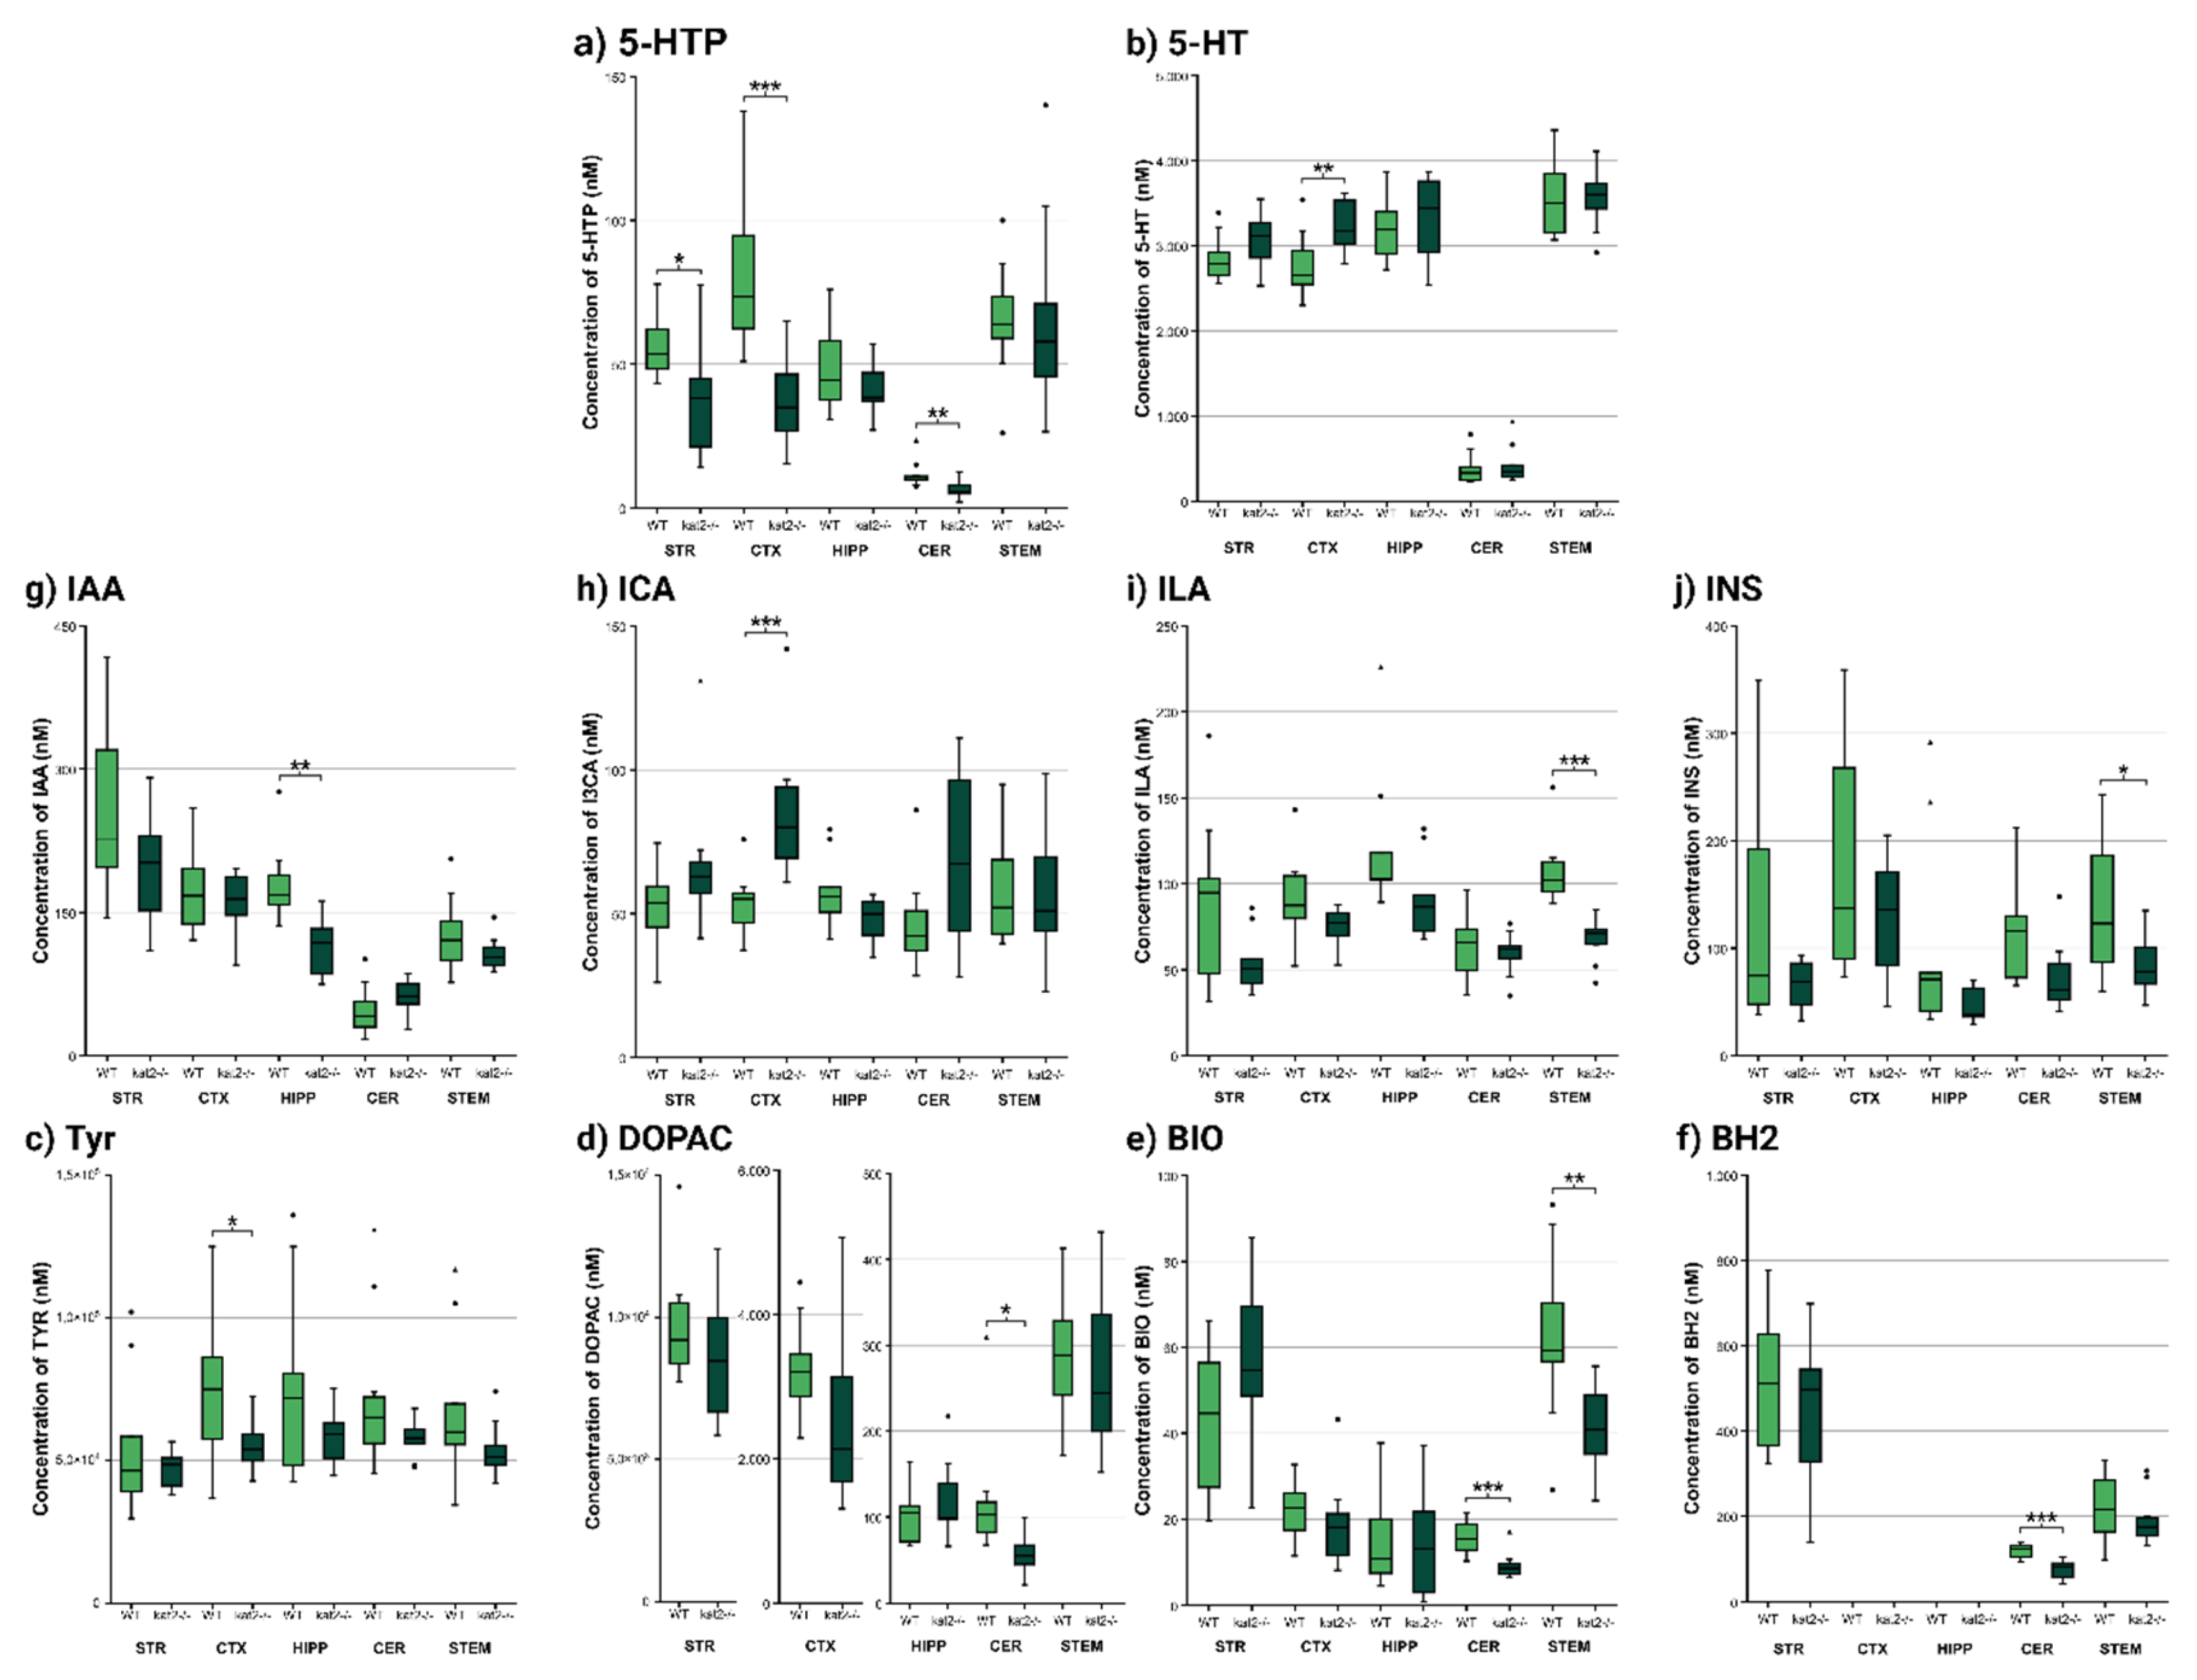
| 5-HTP | 55.689 ± 11.051 | 37.989 ± 20.492 | p < 0.037 * | 80.070 ± 26.609 | 37.490 ± 15.897 | p < 0.001 *** | 48.167 ± 15.514 | 42.011 ± 9.346 | p < 0.323 | 11.708 ± 4.638 | 6.451 ± 2.871 | p < 0.007 ** | 65.120 ± 19.882 | 65.200 ± 34.451 | p < 0.995 |
| 5-HT | 2854.444 ± 281.741 | 3087.778 ± 318.856 | p < 0.119 | 2780.000 ± 364.722 | 3238.000 ± 304.478 | p < 0.007 ** | 3162.222 ± 368.571 | 3316.667 ± 482.519 | p < 0.457 | 382.600 ± 182.449 | 423.500 ± 218.472 | p < 0.655 | 3542.000 ± 426.375 | 3554.000 ± 334.006 | p < 0.945 |
| 5-HIAA | 2771.111 ± 232.886 | 2825.556 ± 493.739 | p < 0.769 | 2816.000 ± 511.147 | 2634.000 ± 333.340 | p < 0.358 | 3984.444 ± 640.666 | 3618.889 ± 412.566 | p < 0.169 | 952.300 ± 165.692 | 954.100 ± 216.632 | p < 0.984 | 3998.000 ± 733.664 | 4076.000 ± 651.804 | p < 0.804 |
| Indole-pyruvate pathway | |||||||||||||||
| IAA | 263.000 ± 94.166 | 196.111 ± 59.711 | p < 0.091 | 174.300 ± 46.294 | 160.100 ± 32.385 | p < 0.437 | 179.000 ± 41.985 | 113.767 ± 30.709 | p < 0.002 ** | 47.260 ± 26.084 | 62.300 ± 18.091 | p < 0.151 | 126.790 ± 38.684 | 106.450 ± 17.163 | p < 0.146 |
| ICA | 52.522 ± 15.104 | 67.000 ± 25.999 | p < 0.168 | 53.590 ± 10.768 | 85.520 ± 23.399 | p < 0.001 *** | 58.078 ± 12.274 | 48.344 ± 7.459 | p < 0.059 | 46.850 ± 16.225 | 70.060 ± 31.928 | p < 0.055 | 57.430 ± 18.870 | 56.190 ± 21.972 | p < 0.894 |
| IPA | no data | no data | no data | no data | no data | no data | no data | no data | no data | 14.509 ± 7.547 | 12.995 ± 6.244 | p < 0.631 | 29.370 ± 14.081 | 19.479 ± 5.821 | p < 0.055 |
| ILA | 88.656 ± 49.392 | 54.078 ± 17.784 | p < 0.066 | 91.820 ± 24.495 | 74.690 ± 11.764 | p < 0.062 | 122.067 ± 43.164 | 91.444 ± 23.630 | p < 0.080 | 62.750 ± 18.591 | 59.500 ± 12.143 | p < 0.649 | 106.910 ± 19.352 | 68.030 ± 12.774 | p < 0.001 *** |
| INS | 136.444 ± 124.642 | 66.144 ± 22.154 | p < 0.115 | 181.320 ± 108.171 | 129.140 ± 54.474 | p < 0.190 | 102.700 ± 93.846 | 48.411 ± 15.970 | p < 0.106 | 114.680 ± 46.885 | 73.380 ± 32.000 | p < 0.034 * | 135.570 ± 66.490 | 86.080 ± 27.670 | p < 0.043 * |
| pCS | 22.863 ± 45.643 | 6.428 ± 3.057 | p < 0.297 | 13.201 ± 15.641 | 6.452 ± 6.191 | p < 0.221 | 11.421 ± 14.434 | 2.932 ± 1.870 | p < 0.099 | 28.415 ± 45.171 | 4.284 ± 2.878 | p < 0.109 | 5.987 ± 5.293 | 4.280 ± 4.371 | p < 0.442 |
| Tyrosine-dopamine pathway | |||||||||||||||
| Tyr | 55533.333 ± 25146.620 | 47200.000 ± 66.11.354 | p < 0.351 | 74760.000 ± 27036.856 | 55710.000 ± 9047.216 | p < 0.049 * | 76522.222 ± 33835.513 | 57944.444 ± 10032.337 | p < 0.134 | 72320.000 ± 27354.983 | 57480.000 ± 6273.542 | p < 0.112 | 67800.000 ± 25030.026 | 53600.000 ± 9267.026 | p < 0.110 |
| L-DOPA | no data | no data | no data | 130.840 ± 71.182 | 119.180 ± 91.862 | p < 0.755 | 147.389 ± 60.587 | 122.400 ± 31.455 | p < 0.288 | 97.580 ± 16.040 | 103.530 ± 54.909 | p < 0.746 | 144.090 ± 139.318 | 118.740 ± 19.909 | p < 0.576 |
| 3OMD | 43.067 ± 11.017 | 48.467 ± 22.082 | p < 0.521 | 42.010 ± 7.379 | 46.620 ± 10.305 | p < 0.265 | 42.867 ± 13.189 | 41.678 ± 9.240 | p < 0.828 | 44.220 ± 8.036 | 38.350 ± 6.488 | p < 0.089 | 36.990 ± 11.834 | 35.540 ± 8.342 | p < 0.755 |
| DA | 238805.321 ± 62124.925 | 226596.946 ± 85742.994 | p < 0.734 | 11460.000 ± 4415.938 | 9733.000 ± 1997.838 | p < 0.265 | 327.778 ± 184.660 | 301.556 ± 119.914 | p < 0.726 | 126.260 ± 129.803 | 90.500 ± 32.822 | p < 0.409 | 373.800 ± 137.416 | 320.700 ± 78.006 | p < 0.302 |
| 3-MT | 12277.778 ± 3429.001 | 15417.778 ± 7109.386 | p < 0.250 | 2637.000 ± 1213.370 | 3510.000 ± 2184.272 | p < 0.284 | 72.811 ± 27.012 | 76.333 ± 42.626 | p < 0.837 | 48.360 ± 51.290 | 39.780 ± 27.131 | p < 0.646 | 108.990 ± 55.943 | 100.420 ± 45.985 | p < 0.713 |
| DOPAC | 9731.111 ± 2098.681 | 8508.889 ± 2173.571 | p < 0.243 | 3231.000 ± 662.528 | 2604.000 ± 1298.026 | p < 0.190 | 99.844 ± 31.080 | 119.122 ± 46.575 | p < 0.317 | 118.510 ± 70.272 | 58.230 ± 22.991 | p < 0.019 * | 286.600 ± 83.187 | 269.700 ± 90.096 | p < 0.668 |
| HVA | 8845.556 ± 1621.983 | 9957.778 ± 2933.235 | p < 0.334 | 3219.000 ± 465.271 | 2994.000 ± 815.383 | p < 0.458 | 563.667 ± 249.747 | 622.000 ± 272.426 | p < 0.642 | 241.000 ± 72.399 | 235.410 ± 110.270 | p < 0.895 | 512.900 ± 142.529 | 479.100 ± 199.441 | p < 0.668 |
| VMA | no data | no data | no data | 6.815 ± 4.531 | 9.876 ± 7.149 | p < 0.268 | 4.113 ± 2.537 | 7.131 ± 3.580 | p < 0.056 | 23.772 ± 34.420 | 34.862 ± 38.254 | p < 0.504 | 7.121 ± 4.828 | 8.801 ± 6.926 | p < 0.537 |
| MHPGS | 31.467 ± 15.193 | 33.022 ± 10.663 | p < 0.805 | 42.420 ± 20.320 | 47.070 ± 7.532 | p < 0.506 | 49.722 ± 16.118 | 46.011 ± 9.992 | p < 0.565 | 23.668 ± 27.307 | 17.066 ± 6.494 | p < 0.467 | 21.700 ± 9.295 | 22.040 ± 5.288 | p < 0.921 |
| BIO | 43.611 ± 16.815 | 55.533 ± 18.984 | p < 0.178 | 22.410 ± 7.193 | 18.823 ± 10.159 | p < 0.374 | 15.201 ± 11.095 | 14.789 ± 12.229 | p < 0.941 | 15.690 ± 3.897 | 9.233 ± 3.056 | p < 0.001 *** | 62.380 ± 19.428 | 41.020 ± 9.643 | p < 0.006 ** |
| BH2 | 514.956 ± 164.623 | 441.378 ± 173.194 | p < 0.369 | no data | no data | no data | no data | no data | no data | 117.947 ± 16.544 | 76.528 ± 22.014 | p < 0.001 *** | 222.409 ± 82.207 | 192.147 ± 59.659 | p < 0.359 |
| Metabolite | Plasm (nM) | Urine (nM) | ||||
|---|---|---|---|---|---|---|
| Mean ± SD | p-value | Mean ± SD | p-value | |||
| WT | kat2-/- | WT | kat2-/- | |||
| Indole-pyruvate pathway | ||||||
| ICA | no data | no data | no data | no data | no data | no data |
| IPA | no data | no data | no data | no data | no data | no data |
| ILA | no data | no data | no data | no data | no data | no data |
| pCS | 853.520 ± 961.663 | 1097.193 ± 1196.572 | p < 0.622 | 9683.873 ± 15558.939 | 7429.639 ± 12598.662 | p < 0.726 |
| Tyrosine-dopamine pathway | ||||||
| Tyr | 50824.432 ± 20811.617 | 35775.857 ±16975.863 |
p < 0.093 | 9411.420 ± 2214.266 | 8789.288 ± 1547.575 | p < 0.476 |
| L-DOPA | 36.800 ± 15.606 | 35.109 ± 13.708 | p < 0.800 | no data | no data | no data |
| 3OMD | 36.340 ± 5.556 | 31.128 ± 5.595 | p < 0.051 | 41.828 ± 21.255 | 40.299 ± 17.829 | p < 0.864 |
| DA | no data | no data | no data | 671.105 ± 320.951 | 779.887 ± 193.877 | p < 0.371 |
| 3-MT | 2.653 ± 1.315 | 1.796 ± 0.655 | p < 0.082 | 241.517 ± 93.336 | 235.939 ± 50.578 | p < 0.870 |
| DOPAC | no data | no data | no data | 370.196 ± 224.797 | 301.471 ± 108.291 | p < 0.395 |
| HVA | no data | no data | no data | 1120.520 ± 890.606 | 731.657 ± 173.621 | p < 0.192 |
| VMA | no data | no data | no data | 820.064 ± 567.571 | 760.459 ± 124.132 | p < 0.749 |
| MHPGS | 27.657 ± 12.496 | 15.392 ± 6.886 | p < 0.014 * | 8533.153 ± 3929.104 | 14639.178 ± 3364.617 | p < 0.002 ** |
| BIO | 68.419 ± 23.013 | 82.535 ± 17.725 | p < 0.142 | 231.328 ± 80.142 | 221.133 ± 88.018 | p < 0.790 |
| BH2 | 588.898 ± 122.352 | 577.701 ± 178.965 | p < 0.872 | 4508.851 ± 2655.882 | 4488.304 ± 2298.353 | p < 0.985 |
| Enzyme | Product/Substrate | Striatum | Cortex | Hippocampus | Cerebellum | Brainstem | ||||||||||
|---|---|---|---|---|---|---|---|---|---|---|---|---|---|---|---|---|
| Mean ± SD | p-value | Mean ± SD | p-value | Mean ± SD | p-value | Mean ± SD | p-value | Mean ± SD | p-value | |||||||
| WT | kat2-/- | WT | kat2-/- | WT | kat2-/- | WT | kat2-/- | WT | kat2-/- | |||||||
| TDO/IDOs | KYN/Trp | 0.006 ± 0.001 | 0.007 ± 0.002 | p < 0.188 | 0,004 ± 0,001 | 0.005 ± 0.001 | p < 0.212 | 0.004 ± 0.001 | 0.005 ± 0.001 | p < 0.245 | 0.006 ± 0.004 | 0.005 ± 0.002 | p < 0.349 | 0.005 ± 0.001 | 0.005 ± 0.002 | P < 0.907 |
| KATs | KYNA/KYN | 0.012 ± 0.005 | 0.026 ± 0.017 | p < 0.035 * | 0.045 ± 0.027 | 0.026 ± 0.012 | p < 0.063 | 0.022 ± 0.010 | 0.015 ± 0.007 | p < 0.099 | 0.036 ± 0.015 | 0.041 ± 0.019 | p < 0.487 | 0.034 ± 0.011 | 0.032 ± 0.017 | P < 0.696 |
| KMO | 3-HK/KYN | 0.305 ± 0.075 | 0.510 ± 0.216 | p < 0.002 ** | 0.413 ± 0.131 | 0.714 ± 0.262 | p < 0.001 ** | 0.463 ± 0.121 | 0.844 ± 0.264 | p < 0.001 *** | 0.458 ± 0.139 | 0.957 ± 0.365 | p < 0.001 *** | 0.365 ± 0.087 | 0.709 ± 0.230 | P < 0.001 *** |
| KYNU | AA/KYN | 0.018 ± 0.006 | 0.018 ± 0.009 | p < 0.951 | 0.003 ± 0.001 | 0.004 ± 0.003 | p < 0.208 | 0.003 ± 0.001 | 0.002 ± 0.001 | p < 0.301 | 0.003 ± 0.001 | 0.003 ± 0.002 | p < 0.913 | 0.004 ± 0.002 | 0.005 ± 0.004 | P < 0.651 |
| KYNU | 3-HAA/3-HK | no data | no data | no data | 0.135 ± 0.040 | 0.125 ± 0.034 | p < 0.540 | 0.072 ± 0.036 | 0.038 ± 0.020 | p < 0.026 * | no data | no data | no data | no data | no data | no data |
| KAT III | XA/3-HK | 0.045 ± 0.027 | 0.022 ± 0.018 | p < 0.052 | 0.151 ± 0.106 | 0.035 ± 0.027 | p < 0.001 ** | 0.031 ± 0.017 | 0.011 ± 0.009 | p < 0.007 ** | 0.034 ± 0.015 | 0.014 ± 0.015 | p < 0.001 ** | 0.088 ± 0.054 | 0.020 ± 0.017 | P < 0.001 *** |
| 3-HAO | QA/3-HAA | no data | no data | no data | 5.910 ± 2.878 | 3.693 ± 2.022 | p < 0.112 | 6.125 ± 4.070 | 10.220 ± 9.885 | p < 0.508 | no data | no data | no data | no data | no data | no data |
| 3-HAO + ACMSD | PA/3-HAA | no data | no data | no data | 23.688 ± 7.982 | 20.024 ± 13.316 | p < 0.082 | 66.477 ± 82.924 | 51.852 ± 33.947 | p < 0.895 | no data | no data | no data | no data | no data | no data |
| TPHs | 5-HTP/Trp | 0.002 ± 0.000 | 0.002 ± 0.001 | p < 0.313 | 0.003 ± 0.001 | 0.002 ± 0.001 | p < 0.005 ** | 0.002 ± 0.000 | 0.002 ± 0.000 | p < 0.331 | 0.000 ± 0.000 | 0.000 ± 0.000 | p < 0.003 ** | 0.002 ± 0.001 | 0.003 ± 0.001 | P < 1.000 |
| AADC | 5-HT/5-HTP | 53.246 ± 12.810 | 110.941 ± 73.047 | p < 0.015 * | 37.833 ± 12.360 | 102.426 ± 43.532 | p < 0.001 ** | 72.470 ± 26.437 | 82.603 ± 22.339 | p < 0.393 | 34.597 ± 17.138 | 74.676 ± 41.567 | p < 0.004 ** | 63.557 ± 38.662 | 68.894 ± 37.313 | P < 0.496 |
| MAOs + ALDH | 5-HIAA/5-HT | 0.982 ± 0.148 | 0.922 ± 0.180 | p < 0.453 | 1.036 ± 0.280 | 0.822 ± 0.141 | p < 0.044 * | 1.290 ± 0.327 | 1.126 ± 0.285 | p < 0.274 | 2.905 ± 1.239 | 2.539 ± 0.796 | p < 0.442 | 1.150 ± 0.271 | 1.160 ± 0.232 | P < 0.926 |
| TMO (TrD, ArAT) | IAA/Trp | 0.010 ± 0.003 | 0.009 ± 0.002 | p < 0.212 | 0.006 ± 0.002 | 0.007 ± 0.001 | p < 0.054 | 0.006 ± 0.001 | 0.005 ± 0.001 | p < 0.021 * | 0.002 ± 0.001 | 0.002 ± 0.001 | p < 0.026 * | 0.004 ± 0.001 | 0.004 ± 0.001 | P < 0.597 |
| TNA | INS/Trp | 0.005 ± 0.003 | 0.003 ± 0.001 | p < 0.554 | 0.006 ± 0.003 | 0.005 ± 0.002 | p < 0.624 | 0.003 ± 0.002 | 0.002 ± 0.001 | p < 0.161 | 0.004 ± 0.002 | 0.003 ± 0.001 | p < 0.170 | 0.005 ± 0.003 | 0.003 ± 0.001 | P < 0.147 |
| Oxidant/antioxidant metabolites | Striatum | Cortex | Hippocampus | Cerebellum | Brainstem | ||||||||||
| Mean ± SD | p-value | Mean ± SD | p-value | Mean ± SD | p-value | Mean ± SD | p-value | Mean ± SD | p-value | ||||||
| WT | kat2-/- | WT | kat2-/- | WT | kat2-/- | WT | kat2-/- | WT | kat2-/- | ||||||
| 3-HK/(KYNA+AA+XA) | 6.951 ± 2.904 | 10.723 ± 10.215 | p < 0.627 | 4.700 ± 2.112 | 17.670 ± 13.315 | p < 0.001 ** | 13.509 ± 6.992 | 37.148 ± 15.859 | p < 0.002 ** | 9.667 ± 3.839 | 20.311 ± 9.275 | p < 0.006 ** | 5.740 ± 1.892 | 18.705 ± 9.300 | p < 0.002 ** |
| NMDA agonist/antagonist metabolites | Striatum | Cortex | Hippocampus | Cerebellum | Brainstem | ||||||||||
| Mean ± SD | p-value | Mean ± SD | p-value | Mean ± SD | p-value | Mean ± SD | p-value | Mean ± SD | p-value | ||||||
| WT | kat2-/- | WT | kat2-/- | WT | kat2-/- | WT | kat2-/- | WT | kat2-/- | ||||||
| QA/KYNA | 11.575 ± 18.379 | 9.138 ± 7.260 | p < 0.923 | 9.263 ± 7.574 | 14.235 ± 14.254 | p < 0.597 | 7.957 ± 5.478 | 16.120 ± 9.907 | p < 0.046 * | 5.306 ± 4.601 | 4.998 ± 4.789 | p < 0.880 | 7.724 ± 7.414 | 10.224 ± 5.544 | p < 0.096 |
Disclaimer/Publisher’s Note: The statements, opinions and data contained in all publications are solely those of the individual author(s) and contributor(s) and not of MDPI and/or the editor(s). MDPI and/or the editor(s) disclaim responsibility for any injury to people or property resulting from any ideas, methods, instructions or products referred to in the content. |
© 2025 by the authors. Licensee MDPI, Basel, Switzerland. This article is an open access article distributed under the terms and conditions of the Creative Commons Attribution (CC BY) license (http://creativecommons.org/licenses/by/4.0/).


