Submitted:
07 October 2025
Posted:
08 October 2025
You are already at the latest version
Abstract
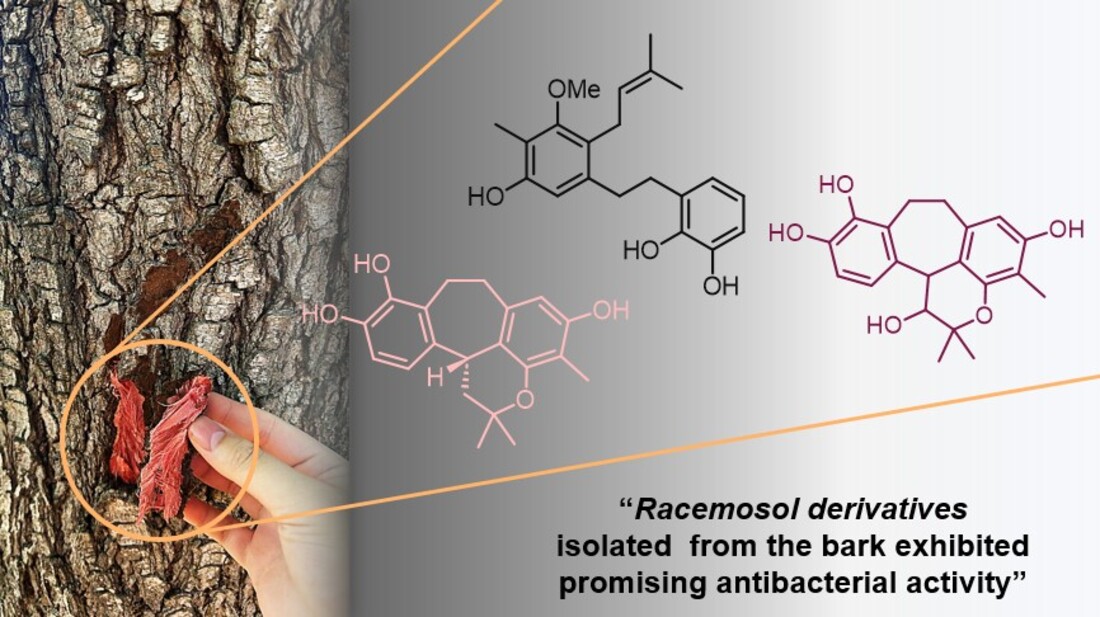
Racemosol, a natural phenolic compound, is known for its antimicrobial potential, yet experimental studies remain limited. In this study, two new racemosol derivatives (4–5) and four known compounds (1–3, 6) were isolated from the bark of Bauhinia malabarica and structurally elucidated using spectroscopic analyses. Most of isolated compounds exhibited notable activity against Gram-positive bacteria, including Staphylococcus aureus, Bacillus subtilis, and Listeria monocytogenes, while showing limited effects on Gram-negative strains. Racemosol (1) and its derivatives (2, 4, and 6) displayed potent antibacterial activity with MIC values of 0.156–0.625 µg/µL and bactericidal properties confirmed by comparable MBCs. Compound 6 exhibited the highest potency, indicating that specific structural modifications enhance activity. These findings provide new insights into the structure activity relationships of racemosol derivatives and highlight B. malabarica as a promising natural source of phenolic antibacterial agents.
Keywords:
Bauhinia malabarica
; racemosol derivatives
; phenolic compounds
; antimicrobial activity
; Gram-positive bacteria
1. Introduction
Bauhinia is a large genus within the family Fabaceae–Caesalpinioideae–comprising nearly 300 species of trees, shrubs, and climbers. Members of this genus are distributed mainly in tropical regions, including Africa, Asia, and South America [1]. Bauhinia malabarica is a tropical tree widely distributed throughout Thailand. The young leaves and flowers are edible, with the leaves having a sour taste and traditionally employed in folk medicine for wound healing, as a diuretic, and for the treatment of dysentery and menstrual disorders [1,2,3]. Phytochemical studies have revealed the presence of seven flavonol derivatives in the leaves [2]. Investigations of the roots have led to the identification of racemosol and demethylracemosol, along with their putative biogenetic precursors, preracemosol A and preracemosol B [3,4]. These metabolites have demonstrated notable biological properties, including cytotoxic, antimalarial, and anti-inflammatory activities through inhibition of COX-1 and COX-2.
Racemosol– a natural phenolic compound–has been reported to possess notable antimicrobial potential against a broad spectrum of pathogenic microorganisms. To date, the majority of investigations on racemosol have relied predominantly on computational and in silico approaches, particularly in the context of its predicted inhibitory activity against bacteria such as Mycobacterium tuberculosis [5]. Experimental studies remain comparatively scarce, with only one report documenting the isolation of racemosol from B. racemosa, where it demonstrated activity against Staphylococcus aureus and certain Aspergillus spp. such as A. flavus, A. fumigatus and A. niger [6]. Despite the ethnomedicinal importance of the Bauhinia genus, which is widely recognized for its diverse secondary metabolites, the clinical relevance of its constituents against pathogenic microorganisms has not been comprehensively established. To address this gap, and as part of our ongoing investigations into bioactive secondary metabolites from natural sources [7,8,9], we isolated two new racemosol derivatives (4–5), along with four known compounds (1–3, 6) (Figure 1). The present study describes in detail the isolation and structural elucidation of these compounds and evaluates their antimicrobial efficacy against a broad panel of pathogenic bacteria, thereby providing novel insights into the antimicrobial potential of racemosol derivatives from B. malabarica.
2. Results and Discussion
Phytochemical investigation of the bark of B. malabarica by successive chromatographic separation resulted in the isolation of four known compounds, demethylracemosol (1), racemosol (2) [3], 3-hydroxy-de-O-methyl racemosol (3) [10], and preracemosol A (6) [3], together with two previously undescribed racemosol derivatives (4 and 5). To the best of our knowledge, only the relative configuration at the C-12b position of compounds 1 and 2 has previously been determined by single-crystal X-ray diffraction analysis [11]. Therefore, we sought to establish the absolute configuration of this stereogenic center. To address this issue, electronic circular dichroism (ECD) calculations were employed.
The spectral data of demethylracemosol (1) and racemosol (2) were in complete agreement with those previously reported [11,12]. Compound 1 exhibited optical activity, with [α]D20 = +16 (c 0.10, MeOH). The ECD spectra of the two possible enantiomers were then calculated and compared with the experimental spectrum (Figure 2A). The calculated spectrum for the R absolute configuration at C-12b showed good agreement with the experimental data, accordingly, the absolute configuration of 1 was assigned as illustrated in Figure 1. Based on these results, the absolute configuration of racemosol (2) was also assigned as R, consistent with its observed optical rotation, [α]D20 = +20 (c 0.10, MeOH), which has the same sign as that of 1.
3-Hydroxy-8-O-methylracemosol (4) was obtained as a whitish amorphous solid. HRESIMS showed a molecular ion at m/z 355.1549 [M–H]– (calcd. for C21H23O5–, 355.1551), consistent with the molecular formula C21H24O5. The 1H NMR spectrum of 4 (Table 1) displayed a pattern characteristic of the racemosol skeleton, a relatively rare natural product class found in this plant. Two aromatic doublets at δH 6.90 (d, J = 8.6 Hz, H-6) and 6.72 (d, J = 8.6 Hz, H-7), together with a singlet at δH 6.11 (s, H-14), indicate three aromatic protons. The presence of a pyran ring is supported by two oxygenated methine resonances at δH 4.33 (overlapping, H-3 and H-4) and two methyl singlets at δH 1.55 (s, Me-5′) and 1.23 (s, Me-6′). Two methylene groups were observed at δH 3.37 (m, H-11a), 3.04 (m, H-11b), 3.12 (m, H-12a) and 2.76 (m, H-12b). Additional methyl resonances were detected at δH 1.97 (s, Me-16) and 3.80 (s, 8-OMe). Three exchangeable protons assigned to hydroxyl groups were observed at δH 4.09 (d, J = 4.8 Hz, 3-OH), 7.30 (s, 9-OH) and 7.78 (s, 15-OH). The 13C NMR data (Table 1) further supported the proposed racemosol-type skeleton, with the only difference being the presence of a methoxy substituent. Indeed, based on this evidence, this compound has not been previously reported.
2D NMR, including 1H–1H COSY and HMBC data, confirmed the planar structure (Figure 3). The COSY spectrum revealed three spin systems: H-3/H-4, H-6/H-7, and H-11/H-12. The HMBC correlations (Figure 3) provided crucial evidence for assigning the position of the methoxy group. The protons H-6, H-7, H-11, and H-12 showed correlations to δC 146.5 (C-8), which was also correlated with δH 3.80 (s), corresponding to the methoxy group. Therefore, the methoxy substituent was assigned to C-8 rather than C-9. Other HMBC correlations not mentioned in the text can be seen in Figure 3, which further support this structural assignment.
Since the signals of H-3 and H-4 were overlapped, the NOESY spectrum did not provide sufficient information to determine the relative configuration of the pyran ring. To resolve this issue, the relative configuration of compound 4 was investigated using the DP4+ probability method [13]. The calculated 13C NMR chemical shifts of two possible diastereoisomers, 4a (cis) and 4b (trans) (Figure S14), were compared with the experimental data. The DP4+ statistical analysis clearly indicated that compound 4 corresponded to 4a with 99.59% probability. The absolute configuration of 4 was subsequently determined by ECD. Theoretical ECD spectra for the two enantiomers of 4a were simulated and compared with the experimental ECD spectrum (Figure 2B). The computed spectrum for the 3R, 4R absolute configuration showed excellent agreement with the experimental results, thereby confirming the stereochemistry. Consequently, the structure of compound 4 was established as shown in Figure 1.
3-Hydroxy-9-O-methylracemosol (5) was obtained as a whitish amorphous solid, had the same molecular formula C21H24O5 as compound 1 obtained by the HRESIMS data. The 1H and 13C NMR data of compound 5 (Table 1) were generally similar to those of compound 4. However, the presence of a distinct hydroxyl proton signal in the 1H NMR spectrum suggested a difference in the position of the methoxy substituent within the same skeleton. The HMBC correlations (Figure 3) provided crucial evidence for determining the position of the methoxy substituent, particularly through the correlations of the aromatic protons. Among them, only proton H-7 (δH 7.04) exhibited a correlation with δC 145.4 (C-9), which also showed a correlation with δH 3.78, corresponding to the methoxy group. In addition, protons H-11 (δH 3.25 and 3.15) and H-12 (δH 3.17 and 2.80) displayed correlations to C-9 that further supported this substitution pattern.
The absolute configuration of compound 5 was determined by comparison with that of compound 4, which exhibited an optical rotation of the same sign and a comparable magnitude. Compound 5 showed [α]D20 = +37.3 (c 0.10, MeOH), whereas compound 4 showed [α]D20 = +35.0 (c 0.10, MeOH). Based on this similarity, the absolute configuration of 5 was assigned as 3R, 4R, identical to that of 4. Likewise, compound 3, whose absolute configuration had not been previously reported, exhibited [α]D20 = +43.0 (c 0.10, MeOH) and was also concluded to share the same absolute configuration. Therefore, the absolute configurations of compounds 3–5 were assigned accordingly.
The antimicrobial potential of all isolated compounds (1–6) was evaluated against a full panel of clinically pathogenic Gram-positive and Gram-negative bacteria using the overlay-spot and broth microdilution methods (Table 2 and Table 3).
In the preliminary overlay-spot assay, all compounds demonstrated evident inhibitory activity against Gram-positive species, whereas their effects on Gram-negative organisms were comparatively weaker with an exception of a compound 5. Among the tested isolates, Bacillus subtilis, Staphylococcus aureus, Listeria monocytogenes, Streptococcus pyogenes, and Enterococcus faecalis exhibited potential in inhibiting bacterial growth following exposure to compounds 1–4, and 6. In contrast, compound 5 consistently showed no detectable activity across all bacterial strains, suggesting structural specificity among the analogues.
Activity against Gram-negative bacteria was limited, though compounds 1, 4, and 6 produced small inhibition against A. baumannii, E. coli (both ATCC25922 and O157:H7), K. pneumoniae, and S. Typhi. Notably, only 4 and 6 demonstrated measurable activity against Pseudomonas aeruginosa and Shigella enteritidis, and these organisms are well known for hospitalized-acquired resistance. These findings highlight the preferential antibacterial spectrum of racemosol and its derivatives toward Gram-positive species. A pattern consistent with other phenolic compounds whose lipophilic character facilitates permeation through the peptidoglycan-rich cell wall of Gram-positive bacteria but is hindered by the outer membrane of Gram-negative bacteria [14,15,16].
Racemosol (1) and its active derivatives (2, 4, and 6) displayed potent activity, with MIC values ranging from 0.156–0.625 µg/µL against S. aureus ATCC 25923, B. subtilis, and L. monocytogenes. The corresponding MBCs were generally identical or within a four-fold range of the MICs, indicating a predominantly bactericidal mode of action. Compound 6, in particular, exhibited the lowest MIC/MBC values (0.156 µg/µL) against several Gram-positive strains, suggesting their structural modifications in this derivative enhance antimicrobial property [17]. Conversely, Gram-negative isolates showed markedly higher MICs (2.5–5 µg/µL) or were non-responsive (MIC > 5 µg/µL). Moderate susceptibility was observed for A. baumannii (ATCC 19606) and E. coli O157:H7, while P. aeruginosa and S. enteritidis remained largely resistant. The standard antibiotics ampicillin and gentamicin displayed lower MICs in the microgram, as expected, serving as validation controls for assay performance.
3. Materials and Methods
3.1. General Experimental Procedure
Optical rotations were measured using a JASCO DIP-1000 digital polarimeter (JASCO Inc., Tokyo, Japan). UV and ECD spectra were recorded on a JASCO J-810 spectropolarimeter. IR spectra were obtained using a Bruker Tensor 27. NMR spectra were recorded on a Bruker Avance 400 spectrometer equipped with a cryoprobe (Bruker, Karlsruhe, Germany), using CDCl3, or acetone-d6 as solvents. Residual solvent signals were used as internal references. High-resolution electrospray ionization mass spectrometry (HR-ESI-TOF-MS) data were acquired with a Bruker micrOTOF mass spectrometer (Bruker, Karlsruhe, Germany). Column chromatography was performed on Merck silica gel 60 (230–400 mesh) (Merck, Darmstadt, Germany). Thin-layer chromatography (TLC) was carried out on pre-coated Merck silica gel 60 F254 plates (Merck, Darmstadt, Germany). Spots were visualized under UV light (254 and 365 nm) and further detected by spraying with p-anisaldehyde reagent followed by heating until charring.
3.2. Plant Material
The bark of B. malabarica Roxb. was collected from Chum Phae District, Khon Kaen Province, in January 2025. The plant was identified by comparison with an authentic sample, and a voucher specimen (No. AVS-NPR004) has been deposited in the Natural Products Laboratory, Faculty of Applied Science, King Mongkut’s University of Technology North Bangkok, for future reference.
3.3. Extraction and Isolation
The MeOH extract (30.0 g) was fractionated by silica gel column chromatography (CC) using a gradient elution of EtOAc in n-hexane and EtOAc in MeOH, gradually increasing to 100% MeOH, to afford five fractions, designated BmbA–BmbE. Fraction BmbB was further subjected to CC with an eluent system of 100% CH2Cl2, gradually increasing to 1:1 (v/v) EtOAc/ CH2Cl2, yielding six subfractions (BmbB1–BmbB6). Compound 2 (20.0 mg) was isolated from subfraction BmbB4 as a pale-yellow solid by Sephadex LH-20 CC using 100% MeOH as the mobile phase. Further purification of subfraction BmbB6 by CC with acetone/n-hexane (2:8, v/v) afforded compounds 1 (120.0 mg) and 6 (32.0 mg), both obtained as pale-yellow solids. Fraction BmbD was subjected to CC with an eluent system of 100% CH2Cl2, gradually increasing to 1:1 (v/v) EtOAc/ CH2Cl2, affording three subfractions (BmbD1–BmbD3). Subfraction BmbD1 was purified by CC with an isocratic eluent system of acetone/n-hexane (3:7, v/v) to afford compound 5 (10.0 mg) as a pale-yellow solid. Finally, compounds 3 (30.2 mg) and 4 (15.0 mg) were isolated from subfraction BmbD3 as pale-yellow solids via CC with an isocratic eluent system of MeOH/CH2Cl2 (3:7, v/v).
3-Hydroxy-8-O-methylracemosol (4), whitish amorphous solid;
[α]20D +35.0 (c 0.1, MeOH); 1H and 13C NMR data, see Table 1; HRESIMS m/z 355.1549 [M – H]– (calcd for 355.1551, C21H23O5–).
3-Hydroxy-9-O-methylracemosol (5), whitish amorphous solid;
[α]20D +37.3 (c 0.1, MeOH); 1H and 13C NMR data, see Table 1; HRESIMS m/z 355.1566 [M – H]– (calcd for 355.1551, C21H23O5–).
3.4. ECD Calculations
All quantum chemical calculations were carried out using the GAUSSIAN 09 software package [18]. Conformational searches were initially performed with the Monte Carlo algorithm employing molecular mechanics force fields implemented in HyperChem Professional 8.0.7 (Hypercube, Inc.). The resulting low-energy conformers were subsequently optimized using density functional theory (DFT) at the B3LYP/6-31 + G(d,p) level. Electronic circular dichroism (ECD) spectra were simulated with time-dependent DFT (TD-DFT) calculations at the B3LYP/6-31G(d,p) level using the polarizable continuum model (PCM, σ = 0.50). The theoretical ECD curves were generated using SpecDis 1.64 (University of Würzburg, Germany). For the DP4+ NMR analysis, isotropic magnetic shielding tensors were computed using the gauge-independent atomic orbital (GIAO) method at the mPW1PW91/6-311 + G(d,p) level with the CPCM solvent model. The 13C NMR chemical shifts (δXcalc) were derived from the Boltzmann-averaged shielding tensors according to the equation:
δXcalc = σ° − σ_X
The resulting chemical shift data were used to perform the DP4+ probability analysis using the Excel-based DP4+ calculator developed by Grimblat et al. (2015).
3.5. Antimicrobial Properties
3.5.1. Determination of Antimicrobial Activity
All bacterial strains utilized in this work were obtained from the Department of Microbiology, School of Medicine, Walailak University, Thailand. The extracts were evaluated against a panel of Gram-positive bacteria, including Bacillus subtilis 7988 (clinical isolate), Bacillus subtilis ATCC6051, Enterococcus faecalis 4232 (Clinical isolates), Listeria monocytogenes (clinical isolate), Staphylococcus aureus ATCC25923, Staphylococcus aureus ATCC29213, methicillin-resistant Staphylococcus aureus (MRSA, clinical isolate), Staphylococcus epidermidis ATCC35984, and Streptococcus pyogenes ATCC19615. The Gram-negative organisms used for antimicrobial screening comprised Acinetobacter baumannii ATCC19606, Acinetobacter baumannii (MDR strain), Escherichia coli ATCC25922, Escherichia coli O157:H7, Klebsiella pneumoniae ATCC70063, Pseudomonas aeruginosa ATCC27853, Salmonella enterica serovar Typhi (clinical isolate), and Shigella enteritidis (clinical isolate).
All Gram-positive and Gram-negative strains were maintained at 4 °C on nutrient agar or Luria-Bertani (LB) agar (Gibco; Thermo Fisher Scientific, Inc.), respectively. Overnight cultures were prepared in Mueller–Hinton (MH) broth (Gibco; Thermo Fisher Scientific, Inc.) at 37 °C, and subsequently adjusted to approximately 8 × 10⁸ CFU/ml for use in antimicrobial testing. Ampicillin served as the reference antibiotics for Gram-positive bacteria, while gentamicin was used as a standard control for both Gram- negative strains.
3.5.2. Overlay Spot Assay for Antimicrobial Screening
Antimicrobial screening was performed following a modified protocol of Sirisarn et al. (2024) [19]. Briefly, bacterial cultures grown overnight in MH broth at 37 °C were diluted to 107 CFU/ml and spread onto MH agar plates in three directions to achieve uniform lawns. Racemosol and its derivatives were prepared at 10 mg/ml in DMSO and sterilized with a 0.22 μm PTFE filter. Subsequently, 10 μl of each sample was spotted onto the inoculated plates, which were incubated at 37 °C in a 5% CO2 atmosphere overnight. The presence of clear inhibition zones on the bacterial lawn was recorded as an indication for antimicrobial activity.
3.5.3. Microdilution Method for MIC and MBC
The broth microdilution procedure for determining minimum inhibitory concentration (MIC) and minimum bactericidal concentration (MBC) was adapted from Sirisarn et al. (2024) [19]. For MIC determination, 100 μl of MH broth was dispensed into each well of a sterile 96-well microplate. Samples were initially diluted to 10 mg/ml in MH broth and subjected to two-fold serial dilutions across the wells, producing concentrations ranging from 5 mg/ml down to 0.00976 mg/ml. To each well, 100 μl of bacterial suspension (106 CFU/ml) was added. As a growth control, 1% DMSO in MH broth was included in parallel. Plates were incubated at 37 °C under 5% CO2, and the MIC was defined as the lowest compound concentration that produced complete inhibition, evident by visual clarity of the well contents.
To establish the MBC, 10 μl aliquots from wells at and above the MIC were inoculated onto MH agar plates and incubated at 37 °C in 5% CO2. The MBC was defined as the lowest concentration of compound that resulted in the absence of visible bacterial colonies.
4. Conclusions
In summary, we isolated four known compounds (1–3, and 6) and two new racemosol derivatives (4 and 5) from the bark of B. malabarica. The structures of the new compounds were elucidated through extensive spectroscopic analysis, and their absolute configurations were established by comparing experimental and calculated ECD curves. Furthermore, GIAO NMR chemical shift calculations, supported by the DP4+ statistical method, were employed to confirm the relative configurations. All isolated compounds were also evaluated for their antibacterial activity against several bacterial strains.
Supplementary Materials
The following supporting information can be downloaded at the website of this paper posted on Preprints.org: 1D and 2D NMR spectra of compounds 4 and 5.
Author Contributions
Conceptualization, A.W.; methodology, W.S. and AW.; investigation, W.S., A.S., S.K., N.Y. and A.W.; resources, A.W.; writing—original draft, W.S., S.J. and AW.; writing— review and editing, A.W.; supervision, A.W.; project administration, A.W.; funding acquisition, A.W. All authors have read and agreed to the published version of the manuscript.
Funding
This research budget was allocated by National Science, Research and Innovation Fund (NSRF), and King Mongkut’s University of Technology North Bangkok (Project no. KMUTNB-FF-69-B-33).
Institutional Review Board Statement
Not applicable.
Informed Consent Statement
Not applicable.
Data Availability Statement
The data presented in this study are available in the present article and the Supplementary Material.
Acknowledgments
We are thankful for the partial support from Department of Industrial Chemistry, Faculty of Applied Science, King Mongkut’s University of Technology North Bangkok.
Conflicts of Interest
The authors declare no conflict of interest.
References
- Thetsana, P.; Chaowuttikul, C.; Palanuvej, C.; Ruangrungsi, N. Pharmacognostic Specifications, Quercetin and Quercitrin Quantification in Bauhinia Malabarica Leaf. Pharmacognosy Journal 2019, 11, 155–160. [CrossRef]
- Kaewamatawong, R.; Kitajima, M.; Kogure, N.; Takayama, H. Flavonols from Bauhinia malabarica. J Nat Med 2008, 62, 364–365. [CrossRef]
- Kittakoop, P.; Kirtikara, K.; Tanticharoen, M.; Thebtaranonth, Y. Antimalarial Preracemosols A and B, Possible Biogenetic Precursors of Racemosol from Bauhinia malabarica Roxb. Phytochemistry 2000, 55, 349–352. [CrossRef]
- Songarsa, S.; Rajviroongit, S.; Sae-Tang, D.; Hannongbua, S.; Kirtikara, K.; Kittakoop, P. New Racemosol Derivatives as Potent Cyclooxygenase (COX) Inhibitors. Chem Biodivers 2005, 2, 1635–1647. [CrossRef]
- Verma, R.; Dash, S.; Ankita; Thakur, S.; Kumar, R.; Singh, G.; Kaur, C. Genus Bauhinia (Fabaceae): A Review from Phytochemistry to Pharmacology- Exploring Traditional Uses and Toxicological Insights across Asia. Phytomedicine 2024, 135, 156246. [CrossRef]
- Rashed, K.; Butnariu, M. Antimicrobial and Antioxidant Activities of Bauhinia racemosa Lam. and Chemical Content; 2014; Vol. 13.
- Schevenels, F.T.; Jadsadajerm, S.; Lekphrom, R.; Yodsin, N.; Suebrasri, T.; Senawong, T.; Wisetsai, A. Siamfuranones A–C, Three Novel Furanone Derivatives from the Flowers of Uvaria siamensis and Their Biological Activities. Nat Prod Res 2024, 1–10. [CrossRef]
- Wongwad, E.; Jadsadajerm, S.; Mungmai, L.; Wisetsai, A. Antioxidant, Cytotoxic, Anti-Glycation, and Anti-Tyrosinase Compounds from the Leaves of Uvaria siamensis. Chem Biodivers 2024, 21. [CrossRef]
- Tabtimmai, L.; Phonchan, T.; Thongprik, N.; Kaennakam, S.; Yodsin, N.; Choowongkomon, K.; Sonklin, C.; Jadsadajerm, S.; Wisetsai, A. New Oxepin and Dihydrobenzofuran Derivatives from Bauhinia saccocalyx Roots and Their Anti-Inflammatory, Cytotoxic, and Antioxidant Activities. J Nat Med 2025, 79, 543–555. [CrossRef]
- Jain, R.; Alam, S.; Saxena, U. A New Tetracyclic Phenol and Other Constituents from the Roots of Bauhinia racemosa. ChemInform 2002, 33, 219–219. [CrossRef]
- Anjaneyulu, A.S.R.; Reddy, A.V.R.; Reddy, D.S.K.; Cameron, T.S.; Roe, S.P. Racemosol: A Novel Tetracyclic Phenol from Bauhimia racemosa Lamk. Tetrahedron 1986, 42, 2417–2420. [CrossRef]
- Maillard, M.P.; Recio-Iglesias, M.; Saadou, M.; Stoeckli-Evans, H.; Hostettmann, K. Novel Antifungal Tetracyclic Compounds from Bauhinia rufescens LAM. Helv Chim Acta 1991, 74, 791–799. [CrossRef]
- Grimblat, N.; Zanardi, M.M.; Sarotti, A.M. Beyond DP4: An Improved Probability for the Stereochemical Assignment of Isomeric Compounds Using Quantum Chemical Calculations of NMR Shifts. J Org Chem 2015, 80, 12526–12534. [CrossRef]
- Lobiuc, A.; Pavăl, N.-E.; Mangalagiu, I.I.; Gheorghiță, R.; Teliban, G.-C.; Amăriucăi-Mantu, D.; Stoleru, V. Future Antimicrobials: Natural and Functionalized Phenolics. Molecules 2023, 28, 1114. [CrossRef]
- Kamal, G.M.; Uddin, J.; Asmari, M.; Noreen, A.; Liaqat, A.; Sabir, A.; Khan, J.; Iqbal, R.; Sharma, A.; Nayik, G.A.; et al. Natural Polyphenols as a Promising Aquatic Food Preservative: A Concurrent Review. J Agric Food Res 2025, 22, 102046. [CrossRef]
- Kumar, R.S.; Sivakumar, T.; Sunderam, R.S.; Gupta, M.; Mazumdar, U.K.; Gomathi, P.; Rajeshwar, Y.; Saravanan, S.; Kumar, M.S.; Murugesh, K.; et al. Antioxidant and Antimicrobial Activities of Bauhinia racemosa L. Stem Bark. BJMBR 2005, 38, 1015–1024. [CrossRef]
- Ju, J.-H.; Li, X.-T.; Shen, Q.-K.; Guo, H.-Y.; Quan, Z.-S.; Yin, X.-M. Advances in Structural Modification of Natural Products with Antimicrobial Activity. Fitoterapia 2025, 186, 106815. [CrossRef]
- Frisch MJ, Trucks GW, Schlegel HB, Scuseria GE, Robb MA, Cheeseman JR, Scalmani G, Barone V,Mennucci B, Petersson GA, et al. 2013. Gaussian 09, revision D.01. Wallingford (CT): Gaussian Inc.
- Sirisarn, W.; Mordmuang, A.; Kerdkumthong, K.; Saeheng, S. Exploring Bougainvillea Glabra Flowers: A Promising Source of Natural Antimicrobial and Anticancer Agents. J Appl Biol Biotechnol 2024. [CrossRef]
Figure 1.
Structures of isolated compounds.
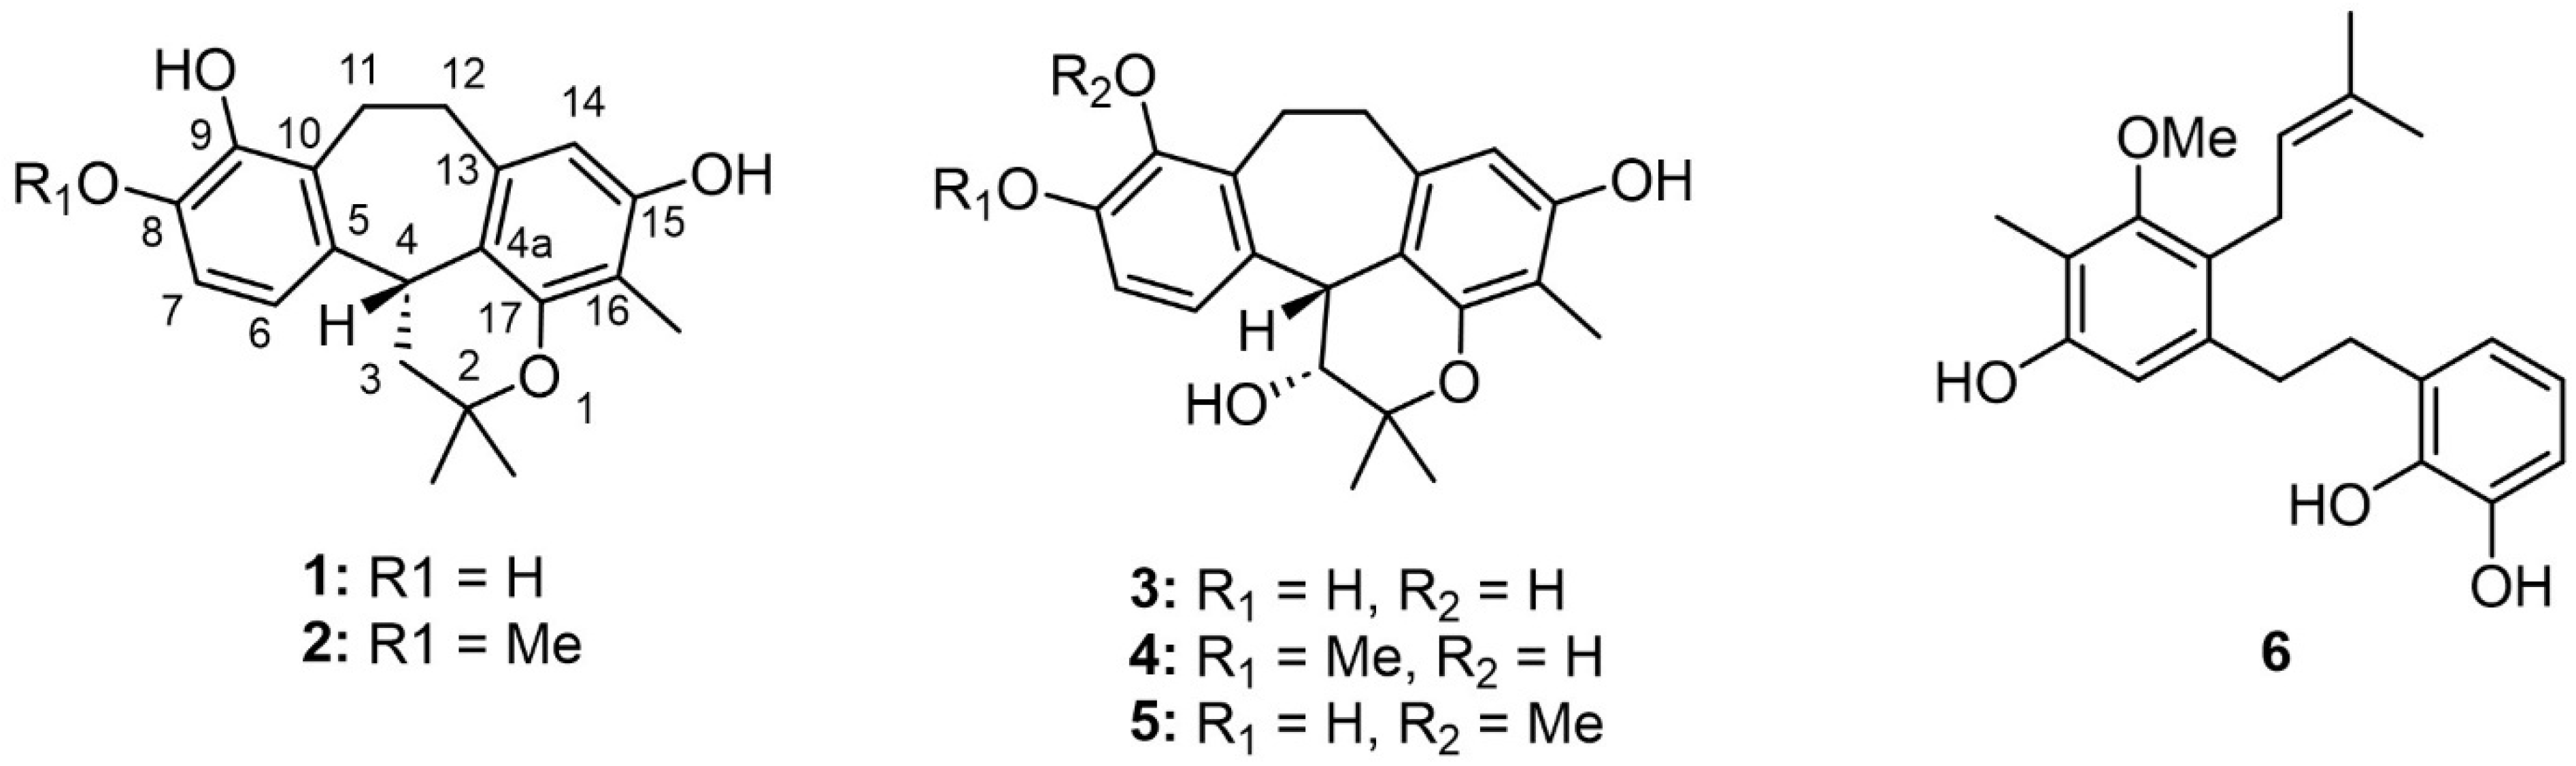
Figure 2.
Experimental and calculated ECD spectra of compounds 1 (A) and 4 (B).
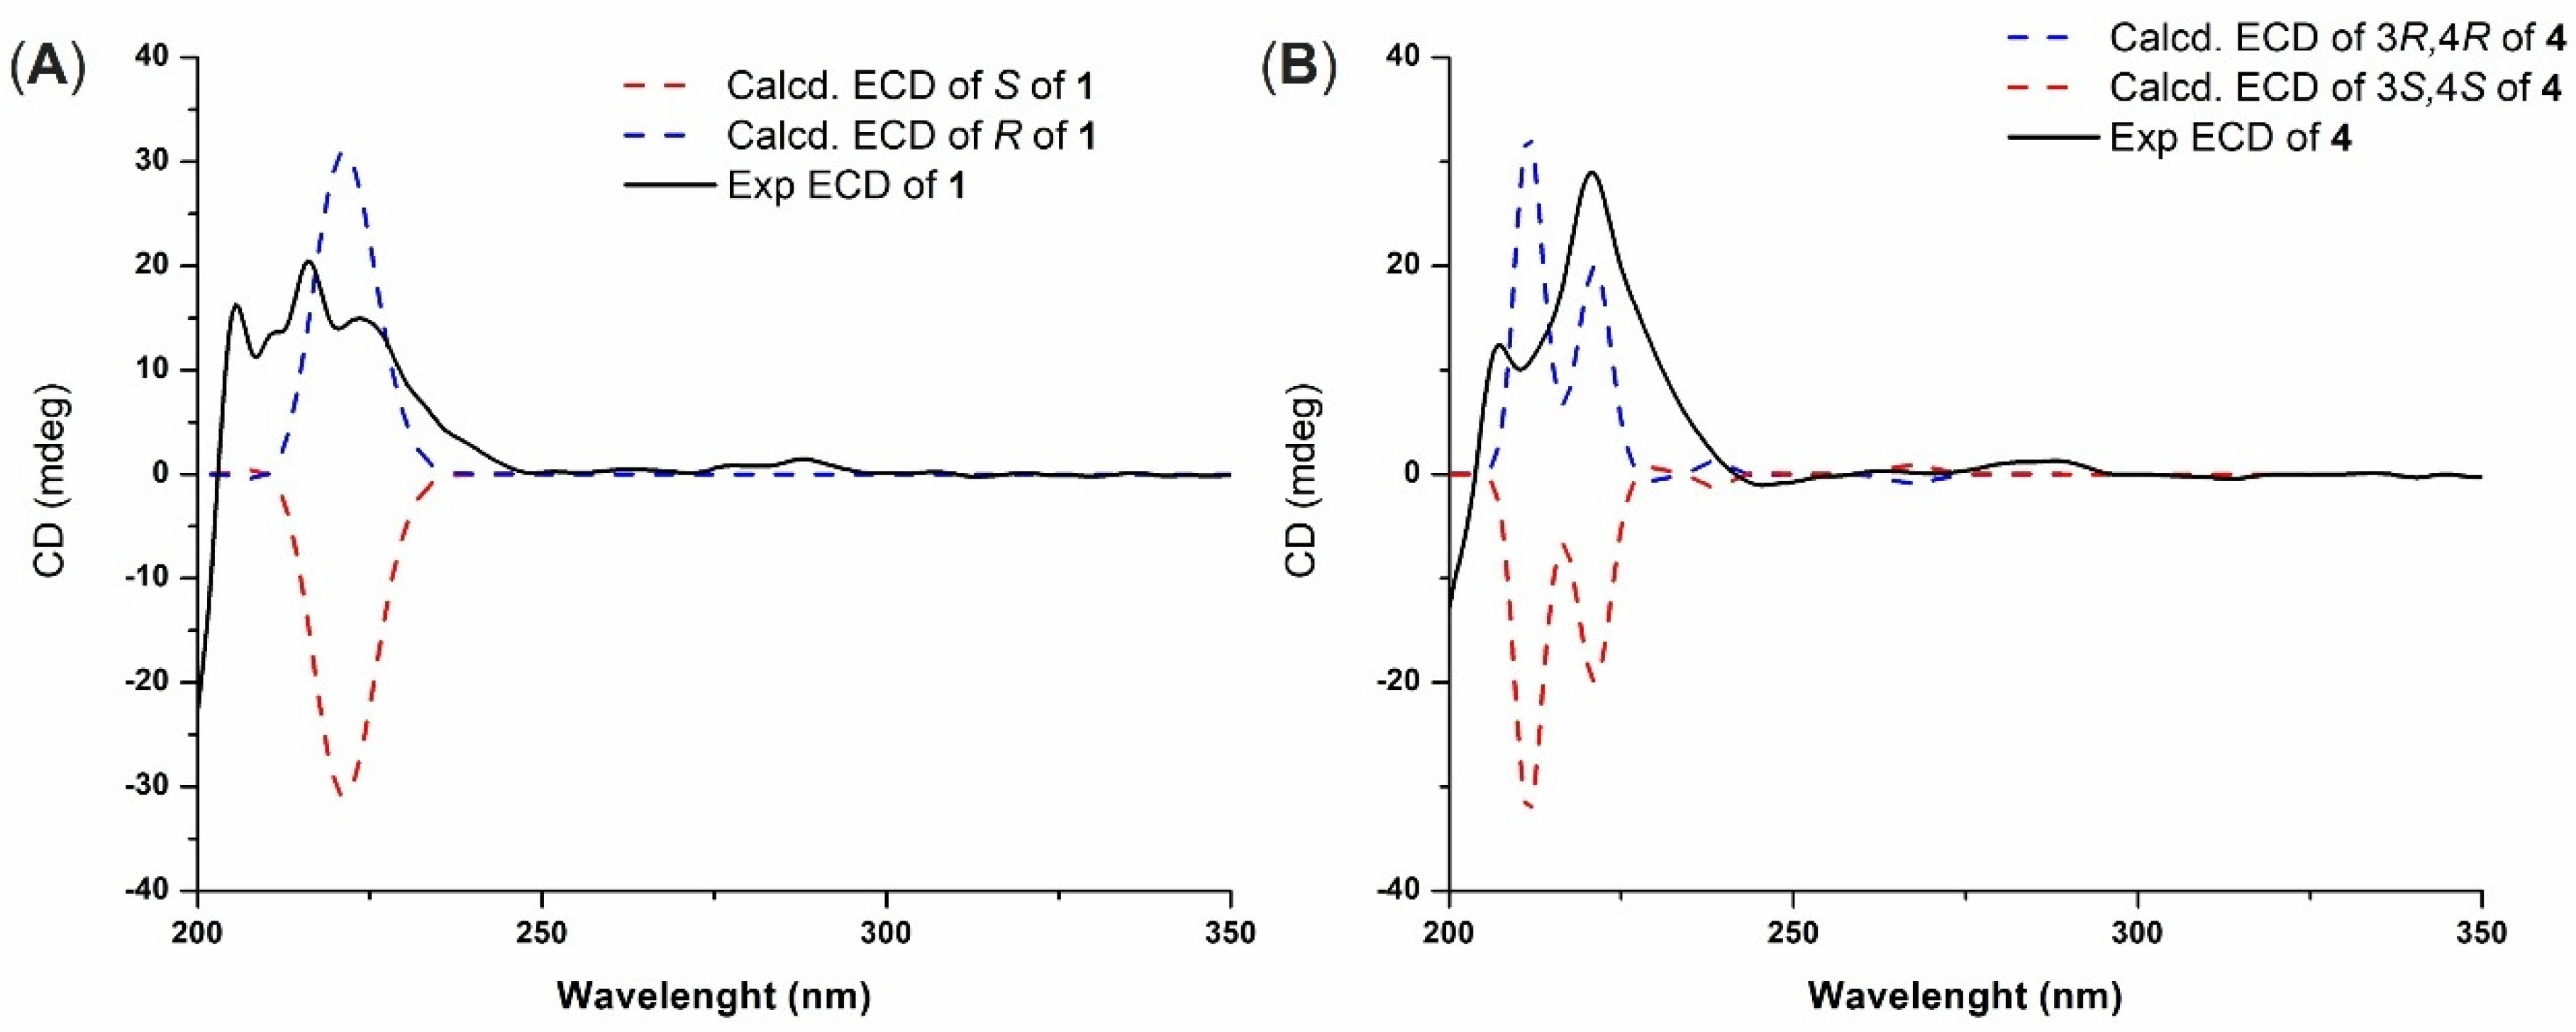
Figure 3.
1H-1H COSY and full HMBC correlations of 4 and 5.
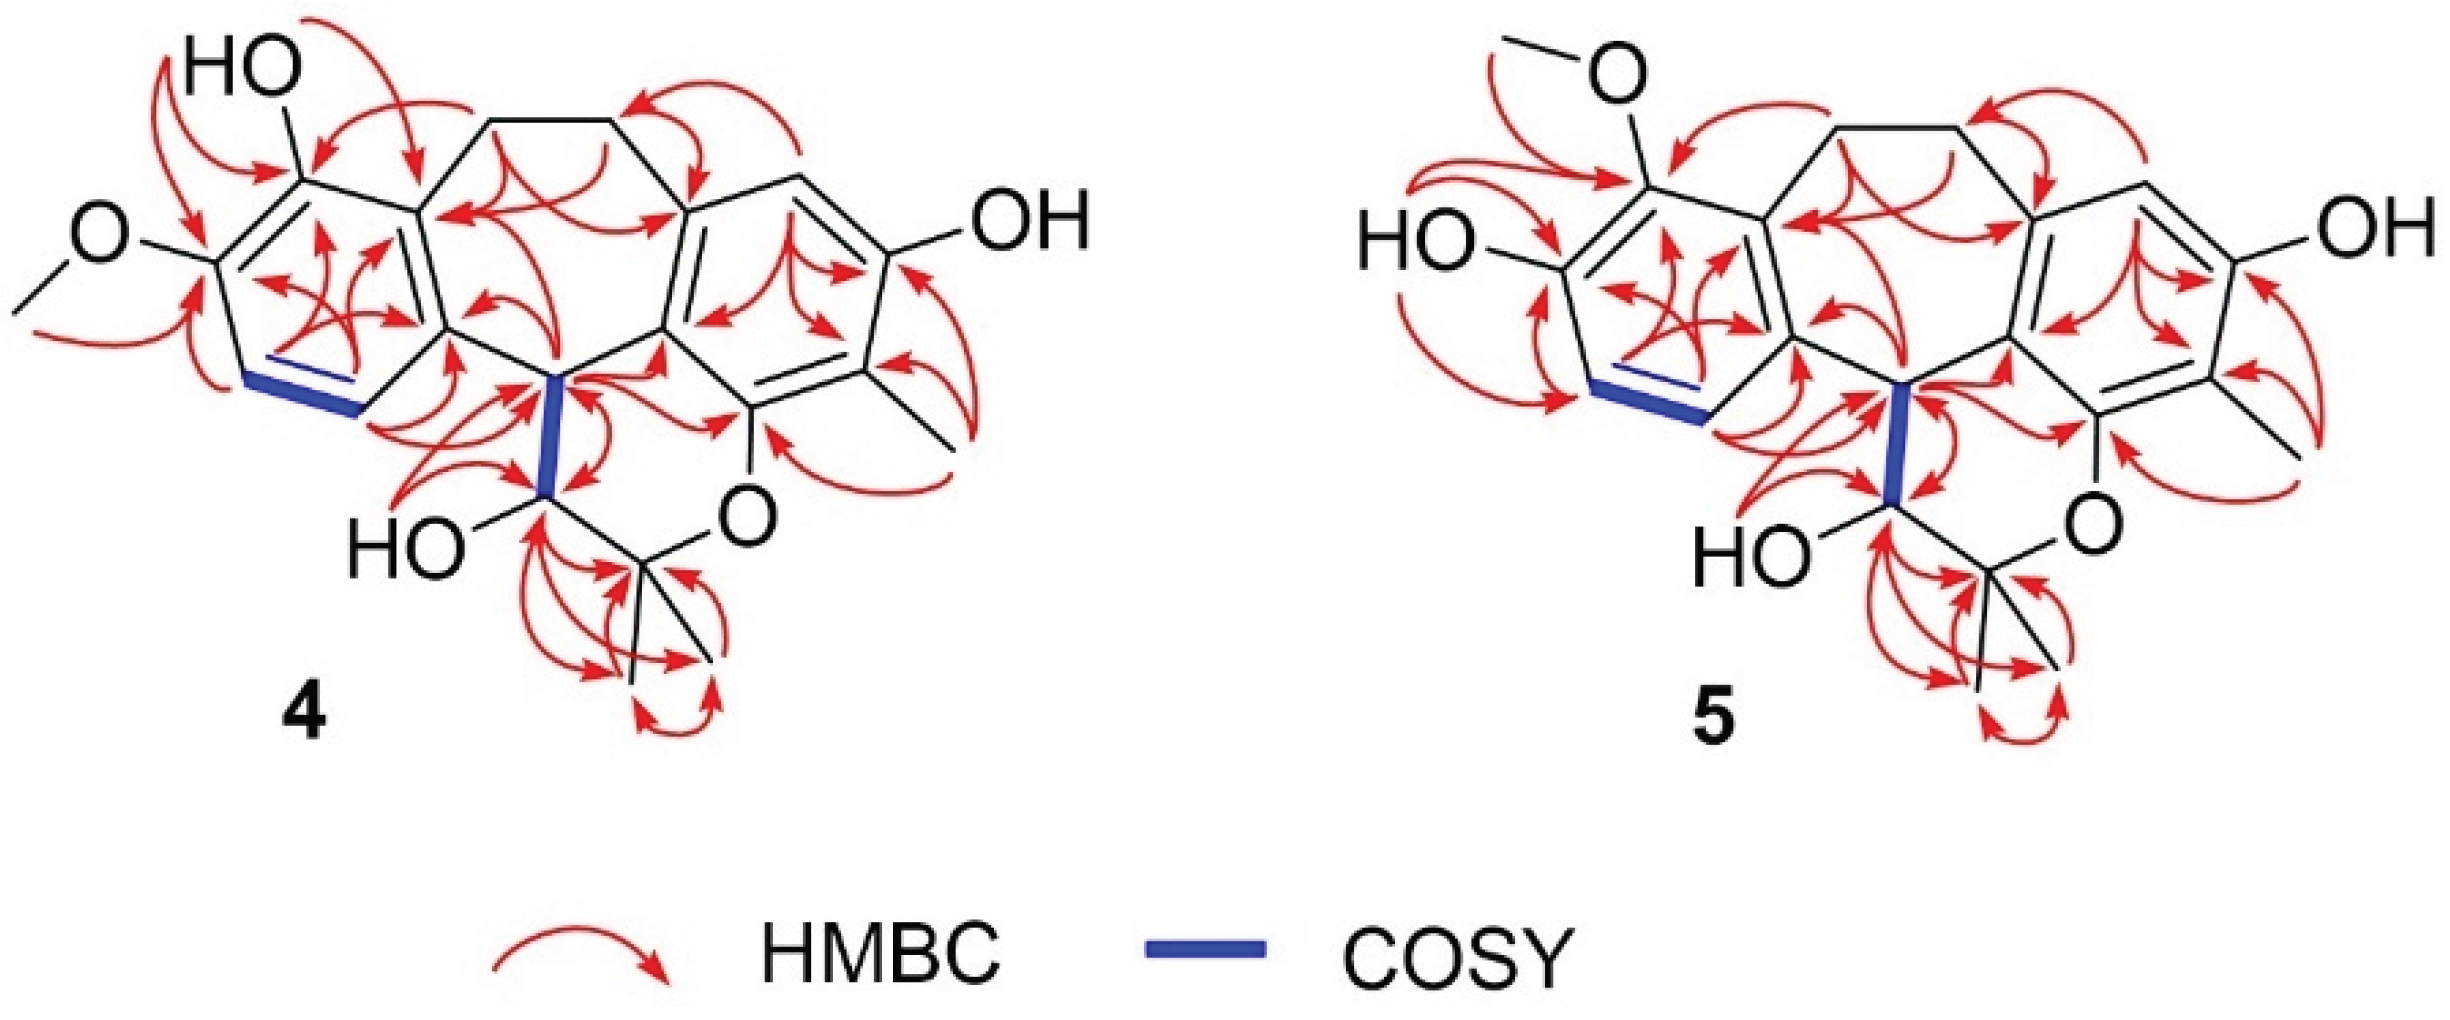

Table 1.
1H (in ppm, J in Hz) and 13C NMR data of compounds 4–5 in acetone-d6.
| No. | 3-Hydroxy-8-O-methylracemosol (4) | 3-Hydroxy-9-O-methylracemosol (5) | |||
|---|---|---|---|---|---|
| δC | δH (mult, J in Hz) | δC | δH (mult, J in Hz) | ||
| 2 | 76.9 | - | 76.9 | - | |
| 3 | 71.9 | 4.31 (m) | 71.9 | 4.28 (m) | |
| 4 | 41.4 | 4.31 (m) | 41.3 | 4.28 (m) | |
| gem-Me | 27.5 | 1.55 (s) | 27.5 | 1.55 (s) | |
| 17.7 | 1.23 (s) | 17.7 | 1.23 (s) | ||
| 4a | 115.7 | - | 115.5 | - | |
| 5 | 135.5 | - | 134.1 | - | |
| 6 | 116.0 | 6.90 (d, 8.6) | 114.1 | 6.68 (d, 8.4) | |
| 7 | 109.0 | 6.72 (d, 8.6) | 121.3 | 7.04 (d, 8.4) | |
| 8 | 146.5 | - | 149.2 | - | |
| 9 | 143.5 | - | 145.4 | - | |
| 10 | 129.6 | - | 137.2 | - | |
| 11 | 22.3 | 3.37 (m) 3.04 (m) |
23.1 | 3.25 (m) 3.15 (m) |
|
| 12 | 34.3 | 3.12 (m) 2.76 (m) |
34.9 | 3.17 (m) 2.80 (m) |
|
| 13 | 136.4 | - | 136.1 | - | |
| 14 | 110.7 | 6.11 (s) | 110.7 | 6.11 (s) | |
| 15 | 154.7 | - | 154.7 | - | |
| 16 | 110.1 | - | 110.2 | - | |
| 17 | 152.1 | - | 152.1 | - | |
| 16-Me | 8.7 | 1.97 (s) | 8.7 | 1.97 (s) | |
| 8-OMe | 56.3 | 3.80 (s) | - | - | |
| 9-OMe | - | - | 61.3 | 3.78 (s) | |
| 3-OH | - | 4.09 (d, 4.8) | - | 4.17 (s) | |
| 8-OH | - | - | - | 7.87 (s) | |
| 9-OH | - | 7.30 (s) | - | - | |
| 15-OH | - | 7.78 (s) | - | 7.80 (s) | |
Table 2.
Antimicrobial activity using overlay spotted assay of compounds 1–6 screened against various pathogenic bacteria.
Table 2.
Antimicrobial activity using overlay spotted assay of compounds 1–6 screened against various pathogenic bacteria.
| Pathogenic isolates | Antimicrobial activity of compounds 1–6 (100 ug) | Positive control (amp/gen) | Negative control (1% DMSO) | |||||
|---|---|---|---|---|---|---|---|---|
| 1 | 2 | 3 | 4 | 5 | 6 | |||
| Gram-positive bacteria | ||||||||
| Bacillus subtilis 7988 (Clinical isolate) | + | + | + | + | - | + | +* | - |
| Bacillus subtilis ATCC6051 | + | + | + | + | - | + | +* | - |
| Enterococcus faecalis 4232 (Clinical isolates) | + | + | + | + | - | + | +* | - |
| Listeria monocytogenes (Clinical isolates) | + | + | + | + | - | + | +* | - |
| Staphylococcus aureus ATCC25923 | + | + | + | + | - | + | +* | - |
| Staphylococcus aureus ATCC29213 | + | + | + | + | - | + | +* | - |
| Methicillin Resistant Staphylococcus aureus (Clinical isolate) | + | + | + | + | - | + | −* | - |
| Staphylococcus epidermitis 35984 | + | + | + | + | - | + | +* | - |
| Streptococcus pyogenes ATCC49619 | + | + | + | + | - | + | +* | - |
| Gram-negative bacteria | - | |||||||
| Acinetobacter baumannii ATCC19606 | + | - | - | + | - | + | +** | - |
| Multidrug-resistant Acinetobacter baumannii (MDR) | + | + | - | + | - | + | −** | - |
| Escherichia coli ATCC25922 | + | + | - | + | - | + | +** | - |
| Escherichia coli O157:H7 | + | + | + | + | - | + | +** | - |
| Klebsiella pneumoniae ATCC70063 | + | + | - | + | - | + | +** | - |
| Pseudomonas aeruginosa ATCC27853 | - | - | - | + | - | + | +** | - |
| Salmonella enterica serotype Typhi (Clinical isolates) | + | + | - | + | - | + | +** | - |
| Shigella enteritis (Clinical isolates) | - | - | - | - | - | - | +** | - |
10 µg/mL of ampicillin (amp) was used as positive control for Gram positive bacteria marked as * and 10 µg/mL of gentamycin (gen) was used as positive control for Gram negative bacteria marked as **. DMSO was used as a negative control. Symbol + and - stand for making a clear spot and not making a clear spot on bacterial lawn respectively. All tests were conducted in triplicate.
Table 3.
Minimum inhibitory concentrations and minimum bactericidal concentrations of compounds 1–6 against various pathogenic bacteria.
Table 3.
Minimum inhibitory concentrations and minimum bactericidal concentrations of compounds 1–6 against various pathogenic bacteria.
| Pathogenic isolates | Minimum Inhibitory Concentration (MIC)/ Minimum Bactericidal Concentration (MBC) in µg/µL of compounds 1–6 | Minimum Inhibitory Concentration (MIC) of Ampicillin/Gentamycin (µg/ml) | Negative control (1% DMSO) | |||||
|---|---|---|---|---|---|---|---|---|
| 1 | 2 | 3 | 4 | 5 | 6 | |||
| Gram-positive bacteria | ||||||||
| Bacillus subtilis 7988 (Clinical isolate) | 0.625/0.625 | 0.625/2.5 | 2.5/2.5 | 0.625/0.625 | NA | 0.15625/0.15625 | 0.5/0.5 | R |
| Bacillus subtilis ATCC6051 | 0.15625/>5 | 0.3125/>5 | 1.25/>5 | 0.3125/>5 | NA | 0.15625/>5 | 0.125/0.125 | R |
| Enterococcus faecalis 4232 (Clinical isolates) | 0.15625/>5 | 0.625/>5 | 2.5/>5 | 1.25/>5 | NA | 0.3125/0.625 | 0.25/NA | R |
| Listeria monocytogenes (Clinical isolates) | 0.15625/0.3125 | 0.625/>5 | 0.625/>5 | 0.3125/1.25 | NA | 0.3125/0.3125 | 0.25/2 | R |
| Staphylococcus aureus ATCC25923 | 0.15625/0.3125 | 0.625/>5 | 0.625/>5 | 0.625/>5 | NA | 0.3125/0.3125 | 0.25/0.5 | R |
| Staphylococcus aureus ATCC29213 | 0.15625/0.3125 | 0.625/>5 | 0.625/>5 | 0.3125/>5 | NA | 0.3125/0.625 | 0.25/0.125 | R |
| Methicillin Resistant Staphylococcus aureus (Clinical isolate) | 0.15625/0.15625 | 0.625/>5 | 0.625/>5 | 0.3125/>5 | NA | 0.3125/0.3125 | NA/0.25 | R |
| Staphylococcus epidermitis 35984 | 0.15625/0.625 | 1.25/>5 | 1.25/>5 | 0.15625/>5 | NA | 0.3125/0.625 | 0.5/0.25 | R |
| Streptococcus pyogenes ATCC49619 | 0.3125/0.3125 | 1.25/>5 | 1.25/>5 | 0.3125/>5 | NA | 0.3125/0.625 | 0.25/0.125 | R |
| Gram-negative bacteria | ||||||||
| Acinetobacter baumannii ATCC19606 | 0.3125/0.625 | NA | NA | 0.3125/5 | NA | 0.15625/0.3125 | NA/1 | R |
| Multidrug-resistant Acinetobacter baumannii (MDR) | 1.25/5 | 1.25/>5 | NA | 1.25/5 | NA | 1.25/5 | NA/NA | R |
| Escherichia coli ATCC25922 | 2.5/>5 | 2.5/>5 | NA | 2.5/5 | NA | 2.5/>5 | NA/0.031 | R |
| Escherichia coli O157:H7 | 2.5/5 | 2.5/5 | 2.5/5 | 2.5/>5 | NA | 2.5/5 | NA/0.063 | R |
| Klebsiella pneumoniae ATCC70063 | 2.5/>5 | 2.5/>5 | NA | 2.5/>5 | NA | 2.5/>5 | NA/0.062 | R |
| Pseudomonas aeruginosa ATCC27853 | NA | NA | NA | 2.5/>5 | NA | 2.5/5 | NA/4 | R |
| Salmonella enterica serotype Typhi (Clinical isolates) | 2.5/>5 | 2.5/>5 | NA | 2.5/>5 | NA | 2.5/5 | NA/2 | R |
| Shigella enteritis (Clinical isolates) | NA | NA | NA | NA | NA | NA | NA/1 | R |
Ampicillin (amp) was used as positive control for Gram positive bacteria marked as * and Gentamycin (gen) was used as positive control for both Gram positive and Gram negative bacteria. DMSO (1%) was used as a negative control diluted by MHB broth. The letter R denotes resistance, a parameter that was not employed in the investigation of minimum inhibitory concentration (MIC).
Disclaimer/Publisher’s Note: The statements, opinions and data contained in all publications are solely those of the individual author(s) and contributor(s) and not of MDPI and/or the editor(s). MDPI and/or the editor(s) disclaim responsibility for any injury to people or property resulting from any ideas, methods, instructions or products referred to in the content. |
© 2025 by the authors. Licensee MDPI, Basel, Switzerland. This article is an open access article distributed under the terms and conditions of the Creative Commons Attribution (CC BY) license (http://creativecommons.org/licenses/by/4.0/).
Copyright: This open access article is published under a Creative Commons CC BY 4.0 license, which permit the free download, distribution, and reuse, provided that the author and preprint are cited in any reuse.


