Submitted:
05 October 2025
Posted:
08 October 2025
You are already at the latest version
Abstract
Background: Coronary heart disease (CHD) is the leading cause of premature mortality. The incremental value of polygenic risk score (PRS) to clinical risk score towards improving CHD prediction is controversial. Meanwhile, the effect of PRS on CHD prediction in the chronic disease population is unclear. Methods: Utilizing publicly available summary statistic data, we developed several PRSs using genome data of European ancestry from the Atherosclerosis Risk in Communities Study. Furthermore, we investigated the association of CHD with best-performing PRS in both the overall and chronic disease cohorts. Additionally, we evaluated whether adding best-performing PRS to clinical risk score improves the risk prediction. Results: A total of 6,152 subjects (767 CHD cases) were included in this study. The developed best-performing PRS was significantly associated with increased risk of CHD, with a stronger association in the hypertensive population (interaction P = 0.0144). Compared with individuals in the bottom 20% of PRS, those in the top 20% were more than 3-fold more likely to develop CHD in overall cohort, rising to 5-fold in the hypertensive cohort. Adding PRS to the clinical risk score significantly improved the C-index (0.72 to 0.74; P = 0.004) with a 10% net reclassification improvement overall. The hypertensive population showed the greatest improvements. Furthermore, we observed significant gradient of 10-year and lifetime risk of CHD based on PRS within each clinical risk category. Conclusions: Compared to the clinical risk score, integrating PRS significantly improved CHD prediction and better identified CHD risk trajectories, especially in the hypertensive population.
Keywords:
coronary heart disease
; hypertension
; polygenic risk score
; risk factors
Introduction
Coronary heart disease (CHD) is a complex condition arising from a combination of genetic, cardiometabolic, behavioral, environmental, and social risk factors. It remains the leading cause of premature mortality in both developed and developing countries [1,2]. Reducing the burden of CHD worldwide and providing accurate risk prediction of incident CHD is a crucial public health problem [3].
Although the treatment methods for CHD are rapidly increasing, identifying and selecting the patients who can benefit from these treatments remains a challenge. Current, several clinical models were proposed for predicting an individual’s incident CHD, such as the American College of Cardiology/American Heart Association Pooled Cohort Equation (PCE) [4], the European Society of Cardiology SCORE2 model [5] and the QRISK3 model [6]. These models integrate data on demographics and cardiovascular risk factors to estimate the 10-year risk of an incident CHD. However, conventional clinical risk prediction models are not highly accurate in estimating the risk of CHD. For example, many individuals, who have an estimated 10-year CHD risk below 7.5% based on PCE, experienced an incident CHD [7]. Therefore, there is particular interest in proposing tools to further enhance the risk stratification of the population, thereby minimizing treatment costs, improving patient prognosis, and informing public health.
The estimated heritability of CHD ranges between 40% and 60%, with the majority of the heritable risk attributed to a polygenic component [8]. The polygenic risk score (PRS), which can capture a proportion of heritability [9], has been an effective tool for predicting various diseases [10,11,12,13]. The score is the weighted sum of those identified single-nucleotide polymorphisms (SNPs) associated with the interested traits or diseases in genome-wide association studies (GWAS) [14]. The successful application of PRS to complex diseases demonstrates their strong potential for enhancing CHD risk prediction by leveraging information from millions of genomic variants. Recently, many PRSs for CHD have been developed to improve risk prediction. Several studies have shown that PRSs can improve risk prediction accuracy for prevalent CHD events compared with conventional clinical risk factors [15,16] and enhance power in terms of net reclassification improvement (NRI) by combining clinical risk prediction models (i.e., PCE) with PRS [17,18]. In contrast, several studies [19,20] that integrated a PRS into the PCE found that the combined strategy failed to significantly improve discrimination, calibration, or risk reclassification. However, its applicability in individuals with prior chronic conditions (such as hypertension, diabetes, or chronic kidney disease) has not been fully studied. These populations are often at elevated baseline risk for CHD, but their risk trajectories differ because of complex interactions between clinical and genetic factors [21].
To address the unmet need of individualized CHD risk prediction, we constructed a CHD PRS and aimed to: (1) evaluate its predictive power across subgroup populations defined by chronic disease status; and (2) assess whether incorporating CHD PRS with an established clinical arteriosclerotic cardiovascular disease (ASCVD) risk score improves CHD risk prediction. We found that the developed PRS exhibited a significant interaction in subgroups defined by chronic disease status and demonstrated excellent predictive performance in the hypertensive population. Furthermore, integrating this PRS with a clinical risk score significantly enhanced CHD risk prediction.
Materials and Methods
Study Population
The study population of interest included 13,113 participants from the Atherosclerosis Risk in Communities (ARIC) Study. The ARIC study is a prospective, longitudinal cohort of middle-aged black and white participants (45% male vs 55% female) recruited from four communities in the United States (Forsyth County, North Carolina; Jackson, Mississippi; suburbs of Minneapolis, Minnesota; and Washington County, Maryland) from 1987 to 1989 (visit 1). All participants involved were followed up every three years until visit 4 (1996-1998), and more recently, visit 5 (2011-2013), visit 6 (2014-2016) and visit 7 (2017-2019) [22]. Clinical examination, blood measurement, physician assistant reviews and telephone questionnaire were carried out at each follow-up. The entire dataset was randomly split into a training set (70%) and a validation set (30%). The training set was used to construct predictive models, and the validation set was used for parameter tuning of PRS algorithms. The ARIC study protocol was approved by the Institutional Review Board of Vanderbilt University Medical Center, and all participants provided written informed consent. The publicly available ARIC data can be obtained from dbGaP (phs000090).
Genotype Data
SNP genotype data of all participants were acquired on the Affymetrix 6.0 DNA microarray platform (Affymetrix, Santa Clara, CA) and were analyzed with the Birdseed variant-calling algorithm. Quality control was conducted using PLINK 2.0 [23] before genotype imputation. We excluded SNPs that have call rate < 95%, missing data >5%, Hardy–Weinberg equilibrium P values < 10-6, or minor allele frequencies < 5%, as well as duplicated SNPs [24]. Individuals who failed the X-chromosome sex concordance check, as well as those with more than 5% missing data, were removed. Related individuals were excluded by randomly removing one of each pair of individuals with genetic relatedness more than 0.8. The 1000 Genomes Project was used as a reference panel for genotype imputation via an algorithm on the Michigan Server [25,26]. SNPs with imputation quality below 0.4 were removed. The QC procedure ensured there was no bias produced by sample batch effect or genotyping quality.
ASCVD Risk Score
ASCVD 10-year risk score of all participants with available baseline was calculated using PCE model [4], which incorporates variables of sex, age, race and ethnicity, diabetes, total cholesterol, high-density lipoprotein cholesterol (HDL-C), systolic blood pressure (SBP), antihypertensive medication use, and smoking status. Each participant was designated to one of three risk categories: low (<7.5%), intermediate (7.5%-20%) and high (>20%) based on 10-year risk score of CHD.
Polygenic Risk Score
The PRS of an individual can be calculated as the weighted sum of risk alleles based on the GWAS summary data. We used the GWAS summary data from the Coronary Artery Disease Genome-Wide Replication and Meta-analysis (CARDIoGRAM) plus the Coronary Artery Disease (C4D) Genetics (CARDIoGRAMplusC4D) Consortium[27]. Several different algorithms estimate separate effect sizes, resulting in varying predictive performance of the calculated PRS. To select the optimal PRS for CHD, we evaluated four PRSs: one previously developed by Khera et al. [8], and three others were developed using different algorithms (clumping and thresholding [28] (C+T/ P+T), LDpred2 [29] and PRS-cs [30]). Detailed information on each PRS algorithm and its tuning parameters is described in the supplementary materials.
For the PRS tuning, the candidate PRS-cs PRSs, LDpred2 PRSs and P+T PRSs were calculated in a validation dataset in the ARIC independent from the training dataset. The best PRS of each approach was selected using the area under the receiver operating characteristic (ROC) curve (AUC). Specifically, we fitted a logistic regression with CHD as outcome; each candidate PRS as exposure; and age, sex, and the first ten principal components (PCs) of genotype as covariates. The best PRS-cs PRS, best LDpred2 PRS and best P+T PRS were used in the subsequent analysis.
We calculated a series of metrics to assess the performance of the best P+T PRS, best LDpred2 PRS and best PRS-cs PRS using the same approach with adjustment of the same set of covariates as in the tuning step through 10-fold cross validation in the whole dataset. Each PRS was standardized using z-score transformation. Based on the most predictive PRS, the study participants were divided into three genetic risk categories: low (bottom quintile), intermediate (the second to fourth quintile) and high (top quintile), as in the published approach [31].
Outcome and Follow-Up
The incident CHD cases were defined as having incident myocardial infarction (MI), heart attack, fatal coronary event, or silent MI detected by electrocardiogram or having undergone a revascularization procedure by December 31, 2004. The interested variables age, smoking status (current, former and never), SBP, hypertension, antihypertensive medication use, HDL-C, stroke, congestive heart failure (CHF), chronic kidney disease (CKD), obesity, dyslipidemia and diabetes were ascertained at the visit 1 examination. The follow-up time for each participant was calculated as the interval between the date of the baseline examination and the date of occurrence of CHD, the date of death, or the last follow-up visit, whichever occurred first.
Statistical Analysis
Baseline characteristics of overall participants were described as means for continuous variables and frequencies for categorical variables. To compare the differences of demographics and clinical factors for those with and without incident CHD, a two-sided Student’s t-test was used for continuous variables and a chi-squared test was used for categorical variables. To measure the overall prediction accuracy of PRSs, we calculated: i) the proportion of variation in CHD status explained by the PRS on the liability scale; ii) the AUC for the PRS combined with covariates; iii) the odds ratio (OR) which measures the association of the PRS with CHD.
Two Cox proportional hazard models were constructed to investigate the association between PRS and incident CHD and estimate hazard ratio (HR) for the risk of incident CHD given one-unit standard deviation (SD) increment in the PRS and by quintiles of the PRS distribution. Model 1, which included age, sex, and the first ten PCs; model 2, which additionally included diabetes, LDL-C, HDL-C, SBP, DBP, hypertension, antihypertension and smoking status. A series of models incorporating interaction terms between PRS and chronic disease status were constructed to assess potential effect modification on incident CHD risk, evaluated on a continuous scale. Cox proportional hazard model fit was estimated by examining Schoenfeld residuals to evaluate the proportional hazards assumptions for the covariates, Martingale residuals to assess nonlinearity, and deviance results to identify influential outliers. Kaplan–Meier survival analyses were conducted to explore the relationship between genetic risk categories and the cumulative incidence of CHD, with statistical comparisons performed using the log-rank test.
Harrell concordance index (C-index) was calculated for Cox proportional hazard models adjusted for age, sex and first ten PCs to examine the model goodness-of-fit. The incremental value of the PRS to the clinical ASCVD risk score was assessed by evaluating the difference in C-index. We calculated 95% confidence intervals for C-index and for the difference in C-index values between models by 10-fold cross-validation using a nonoverlapping 9:1 split. We evaluated the calibration of risk prediction models by comparing the observed with the predicted event probabilities using the Greenwood-Nam-D’Agostino chi-squared test [32]. The NRI was calculated for the combined model (includes clinical ASCVD risk score and PRS, denoted by PRS-enhanced model) and the PCE model (includes clinical ASCVD risk score only). We calculated both categorized NRI and continuous NRI to assess the PRS prediction performance when added to the clinical ASCVD risk score. The 95% confidence intervals for NRI were obtained using bootstrapping. All statistical tests were two-sided and a P < 0.05 was considered significant. Statistical analysis was performed in R software, version 4.3.1.
Results
Baseline Characteristics of the Study Cohort
A total of 6,152 participants were included in our analysis (Figure 1), and 767 of them experienced CHD event. The mean age was 54 years (SD, 5.6 years) and 44.73% male of the overall cohort. As shown in Table 1, most of the baseline characteristics significantly differed between those developed CHD and not developed CHD. Those with CHD were older than those without CHD, with a mean age of 55.4 years (SD, 5.4 years) compared to 53.8 years (SD, 5.6 years) (P = 8.21×10⁻¹³). There were more men (70.3% male vs 29.7% female, P = 3.26×10-52) and more former or current smoking (26.99% current smoking vs 42.76% former smoking vs 30.25% never smoking, respectively, P = 1.24×10⁻¹⁵) among those who developed CHD. Furthermore, SBP was significantly higher in those with CHD than those without CHD (P = 2.58×10⁻¹⁹), and individuals with CHD were also more likely to be on antihypertensives. In the context of chronic diseases, individuals with CHD had a higher incidence of hypertension, obesity, dyslipidemia, and CHF (P < 0.001), but not stroke or CKD. There was also a significant difference across genetic risk categories (Table S1). The mean follow-up time for those with CHD was lower than for those without CHD (10.14 years vs 16.23 years, P < 0.001).
Performance of CHD PRS
Across the entire study population, the optimal performing PRS with an AUC of 0.72(95%CI: 0.68-0.76), liability R2 of 6.30% and odds ratio (OR) of 1.65 (95%CI: 1.52-1.79) was calculated using the LDpred2 algorithm (Table S2). The distribution of the optimal performing PRS in the ARIC population-based cohort shows that individuals with CHD have higher PRS than those without CHD (Figure S1A). As shown in Figure S1B, the prevalence of CHD increases as the PRS percentile increases. In the group with the high PRS, the prevalence of CHD was 34.78%, which is a 10.4-fold difference compared with a CHD prevalence of 3.33% in the low PRS group. Having illustrated the association between PRS and CHD, we evaluated effect sizes in the general population. The individuals with PRS in the highest centile (prevalence = 34.78 cases per 1000 individuals) had a significantly higher risk than those with median centile (prevalence = 16.37 cases per 1000 individuals, OR = 2.53, P = 0.0043) and lowest centile (prevalence = 3.33 cases per 1000 individuals, OR = 23.29, P = 0.0023, Figure S1B). The association of CHD PRS and CHD risk was investigated, the CHD PRS was significantly associated with CHD risk (hazard ratio (HR) per 1-SD increment = 1.58, 95%CI: 1.47-1.70, P = 4.73×10⁻³⁵, Table 2). After adjusting for diabetes, LDL-C, HDL-C, SBP, DBP, hypertension, antihypertension and smoking status, there was a significant association of CHD PRS with CHD risk (HR = 1.51, 95%CI: 1.40-1.62, P = 1.27×10⁻²⁷). As shown in Table 2, the hazard ratios (HRs) for polygenic risk score (PRS) values in the upper 2nd, 5th, 10th, and 20th percentiles consistently increased with higher PRS percentiles in both Model 1 and Model 2.
We evaluated the association between CHD PRS and the lifetime (till 80 years of age) trajectories of CHD risk. The cumulative risk by age of 80 years for those in low, intermediate and high genetic risk categories was 12.1%, 24.8% and 33.9%, respectively (Figure 2A). In time-to-event analyses, the risk of CHD was higher in participants with intermediate (HR = 2.19, 95%CI: 1.72-2.80, P = 2.28×10⁻¹⁰) and high (HR = 3.68, 95%CI: 2.84-4.77, P = 9.52×10⁻²³) genetic risk compared with those with low genetic risk. The Kaplan–Meier survival analyses with follow-up time as the time scale showed that the CHD PRS provided a significant gradient of CHD risk stratification (Figure S2A, log-rank test, P < 0.0001).
Interaction of Chronic Diseases on PRS for CHD Prediction
The association of CHD PRS with CHD risk was investigated across strata of chronic diseases and smoking status. We found that the association of CHD PRS with CHD risk was largely independent of chronic diseases and smoking status, as well as the ASCVD risk score (Table S3). Furthermore, we examined the association of CHD PRS with CHD risk in different chronic disease populations. The HR was significantly higher in individuals with hypertension (HR = 1.76, 95%CI: 1.55-2.00, P = 1.35×10⁻¹⁸) compared with those without hypertension (HR = 1.47, 95%CI: 1.34-1.60, P = 9.21×10⁻¹⁷; P = 0.0144 for interaction, Figure 3 and Table S4). In contrast, HRs did not significantly differ in other chronic diseases or different smoking status populations. Similar to the results in all individuals, the CHD PRS provided a significant gradient of CHD risk stratification in individuals with and without hypertension (Figure S2). Individuals with hypertension at high genetic risk exhibited a significantly lower probability of CHD event-free survival compared to those without hypertension. In time-event analyses, the risk of CHD for hypertensive individuals elevated in those with intermediate (HR = 3.19, 95%CI: 1.88-5.44, P = 1.93×10⁻⁵) and high (HR = 5.91, 95%CI: 3.41-10.2, P = 2.47×10⁻¹⁰) genetic risk compared with those with low genetic risk (Figure 2B). Conversely, the risk of CHD for non-hypertensive individuals attenuated in those with intermediate (HR = 1.86, 95%CI: 1.41-2.45, P = 1.02×10⁻⁵) and high (HR = 2.86, 95%CI: 2.11-3.87, P = 1.36×10⁻¹¹) genetic risk than those with low genetic risk (Figure 2C). In addition, the cumulative risk of CHD by age of 80 years significantly elevated in hypertensive individuals but attenuated in non-hypertensive individuals.
Addition of PRS to Clinical ASCVD Risk Score
We investigated whether adding the CHD PRS to the clinical ASCVD risk score improves predictive performance. By calculating the C-index of the Cox proportional hazards model, we evaluated the performance of models. We found that a model with only PRS produced a C-index of 0.71(95%CI: 0.69-0.73), whereas a model with only clinical ASCVD risk score increased the model performance to 0.72 (95%CI: 0.70-0.74), and the PRS-enhanced model further improved performance to 0.74 (95%CI: 0.72-0.77, ΔC-index: 0.02, P = 0.004; Table S5). Furthermore, the PRS-enhanced model significantly improved the C-index in individuals with hypertension (P = 7.92×10-04), whereas no significant improvement was observed in non-hypertensive individuals (P = 0.192). When evaluating reclassification metrics in detail, we found there was significant reclassification improvement in three-category risk (<7.5%, 7.5%-20%, >20%) assessment (NRI, 0.10, 95%CI: 0.04-0.16; continuous NRI, 0.47, 95%CI: 0.34-0.57, Table 3) across all participants. Furthermore, subgroup analysis revealed that the PRS-enhanced model performed better in hypertensive individuals (NRI, 0.13, 95%CI: 0.04-0.23; continuous NRI, 0.51, 95%CI: 0.35-0.67) compared with non-hypertensive individuals (NRI, 0.10, 95%CI: 0.05-0.16; continuous NRI, 0.37, 95%CI: 0.25-0.53, Table S6). Calibration analysis indicated that the model with clinical ASCVD risk score and PRS was well calibrated in whole participants and different subgroups (Figure S3).
We further investigated the interaction of the PRS and the clinical ASCVD risk score on CHD risk. When the study population was stratified into ASCVD risk score categories, we observed that PRS provided an additional significant gradient in the 10-year lifetime risk of CHD within each ASCVD risk score category (P-trend < 0.001) (Figure 4). When using both the ASCVD risk score and the PRS together, there was a nearly 23-fold and 10-fold increase in 10-year and lifetime risk from the lowest risk to the highest risk subgroups (1.36% 10-year risk and 8.15% lifetime risk in those with low clinical risk and low genetic risk; 31.58% 10-year risk and 78.43% lifetime risk in those with high clinical risk and high genetic risk). Furthermore, the ASCVD risk score provided a significant gradient of risk stratification across genetic risk categories. Similar analysis was conducted in the hypertensive population and the non-hypertensive population, we observed similar patterns of the interaction between ASCVD risk score and PRS (Figure S4). We also observed that the 10-year and lifetime risk of CHD were elevated in individuals with hypertension but attenuated in individuals without hypertension.
Discussion
In this paper, we proposed a CHD PRS that has good performance in risk stratification of incident CHD risk, and enhanced the performance of the PCE when integrating this PRS into the clinical ASCVD risk score. Meanwhile, we found that hypertension has an interaction with CHD PRS for predicting CHD risk. The time-to-event analyses demonstrated there was a substantial gradient of 10-year and lifetime CHD risk across polygenic risk categories. These results provide promising support that PRS can improve accuracy in identifying the risk of incident CHD, especially in the hypertensive population.
In the last decades, GWASs have demonstrated thousands of genetic loci associated with hundreds of phenotypes [33]. The PRS derived from these GWASs can explain some of phenotypic variance and has been used for disease prediction and risk stratification. Previous studies8,19 have developed PRSs for CHD risk prediction, but they used old algorithms to calculate PRSs that may have unsatisfactory performance. Recently, there has been an increasing number of novel algorithms developed for improving the accuracy of PRS in explaining phenotypic variance and risk prediction. This study used three advanced and recent algorithms to calculate PRSs and selected an optimal PRS for subsequent CHD risk prediction and population stratification. Our results demonstrate that the PRS calculated from the LDpred2 algorithm has the best performance with a significant HR of 1.58 per 1-SD increment, AUC of 0.706 and C-index of 0.71. These values are higher than those reported in previous studies [18,34,35]. In our adjusted model, we found that those individuals in the highest PRS percentile had 10.4 times higher odds of having incident CHD than those in the lowest percentile. Our evaluation of the PRS risk stratification performance revealed that the individuals with high (HR = 3.66) and intermediate (HR = 2.19) genetic risk showed a significantly increasing CHD risk compared with those with low genetic risk, respectively. We observed that the HRs increased progressively with higher PRS percentiles (top 2nd, 5th, 10th, and 20th percentiles), demonstrating excellent risk stratification performance of our polygenic risk score. Our findings support the clinical utility of the proposed CHD PRS, showing enhanced accuracy in both CHD prediction and risk stratification. However, the predictive performance could potentially be further improved through more advanced algorithms (e.g., ensemble learning methods) and larger sample sizes.
Furthermore, our proposed CHD PRS was independent of conventional clinical risk factors (e.g., stroke, obesity) which illustrated the independent predictive value of the CHD PRS. Interestingly, consistent with previous studies [36], we found that hypertension significantly modified the association between the PRS and CHD risk (P = 0.014). To our knowledge, there are few studies that investigate the interaction of hypertension on PRS for predicting CHD risk. Further stratified analyses were conducted to evaluate the association between PRS and CHD risk prediction across hypertension-specific subgroups. We observed that HR was significantly elevated (1.76 vs 1.47, P = 0.014) in the population with hypertension than in those without hypertension. Furthermore, among individuals with hypertension, those with high genetic risk have a higher incidence rate and HR than those with low genetic risk. These findings suggest that the PRS provides stronger CHD risk stratification in the hypertensive population.
The clinical utility of PRS in CHD risk prediction and risk classification was controversial when integrating the CHD PRS into a clinical risk score. Multiple studies [17,18,35,37] have reported improved predictive performance when adding PRS to traditional clinical risk scores, whereas other investigations [19,20,34] found no significant enhancement in prediction accuracy. This discrepancy may reflect differences in study populations, PRS construction methods, or clinical risk score selection. We further investigated the reclassification performance of the addition of PRS to the clinical risk score. Our PRS-enhanced model demonstrated excellent goodness-of-fit with a C-index of 0.74, which was significantly elevated compared with PCE (C-index of 0.72, P = 0.004). Adding the PRS to the clinical ASCVD risk score yielded a category NRI of 10% at three-category clinical ASCVD risk (<7.5%, 7.5%-20% and >20%) and a continuous NRI of 47%. These findings demonstrate that the addition of the PRS improves CHD risk classification beyond the clinical ASCVD risk score.
Similar trends were observed in the hypertensive population; however, the model performance declined slightly, with a reduction in the C-index from 0.74 to 0.71 and in NRI from 10% to 4%. This attenuation might be attributed to the limited sample size of hypertensive participants. Conversely, the C-index and NRI show no changes in the non-hypertensive population. Of note, the NRI would be 1.8% when assessing the reclassification in a two-category clinical ASCVD risk with a threshold of 7.5% in the ARIC cohort [18]. In our three-category risk strata, we observed a striking gradient of longitudinal risk across CHD PRS categories. Our PRS demonstrated a consistent capability to effectively stratify the trajectories of CHD genetic risk within each clinical ASCVD risk category. Notably, hypertensive individuals with high CHD PRS exhibits an elevated incidence of CHD. These findings underscore the PRS-enhanced model refines CHD risk prediction and stratification in hypertensive population.
A primary strength of this work is the excellent performance of our novel CHD PRS and its incorporation into clinical ASCVD risk score, offering substantial improvements in CHD risk prediction and stratification compared with clinical ASCVD risk score. We observed that an HR of 3.68 among those in top 20% of the PRS compared with the remaining 80% in hypertensive population, supporting that our PRS may serve as a risk-enhancing factor for CHD [38]. Furthermore, multiple studies have demonstrated the association of CHD PRS with disease susceptibility in demographic subgroups (e.g., male populations) [35,37], whereas its utility in chronic disease cohorts has not been systematically investigated. Our findings support the potential utility of PRS in enhancing CHD risk prediction among patients with chronic diseases (e.g., hypertension), though further validation is warranted.
Study Limitations
This work has some potential limitations. Firstly, this work is limited to population of European ancestry, therefore further study needs to be conducted in other ethnic populations. Furthermore, previous work has shown that PRS developed and tested based on different populations may experience performance degradation [39]. The variant weights for polygenic risk score were estimated using the CARDIOGRAMplusC4D GWAS which includes 77% of European participants. Even though, the inclusion of other ancestries could affect the estimation of variant weights and attenuate the performance of the polygenic risk score in European population. This can be due to the differences in variant frequencies, as well as the linkage disequilibrium patterns between racial and ethnic populations. Secondly, the ARIC cohort is one of the cohorts in CARDIOGRAMplusC4D, which might lead to an overestimation of the performance of the polygenic risk score. Thirdly, the limited sample size in our study may have led to an overestimation of both CHD risk and incidence rates. For instance, while the general population prevalence of CHD is 7.2%, our cohort exhibited a higher prevalence of 12.5%. This potential overestimation is further illustrated by the subgroup analysis: among the 157 individuals with both high lifetime clinical risk and high genetic risk, the observed CHD incidence rate exceeded 70%. Fourthly, the performance of our PRS-enhanced risk model may differ across varying ASCVD 10-year CHD risk thresholds, therefore further study needs to be conducted. Fifthly, as this study is restricted to participants aged 44-65 years, the findings may not be generalizable to younger (< 44 years) or older (> 65 years) populations. Genetic testing at an earlier age may further improve risk prediction accuracy, but this hypothesis requires validation in future studies. Finally, present studies focused on adding PRS to clinical risk factors and ignored the impacts of socio-demographic, family history, lifestyle, and other environmental variables. Previous works [8,40,41] have shown that those variables have significant impacts on disease prediction.
Conclusions
We proposed a CHD PRS that has good performance in risk stratification of incident CHD beyond clinical ASCVD risk score. Furthermore, we observed there were interaction of hypertension on the PRS for predicting CHD risk. The PRS may provide a valuable CHD risk stratification guidance to identify hypertensive patients who should be initiated or given intensive lifestyle changes and drug treatments.
Supplementary Materials
The following supporting information can be downloaded at the website of this paper posted on Preprints.org.
Author Contributions
Conceptualization, S.Y. and Y.Q.; Methodology, S.Y.; Software, S.Y.; Validation, S.Y.; Formal Analysis, S.Y and Y.Q..; Investigation, S.Y.; Resources, S.Y. and Y.Q.; Data Curation, S.Y. and Y.Q.; Writing – Original Draft Preparation, S.Y.; Writing – Review & Editing, Y.-Q.; Visualization, S.Y.; Supervision, Y.-Q.; Project Administration, Y.-Q.; Funding Acquisition, Y.-Q.
Funding
This research was funded by National Key R&D Program of China grant number [2023YFF1205101].
Acknowledgments
The authors are grateful to ARIC for access genotype and clinical data, and to CARDIoGRAMplusC4D Consortium for access to GWAS summary statistics data.
Data Availability Statement
GWAS summary statistics data is available at https://cvd.hugeamp.org/. The ARIC phenotypic and genetic data are available on the database of Genotypes and Phenotypes (dbGaP; study accession: phs000090.v8.p2). The R package bigsnpr used to conduct P+T and LDpred2 algorithms is available at https://github.com/privefl/bigsnpr. The software PRS-cs is available at https://github.com/getian107/PRScs.
Conflicts of Interest
The authors declare no conflict of interest.
References
- Wang, H.; Naghavi, M.; Allen, C.; et al. Global, regional, and national life expectancy, all-cause mortality, and cause-specific mortality for 249 causes of death, 1980–2015: a systematic analysis for the Global Burden of Disease Study 2015. Lancet 2016, 388, 1459–1544. [Google Scholar] [CrossRef]
- Roth, G.A.; Mensah, G.A.; Johnson, C.O.; et al. Global Burden of Cardiovascular Diseases and Risk Factors, 1990-2019: Update From the GBD 2019 Study. J Am Coll Cardiol. 2020, 76, 2982–3021. [Google Scholar] [CrossRef]
- Damen, J.A.; Hooft, L.; Schuit, E.; et al. Prediction models for cardiovascular disease risk in the general population: systematic review. BMJ. 2016, 353, i2416. [Google Scholar] [CrossRef]
- Goff, D.C., Jr.; Lloyd-Jones, D.M.; Bennett, G.; et al. 2013 ACC/AHA guideline on the assessment of cardiovascular risk: a report of the American College of Cardiology/American Heart Association Task Force on Practice Guidelines. J Am Coll Cardiol. 2014, 63, 2935–2959. [Google Scholar] [CrossRef]
- SCORE2 working group; ESCCardiovascular risk collaboration. SCORE2 risk prediction algorithms: new models to estimate 10-year risk of cardiovascular disease in Europe. Eur Heart J. 2021, 42, 2439–2454. [Google Scholar] [CrossRef]
- Hippisley-Cox, J.; Coupland, C.; Brindle, P. Development and validation of QRISK3 risk prediction algorithms to estimate future risk of cardiovascular disease: prospective cohort study. BMJ 2017, 357, j2099. [Google Scholar] [CrossRef]
- Muntner, P.; Colantonio, L.D.; Cushman, M.; et al. Validation of the atherosclerotic cardiovascular disease pooled cohort risk equations. JAMA 2014, 311, 1406–1415. [Google Scholar] [CrossRef] [PubMed]
- Khera, A.V.; Kathiresan, S. Genetics of coronary artery disease: discovery, biology and clinical translation. Nat Rev Genet 2017, 18, 331–344. [Google Scholar] [CrossRef] [PubMed]
- Kullo, I.J.; Ding, K. Mechanisms of disease: the genetic basis of coronary heart disease. Nat Clin Pract Cardiovasc Med 2007, 4, 558–569. [Google Scholar] [CrossRef] [PubMed]
- Wang, F.; Ghanzouri, I.; Leeper, N.J.; Tsao, P.S.; Ross, E.G. Development of a polygenic risk score to improve detection of peripheral artery disease. Vasc Med 2022, 27, 219–227. [Google Scholar] [CrossRef]
- Marston, N.A.; Garfinkel, A.C.; Kamanu, F.K.; et al. A polygenic risk score predicts atrial fibrillation in cardiovascular disease. Eur Heart J 2023, 44, 221–231. [Google Scholar] [CrossRef] [PubMed]
- Li, Y.; Bernstein, C.N.; Xu, W.; et al. Polygenic risk and causal inference of psychiatric comorbidity in inflammatory bowel disease among patients with European ancestry. J Transl Med 2022, 20, 43. [Google Scholar] [CrossRef]
- Yu, Z.; Jin, J.; Tin, A.; et al. Polygenic Risk Scores for Kidney Function and Their Associations with Circulating Proteome, and Incident Kidney Diseases. J Am Soc Nephrol 2021, 32, 3161–3173. [Google Scholar] [CrossRef]
- Euesden, J.; Lewis, C.M.; O’Reilly, P.F. PRSice: polygenic risk score software. Bioinformatics 2015, 31, 1466–1468. [Google Scholar] [CrossRef]
- Inoyue, M.; Abraham, G.; Nelson, C.; et al. Genomic risk prediction of coronary artery disease in 480,000 adults: implications for primary prevention. J Am Coll Cardiol 2018, 72, 1883–1893. [Google Scholar] [CrossRef]
- Khera, A.V.; Chaffin, M.; Aragam, K.G.; et al. Genome-wide polygenic scores for common diseases identify individuals with risk equivalent to monogenic mutations. Nat Genet 2018, 50, 1219–1224. [Google Scholar] [CrossRef]
- Weale, M.; Riveros-McKay, F.; Selzam, S.; et al. Validation of an integrated risk tool, including polygenic risk score, for atherosclerotic cardiovascualr disease in multiple ethnicities and ancestries. Am J Cardiol 2021, 148, 157–164. [Google Scholar] [CrossRef]
- Mosley, J.D.; Gupta, D.K.; Tan, J.; et al. Predictive Accuracy of a Polygenic Risk Score Compared With a Clinical Risk Score for Incident Coronary Heart Disease. JAMA 2020, 323, 627–635. [Google Scholar] [CrossRef] [PubMed]
- Marston, N.A.; Pirruccello, J.P.; Melloni, G.E.M.; et al. Predictive Utility of a Coronary Artery Disease Polygenic Risk Score in Primary Prevention. JAMA Cardiol 2023, 8, 130–137. [Google Scholar] [CrossRef]
- Khan, S.S.; Post, W.S.; Guo, X.; et al. Coronary Artery Calcium Score and Polygenic Risk Score for the Prediction of Coronary Heart Disease Events. JAMA 2023, 329, 1768–1777. [Google Scholar] [CrossRef] [PubMed]
- Li, M.; Zhou, M.; Yang, Y.; et al. Multi-trajectories of systolic and diastolic hypertension and coronary heart disease in middle-aged and older adults. Front Public Health 2022, 10, 1017727. [Google Scholar] [CrossRef]
- The ARIC investigators. The atherosclerosis risk in communities (ARIC) study: design and objectives. The ARIC investigators. Am J Epidemiol 1989, 129, 687–702. [Google Scholar] [CrossRef]
- Chang, C.C.; Chow, C.C.; Tellier, L.C.; et al. Second-generation PLINK: rising to the challenge of larger and richer datasets. Gigascience 2015, 4, 7. [Google Scholar] [CrossRef]
- Ellinor, P.T.; Lunetta, K.L.; Albert, C.M.; et al. Meta-analysis identifies six new susceptibility loci for atrial fibrillation. Nat Genet 2012, 44, 670–675. [Google Scholar] [CrossRef] [PubMed]
- Howie, B.N.; Donnelly, P.; Marchini, J. A flexible and accurate genotype imputation method for the next generation of genome-wide association studies. PLoS Genet 2009, 5, e1000529. [Google Scholar] [CrossRef] [PubMed]
- The 1000 Genomes Project Consortium. A map of human genome variation from population-scale sequencing. Nature 2010, 467, 1061–1073. [Google Scholar] [CrossRef]
- Aragam, K.; Jiang, T.; Goel, A.; et al. Discovery and systematic characterization of risk variants and genes for coronary artery disease in over a million participants. Nat Genet 2022, 54, 1803–1815. [Google Scholar] [CrossRef]
- Choi, S.W.; Mak, T.S.; O’Reilly, P.F. Tutorial: a guide to performing polygenic risk score analyses. Nat Protoc 2022, 15, 2759–2772. [Google Scholar] [CrossRef] [PubMed]
- Privé, F.; Arbel, J.; Vilhjálmsson, B.J. LDpred2: better, faster, stronger. Bioinformatics 2020, 36, 5424–5431. [Google Scholar] [CrossRef]
- Ge, T.; Chen, C.Y.; Ni, Y.; et al. Polygenic prediction via Bayesian regression and continuous shrinkage priors. Nat Commun 2019, 10, 1776. [Google Scholar] [CrossRef]
- Mega, J.L.; Stitziel, N.O.; Smith, J.G.; et al. Genetic risk, coronary heart disease events, and the clinical benefit of statin therapy: an analysis of primary and secondary prevention trials. Lancet 2015, 385, 2264–2271. [Google Scholar] [CrossRef]
- Demler, O.V.; Paynter, N.P.; Cook, N.R. Tests of calibration and goodness-of-fit in the survival setting. Stat Med 2015, 34, 1659–1680. [Google Scholar] [CrossRef]
- Hindorff, L.A.; Sethupathy, P.; Junkins, H.A.; et al. Potential etiologic and functional implications of genome-wide association loci for human diseases and traits. Proc Natl Acad Sci U S A 2009, 106, 9362–9367. [Google Scholar] [CrossRef]
- Aday, A.W.; Bagheri, M.; Vaitinadin, N.S.; et al. Polygenic risk score in comparison with C-reactive protein for predicting incident coronary heart disease. Atherosclerosis 2023, 379, 117194. [Google Scholar] [CrossRef] [PubMed]
- King, A.; Wu, L.; Deng, H.W.; et al. Polygenic risk score improves the accuracy of a clinical risk score for coronary artery disease. BMC Med 2022, 20, 385. [Google Scholar] [CrossRef]
- Turin, T.; Okamura, T.; Afzal, A.; et al. Impact of hypertension on the lifetime risk of coronary heart disease. Hypertens Res 2016, 39, 548–551. [Google Scholar] [CrossRef]
- Manikpurage, H.D.; Eslami, A.; Perrot, N.; et al. Polygenic Risk Score for Coronary Artery Disease Improves the Prediction of Early-Onset Myocardial Infarction and Mortality in Men. Circ Genom Precis Med 2021, 14, e003452. [Google Scholar] [CrossRef]
- Yeboah, J.; McClelland, R.L.; Polonsky, T.S.; et al. Comparison of novel risk markers for improvement in cardiovascular risk assessment in intermediate-risk individuals. JAMA 2012, 308, 788–795. [Google Scholar] [CrossRef]
- Duncan, L.; Shen, H.; Gelaye, B.; et al. Analysis of polygenic risk score usage and performance in diverse human populations. Nat Commun 2019, 10, 3328. [Google Scholar] [CrossRef] [PubMed]
- Wang, N.; Sun, Y.; Zhang, H.; et al. Long-term night shift work is associated with the risk of atrial fibrillation and coronary heart disease. Eur Heart J 2021, 42, 4180–4188. [Google Scholar] [CrossRef] [PubMed]
- Hasbani, N.R.; Ligthart, S.; Brown, M.R.; et al. American Heart Association’s Life’s Simple 7: Lifestyle Recommendations, Polygenic Risk, and Lifetime Risk of Coronary Heart Disease. Circulation 2022, 145, 808–818. [Google Scholar] [CrossRef] [PubMed]
Figure 1.
The design and flowchart of this study. To select an optimal PRS for CHD prediction, we evaluated the performance of five PRSs derived from summary statistics from the CARDIoGRAMplusC4D and existing PRS obtained from Khera et al. Lastly, we evaluated the performance of a clinical risk model (i.e., PCE) in identifying risk of CHD and a clinical risk model combined with the PRS (i.e., the PRS-enhanced clinical risk model). CARDIoGRAMplusC4D, the Coronary Artery Disease Genome-Wide Replication and Meta-analysis (CARDIoGRAM) plus the Coronary Artery Disease (C4D) Genetics; GWAS, genome-wide association analysis; CHD, coronary heart disease; PRS, polygenic risk score.
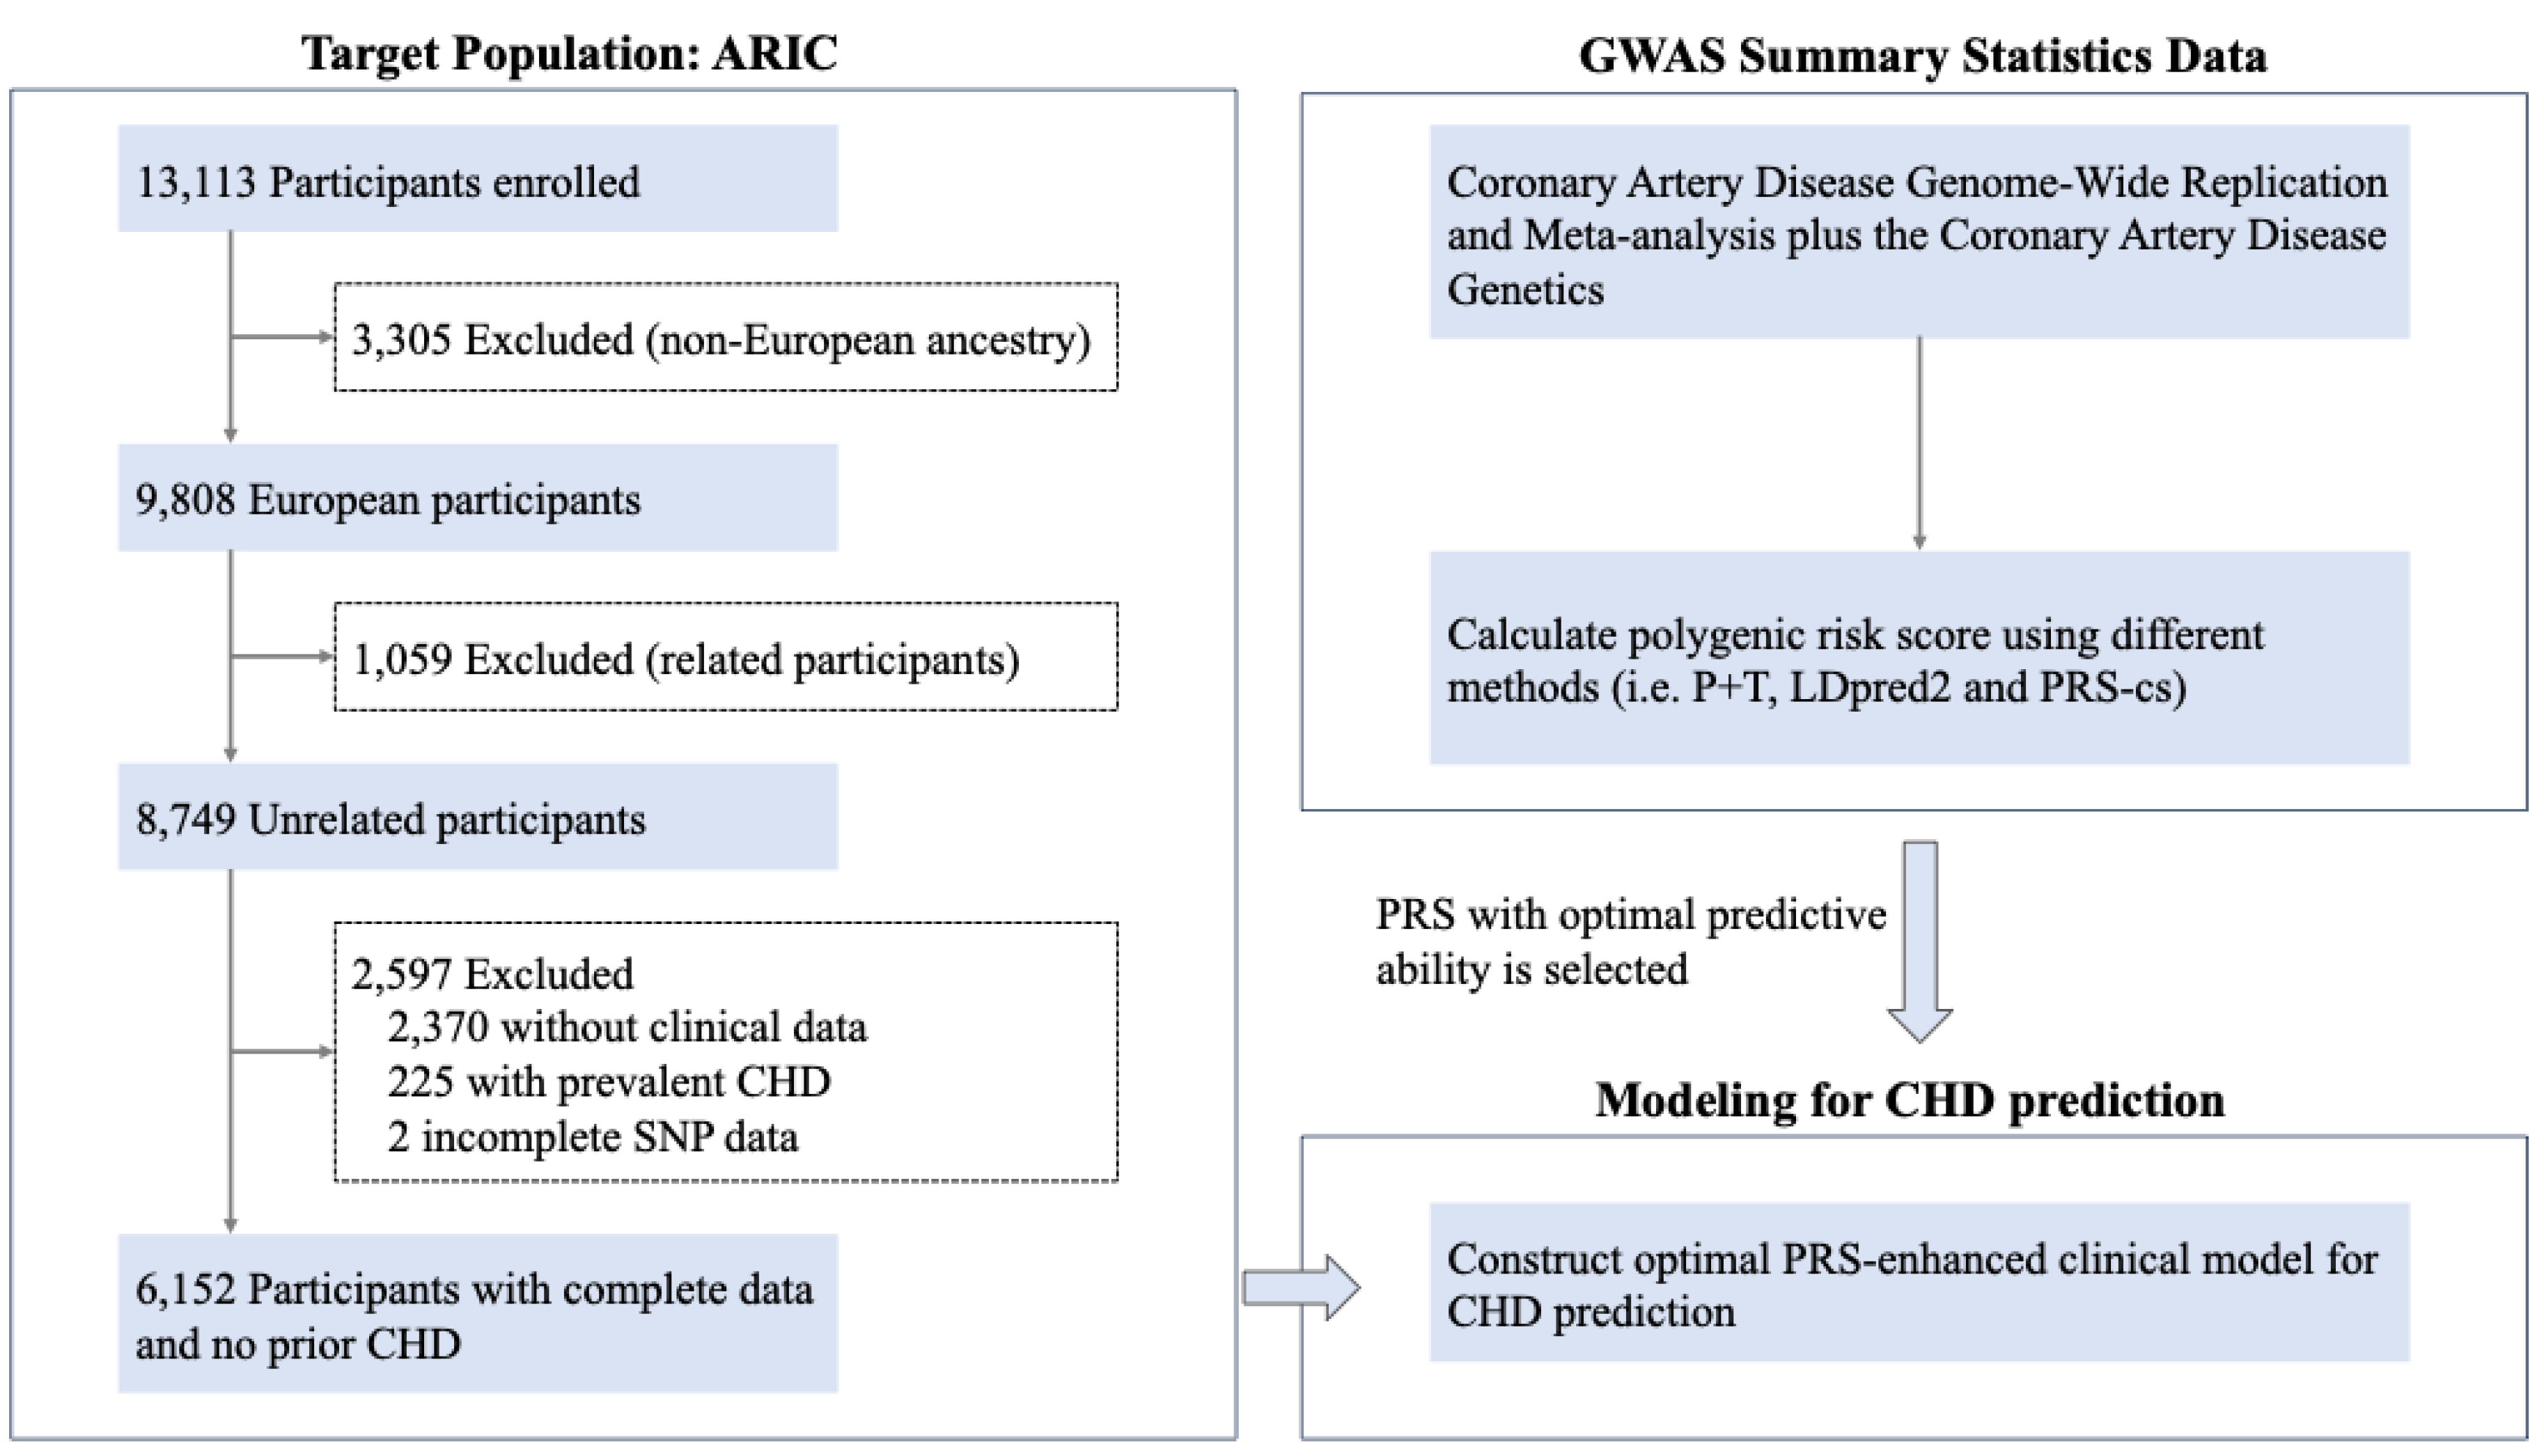
Figure 2.
Cumulative incidence curves for CHD across polygenic risk categories. A-C, Cumulative incidence curves were obtained from Kaplan-Meier estimates for CHD PRS in all participants (A), participants with hypertension (B) and participants without hypertension (C). Cox proportional hazards model was used to estimate the HR (95% CI) and the cumulative risk of CHD adjusted for sex and the first ten principal components with age as the time scale. Polygenic risk categories: low (bottom quintile), intermediate (2nd–4th quintile), or high (top quintile) risk according to quintiles of the CHD PRS. CHD, coronary heart disease; HR, hazard ratio.
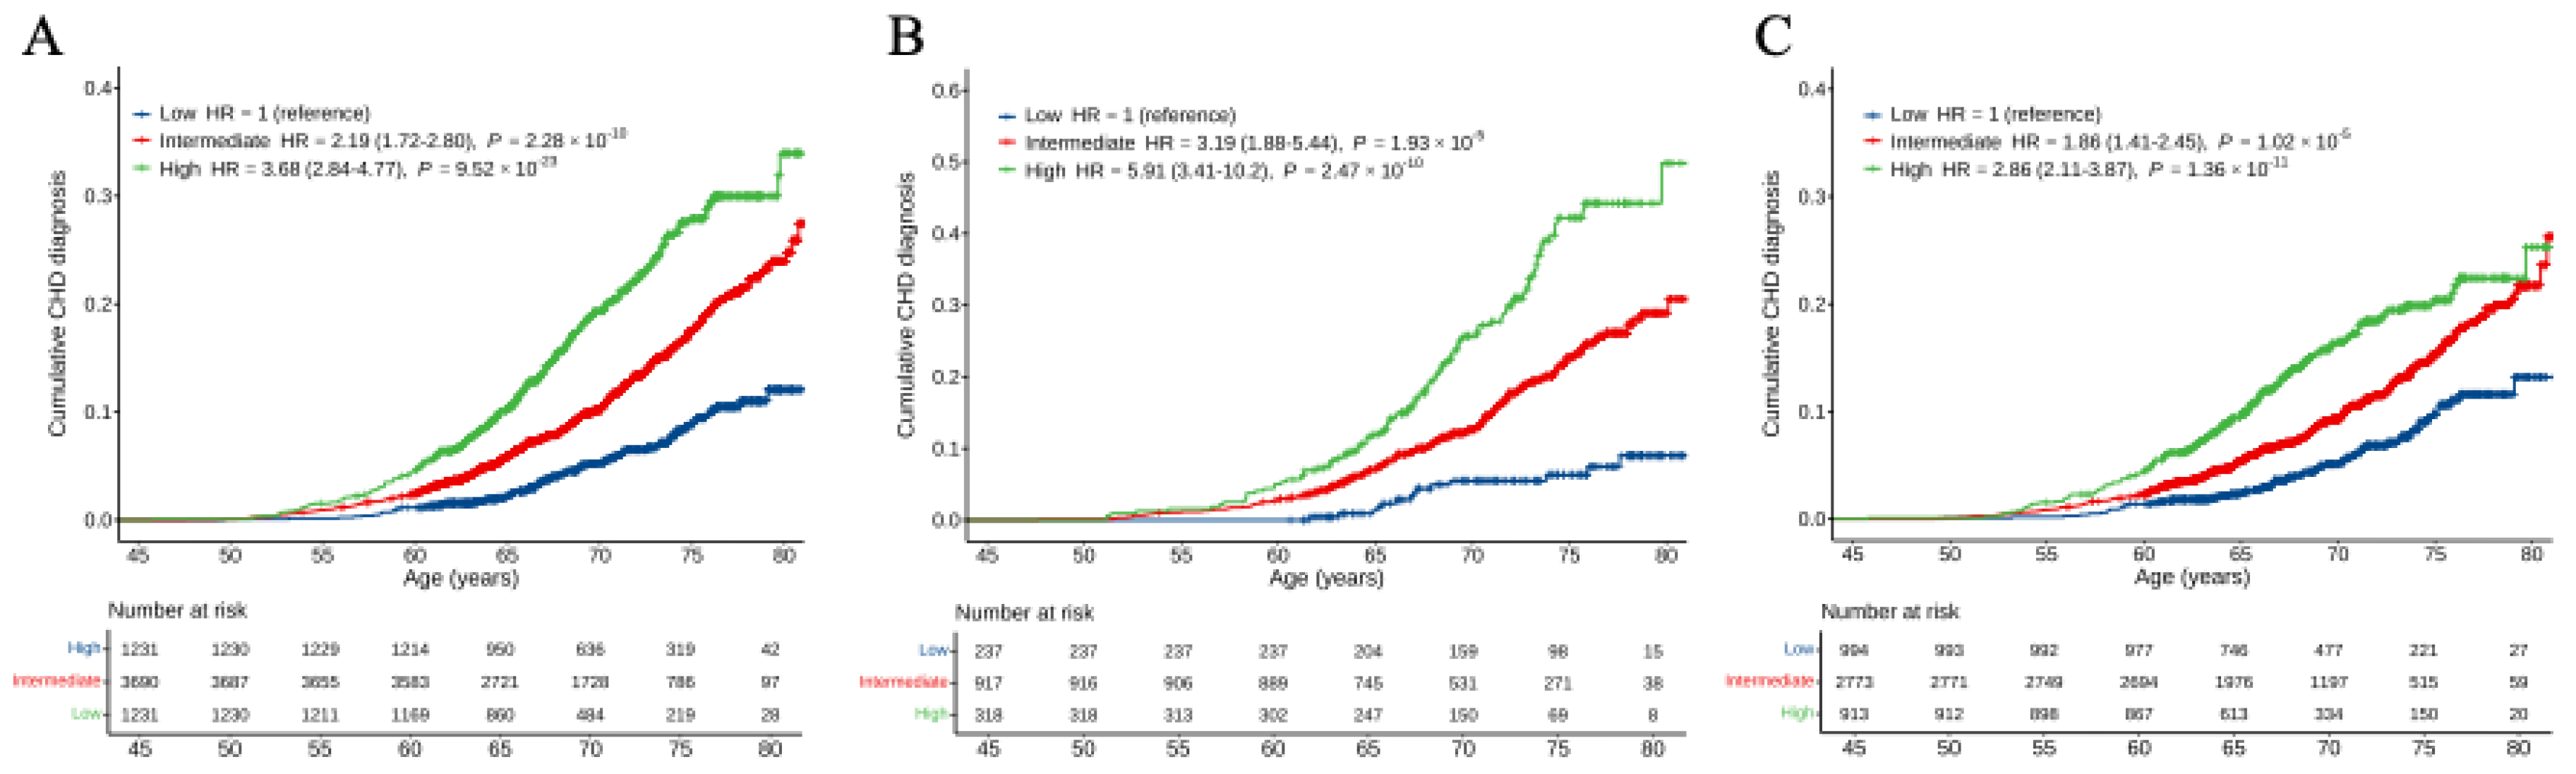
Figure 3.
HR for CHD per 1-SD increase in PRS by subgroups. HR and 95% confidence interval were estimated using Cox proportional hazards model with follow-up time as time scale (adjusted for age, sex, the first 10 principal components) in different subgroups. CHD, coronary heart disease; CI, confidence interval; HR, hazard ratio; SD, standard deviation; CKD, congestive kidney disease; CHF, coronary heart failure.
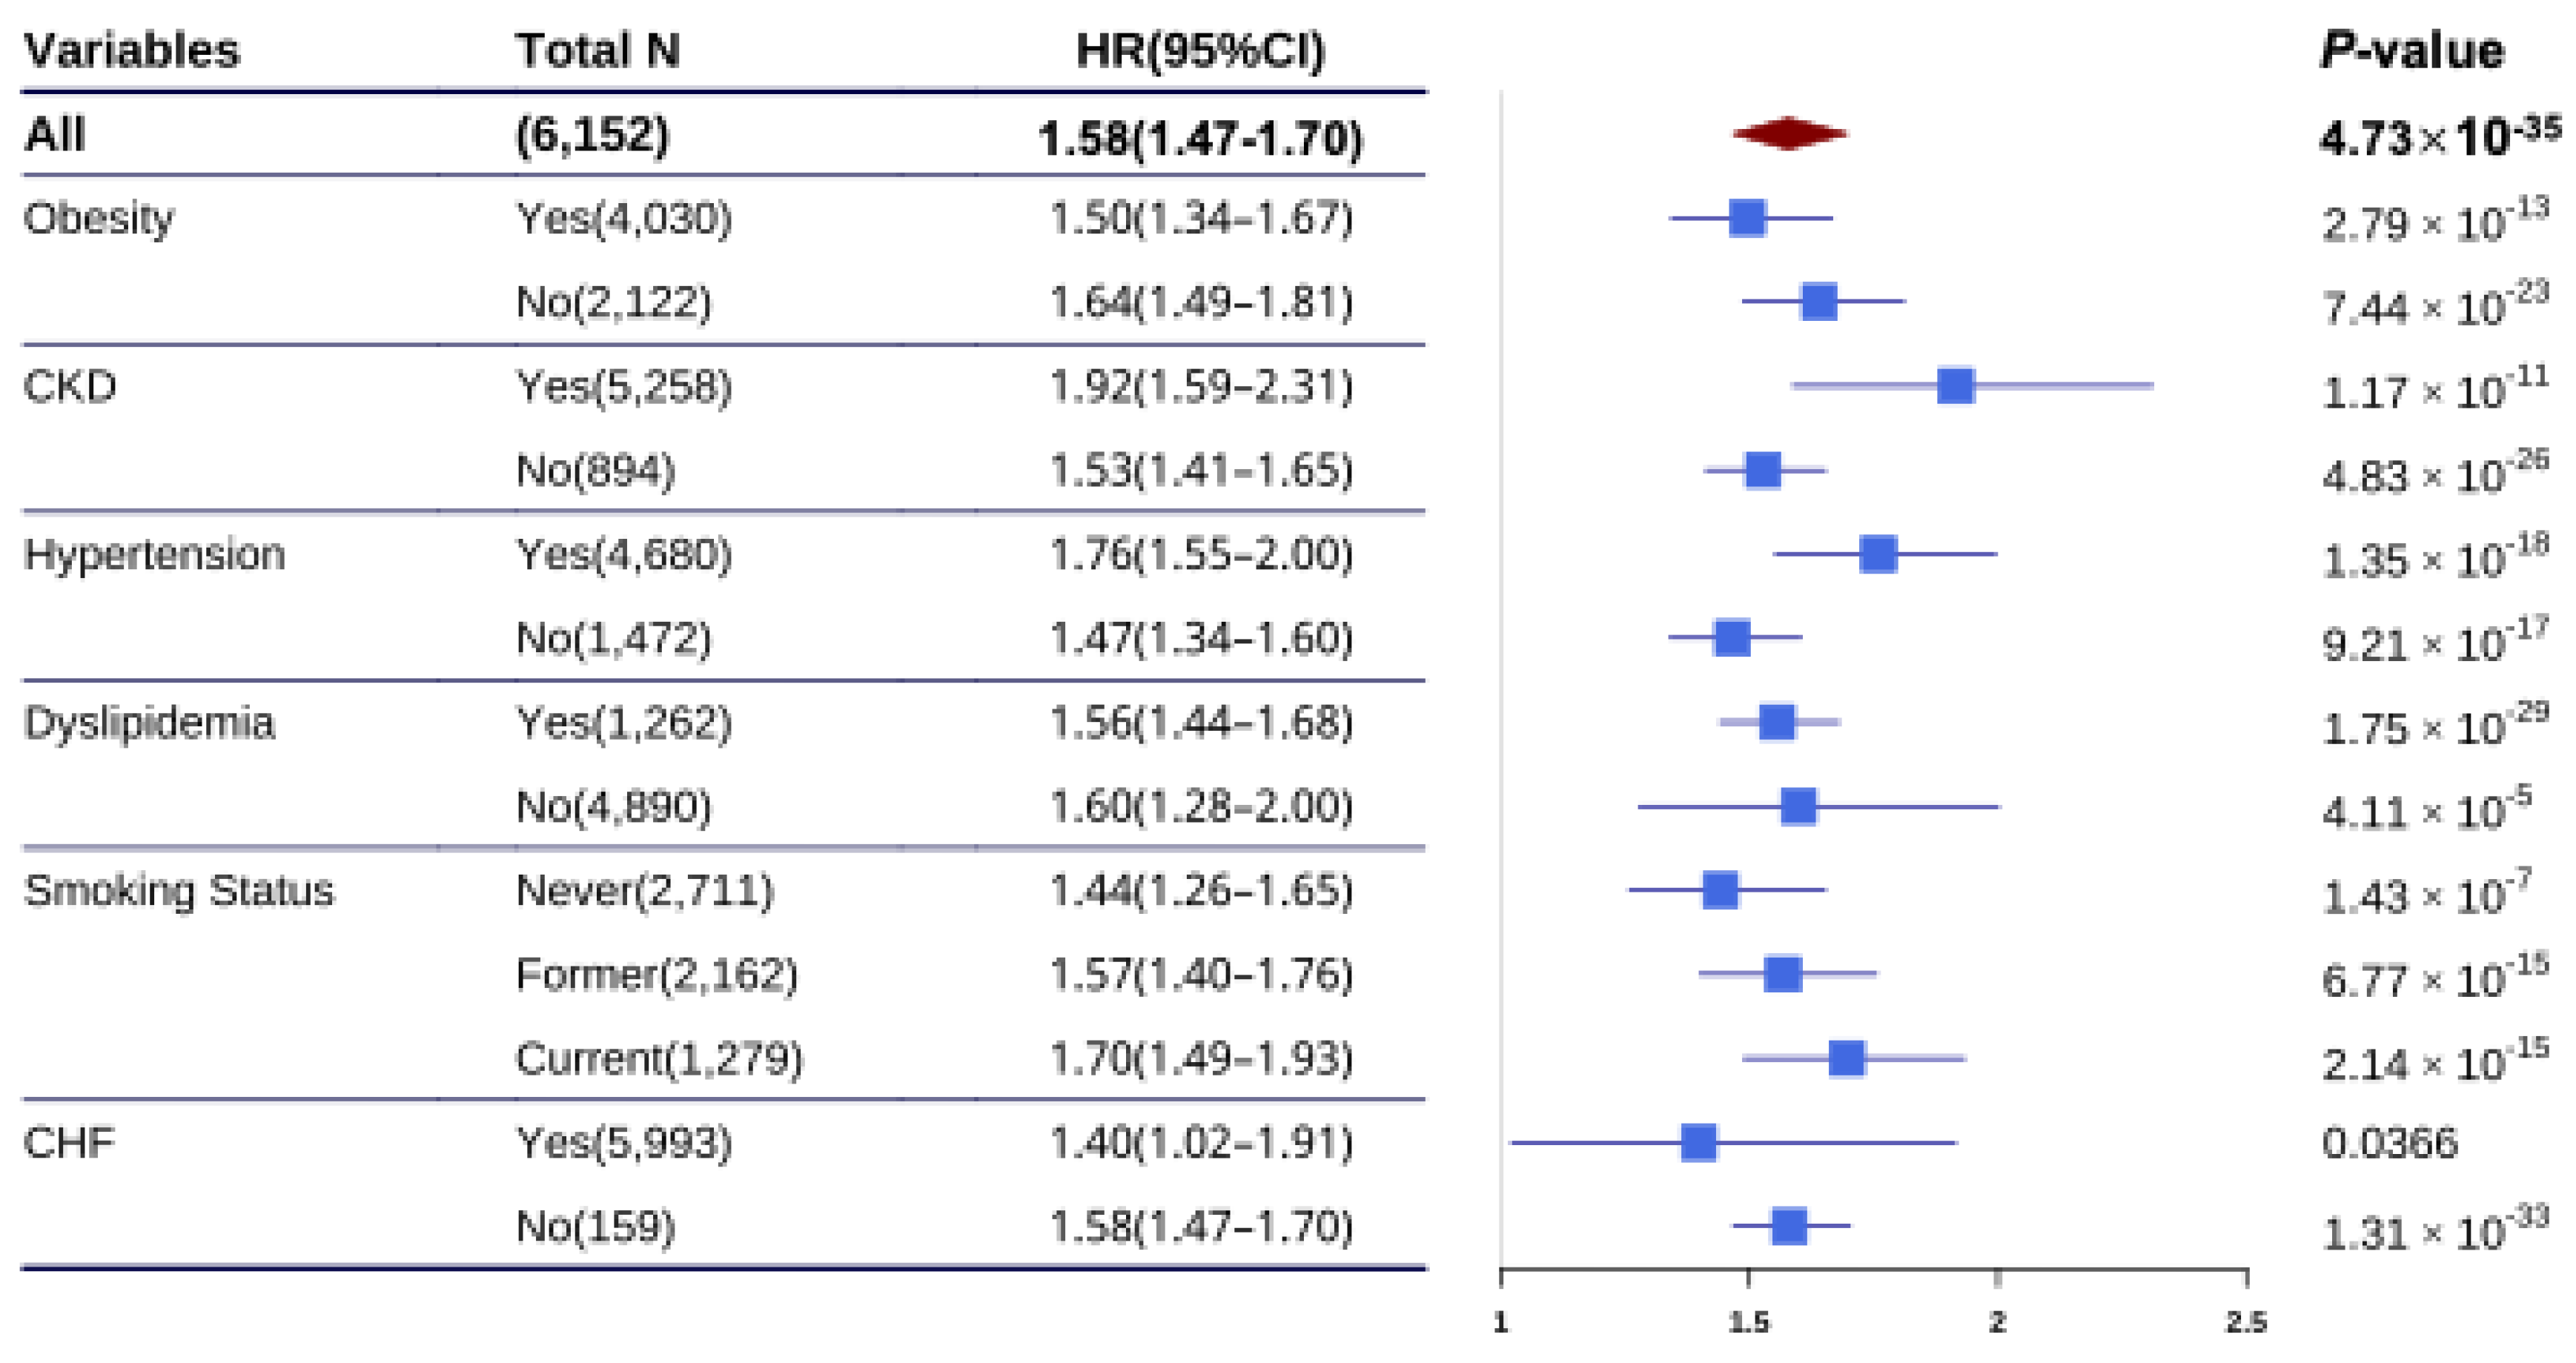
Figure 4.
Ten-year and lifetime risk of CHD according to clinical ASCVD and polygenic risk categories A, Ten-year risk of CHD obtained from the clinical ASCVD risk score and CHD PRS model with follow-up time as the time scale. B, Lifetime risk of CHD (till 80 years of age) obtained from the clinical ASCVD risk score and CHD PRS model with age as the time scale. Participants were stratified into low (<7.5%), intermediate (7.5%-20%) and high (>20%) ASCVD 10-year risk of CHD categories, and low (bottom quintile), intermediate (the second to fourth quintile) and high (top quintile) PRS risk categories. Within each clinical risk categories, increased genetic risk conferred significantly increased risk of CHD (P-trend <0.001 within each clinical risk categories). CHD, coronary heart disease; PRS, polygenic risk score; ASCVD, arteriosclerotic cardiovascular disease.
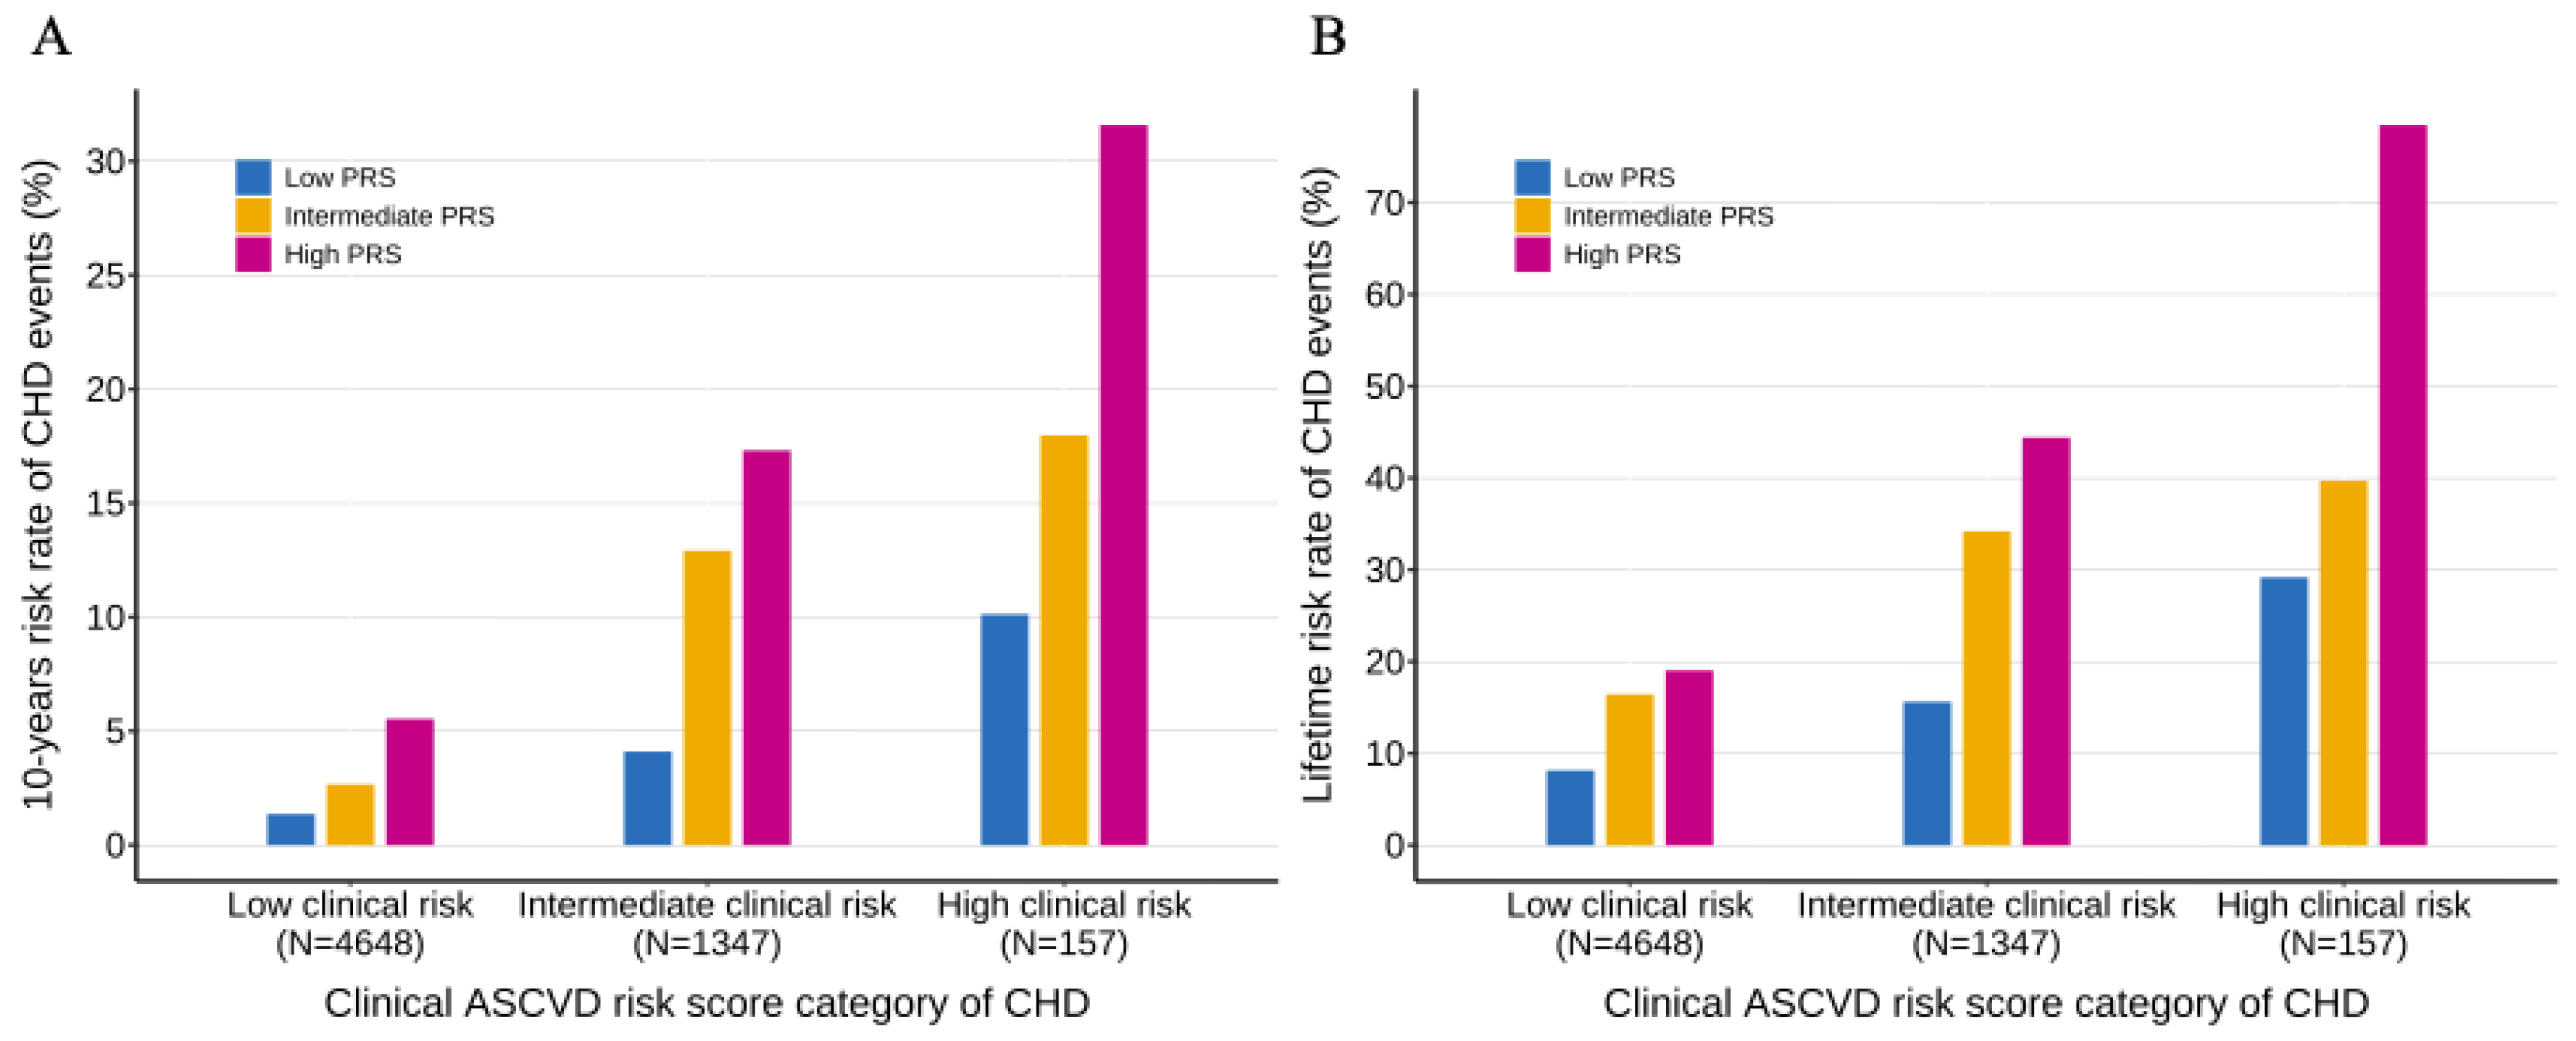

Table 1.
Baseline characteristics of study cohort.
| Baseline characteristics | Overall N = 6,152a |
CHD events N = 767a |
Non-CHD events N = 5,385a |
P-value b |
|---|---|---|---|---|
| Age, years | 54.02 (5.63) | 55.37 (5.41) | 53.83 (5.64) | 8.21×10⁻¹³ |
| Gender, N(%) | 3.26×10-52 | |||
| Female | 3,400 (55.27%) | 228 (29.73%) | 3,172 (58.90%) | |
| Male | 2,752 (44.73%) | 539 (70.27%) | 2,213 (41.10%) | |
| HDL-C, mg/dL | 51.94 (16.61) | 43.93 (13.07) | 53.08 (16.75) | 7.45×10-55 |
| LDL-C, mg/dL | 136.17 (36.95) | 147.23 (36.80) | 134.60 (36.71) | 4.31×10⁻²⁰ |
| Systolic blood pressure, mmHg | 117.70 (16.30) | 122.88 (17.46) | 116.96 (15.99) | 2.58×10⁻¹⁹ |
| Diastolic blood pressure, mmHg | 71.65 (9.77) | 73.16 (10.79) | 71.43 (9.59) | 4.10×10-06 |
| Diabetes, N(%) | 394 (6.40%) | 126 (16.43%) | 268 (4.98%) | 8.42×10⁻³⁴ |
| Smoking status, N(%) | 1.24×10⁻¹⁵ | |||
| Current | 1,279 (20.79%) | 207 (26.99%) | 1,072 (19.91%) | |
| Former | 2,162 (35.14%) | 328 (42.76%) | 1,834 (34.06%) | |
| Never | 2,711 (44.07%) | 232 (30.25%) | 2,479 (46.04%) | |
| Hypertension, N(%) | 1,472 (23.93%) | 281 (36.64%) | 1,191 (22.12%) | 1.17×10⁻¹⁸ |
| Antihypertensives, N(%) | 1,056 (17.17%) | 194 (25.29%) | 862 (16.01%) | 1.76×10⁻¹⁰ |
| Obesity, N(%) | 2,122 (34.49%) | 349 (45.50%) | 1,773 (32.92%) | 7.09×10⁻¹² |
| Dyslipidemia, N(%) | 4,890 (79.49%) | 690 (89.96%) | 4,200 (77.99%) | 1.61×10⁻¹⁴ |
| CKD, N(%) | 894 (14.53%) | 120 (15.65%) | 774 (14.37%) | 0.35 |
| CHF, N(%) | 159 (2.58%) | 34 (4.43%) | 125 (2.32%) | 5.64×10-04 |
| Stroke, N(%) | 84 (1.37%) | 11 (1.43%) | 73 (1.36%) | 0.86 |
| Follow up time, years | 15.47 (2.81) | 10.14 (4.41) | 16.23 (1.28) | <0.001 |
Abbreviations: CHD, coronary heart disease; HDL-C: high-density lipoprotein cholesterol; LDL-C: low-density lipoprotein cholesterol; eGFR, estimated Glomerular Filtration Rate; CKD, chronic kidney disease; CHF, congestive heart failure. a Mean (SD); n (%). b Wilcoxon rank sum test for continuous variable; Pearson’s Chi-squared test for categorical variable.
Table 2.
Hazard ratios of CHD events for the PRS (per 1-SD increase) and selected PRS strata.
| PRS | Model 1 | Model 2 | ||
|---|---|---|---|---|
| HR (95%CI) | P-value | HR (95%CI) | P-value | |
| Continuous per SD increment |
1.58(1.47, 1.70) | 4.73×10⁻³⁵ | 1.51(1.40, 1.62) | 1.27×10⁻²⁷ |
| Top 20% | 2.53(2.00, 3.21) | 1.58×10⁻¹⁴ | 2.37(1.87, 3.01) | 1.26×10⁻¹² |
| Top 10% | 2.75(1.95, 3.88) | 8.80×10-09 | 2.49(1.76, 3.51) | 2.38×10-07 |
| Top 5% | 3.32(1.96, 5.64) | 8.88×10-06 | 3.07(1.80, 5.22) | 3.49×10-05 |
| Top 2% | 6.14(1.97, 19.1) | 0.00172 | 5.86(1.88, 18.2) | 0.00223 |
HR and 95% CI derived from Cox proportional hazards models; model 1 adjusted for age, sex, and first ten principal components; model 2 adjusted for age, sex, and first ten principal components, diabetes, LDL-C, HDL-C, SBP, DBP, hypertension, antihypertension and smoking status. HR, hazards ratios; CI, confidence interval; PRS, polygenic risk score; CHD, coronary heart disease; HDL-C: high-density lipoprotein cholesterol; LDL-C: low-density lipoprotein cholesterol; SBP, systolic blood pressure; DBP, diastolic blood pressure.
Table 3.
Net reclassification improvement after adding CHD PRS to PCE ASCVD risk score.
| PCE model | PRS-enhanced model | |||
|---|---|---|---|---|
| <7.5% | 7.5%-20% | >20% | Total | |
| CHD | ||||
| <7.5% | 126 | 45 | 1 | 172 |
| 7.5%-20% | 20 | 102 | 17 | 139 |
| >20% | 0 | 4 | 18 | 22 |
| Total | 146 | 151 | 36 | 333 |
| Non-CHD | ||||
| <7.5% | 4,401 | 337 | 1 | 4,739 |
| 7.5%-20% | 302 | 605 | 67 | 974 |
| >20% | 1 | 17 | 54 | 72 |
| Total | 4,704 | 959 | 122 | 5,785 |
| Net reclassified improvement | ||||
| NRI for CHD (95%CI) | 0.12(0.06, 0.17) | |||
| NRI for Non-CHD (95%CI) | -0.01(-0.02, -0.01) | |||
| NRI (95%CI) | 0.10(0.04, 0.16) | |||
| Continuous NRI for CHD (95%CI) | 0.26(0.14, 0.37) | |||
| Continuous NRI for Non-CHD (95%CI) | 0.21(0.18, 0.24) | |||
| Continuous NRI (95%CI) | 0.47(0.34, 0.57) | |||
In the upper part, columns and rows refer to categories of 10-year predicted risk, and the numbers represent the counts of individuals assigned to the indicated risk category. The standard CHD model adjusted for sex, age, the first ten principal components, and the low (<7.5%), intermediate (7.5%-20%) and high (>20%) risk categories are based on the ASCVD risk score. NRI, net reclassification improvement; CHD, coronary heart disease; CI, confidence interval; PRS, polygenic risk score; NRI, net reclassified improvement; ASCVD, arteriosclerotic cardiovascular disease.
Disclaimer/Publisher’s Note: The statements, opinions and data contained in all publications are solely those of the individual author(s) and contributor(s) and not of MDPI and/or the editor(s). MDPI and/or the editor(s) disclaim responsibility for any injury to people or property resulting from any ideas, methods, instructions or products referred to in the content. |
© 2025 by the authors. Licensee MDPI, Basel, Switzerland. This article is an open access article distributed under the terms and conditions of the Creative Commons Attribution (CC BY) license (http://creativecommons.org/licenses/by/4.0/).
Copyright: This open access article is published under a Creative Commons CC BY 4.0 license, which permit the free download, distribution, and reuse, provided that the author and preprint are cited in any reuse.


