
Submitted:
07 October 2025
Posted:
08 October 2025
You are already at the latest version
Abstract
Background/Aim: Late-onset Fuchs’ endothelial corneal dystrophy (FECD) is a hereditary, progressive, bilateral and irreversible disorder that is characterized by thickening of Descemet's membrane, microscopic collagenous protuberances known as guttae and accelerated loss of corneal endothelial cells. Patients initially complain of blurred vision and as the disease progresses, painful epithelial edema develops. Untreated cases of FECD often result in blindness and then, the only treatment is corneal transplantation. DNA polymorphisms in many genes have been implicated, among them TCF4 on chromosome 18q encoding a transcription factor protein E2-2, which is involved in regulating cellular growth and differentiation in the cornea. In our previous published study, we confirmed the association of an intronic TCF4 SNP (rs613872) with the disease in our population. The purpose of this present study is to investigate further into another intronic point of interest in the same gene, the CTG18.1 trinucleotide repeat expansion. Methods: DNA was isolated from EDTA blood from a well-ascertained group of 36 Greek patients with FECD (Krachmer scale ≥2) and 58 healthy individuals, age- and sex-matched after obtaining their informed consent. STR-PCR and triplet-repeat primed PCR (TP-PCR) were performed and followed gel electrophoresis and fragment analysis in an ABI SeqStudio genetic analyzer. Our real-time qPCR genotyping method was used for the SNP in the LightCycler (Roche). Statistical analysis of both genetic results was performed with SPSS and SNPStats. Results: The TCF4 expansion method was validated adequately and a cost-effective diagnostic algorithm is proposed. An expanded allele was defined as having over 40 trinucleotide repeats. 20 out of 36 patients (56%) possessed at least one expanded allele compared to only 3 out of 58 healthy controls [5%, odds ratio=19.85 (95% C.I.=5.23-75.29)]. The frequency of TCF4 risk G allele was increased to 40% in patients with FECD compared to 17% in healthy subjects [odds ratio=3.59 (95% C.I.= 1.68-7.69)]. Conclusion: The need for an international effort for TCF4 triplet repeat method standardization is stressed along with the provision of suitable reference materials. Since 58.4% of the FECD patients possessed a range of 2-4 risk alleles in both TCF4 loci, we conclude that TCF4 is strongly and statistically associated with late-onset FECD in the Greek population. The missing heritability could be attributed to other genes that deserve further attention in the future.
Keywords:
FECD
; TCF4 gene
; trinucleotide repeat expansion
; SNP
; genetic profile
; molecular diagnosis
; prognostic markers
1. Introduction
Fuchs' endothelial corneal dystrophy (FECD) is a bilateral disease of the innermost layer of the cornea that accounts at 3-11% of elderly population and ranks first in causes of corneal transplantation worldwide [1,2,3]. FECD is a genetically complex, female predominant disorder that gradually leads to decrease in visual acuity and blindness in latter stages [3,4]. Its cytological picture is characterized by progressive loss of corneal endothelial cells and formation of guttae that begins in the center of cornea and radiates towards the periphery. Endothelial loss triggers proliferation and migration of cells that leads to abnormalities in size (polymegalism) and number (pleomorphism) which is visualized with specular microscopy as a thickening of Descemet’s membrane (DM) and guttate excrescences on DM. Gradual failure of the corneal endothelial pump and secondary corneal edema affects vision quality, whilst guttae induces visual disturbances and provokes contrast sensitivity [1,5,6]. Therapeutic strategies vary depending on the stage and the progression of disease. Conservative management with topical medications is effective at early stages, whereas decreased visual acuity and endothelial decompensation suggests keratoplasty. Corneal transplantation is considered the optional treatment at severe cases, and Descemet Stripping Automated Keratoplasty (DSAEK) surgical method is most of the times, successful [7]. Nevertheless, the risk for transplant failure and emerging precision medicine, highlight the need to advocate for a less-invasive and effective targeted therapy based on genetic signature [6,7,8,9,10].
Last decades, molecular diagnostics have provided novel insights into the pathogenic mechanisms that are involved in FECD. Unraveling the genetic and molecular nature of FECD, is a pass-key for an early and accurate diagnosis, reliable prognosis, whilst it promises evolution in novel therapies such as cell-therapies [8,9]. FECDs’ clinical heterogeneity is induced by genetic and non-heritable factors such as smoke and UV. The genetic basis of FECD demonstrates a variability in expressivity and incomplete penentrace. Although inheritance models follow an autosomal dominant mode, a significant inter-population variability in the strength of correlations among gene mutations and FECD phenotype was observed [11]. Thus, FECD is stratified in two globally recognized forms, the early and the late-onset FECD which yield different genetic profile. The rare early-onset that affects individuals from an early age, is usually more severe and positive related with mutations in collagen gene 8A2 (COL8A2) on chromosome 1[2,8,11]. COL8A2 gene encodes the a2 chain of short chain collagen VIII, which is an extracellular matrix protein and major compoment of DM. Initial genetic studies revealed that the most common, late-onset FECD, is associated with rare mutations in genes such as solute carrier family 4 sodium borate transporter member 11(SLC4A11), transcription factor 8 gene (TCFG8), transcription factor 4 gene (TCF4), lipoxygenase homology domains 1(LOXHD1) and ATP/GTP binding protein like 1 (AGBL1) [1,12,13,14,15]. Although several genes have been correlated with late-onset FECD, which manifests in the late forties, the most prevalent alteration worldwide, is a triplet repeat expansion in the TCF4 gene [16,17,18,19,20]. TCF4 gene or E2-2, is found on chromosome 18 and encodes the E2-2 protein which belongs to a family of basic helix-loop-helix transcription factors that regulate cellular growth and differentiation. TCF4 gene is involved in many developmental functions such as programmed cell-death, epithelial mesenchymal transition (EMT) and transforming growth factor-β (TGF-β) signaling pathways [21]. Additionally, an independent and significant correlation was revealed among FECD and four TCF4 single nucleotide polymorphisms (SNPs) (rs 17595731, rs 613872, rs 9954153 and rs 2286812). There is a diversity on the impact of those four SNPs among different ethnic groups, however rs613872 in the third intron of the TCF4 gene prevails as the most significant polymorphism, most probably affecting the binding site of important transcription factors [8,11,12,22,23]. Homozygotes in this TCF4 variant are at a 30-fold increased risk of having FECD compared to control group [11,12]. Noteworthy, a non-coding CTG trinucleotide repeat in the second intron of TCF4 claims to be the main pathogenic variant. It was named CTG18.1 due its location on 18q21.1 and most propably affects TCF4 expression levels either through different intitiation sites or from splicing deregulation or RNA toxicity and/or RAN translation [24,25,26,27]. Genetic analysis established that CTG18.1 expansion polymorphism has a stronger association with FECD compared to TCF4 rs613872 polymorphism. In unaffected population, less than 40 repeats were observed, while the globally recognized cut-off for a biological relevance with FECD is over 40 [11,22]. Expanded repeat length >50 demonstrated a positive correlation with FECD with 79% sensitivity and 96% specificity [28]. Hence, CTG18.1 repeat is a more specific index than the previously identified rs613872 polymorphism, whose specificity was 79%. Furthermore, CTG repeat length claims to have a potential prognostic value, as patients with a highly expanded CTC18.1 allele indicate a higher risk for keratoplasty and disease progression [29,30]. Herein, several studies came to a concesus that the length of an abnormal CTG repeat could be the best predictor of disease [29]. As CTG repeats show ethnic diversity similar to SNPs, coevaluation of rs613872 and CTG18.1 repeat length is promising for ameliorating the diagnostic value of genotyping in FECD [2,11,29,31].
The main purpose of the present research was to investigate the significance of TCF4 CTG1.8 polymorphism, as a risk factor for the occurrence of FECD in the Greek population. We provide practical advice for this cumbersome evaluation in order to avoid pitfalls and transform it into a cost-effective diagnostic algorithm. The need for standardization and use of reference materials for its accurate implementation is stressed. We also expand on our previous work on the TCF4 SNP [22], in a larger Greek FECD population and examine the impact of both intronic polymorphisms in the disease.
2. Materials and Methods
2.1. Patients
Our study was conducted on a cohort of 36 well-ascertained Greek patients with late-onset FECD (Krachmer scale >2) and 58 healthy controls, who were investigated during a two-year period in “G.Gennimatas” General Hospital. All particapants were recruited after ophthalmological evaluation and clinical data collection. Clinical evaluation was based on visual acuity and slit-lamp anterior segment examination. A modified version of the Krachmer scale classification system was used to determine disease severity, grading patients on a scale of 0 to 5; Grade 0: no central cornea guttae, grade 1: scattered central cornea guttae, grade 2: 1 or 2mm of central cornea guttae, grade 3: 2 to 5 mm of grouped cornea guttae, grade 4: 5mm of grouped central cornea guttae, grade 5: cornea guttae with corneal edema [22]. Participants were selected as patients only when the grade was 2 or more. All individuals agreed to sign an informed consent in advance of blood sampling. Peripheral blood samples were collected after approvals from the “G.Gennimatas” General Hospital Scientific and Bioethics committees.
2.2. Genomic DNA isolation
Peripheral blood samples were collected in EDTA tubes and after centrifugation, buffy coat (white cells) were stored at -200C til DNA extraction. DNA isolation was performed using the High Pure PCR Template Extraction Kit (Roche Applied Science, Switzerland) according to the manufacturer’s instructions. DNA concentration was calculated by the Quant-IT dsDNA BR Assay Kit in a Qubit fluorimeter (ThermoFisher Invitrogen, Waltham, MA, USA) which employs a dye specific for DNA. DNA was stored at -200C until further use.
2.3. TCF4 CTG Expansion Evaluation by STR-PCR and TP-PCR Methods
All PCR reactions were run in the Eppendorf Mastercycler gradient cycler with 2X GoTaq G2 Green Master mix polymerase (Promega). Primers and PCR conditions for the two expansion evaluation methods were as described in Mootha et al [32].
Primers P1 and P2 were used for Short Tandem Repeat PCR (STR-PCR). PCR products were run in a high-resolution 4% agarose (1:1 with Nusieve) and in parallel, in the fragment analysis mode of a SeqStudio genetic analyzer (in the latter case, the P1 primer is labeled with fluorescein). The expected size of the STR-PCR allelic products -depending on the number of CTG triplets they contain- is provided in the Supplementary table 1. The size is estimated with the use of appropriate MW (molecular weight) controls for each of the two running modes. The GenBank sequence for the TCF4 gene (NG_011716.2) contains 24 CTG repeats (or 25 TGC repeats; hence the other name that some authors use in order to define this polymorphism [24,25,26]).
Fluorescent P1 along primers P3 and P4 are used for the triplet-repeat primed PCR (TP-PCR) [33]. As depicted in Figure 1, primer P4 carries in its 3’ end a complementary sequence to five CTG triplets. This structure results in the possibility of many annealing sites -starting with the first CTG triplet in TCF4 sequence in each chromosome- and creates many PCR products differing in size by multiples of 3 bp. The expected size of the TP-PCR allelic products -depending on the number of CTG triplets they contain- is provided in the Supplementary table 1. TP-PCR is followed by fragment analysis in the genetic analyzer SeqStudio (Applied Biosystems) and triplets are seen as different peaks and are counted with the Peak Scanner software (Thermo Fisher). In theory, the triplets should ideally result in peaks of equal intensity from each chromosome (Figure 1); however, diminishing intensities are usually seen with a ladder-like appearance. In general, pathological expansion- noted by X symbol- is defined when at least one of the two alleles -after accurate triplet counting- contains >40 triplets.
2.4. DNA Sequencing
In case of a sample where a single band is seen in the gel electrophoresis and then, a single cluster in the TP-PCR fragment analysis, Cycle sequencing of the corresponding purified STR-PCR product is performed with primer P1 and Big Dye terminators vs3.1 and run in an ABI SeqStudio genetic analyzer in order to confirm homozygosity.
2.5. TCF4 rs 613872 real-time-qPCR assay
Our previously developed real-time qPCR-melting curve method in the LightCycler platform (Roche) [22] was used for genotyping of the rs613872 TCF4 polymorphism (g.97923 A>C, T>G in the other DNA strand that is being investigated by the probes of this method) in 14 additional FECD patients (thus, for a total of 36 patients).
2.6. Statistics
Statistical analysis was performed using SPSS 26.0 software package for Windows (IBM). The criterion used for statistical significance was p<0.05. Normality of distribution of age was assessed with the Kolmogorov–Smirnov test. Median age between patients and controls was compared with the Mann-Whitney test and sex proportions with the chi-squared test. Correlation of peaks in fragment analysis was performed with Spearman’s test. The online SNPstats software tool (https://www.snpstats.net/) [34] was used in order to examine conformance with Hardy–Weinberg equilibrium (HWE), allelic count, genotypic frequencies, haplotype analysis and odds ratio (OR) calculation with 95% confidence intervals (C.I.) for all plausible inheritance models (dominant, co-dominant, recessive or log-additive). The significant model with the lower Akaike information criterion (AIC) was selected.
3. Results
Patients (mean age 73 years, range 51-82y, 58% female) and 58 healthy controls (mean age 74 years, range 42-87y, 57% female) didn’t differ significantly when considering age and sex (Mann-Whitney and x2 tests, both p>0.05).
When the TCF4 STR-PCR products of all samples were run in high-resolution agarose gel electrophoresis, two distinct bands were observed in 16 FCED patients and in 55 controls, one band in 17 FECD samples and 3 controls and no band in 3 FECD patients. Same products were then run in the fragment analysis mode of the DNA Sequencer and better estimates of the sizes were obtained (in high accordance though with the sizes obtained empirically from the gel). All samples also, underwent TCF4 TP-PCR that was followed by fragment analysis in the DNA Sequencer.
Regarding the samples with two bands in the gel and therefore, two peaks in the STR-PCR fragment analysis, there was high concordance with the estimated repeat sizes obtained from the two clusters of the TP-PCR analysis (due to non-normality, Spearman’s rho=0.84), even in a polymorphic 14/17 sample differing by 3 triplets, thus by only 9 bp in the allelic products (Figure 2 and Figure 3). In our dataset, all samples containing two distinct bands/peaks were assigned as normal N/N as their STR-PCR products were less than 235 bp in size (corresponding to the 40 CTG triplets expected product length which is the cut-off regarding abnormality, see Suppl Table 1).
Regarding samples with only one band in the gel and one peak in STR-PCR fragment analysis, there were two types of results. In only one sample F24, the STR-PCR result was a single peak at 147 bp corresponding to 11 CTG triplets and the TP-PCR fragment result was a single cluster with the last peak at 87 bp corresponding again to 11 CTG triplets in the TCF4 gene (Figure 4 and Figure 5 respectively). The sample was finally adjudicated as normal 11/11 homozygote by DNA Sequencing, Supplementary figure 1).
The other type of obtained result was the N/X, due to allelic dropout of the expanded X allele that didn’t produce a PCR product under the stringent conditions of the STR-PCR. In these cases the TP-PCR method is the revealing method with the appearance of a peak cluster protruding from a ladder-like fragment pattern (hence, the N number can be estimated). The same statement is valid for the three FECD cases where no gel band was seen and the result is denoted as expanded in both alleles (X/X). The expansion in Figure 6 goes up to 452 bp that corresponds to 133 triplets in the TCF4 gene (Suppl. Table 1); in these cases it is difficult to estimate the exact number of the triplets in both chromosomes. DNA sequencing was performed in selected N/X and X/X cases but the frameshift-like appearance in the electropherogram was very confusing in order to estimate accurately the number of repeats.
All samples provided TCF4 genotyping results in both loci that were in accordance with Hardy-Weinberg equilibrium (p>0.05) (Table 1 and Table 2). Twenty out of 36 FECD patients (56%) possessed at least one expanded X allele (X allele frequency 32%) compared to 5% of healthy controls (3 out of 58, X allele frequency 3%). The odds ratio for developing the disease when carrying an expanded allele was estimated to be 19.85 (95% C.I.=5.23-75.29)] in the log-additive inheritance model. The frequency of TCF4 risk G allele was increased to 40% in FECD patients compared to 17% in healthy subjects [odds ratio=3.59 (95% C.I.= 1.68-7.69), log-additive]. Haplotype analysis revealed strong linkage disequilibrium (D’=0.76, r=0.52) with an OR of approximately 173 (but with no statistical confidence in the boundaries).
When examining both polymophisms, a total of 19.5% of patients possessed a range of 3-4 pathological alleles in the two genetic TCF4 loci, while 38.9% possessed 2 pathological alleles and could belong to a “grey zone” area.

Table 1.
TCF4 expansion assay results analyzed with SNPStats software for Odds Ratio adjusted by sex and age (N denotes normal triplet result, X abnormal triplet result >40, STATUS=0 Healthy Controls, STATUS=1 FECD Patients).
Table 1.
TCF4 expansion assay results analyzed with SNPStats software for Odds Ratio adjusted by sex and age (N denotes normal triplet result, X abnormal triplet result >40, STATUS=0 Healthy Controls, STATUS=1 FECD Patients).
| Model | Genotype | STATUS=0 | STATUS=1 | OR (95% CI) | P-value | AIC |
|---|---|---|---|---|---|---|
| Codominant | N/N | 55 (94.8%) | 16 (44.4%) | 1.00 | <0.0001 | 103 |
| N/X | 3 (5.2%) | 17 (47.2%) | 19.41 (5.02-75.02) | |||
| X/X | 0 (0%) | 3 (8.3%) | NA (0.00-NA) | |||
| Dominant | N/N | 55 (94.8%) | 16 (44.4%) | 1.00 | <0.0001 | 102 |
| N/X-X/X | 3 (5.2%) | 20 (55.6%) | 22.83 (5.99-87.09) | |||
| Recessive | N/N-N/X | 58 (100%) | 33 (91.7%) | 1.00 | 0.015 | 127 |
| X/X | 0 (0%) | 3 (8.3%) | NA (0.00-NA) | |||
| Log-additive | --- | --- | --- | 19.85 (5.23-75.29) | <0.0001 | 101 |
Table 2.
TCF4 rs613872 SNP results analyzed with SNPStats software (STATUS=0 Healthy Controls, STATUS=1 FECD Patients) for Odds Ratio (adjusted by sex and age). G is the risk allele.
Table 2.
TCF4 rs613872 SNP results analyzed with SNPStats software (STATUS=0 Healthy Controls, STATUS=1 FECD Patients) for Odds Ratio (adjusted by sex and age). G is the risk allele.
| Model | Genotype | STATUS=0 | STATUS=1 | OR (95% CI) | P-value | AIC |
|---|---|---|---|---|---|---|
| Codominant | T/T | 38 (65.5%) | 14 (38.9%) | 1.00 | 2e-04 | 118 |
| G/T | 20 (34.5%) | 15 (41.7%) | 2.11 (0.81-5.45) | |||
| G/G | 0 (0%) | 7 (19.4%) | NA (0.00-NA) | |||
| Dominant | T/T | 38 (65.5%) | 14 (38.9%) | 1.00 | 0.0082 | 126 |
| G/T-G/G | 20 (34.5%) | 22 (61.1%) | 3.26 (1.33-8.02) | |||
| Recessive | T/T-G/T | 58 (100%) | 29 (80.6%) | 1.00 | 1e-04 | 118 |
| G/G | 0 (0%) | 7 (19.4%) | NA (0.00-NA) | |||
| Log-additive | --- | --- | --- | 3.59 (1.68-7.69) | 4e-04 | 120 |
4. Discussion
The main goal of our research was to designate the statistical significance of the association among TCF4 CTG18.1 polymophism and FECD prevalence in Greek population and –if possible- to suggest an algorithm that incorporates novel molecular modalities that guarantee a rational diagnostic pathway towards tailored-therapy.
Since there is an extensive TCF4 ethnic diversity reported in the literature e.g. no SNP alterations or rarely in East Asian, South American and African populations [23], various percentages for CTG18.1 [27,35], our lab -which is the only one in Greece that investigates and performs FECD genetic analysis, opted to implement in-house molecular methods in order to detect and measure the prevalence of the TCF4 CTG18.1 polymophism (the SNP was investigated in our previous study [22]).
As suggested by other labs, both STR- and TP-PCR run in fragment analysis mode in a genetic analyzer are recommended for an accurate CCG expansion evaluation. However, in our hands and in our dataset, it was observed that in about half of the cases (44.4%) when both alleles are normal (<40 repeats), a high-resolution agarose gel of the STR-PCR products could suffice in order to separate adequately the two bands. The samples are then assigned as N/N (when both bands are less than 235 bp) and thus avoiding the need to use fluorescent fragment analysis and proceed to further cumbersome TP-PCR method. Indeed in the normal samples, there is no need for the STR-PCR products to be run in fragment analysis, since in our study we proved that STR-PCR gel optical estimation is similar with both STR-and TP- fragment analysis (rho=0.84).
In the rest of the cases, where one (or none) band is detected in the STR-PCR gel (mostly in patients, rarely in healthy subjects), there is a high suspicion for the presence of one (or two) abnormal expanded X alleles (due to allelic dropout). The lab should then proceed directly to TP-PCR fragment analysis. In the majority of these cases, a ladder-like appearance of the electropherogram is observed and experienced personnel can count the triplets and/or estimate the size of the normal allele in the case of a N/X sample. Thus in this proposed algorithm, the empical and difficult expansion assay evaluation can become cost-effective.
In the rare occasion where a single band is detected in the STR-PCR gel and a single cluster of peaks in the TP-PCR fragment analysis, there is suspicion for the presence of an homozygous sample that can be futher verified by DNA Sequencing.
In general, trinucleotide repeats are more difficult that four- five- or hexanucleotide in polymerase demands (no DNA slippage is allowed during polymerization) and in possibility of accurate sizing. There is need for standardization; no reference materials exist as e.g. in Fragile X syndrome or Huntington’s disease where commercial controls exist. Reference materials should include homozygotes, samples with two distict normal alleles and X/X samples with an accurate estimate for the maximum number of triplets (target value ± standard deviation). In this sense, we identified one sample in our dataset that can be used as a reference material.
Twenty out of 36 FECD patients (56%) possessed at least one expanded X allele (X allele frequency 32%) compared to 5% of healthy controls (3 out of 58, X allele frequency 3%). The presence of the X allele was therefore verified in our Greek population in a significant proportion as in the rest of European populations and can add value in the diagnostic and prognostic patient approach.
The odds ratio for developing the disease when carrying an expanded allele was estimated to be 19.85 (95% C.I.=5.23-75.29)] in the log-additive inheritance model. The frequency of TCF4 risk G allele was increased to 40% in FECD patients compared to 17% in healthy subjects [odds ratio=3.59 (95% C.I.= 1.68-7.69), log-additive]. Haplotype analysis revealed strong linkage disequilibrium (D’=0.76, r=0.52) with an OR of approximately 173 (but with no statistical confidence in the boundaries).
When examining both polymophisms, a total of 19.5% of patients possessed a range of 3-4 pathological alleles in the two genetic TCF4 loci, therefore in these cases TC4 gene express is surely affected in both chromosomes.
Another 38.9% possess 2 pathological alleles and belong to a “grey zone” area where the alterations could matter depending on whether they are located at “cis” or “trans” position. It is expected that in half of these cases the two pathological alleles are located in “trans” with the severe possibility of altering and/or inactivating normal TCF4 expression from both chromosomes.
However, in the rest 42% of the FECD Greek patients that possessed 0-1 pathological alleles, there is strong possibility of mutations in other genes. As FECD is an oligogenic disease, the missing heritability could be attributed to other genes such as ZEB1, AGBL1, SLC4A11, LOXHD1 that were detected in the initial studies. Genome-wide association studies have identified additional loci with p-values over 10-7 besides TCF4: in KANK4 (KN motif- and ankyrin repeat domain-containing protein 4) gene, in LAMC1 (laminin gamma 1) gene and in ATP1B1 gene (Na+/ K+ transporting ATPase, beta-1 polypeptide) [31]. Also other genes are under investigation such as CLU, FAS, DNA repair genes (RAD51, XRCC1, FEN1, NEIL1) etc [12,27,36].
With the advent of Next Generation Sequencing techniques -that become continuously more economic and efficient- a targeted panel with all the aforementioned genes or a whole exome approach would result in the full genetic elucidation for FECD. That could lead to personalized precision Medicine therapeutics such as gene editing, anti-sense and mRNA technologies in order to correct the genetic defect or alter expression of an important FECD gene [27].
Supplementary Materials
The following supporting information can be downloaded at the website of this paper posted on Preprints.org. Supplementarty Figure 1. DNA Sequencing result for the F24 sample with a single result in both STR- and TP-PCRs. The arrow indicates the first CTG triplet, another ten triplets are seen in a homozygous state (11/11 normal homozygous sample). Flanking sequences are as expected for borders of the expansion CTG area in the TCF4 gene. Supplementary Table 1. A comprehensive table to be used as a tool for easy identification of the triplet number and the expected size of STR- and TP-PCR peaks in fragment analysis.
References
- Sarnicola, 2019. 45, 1–10.
- Ong Tone, S.; Kocaba, V.; Böhm, M.; Wylegala, A.; White, T.L.; Jurkunas, U.V. Fuchs endothelial corneal dystrophy: The vicious cycle of Fuchs pathogenesis. Prog. Retin. Eye Res. 2021, 80, 100863. [CrossRef]
- Altamirano, F.; Ortiz-Morales, G.; Valdez-Garcia, J.E. Fuchs endothelial corneal dystrophy: An updated review. Int. Ophthalmol. 2024, 44, 61. [CrossRef]
- Kumar, V.; Deshpande, N.; Parekh, M.; Wong, R.; Ashraf, S.; Zahid, M.; et al. Estrogen genotoxicity causes preferential development of Fuchs endothelial corneal dystrophy in females. Redox Biol. 2024, 69, 102986. [CrossRef]
- Nanda, G.G.; Alone, D.P. Review: Current understanding of the pathogenesis of Fuchs’ endothelial corneal dystrophy. Mol. Vis. 2019, 25, 295–310.
- Thaung, C.; Davidson, A.E. Fuchs endothelial corneal dystrophy: Current perspectives on diagnostic pathology and genetics—Bowman Club Lecture. BMJ Open Ophthalmol. 2022, 7, e001103. [CrossRef]
- Dimtsas, G.S.; Moschos, M.M. Ultrathin-Descemet Stripping Automated Endothelial Keratoplasty versus Descemet Membrane Endothelial Keratoplasty: A systematic review and meta-analysis. In Vivo 2023, 37, 400–409. [CrossRef]
- Matthaei, M.; Hribek, A.; Clahsen, T.; Bachmann, B.; Cursiefen, C.; Jun, A.S. Fuchs endothelial corneal dystrophy: Clinical, genetic, pathophysiologic, and therapeutic aspects. Annu. Rev. Vis. Sci. 2019, 5, 151–175. [CrossRef]
- Liu, J.-X.; Chiang, T.-L.; Hung, K.-F.; Sun, Y.-C. Therapeutic future of Fuchs endothelial corneal dystrophy: An ongoing way to explore. Taiwan J. Ophthalmol. 2024, 14, 15–26. [CrossRef]
- Chan, M.F.; Pan, P.; Wolfreys, F.D. Novel mechanisms guide innovative molecular-based therapeutic strategies for Fuchs endothelial corneal dystrophy. Cornea 2023, 42, 929–933. [CrossRef]
- Liu, X.; Zheng, T.; Zhao, C.; Zhang, Y.; Liu, H.; Wang, L.; et al. Genetic mutations and molecular mechanisms of Fuchs endothelial corneal dystrophy. Eye Vis. (Lond.) 2021, 8, 24. [CrossRef]
- Zhang, J.; McGhee, C.N.J.; Patel, D.V. The molecular basis of Fuchs’ endothelial corneal dystrophy. Mol. Diagn. Ther. 2019, 23, 97–112. [CrossRef]
- Iliff, B.W.; Riazuddin, S.A.; Gottsch, J.D. The genetics of Fuchs’ corneal dystrophy. Expert Rev. Ophthalmol. 2012, 7, 363–375. [CrossRef]
- Fuchs, B.; Zhang, K.; Bolander, M.E.; Sarkar, G. Differential mRNA fingerprinting by preferential amplification of coding sequences. Gene 2000, 258, 155–163. [CrossRef]
- Gottsch, J.D.; Bowers, A.L.; Margulies, E.H.; Seitzman, G.D.; Kim, S.W.; Saba, S.; et al. Serial analysis of gene expression in the corneal endothelium of Fuchs’ dystrophy. Invest. Ophthalmol. Vis. Sci. 2003, 44, 594–599. [CrossRef]
- Westin, I.M.; Viberg, A.; Golovleva, I.; Byström, B. CTG18.1 expansion in transcription factor 4 (TCF4) in corneal graft failure: Preliminary study. Cell Tissue Bank 2024, 25, (ahead of print). [CrossRef]
- Sahin Vural, G.; Bolat, H. Nanopore sequencing method for CTG18.1 expansion in TCF4 in late-onset Fuchs endothelial corneal dystrophy and a comparison of the structural features of cornea with first-degree relatives. Graefe’s Arch. Clin. Exp. Ophthalmol. 2024, 262, (ahead of print). [CrossRef]
- Vazirani, J.; Rambhia, M. Genetics in corneal dystrophy. In Genetics of Ocular Diseases; 2022; pp. 7–14.
- Qiu, J.; Gu, R.; Shi, Q.; Zhang, X. Long noncoding RNA ZFAS1: A novel anti-apoptotic target in Fuchs endothelial corneal dystrophy. Exp. Eye Res. 2024, 241, 109832. [CrossRef]
- Tsedilina, T.R.; Sharova, E.; Iakovets, V.; Skorodumova, L.O. Systematic review of SLC4A11, ZEB1, LOXHD1, and AGBL1 variants in the development of Fuchs’ endothelial corneal dystrophy. Front. Med. (Lausanne) 2023, 10, 1153122. [CrossRef]
- Baratz, K.H.; Tosakulwong, N.; Ryu, E.; Brown, W.L.; Branham, K.; Chen, W.; et al. E2-2 protein and Fuchs’s corneal dystrophy. N. Engl. J. Med. 2010, 363, 1016–1024. [CrossRef]
- Moschos, M.M.; Diamantopoulou, A.; Gouliopoulos, N.; Droutsas, K.; Kitsos, G.; et al. TCF4 and COL8A2 gene polymorphism screening in a Greek population of late-onset Fuchs endothelial corneal dystrophy. In Vivo 2019, 33, 963–971. [CrossRef]
- Li, Y.J.; Minear, M.A.; Rimmler, J.; Zhao, B.; Balajonda, E.; Hauser, M.A.; et al. Replication of TCF4 through association and linkage studies in late-onset Fuchs endothelial corneal dystrophy. PLoS One 2011, 6, e18044. [CrossRef]
- Wieben, E.D.; Aleff, R.A.; Eckloff, B.W.; Atkinson, E.J.; Baheti, S.; Middha, S.; et al. Comprehensive assessment of genetic variants within TCF4 in Fuchs’ endothelial corneal dystrophy. Invest. Ophthalmol. Vis. Sci. 2014, 55, 6101–6107. [CrossRef]
- Wieben, E.D.; Aleff, R.A.; Tosakulwong, N.; Butz, M.L.; Highsmith, W.E. Jr; Edwards, A.O.; et al. A common trinucleotide repeat expansion within the transcription factor 4 (TCF4, E2-2) gene predicts Fuchs corneal dystrophy. PLoS One 2012, 7, e49083. [CrossRef]
- Wieben, E.D.; Aleff, R.A.; Basu, S.; Sarangi, V.; Bowman, B.; McLaughlin, I.J.; et al. Amplification-free long-read sequencing of TCF4 expanded trinucleotide repeats in Fuchs endothelial corneal dystrophy. PLoS One 2019, 14, e0219446. [CrossRef]
- Fautsch, M.P.; Wieben, E.D.; Baratz, K.H.; Bhattacharyya, N.; Sadan, A.N.; Hafford-Tear, N.J.; et al. TCF4-mediated Fuchs endothelial corneal dystrophy: Insights into a common trinucleotide repeat-associated disease. Prog. Retin. Eye Res. 2021, 81, 100883. [CrossRef]
- Vasanth, S.; Eghrari, A.O.; Gapsis, B.C.; Wang, J.; Haller, N.F.; Stark, W.J.; et al. Expansion of CTG18.1 trinucleotide repeat in TCF4 is a potent driver of Fuchs’ corneal dystrophy. Invest. Ophthalmol. Vis. Sci. 2015, 56, 4531–4536. [CrossRef]
- Soh, Y.Q.; Lim, G.P.S.; Htoon, H.M.; Gong, X.; Mootha, V.V.; Vithana, E.N.; et al. Trinucleotide repeat expansion length as a predictor of the clinical progression of Fuchs’ endothelial corneal dystrophy. PLoS One 2019, 14, e0210996. [CrossRef]
- Eghrari, A.O.; Vasanth, S.; Wang, J.; Vahedi, F.; Riazuddin, S.A.; Gottsch, J.D. CTG18.1 expansion in TCF4 increases likelihood of transplantation in Fuchs corneal dystrophy. Cornea 2017, 36, 40–43. [CrossRef]
- Afshari, N.A.; Igo, R.P. Jr; Morris, N.J.; Stambolian, D.; Sharma, S.; Pulagam, V.L.; et al. Genome-wide association study identifies three novel loci in Fuchs endothelial corneal dystrophy. Nat. Commun. 2017, 8, 14898.
- Mootha, V.V.; Gong, X.; Ku, H.C.; Xing, C. Association and familial segregation of CTG18.1 trinucleotide repeat expansion of TCF4 gene in Fuchs’ endothelial corneal dystrophy. Invest. Ophthalmol. Vis. Sci. 2014, 55, 33–42. [CrossRef]
- Warner, J.P.; Barron, L.H.; Goudie, D.; Kelly, K.; Dow, D.; Fitzpatrick, D.R.; et al. A general method for the detection of large CAG repeat expansions by fluorescent PCR. J. Med. Genet. 1996, 33, 1022–1026. [CrossRef]
- Solé, X.; Guinó, E.; Valls, J.; Iniesta, R.; Moreno, V. SNPStats: A web tool for the analysis of association studies. Bioinformatics 2006, 22, 1928–1929. [CrossRef]
- Kuot, A.; Hewitt, A.W.; Snibson, G.R.; Souzeau, E.; Mills, R.; Craig, J.E.; et al. TGC repeat expansion in the TCF4 gene increases the risk of Fuchs’ endothelial corneal dystrophy in Australian cases. PLoS One 2017, 12, e0183719. [CrossRef]
- Kannabiran, C.; Chaurasia, S.; Ramappa, M.; Mootha, V.V. Update on the genetics of corneal endothelial dystrophies. Indian J. Ophthalmol. 2022, 70, 2126–2137.
Figure 1.
An explanatory figure of TP-PCR expansion assay in the case of TCF4 trinucleotide CTG repeat estimation. P1-FAM is the forward primer and P4 is the reverse primer that contains a “black” part which is 100% complementary to five CTG triplets in a row and a “red” part that is irrelevant and same in sequence as the P3 primer (sequences are provided 5’→3’). In the left part of the figure, the stochastic action of P4 primer in initiating multiple PCR start sites is depicted in two cases: in the upper part, in a chromosome containing 10 CTG repeats where there is equal possibility of creating six PCR products of equal intensity between 69 and 84 bp seen as peaks in the fragment analysis (differing by 3 bp) and in the lower part in a chromosome containing 15 CTG repeats where there is equal possibility of creating eleven PCR products of equal intensity. In the upper right part of the figure, the expected fragment analysis result is seen for a homozygous 10/10 sample. In the lower right part of the figure, an ideal expected fragment analysis result is seen for a heterozygous 15/10 sample where there will be two peak clusters of different intensity, the first cluster will contain six peaks corresponding in the 10 triplets being present in both chromosomes and another cluster of peaks of weaker half intensity ranging from 87 to 99 bp corresponding to the rest of the triplets in only one of the two chromosomes.
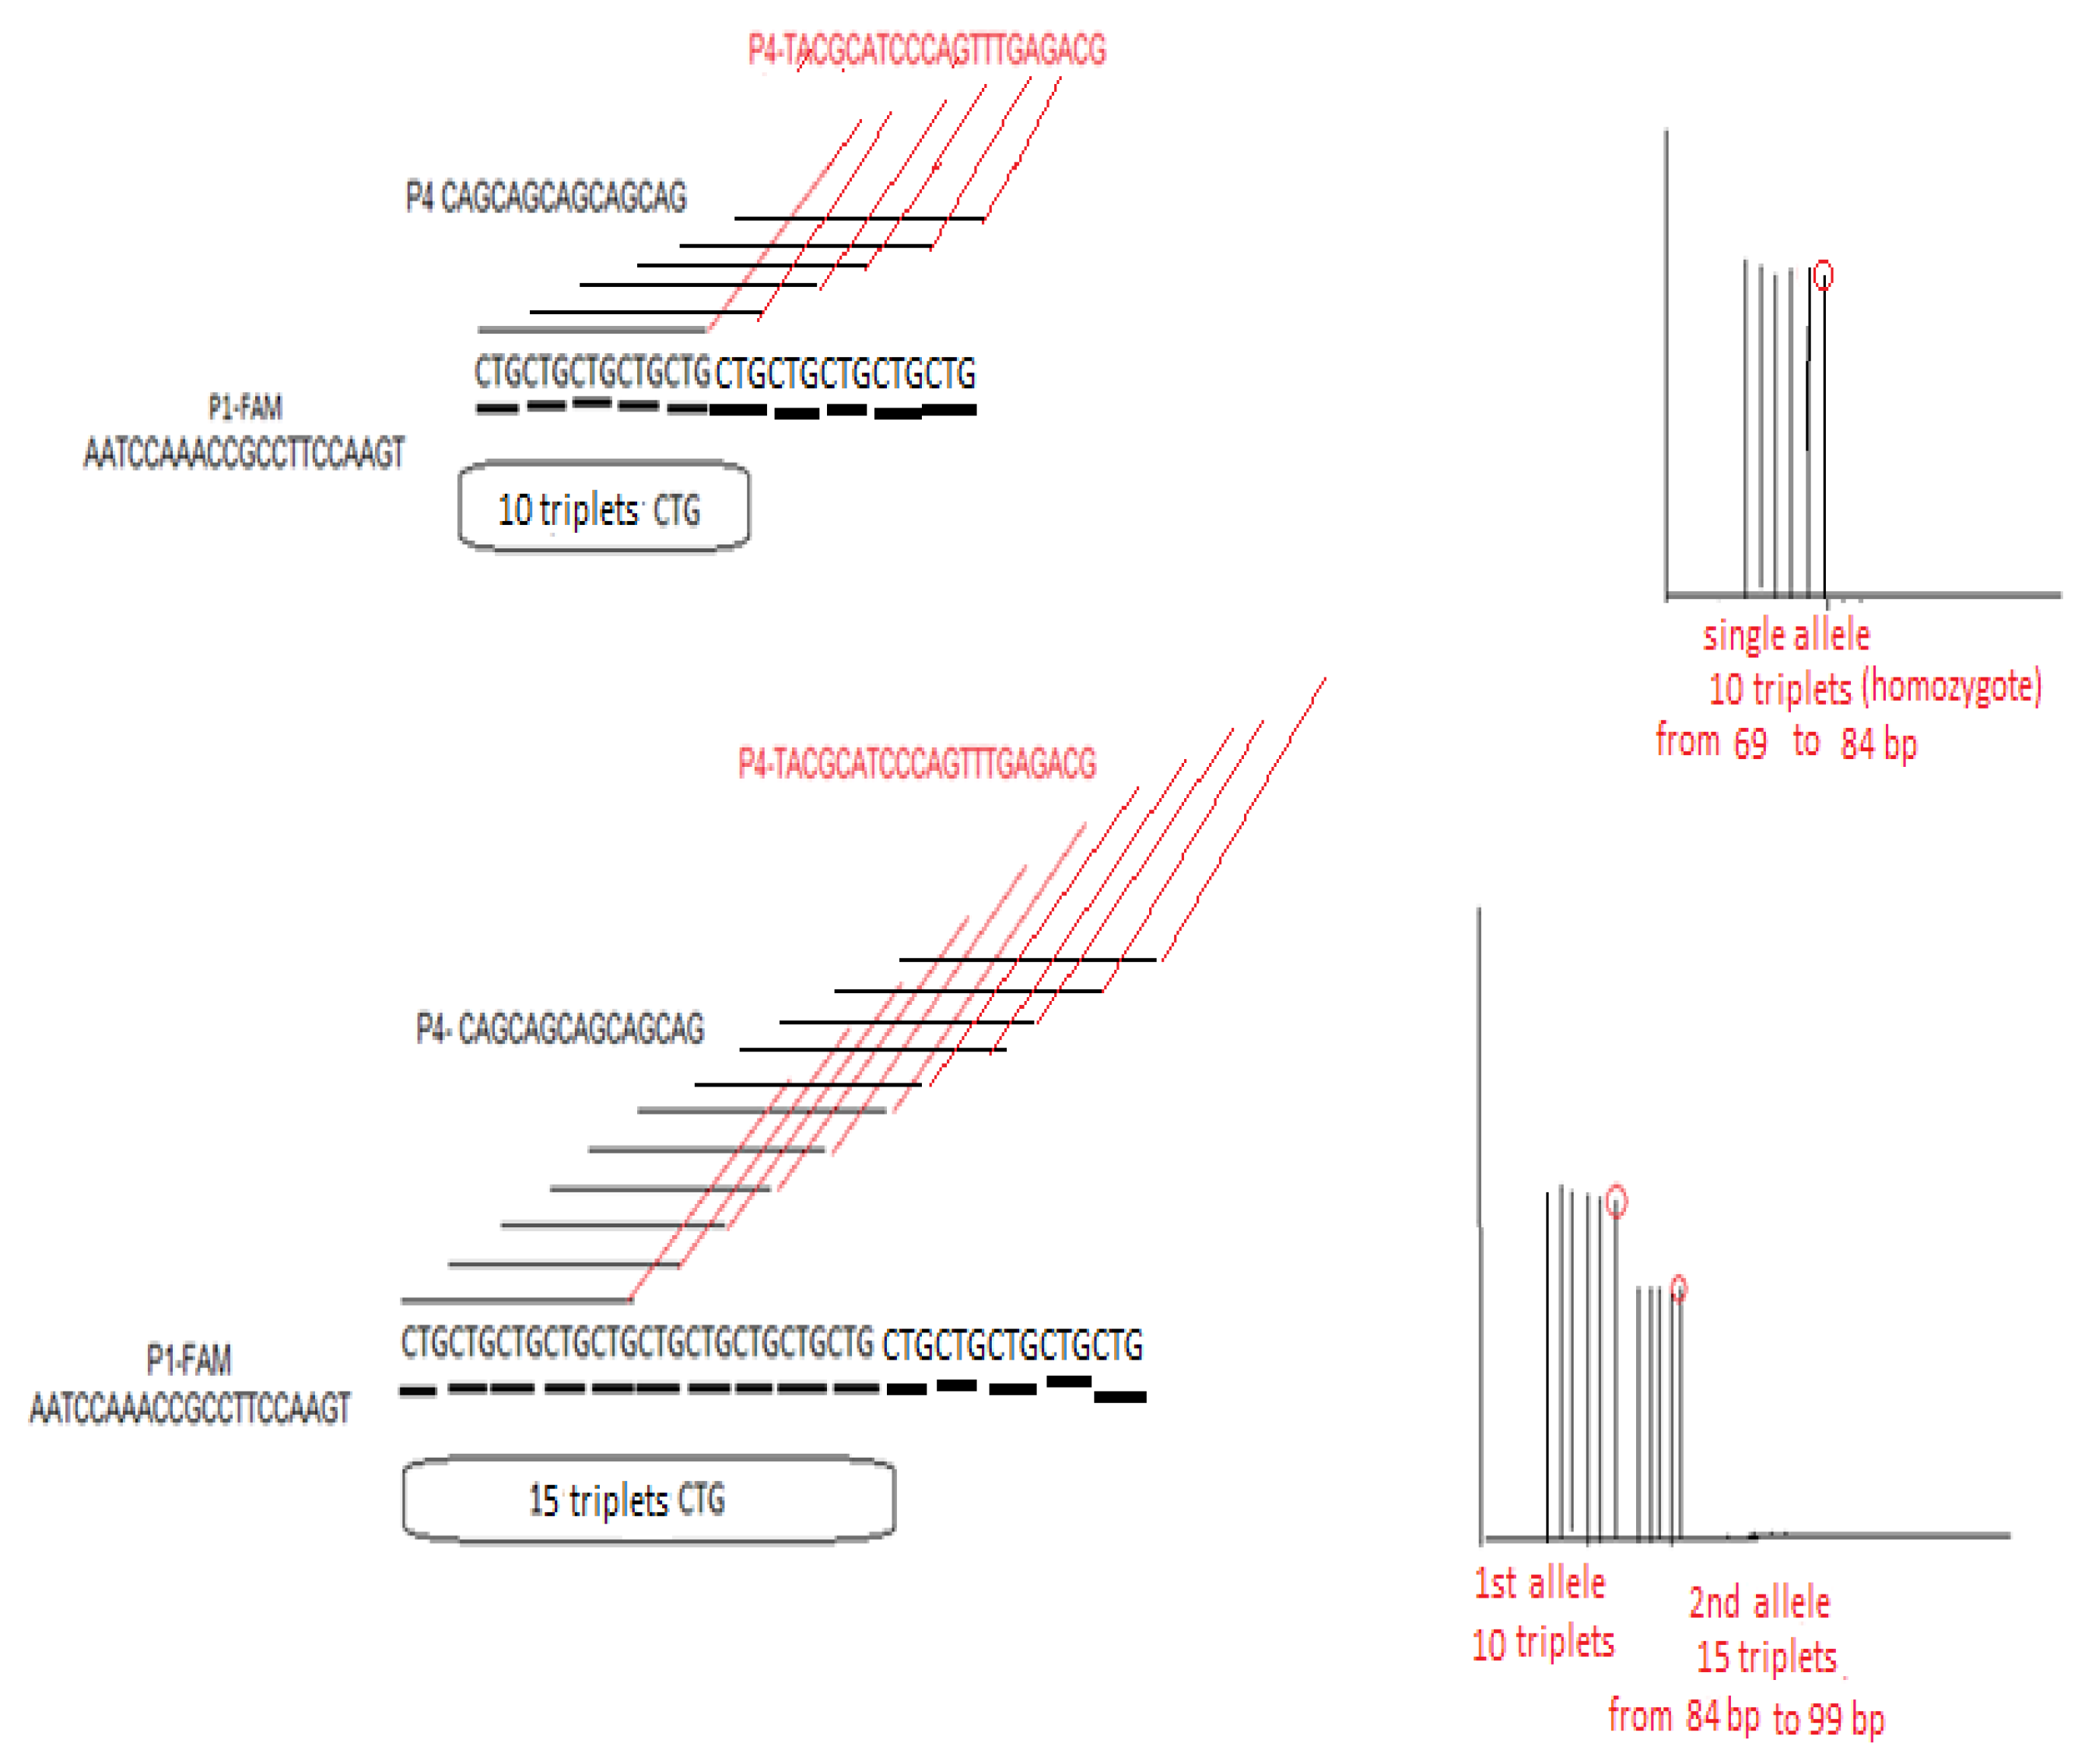
Figure 2.
F31 patient sample STR-PCR result with 2 peaks at 159 and 167 bp corresponding to 14 and 17 CTG triplets in the TCF4 gene. The sample is characterized as normal-expansion in both chromosomes (N, N) Liz GS 500 (ABI) is used as a MW size standard in all fragment results (depicted as low-intensity orange vertical lines spanning the whole electropherogram).
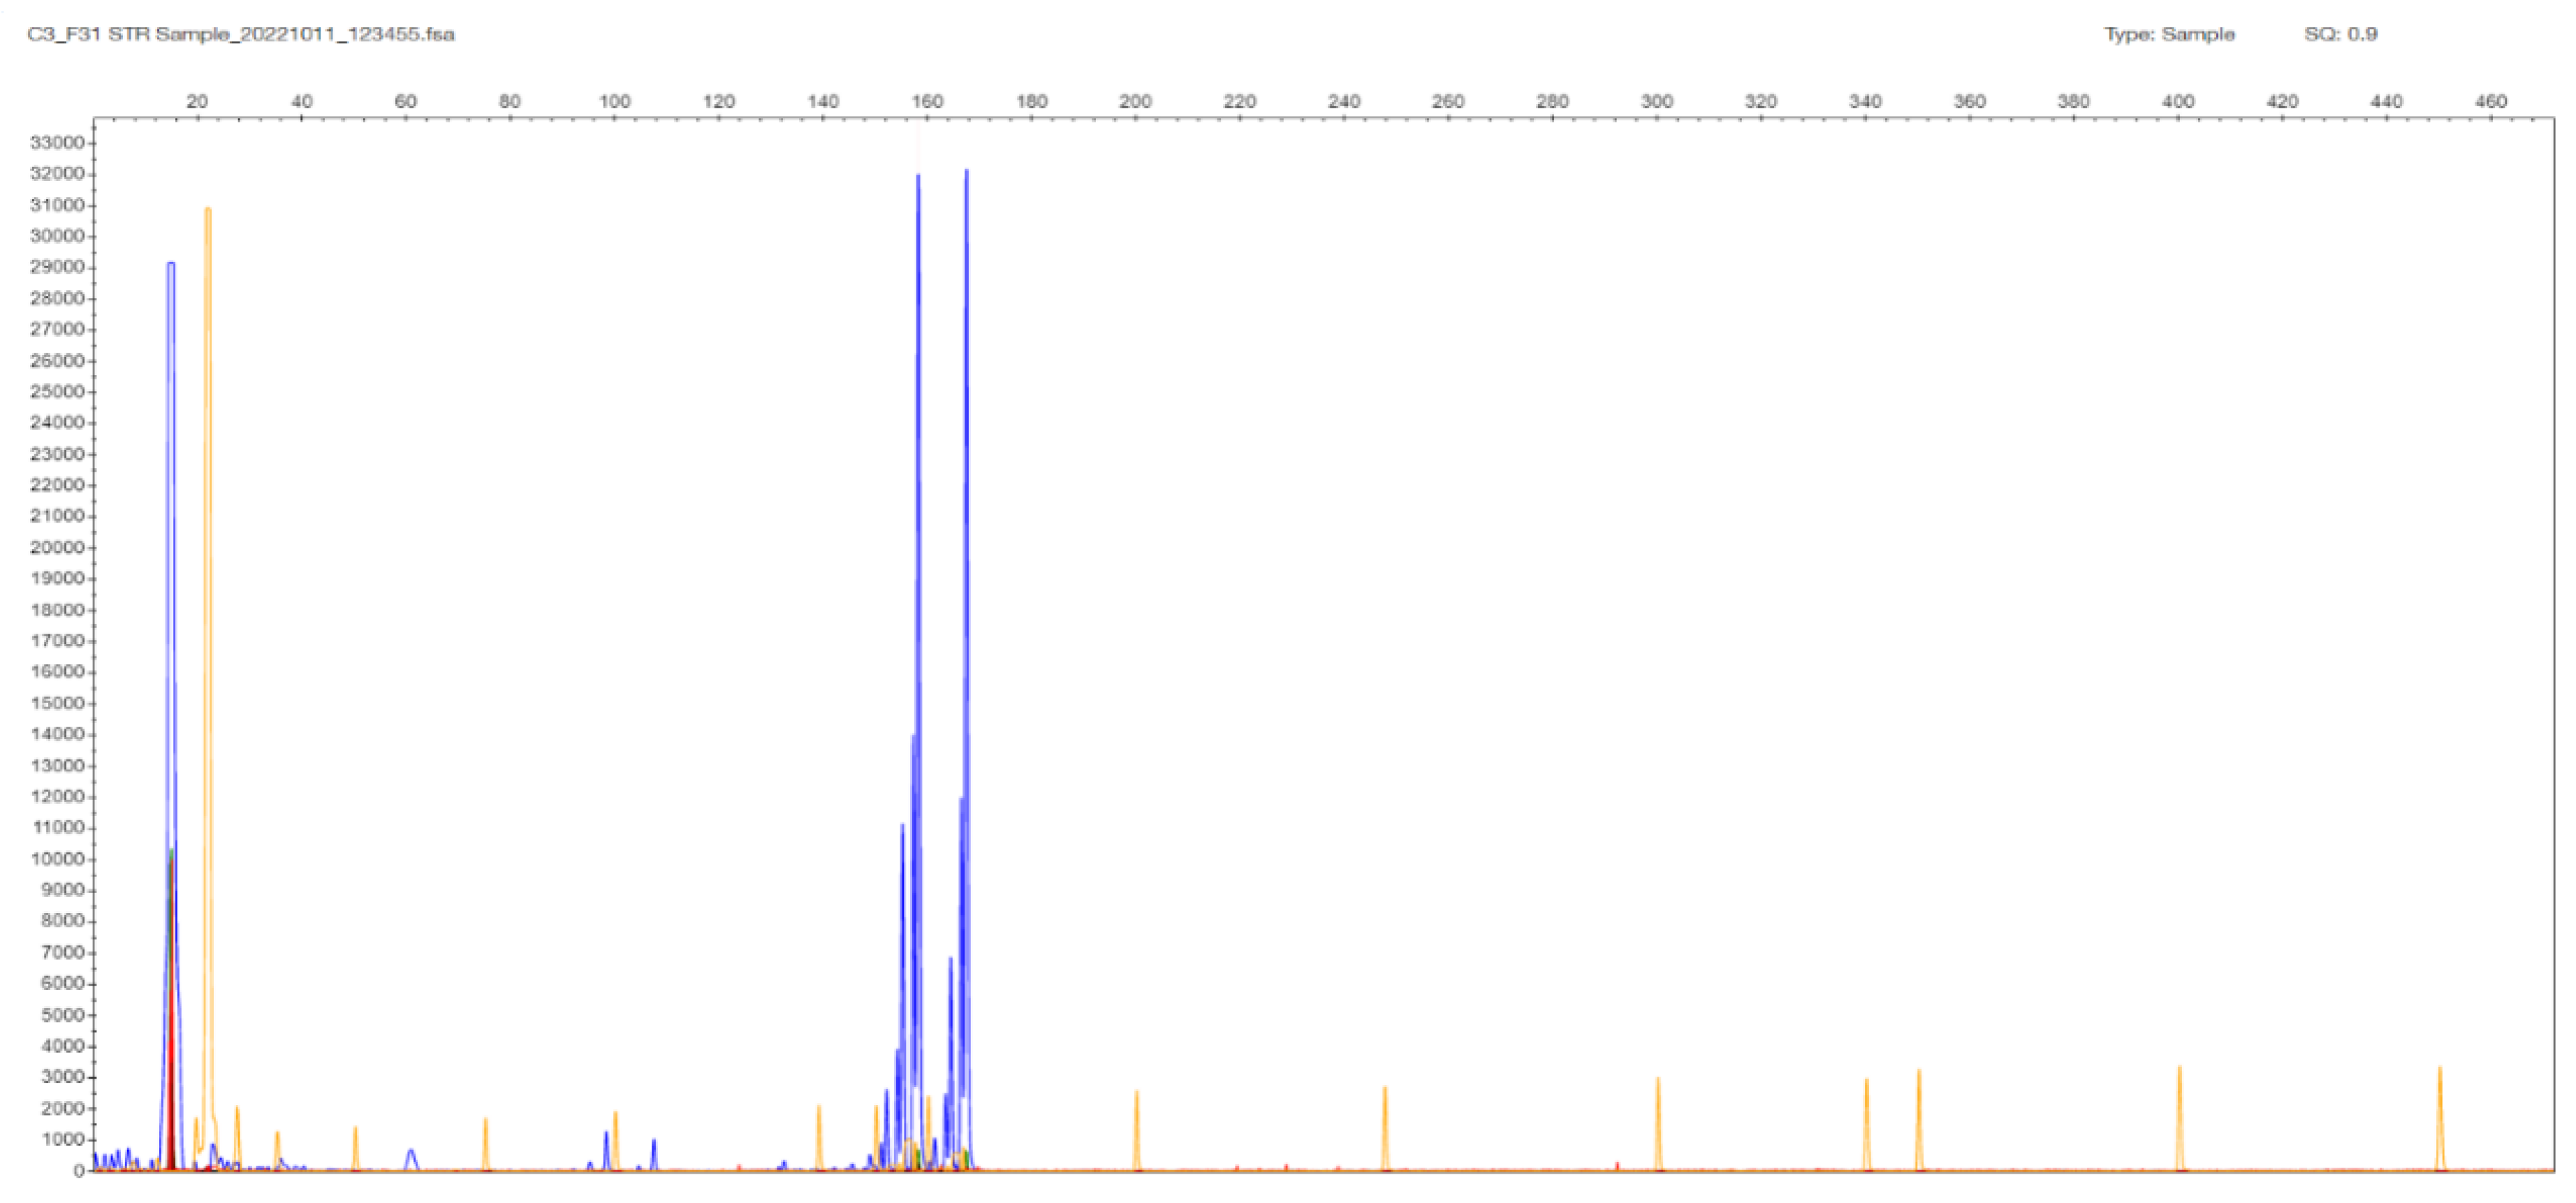
Figure 3.
F31 patient sample TP-PCR result with two cluster of bands with peaks at 90 and 102 bp corresponding to 12 and 17 CTG triplets in the TCF4 gene.
Figure 3.
F31 patient sample TP-PCR result with two cluster of bands with peaks at 90 and 102 bp corresponding to 12 and 17 CTG triplets in the TCF4 gene.
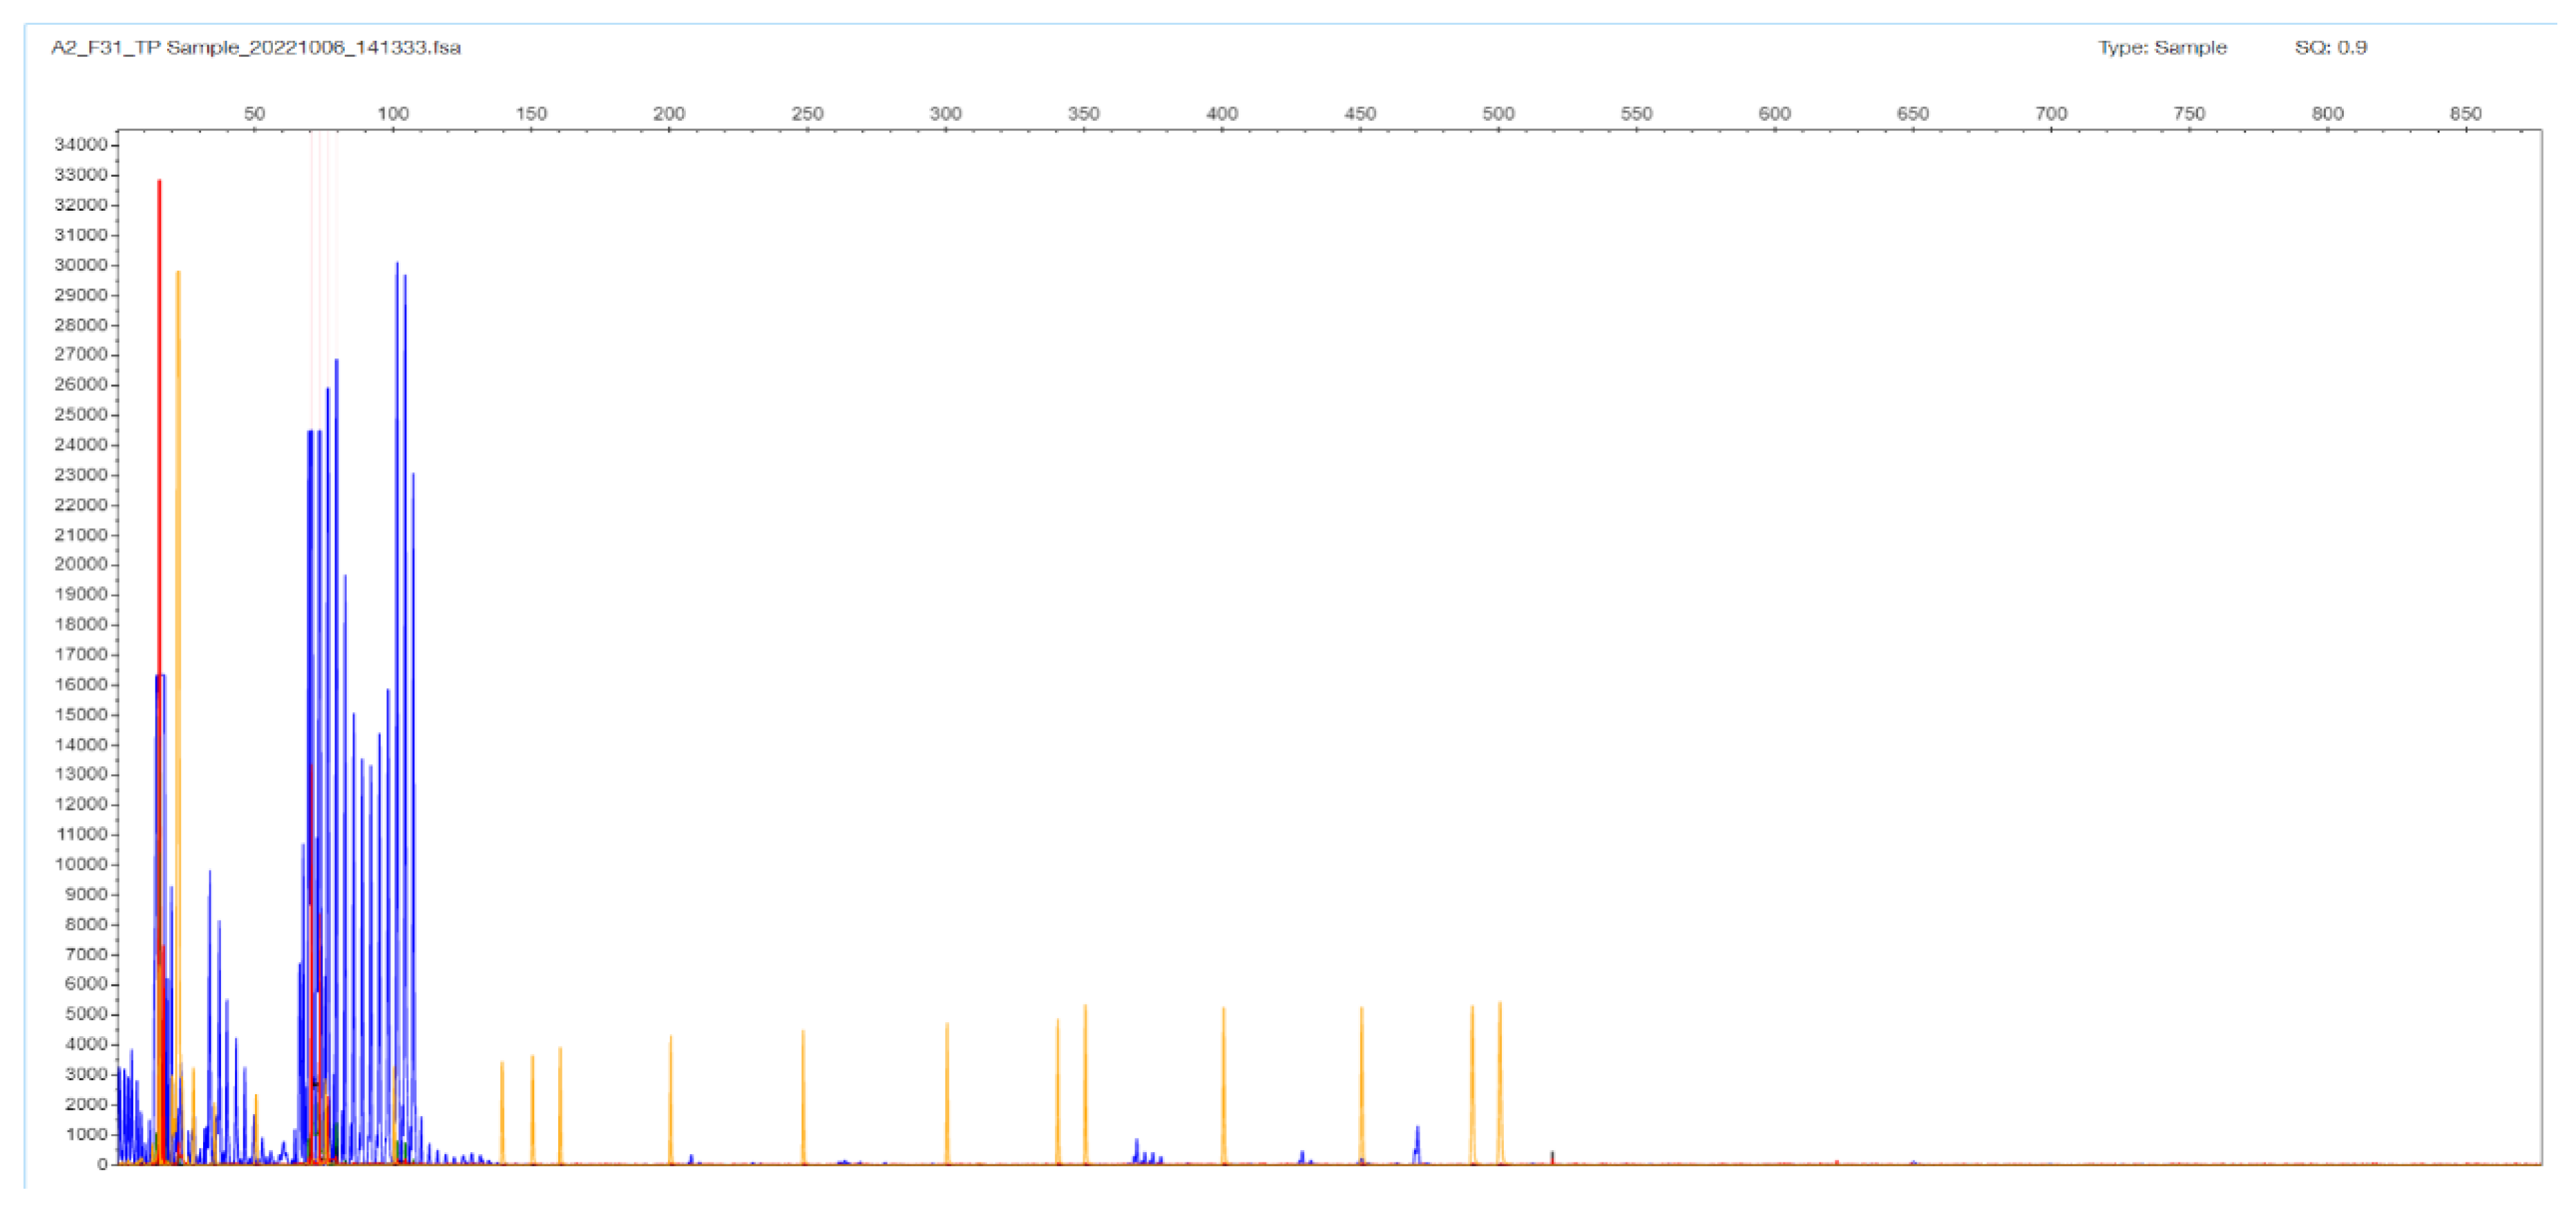
Figure 4.
F24 patient sample STR-PCR result with a single peak at 147 bp corresponding to 11 CTG triplets in the TCF4 gene (the sample is proven as normal 11/11 homozygote by DNA Sequencing).
Figure 4.
F24 patient sample STR-PCR result with a single peak at 147 bp corresponding to 11 CTG triplets in the TCF4 gene (the sample is proven as normal 11/11 homozygote by DNA Sequencing).
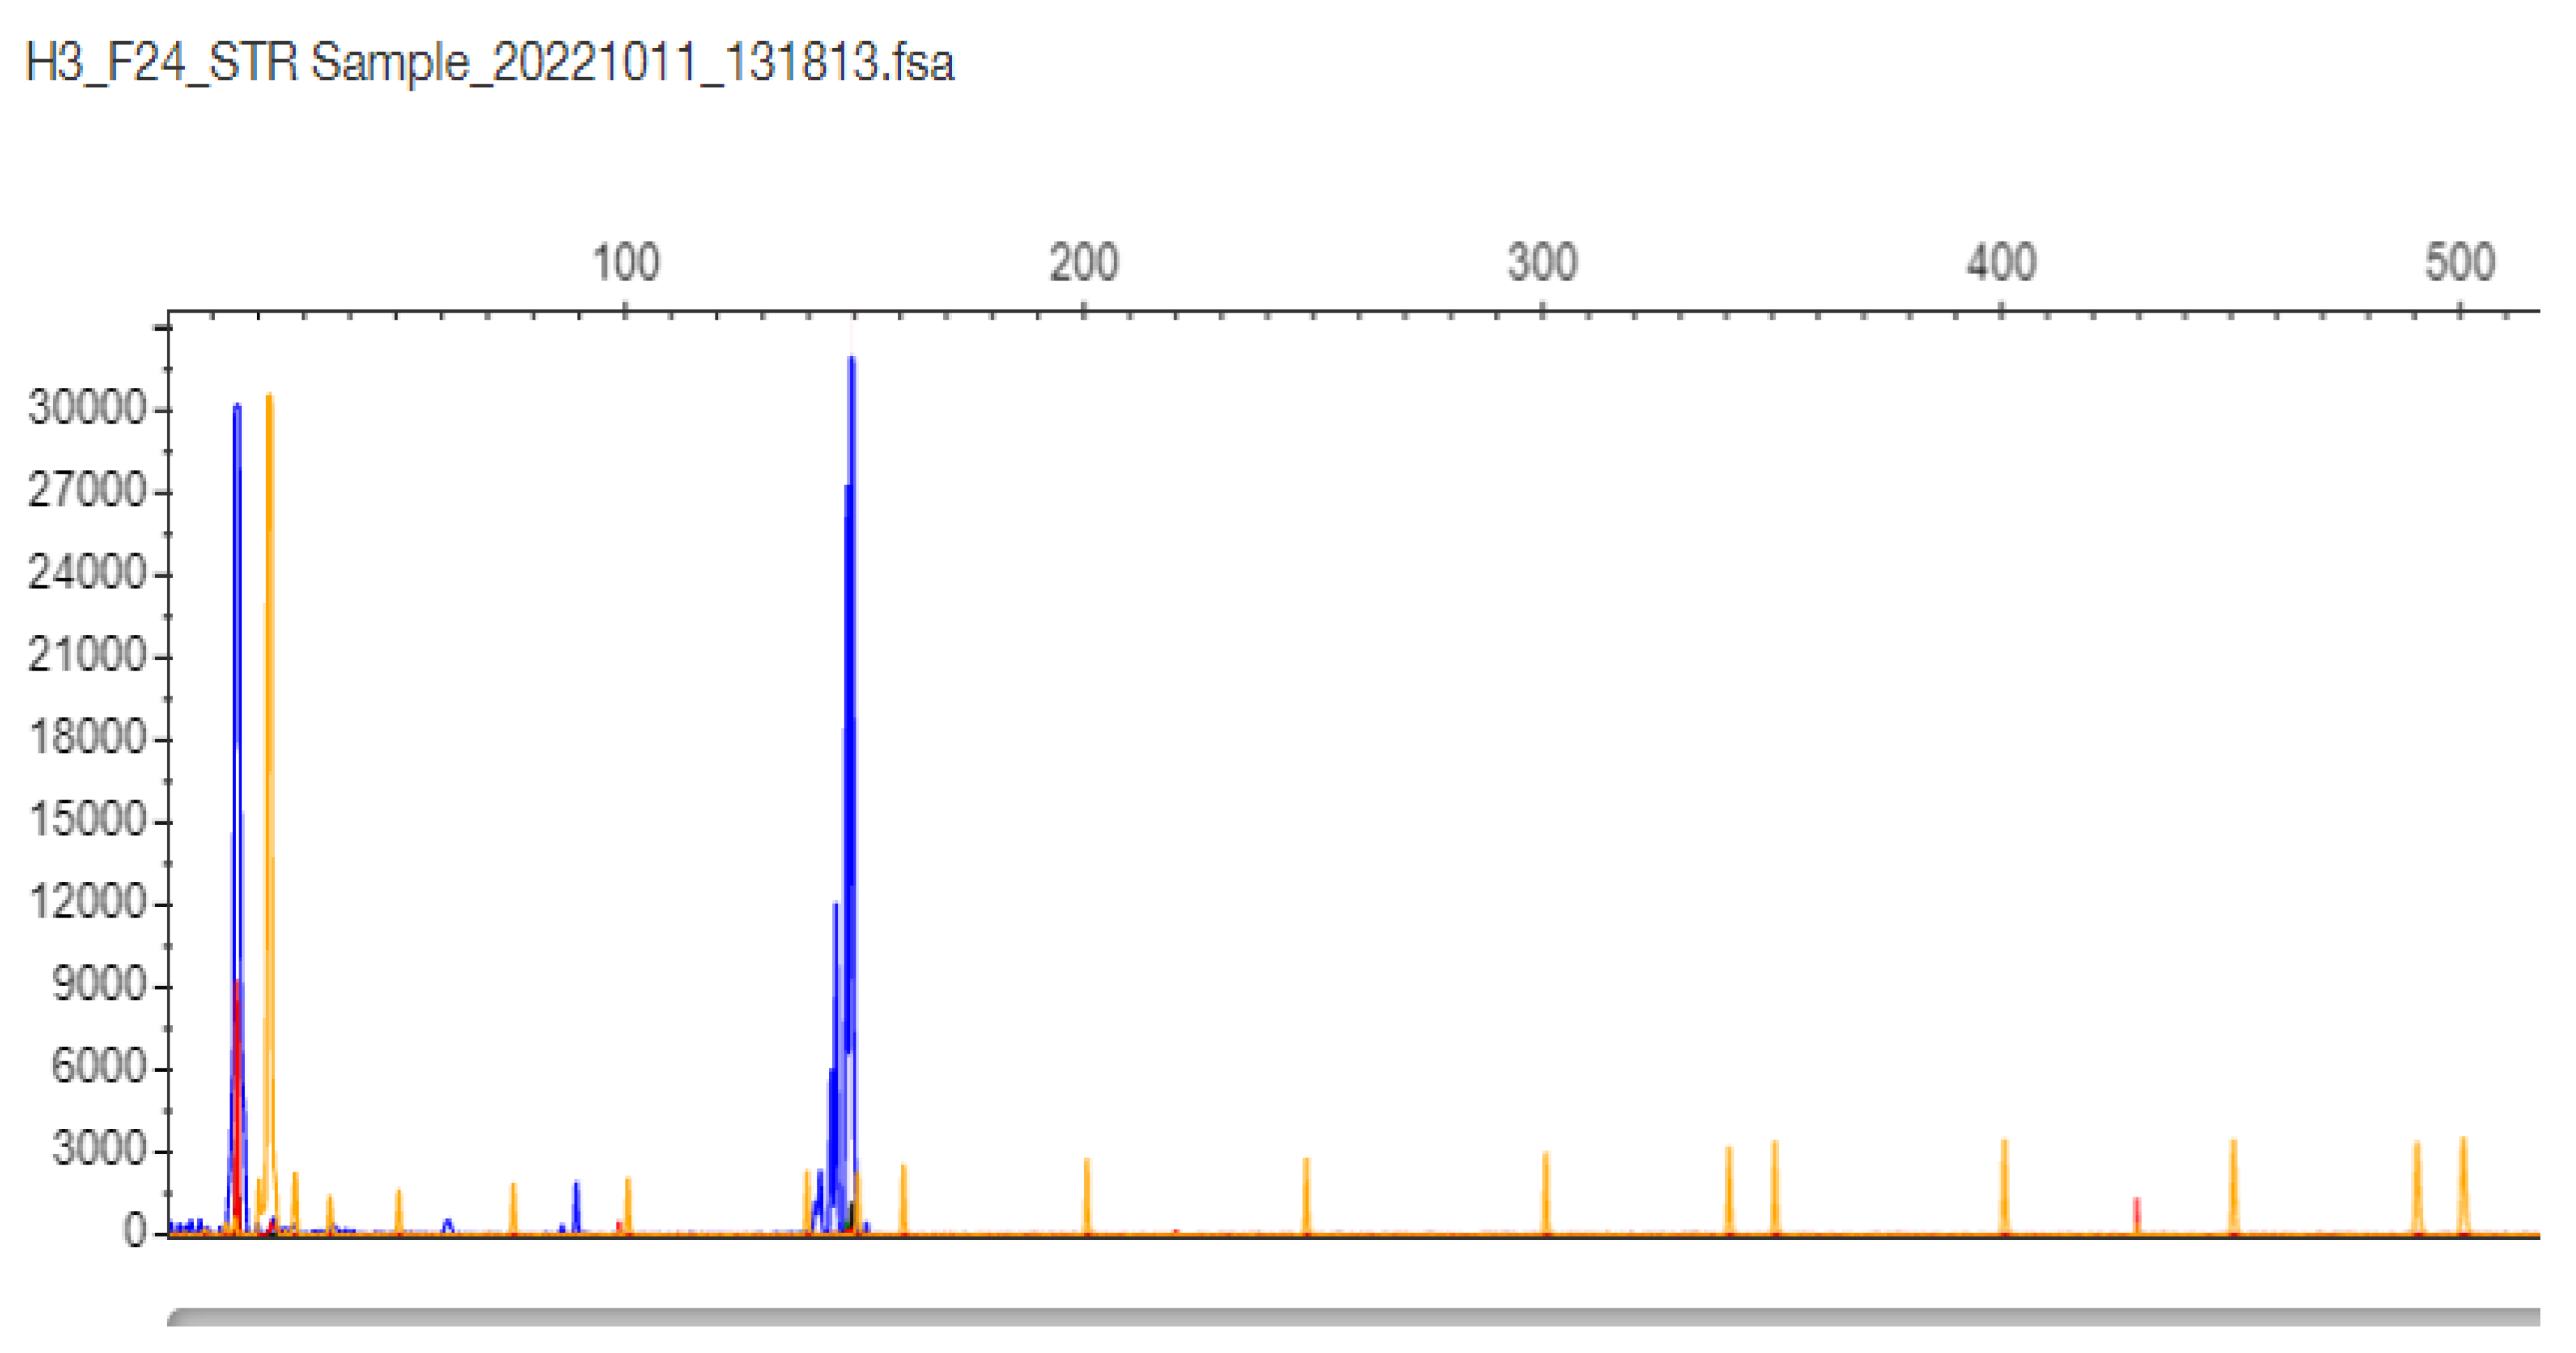
Figure 5.
F24 patient sample TP-PCR result with a single cluster with the last peak at 87 bp corresponding to 11 CTG triplets in the TCF4 gene (the sample is proven as normal 11/11 homozygote by DNA Sequencing).
Figure 5.
F24 patient sample TP-PCR result with a single cluster with the last peak at 87 bp corresponding to 11 CTG triplets in the TCF4 gene (the sample is proven as normal 11/11 homozygote by DNA Sequencing).
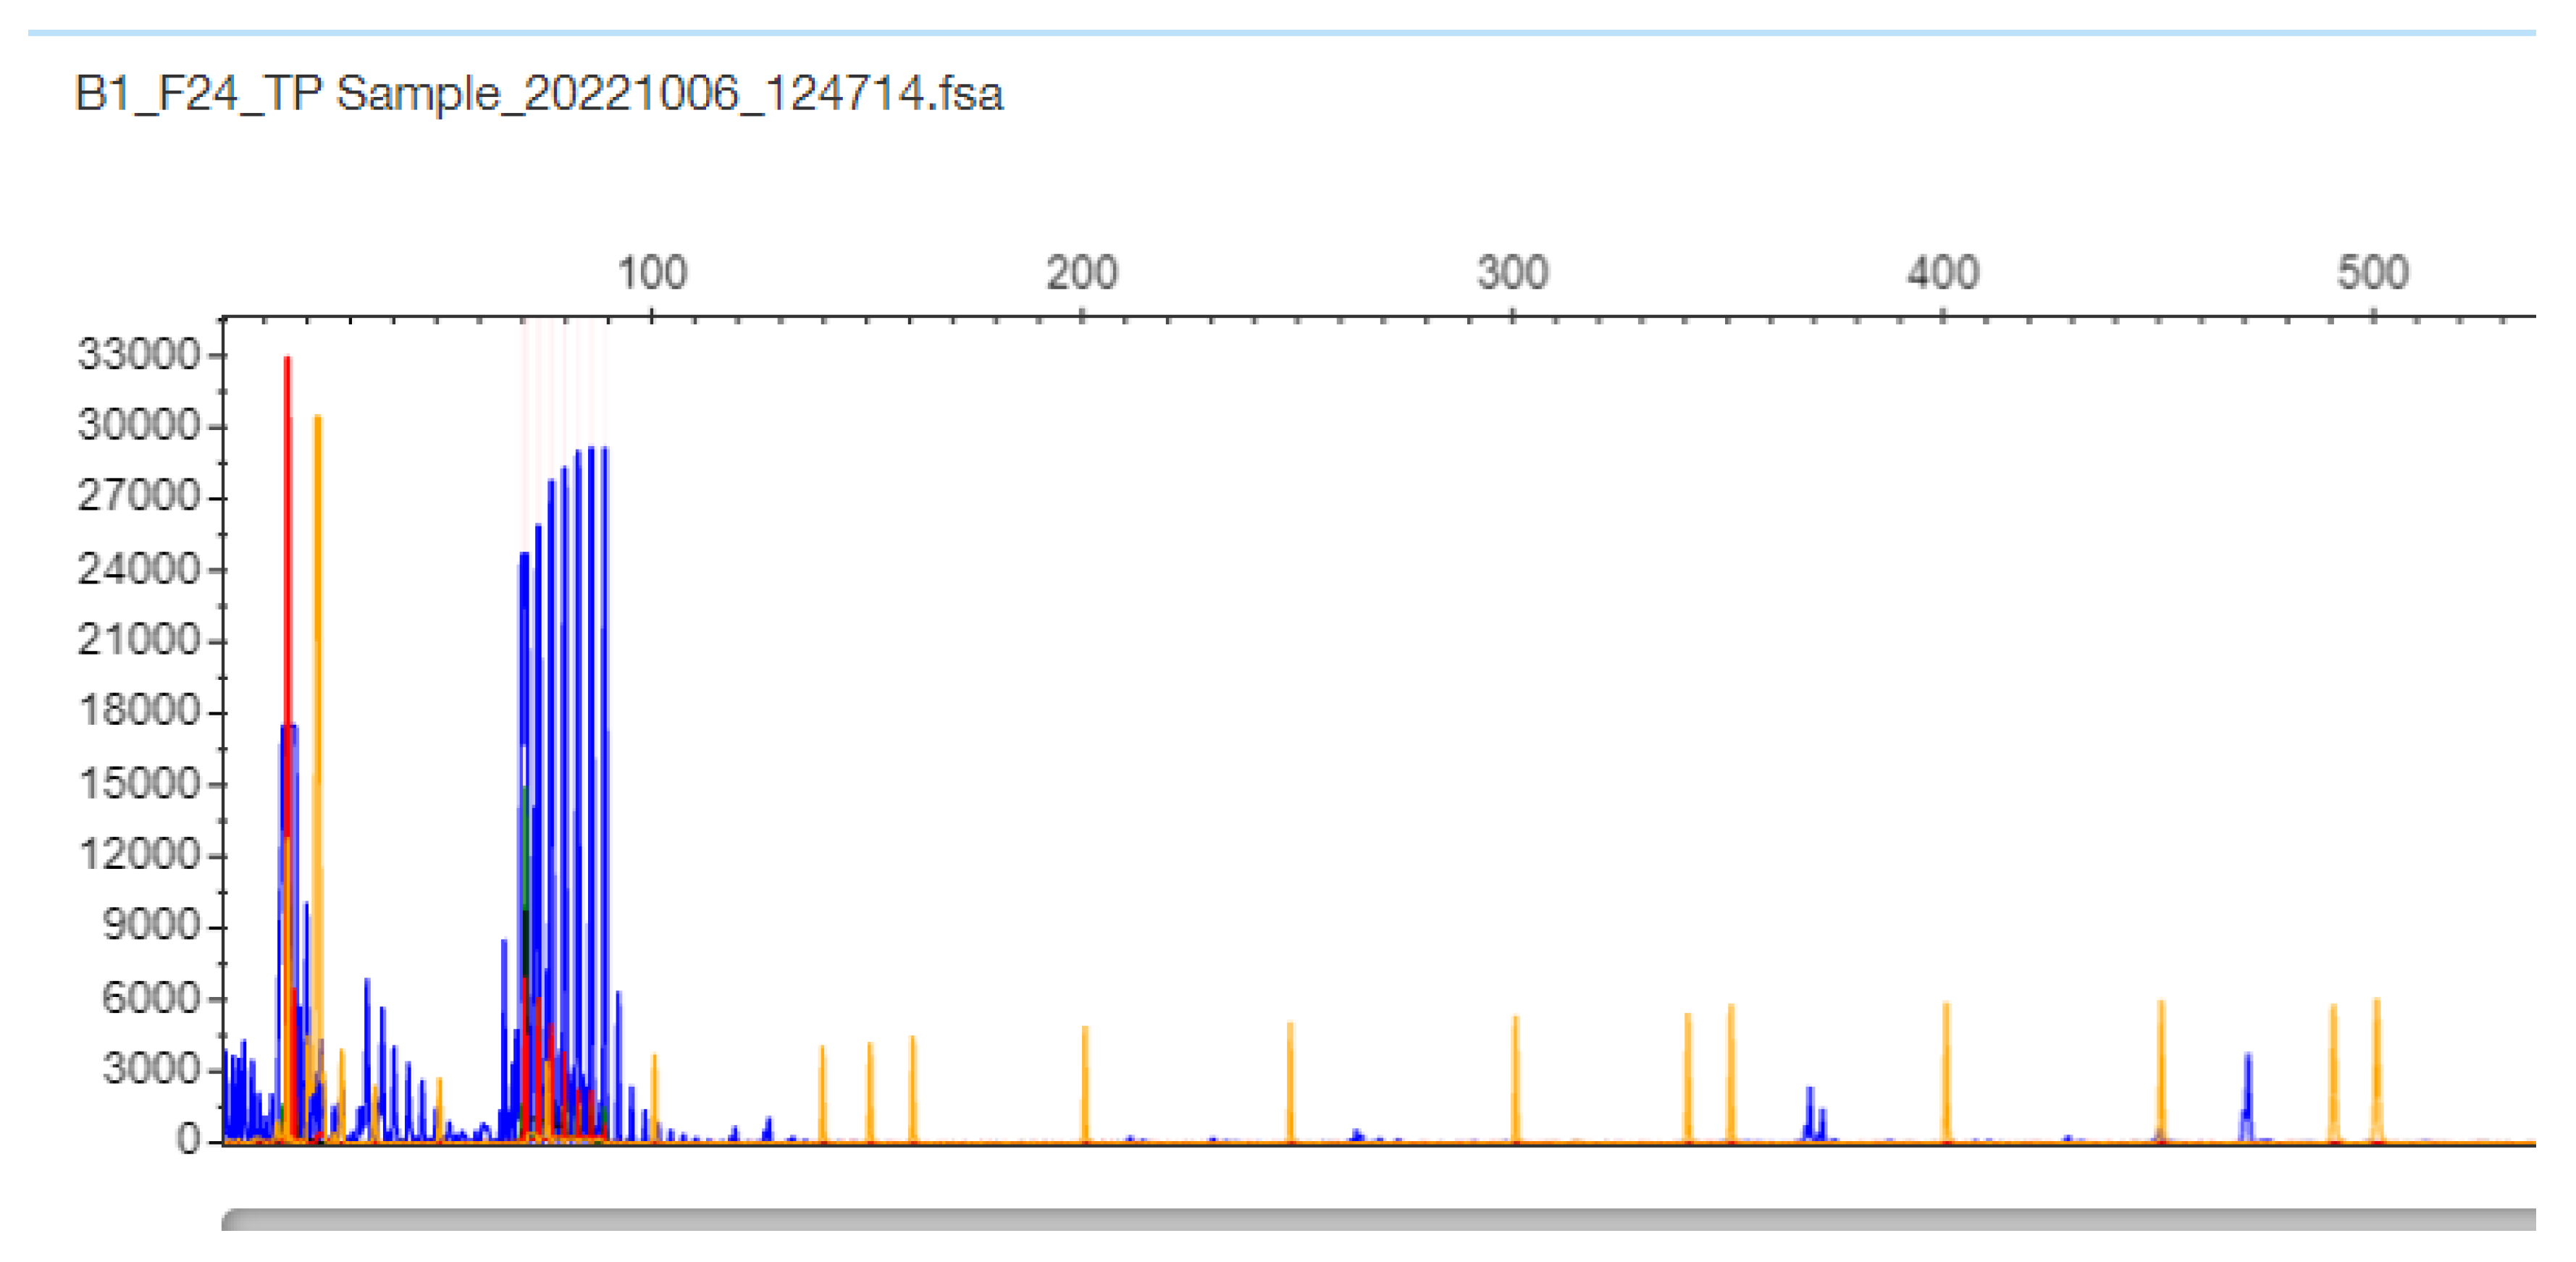
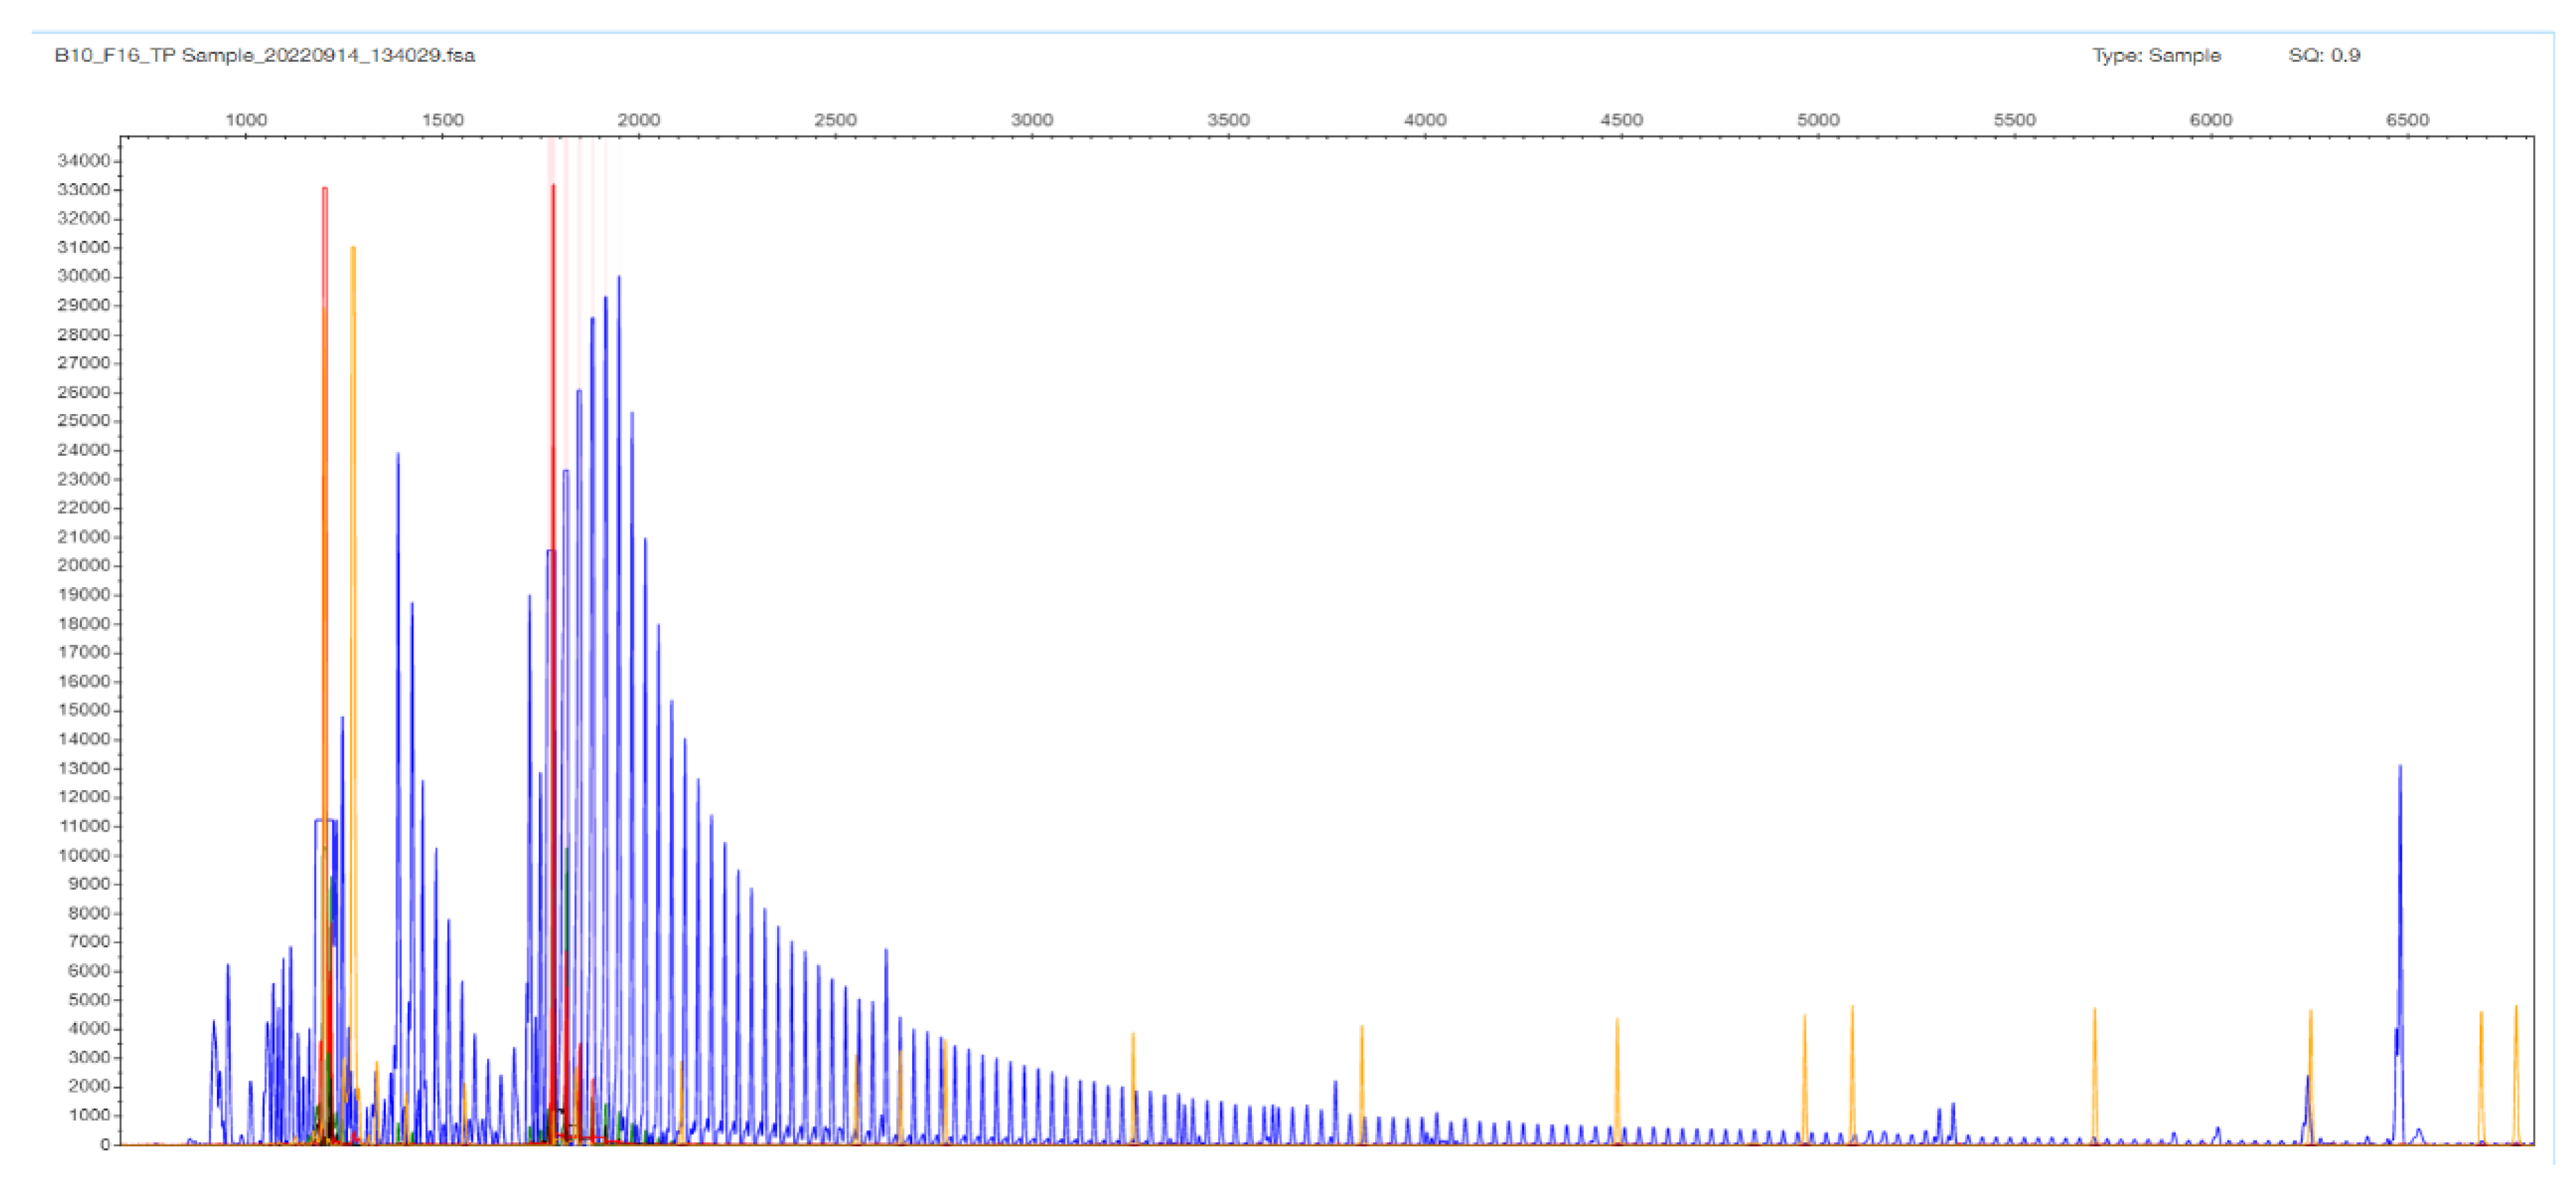
Figure 6.
F16 patient sample sample with no gel band or peak in the STR-PCR (not shown) but with a with a ladder appearance in the TP-PCR fragment analysis image. The expansion goes up to 452 bp that corresponds to 133 triplets in the TCF4 gene. The result is denoted as expanded (X/X); it is difficult to estimate the exact number of the triplets in both chromosomes.
Disclaimer/Publisher’s Note: The statements, opinions and data contained in all publications are solely those of the individual author(s) and contributor(s) and not of MDPI and/or the editor(s). MDPI and/or the editor(s) disclaim responsibility for any injury to people or property resulting from any ideas, methods, instructions or products referred to in the content. |
© 2025 by the authors. Licensee MDPI, Basel, Switzerland. This article is an open access article distributed under the terms and conditions of the Creative Commons Attribution (CC BY) license (http://creativecommons.org/licenses/by/4.0/).
Copyright: This open access article is published under a Creative Commons CC BY 4.0 license, which permit the free download, distribution, and reuse, provided that the author and preprint are cited in any reuse.


