
Submitted:
06 October 2025
Posted:
07 October 2025
You are already at the latest version
Abstract
An 8-week study was conducted to evaluate the effects of dietary marine protein hydrolysates as fish meal replacers in low-fish diets on the growth performance, feed utilization, and health status of Asian seabass (Lates calcarifer). The high fish meal (HFM) diet contained 25% fish meal, while the low fish meal (LFM) diet replaced 60% of the fish meal with soybean meal. Three experimental diets were formulated by supplementing the LFM diet with 5% tuna hydrolysate (TH), 2% shrimp hydrolysate (SH), and 5% salmon silage (SS), each replacing an equivalent amount of fish meal. These diets were designated as LFM+TH, LFM+SH, and LFM+SS, respectively. The results showed that the LFM+TH diet significantly improved percent weight gain, average daily growth, specific growth rate, protein efficiency ratio, and feed conversion ratio compared to the LFM diet (P< 0.05), without negatively affecting feed intake or metabolic markers. Histological analysis revealed improved villus length and goblet cell count in the intestine, indicating better nutrient absorption (P< 0.05). However, no significant differences were observed in hematological and immunological parameters, blood plasma metabolic markers, or carcass proximate composition (P>0.05). Furthermore, the LFM+TH diet exhibited superior survival rates under ammonia stress, highlighting its potential to enhance stress tolerance. These findings suggest that marine protein hydrolysates, particularly 5%TH, can serve as a sustainable and efficient alternative to fish meal protein in diets with up to 60% with soybean meal compensation, promoting better growth and survival in Asian seabass.
Keywords:
Asian seabass
; marine protein hydrolysates
; growth performance
; feed utilization
; health status
1. Introduction
Asian seabass (Lates calcarifer) is a high-value species and widely farmed in the Asia Pacific region, particularly in countries like Australia, Indonesia, Malaysia, Philippines, Taiwan and Thailand [1,2,3]. As a carnivorous species, it requires a high protein diet, typically consisting of 40-50% protein [1,2], often sourced from fish meal (FM), which provides an excellent amino acids profile, omega-3, fatty acids and contributes to dietary palatability [4,5]. However, the increasing cost and demand for FM has led to the exploration of alternative protein sources in aquafeeds.
Despite various studies investigating plant- and animal- based FM substitutes, challenges such as amino acids imbalance, anti-nutritional factors, and reduced palatability remain, impacting growth and utilization in carnivorous diets [6,7,8,9,10,11].
Marine pro[12,13tein hydrolysates, derived from seafood processing by-products including heads, skin, bones, and viscera [12,13], providing high-quality protein with excellent functional properties, including enhanced palatability, health benefits, and high digestibility. These hydrolysates are rich in bioactive peptides and free amino acids, which not only improve feed palatability but also to stimulate feed intake. As a result, they are widely used as feed ingredients in animal feed, offering significant nutritive value [14]. Several studies have highlighted that supplementing 1-6% protein hydrolysates in low-fish meal diets improves feed intake, feed utilization, growth performance, and health in aquaculture species such as Asian seabass [9,15], Atlantic salmon (Salmo salar) [16], European seabass (Dicentrarchus labrax) [17], Snakehead fish (Channa striata) [11], Olive flounder (Paralichthys olivaceus) [6,10,18,19,20], Red seabream (Pagrus major) [8,20], and Nile tilapia (Oreochromis niloticus) [21].
While many plant- and animal-based alternatives to fish meal have been studied, issues like amino acid imbalance and poor palatability limit their use in carnivorous fish such as Asian seabass [7,8,9,13,14,22]. Marine protein hydrolysates offer promise due to their bioactive peptides, but direct comparisons among types (tuna, shrimp, salmon) and their effects on health and stress tolerance in Asian seabass are limited. This highlights the need for comprehensive evaluation of different marine hydrolysates as fish meal replacements in seabass diets.
Therefore, the present study aims to evaluate the effect of marine protein hydrolysates including tuna hydrolysate (TH), shrimp hydrolysate (SH), and salmon silage (SS) as dietary supplements replacing fish meal on growth performance, feed utilization, nutrients digestibility, health status, histological changes, and stress tolerance in Asian seabass.
2. Materials and Methods
2.1. Experimental Diets
Five isonitrogenous (48% crude protein), isolipidic (11% crude lipid), and isocaloric (19 MJ kg-1) diets were formulated. Marine ingredients, tuna hydrolysate (TH), shrimp hydrolysate (SH), and salmon silage (SS) with their chemical composition, molecular weight distribution, and amino acid profiles are shown in Table 1. TH was derived from tuna viscera via enzymatic hydrolysis, SH from shrimp processing waste (35–45% inedible), and SS from category 3 salmon by-products treated with 2% formic acid and gut enzymes. All marine ingredients were provided by Marine and Feed, SPF Diana Thailand Co.,Ltd (Symrise group). A high-FM diet (HFM) contained 25% fishmeal, while a low-FM diet (LFM) replaced 60% of fishmeal with soybean meal. Three additional diets were based on LFM, supplemented with 5% TH, 2% SH, or 5% SS, and balanced for essential nutrients.
Experimental diets (Table 2) were prepared by blending powdered ingredients with marine protein hydrolysates, fish oil, and soybean oil, then adding 30% water. The mixture was pelletized using a single-screw extruder (Model EXT15HP3V03, Siam Farm Services Co., Ltd., Thailand) with a 2 mm die, dried at 90 °C for 4 hours, and stored at −20 °C. Random samples were analyzed for chemical composition, peptide profile, and amino acid profile (Table 2 and Table 3).
2.2. Experimental Animals and Conditions and Feeding Procedure
The experiment was conducted at Aqualis APAC testing center, SPF Diana (Thailand) Co., Ltd., using juvenile Asian seabass with body weight of 1-2 g. The fish were acclimatized to freshwater for two weeks and fed a commercial diet (PROFEED No. 902, Thia Union Feed mill PLC, Thailand) containing 42% crude protein and 12% crude lipid. The tanks were equipped with a recirculating water system, maintained optimal water quality parameters including dissolved oxygen (5.42±0.99 mg L-1), pH (7.41±0.17), temperature (26.76±1.52 °C), ammonia (0.13±0.06 mg L-1), nitrite (0.42±0.10 mg L-1) and alkalinity (104.3±21.1 mg L-1). A group of 50 fish with a mean initial weight of 2.62±0.01 g fish-1 was distributed into twenty-five 500L plastic PE tanks and each tank was fed one of five experimental diets, twice a day (8.00h and 16.00h) by ad libitum for 8 weeks, with feeding stopping once fish showed slow feeding response.
2.3. Sample Collection
At the end of the 8-week feeding trial, the fish were fasted for 24 hours and then individually weighed to determine their final body weight. Prior to sampling, the fish were anesthetized with a 2-phenoxyethanol solution (2 mg L-1). Blood samples were collected from the caudal vein of two fish per replicate (a total of 10 fish per treatment) using a 1-mL sterile syringe with a 23-gauge needle containing 1 mL of precooled anticoagulant (heparin injection BP 25,000 IU, Gland Pharma Limited, India). The blood samples were then transferred to heparinized tubes for hematological and immunological analyses. For blood plasma were centrifuged at 10,000 rpm for 10 min to separate the plasma. Plasma samples were preserved at -80 °C until use. The intraperitoneal fat, liver, and whole viscera were also collected and quickly weighed for intraperitoneal fat, hepatosomatic index, and viscerosomatic index. The sample of liver and intestine were fixed in 10% formalin buffer for histological analysis. Additionally, two fish per replicate (a total of 10 fish per treatment) and 10 fish from the initial carcass were collected and stored at −20 °C for carcass proximate composition analysis.
2.4. Analytical Methods
2.4.1. Growth Performance and Feed Utilization
This data was utilized to calculate growth performance, feed utilization, and survival rate using the following equation:
Percent weight gain (%) = 100×(final body weight (g fish-1) – initial body weight (g fish-1)/ day of feeding (day)
Average daily growth (g day-1) = (average final body weight (g fish-1) – average initial body weight (g fish-1))/ day of feeding (day)
Specific growth rate (% day-1) = 100×(In final body weight (g fish-1) – In average initial body weight (g fish-1)/ day of feeding (day)
Feed conversion ratio = dry feed intake (g fish-1) – body weight gain (g fish-1)
Protein efficiency ratio = 100×(body weight gain (g fish-1)/protein intake (g fish-1))
Nitrogen retention (%) = 100×(nitrogen gain (g fish-1)/nitrogen intake (g fish-1))
Lipid retention (%) = 100×(lipid gain (g fish-1)/lipid intake (g fish-1))
Intraperitoneal fat (%) = 100×intraperitoneal fat weight (g)/body weight (g fish-1)
Hepatosomatic index (%) = 100×liver weight (g)/ body weight (g fish-1)
Viscerosomatic index (%) = 100×viscera weight (g)/ body weight (g fish-1)
Survival rate (%) = 100×(initial fish number (fish) – final fish number (fish)/initial fish number (fish)
2.4.2. Hematological Parameters Analysis
The heparinized blood samples were analyzed for hematological parameters. Red blood cell count and white blood cell count were determined using a Neubauer hemocytometer, following the method of Blaxhall and Daisley [23]. The packed cell volume was measured using the standard microhematocrit method and expressed as a percentage, as outlined by England and Walford [24]. Hemoglobin levels were determined using cyanmethemoglobin method according to Blaxhall and Daisley [23]. The mean corpuscular hemoglobin concentration (MCHC) was calculated based on the method described by Blaxhall and Daisley [23].
2.4.3. Immunological Parameters Analysis
Lysozyme activity was measured using a turbidimetric assay, as described by Parry et al. [25] with slight modifications. Briefly, 10 µL of blood plasma sample was added to 250 µL of 0.2 mg L-1 of Micrococcus lysodeikticus suspension (ATCC No. 4698, Sigma-Aldric, USA). The reaction was conducted at 25 °C, and absorbance was measured at 540 nm after 0.5 and 5.5 min with microplate reader. One unit of lysozyme activity was defined as the amount of sample caused a 0.001 min-1 reduction in absorbance. The antioxidant enzyme activities including NBT activity were assessed by reduction of nitroblue-tetrazolium (NBT) to blue formazan adapted from Song and Hsieh [26], Superoxide dismutase activity (SOD) was assessed with 19160 SOD determination kit (Sigma-Aldric, Germany), Catalase activity (CAT) was measured using K-CATAL 07/19 (Magazyme, UK) and Clearance efficiency of blood plasma was assessed using a modified method from Kewcharoen and Srisapoome [27].
2.4.4. Blood Plasma Metabolic Markers Analysis
The blood plasma metabolic markers parameters were analyzed, including cholesterol (enzymatic, OXI/PER), triglyceride (enzymatic, OXI/PER), glucose (enzymatic, oxidase), albumin (colorimetric, BGC), total protein (colorimetric, biuret), creatinine (enzymatic, jiffe), aspartate transaminase (Kinetic, IFCC) and alkaline phosphatase (kinetic, IFCC). Thes analyses were conducted using an automatic biochemistry analyzer (BA400; BioSystems, Spain).
2.4.5. Histological of Liver and Intestine Analysis
After being preserved in 10% formalin for 24 h, histological analysis of liver and intestine was performed following the methods outlined by Clark [28]. The liver and intestine were carefully dissected using sterilized surgical scissors, and serial histological sections were prepared. The samples were dehydrated by immersion in increasing concentrations of ethanol up to 100%, before being embedded in paraffin. Tissue sections, 4-5 µm thick, were stained with hematoxylin and eosin (H&E) to assess general morphology. Images were captured using a digital microscope camera at magnification of 4X,10X and 40X (Nikon, NIS-Elements software).
2.4.6. Carcass Composition Analysis
The proximate composition of whole-body fish, including dry matter, crude protein, crude lipid and crude ash was analyzed following the methods described by AOAC [29]. Analysis performed by Agricultural development research center in northeast Thailand, Faculty Agriculture, Khon Kaen University: dry matter (AOAC official method 934.01), crude protein (Kjeldahl method, total N×6.25), crude lipid (AOAC official method 2003.05, Soxhlet extraction), and ash (AOAC official method 942.05).
2.5. Digestibility Analysis
2.5.1. In Vitro Protein Digestibility of Marine Ingredients and Experimental Diets
The digestive enzymes were extracted from another set of anterior intestine tissues of 10 Asian seabass (approximately 25–30 g body weight), following the method of Rungruangsak-Torrissen et al. [30]. The anterior intestine tissues were homogenized in 50mM Tris-HCl buffer, pH 8 containing 200 mM NaCl (1:5 w/v). The homogenate was centrifuged at 12,000 rpm at 4 °C for 30 min and supernatant was collected and stored at -20 °C to determine the In vitro protein digestibility.
In vitro protein digestibility of marine ingredients and experimental diets was evaluated using the modified method of Rungruangsak-Torrissen et al. [31] and Rungruangsak-Torrissen [32]. A 30 mg protein sample (dry basis) was incubated with 40 mL of phosphate buffer (50mM, pH8.2) and 200 µL of chloramphenicol phosphate (0.5%) at 200 rpm, 30 °C for 24 h, followed by the addition of 500 µL of dialyzed crude enzyme extract. The digested solution was analyzed by mixing 200 µL of the solution with 2 mL phosphate buffer (50mM, pH 8.2), and 0.1% Trinitrobenzene sulphonic acid (TNBS), then incubating at 60 °C for 1h. The reaction was stopped with 1 mL HCl (1M), and protein digestibility was measured spectrophotometrically at 420 nm using DL-alanine as a standard.
In vitro protein digestibility of marine ingredients and experimental diets was evaluated using the modified method of Rungruangsak-Torrissen et al. [31] and Rungruangsak-Torrissen [32]. A 30 mg protein sample (dry basis) was incubated with 40 mL of phosphate buffer (50mM, pH8.2) and 200 µL of chloramphenicol phosphate (0.5%) at 200 rpm, 30 °C for 24 h, followed by the addition of 500 µL of dialyzed crude enzyme extract. The digested solution was analyzed by mixing 200 µL of the solution with 2 mL phosphate buffer (50mM, pH 8.2), and 0.1% Trinitrobenzene sulphonic acid (TNBS), then incubating at 60 °C for 1h. The reaction was stopped with 1 mL HCl (1M), and protein digestibility was measured spectrophotometrically at 420 nm using DL-alanine as a standard.
2.5.2. In Vivo Estimation of Apparent Digestibility Coefficients
The In vivo digestibility experiment was conducted using a similar protocol as the growth experiment, incorporating 1% chromium oxide (Cr2O3) in the diet as an inert marker. Fecal samples were collected twice daily from each tank at 10.00h and 17.00h by siphoning. The samples were filtered to remove excess water and then stored at -20 °C. Afterward, the fecal samples were dried overnight at 60 °C, ground and stored at -20 °C for further analysis. Chromium oxide levels in both diets and fecal samples were determined according to Austreng method [33] and apparent digestibility coefficients (ADCs) were calculated according to Cho et al. [34].
2.6. Ammonia Stress Challenge Test
After the 8-weeks of feeding experiment, an ammonia challenge was performed. The 96 h of LC50 for ammonia was previously determined to be 49.049 mg L-1, as described by Lin and Chen [35]. Before the challenge, fish from each treatment group were pooled and distributed into three tanks, with 25 fish per tank. Ammonium chloride, NH4Cl (>99.5% purity, Ke Huan, China) was diluted to the desired concentration and the challenge water was statically renewed by exchanging 50% of the water containing the same ammonia concentration during the experiment, the fish were starved. Mortality was monitored and recorded over a 120-h period. At the end of the challenge, blood samples were collected from six fish (two from each replicate). The blood was drawn individually from the caudal vein using 1-mL sterile syringe with a 23-gauge needle containing 1 mL precooled anticoagulant (heparin injection BP 25000 IU, Gland pharma limited, India) and then transferred to heparinized tubes for hematological, immunological, blood plasma metabolic markers, (blood analyzer, BA400, BioSystems, Spain), serum electrolytes parameters (IDEXX Catalyst One Chemistry analyzer, USA) and cortisol levels (CMAI method; IMMULITE 1000-Siemens Healthiness).
2.7. Statistical Analysis
Experimental diets were assigned according to a completely randomized design. Statistical analysis of the data was conducted using SPSS program version 23, employing one-way ANOVA followed by Tukey’s multiple comparison test at a significance level of 5% (P<0.05). This approach allowed for the assessment of differences among the treatment groups.
3. Results
3.1. Growth Performance and Feed Utilization
In this 8-week study, Asian seabass fed the LFM+TH diet showed significantly better growth (final body weight, body weight gain, average daily growth and specific growth), feed efficiency, and protein utilization than those fed LFM, LFM+SH, or LFM+SS diets (P<0.05), and performed similarly to the HFM group (P>0.05). Feed intake was highest in HFM, LFM+TH, and LFM+SS groups, while LFM+SH was lowest (P<0.05). The best feed conversion ratio was seen in LFM+TH and HFM diets. Protein efficiency was highest in LFM+TH. No significant differences were found among diets for nitrogen/lipid retention, fat indices, or organ indices. Survival was lowest in the LFM group (P<0.05) (Table 4).
3.2. Hematological and Immunological
Hematological and immunological parameters, including red blood cell count (RBC) and white blood cell count, hematocrit, hemoglobin, mean cell hemoglobin concentration (MCHC), nitro tetrazolium activity (NBT), superoxide dismutase activity (SOD) and catalase activity (CAT) did not show any significant differences compared to both HFM and LFM diets (P>0.05) (Table 5). However, the lysozyme activity in fish fed LFM+TH diet was significantly higher than in the other diets (P<0.05), although no significant difference was observed compared to LFM+SH diet (P>0.05). There were no significant differences in lysozyme activity between the fish fed HFM, LFM+SH and LFM+SS diets (P>0.05), while the LFM diet exhibited significantly lower activity than all other diets (P<0.05) (Figure 1A). Total immunoglobulin (total Ig) levels did not differ significantly across all dietary treatments, ranging from 89.61 to 115.61 µg mL-1 (P>0.05) (Figure 1B). The plasma clearance efficiency, which assessed the inhibitory effect against Aeromonas hydrophila (10.40% to 11.68%) and Streptococcus agalactiae (1.41% to 3.07%), showed no significant differences across all dietary treatments (P>0.05) (Figure 1CD).
3.3. Blood Plasma Metabolic Markers
The analysis of blood plasma metabolic markers in Asian seabass including cholesterol, triglyceride, glucose, albumin, total protein, creatinine, aspartate transaminase and alkaline phosphatase, revealed no significant differences between the dietary treatments (P>0.05) (Table 6). These results indicated that the dietary treatments did not significantly influence the metabolic parameters assessed in Asian seabass.
3.4. Histological of Liver and Intestine
The histological examination of the liver and distal intestine of Asian seabass fed the experimental diets for 8 weeks revealed distinct differences (Figure 2A-D). Fish from all treatment groups exhibited normal liver parenchyma structure, with hepatocytes cords separated by sinusoids containing erythrocytes. The hepatocytes were large, with centrally located nuclei displayed prominent nucleoli (Figure 2A-B). Fish fed the HFM diet exhibited normal distal intestine structure, with elongated villi, absorptive vacuoles in the enterocytes, and well-defined villous core containing blood and lymph capillaries (Figure 2C-D: 1c,d). In contrast, fish fed LFM diet had a shorter villus in the distal intestine (Figure 2C-D: 2c,d). Fish on LFM+TH diet had a distal intestine structure similar to the HFM group (Figure 2C-D: 2c,d), with notable increase in villi length and goblet cells significantly higher than those fed the LFM, LFM+SH and LFM+SS diets (P<0.05), though no significant difference was found compared to the HFM diet (P>0.05) (Figure 3A). Fish fed the LFM+SH and LFM+SS diets displayed similar villi length and goblet cell counts, with no significant difference between these groups (P>0.05) (Figure 2C-D: 4c,d and 5c,d, 3A-B). The LFM diet showed significantly shorter villi and fewer goblet cells compared to other diets (P<0.05) (Figure 2C-D: 2c,d and 3A-B).
3.5. Carcass Proximate Composition
The carcass proximate composition of whole-body fish fed the experimental diets for 8 weeks is shown in Table 7. Carcass dry matter, protein, lipid and ash were not affected by the dietary treatments (P>0.05).
3.6. Nutrient Digestibility
3.6.1. In Vitro Protein Digestibility of Marine Ingredients and Experimental Diets
The protein digestibility of marine hydrolysates in the fish meal (65% crude protein) and TH groups (both 0.47±0.02 mMol DL-Alanine g-1 trypsin activity-1) was significantly higher compared to the SH and SS groups (0.14±0.02 mMol DL-Alanine g-1 trypsin activity-1 and 0.22±0.03 mMol DL-Alanine g-1 trypsin activity-1, respectively) (P<0.05). Moreover, the SH group exhibited significantly lower digestibility than the SS group (P<0.05) (Figure 4A). In terms of overall of In vitro protein digestibility in experimental diets found that LFM+TH diet (0.75±0.04 mMol DL-Alanine g-1 trypsin activity-1) showed a significantly higher value compared to all other diets (P<0.05). However, no significant differences were observed between the HFM, LFM, and LFM+SS diets (0.63±0.02 mMol DL-Alanine g-1 trypsin activity-1, 0.57±0.02 mMol DL-Alanine g-1 trypsin activity-1, and 0.61±0.03 mMol DL-Alanine g-1 trypsin activity-1, respectively), although these were significantly higher than the LFM+SH diets (0.49±0.01 mMol DL-Alanine g-1 trypsin activity-1) (P<0.05) (Figure 4B).
3.6.2. Apparent Digestibility Coefficients (ADCs)
The ADCs for dry matter, protein, and lipid are shown in Table 8. Fish fed HFM, LFM+TH and LFM+SS diets exhibited significantly higher ADC of dry matter than LFM and LFM+SH diets (P<0.05). ADC of protein was significantly higher in fish fed LFM+TH diet compared to that of LFM, LFM+SH and LFM+SS diets (P<0.05) but was no significant difference compared to HFM diet (P>0.05). No significant difference was observed in ADC of lipid among the treatments (P>0.05).
3.7. Ammonia Stress Challenge Test
After the ammonia challenges test, the survival rate of fish fed supplemented with marine hydrolysates ranged from 25.3% to 49.3% (Figure 5). The fish fed the LFM+TH diet showed a significantly higher survival rate (49.3±2.3%) compared to the other dietary treatments (P<0.05). The HFM diet (37.3±2.3%) also had a significantly higher survival rate than LFM diet (P<0.05). However, no significant were observed between the LFM (25.3±2.3%), LFM+SH (29.3±2.3%), and LFM+SS diets (25.3±2.3%) (P<0.05).
Cortisol levels in blood plasma of Asian seabass trended to decreased in fish fed with LFM+TH diet, although no significant differences were observed compared to HFM, LFM, and LFM+SH diets (P<0.05). However, fish fed the LFM+SS diet exhibited significantly higher cortisol levels after 120 h of ammonia challenge, compared to all other dietary groups, though no significant differences was observed when compared to the LFM diet (P<0.05) (Figure 6). Regarding hematological, immunological, blood plasma metabolic markers and serum electrolytes of Asian seabass after 120-h ammonia stress challenged as shown in Table 9, the results did not show any specific trend of changes due to supplementation of marine hydrolysates.
4. Discussion
This study showed that supplementing marine hydrolysates, especially TH, in a LFM diet significantly improved growth and feed utilization in Asian seabass. The LFM+TH diet yielded the best results, fully restoring performance despite a 60% fish meal replacement that otherwise reduced growth by 19%. This improvement is likely due to enhanced palatability and nutrient balance, consistent with previous findings using 2.5–3% TH [9,15]. The superior performance of TH can be attributed to its favorable molecular weight distribution and digestibility characteristics. Specifically, TH contained a high proportion of low molecular weight peptides in diet (<1000 Da, 54.1%) (Table 3), which are known to stimulate feed intake and improve nutrient absorption [6,8,9,10,11,15,36,37,38,39,40]. Additionally, the LFM+TH diet exhibited the highest in vitro protein digestibility (0.75±0.04 mMol DL-Alanine g⁻¹ trypsin activity⁻¹) (Figure 4) and significantly higher apparent protein digestibility coefficient (ADCp) compared to other treatments (Table 8), indicating better bioavailability of nutrients. These factors collectively contributed to improved feed intake, growth rate, and feed efficiency in Asian seabass fed the TH-supplemented diet. Furthermore, the activation of taste receptor cells (TRCs) by amino acids and low molecular weight peptides in TH may trigger orexigenic neuropeptides such as Neuropeptide Y (NPY) and Agouti-related protein (AgRP) [41,42,43,44,45,46,47], enhancing appetite and feed intake. Once ingested, these peptides may also activate the target of rapamycin (TOR) pathway and Insulin-like growth factor (IGF-I) signaling, promoting protein synthesis and growth [36,47,48,49,50,51,52,53,54,55,56,57,58,59,60,61,62,63,64,65,66,67]. Therefore, the previous studies not only support the observed growth recovery in our study but also validate the proposed mechanisms involving peptide bioactivity, nutrient signaling, and metabolic regulation.
Hematological and immunological parameters are key indicators of fish health and nutrition [22]. In this study, marine protein hydrolysate supplementation did not significantly affect these parameters in Asian seabass, except for lysozyme activity. This aligns with previous studies in Asian seabass [68], pompano (T. blochii) [69], snakehead fish (C. striata) [11], and red seabream (P. major) [18,20], as well as olive flounder (P. olivaceus) [6,10,20], which also found no significant changes in hematological indices. However, several studies reported increased lysozyme activity with hydrolysate supplementation in Asian seabass [22], pompano (T. blochii) [69], olive flounder (P. olivaceus) [10], red seabream (P. major) [20], yellow croaker (P. crocea) [70], Japanese sea bass (L. japonicus) [71], and juvenile coho salmon (Oncorhynchus kisutch) [72]. Some studies, however, found no effect on lysozyme activity [9,11,18,37,40,71]. Overall, marine protein hydrolysates may not alter all hematological or immunological parameters but can influence specific immune responses like lysozyme activity. Effects may depend on species, hydrolysate concentration, and supplementation duration. Further research is needed to clarify these immune-modulating mechanisms and their health benefits.
Blood plasma metabolic markers parameters are commonly used as physiological indicators to assess the health status of fish [73]. In the current study, dietary supplementation of marine protein hydrolysates had no significant effect on the blood plasmas metabolic markers parameters of Asian seabass, which is consistent with previous studies [22,74]. Similarly, Pham et al. [69] found that dietary TH supplementation in pompano (T. blochii) had no significant impact on blood plasma metabolic markers parameters, except for total protein. On the other hand, fish fed diets containing 6.1% to 12.2% fish protein hydrolysates in Asian seabass showed significantly lower plasma glucose levels compared to the control group [68], a result also reported in olive flounder (P. olivaceus) and red seabream (P. major) fed LFM diets supplemented with TH or SH [20]. In contrast, Asian seabass fed LFM supplemented with 2.5%TH exhibited a significant increase albumin level compared to those fed LFM diet [9].
Histological analysis showed normal liver architecture in all fish, with large hepatocytes arranged in cords and separated by sinusoids containing erythrocytes. This correlates with serum levels of creatinine, aspartate transaminase (AST), and alkaline phosphatase (ALP), commonly used for the detection of liver damage or organ dysfunction in fish species [14,75,76,77].
The intestinal epithelium of fish, which includes villi, microvilli, and goblet cells, is highly responsive to dietary changes. A deficiency in nutrients and impaired absorption lead to structural alterations in the intestinal, such as a reduction in villi length and decrease in the number of goblet cells, ultimately compromising immune function [68]. In the present study, it was found that marine protein hydrolysates supplementation (TH, SH, and SS) significantly increased villi length and goblet cell count in the intestines of Asian seabass compared to the LFM diet, with TH-fed fish showing the most significant improvement. This increase in villi length and goblet cell count in TH-fed fish was even greater than in the HFM-fed fish group, indicating a full recovery of intestinal functions. Similar findings were reported in previous studies in various fish species, including Asian seabass [9,67,68], olive flounder (P. olivaceus) [6,10], red seabream (P. major) [6], and European seabass (D. labrax) [17,78]. The increasing villi length leads to a larger surface area in intestine, improving nutrient absorption [79]. In contrast, high plant-based protein diets have been shown to negatively affect fish gut health, particularly by shortening villi length. Some studies in various fish species reported that Atlantic salmon (S. salar) [80], rainbow trout (O. mykiss) [81], Japanese seabass (L. japonicus) [82], pompano (T. blochii) [69], and olive flounder (P. olivaceus) [6,10] do not cause significant intestinal inflammation or histological changes, although it may reduce growth performance due to altered metabolic status. However, Domeneghini et al. [83] also revealed a positive relationship between higher goblet cells numbers and elevated mucosal membrane protection. Siddik et al. [68] also assumed that the increment of goblet cells in Asian seabass fed fish protein hydrolysates could be attributed to the enhanced immunity against invading microorganisms. Previous studies have not reported any histopathological changes in the livers Asian seabass associated with soybean meal-based diets [7,9]. While hepatic alterations such as cytoplasmic vacuolization and increased lipid accumulation were observed in juvenile Asian seabass fed containing more than 20% fish protein hydrolysates, no such liver changes were observed in the present study. Additionally, biochemical parameters like creatinine, alkaline phosphatase and aspartate transaminase did not show significant differences among the treatments. This suggests that the inclusion of marine protein hydrolysates in the diets did not cause any hepatocellular damage in Asian seabass.
Carcass composition results showed no significant differences in whole-body proximate composition of Asian seabass supplemented with marine protein hydrolysates (TH, SH, SS), consistent with prior studies [9,10,20,68] indicating these supplements improve growth and health but do not notably alter tissue nutrition.
In vitro assays showed TH and fish meal (65% CP) had high protein digestibility (0.47±0.02 mMol DL-Alanine g⁻¹ trypsin activity⁻¹), while the LFM+TH diet was highest at 0.75±0.04. Other diets showed no significant differences. Enhanced digestibility is due to hydrolysis, which improves protein solubility and dispersibility, and generates small peptides and free amino acids [12,84].
Protein ADC in fish fed TH-supplemented diets was comparable to HFM, matching growth results. LFM diet showed lower digestibility, but TH supplementation restored it, consistent with findings in Asian seabass [68], olive flounder (P. olivaceus) (6,10,20,37], red seabream (P. major) [18], and Atlantic salmon (S. salar L.) [85]. This is due to enzymatic hydrolysis producing bioavailable peptides [68]. SH and SS diets did not significantly improve ADC, likely due to excess free amino acids and low MW peptides [68]. Lecduc et al. [17] found TH or SH enhanced intestinal metabolism in European seabass (D. labrax). Improvements in gut morphology with TH or SH may have disrupted digestion, highlighting the need to optimize hydrolysate levels for balanced nutrient absorption.
Fish are known to be highly sensitive to stressors, often reacting to stimuli at levels undetectable by terrestrial animals. In this study, an ammonia stress challenge test revealed that fish fed the LFM+TH diet exhibited the highest survival rate (49.3 ± 2.3%) and significantly lower cortisol levels, indicating enhanced stress resistance compared to other dietary treatments. Hematological, immunological, blood plasma metabolic markers, and blood plasma electrolyte parameters showed no significant differences among groups, further suggesting improved stress resilience. Although there is no direct evidence that tuna hydrolysate can suppress cortisol levels in Asian seabass or other fish species under ammonia-induced stress, it is hypothesized that bioactive peptides with antioxidant properties and amino acids functioning as neuromodulators present in tuna hydrolysate may contribute to cortisol regulation [14,17,86]. This effect is believed to occur through the downregulation of the hypothalamic-pituitary-interrenal (HPI) axis, leading to the inhibition of corticotropin-releasing hormone (CRF) secretion from the hypothalamus. Consequently, this suppresses the stimulation of corticotrophic cells in the anterior pituitary and reduces adrenocorticotropic hormone (ACTH) release, ultimately lowering cortisol synthesis and secretion by interrenal cells in the head kidney [87,88]. While data on stress and cortisol regulation in fish remain limited, improved tolerance to elevated ammonia levels may enhance survival during sudden environmental changes.
5. Conclusions
Dietary supplementation with 5% TH could effectively replace up to 60% of fish meal in low-fish meal diets, with soybean meal compensating up to 42%. This supplementation significantly improved growth, feed utilization, survival rate, diet digestibility, immune function, and intestine morphology in juvenile Asian seabass. Additionally, the TH diet enhances survival rates under ammonia stress, highlighting the potential of marine protein hydrolysate to improve stress tolerance. These findings suggest that marine protein hydrolysate supplementation offers a sustainable and efficient alternative to conventional fishmeal-based diets.
Author Contributions
Conceptualization, D.P.; methodology, D.P., S.T, and B.Y.; software, D.P.; validation, S.T. and B.Y.; formal analysis, D.P., investigation, D.P.; resources, D.P.; data curation; D.P., writing—original draft preparation, D.P.; writing—review and editing, S.T. and B.Y., visualization, D.P.; supervision, S.T. and B.Y., project administration, D.P.; funding acquisition, B.Y. All authors have read and agreed to the published version of the manuscript.
Funding
This study was supported by the research fund for supporting lecturers to admit high-potential students to study and conduct research in their expert programs in 2022, Khon Kaen University, Khon Kaen, Thailand.
Institutional Review Board Statement
Animals Use License, IACUC-KKU-103/67, Institutional animal Care and Use Committee of Khon Kaen University, National Research Council of Thailand (NRCT).
Informed Consent Statement
Not applicable.
Data Availability Statement
Additional data supporting the findings of this study are available from the corresponding authors upon reasonable request.
Acknowledgments
The authors would like to extend their sincere gratitude to Dr. Vincent Fournier, Mikael Herault, and Paul Seguin for their invaluable guidance on feed formulation and experimental design. This research was partially supported by SPF Diana (Thailand) Co., Ltd. and Khon Kaen University, Thailand.
Conflicts of Interest
The authors declare that they have no competing financial interests or personal relationships that could have appeared to influence the work reported in this paper. Abbreviations
References
- Glencross, B. The nutritional management of barramundi, Lates calcarifer -A review. Aquac. Nutr. 2006, 12, 291–309. [Google Scholar] [CrossRef]
- Boonyaratpalin, M.; Williams, K.; Asian sea bass Lates calcarifer In, C.D. Asian sea bass Lates calcarifer. In Nutrient requirements and feeding of finfish for aquaculture; Webster, C.D., Lim, C.E., Eds.; 2009; pp. 40–50. [Google Scholar]
- Siddik, M.A.B.; Islam, M.A.; Hanif, M.A.; Chaklader, M.R.; Kleindienst, R. Barramundi, Lates calcarifer (Bloch, 1790): A new dimension to the fish farming in coastal Bangladesh. J. Aquacult. Res. Dev. 2016, 7, 1–3. [Google Scholar]
- Tacon, A.G.J.; Metian, M. Global overview on the use of fish meal and fish oil in industrially compounded aquafeeds: Trends and future prospects. Aquac. 2008, 285, 146–158. [Google Scholar] [CrossRef]
- Tantikitti, C. Feed palatability and the alternative protein sources in shrimp feed. Songklanakarin J. Sci. Technol. 2014, 36, 51–55. [Google Scholar]
- Khosravi, S.; Bui, D.T.H.; Fournier, V.; Kim, K.W.; Lee, K. Supplementation of protein hydrolysates to a low-fishmeal diet improves growth and health status of juvenile olive flounder, (Paralicthys olivaceus). JWAS. 2018, 49, 897–911. [Google Scholar]
- Ma, Z.; Hassan, M.M.; Allais, L.; He, T.; Leterme, S.; Ellis, A.V.; McGraw, B.; Qin, J.G. Replacement of fishmeal with commercial soybean meal and EnzoMeal in juvenile barramundi Lates calcarifer. Aquac. Res. 2018, 49, 3258–3269. [Google Scholar] [CrossRef]
- Tola, S.; Fukada, H.; Masumoto, T. Effects of feeding a fishmeal-free soy protein concentrate-based diet on the growth performance and nutrient utilization of red sea bream (Pagrus major). Aquac. Res. 2016, 50, 1087–1095. [Google Scholar] [CrossRef]
- Tola, S.; Sommit, N.; Seel-audom, M.; Khamtavee, P.; Waiho, K.; Boonmee, T.; Yuangsoi, B.; Munpholsri, N. Effect of dietary tuna hydrolysate supplementation on feed intake, growth performance, feed utilization and health status of Asian seabass (Lates calcarifer) fed a low fish meal soybean meal-based diet. Aquac. Res. 2022, 00, 1–15. [Google Scholar]
- Gunathilaka, B.E.; Khosravi, S.; Herault, M.; Fournier, V.; Lee, C.; Jeong, J.; Lee, K. Evaluation of shrimp or tilapia protein hydrolysate at graded dosages in low fish meal diet for olive flounder (Paralichthys olivaceus). Aquac. Nutr. 2020, 26, 1592–1603. [Google Scholar] [CrossRef]
- Suratip, N.; Charoenwattanasak, S.; Klahan, R.; Herault, M.; Yuangsoi, B. An investigation into the effects of using protein hydrolysate in low fish meal diets on growth performance, feed utilization and health status of snakehead fish (Channa striata) fingerling. Aquac. Rep. 2023, 30, 101623. [Google Scholar] [CrossRef]
- Chalamaiah, M.; Dinesh, K.B.; Hemalatha, R.; Tummala, J. Fish protein hydrolysates: Proximate composition, amino acid composition, antioxidant activities and applications: A review. Food Chem. 2012, 135, 3020–3038. [Google Scholar] [CrossRef]
- Gamarro, E.; Orawattanamateekul, W.; Sentina, J.; Gopal, S. By-products of tuna processing GLOBEFISH Res. Program. FAO, 112. 2013; pp. 1–48. [Google Scholar]
- Siddik, M.A.B.; Pham, H.D.; Francis, D.S.; Vo, B.V.; Shahjahan, M. Dietary supplementation of fish protein hydrolysate in high plant protein diets modulates growth, liver and kidney health, and immunity of barramundi (Lates calcarifer). Aquac. Nutr. 2021, 27, 86–98. [Google Scholar] [CrossRef]
- Chotikachinda, R.; Tantikitti, T.; Benjakul, S.; Rustad, T.; Kumarnsit, E. Production of protein hydrolysate from skipjack tuna (Katsuwonus pelamis) viscera as feeding attractants for Asia seabass (Lates calcarifer). Aquac. Nutr. 2013, 19, 773–784. [Google Scholar] [CrossRef]
- Egerton, S.; Wan, A.; Murphy, K.; Collins, F.; Ahern, G.; Sugrue, I.; Busca, K.; Egan, F.; Muller, N.; Whooley, J.; McGinnity, P.; Culloty, S.; Ross, R.; Stanton, C. Replacing fishmeal with plant protein in Atlantic salmon (Salmo salar) diets by supplementation with fish protein hydrolysate. Sci. Rep. 2020, 10, 1–16. [Google Scholar] [CrossRef]
- Leduc, A.; Hervy, M.; Rangama, J.; Delépée, R.; Fournier, V.; Henry, J. Shrimp by-product hydrolysate induces intestinal myotropic activity in European seabass (Dicentrarchus labrax). Aquac. 2018, 497, 380–388. [Google Scholar] [CrossRef]
- Bui, H.T.D.; Khosravi, S.; Fournier, V.; Herault, M.; Lee, K. Growth performance, feed utilization, innate immunity, digestibility and disease resistance of juvenile red seabream (Pagrus major) fed diets supplemented with protein hydrolysates. Aquac. 2014, 418–419, 11–16. [Google Scholar] [CrossRef]
- Kim, H.S.; Jung, W.G.; Myung, S.H.; Cho, S.H.; Kim, D.S. Substitution effects of fishmeal with tuna byproduct meal in the diet on growth, body composition, plasma chemistry and amino acid profiles of juvenile olive flounder (Paralichthys olivaceus). Aquac. 2014, 431, 92–98. [Google Scholar] [CrossRef]
- Khosravi, S.; Bui, D.T.H.; Rahimnejad, S.; Herault, M.; Fournier, V.; Kim, S.; Jeong, J.; Lee, K. Dietary supplementation of marine protein hydrolysate in fish-meal base diet for red sea bream (Pagrus major) and olive flounder (Paralicthys olivaceus). Aquac. 2015, 435, 371–376. [Google Scholar] [CrossRef]
- Leal, A.L.G.; Fernandes de Castro, P.F.; de Lima, J.P.V.; de Souza Correia, E.; de Souza Bezerra, R. Use of shrimp protein hydrolysate in Nile tilapia (Oreochromis niloticus, L.) feeds. Aquac. Int. 2010, 18, 635–646. [Google Scholar] [CrossRef]
- Siddik, M.A.B.; Howieson, J.; Fotedar, R. Beneficial effects of tuna hydrolysate in poultry by-product meal diets on growth, immune response, intestinal health, and disease resistance to Vibrio harveyi in juvenile barramundi, Lates calcarifer. Fish Shellfish Immunol. 2019, 89, 61–71. [Google Scholar] [CrossRef]
- Blaxhall, P.C.; Daisley, K.W. Routine hematological methods for use with fish blood. J. Fish Biol. 1973, 5, 771–781. [Google Scholar] [CrossRef]
- England, J.M.; Walford, D.M. Re-assessment of the reliability of haematocrit. Br. J. Hematol. 1972, 23, 247–253. [Google Scholar] [CrossRef]
- Parry, R.M.; Chandau, R.C.; Shahani, R.M. A rapid and sensitive assay of muramidase. Proc. Soc. Exp. Biol. Med. 1965, 119, 384–386. [Google Scholar] [CrossRef] [PubMed]
- Song, Y.L.; Hsieh, Y.T. Immunostimulation of tiger shrimp (Penaeus monodon) hemocytes for generation of microbicidal substances: Analysis of reactive oxygen species. Dev. Comp. Immunol. 1994, 18, 201–209. [Google Scholar] [CrossRef] [PubMed]
- Kewcharoen, W.; Srisapoome, P. Probiotic effects of Bacillus spp. From Pacific white shrimp (Litopenaeus vannamei) on water quality and shrimp growth, immune responses, and resistance to Vibrio parahaemolyticus (AHPND strains). Fish Shellfish Immunol. 2018, 94, 175–189. [Google Scholar] [CrossRef] [PubMed]
- Clark, G. Tissue preparation and basic staining techniques. In Neuroanatomical Research Techniques; Robertson, R.T., Ed.; Academic Press, 1978; pp. 25–45. [Google Scholar]
- AOAC 2005. Official methods of analysis (18th edition) Association of Official Analytical Chemists International. Maryland, USA.
- Rungruangsak-Torrissen, K.; Moss, R.; Andresen, L.H.; Berg, A.; Waagbø, R. Different expressions of trypsin and chymotrypsin in relation to growth in Atlantic salmon (Salmo salar L.). Fish Physiol. Biochem. 2006, 32, 7–23. [Google Scholar] [CrossRef] [PubMed]
- Rungruangsak-Torrissen, K.; Rustad, A.; Sunde, J.; Eiane, S.A.; Jensen, H.B.; Opstvedt, J.; Nygard, E.; Samuelsen, T.A.; Mundheim, H.; Luzzana, U.; Venturini, G. In vitro digestibility based on fish crude enzyme extract for prediction of feed quality in growth trials. J. Sci. Food Agric. 2002, 82, 644–654. [Google Scholar] [CrossRef]
- Rungruangsak-Torrissen, K. Digestive efficiency, growth and qualities of muscle and oocyte in Atlantic salmon (Salmo salar L.) fed on diets with krill meal as an alternative protein source. J. Food Biochem. 2007, 31, 509–540. [Google Scholar] [CrossRef]
- Austreng, E. Digestibility determination in fish using chromic oxide marking and analysis of contents from different segments of the gastrointestinal tract. Aquac. 1978, 13, 265–272. [Google Scholar] [CrossRef]
- Cho, C.Y.; Slinger, S.J.; Bayley, H.S. Bioenergetics of salmonid fishes: Energy intake, expenditure and productivity. Comp. Biochem. Physiol. B Biochem. Mol. Biol. 1982, 73, 25–41. [Google Scholar] [CrossRef]
- Lin, Y.C.; Chen, J.C. Acute toxicity of ammonia on Litopenaeus vannamei Boone juveniles at different salinity levels. J. Exp. Mar. Biol. Ecol. 2001, 259, 109–119. [Google Scholar] [CrossRef]
- Chatzifotis, S.; Arias, M.V.; Papadakis, I.E.; Divanach, P. Evaluation of feed stimulants in diets for Sea Bream (Sparus aurata). Isr. J. Aquacult.Bamidgeh 2009, 61, 315–321. [Google Scholar] [CrossRef]
- Zheng, K.; Liang, M.; Yao, H.; Wang, J.; Chang, Q. Effect of dietary fish protein hydrolysate on growth, feed utilization and IGF-I levels of Japanese flounder (Paralichthys olivaceus). Aquac. Nutr. 2012, 18, 297–303. [Google Scholar] [CrossRef]
- Li, P.; Mai, K.; Trushenski, J.; Wu, G. New developments in fish amino acid nutrition: Towards functional and environmentally oriented aquafeeds. Amino Acids. 2009, 37, 283–293. [Google Scholar] [CrossRef]
- Wei, Y.; Li, B.; Xu, H.; Liang, M. Effects of lysine and leucine in free and different dipeptide forms on growth and amino acid transporters in turbot (Scophthalmus maximus). Fish Physiol. Biochem. 2020, 46, 1795–1807. [Google Scholar] [CrossRef] [PubMed]
- Zheng, K.; Liang, M.; Yao, H.; Wang, J.; Chang, Q. Effect of size-fractionated fish protein hydrolysate on growth and feed utilization of turbot (Scophthalmus maximus L.). Aquac. Res. 2013, 44, 895–902. [Google Scholar] [CrossRef]
- Morais, S. The Physiology of Taste in Fish: Potential Implications for Feeding Stimulation and Gut Chemical Sensing. Rev Fish Sci Aquac. 2017, 25, 133–149. [Google Scholar] [CrossRef]
- Kasumyan, A.O.; Døving, K.B. Taste preferences in fisheries. Fish Physiol. Biochem. 2003, 4, 289–347. [Google Scholar]
- Dabrowski, K.; Zhang, Y.; Kwasek, K.; Hliwa, P.; Ostaszewska, T. Effects of protein-, peptide-and free amino acid-based diets in fish nutrition. Aquac. Res. 2010, 41, 668–683. [Google Scholar] [CrossRef]
- Mamauag, R.E.P.; Koshio, S.; Ishikawa, M.; Yokoyama, S.; Gao, J.; Nguyen, B.T.; Ragaza, J.A. Soy peptide inclusion levels influence the growth performance, proteolytic enzyme activities, blood biochemical parameters and body composition of Japanese flounder, Paralichthys olivaceus. Aquac. 2011, 321, 252–258. [Google Scholar] [CrossRef]
- Zheng, K.; Xu, T.; Qian, C.; Liang, M.; Wang, X. Effect of low molecular weight fish protein hydrolysate on growth performance and IGF-I expression in Japanese flounder (Paralichthys olivaceus) fed high plant protein diets. Aquac. Nutr. 2014, 20, 372–380. [Google Scholar] [CrossRef]
- Lin, X.; Chen, W.; Lin, S.; Luo, L. Effects of dietary cecropin on growth, non-specific immunity and disease resistance of tilapia (Oreochromis niloticus × O. aureus). Aquac. Res. 2015, 46, 2999–3007. [Google Scholar] [CrossRef]
- Xu, D.; He, G.; Mai, K.; Zhou, H.; Xu, W.; Song, F. Postprandial nutrient sensing and metabolic responses after partial dietary fishmeal replacement by soyabean meal in Turbot (Scophthalmus Maximus L.). Brit. J. Nutr. 2016, 115, 379–388. [Google Scholar] [CrossRef]
- Dai, M.; Li, S.; Fu, C.; Qiu, H.; Chen, N. The potential role of marine protein hydrolysates in elevating nutritive values of diets for largemouth bass, Micropterus Salmoides. Front. Mar. Sci. 2020, 7, 197. [Google Scholar] [CrossRef]
- 49 Bröer, S. Amino Acid Transport Across Mammalian Intestinal and Renal Epithelia. Physiol. Rev. 2008, 88, 249–286. [Google Scholar] [CrossRef]
- Verri, T.; Barca, A.; Pisani, P.; Piccinni, B.; Storelli, C.; Romano, A. Di-and tripeptide transport in vertebrates: The contribution of teleost fish models. J. Comp. Physiol. B. 2017, 187, 395–462. [Google Scholar] [CrossRef]
- Kimball, S.R.; Jefferson, L.S. Control of protein synthesis by amino acid availability. Curr Opin Clin Nutr Metab Care. 2002, 5, 63–67. [Google Scholar] [CrossRef] [PubMed]
- Laplante, M.; Sabatini, D.M. mTOR Signaling in Growth Control and Disease. Cell. 2012, 149, 274–293. [Google Scholar] [CrossRef]
- Kilberg, M.S.; Pan, Y.X.; Chen, H.; Leung-Pineda, V. Nutrition Control of Gene Expression: How Mammalian Cells Respond to Amino Acid Limitation. Annu. Rev. Nutr. 2005, 25, 59–85. [Google Scholar] [CrossRef] [PubMed]
- Robinson, J.W.; Yanke, D.; Mirza, J.; Ballantyne, J.S. Plasma Free Amino Acid Kinetics in Rainbow Trout (Oncorhynchus Mykiss) Using a Bolus Injection of 15N-Labeled. Amino Acids. 2011, 40, 689–696. [Google Scholar] [CrossRef]
- Lansard, M.; Panserat, S.; Plagnes-Juan, E.; Seiliez, I.; Skiba-Cassy, S. Integration of insulin and amino acid signals that regulate hepatic metabolism-related gene expression in Rainbow Trout: Role of TOR. Amino Acids. 2010, 39, 801–810. [Google Scholar] [CrossRef]
- Chen, G.; Feng, L.; Kuang, S.; Liu, Y.; Jiang, J.; Hu, K.; Jiang, W.; Li, S.; Tang, L.; Zhou, X. Effect of dietary arginine on growth, intestinal enzyme activities and gene expression in muscle, hepatopancreas and intestine of juvenile Jian Carp (Cyprinus Carpio Var. Jian). Brit. J. Nutr. 2012, 8, 195–207. [Google Scholar] [CrossRef] [PubMed]
- Song, F.; Xu, D.; Mai, K.; Zhou, H.; Xu, W.; He, G. Comparative study on the cellular and systemic nutrient sensing and intermediary metabolism after partial replacement of fishmeal by meat and bone meal in the diet of Turbot (Scophthalmus Maximus L.). PloS. One. 2016, 11, e0165708. [Google Scholar] [CrossRef] [PubMed]
- Xu, H.; Mu, Y.; Zhang, Y.; Li, J.; Liang, M.; Zheng, K.; Wei, Y. Graded levels of fish protein hydrolysate in high plant diets for turbot (Scophthalmus maximus): Effects on growth performance and lipid accumulation. Aquac. 2016, 454, 140–147. [Google Scholar] [CrossRef]
- Sheng, Z.; Turchini, G.M.; Xu, J.; Fang, Z.; Chen, N.; Xie, R.; Zhang, H.; Li, S. Functional properties of protein hydrolysates on growth, digestive enzyme activities, protein metabolism, and intestinal health of larval largemouth bass (Micropterus salmoides). Front. Immunol. 2022, 13, 913024. [Google Scholar] [CrossRef] [PubMed]
- Cahu, C.; Zambonio-Infante, J.; Takeuchi, T. Nutritional components affecting skeletal development in fish larvae. Aquac. 2003, 227, 245–258. [Google Scholar] [CrossRef]
- Moriyama, S.; Ayson, F.G.; Kawauchi, H. Growth Regulation by Insulin-like Growth Factor-I in Fish. Biosci Biotechnol Biochem. 2000, 64, 1553–1562. [Google Scholar] [CrossRef]
- Gómez-Requeni, P.; Mingarro, M.; Calduch-Giner, J.A.; Médale, F.; Martin, S.A.M.; Houlihan, D.F.; Kaushik, S.; Pérez-Sánchez, J. Protein growth performance, amino acid utilisation and somatotropic axis responsiveness to fish meal replacement by plant protein sources in gilthead sea bream (Sparus aurata). Aquac. 2004, 232, 493–510. [Google Scholar] [CrossRef]
- Men, K.; Ai, Q.; Mai, K.; Xu, W.; Zhang, Y.; Zhou, H. Effects of dietary corn gluten meal on growth, digestion and protein metabolism in relation to IGF-I gene expression of Japanese seabass (Lateolabrax japonicus). Aquac. 2014, 428–429, 303–309. [Google Scholar] [CrossRef]
- Sun, Y.; Guo, C.Y.; Wang, D.D.; Li, X.F.; Xiao, L.; Zhang, X.; You, X.; Shi, Q.; Hu, QJ.; Fang, C.; Lin, H.R.; Zhang, Y. Transcriptome analysis reveals the molecular mechanisms underlying growth superiority in a novel grouper hybrid (Epinephelus fuscoguttatus♀×E. lanceolatus♂). BMC Genetics. 2006, 17, 24. [Google Scholar]
- Fuentes, E.N.; Björnsson, B.T.; Valdés, J.A.; Molina, A. Insulin-like growth factor-I (IGF-I) and its signaling pathways in skeletal muscle are regulated by nutrition and contribute to somatic growth in the fine flounder. Am. J. Physiol. Regul. Integr. Comp. Physiol. 2011, 300, 1532–1542. [Google Scholar] [CrossRef]
- Ma, X.M.; Blenis, J. Molecular mechanisms of mTOR-mediated translational control. Nat. Rev. Mol. Cell Biol. 2009, 10, 307–318. [Google Scholar] [CrossRef]
- Gallinetti, J.; Harputlugil, E.; Mitchell, J.R. Amino acid sensing in dietary-restriction-mediated longevity: Roles of signal-transducing kinases GCN2 and TOR. Biomolecules. 2013, 499, 1–10. [Google Scholar] [CrossRef]
- Siddik, M.A.B.; Howieson, J.; Partridge, G.J.; Fotedar, R.; Gholipourkanani, H. Dietary tuna hydrolysate modulates growth performance, immune response, intestinal morphology and resistance to Streptococcus iniae in juvenile barramundi, Lates calcarifer. Sci. Rep. 2018, 8, 1–13. [Google Scholar] [CrossRef]
- Pham, H.C.; Siddik, M.A.B.; Le, H.M.; Ngo, M.V.; Nguyen, M.V.; Francis, D. Effects of Dietary Tuna Viscera Hydrolysate Supplementation on Growth, Intestinal Mucosal Response, and Resistance to Streptococcus iniae Infection in Pompano (Trachinotus blochii). Aquac. Nutr. 2022, 2022, 3645868. [Google Scholar] [CrossRef]
- Tang, H.G.; Wu, T.X.; Zhoa, Z.Y.; Pan, X.D. Effects of fish protein hydrolysate on growth performance and humoral immune response in large yellow croaker (Pseudosciaena crocea R.). J. Zhejiang Univ. Sci. B. 2008, 9, 684–690. [Google Scholar] [CrossRef] [PubMed]
- Liang, M.; Wang, J.; Chang, Q.; Mai, K. Effects of different levels of fish protein hydrolysate in the diet on the nonspecific immunity of Japanese sea bass, Lateolabrax japonicus (Cuvieret Valenciennes, 1828). Aquac. Res. 2006, 37, 102–106. [Google Scholar] [CrossRef]
- Murray, A.L.; Pascho, R.J.; Alcorn, S.W.; Fairgrieve, W.T.; Shearer, K.D.; Roley, D. Effects of various feed supplements containing fish protein hydrolysate or fish processing by-products on the innate immune functions of juvenile coho salmon (Oncorhynchus kisutch). Aquac. 2003, 220, 643–653. [Google Scholar] [CrossRef]
- Ambardekar, A.A.; Reigh, R.C.; Williams, M.B. Absorption of amino acids from intact dietary proteins and purified amino acid supplements follows different time-courses in channel catfish (Ictalurus punctatus). Aquac. 2009, 291, 179–187. [Google Scholar] [CrossRef]
- Chaklader, M.R.; Fotedar, R.; Howieson, J.; Siddik, M.A.B.; Foysal, J. The ameliorative effects of various fish protein hydrolysates in poultry by-product meal based diets on muscle quality, serum biochemistry and immunity in juvenile barramundi, Lates calcarifer. Fish Shellfish Immunol. 2000, 104, 567–578. [Google Scholar] [CrossRef]
- Salamat, N.; Ardeshir, R.A.; Movahedinia, A.; Rastgar, S. Liver histophysiological alterations in pelagic and benthic fish as biomarkers for marine environmental assessment. Int. J. Environ. Res. 2007, 11, 251–262. [Google Scholar] [CrossRef]
- Tenji, D.; Micic, B.; Sipos, S.; Miljanovic, B.; Teodorovic, I.; Kaisarevic, S. Fish biomarkers from a different perspective: Evidence of adaptive strategy of Abramis brama (L.) to chemical stress. Environ. Sci. Eur. 2020, 32, 47. [Google Scholar] [CrossRef]
- Shukla, G. A review on liver enzymes as useful biomarkers to evaluate the effects of pesticides on freshwater fish. WJBPHS. 2024, 19, 171–176. [Google Scholar]
- Kotzamanis, Y.P.; Gisbert, E.; Gatesoupe, F.J.; Zambonino Infante, J.; Cahu, C. Effects of different dietary levels of fish protein hydrolysates on growth, digestive enzymes, gut microbiota, and resistance to Vibrio anguillarum in European seabass (Dicentrarchus labrax) larvae. Comp. Biochem. Physiol. A Mol. Integr. Physiol. 2007, 147, 205–214. [Google Scholar] [CrossRef]
- Caspary, W.F. Physiology and pathophysiology of intestinal absorption. Am. J. Clin. Nutr. 1992, 55, 299S–308S. [Google Scholar] [CrossRef]
- Baeverfjord, G.; Krogdahl, Å. Development regression of soybean meal induced enteritis in Atlantic salmon Salmo salar L, distal intestine: A comparison with the intestines of fasted fish, J. Fish Dis. 1996, 19, 375–387. [Google Scholar] [CrossRef]
- Escaffre, A.-M.; Kaushik, S.; Mambrini, M. Morphometric evaluation of changes in the digestive tract of rainbow trout (Oncorhynchus mykiss) due to fish meal replacement with soy protein concentrate. Aquac. 2007, 273, 127–138. [Google Scholar] [CrossRef]
- Zhang, C.; Rahimnejad, S.; Wang, Y.; Lu, K.; Song, K.; Wang, L.; Ma, K. Substituting fish meal with soybean meal in diets for Japanese seabass (Lateolabrax japonicus): Effects on growth, digestive enzymes activity, gut histology, and expression of gut inflammatory and transporter genes. Aquac. 2018, 483, 173–182. [Google Scholar] [CrossRef]
- Domeneghini, C.; Arrighi, S.; Radaelli, G.; Bosi, G.; Veggetti, A. Histochemical analysis of glycoconjugate secretion in the alimentary canal of Anguilla anguilla L. Acta Histochemica. Acta Histochemica. 2005, 106, 477–487. [Google Scholar] [CrossRef]
- Srichanun, M.; Tantikitti, C.; Kortner, T.M.; Krogdahl, A.; Chotikachinda, R. Effects of different protein hydrolysate products and levels on growth, survival rate and digestive capacity in Asian seabass (Lates calcarifer Bloch) larvae. Aquac. 2014, 428–429, 195–202. [Google Scholar] [CrossRef]
- Hevrøy, E.M.; Espe, M.; Waagbø, R.; Sandnes, K.; Ruud, M.; Hemre, G.I. Nutrient utilization in Atlantic salmon (Salmo salar L.) fed increased levels of fish protein hydrolysate during a period of fast growth. Aquac. Nutr. 2005, 11, 301–313. [Google Scholar] [CrossRef]
- Saidi, S.; Saoudi, M.; Ben, A.R. Valorisation of Tuna Processing Waste Biomass: Isolation, Purification and Characterisation of Four Novel Antioxidant Peptides from Tuna by-Product Hydrolysate. Environ. Sci. Pollut. Res. 2018, 25, 17383–17392. [Google Scholar] [CrossRef]
- Reid, S.G.; Bernier, N.J.; Perry, S.F. The adrenergic stress response in fish: Control of catecholamine storage and release. CBP. 1998, 120C, 1–27. [Google Scholar] [CrossRef] [PubMed]
- Mommsen, T.P.; Vijayan, M.M.; Moon, T.W. Cortisol in teleosts: Dynamics, mechanisms of action, and metabolic regulation. Rev. Fish Biol. Fish. 1999, 9, 21–268. [Google Scholar] [CrossRef]
Figure 1.
Lysozyme activity (A), total immunoglobulin (B), and plasma clearance efficiency against Aeromonas hydrophila (C) and Streptococcus agalactiae (D) in Asian seabass after 8 weeks of feeding. Values are means ± SD (n = 5). Abbreviations: HFM, high-fish meal diet; LFM, low-fish meal diet; LFM+TH, LFM diet + tuna hydrolysate; LFM+SH, LFM diet + shrimp hydrolysate; LFM+SS, LFM diet + salmon silage.
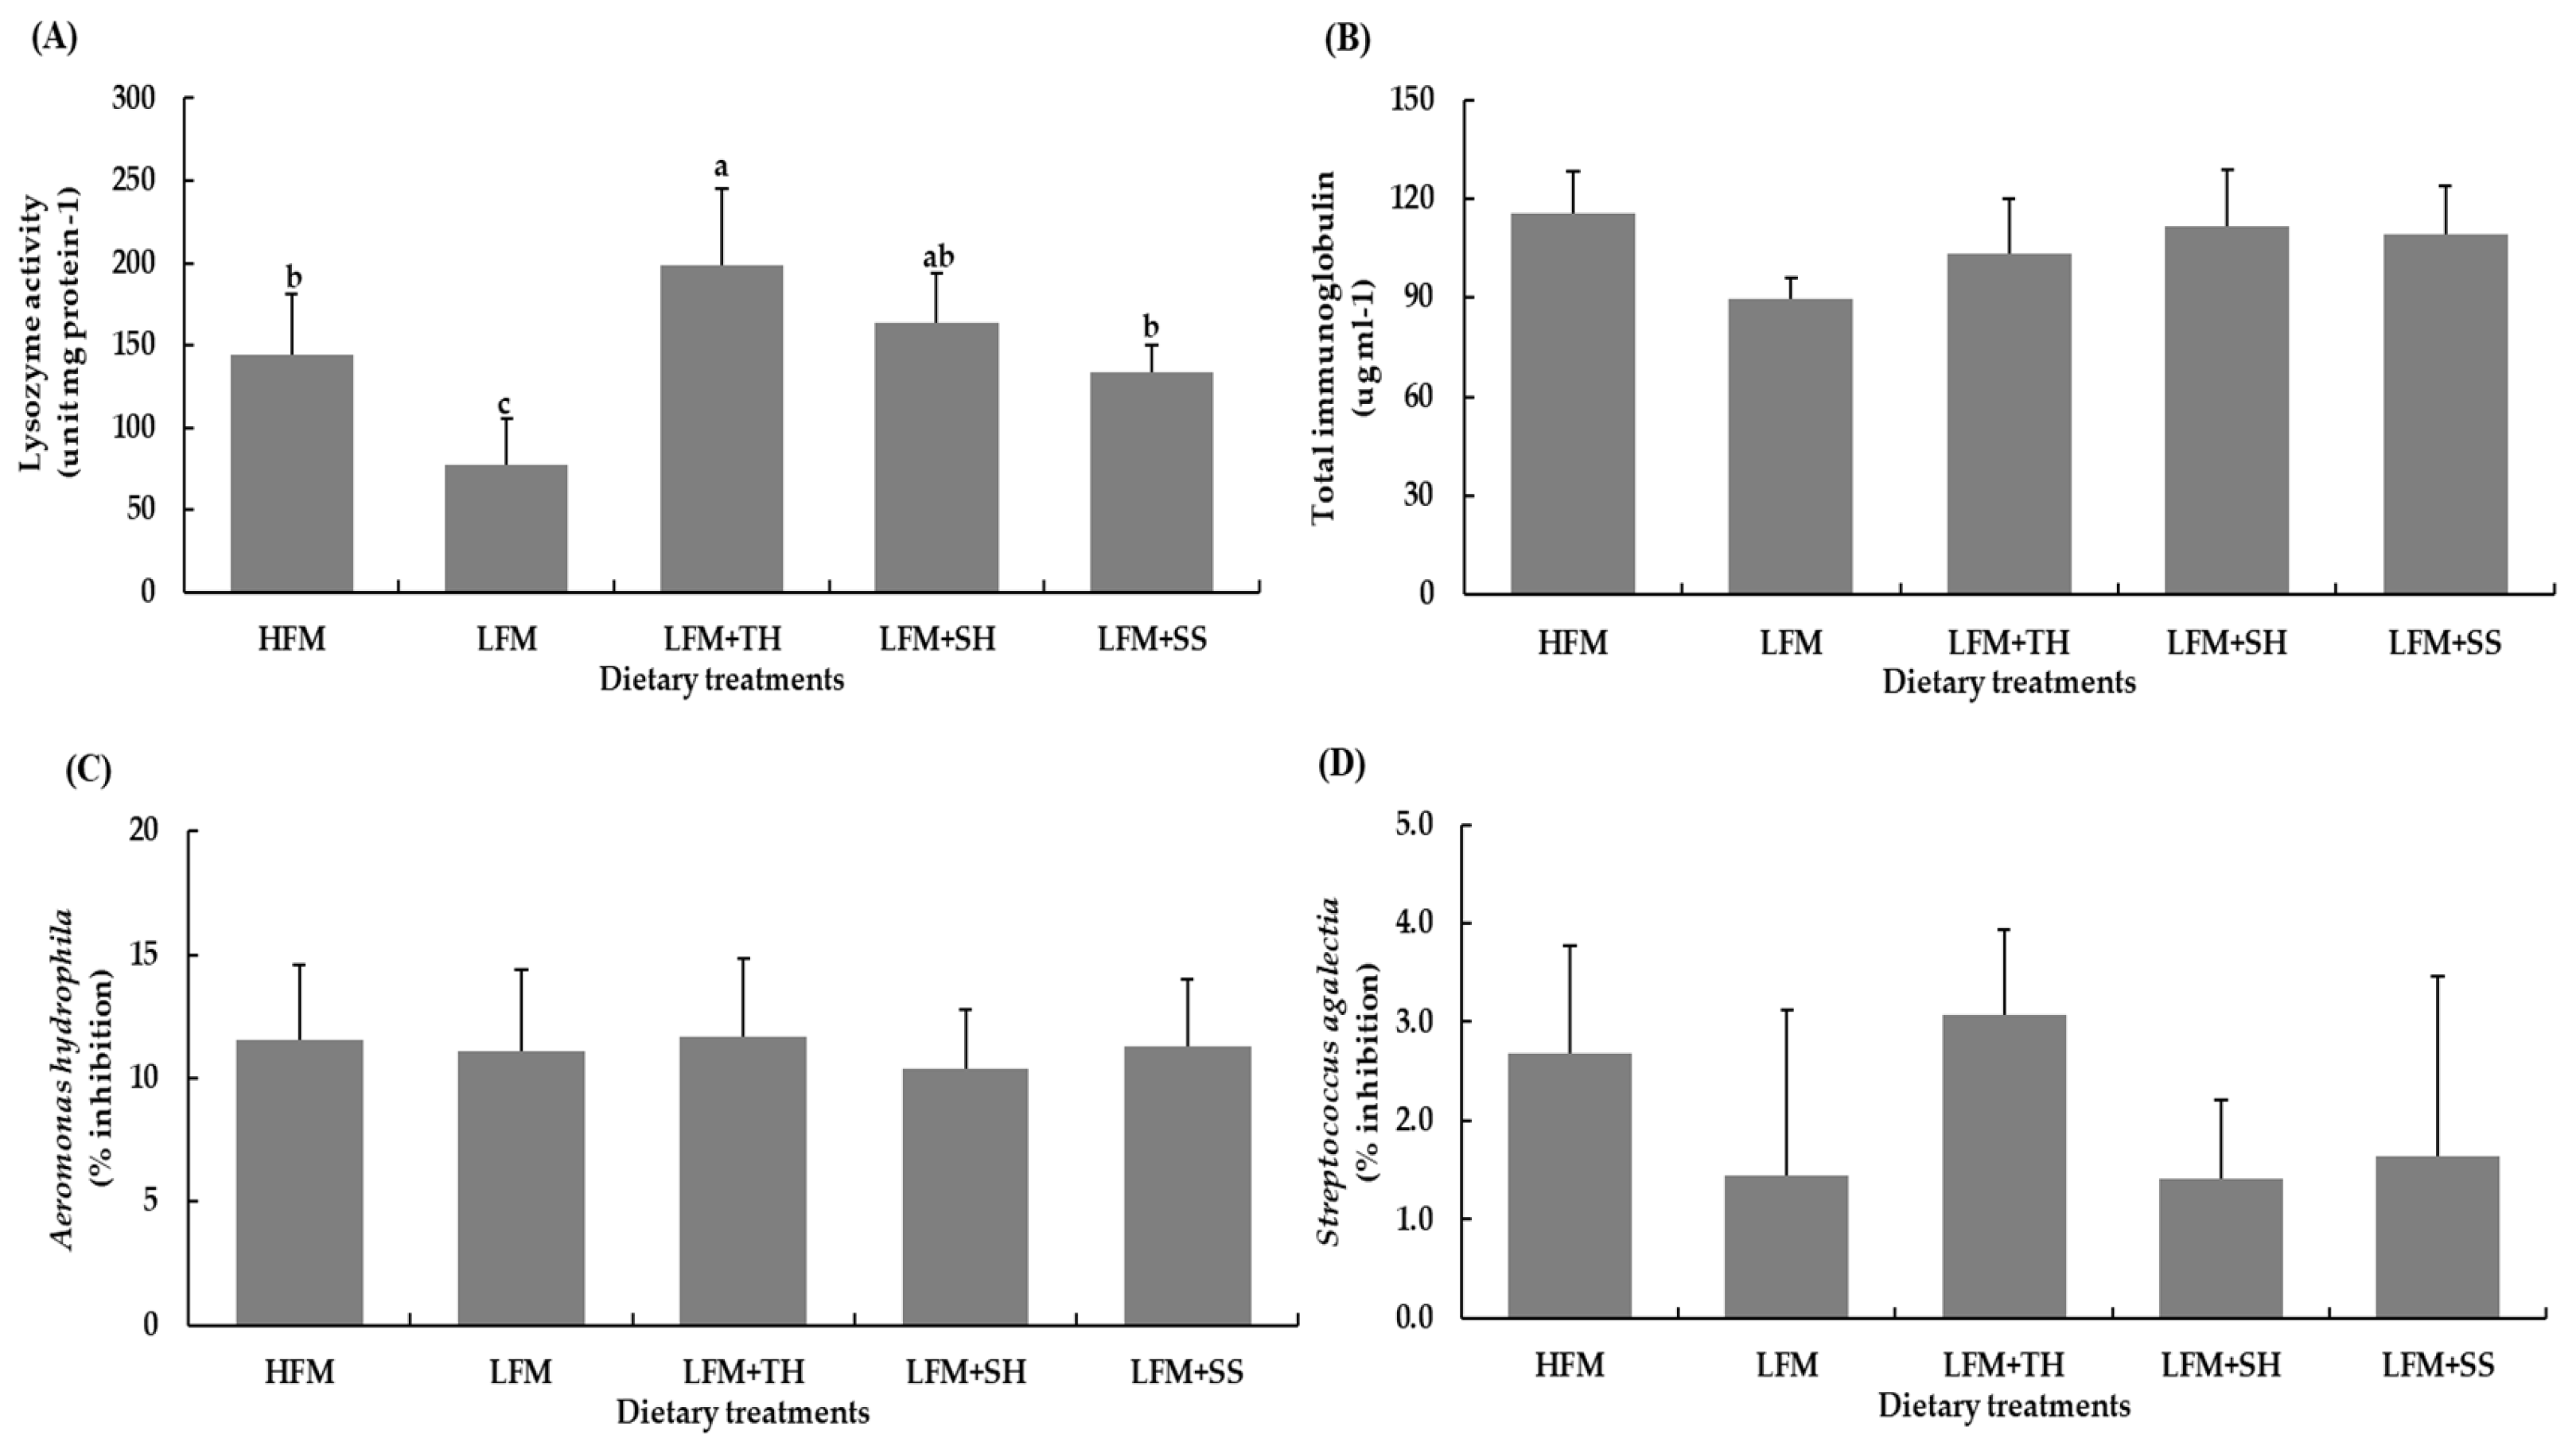
Figure 2.
Histological sections of liver (A, B) and distal intestine (C, D) of Asian seabass after 8 weeks of feeding. Panels: (1a–d) HFM; (2a–d) LFM; (3a–d) LFM+TH; (4a–d) LFM+SH; (5a–d) LFM+SS. Images at 4× (A, C) and 40× (B, D). Abbreviations: CE, columnar epithelium; EN, enterocytes; GC, goblet cells; L, lumen; LP, lamina propria; MU, mucosa; MS, muscularis; VC, villous core containing blood and lymph capillaries; VI, villi; SR, serosa; SM, submucosa; N, nuclei; FD, fat deposits; SE, sinusoid erythrocytes; P, pancreatic cells; BC, blood congestion.
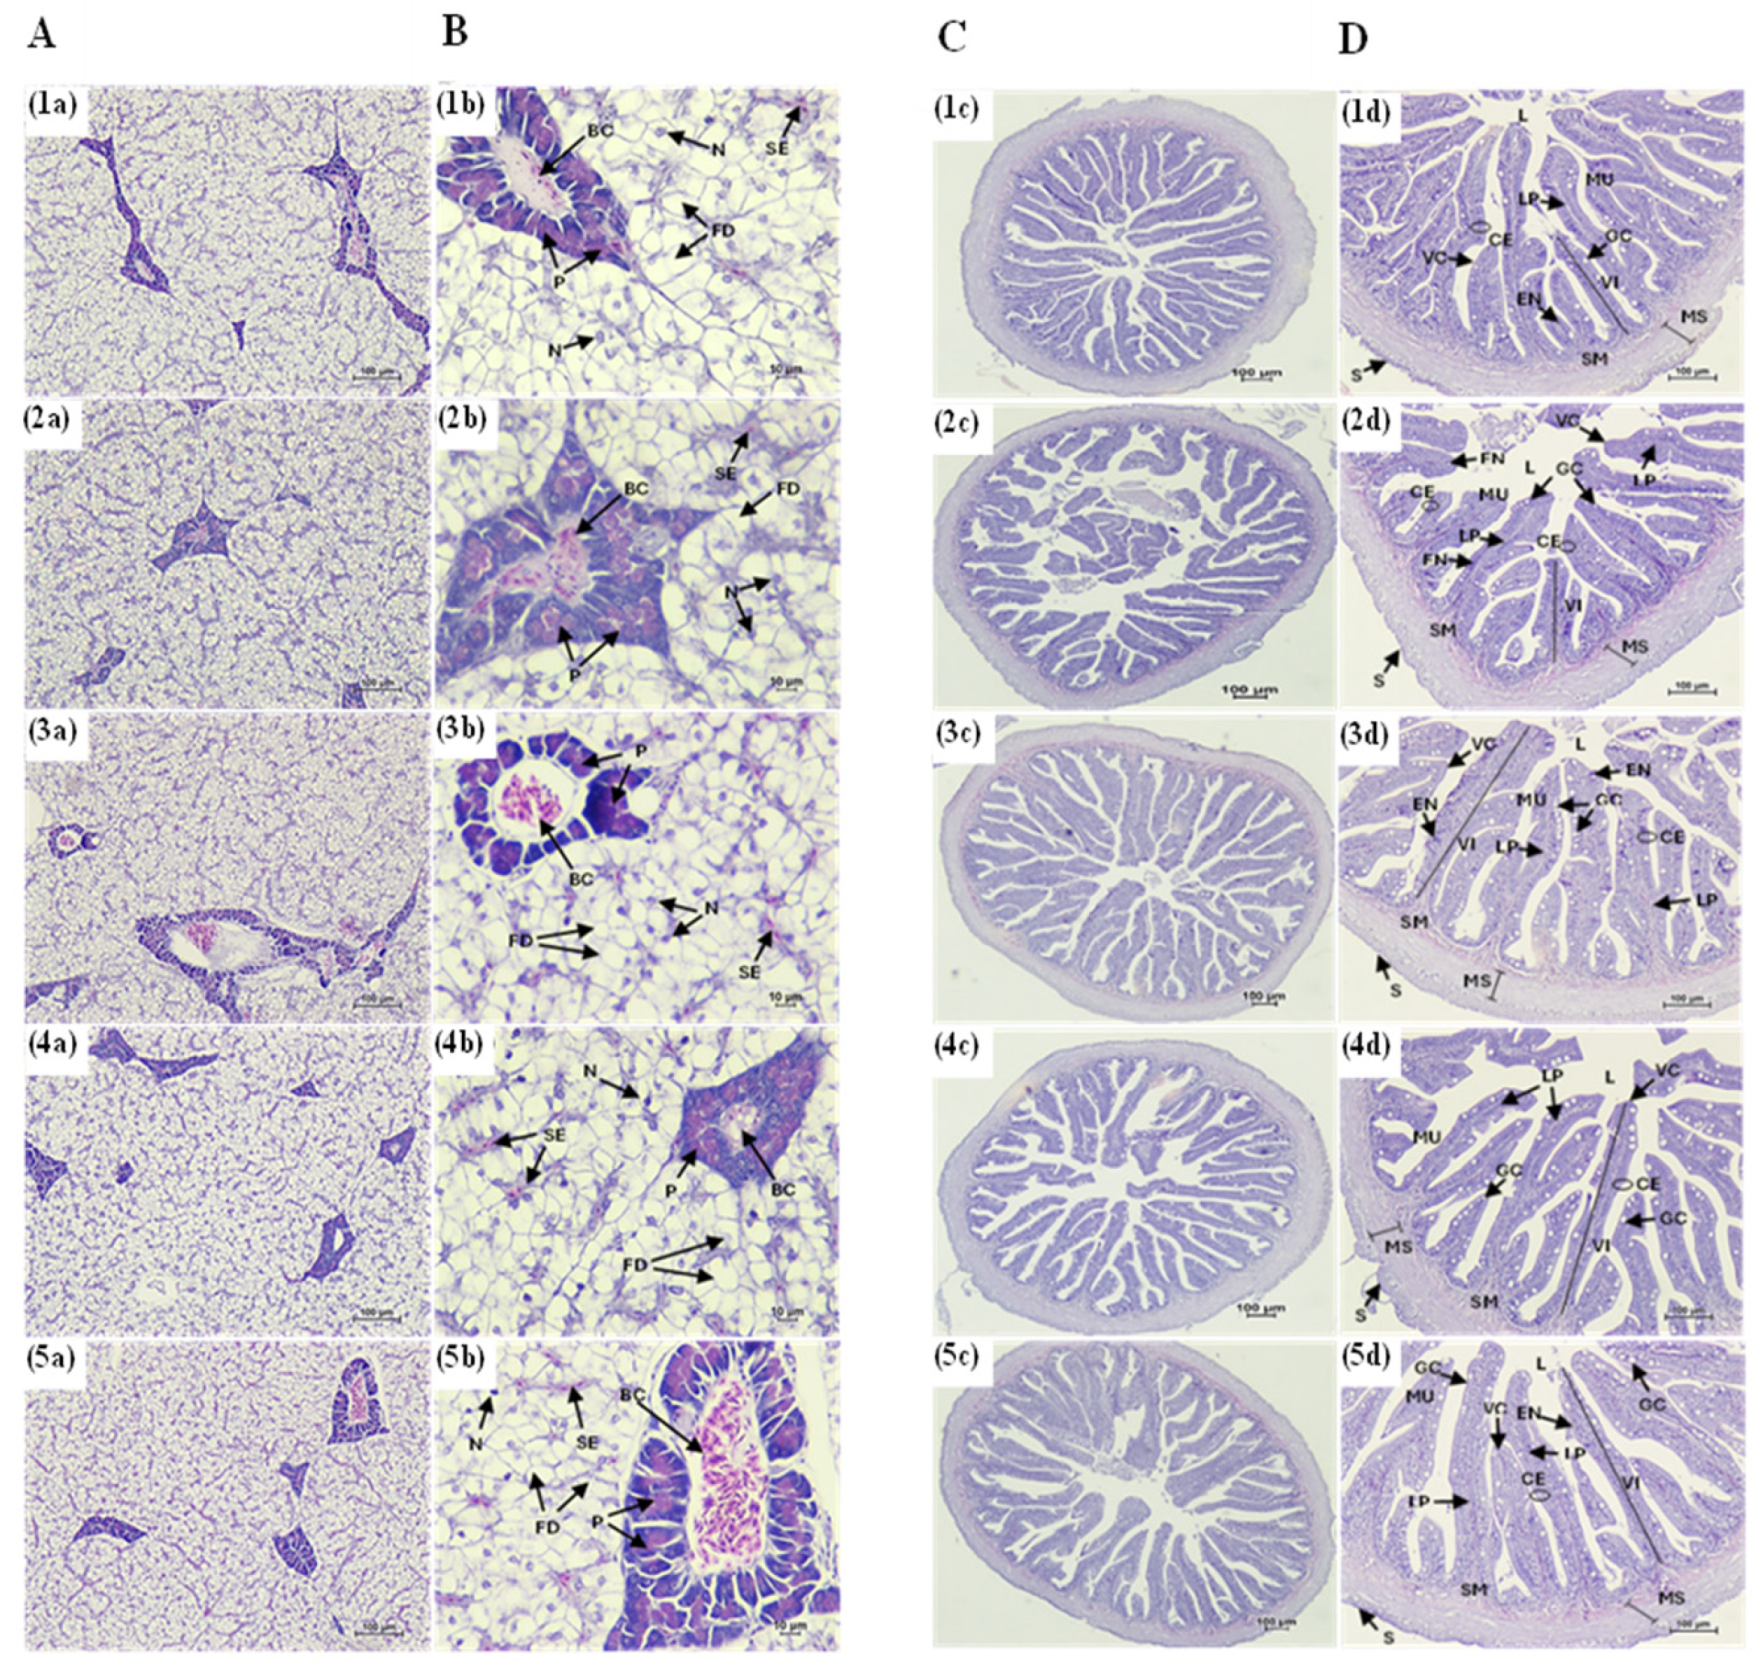
Figure 3.
Villi length (A) and goblet cell counts (B) in the distal intestine of Asian seabass after 8 weeks of feeding. Values are means ± SD (n = 5). Abbreviations: HFM, high-fish meal diet; LFM, low-fish meal diet; LFM+TH, LFM diet + tuna hydrolysate; LFM+SH, LFM diet + shrimp hydrolysate; LFM+SS, LFM diet + salmon silage.
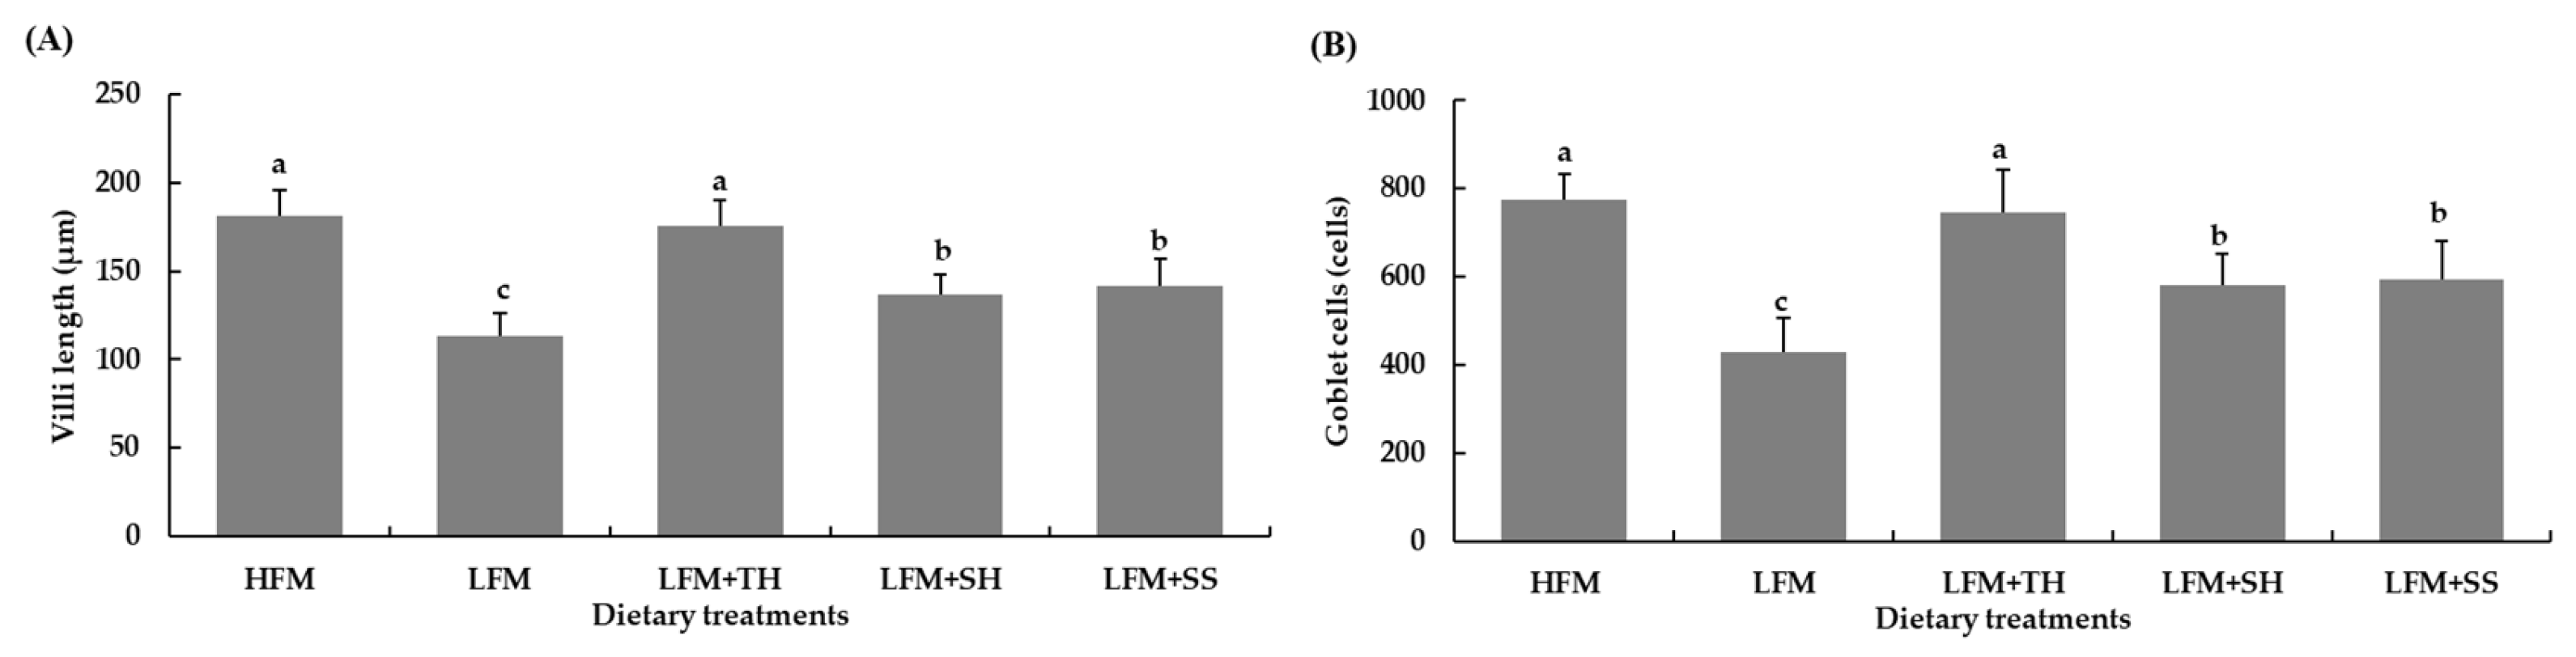
Figure 4.
In vitro protein digestibility of marine ingredients (A) and experimental diets (B). Values are means ± SD (n = 5). Abbreviations: HFM, high-fish meal diet; LFM, low-fish meal diet; LFM+TH, LFM diet + tuna hydrolysate; LFM+SH, LFM diet + shrimp hydrolysate; LFM+SS, LFM diet + salmon silage.
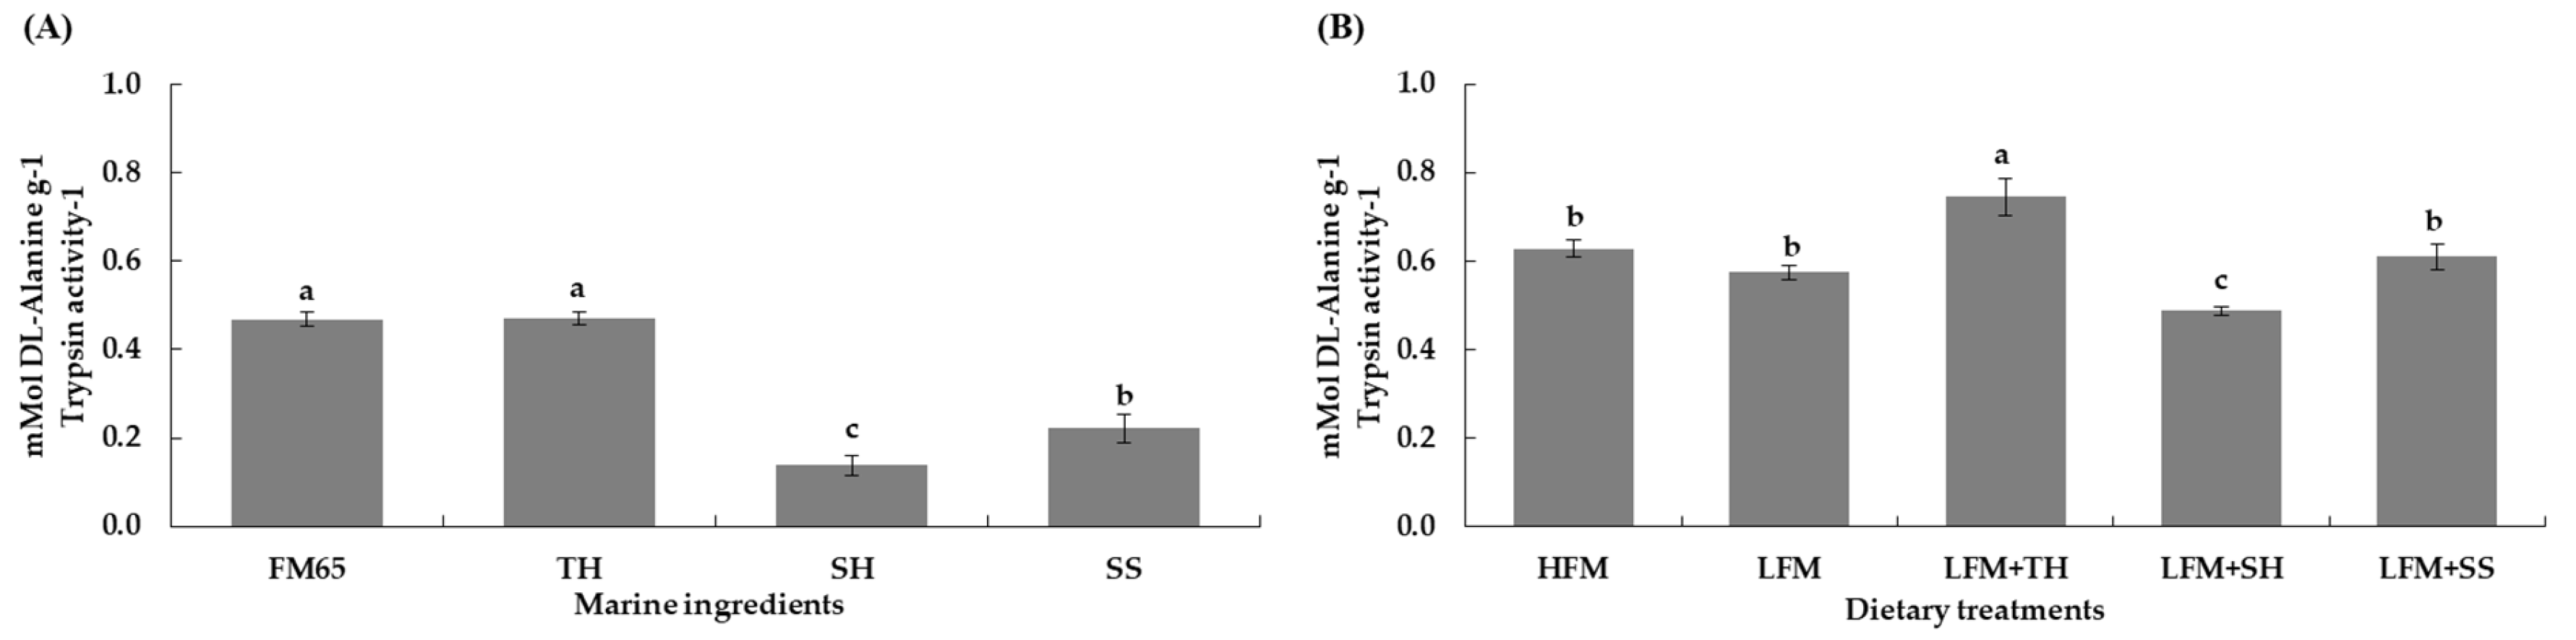
Figure 5.
Survival rate of Asian seabass following a 120-h ammonia stress challenge. Values are means ± SD (n = 3). Abbreviations: HFM, high-fish meal diet; LFM, low-fish meal diet; LFM+TH, LFM diet + tuna hydrolysate; LFM+SH, LFM diet + shrimp hydrolysate; LFM+SS, LFM diet + salmon silage.
Figure 5.
Survival rate of Asian seabass following a 120-h ammonia stress challenge. Values are means ± SD (n = 3). Abbreviations: HFM, high-fish meal diet; LFM, low-fish meal diet; LFM+TH, LFM diet + tuna hydrolysate; LFM+SH, LFM diet + shrimp hydrolysate; LFM+SS, LFM diet + salmon silage.
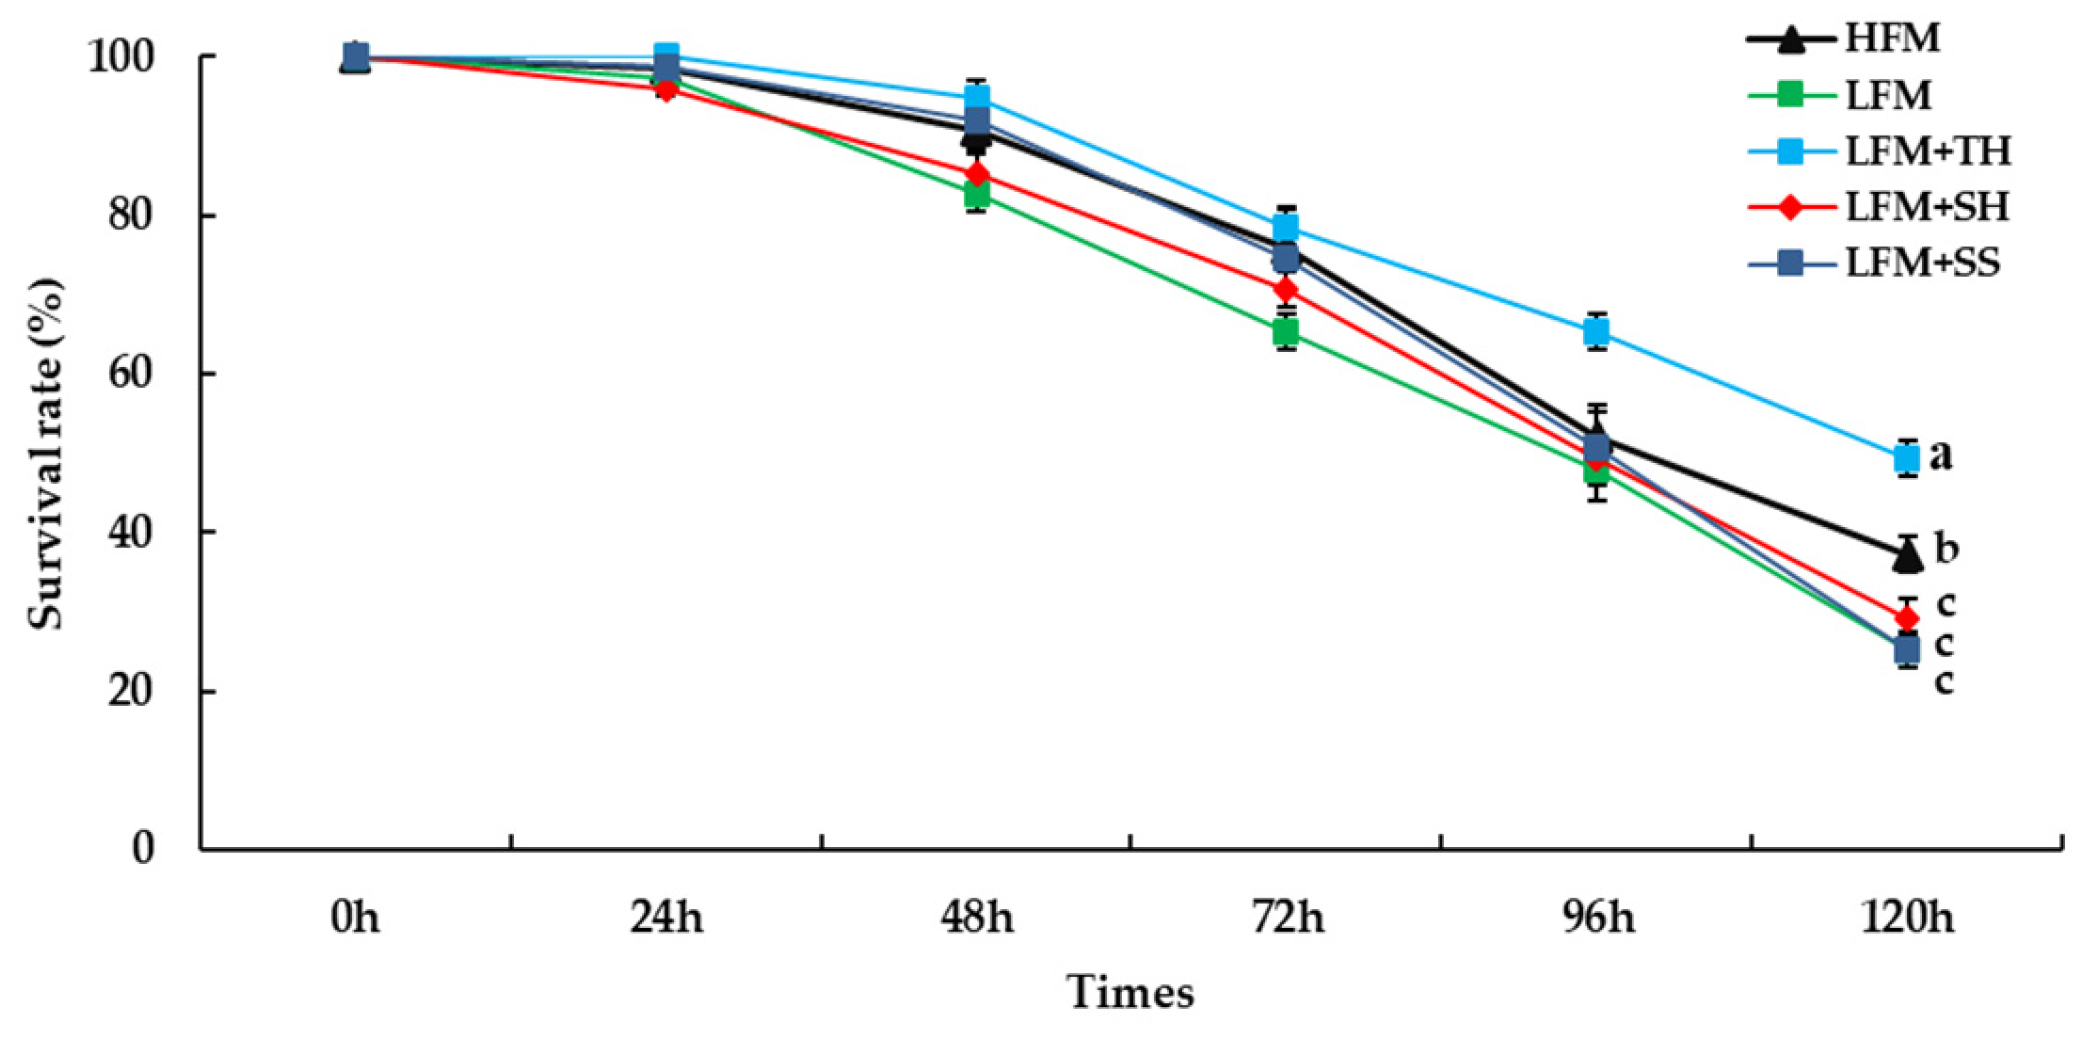
Figure 6.
Cortisol levels in Asian seabass following a 120-h ammonia stress challenge. Values are means ± SD (n = 5). Abbreviations: HFM, high-fish meal diet; LFM, low-fish meal diet; LFM+TH, LFM diet + tuna hydrolysate; LFM+SH, LFM diet + shrimp hydrolysate; LFM+SS, LFM diet + salmon silage.
Figure 6.
Cortisol levels in Asian seabass following a 120-h ammonia stress challenge. Values are means ± SD (n = 5). Abbreviations: HFM, high-fish meal diet; LFM, low-fish meal diet; LFM+TH, LFM diet + tuna hydrolysate; LFM+SH, LFM diet + shrimp hydrolysate; LFM+SS, LFM diet + salmon silage.
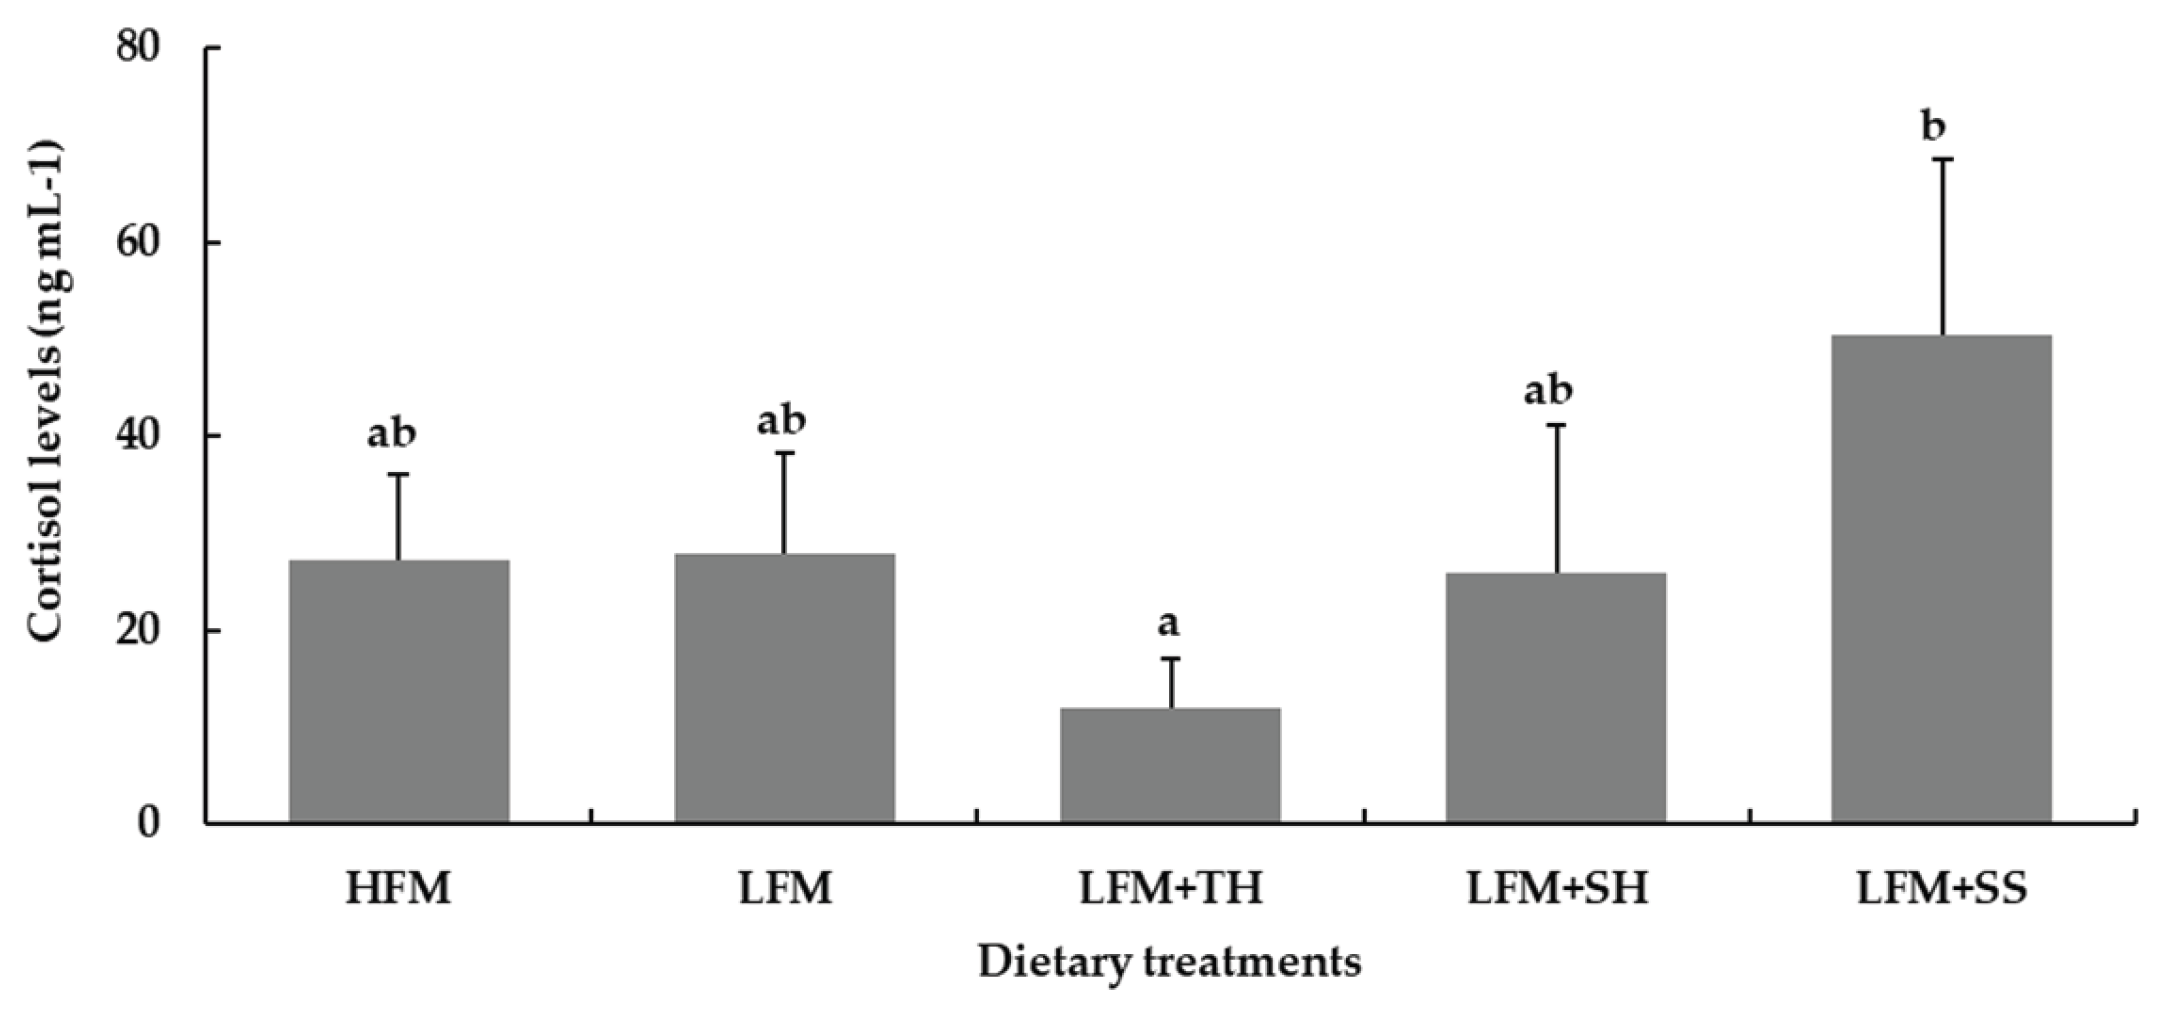

Table 1.
Chemical composition, molecular weight, and amino acids profile of tuna hydrolysate (TH), shrimp hydrolysate (SH) and salmon silage (SS).
Table 1.
Chemical composition, molecular weight, and amino acids profile of tuna hydrolysate (TH), shrimp hydrolysate (SH) and salmon silage (SS).
| Ingredients | |||||||
|---|---|---|---|---|---|---|---|
| TH | SH | SS | |||||
| Chemical composition (% dry matter) | |||||||
| Dry matter | 35.5 | 95.6 | 45.1 | ||||
| Crude protein | 62.1 | 71.2 | 68.7 | ||||
| Crude lipid | 8.2 | 9.2 | 19.1 | ||||
| Crude ash | 20.2 | 12.3 | 6.7 | ||||
| Energy (MJ kg-1) | 17.8 | 21.8 | 24.2 | ||||
| Soluble protein | >90 | >90 | n.d.* | ||||
| Molecular weight (Dalton, % wet basis) | |||||||
| <500 | 64 | 79 | 82 | ||||
| 500-1000 | 5 | 10 | 7 | ||||
| 1000-5000 | 15 | 10 | 9 | ||||
| 5000-10000 | 8 | 1 | 1 | ||||
| >10000 | 8 | 0 | 0 | ||||
| Essential amino acids (% wet basis) | |||||||
| Arginine | 1.14 | 4.19 | 1.97 | ||||
| Histidine | 0.85 | 1.03 | 0.46 | ||||
| Isoleucine | 0.59 | 2.70 | 1.20 | ||||
| Leucine | 1.09 | 4.04 | 2.31 | ||||
| Lysine | 1.16 | 4.30 | 2.40 | ||||
| Methionine | 0.40 | 1.30 | 0.95 | ||||
| Phenylalanine | 0.59 | 2.90 | 1.17 | ||||
| Threonine | 0.72 | 2.50 | 1.17 | ||||
| Tryptophan | 0.15 | 0.80 | 0.37 | ||||
| Valine | 0.77 | 3.20 | 1.51 | ||||
| Total essential amino acids | 7.46 | 26.96 | 13.51 | ||||
| Non-essential amino acids (% wet basis) | |||||||
| Alanine | 1.34 | 4.30 | 1.85 | ||||
| Aspartic acid | 1.37 | 5.70 | 2.86 | ||||
| Glutamic acid | 2.12 | 9.00 | 4.31 | ||||
| Glycine | 1.91 | 4.90 | 1.85 | ||||
| Proline | 1.09 | 2.30 | 1.05 | ||||
| Serine | 0.74 | 2.40 | 1.85 | ||||
| Tyrosine | 0.47 | 2.30 | 0.28 | ||||
| Total essential amino acids | 7.46 | 26.96 | 13.51 | ||||
| Total non-essential amino acids | 9.04 | 30.90 | 14.05 | ||||
| Total amino acids | 16.50 | 59.08 | 27.56 | ||||
Abbreviations: HFM, high-fish meal diet; LFM, low-fish meal diet; LFM+TH, low-fish meal diet supplemented with tuna hydrolysate; LFM+SH, low-fish meal diet supplemented with shrimp hydrolysate and LFM+SS, low-fish meal diet supplemented with salmon silage. * n.d.= no data.
Table 2.
Formulation and chemical composition of experimental diets for Asian seabass (% as-fed basis).
Table 2.
Formulation and chemical composition of experimental diets for Asian seabass (% as-fed basis).
| Ingredients (% crude basis) |
Dietary treatment | ||||
|---|---|---|---|---|---|
| HFM | LFM | LFM+TH | LFM+SH | LFM+SS | |
| Fish meal, 65%CP | 25.00 | 10.00 | 10.00 | 10.00 | 10.00 |
| Soybean meal, 44%CP | 23.00 | 48.46 | 42.88 | 45.03 | 42.60 |
| Poultry by-product meal | 12.00 | 12.00 | 12.00 | 12.00 | 12.00 |
| Wheat gluten | 5.06 | 5.06 | 5.06 | 5.06 | 5.06 |
| Wheat flour | 28.29 | 14.13 | 15.01 | 15.56 | 15.69 |
| Tuna crude oil | 4.50 | 5.80 | 5.50 | 5.80 | 5.40 |
| Choline chloride | 1.00 | 1.00 | 1.00 | 1.00 | 1.00 |
| Mono calcium phosphate | 0.00 | 2.00 | 2.00 | 2.00 | 2.00 |
| DL-Methionine | 0.00 | 0.35 | 0.35 | 0.35 | 0.25 |
| L-Lysine | 0.10 | 0.20 | 0.20 | 0.20 | 0.00 |
| Salt, NaCl | 0.20 | 0.15 | 0.15 | 0.15 | 0.15 |
| Vitamin premix1 | 0.20 | 0.20 | 0.20 | 0.20 | 0.20 |
| Mineral premix2 | 0.15 | 0.15 | 0.15 | 0.15 | 0.15 |
| Antioxidants | 0.25 | 0.25 | 0.25 | 0.25 | 0.25 |
| Antimicrobial agents | 0.25 | 0.25 | 0.25 | 0.25 | 0.25 |
| Tuna hydrolysate | 5.00 | ||||
| Shrimp hydrolysate | 2.00 | ||||
| Salmon silage | 5.00 | ||||
| Analyzed chemical composition (% dry matter)3 | |||||
| Dry matter | 92.50 | 89.52 | 90.69 | 89.60 | 89.39 |
| Crude protein | 48.84 | 48.51 | 48.43 | 48.09 | 48.18 |
| Crude lipid | 11.89 | 11.95 | 11.91 | 11.83 | 11.97 |
| Ash | 10.18 | 9.75 | 10.34 | 10.67 | 10.18 |
| Crude fiber | 2.34 | 2.52 | 1.64 | 1.62 | 2.61 |
| Nitrogen-free extract | 26.75 | 27.26 | 27.68 | 27.79 | 27.06 |
| Gross energy (MJ kg-1) | 19.92 | 19.62 | 19.70 | 19.61 | 19.36 |
Abbreviations: HFM, high-fish meal diet; LFM, low-fish meal diet; LFM+TH, low- fish meal diet supplemented with tuna hydrolysate; LFM+SH, low-fish meal diet supplemented with shrimp hydrolysate and LFM+SS, low-fish meal diet supplemented with salmon silage. 1 Vitamin premix (1 kg) = vitamin A, 3000000 mg kg-1; vitamin B1-Thiamin, 15000 mg kg-1; vitamin B2-Riboflavin, 12500 mg kg-1; vitamin B3-Niacin, 50000 mg kg-1; vitamin B5-Pantothenic acid, 40000 mg kg-1; vitamin B6-Pyridoxine, 20000 mg kg-1; vitamin B7-Biotin, 750 mg kg-1; vitamin B9-Folic acid, 3000 mg kg-1; vitamin B12, 100 mg kg-1; vitamin D, 1000000 µg kg-1; vitamin E, 90000 mg kg-1 and vitamin K, 20000 mg kg-1. 2 Mineral premix (1 kg) = Ca, 150 mg kg-1; P, 150 mg kg-1; Cu, 20000 mg kg-1; Fe, 40000 mg kg-1; Mn, mg kg-1; Se, 280 mg kg-1; Zn, 40000 mg kg-1 and I, 2200 mg kg-1. 3 Analysis performed by Agricultural development research center in northeast Thailand, Faculty Agriculture, Khon Kaen University: dry matter (AOAC official method 934.01), crude protein (Kjeldahl method, total N×6.25), crude lipid (AOAC official method 2003.05, Soxhlet extraction), crude fiber (Fibertherm method), ash (AOAC official method 942.05), Nitrogen-free extract (NFE) was calculated as: % of dry matter – (% of crude protein + % of crude lipid + % of crude ash + % of crude fiber), and gross energy (automatic dynamic bomb calorimeter (IKA® Werke, C5000, Germany).
Table 3.
Peptides profile and amino acids profile of experimental diet for Asian seabass.
| Parameters | Dietary treatments | ||||
|---|---|---|---|---|---|
| HFM | LFM | LFM+TH | LFM+SH | LFM+SS | |
| Peptides profile (Dalton, % wet basis)1 | |||||
| <500 | 48.8 | 49.1 | 50.7 | 40.4 | 49.1 |
| 500-1000 | 3.9 | 2.7 | 3.4 | 3.0 | 3.8 |
| 1000-5000 | 7.0 | 5.6 | 6.6 | 7.2 | 6.6 |
| 5000-10000 | 3.9 | 4.0 | 4.1 | 5.1 | 3.8 |
| 10000-20000 | 9.1 | 9.4 | 5.6 | 11.2 | 9.8 |
| >20000 | 27.4 | 29.1 | 25.6 | 33.2 | 36.7 |
| Essential amino acids (% dry matter)2 | |||||
| Arginine | 2.60 | 2.70 | 2.48 | 2.72 | 2.52 |
| Histidine | 0.96 | 1.03 | 0.99 | 1.16 | 1.04 |
| Isoleucine | 1.70 | 1.67 | 1.57 | 1.64 | 1.68 |
| Leucine | 2.83 | 2.91 | 2.67 | 2.83 | 2.87 |
| Lysine | 2.65 | 2.72 | 2.59 | 2.81 | 2.73 |
| Methionine | 1.01 | 1.04 | 1.01 | 1.10 | 1.09 |
| Phenylalanine | 1.81 | 1.82 | 2.03 | 2.01 | 1.83 |
| Threonine | 1.26 | 1.33 | 1.22 | 1.33 | 1.32 |
| Tryptophan | 0.50 | 0.55 | 0.48 | 0.50 | 0.47 |
| Valine | 2.24 | 2.33 | 2.21 | 2.35 | 2.35 |
| Non-essential amino acids (% dry matter)2 | |||||
| Alanine | 1.80 | 1.79 | 1.65 | 2.03 | 2.05 |
| Aspartic acid | 3.39 | 3.56 | 3.20 | 3.53 | 3.16 |
| Cystine + Cysteine | 0.75 | 0.69 | 0.68 | 0.69 | 0.69 |
| Glutamic acid | 6.60 | 7.14 | 7.51 | 7.42 | 7.01 |
| Glycine | 2.24 | 2.19 | 2.14 | 2.29 | 2.31 |
| Proline | 2.39 | 2.35 | 2.45 | 2.68 | 2.59 |
| Taurine | 0.16 | 0.14 | 0.20 | 0.20 | 0.28 |
| Tyrosine | 1.36 | 1.38 | 1.50 | 1.66 | 1.55 |
| Serine | 1.77 | 1.98 | 1.73 | 1.94 | 1.83 |
| Total essential amino acids | 17.57 | 18.10 | 17.23 | 18.47 | 17.91 |
| Total non-essential amino acids | 20.48 | 21.22 | 21.06 | 22.44 | 21.47 |
| Sum-total amino acids | 38.05 | 39.32 | 38.29 | 40.90 | 39.38 |
Abbreviations: HFM, high-fish meal diet; LFM, low-fish meal diet; LFM+TH, low- fish meal diet supplemented with tuna hydrolysate; LFM+SH, low-fish meal diet supplemented with shrimp hydrolysate and LFM+SS, low-fish meal diet supplemented with salmon silage. 1 Molecular weight analyses were performed using size exclusion chromatography SEC-HPLC. 2 Amino acids profiles performed by SGS Thailand using ISO13903, HPLC.
Table 4.
Growth performance and feed utilization of Asian seabass fed the experimental diets for 8 weeks.
Table 4.
Growth performance and feed utilization of Asian seabass fed the experimental diets for 8 weeks.
| Parameters | Dietary treatments | |||||
|---|---|---|---|---|---|---|
| HFM | LFM | LFM+TH | LFM+SH | LFM+SS | P-value | |
| Initial body weight (g fish-1) | 2.61±0.01 | 2.62±0.01 | 2.62±0.01 | 2.62±0.01 | 2.62±0.01 | 0.067 |
| Final body weight (g fish-1) | 47.96±0.83a | 40.30±1.27b | 48.05±0.94a | 38.38±1.48c | 41.34±0.35b | <0.001 |
| Percent weight gain (%) | 1736.3±32.6a | 1436.4±47.2b | 1737.1±40.9a | 1367.5±52.7c | 1476.2±13.0b | <0.001 |
| Average daily gain (g day-1) | 0.81±0.01a | 0.67±0.02b | 0.81±0.02a | 0.64±0.03c | 0.69±0.01b | <0.001 |
| Specific growth rate (% day-1) | 5.20±0.03a | 4.88±0.06b | 5.20±0.04a | 4.80±0.06c | 4.92±0.01b | <0.001 |
| Feed intake (g fish-1) | 51.57±2.04a | 49.14±2.07b | 50.49±0.98ab | 46.65±1.98c | 52.40±1.05a | <0.001 |
| Feed conversion ratio | 1.16±0.05a | 1.42±0.94c | 1.14±0.01a | 1.34±0.03b | 1.38±0.04bc | <0.001 |
| Protein efficiency ratio | 1.80±0.05b | 1.58±0.06cd | 1.86±0.02a | 1.59±0.02c | 1.53±0.04d | <0.001 |
| Nitrogen retention (%) | 27.26±1.07a | 25.65±1.06b | 28.03±0.53a | 27.51±1.11a | 23.38±0.46c | <0.001 |
| Lipid retention (%) | 33.71±1.32b | 30.50±1.26c | 35.29±0.67a | 29.81±1.20c | 30.55±0.61c | <0.001 |
| Intraperitoneal fat (%) | 1.74±0.39 | 1.48±0.40 | 1.81±0.33 | 1.81±0.23 | 1.75±0.29 | 0.505 |
| Hepatosomatic index (%) | 2.38±0.26 | 1.95±0.46 | 2.09±0.34 | 2.43±0.34 | 1.92±0.34 | 0.090 |
| Viscerosomatic index (%) | 8.55±0.62 | 8.41±0.97 | 8.18±0.42 | 8.75±0.46 | 8.08±1.00 | 0.615 |
| Survival rate (%) | 96.8±3.0a | 90.0±2.7b | 96.0±2.4a | 96.8±3.0a | 96.8±2.3a | 0.023 |
Note: Values are means of five replicates group and presented as mean±standard deviation. Values with different superscripts in the same row are significantly different (P<0.05). Dietary treatments are abbreviated: HFM, high-fish meal diet; LFM, low-fish meal diet; LFM+TH, low- fish meal diet supplemented with tuna hydrolysate; LFM+SH, low-fish meal diet supplemented with shrimp hydrolysate, and LFM+SS, low-fish meal diet supplemented with salmon silage.
Table 5.
Hematological and non-specific immune response of Asian seabass fed the experimental diets for 8 weeks.
Table 5.
Hematological and non-specific immune response of Asian seabass fed the experimental diets for 8 weeks.
| Parameters | Dietary treatments | |||||
|---|---|---|---|---|---|---|
| HFM | LFM | LFM+TH | LFM+SH | LFM+SS | P-value | |
| Red blood cells (×109 cells mL-1) | 1.72±0.08 | 1.63±0.15 | 1.66±0.08 | 1.67±0.16 | 1.64±0.15 | 0.803 |
| White blood cells (×107 cells mL-1) | 0.87±0.16 | 0.88±0.19 | 0.90±0.20 | 0.83±0.16 | 0.90±0.12 | 0.946 |
| Hematocrit (%) | 39.5±0.5 | 38.3±1.68 | 38.8±2.99 | 38.8±2.41 | 38.1±2.27 | 0.861 |
| Hemoglobin (g dL-1) | 11.73±1.21 | 10.88±1.14 | 11.22±0.78 | 11.69±0.68 | 10.62±1.63 | 0.470 |
| MCHC (g dL-1)1 | 29.78±3.01 | 28.61±2.58 | 28.92±1.37 | 29.95±0.76 | 27.95±3.55 | 0.691 |
| NBT (absorbance 540 nm)2 | 1.134±0.290 | 1.087±0.477 | 1.296±0.367 | 1.103±0.327 | 0.867±0.452 | 0.555 |
| SOD (%inhibition)3 | 66.39±4.48 | 59.29±7.32 | 65.26±4.82 | 53.56±16.48 | 60.85±13.78 | 0.350 |
| CAT (unit mL-1)4 | 33.46±8.20 | 36.80±10.32 | 34.01±14.36 | 39.48±10.04 | 45.43±9.68 | 0.414 |
Note: Values are means of five replicate groups and presented as mean±standard deviation. Values with different superscripts in the same row are significantly different (P<0.05). Dietary treatments are abbreviated: HFM, high-fish meal diet; LFM, low-fish meal diet; LFM+TH, low- fish meal diet supplemented with tuna hydrolysate; LFM+SH, low-fish meal diet supplemented with shrimp hydrolysate, and LFM+SS, low-fish meal diet supplemented with salmon silage. 1 MCHC: Mean cell hemoglobin concentration. 2 NBT: Nitro blue tetrazolium activity. 3 SOD: Superoxide dismutase activity. 4 CAT: Catalase activity.
Table 6.
Blood plasma metabolic markers of Asian seabass fed the experimental diets for 8 weeks.
| Parameters | Dietary treatments | |||||
|---|---|---|---|---|---|---|
| HFM | LFM | LFM+TH | LFM+SH | LFM+SS | P-value | |
| Cholesterol (mg dL-1) | 194.0±11.7 | 194.9±19.3 | 203.6±24.3 | 201.5±19.2 | 182.2±12.0 | 0.390 |
| Triglyceride (mg dL-1) | 265.8±55.5 | 230.9±59.1 | 228.7±27.1 | 203.0±68.2 | 194.4±46.2 | 0.274 |
| Glucose (mg dL-1) | 16.6±7.3 | 23.7±9.4 | 25.5±14.9 | 18.9±14.9 | 23.8±9.0 | 0.714 |
| Albumin (g dL-1) | 1.41±0.30 | 1.69±0.20 | 1.70±0.37 | 1.62±0.50 | 1.73±0.34 | 0.623 |
| Total protein (g dL-1) | 4.30±0.32 | 4.42±0.23 | 4.55±0.41 | 4.67±0.18 | 4.68±0.34 | 0.157 |
| Creatinine (mg dL-1) | 0.26±0.02 | 0.28±0.03 | 0.27±0.03 | 0.27±0.04 | 0.26±0.02 | 0.184 |
| Aspartate transaminase (U L-1) | 127.3±52.2 | 127.3±45.9 | 113.0±35.7 | 122.0±14.4 | 80.2±12.1 | 0.873 |
| Alkaline phosphatase (U L-1) | 63.8±6.7 | 60.0±2.3 | 60.2±12.5 | 59.0±6.9 | 64.8±6.8 | 0.701 |
Note: Values are means of five replicate groups and presented as mean±standard deviation. Values with different superscripts in the same row are significantly different (P<0.05). Dietary treatments are abbreviated: HFM, high-fish meal diet; LFM, low-fish meal diet; LFM+TH, low- fish meal diet supplemented with tuna hydrolysate; LFM+SH, low-fish meal diet supplemented with shrimp hydrolysate, and LFM+SS, low-fish meal diet supplemented with salmon silage.
Table 7.
Carcass proximate composition (as dry basis) of Asian seabass fed experimental diets for 8 weeks.
Table 7.
Carcass proximate composition (as dry basis) of Asian seabass fed experimental diets for 8 weeks.
| Parameters | Dietary treatments | |||||
|---|---|---|---|---|---|---|
| HFM | LFM | LFM+TH | LFM+SH | LFM+SS | P-value | |
| Proximate composition (%)1 | ||||||
| Dry matter | 26.23±0.09 | 26.53±0.12 | 26.67±1.20 | 26.00±0.00 | 26.17±0.38 | 0.759 |
| Crude protein | 48.29±0.14 | 47.54±0.08 | 48.28±0.98 | 47.60±0.09 | 47.33±0.95 | 0.158 |
| Crude lipid | 12.00±0.30 | 11.72±0.43 | 12.05±0.97 | 11.57±0.13 | 11.85±0.16 | 0.823 |
| Crude Ash | 12.56±0.75 | 12.18±0.08 | 12.69±0.79 | 12.24±0.00 | 12.61±0.79 | 0.900 |
Note: Values are means of five replicate groups and presented as mean±standard deviation. Values with different superscripts in the same row are significantly different (P<0.05). Dietary treatments are abbreviated: HFM, high-fish meal diet; LFM, low-fish meal diet; LFM+TH, low- fish meal diet supplemented with tuna hydrolysate; LFM+SH, low-fish meal diet supplemented with shrimp hydrolysate, and LFM+SS, low-fish meal diet supplemented with salmon silage. 1Analysis performed by Agricultural development research center in northeast Thailand, Faculty Agriculture, Khon Kaen University: dry matter (AOAC official method 934.01), crude protein (Kjeldahl method, total N×6.25), crude lipid (AOAC official method 2003.05, Soxhlet extraction), and ash (AOAC official method 942.05).
Table 8.
Apparent digestibility coefficients (%, ADC) of dry matter, protein, and lipid of the experimental diets for Asian seabass.
Table 8.
Apparent digestibility coefficients (%, ADC) of dry matter, protein, and lipid of the experimental diets for Asian seabass.
| Parameters | Dietary treatments | |||||
|---|---|---|---|---|---|---|
| HFM | LFM | LFM+TH | LFM+SH | LFM+SS | P-value | |
| ADCd1 | 73.1±0.3a | 68.8±0.8b | 73.5±1.0a | 69.4±1.2b | 70.4±3.7ab | 0.035 |
| ADCp2 | 90.3±0.6a | 88.7±0.3b | 90.7±0.6a | 88.3±0.1b | 88.0±1.1b | 0.001 |
| ADCl3 | 83.8±1.5 | 79.6±2.7 | 82.5±2.9 | 78.1±0.2 | 77.6±3.9 | 0.066 |
Note: Values are means of five replicate groups and presented as mean±standard deviation. Values with different superscripts in the same row are significantly different (P<0.05). Dietary treatments are abbreviated: HFM, high-fish meal diet; LFM, low-fish meal diet; LFM+TH, low- fish meal diet supplemented with tuna hydrolysate; LFM+SH, low-fish meal diet supplemented with shrimp hydrolysate, and LFM+SS, low-fish meal diet supplemented with salmon silage. 1 ADCd: Apparent digestibility coefficient of dry matter. 2 ADCp: Apparent digestibility coefficient of protein. 3 ADCl: Apparent digestibility coefficient of lipid.
Table 9.
Hematological, non-specific immunity, blood plasma metabolic markers, and blood plasma electrolytes of Asian seabass after ammonia stress challenge for 120 h.
Table 9.
Hematological, non-specific immunity, blood plasma metabolic markers, and blood plasma electrolytes of Asian seabass after ammonia stress challenge for 120 h.
| Parameters | Dietary treatments | |||||||
|---|---|---|---|---|---|---|---|---|
| HFM | LFM | LFM+TH | LFM+SH | LFM+SS | P-value | |||
| Hematological parameters | ||||||||
| Red blood cells (×109 cells mL-1) | 1.38±0.12 | 1.20±0.31 | 1.23±0.22 | 1.36±0.62 | 1.17±0.06 | 0.668 | ||
| White blood cells (×107 cells mL-1) | 0.92±0.18 | 0.81±0.11 | 0.77±0.14 | 0.73±0.24 | 0.79±0.31 | 0.246 | ||
| Hematocrit (%) | 36.77±1.42 | 36.42±4.88 | 37.00±4.09 | 35.75±6.61 | 36.81±3.88 | 0.778 | ||
| Hemoglobin (g dL-1) | 9.94±0.45 | 9.80±1.29 | 9.58±2.29 | 9.88±2.74 | 9.79±1.14 | 0.707 | ||
| MCHC (g dL-1)1 | 26.83±1.41 | 26.85±1.82 | 25.72±3.85 | 27.40±3.20 | 26.80±3.15 | 0.226 | ||
| Non-specific immunity parameters | ||||||||
| NBT (absorbance 540 nm)2 | 0.892±0.440 | 0.974±0.489 | 1.130±0.191 | 0.661±0.085 | 0.834±0.073 | 0.937 | ||
| SOD (%inhibition)3 | 91.88±19.62 | 74.50±31.83 | 91.37±12.83 | 76.14±8.95 | 86.43±12.22 | 0.593 | ||
| CAT (unit mL-1)4 | 33.96±4.79 | 25.72±12.83 | 37.82±8.72 | 28.55±10.66 | 43.00±9.79 | 0.943 | ||
| Total immunoglobulin (µg dL-1) | 140.00±13.00 | 171.41±51.68 | 146.48±16.26 | 149.71±30.79 | 155.33±46.77 | 0.318 | ||
| Lysozyme activity (unit mg protein-1) |
48.59±29.43 |
33.81±23.66 |
38.41±22.01 |
48.18±15.92 |
39.96±9.83 |
0.439 |
||
| Blood plasma metabolic markers parameters | ||||||||
| Cholesterol (mg dL-1) | 162.2±10.3 | 171.2±6.2 | 164.8±12.8 | 170.2±22.8 | 157.7±17.0 | 0.912 | ||
| Triglyceride (mg dL-1) | 200.3±65.7 | 244.7±19.3 | 207.5±31.4 | 238.7±70.5 | 202.5±41.5 | 0.929 | ||
| Glucose (mg dL-1) | 15.2±11.3 | 14.5±4.1 | 17.5±3.6 | 10.3±1.8 | 9.2±4.2 | 0.997 | ||
| Albumin (mg dL-1) | 1.13±0.31 | 1.07±0.06 | 0.95±0.25 | 1.40±0.20 | 1.17±0.21 | 0.963 | ||
| Total protein (mg dL-1) | 3.98±0.33 | 3.93±0.13 | 3.62±0.35 | 4.25±0.40 | 3.95±0.39 | 0.999 | ||
| Creatinine (mg dL-1) | 0.23±0.06 | 0.23±0.03 | 0.22±0.03 | 0.23±0.06 | 0.25±0.05 | 0.483 | ||
| Aspartate transaminase (U L-1) | 72.3±10.6 | 79.3±16.1 | 75.0±23.5 | 82.3±20.9 | 81.8±14.0 | 0.845 | ||
| Alkaline phosphatase (U L-1) | 94.0±5.3 | 120.3±29.2 | 112.8±54.4 | 121.8±40.1 | 144.7±37.5 | 0.888 | ||
| Blood plasma electrolytes parameters | ||||||||
| Sodium (Na+) (mmol L-1) | 169.7±6.0 | 184.2±25.0 | 163.8±13.7 | 168.0±10.6 | 159.8±21.6 | 0.500 | ||
| Chloride (Cl-) (mmol L-1) | 140.8±8.5 | 132.2±15.1 | 133.7±18.7 | 132.3±15.0 | 126.5±16.6 | 0.843 | ||
| Potassium (K+) (mmol L-1) | 5.1±0.9 | 5.1±1.5 | 5.1±0.3 | 5.0±0.7 | 7.6±2.5 | 0.185 | ||
Note: Values are means of five replicate groups and presented as mean±standard deviation. Values with different superscripts in the same row are significantly different (P<0.05). Dietary treatments are abbreviated: HFM, high-fish meal diet; LFM, low-fish meal diet; LFM+TH, low- fish meal diet supplemented with tuna hydrolysate; LFM+SH, low-fish meal diet supplemented with shrimp hydrolysate, and LFM+SS, low-fish meal diet supplemented with salmon silage. 1 MCHC: Mean cell hemoglobin concentration. 2 NBT: Nitro blue tetrazolium activity. 3 SOD: Superoxide dismutase activity. 4 CAT: Catalase activity.
Disclaimer/Publisher’s Note: The statements, opinions and data contained in all publications are solely those of the individual author(s) and contributor(s) and not of MDPI and/or the editor(s). MDPI and/or the editor(s) disclaim responsibility for any injury to people or property resulting from any ideas, methods, instructions or products referred to in the content. |
© 2025 by the authors. Licensee MDPI, Basel, Switzerland. This article is an open access article distributed under the terms and conditions of the Creative Commons Attribution (CC BY) license (http://creativecommons.org/licenses/by/4.0/).
Copyright: This open access article is published under a Creative Commons CC BY 4.0 license, which permit the free download, distribution, and reuse, provided that the author and preprint are cited in any reuse.


