# Both authors contributed equally
Background
Transportation-related traumatic injuries remain a major cause of morbidity and mortality worldwide. Approximately 1.2 million people die as a result of motor vehicle-related trauma (MVRT) each year. [
1]Injuries resulting from MVRTs are the third leading cause of death in the United States [
2]. These events often involve high-energy impacts between motor vehicles, pedestrians, cyclists, and roadside obstacles, producing a wide spectrum of injuries ranging from minor abrasions to complex polytrauma.
Railway injuries, though less common, also pose a public health challenge, particularly in densely populated cities like New York City (NYC), with a subway system that carried 2,027,286,000 riders in 2023 [
3]. Though transit fatalities are relatively low in the United States compared to motor vehicles [
4]Subways have higher all-cause fatality rates than other forms of mass transit. [
5]. Incidents can vary widely, ranging from ground-level falls, falls onto subway tracks, and being struck by trains.
Very little research has been performed, though, comparing injuries sustained in MVRT vs SRT. Understanding the different demographic characteristics, clinical measures, and outcomes of injuries sustained in these incidents is critical for optimizing prehospital care, guiding hospital-based trauma management, and informing public health strategies aimed at prevention. This is especially true in a location like New York City, as both motor vehicles and the subway are used by millions of people each year. This paper examines and compares the patterns, severity, and outcomes of traumatic injuries from these two transportation modalities.
Methods
This is a single-center, retrospective review conducted at Elmhurst Hospital, a level 1 trauma center in Queens, New York City. All patients who presented to the center with traumatic injuries as a result of a motor vehicle-related trauma or subway-related trauma from January 1, 2016, through December 31, 2023, were included. Patients who did not sustain injuries related to these transportation modalities were excluded. 1,043 patients were identified.
Patient data was requested from the National Trauma Registry of the American College of Surgeons (NTRACS) Database. Data collected included patient demographics, clinical measures (including Glasgow Coma Scale (GCS), injury severity score (ISS), hospital and ICU length of stay (LOS), and alcohol level), and hospital disposition. A chart review was also performed for any missing information. All patient identifying information was removed.
Analysis was conducted using SAS 9.4 software. Chi-square and Fisher’s exact were used to analyze categorical demographic data such as Gender, Race, Ethnicity, and Disposition. Continuous variables (mean, standard deviation, median, and range were analyzed via PROC MEANS and Wilcox rank-sum for non-normality. Ordinal and multinomial logistic regressions were performed for associations, including covariates and interaction terms; alcohol level was analyzed as a continuous covariate. A p-value of less than 0.05 was considered significant. All analyses were performed with the help of the built-in statistical tools available in SAS.
Results
A total of 1,043 patients were included. These patents were further divided into two categories based on whether their traumatic injuries were related to an MVRT (604 patients) or an SRT (439 patients). Demographic information is shown in
Table 1. Both MVRTs and SRTs were predominantly male, though MVRT patients were less often male than SRT patients (74.5% vs 79.9%, p=0.0395). The average age of MVRT patients was 42.2 years vs 47.0 years in SRT patients (p<0.0001). Ethnicity was similar between the two groups, with 44.4% of MVRTs and 43.2% of SRTs being of Hispanic origin. Race differed between the two groups; while Black patients were the largest demographic in both MVRTs and SRTs (62.6% vs 56.0%, P<0.0001), White patients were the second largest demographic in MVRTs (14.4%) followed by Asian (12.9% and Other/Unknown (10.1%), but Other/Unknown was the second largest demographic in SRTs (18.9%), followed by Asian (11.4%) and White (4.1%).
Insurance payor status also varied between the two groups (
Table 2). Nearly half of SRT patients were insured by Medicaid compared to only a quarter of MVRT patients (46.8% vs 26.7%, P<0.0001). There was also a difference for commercial payor status, with 17.2% of MVRT patients vs 11.9% of SRT patients (p<0.0001). Expectedly, no SRT patients were covered by no-fault Insurance, while 18.4% of MVRT patients were (p<0.0001).
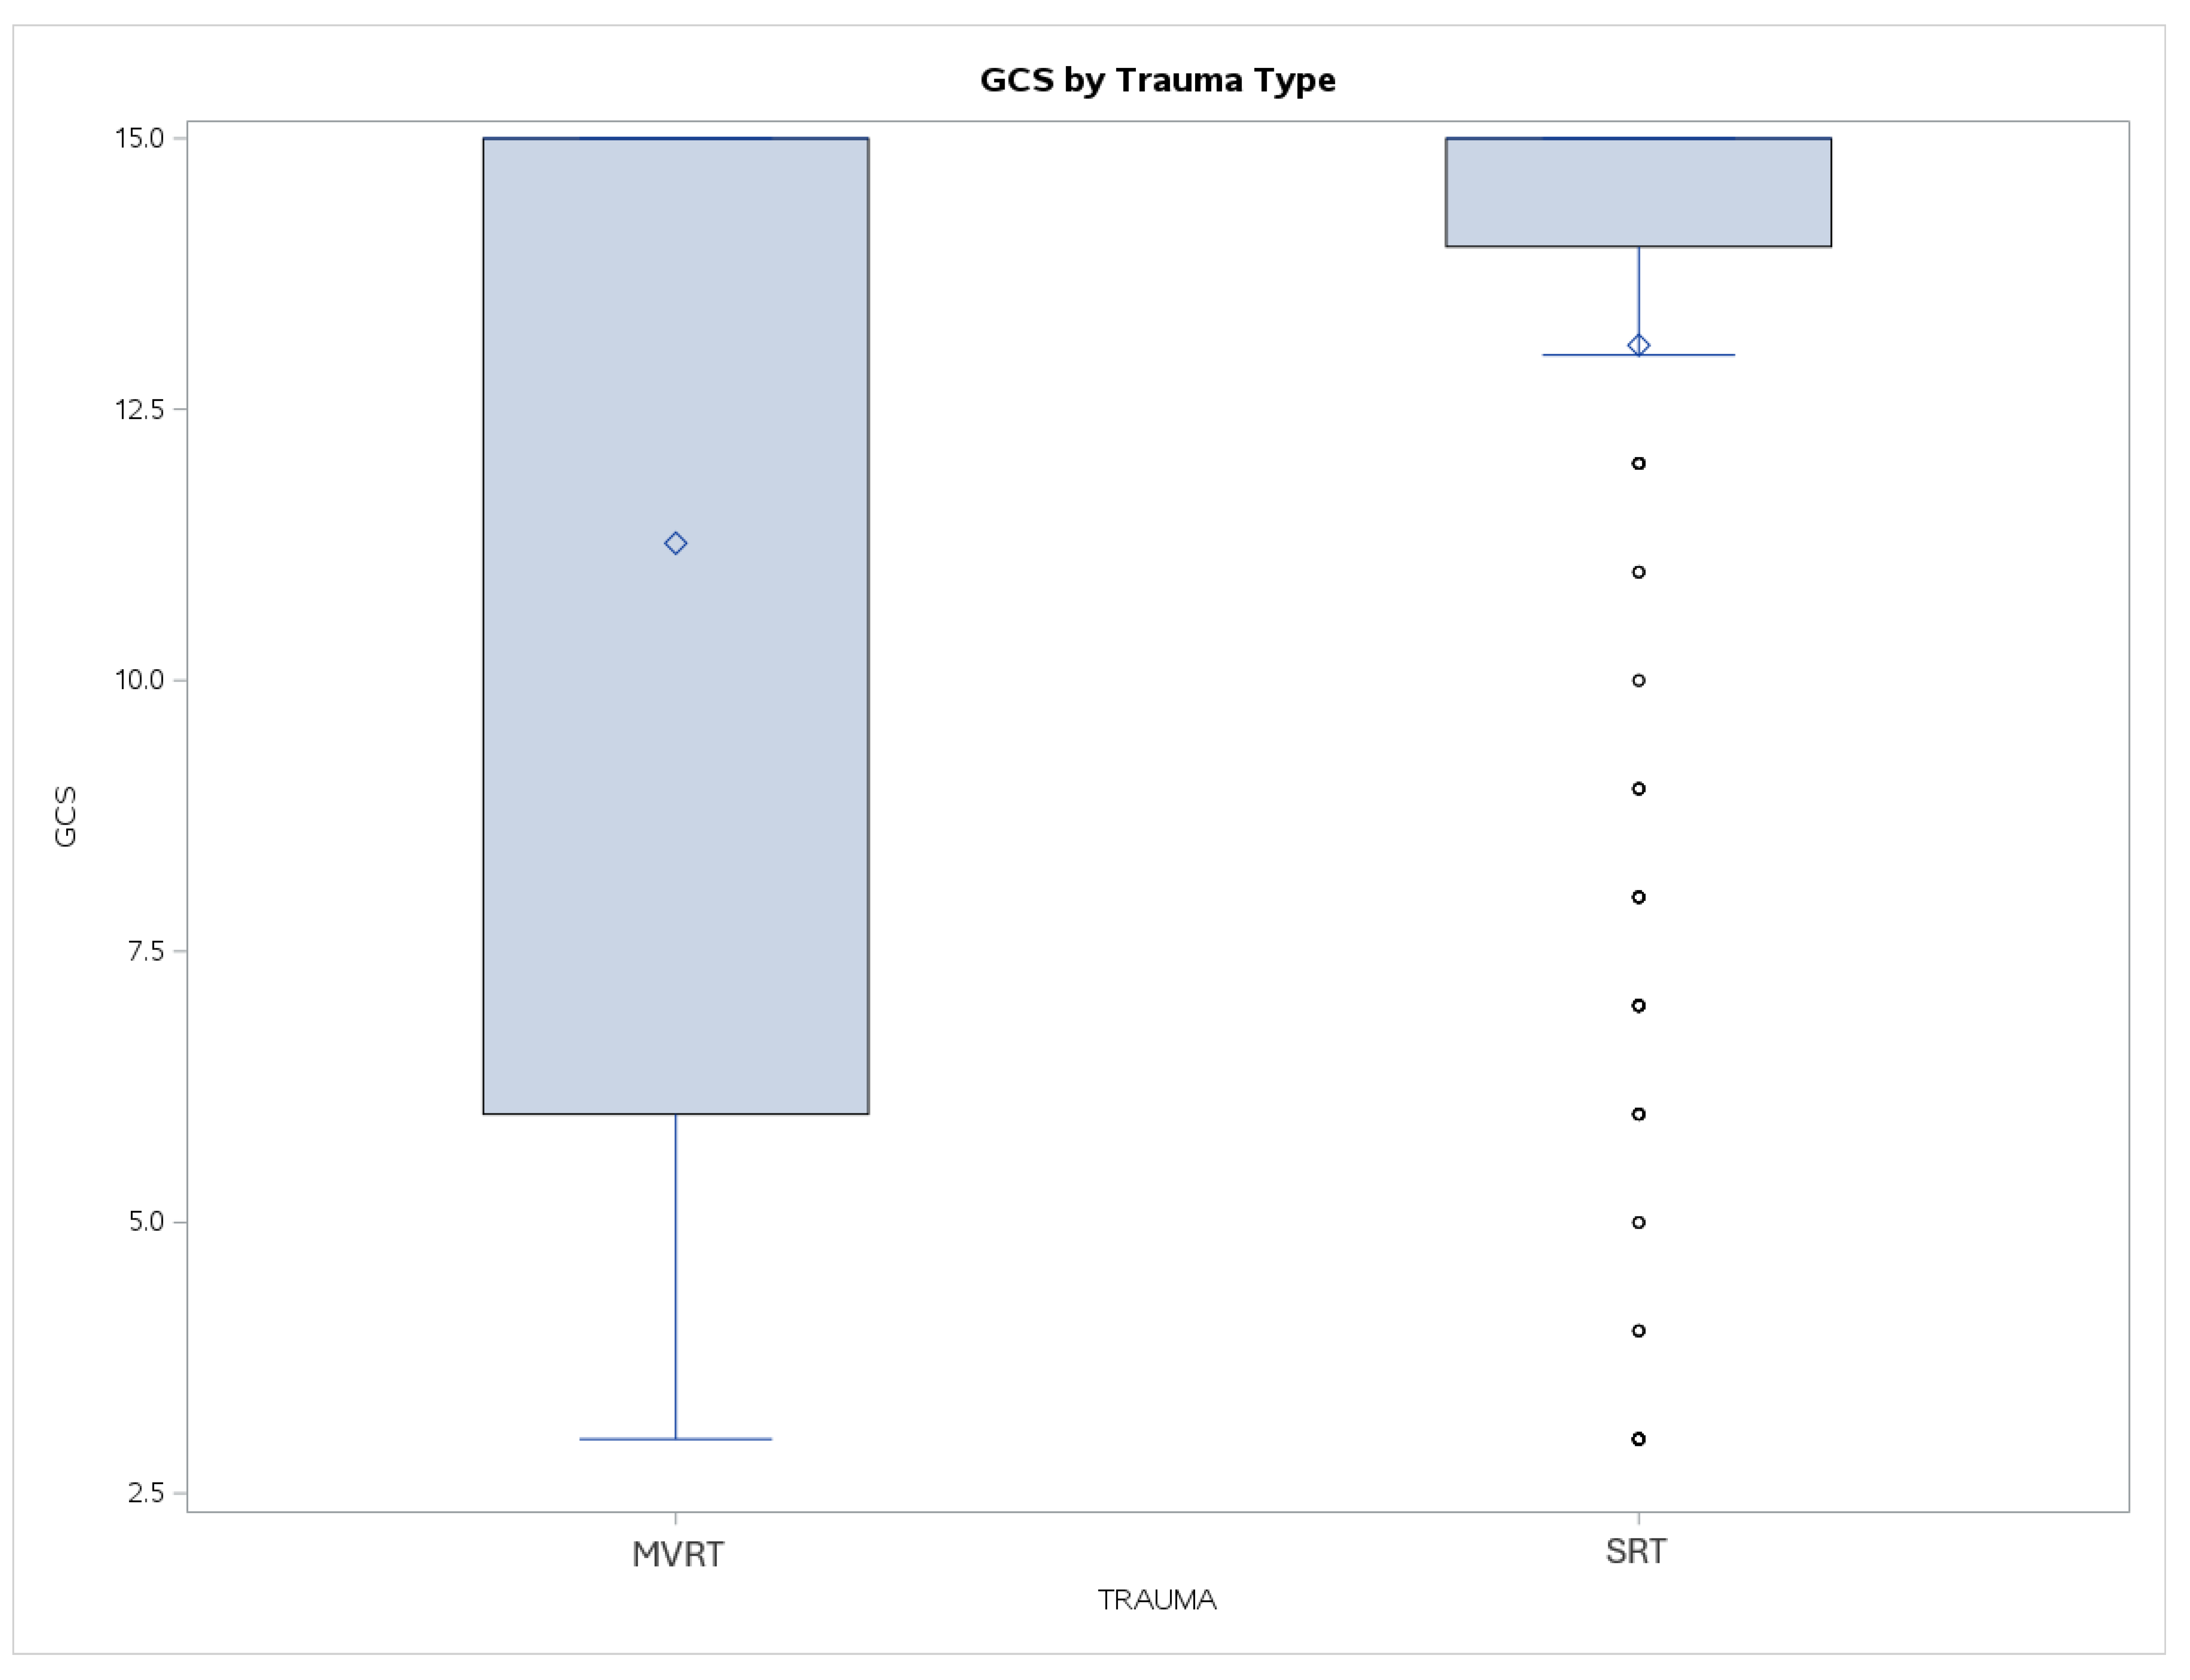
As far as clinical measures, there were also many significant differences (
Table 3). The average GCS on arrival was lower for MVRTs than SRTs (11.3 vs 13.1, p<0.001). While the median score was 15 for both groups, the range of scores was also much broader for MVRTs than SRTs, with the lower quartile reaching below 7 for MVRTs vs 14 for SRTs (
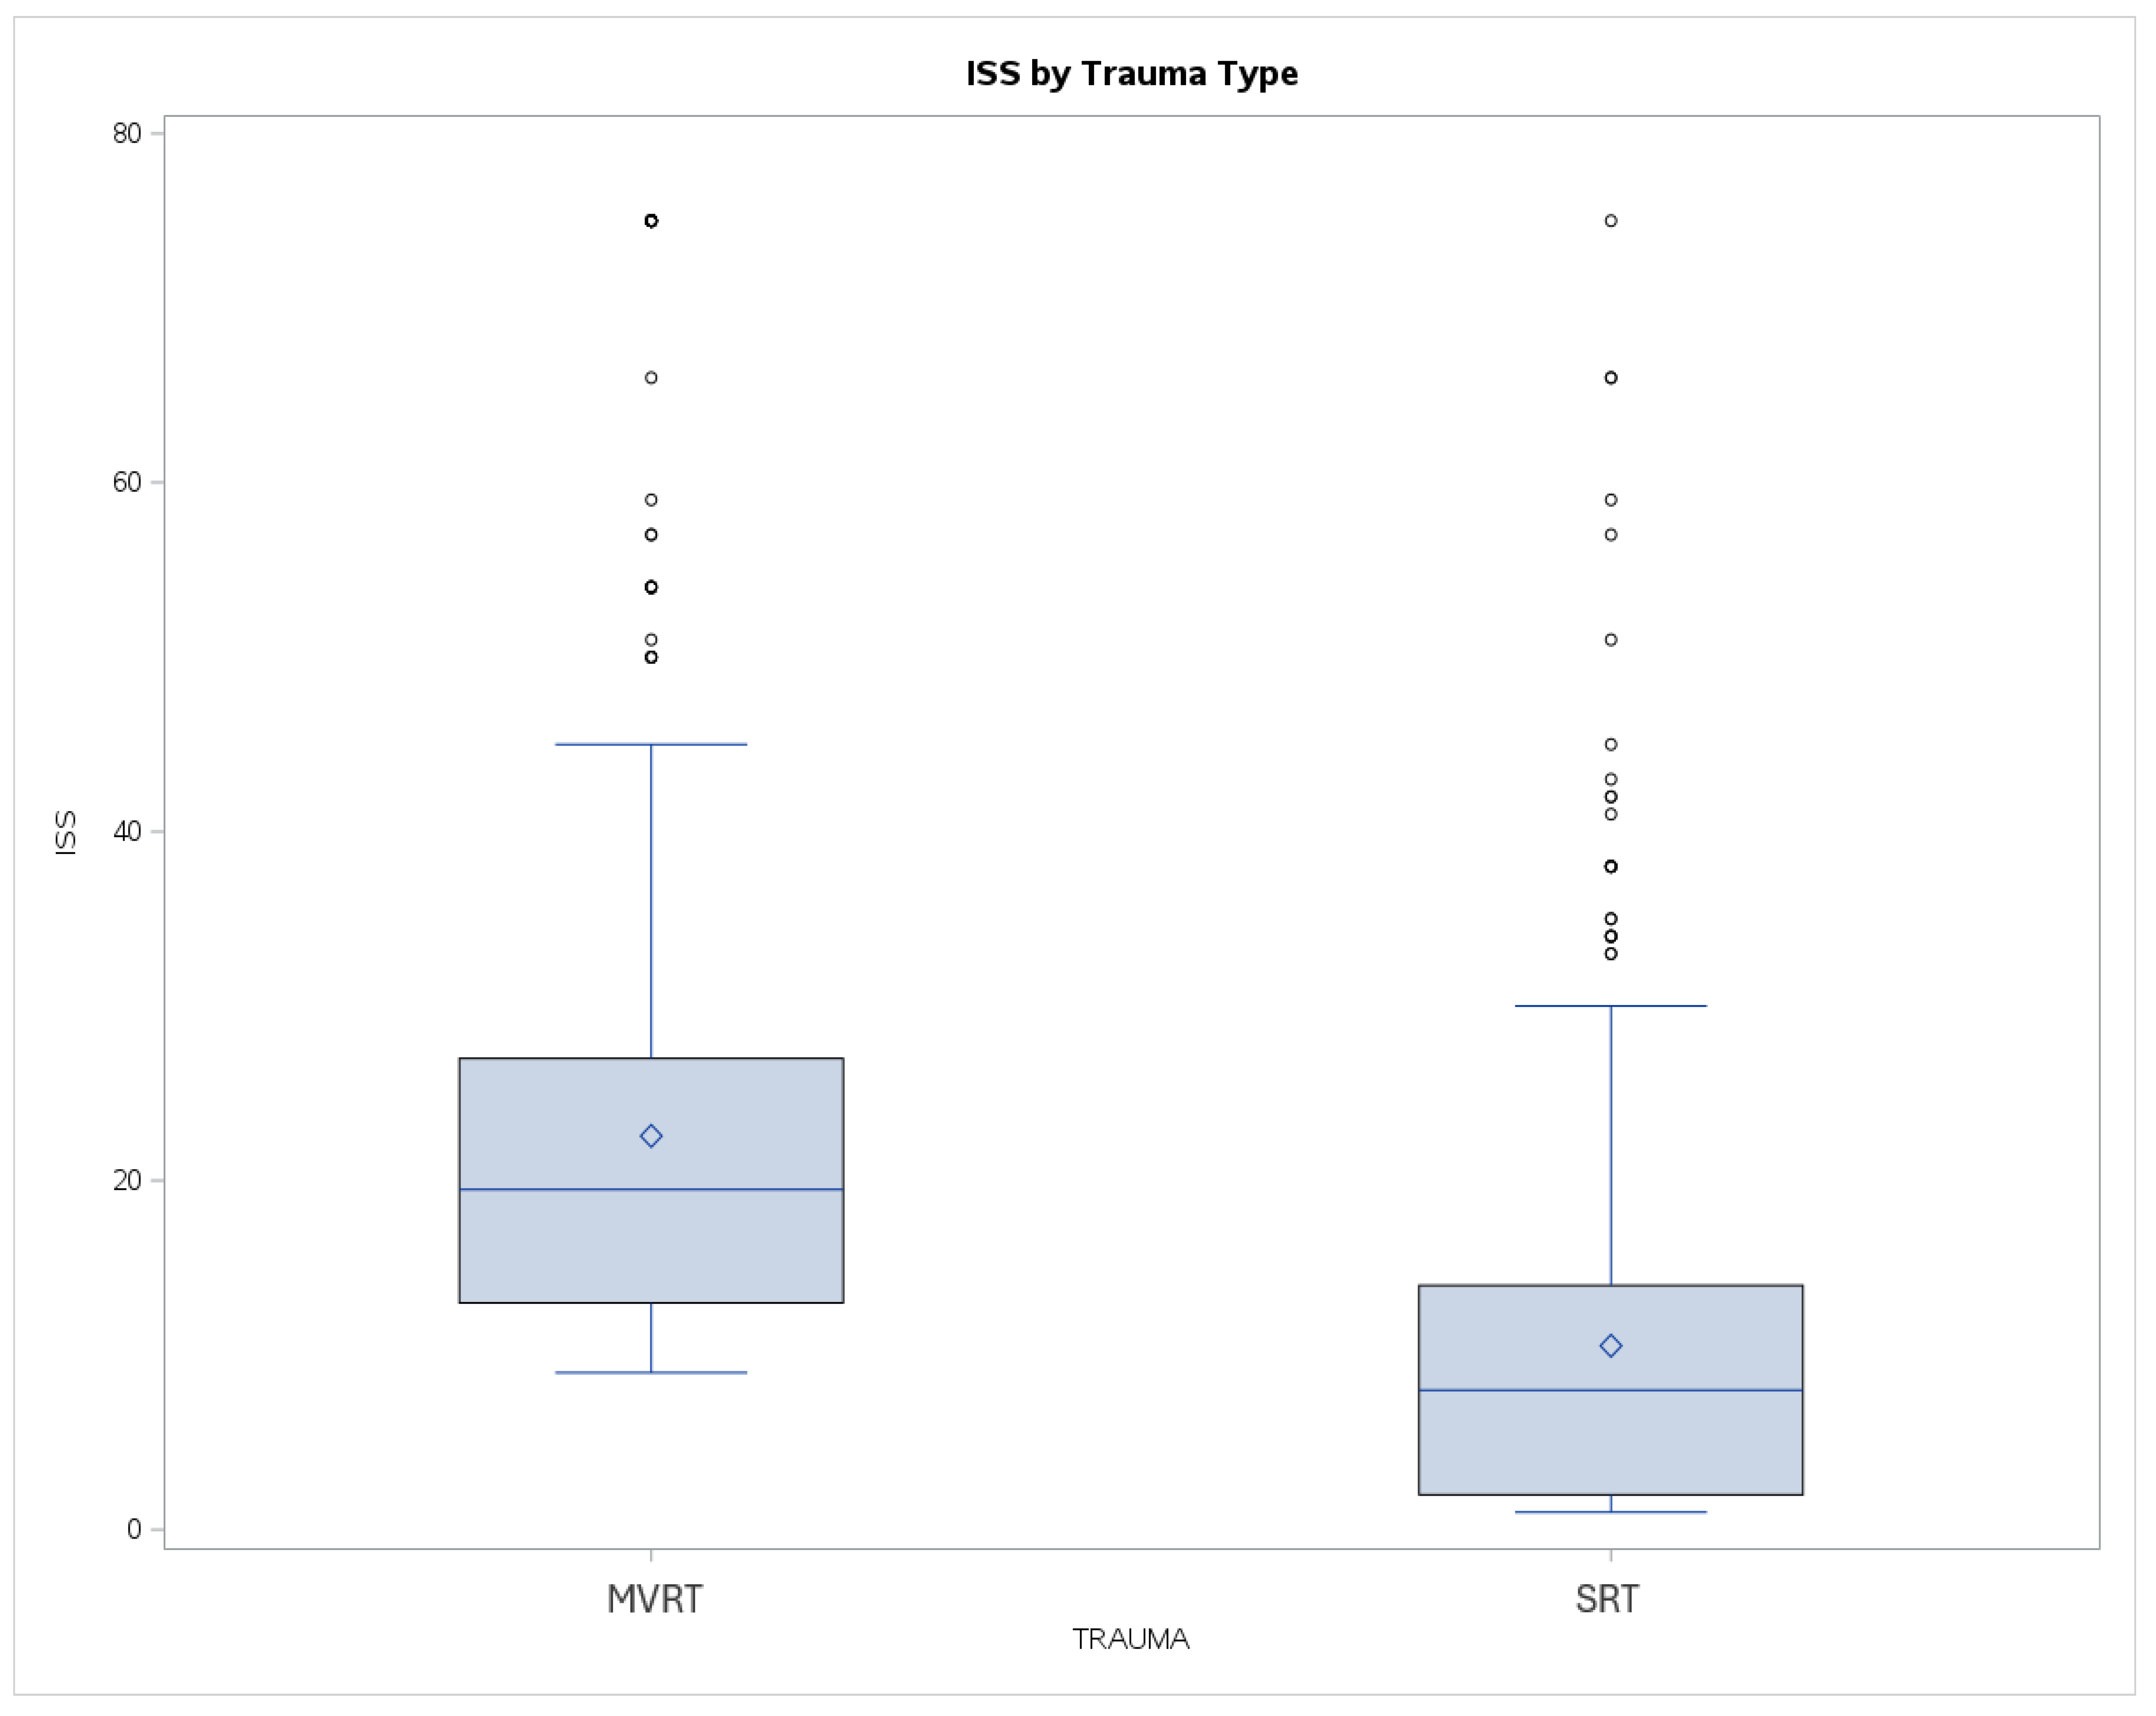
Figure 1). ISS also varied significantly, being twice as high in MVRTs vs SRTs (22.6 vs 10.5, p<0.001). The range of ISS was more similar, though MVRTs again were shifted higher than SRTs (
Figure 2).
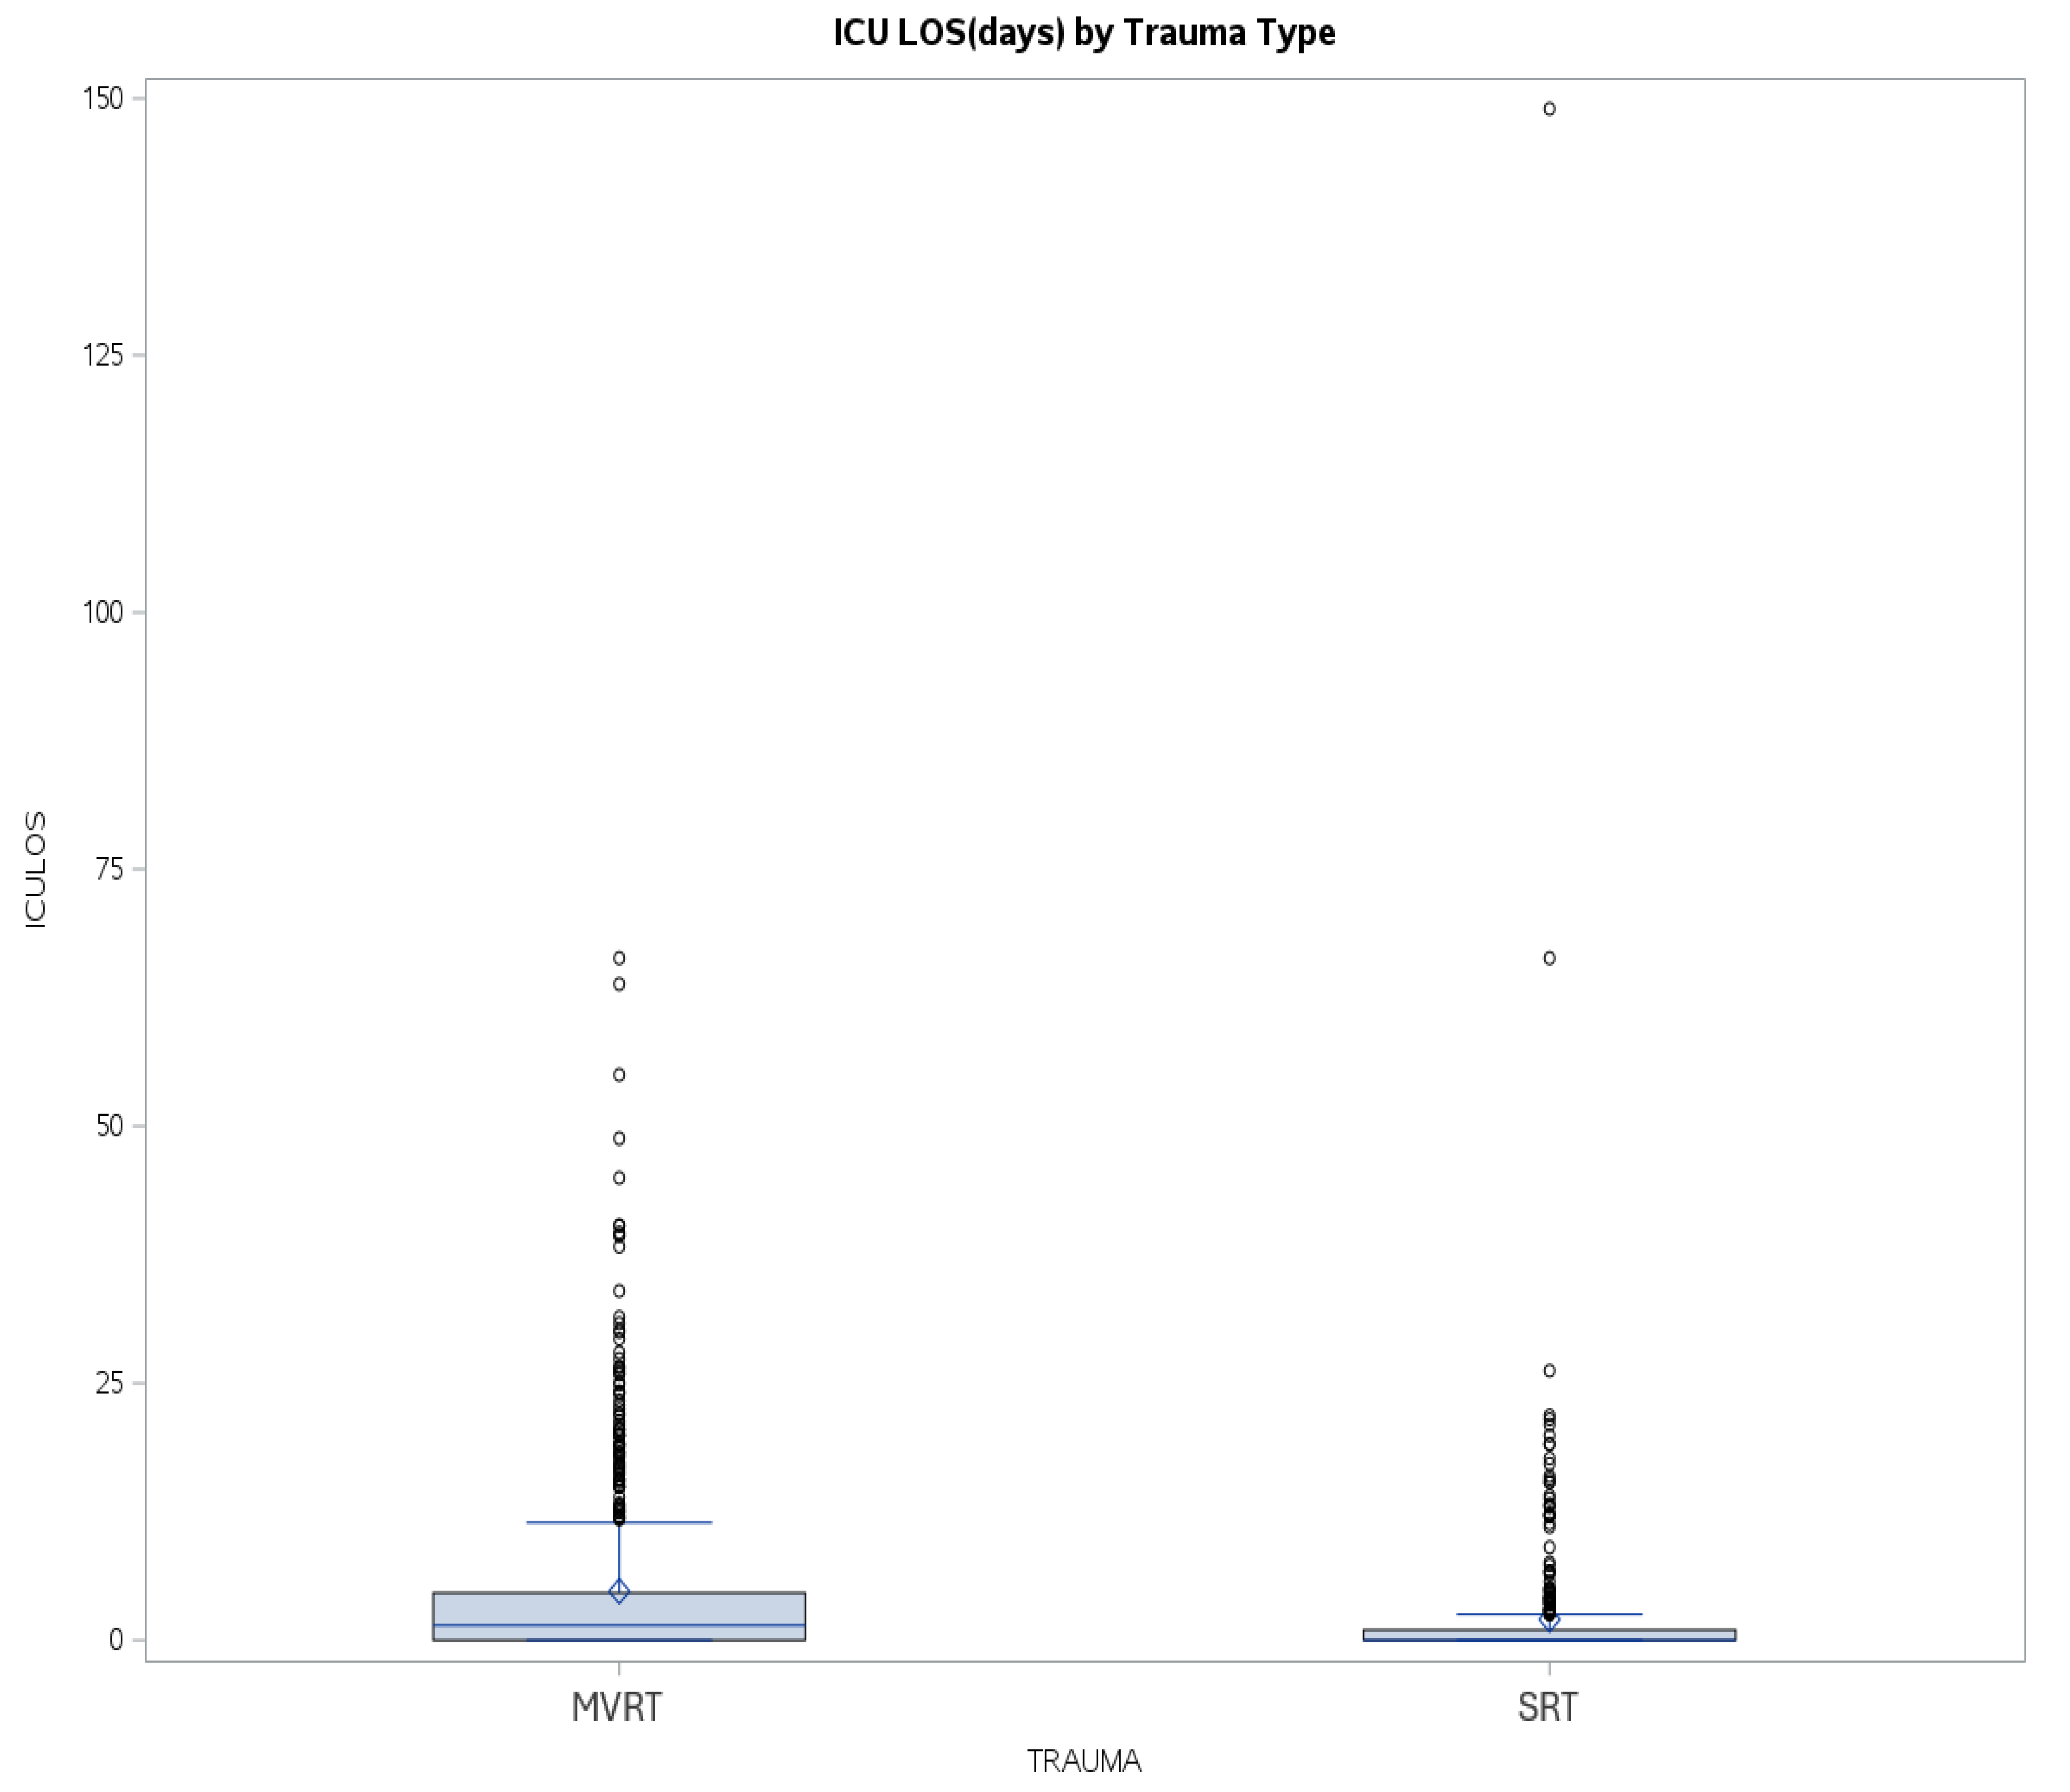
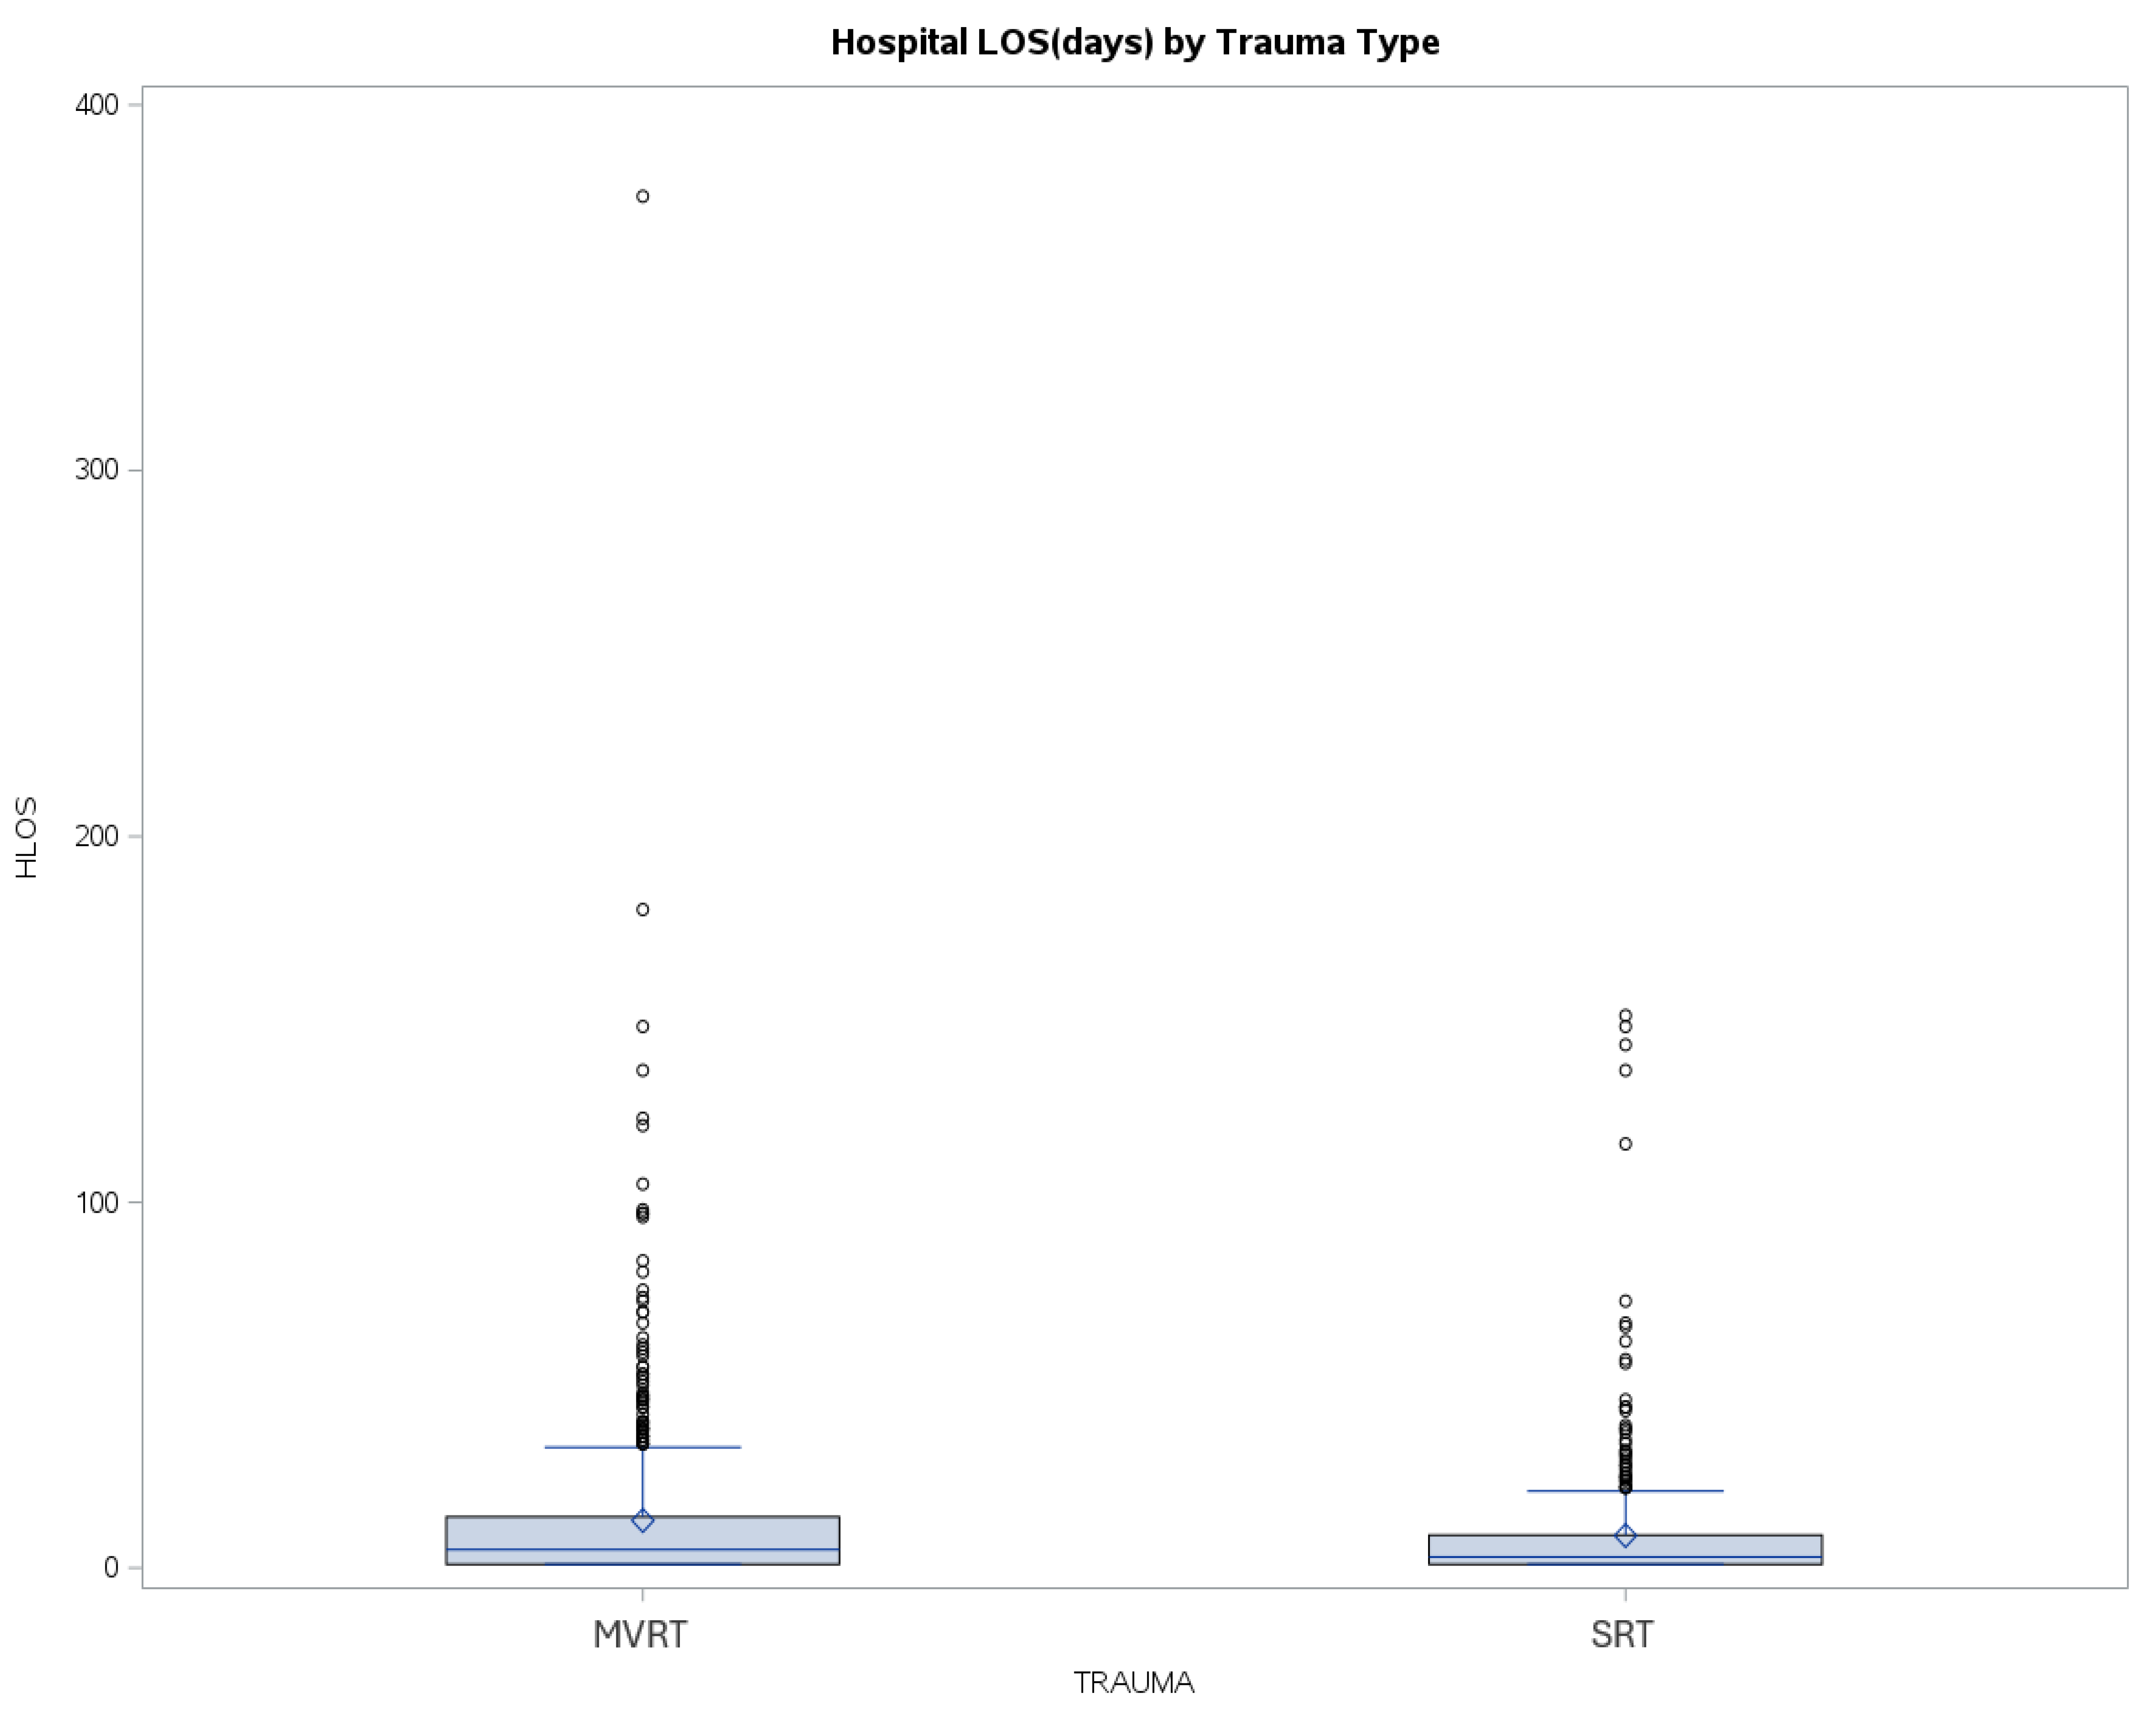
Hospital and ICU LOS varied, with MVRT patients having both longer average hospital LOS (13.0 vs 8.8 days, p<0.001) and ICU LOS (4.8 vs 2.0 days, p<0.001) compared to SRT patients. The range of hospital and ICU LOS was again larger for MVRT, with an increased upper quartile compared to SRT (
Figure 3 and
Figure 4).
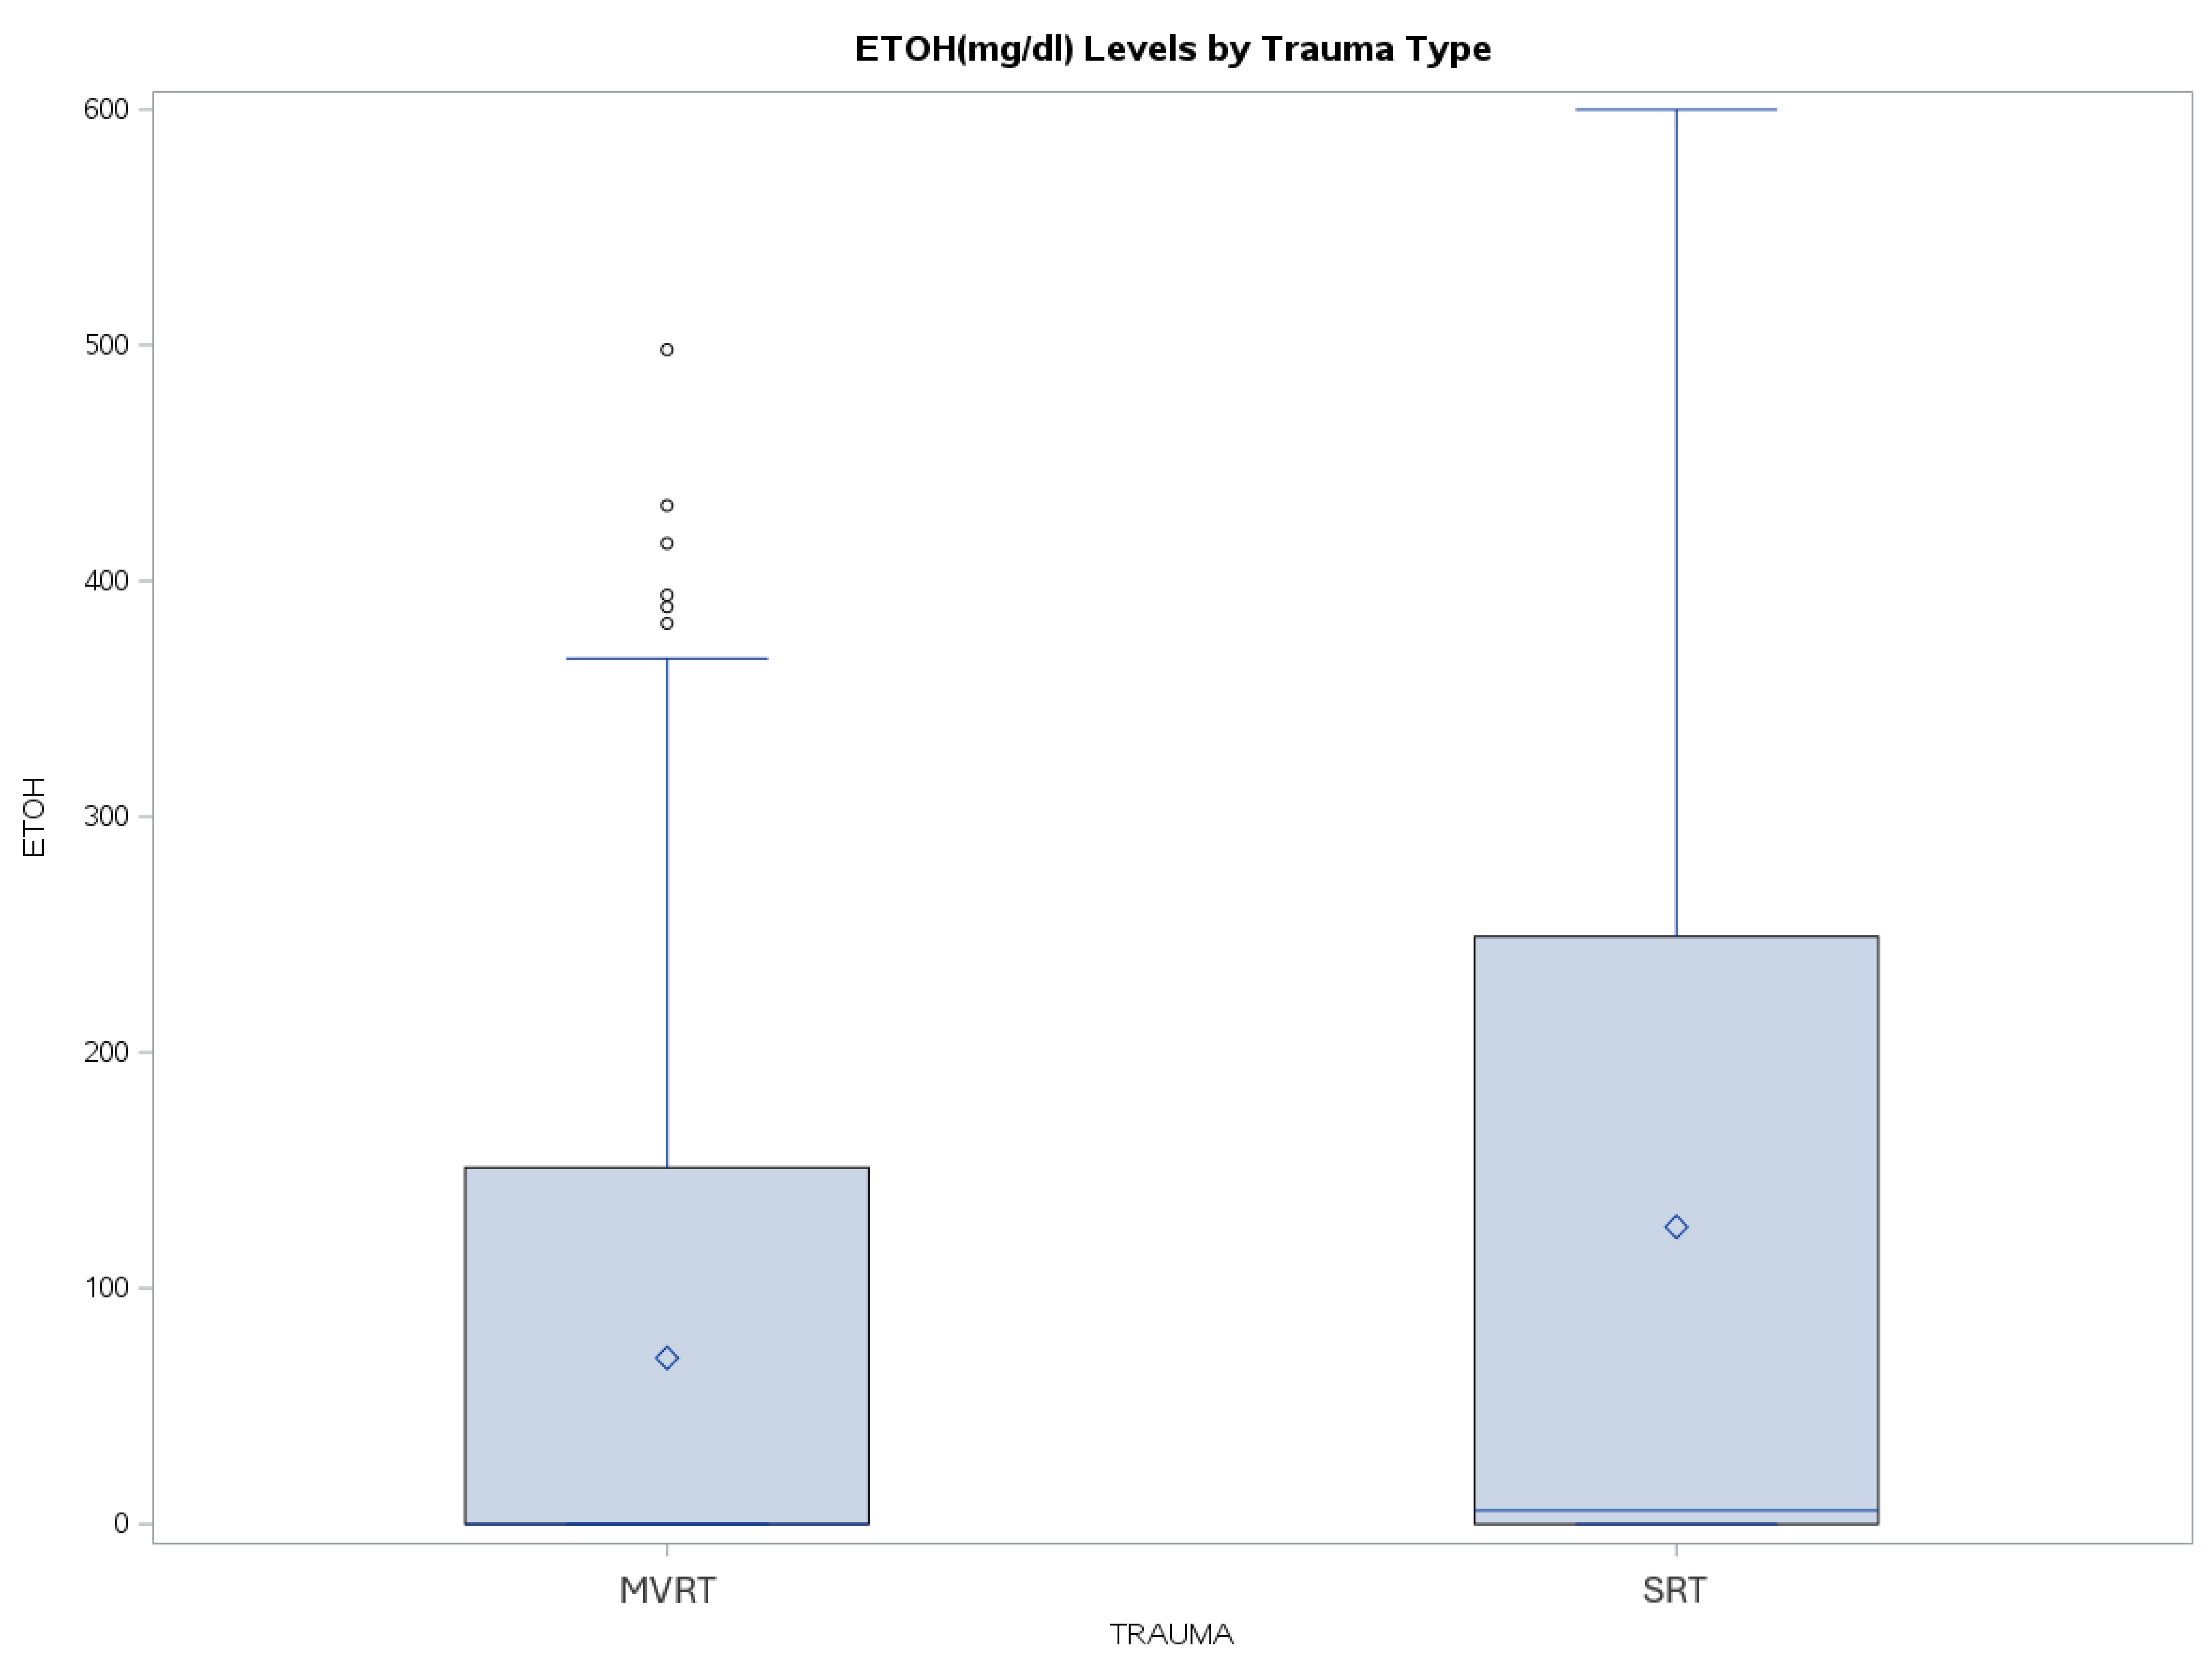
In contrast, SRT patients had a significantly higher blood alcohol level on arrival compared to MVRT patients (125.9 vs 70.3 mg/dL, p<0.001). Additionally, while the median blood alcohol level remained low in both groups, the upper quartile in SRT patients reached the mid-200 mg/dL, with some patients having levels reaching 600 mg/dL, compared to MVRT patients who had an upper quartile in the mid-100 mg/dL (
Figure 5).
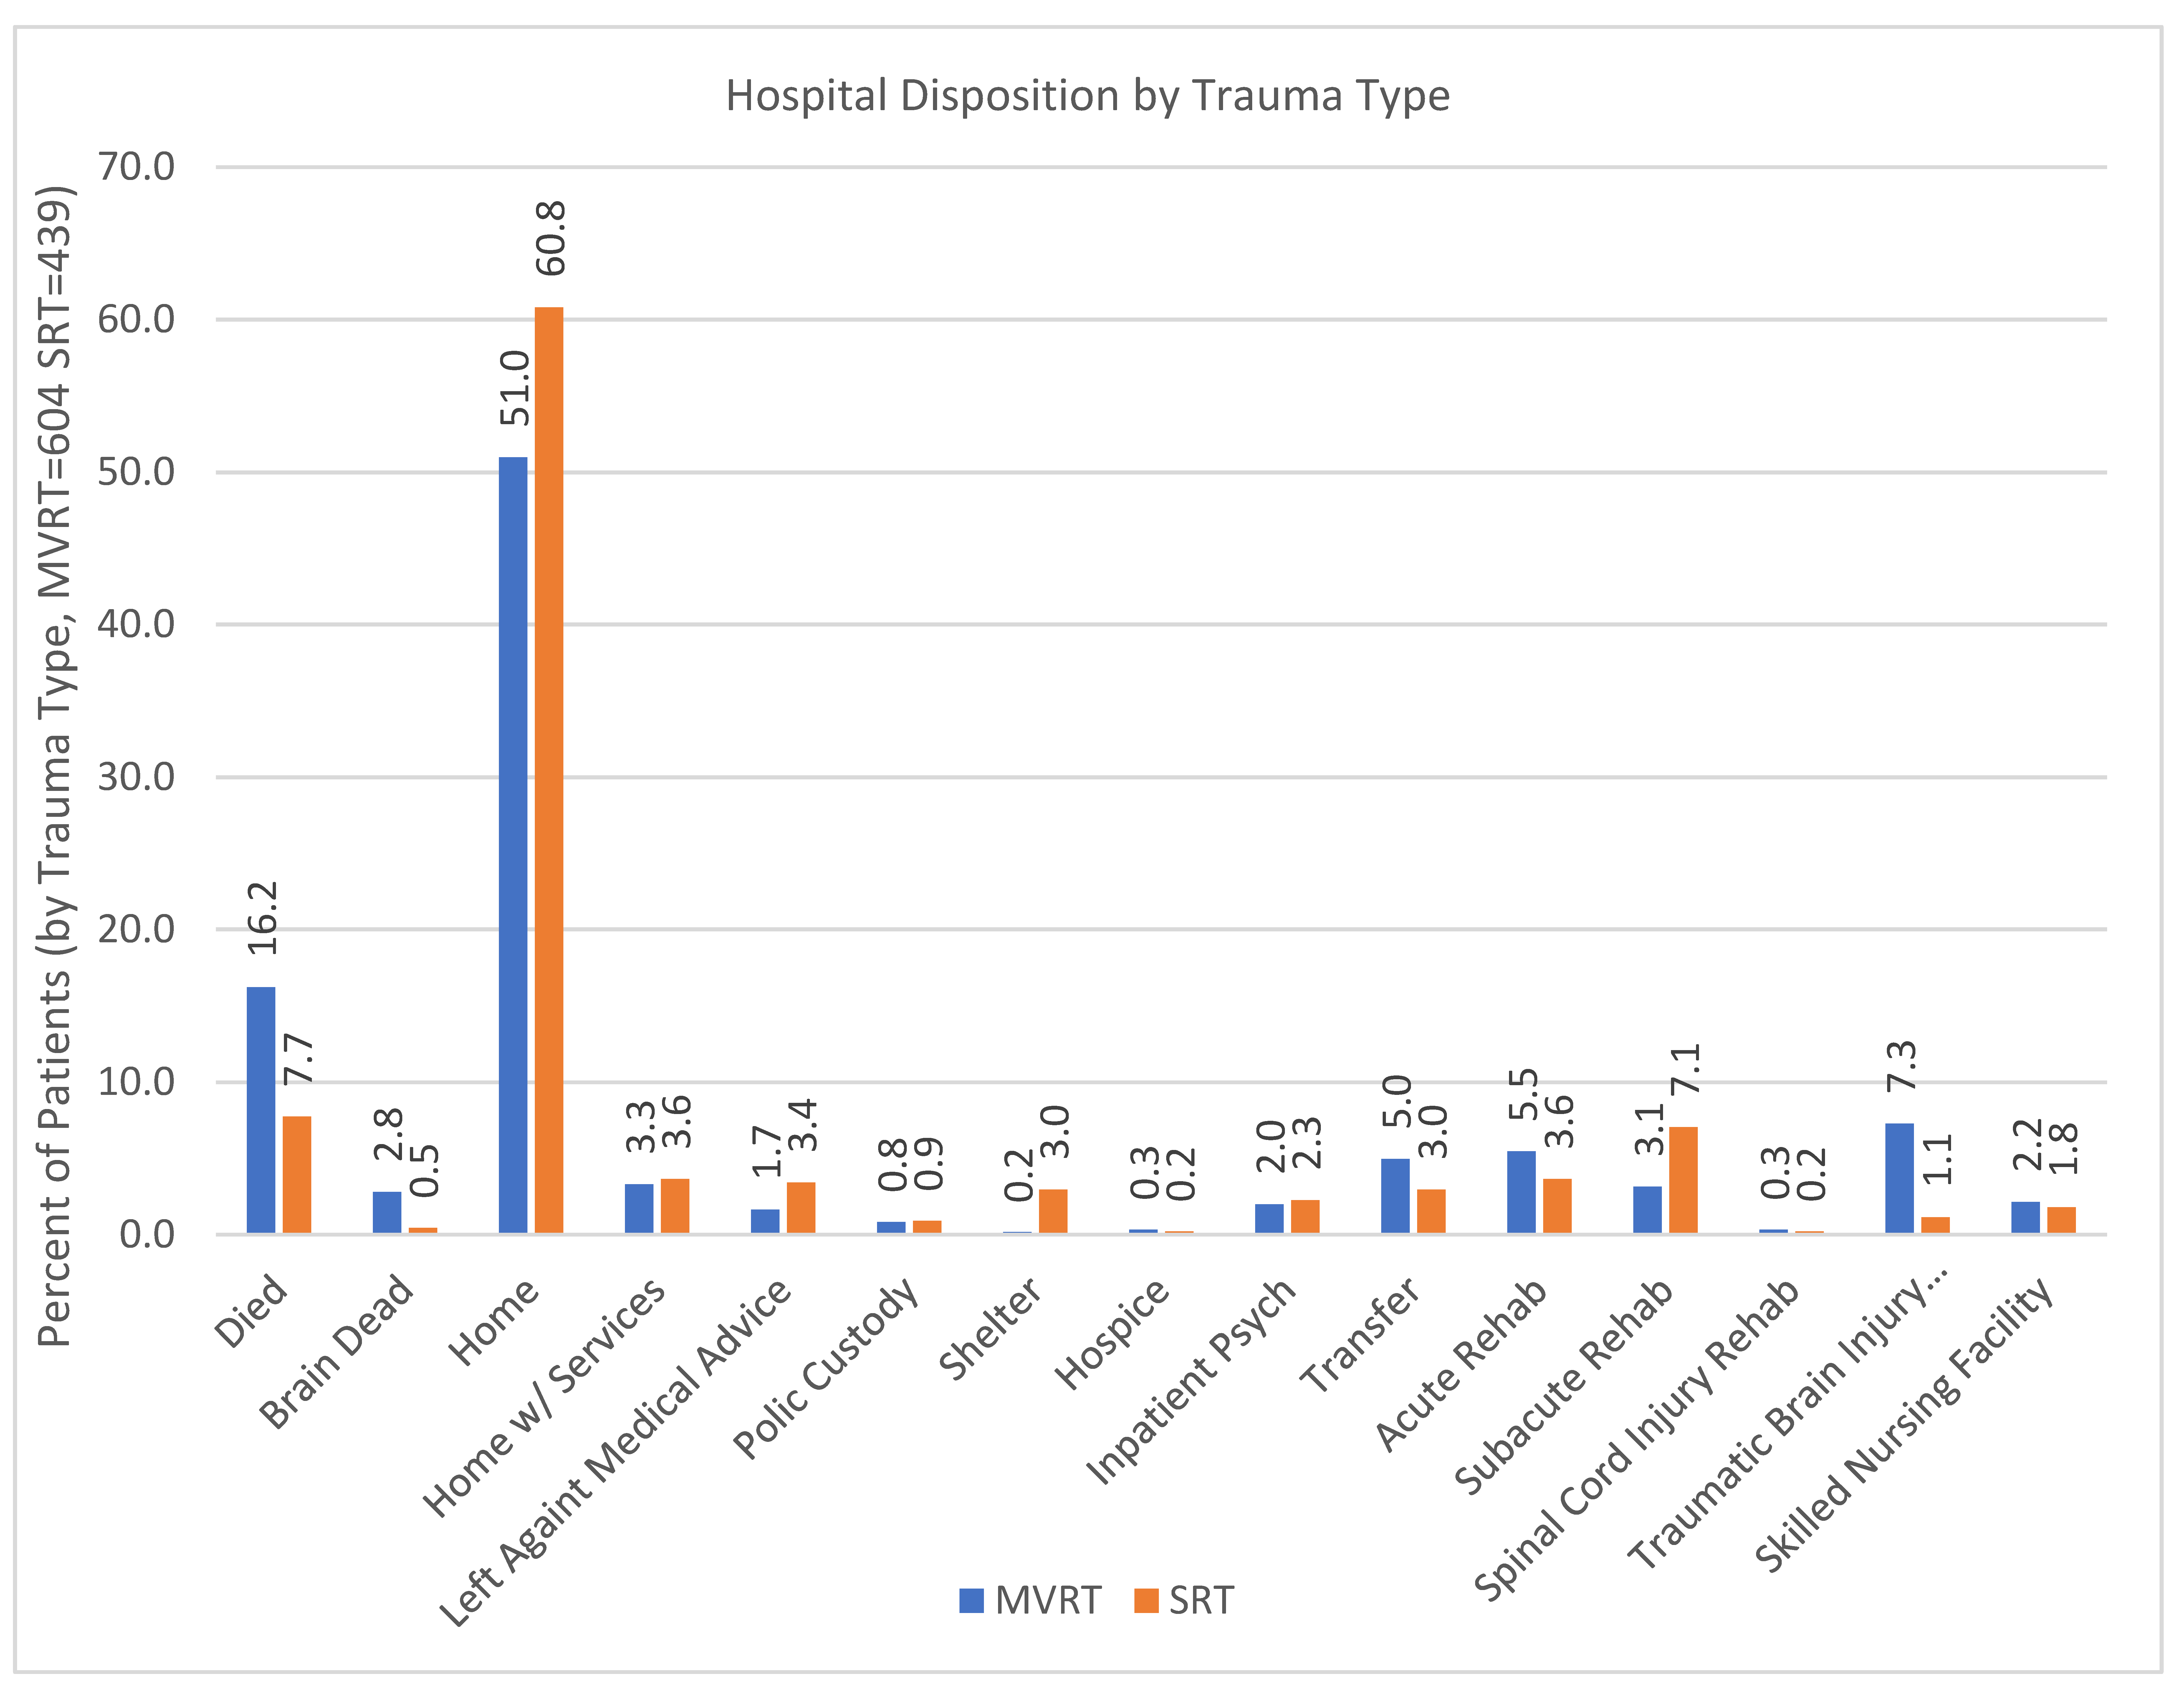
In terms of disposition, there were again many differences between MVRT and SRT patients (
Table 4,
Figure 6). The most common disposition for both groups was home, with 51.0% of MVRT patients and 60.8% of SRT patients (P<0.0001). MVRT patients had significantly higher mortality (19.0% vs 8.2%, p=0.001) and were more likely to be discharged to rehab (16.2% vs 12.1%, p<0.0001).
Given the presence of skewed distributions in several variables, non-parametric tests, including the Wilcoxon rank-sum and Kruskal-Wallis tests, were applied for unadjusted comparisons. Logistic regression models were then employed to adjust for potential covariates and to further evaluate the independent contribution of each predictor. In the analysis of predictors of outcomes, lower GCS and insurance status were significantly associated with differences in clinical trajectories.
Discussion
This study showed many significant differences between MVRT patients and SRT patients. The difference in sex breakdown (SRT 79.9% vs MVRT 74.5%, p=0.0395) reflects prior literature, with studies on SRT having a male predominance ranging from 80-84% [
6,
7,
8] vs MVRT, which has a much wider range (55-73% [
9,
10,
11,
12]). This also follows the well-established understanding that trauma patients tend to be predominantly male [
13]. Prior studies showed the average age for both SRT and MVRT patients to be in the 40s [
6,
8,
11,
12,
14], which is consistent with our findings (SRT mean 47.0 years vs MVRT 42.2 years, p<0.0001). Though there was a statistically significant difference between SRT and MVRT in both of these factors, clinically speaking, these differences are not particularly relevant.
Racial differences were also apparent between the groups. Perhaps the most striking difference is that White patients were the second most likely group to be involved in MVRT but the least likely group to be involved in SRT. This may reflect racial disparities in transport utilization; Survey data show that only 36% of White workers commuted by public transit, compared to 40% of Asian workers, 50% of Black workers, and 52% of Hispanic workers. [
15]. This is in contrast to motor vehicle drivers, who were 54% White, 40% Black, 36% Asian, and 28% Latino. [
16]. Insurance coverage patterns further underscore social and economic distinctions. Nearly half of SRT patients relied on Medicaid (46% SRT vs 26.7% MVRT, p<0.0001), while MVRT patients were more likely to carry no-fault insurance (18.4% MVRT vs 0% SRT, p<0.0001) or commercial coverage (17.2% MVRT vs 11.9% SRT, p<0.0001). On logistic analysis, insurance status was found to be significantly associated with differences in clinical outcomes. These findings highlight structural disparities in access to resources and insurance coverage depending on the mechanism of injury.
Injury severity was significantly worse for MVRT patients in every metric that was studied. Average GCS was lower (11.3 vs 13.1, p<0.001), ISS was higher (22.6 vs 10.5, p<0.001), and both ICU and total hospital LOS were longer (4.8 and 13.0 days vs 2.0 and 8.8 days, both p<0.001) for MVRT patients than SRT patients. Mortality was also higher for MVRT patients at 19.0% compared to 8.2% for SRT patients (p<0.001), and MVRT patients were more likely to be discharged to a rehab facility than SRT patients (16.2% vs 12.1%, p<0.0001). Lower GCS specifically was linked to worse outcomes upon logistic regression analysis. This is consistent with prior literature showing that collisions involving motor vehicles produce higher mortality risk ratios than other blunt trauma mechanisms. [
17]. Although SRT victims in some reports experience a high case-fatality rate [
6]. Many urban rail collisions (especially those that occur at low speeds or involve platform injuries) produce a broad spectrum of injury severities, often with a larger proportion of lower-ISS injuries than high-energy MVRT [
18]. This heterogeneity in rail/subway injury patterns helps explain why, in our cohort, SRT patients overall had lower mean ISS, shorter LOS, and lower mortality.
Interestingly, SRT patients had a significantly higher blood alcohol level compared to MVRT patients (125.9 mg/dL vs 70.3 mg/dL, p<0.001). On further analysis, though, logistic regression showed that alcohol level was not independently predictive of disposition, suggesting that these almost doubly high levels did not put SRT patients at an increased risk. Alcohol is a known risk factor for severe injury and death in motor vehicle accidents. [
19]This data suggests that people who choose to drink are recognizing this risk and utilizing alternative methods of transportation.
From a clinical perspective, subway-related injuries present a distinct profile compared to motor vehicle-related trauma. Despite significantly higher rates of alcohol intoxication, subway patients tended to sustain less severe injuries, were hospitalized for shorter durations, and were more frequently discharged directly home. This suggests that while intoxication is an important consideration for acute management, it may not translate into worse long-term outcomes in this setting. Intoxication in trauma may be more relevant as a marker of risk behavior and an opportunity for intervention, rather than a direct driver of injury severity or outcome in every context. Importantly, this group was also far more likely to rely on Medicaid insurance, reflecting broader socioeconomic and structural disparities in transportation use and healthcare access. For clinicians, this combination of higher intoxication rates, lower injury severity, and greater Medicaid dependence means that acute care may be less resource-intensive, but discharge planning may require special attention. Previous literature shows that trauma patients on Medicaid had significantly longer hospital LOS compared to other patients. [
20,
21].
Conversely, motor vehicle-related trauma patients demonstrated a much more severe clinical course. These patients experienced higher ISS, lower GCS, longer hospitalizations, greater mortality, and were more often discharged to rehabilitation facilities. This pattern underscores the need for early aggressive resuscitation and multidisciplinary planning for post-acute care in MVRT patients. The disproportionate demand for ICU and rehabilitation resources also has implications for system-level planning, particularly in urban centers where both MVRT and SRT occur in parallel but with different clinical burdens.
Limitations
This study has several important limitations. It was conducted at a single Level 1 trauma center in Queens, New York City, which may limit generalizability to other settings with different populations, transit systems, or trauma care resources. The retrospective design introduces risks of missing or misclassified data, as some variables require manual chart review. In addition, only patients who survived to hospital presentation were captured, which may underestimate the true severity and mortality of both subway- and motor vehicle–related trauma. Furthermore, while multivariable analyses were performed, residual confounding is likely. Insurance status, for example, may represent broader socioeconomic differences not directly measured in this dataset. Alcohol levels were available, but data on other substances, psychosocial factors, and long-term functional outcomes were not, restricting conclusions to acute hospital-based outcomes. Future multicenter, prospective studies with broader data collection will be necessary to validate and expand these findings.
Conclusion
In this single-center retrospective study, motor vehicle–related trauma was associated with more severe injuries, higher mortality, and greater resource utilization compared to subway-related trauma, which more often involved alcohol use but resulted in less severe injuries and more frequent discharges home. Race and insurance pattern differences highlighted underlying socioeconomic disparities, with subway patients disproportionately reliant on Medicaid and motor vehicle patients more likely to carry no-fault or commercial coverage. These findings underscore the need for tailored clinical strategies, targeted prevention efforts, and system-level planning that account for the differing clinical profiles and social contexts of urban trauma mechanisms.
Author Contributions
Conceptualization—B.S.; Resources- B.S., Z.S., and G.A.; Methodology- B.S. and T.P., Formal analysis- B.S. and T.P., Investigation- B.S., K.T. and N.D.B., writing—original draft preparation—B.S., H.A.A., and S.K.; writing—review and editing—B.S. and J.W., supervision—B.S.; project administration—B.S. All authors have read and agreed to the published version of the manuscript.
Funding
There is no grant support or financial relationship for this manuscript.
Institutional Review Board (IRB) Statement
This retrospective study was approved by the IRB at Elmhurst Hospital Center (EHC) on July 17, 2024, with IRB number 24-12-287-05G.
Conflicts of Interest
The authors have no competing interests to declare.
References
- World Health Organization. World Health Organization Fact Sheets. 2023. Road Traffic Injuries (accessed on September 15, 2025).
- CDC WISQARS. CDC Web-based Injury Statistics Query and Reporting System. 2023. Leading Causes of Death Reports.
- Metropolitan Transportation Authority. New York City Transit. Subway and bus ridership for 2023. Available from: https://www.mta.info/agency/new-york-city-transit/subway-bus-ridership-2023#:~:text=Significant%20factors%20contributing%20to%20slower,75%20express%20routes. (accessed on 29 September 2025).
- Dickens, M. 2023 Public Transportation Fact Book. Washington, DC, 2024 March (accessed on September 15, 2025).
- Cook A, Walton-Hawthorne A, Gogolin A, Machiraju C, Champlin C, Murphy D, et al. 2023 National Transit Summaries and Trends. 2023.
- Rodier SG, DiMaggio CJ, Wall S, Sim V, Frangos SG, Ayoung-Chee P, et al. Subway-Related Trauma: An Urban Public Health Issue with a High Case-Fatality Rate. J Emerg Med [Internet]. 2018;55(2):165-171.e1. Available from: https://www.sciencedirect.com/science/article/pii/S0736467918303536.
- Gershon RRM, Pearson JM, Nandi V, Vlahov D, Bucciarelli-Prann A, Tracy M, et al. Epidemiology of subway-related fatalities in New York City, 1990-2003. J Safety Res. 2008;39(6):583–8.
- Lin PT, Gill JR. Subway Train-Related Fatalities in New York City: Accident versus Suicide*. J Forensic Sci. 2009 Nov 23;54(6):1414–8.
- Zhang L, Pawlowski E, Hines LM, Bauer MJ, Pressley JC. Risk and Protective Factors for Injury in Adult Front- and Rear-Seated Motor Vehicle Occupants in New York State. Int J Environ Res Public Health. 2024 May 22;21(6):663.
- Karaye IM, Olokunlade T, Cevetello A, Farhadi K, Kyriacou CM. Examining the Trends in Motor Vehicle Traffic Deaths in New York City, 1999–2020. J Community Health. 2023 Aug 7;48(4):634–9.
- Hung KKC, Kifley A, Brown K, Jagnoor J, Craig A, Gabbe B, et al. Impacts of injury severity on long-term outcomes following motor vehicle crashes. BMC Public Health. 2021 Dec 27;21(1):602.
- Hanna K, Okumura K, Shnaydman I. Improving blunt cerebrovascular injury screening in motor vehicle collision patients: Does airbag deployment matter? The American Journal of Surgery [Internet]. 2022;224(6):1393–7. Available from: https://www.sciencedirect.com/science/article/pii/S000296102200664X.
- Sethuraman KN, Marcolini EG, McCunn M, Hansoti B, Vaca FE, Napolitano LM. Gender-specific Issues in Traumatic Injury and Resuscitation: Consensus-based Recommendations for Future Research. Academic Emergency Medicine. 2014 Dec;21(12):1386–94.
- Ho J, Mansour M, Gomez D. Subway-related trauma at a level 1 trauma centre in Toronto, Ontario. Can J Surg. 2021;64(6):E588–93.
- Buchanan M, Richardson H, Van Eyken C, Singla K, Lundy E. Transit Access Stories: The State of Transportation Equity in Seven Cities. New York; 2024 Jun.
- Norton J, Fung L, Caffarelli A. Driving and Self-reported Dangerous Driving Behaviors in New York City. New York; 2017 Mar.
- Kilgo PD, Weaver AA, Barnard RT, Love TP, Stitzel JD. Comparison of injury mortality risk in motor vehicle crashes versus other etiologies. Accid Anal Prev [Internet]. 2014;67:137–47. Available from: https://www.sciencedirect.com/science/article/pii/S0001457514000669.
- Lackner C, Heinzl P, Rizzi MC, Leo C, Schachner M, Pokorny P, et al. Tram to Pedestrian Collisions—Priorities and Potentials. Frontiers in Future Transportation [Internet]. 2022; Volume 3-2022. Available from: https://www.frontiersin.org/journals/future-transportation/articles/10.3389/ffutr.2022.913887.
- National Highway Traffic Safety Administration. Traffic Safety Facts & Data Publications. [cited 2025 Sep 27]. Drunk Driving. Available from: https://www.nhtsa.gov/risky-driving/drunk-driving#:~:text=Overview,Campaign ((accessed on September 15, 2025).
- Sedney CL, Khan U, Dekeseredy P. Traumatic spinal cord injury in West Virginia: Disparities by insurance and discharge disposition from an acute care hospital. J Spinal Cord Med. 2020 Jan 2;43(1):106–10.
- Dabestani PJ, Massenburg BB, Aurit S, Dawson AJ, Susarla SM. Risk factors for inpatient hospital admission following isolated orbital floor fractures. Int J Oral Maxillofac Surg. 2023 Oct;52(10):1039–48.
|
Disclaimer/Publisher’s Note: The statements, opinions and data contained in all publications are solely those of the individual author(s) and contributor(s) and not of MDPI and/or the editor(s). MDPI and/or the editor(s) disclaim responsibility for any injury to people or property resulting from any ideas, methods, instructions or products referred to in the content. |
© 2025 by the authors. Licensee MDPI, Basel, Switzerland. This article is an open access article distributed under the terms and conditions of the Creative Commons Attribution (CC BY) license (http://creativecommons.org/licenses/by/4.0/).