
Submitted:
05 October 2025
Posted:
06 October 2025
You are already at the latest version
Abstract
Cognition measures traditionally employ static testing methods not involving functional movements. In contrast, a recently validated executive function (EF) test, the Walking Response and Inhibition Test (WRIT), involves generating postural responses to displayed visual commands while walking (as measures of functional mobility and intact executive functions). Two observational studies were conducted in healthy older and younger adult cohorts utilizing a portable version of the WRIT test (HMD-WRIT) with a head-mounted device and body position sensors. Two 3D motion analysis systems, three standardized cognition tests, and a mobility test were used to validate the portable device. Both studies supported use of the HMD-WRIT as a viable option for measuring EF during functional movements. Three Questions and Answers-What do we already know about this topic? Previous research has shown efficacy with a Lab-based version of this test of Executive Function during dynamic activity (WRIT).-How does your research contribute to the field? Use of this portable device will allow anywhere administration of an Executive Function test during functional activity, rather than a static, computerized/paper-pencil type test.-What are your research’s implications towards theory, practice, or policy? Executive Function testing during functional activity allows for implications for dynamic, functional movements measurement and rehabilitative strategies pertinent to Activities of Daily Living (ADL) functions.
Keywords:
WRIT
; executive function
; cognition
; functional mobility
1. Introduction
Persons with neurologic pathologies (e.g. Alzheimer’s, Parkinson’s, stroke), traumatic brain injuries (TBI) (e.g., sports injuries, falls, and auto accidents), and normal aging often present clinically with concomitant physical and cognitive impairments.[1,2] In older adults, falls are commonly attributed to physical limitations, but also may be due to disfunctions of executive functions (EF) (inability to plan, focus, recall from memory, and multitask).[3] Recent findings suggest that EF plays a critical role in the regulation of gait in older adults, especially under complex and challenging conditions, and that EF deficits may, therefore, contribute to fall risk.[4] Cognitive deficit measures for these groups traditionally are seated computerized tests, administered by licensed practitioners, and do not incorporate functional (e.g., walking) or dual tasking activities, commonly encountered during daily activities (e.g. cooking, house cleaning, etc.). When symptoms manifest from central and/or peripheral vestibular dysfunctions along with cognitive and behavioral changes, objective measurement and intervention design challenges arise. These are relevant for determining falls prevention strategies, interventions efficacy, safe return to sports participation, and safe basic activities of daily living (B-ADLs) participation guidelines. While vestibular systems testing and interventions are effective in reducing symptoms and improving functionality in these populations, little research supported evidence exists of how EF during dynamic activities impacts functionality during recovery.[5]
Components of EF are the mental processes that enable planning, focusing attention, remembering instructions, and handling multiple tasks. ADLs require filtering of distractions, task prioritization, setting and achieving goals, and impulse control. Studies have shown interventions that concurrently address both physical limitations and EF functions improve cognition, regardless if complementary cognitive rehabilitation methods are employed.[6,7] Measures of EF are commonly the only diagnostics used to monitor these multidimensional approaches and are administered in controlled, static clinical or laboratory settings, often with the client seated. Therefore, novel testing methods involving recognition of visual cues and resultant decision making, demonstrated by reactive functional movements, are needed to better assess the use of cognitive processes during B-ADLs.
The Walking Response Inhibition Test (WRIT) and the Stroop Walking Task (due to their dual tasking and possible cognitive overload) assess cognitive influences on physical tasking.[8,9] Both tests employ walking and reacting to visual stimuli that incorporate basic EF components. They require a controlled, laboratory-based large space setting, large, cumbersome equipment, and specialized measurement devices, making them impractical for common clinical use. The original WRIT test was validated as an EF measure during dynamic activity [8]; therefore, a portable version usable in any environment is merited. Head mounted display-based virtual augmented reality (AR) devices, such as the Microsoft HoloLens® (Redmond, WA, USA), along with wearable technology inertial measurement unit (IMU) devices for tracking spatial movements may allow these tests to be administered in any clinical setting, needing only a hallway or walking space for the test. The use of AR or mixed reality (MR) devices is advantageous because they merge the real and virtual worlds to produce new environments, allowing physical and digital objects to co-exist and interact in real time. The use of VR simulators for rehabilitation has gained favor and shown efficacy in enhancing vestibular and balance functions.[10,11] However, immersion into a virtual environment is not completely innocuous and may provoke motion intolerance symptoms, known as “simulator sickness”.[12,13] The subject’s adaptation to a simulator-generated environment may create a sensory conflict between visual stimuli and movement detected by the vestibular organs, eliciting nausea and motion intolerance.[14] Maladaptation to these immersive stimuli can also result in Mal de Debarquement syndrome, a vestibular system disorder resulting in phantom perception of self-motion, having prolonged debilitating effects.[15] Additionally, immersion in the VR environment prevents the performance of dynamic functional activities, as the surrounding environment is blocked. Unlike VR, AR devices allow simultaneous environment viewing and HMD displayed visual cues, avoiding simulator sickness and motion intolerance, while allowing safe dynamic activities performance.[16] Use of wearable sensor technologies, such as IMUs with accelerometers, is useful during rehabilitative and sports-related applications, and can be interfaced with AR visual simulators.
Leyva et al. (2017) demonstrated the WRIT test was better reflective of EF in the everyday environment than traditional computerized analyses.[8] Adaptation to a portable AR environment using HMD and IMU (HMD-WRIT) made it more viable in common clinical settings with limited resources.[17] Two studies in different locations were conducted, first on healthy older adults, and subsequently on a younger adult cohort, aiming to validate the portable (HMD-WRIT) device as a functional EF measure against two different 3D motion analysis systems (BTS initially, then QTM) at the two locations, and to compare results against three computerized cognitive tests and the Timed Up and Go functional mobility test (TUG).
The HMD-WRIT device responses were hypothesized to positively correlate to both the BTS and QTM results, the MoCA, and TUG, and young adults’ results would differ from the older with shorter latencies of responses (LAT), higher accuracy of correct responses (ACC), and lower scores variability.
2. Methods
2.1. Recruitment
Recruitment for the initial older adult project occurred at the
University of Miami from August through December, 2019, and from March through
June, 2022 at Rosalind Franklin University for the younger adult project. Both
studies were approved by the respective Universities’ Institutional Review
Boards (IRB) for the Use and Protection of Human Subjects (Approval numbers
20200818 and CHP22-325) and conducted according to the World Medical
Association Declaration of Helsinki. Approved recruitment flyers were posted
throughout the campuses and communities. The majority of the older adult study
subjects were recruited via phone and email lists (maintained by the Lab) who
had participated in prior studies. Younger adults were also recruited utilizing
email notifications. Sample sizes were determined via Power Analyses for both
studies.
2.2. Inclusion
Forty-five
healthy adult male (n=22) and female (n=23) subjects, communicative in English,
aged 50-86 (mean = 69.51, SD ± 9.98 years), able to walk 300 feet unaided, with
normal color vision, and living independently in the community participated in
the older adult study. For the subsequent younger adult study, forty-four adult
male (n=21) and female (n=23) subjects aged 18-49 (mean = 26.25, SD ± 6.47
years) meeting the same inclusion criteria participated.
2.3. Exclusion Criteria
Individuals
were excluded with a history of joint replacement, any psychiatric disorder,
history of diagnosed balance or neurologic problems, history of traumatic brain
injury (TBI) within the last 6 months, color blindness, or non-correctable
vision limitations. Adults unable to consent, aged outside 50 to 86 years,
pregnant women, and prisoners were also excluded.
2.4. Procedures
A portable
version of the original WRIT technology was created (HMD-WRIT) using a
head-mounted augmented reality (AR) device (HMD) with heads-up display (HUD)
and integrated inertial measurement unit (IMU) and was compared to a gold
standard 3-D motion analysis system (BTS) (Buskirk, 2021). The forty-five
healthy older adults performed nine randomized trials (three trials of
Congruent (indicating one direction-changing command) and six trials of
Incongruent (indicating combinations of two or three direction-changing
commands). Measurements from both devices, including Accuracy% (ACC)
(correctness of response) and Latency (LAT) (time from displayed command
symbols in the HMD to postural responses), were recorded. An EF score was
tabulated by (ACC * LAT). Subjects completed two NIH Toolbox computerized
cognition tests (the Eriksen Flanker Test, a response inhibition measure, and
the List Sorting Memory Test, a working memory test) and a Stroop Color Word
Test, an ability to inhibit cognitive interference measure, well-known as the
‘Stroop Effect’. Finally, subjects performed the TUG test to assess functional
mobility.
The subsequent healthy young adults study utilized the same portable HMD-WRIT device and protocol. Comparison of Accuracy% (ACC), Latency (LAT), and EF was made to a Qualisys 3-D motion analysis system (QTM). Subjects performed the Montreal Cognitive Assessment (MoCA), validated as a highly sensitive tool for early detection of mild cognitive impairment (MCI). It was used also in the older adult study with score ≥23 for inclusion criteria) and TUG.
Upon arrival, a screening protocol (temperature and Covid-19 questionnaire) was administered, and masks and gloves provided. Maximum of three researchers wearing surgical gowns or laboratory coats, masks, plastic face shield, and disposable gloves performed all tests. University approved COVID-19 precautions were utilized and all equipment properly sanitized. Subjects completed: a written Informed Consent form, a CDC approved COVID-19 screening questionnaire, a Physical Activity Readiness Questionnaire (PAR-Q) form, a health questionnaire, and a photography release form. The use of photographs and videotaping were limited to subjects performing the HMD-WRIT wearing the AR HMD, therefore their faces were obscured. Subjects wore comfortable clothing, allowing secure IMU placement onto a Velcro closure belt at the umbilicus level with four reflective markers (3D motion analysis required) at the anterior and posterior superior iliac spines (ASIS and PSIS). Subjects wore their own comfortable shoes during the HMD-WRIT and TUG tests.
Subjects’ heights and weights were recorded. Subjects completed the Ishihara Plate color blindness test (as the commands shown on the HMD were different colors) and the MoCA. They were instructed on the set-up and procedures for the HMD-WRIT with IMU and moved to the testing area, where they were shown the projected HMD command signals (Figure 1). The HMD displayed combinations of cues: two round circles at the top (one red and/or one blue) and one of two green arrows at the bottom, pointing right or left. A green left pointing arrow indicated a left body turn and a green right pointing arrow indicated a right body turn. A blue circle above an arrow indicated to turn opposite to the pointing arrow. A red circle, whether presented alone or in combination, indicated to stop.
Prior to testing, subjects demonstrated a thorough understanding of the commands and correct postural responses. They were then fitted with the HMD and completed the nine test trials. For the older adults study only, after removal of the HMD and Velcro belt with IMU, subjects were seated and completed the three computerized cognition tests. Finally, subjects completed 3 TUG trials. Appendix, Figure 2 shows the flow of subjects through the study. Each subject was allotted sixty minutes for testing completion.
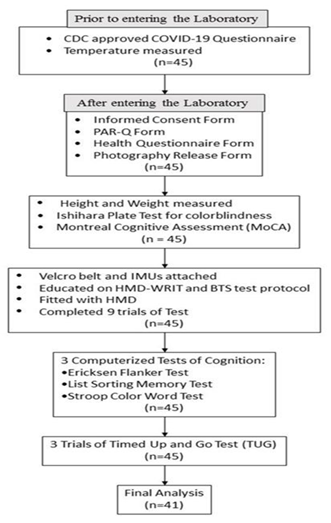
*41 of 45 underwent Final Analysis, as 4 subjects’ data were incomplete and not included.
2.5. HMD-WRIT
The HMD-WRIT utilized a portable HoloLens® version 2 HMD device (Microsoft Corp., Irving, TX) with a custom heads-up display (Charles River Analytics, Baltimore, MD) allowing subjects to view and identify displayed cues’ shapes and colors, eliminating the need for a cumbersome screen for commands display. An IMU (Life Performance Research, Tokyo, Japan) interfaced through telemetry to the HMD determined the subjects’ postural responses to displayed cues. This allowed evaluation of the subjects’ abilities to stop or change directions by providing data for Z (direction of walking), X (lateral left/right), and Y (vertical) planes. Data were stored on an Android phone application (Google, LLC, Mountain View, CA), then uploaded to an Excel spreadsheet (Microsoft Office, Microsoft Corporation, Redmond, WA) and compared to the 3D systems timeline data for each trial. Subjects initially rose onto their toes and returned to feet-flat position prior to immediately initiating the gait cycle, allowing timelines synchronization for the two devices.
Recorded time stamp measurements quantified the displayed randomized commands times and the subjects’ earliest postural responses (change in movement direction or stop), and were recorded as Latency (reaction time) (LAT). The Accuracy % score (ACC) was determined as a percent of correct reactions to total commands. The minimum threshold for gait speed was 1m·s-[1].
Figure 3 is an illustration of the HMD-WRIT testing environment. Course floor space was 9.4m long by 5m wide. A center yellow line provided a visual reference for assessing subjects’ direction change.
Sobolewski et al. (2017) reported longer mean reaction times for an older adult group (1.40 ± 0.126 s) compared younger groups during the Functional Reactive Agility Test (FRAT), a task similar to the HMD-WRIT.[18] In absence of other published works of similar test procedures, this test data (1.53s, mean + 1SD) was used as the threshold value to determine the “purposeful” postural response from a “drop” step or “plant” step, (where the subject “plants” a foot firmly on the ground (either behind or to one side) prior to making the “purposeful” whole-body response) or a corrective (“double”) whole-body response for the older adult study, and was applied to the sixty-eight identified trials. When subjects stopped or paused for >1.53s prior to making a body response, the ACC was deemed incorrect, and the LAT value marked at the response initiation. When the stop or pause lasted <1.53s the response made immediately after was considered the “purposeful” movement. The LAT was marked at the second response initiation and responses determined ACC scores. Calculated EF scores were utilized for analyses.
The younger adult study utilized the same processes for determining response LAT and ACC. There is an absence of published works with similar tests procedures to determine a LAT threshold value for healthy, young adults. Therefore, a mean + 1 SD of the sixty-one obtained responses was calculated (0.72s) and used to determine LAT and ACC of “purposeful” responses.
Computerized Cognitive Tests (Flanker, List Sorting Memory, and Stroop Color Word)
Older adult subjects completed three computerized tests of cognition: two (Eriksen Flanker and List Sorting Memory) from the NIH Toolbox Cognitive battery, and the Stroop Color Word Test. All subjects utilized the same tests order. A five-minute rest period between tests minimized physical or cognitive fatigue. The NIH tests utilized an iPad, while the Stroop used an adapted gaming computer. Subjects received test protocol performance instructions and demonstrated successful understanding of all test battery components using the iPad, keyboard, and mouse responses.
The Eriksen Flanker incorporates “flanker” stimuli surrounding a central target and assesses the ability to suppress inappropriate responses in a particular context.[19] A directional response (left or right) was assigned to a central target stimulus. Three test components were utilized, where “flanker” images were presented to the left and right of a central target as either congruent (same direction as the central target), incongruent (opposite direction from the central target), or neutral (different symbols than the central target). These responses are believed to be controlled at the anterior cingulate cortex, a frontal brain structure responsible for a wide variety of autonomic and EF functions, particularly when processing incongruent stimuli.[20]
Subjects responded by pressing a specific keyboard key or if using a mouse, by selecting a “left” or “right” box indicating the central image directionality. Correct scores in percentage and response times were recorded. The classic Flanker effect shows faster reaction times and higher accuracy percentage for congruent vs incongruent or neutral “flanker” symbols.
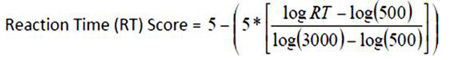
Scoring for the Flanker test typically uses the sum of Accuracy and Reaction times for a Composite score (CS).
Accuracy scores were computed as: 0.125 * Number of Correct Responses (there are 40 possible Accuracy points).
Reaction Time scores were computed as:
The List Sorting Working Memory test assessed working memory.[21] A computerized version presented two image groups (food and animals) that subjects ranked from smallest to largest size order. The image sequence was initially presented as a single category, followed by a more difficult second task, containing both. The number of images increased with each test trial and ended when the subject incorrectly identified the size order of two successive sequences. Scores calculations used the same formulae as the Flanker test.
Not included in the NIH Toolbox, the Stroop Test was used to measure selective attention capacity, cognitive flexibility, response inhibition, working memory, and processing speed.[23] The test (Milisecond Software, Seattle WA), involved processing of a displayed stimulus (word) where one feature (identification of a word vs the print color) may affect the simultaneous processing of a new stimulus.[23,24] There were two subtasks: 1) an incongruent trial, where the color name differed from the word print color, and the subject chose the print color rather than the color the word indicated, and 2) a congruent trial, where the print color matched the meaning of the word.[25,26] These demonstrated the subjects’ abilities to inhibit cognitive interference, a domain of EF.
The subjects were presented with four color options and responded by pressing the F, G, J and K keyboard keys for red, blue, green or black colors. Response LAT and ACC results were determined. One short duration practice trial (20 symbols) was allowed.
Physical Performance Testing - Timed Up-and-Go Test (TUG)
An accepted test of functional mobility and balance (TUG) was used to measure subjects’ abilities to change position, balance, and walk.[27] Subjects sat in a standard armless chair (seat height 43cm), feet flat on the floor. When instructed, in the shortest time possible, they stood and walked to a taped line three meters (9.8ft) away, then returned and sat. Time was recorded from the starting vocal cue until the subject returned to the chair. Each subject performed three trials and a mean time calculated.
3. Statistical Analyses
- 1)
- After applying the newly formed criteria for “purposeful” HMD-WRIT postural responses, data were analyzed by Pearson correlation analyses, comparing the HMD-WRIT to the two 3D motion analysis systems (BTS and QTM) outputs for LAT, ACC, and calculated EF scores. Bland-Altman plots provided further relationships analyses. The standard error of measurement (SEm) was computed (as a measure of the error in the scores not due to true changes) using the formula:
SEm = σM / √N
Where: σM = the standard deviation of the HMD-WRIT scores; and, √N = the square root of the population mean.
- 2)
- Pearson correlation analyses compared the three computer-based cognition tests ACC and LAT data to the HMD-WRIT.
- 3)
- Finally, Pearson correlation analyses tested the HMD-WRIT LAT scores to the mean of the three timed TUG scores.
All analyses utilized SPSS version 26 software (SPSS, Inc., IBM, Chicago, IL). Significance was set a priori at alpha < 0.05.
4. Results
Appendix Table 1 shows subjects’ demographics data. Ethnicity and racial composition were not acquired. All produced MoCA scores above the recommended normal cut-off value (23/30).[27] Both cohorts showed a significant statistical difference between genders for height and weight. Data were analyzed by gender for the younger adult cohort and in aggregate for the older adults.
Older adults:
1. A significant, Strong correlation (r=.94, p<.0001) existed between the HMD-WRIT EF and BTS 3D Motion Analysis system, confirmed by Bland-Altman analyses (Figure 4,Figure 5 and Appendix Table 2Appendix Table 3).
2. A Small, not significant positive correlation (r=.146, p=.368, r=.076, p=.64, and r=.236, p=.142 respectively) existed between the HMD-WRIT EF and three computerized cognition tests.
Appendix Table 4 displays the Pearson correlation analyses of the HMD-WRIT ACC, LAT and EF to these variables for the Flanker, Stroop Color Word, and List Sorting Memory tests.
Correlation of the Flanker ACC with the HMD-WRIT approached significance r(40)=.310, p=.052. No significant correlations were found between HMD-WRIT and the Flanker for LAT or EF. There were no significant correlations between the List Sort Memory and HMD-WRIT for ACC, nor between the Stroop and HMD-WRIT for ACC, LAT and EF scores.
3. A Pearson Correlation analysis examined the HMD- WRIT EF and mean TUG scores. The mean HMD-WRIT EF was 103.66 and the forty-five TUG times (averaged) was 6.23s, showing a significant, moderate correlation (r=.32, p=.04).
Clinical Significance
Effect Size
A Cohen’s d (d=.024) for the difference between WRIT-HMD and BTS EF scores revealed no effect.
Standard Error of the Measurement
To further determine the clinical significance of the differences between the HMD-WRIT EF scores and BTS EF scores the SEm was determined using the formula:
SEm = SD * √ (1-r) Where:
SD = the average standard deviation between BTS and HMD-WRIT r = the interclass correlation (r).
Therefore:
SEm = ((24.80 + 26.52)/2) * √ (1-.936) = 6.5, indicative of a small SEm.
Younger adults:
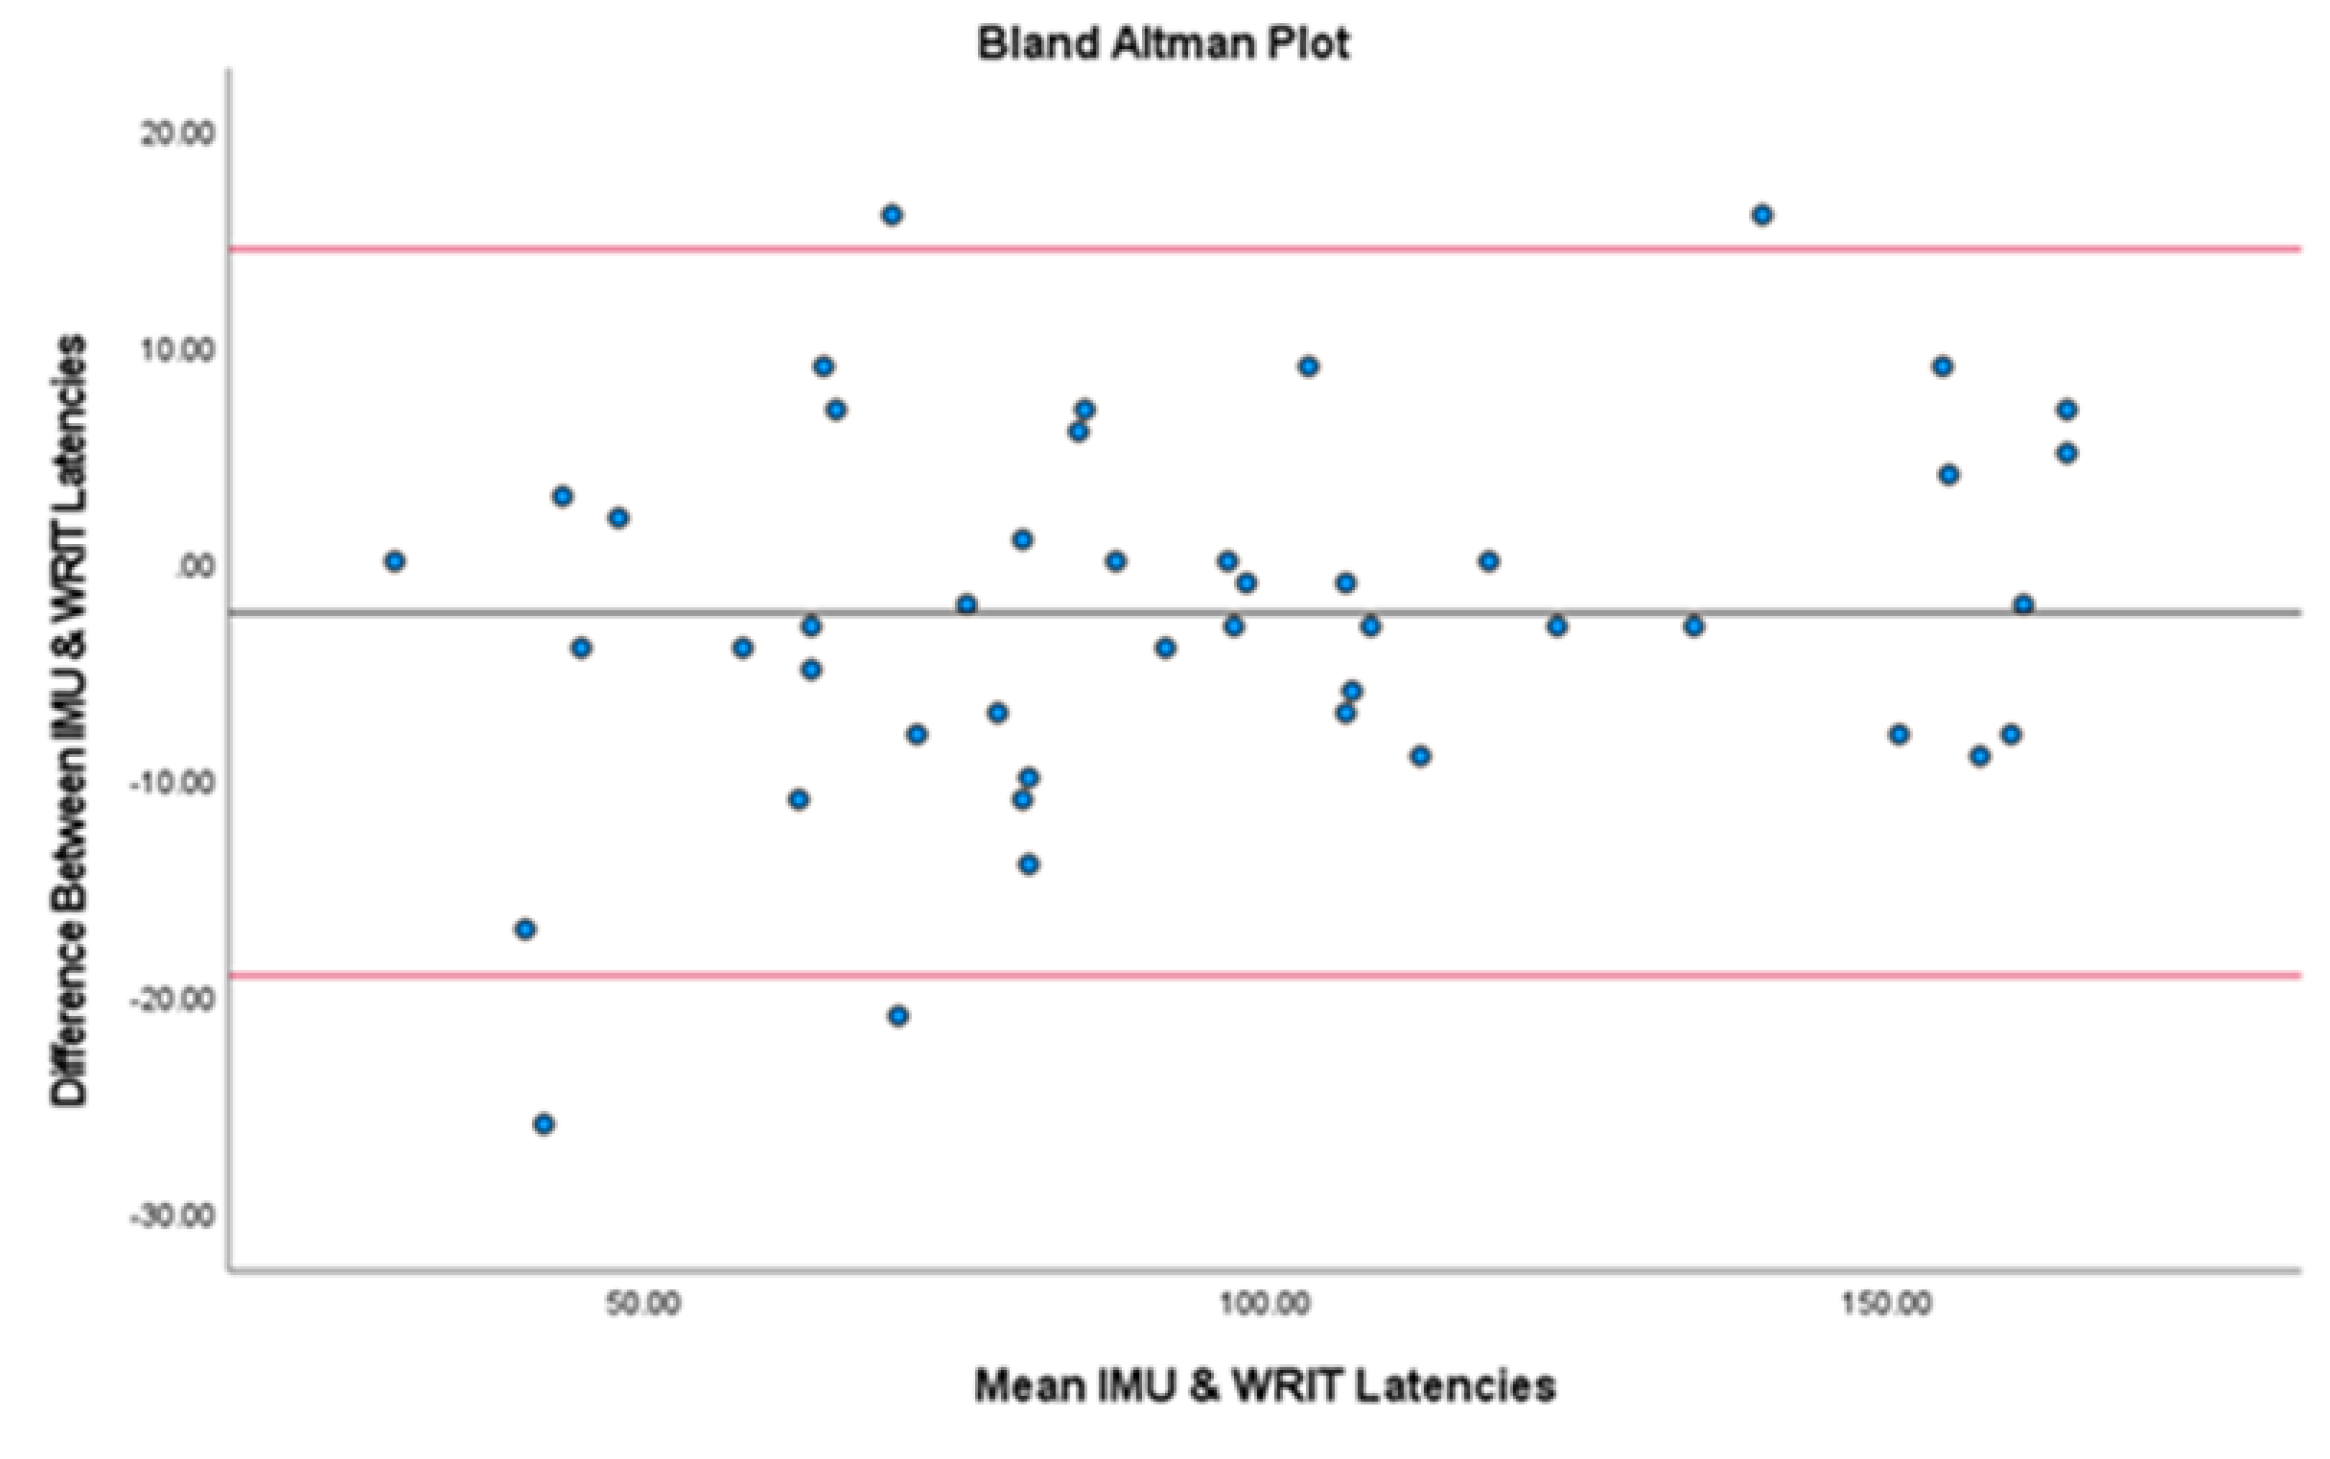
- A significant, Strong correlation existed between the HMD-WRIT and the QTM 3D Motion Analysis system (r=0.98, p<.001), confirmed by Bland-Altman analyses, showing no significant statistical difference between the two devices (t(43)=1.66, p=.104) (Figure 6 and Appendix Table 5).
- 2.
- Statistically significant height and weight differences existed in the younger adults, therefore results were interpreted by gender, rather than in aggregate (Appendix Table 6). Males had a significantly shorter mean LAT (0.76s) compared to females (0.92s, p=0.003), and males had significantly higher ACC (85.89%) to females (71.00%, p=0.008).
- 3.
- A significant, Moderate positive correlation existed for MoCA to group ACC (r=.398, p=.007) and no correlation existed between TUG to group LAT (r=.071, p=.647). A significant positive correlation of MoCA to group EF (r=.331, p=.028) existed, and a negative correlation of TUG to group EF (r= -.202, p=.189) was shown (Appendix Table 7).
Lastly, (Appendix, Table 8) shows a comparison between the two age groups:
- Healthy young adults had shorter LAT values than the older group (0.84s ± .18s compared to 1.29s ± .21s),
- Young males had higher mean ACC, (85.89% ± SD12.57% to 81.5% ± SD19.1%), but young females did not (71% ± SD21.28%),
- Due to shorter LAT values, the young adults’ calculated mean EF scores were lower (63.15 ± SD11.09 to 103.66 ± SD24.8), where EF = LAT (sec) * ACC (%)
- The young adults had less variable EF scores (122.87 ± 11.08 to 615.04 ± 24.8), where EF = LAT (sec) * ACC (%).
5. Discussion
Many medical maladies present clinically with concomitant physical and cognitive decline (especially in advanced age groups) and are increasing worldwide.[29] Previous studies have shown age-related differences in functional brain activity during cognitive tasking.[30]
The primary aims of these two projects were: to examine the validity of the portable HMD- WRIT device compared to two previously validated “gold standard” 3D motion analysis tools, to compare the HMD-WRIT to currently utilized computerized EF assessment tests (in the older adult cohort), to confirm that measured EF results are closely related to daily function when compared to a previously validated functional movement test (TUG), and finally to compare the two age groups.
Findings showed significant, strong correlations between the HMD-WRIT and the two 3D motion Analysis systems, confirmed by Bland-Altman analyses, validating the portable device for anywhere measure of EF. The SEm was 6.5, only 4% of the range of mean scores between HMD-WRIT and BTS.
No correlation was found between the HMD-WRIT and three computerized cognition tests in the older adult cohort and to the MoCA in the younger adults, similarly to the results from the original Leyva project.[8] This lack of significant correlations was not unexpected due to their procedural and test environment differences. The HMD-WRIT incorporated functional movements as the subjects made whole-body postural responses to visual cues by either changing directions or stopping while walking. In contrast, the computerized tests were administered with the subjects seated and responding to stimuli on a computer and iPad. The computerized tests employed only small muscle groups and utilized fine motor movements of the wrist and hand, whereas the HMD-WRIT engaged large muscle groups and required whole body postural responses. Further, the HMD-WRIT utilized a full field visual environment (subjects could view their normal surroundings as the test cues were displayed onto the HMD). While this study is the first to compare an AR environment to traditional computerized EF test measures, Leyva et al.,[8] also demonstrated lack of correlation between the tests utilizing a monitor rather than an HMD for displaying commands. Juan et al.,[35] demonstrated that an AR environment utilizing the Augmented Reality Spatial Memory (ARSM) task was superior to the Dot Matrix subtest of the traditional computerized AWMA-2 test battery, commonly used for visuospatial short-term memory assessment in healthy children. The AR environment was found to be more acceptable to the subjects and better demonstrated an association with memory skills in real life situations. Perrochon et al.,[9], using the “Stroop Walking Task” (which is similar to deciding whether to cross a street based on a pedestrian traffic light), demonstrated the use of dual tasking inspired by an everyday event, seemed to better detect aging subjects’ cognitive impairments than did traditional psychometric tests. Therefore, it may be that the use of the HMD-WRIT differs from traditional computerized tests since it measures EF during functional situations rather than using the small muscles and limited visual field associated with computerized testing. When examining the relationship between the HMD-WRIT and TUG, a functional mobility assessment highly associated with EF, there was a statistically significant positive relationship.[36,37,38] This is not surprising as a significant relationship between the WRIT and TUG was previously reported by Leyva et al.[8] This relationship has considerable functional implications. Improvements in functional capacity and movement effectiveness are specific to practiced movements and limbs utilized.[39] Walking control systems, located within the brainstem, facilitate both visual-motor coordination and accurate foot placement [40] and are important during TUG performance, and both are measured by the HMD-WRIT. Since there was a significant statistical relationship between the HMD-WRIT and TUG, the two tests may be utilized in combination, or the HMD-WRIT may replace TUG as a functional EF assessment.
It was somewhat surprising that performance differences between genders were shown in the younger cohort but not the older (so the older cohort data were analyzed in aggregate). Young males had higher ACC than the older group, but young females did not. The EF scores of the young group were lower due to their shorter LAT values. The young group had less variable EF scores in contrast to healthy older adults. This was consistent with data from Sobolewski et al.,[18] where longer mean reaction times were reported for an older adult group (1.40 ± 0.126 s) compared with younger groups during the Functional Reactive Agility Test (FRAT), a task similar to the HMD-WRIT (but did not employ an HMD device). This result confirmed prior study results showing older adults demonstrate wider variability in responses than younger adults, and may impact their accuracy and function.[41]
Limitations
There were several limitations to the two studies. First, they were conducted during the COVID-19 pandemic, which limited the number of participants despite enforced strict safety guidelines (as mandated by both Universities). This may have influenced the subject recruitment processes, especially since the initial study involved an older population (over age 50). The majority of participants in the older adults study were recruited from a phone and email subjects list maintained by the Max Orovitz Laboratory, where the study was conducted. These subjects had participated in prior studies, therefore, their familiarity with the laboratory and its personnel may have motivated their participation and to provide greater efforts than the general population. Also, although not required for either study, all subjects had been vaccinated and boosted with the FDA and CDC approved vaccines prior to study participation. Since only those subjects who had received the vaccine opted to participate, this may have also biased the sampling processes, since those who had received the vaccine may have returned to a more active lifestyle and more normal functional activities, whereas the unvaccinated population may have continued to remain more homebound and sedentary. All participants were required to wear personal protective equipment (PPE), including masks and face coverings, which may have negatively influenced their physical performance during the functional tests.
For both studies, there was a paucity of published literature on normative postural reaction times related to the studies designs. For the older adults, only one prior study references full body or postural response times to visual and auditory cues, relevant to this study.[18]
Other studies have shown large response times variability in the elderly population as compared to younger subjects utilizing various stimuli and responses.[41,42,43,44,45] Engel, et al.,[46] demonstrated that auditory stimuli elicit faster responses than visual stimuli and adding simultaneous auditory stimuli to a visual stimulus reduces response times. Both stimuli were given simultaneously in both these studies so as to optimally minimize response latencies. No prior studies were found that reference a second or corrective reaction after an initial response, and no studies referenced “plant” or “drop” steps for response latencies. Therefore, for the older adult study, the mean and SD values from the Sobolewski study [18] were utilized, and applying those accepted values to this study’s small sample was a limitation. For the young adult study, the mean and SD values were calculated from the cohort that made double or corrective postural responses. The mean + 1SD was used as the cut-off threshold for determining the LAT and ACC of the trial. Application of this small cohort data as the threshold was a limitation.
For the HMD-WRIT data interpretation methodology, the raw data were converted into graphical representations for analyses via Excel software. Manual response interpretations were determined utilizing all three planes (X, Y, & Z planes) of motions. Choosing the exact timeline points selected manually for HMD-WRIT and 3D systems responses were not exacting and may have led to exaggerated data points differences or similarities. The 3D systems data, however, were considered more precise, since visual evaluation of the actual responses were measured by watching the movement in 3D graphic representation, whereas the HMD-WRIT data were acceleration data only from the IMU, making interpretation precision of the exact responses more difficult.
6. Conclusions
These studies, extensions of previous work by Leyva et al.,[8] demonstrated validity of the portable HMD-WRIT with IMU device using two previously validated 3D Motion Analysis systems. This supports use of the HMD-WRIT as a viable option for measuring EF in healthy, younger and older adults during functional movement, either in conjunction with or in place of traditional static computerized or paper-pencil type testing and the TUG functional movement test.
These results were expected, as Leyva et al.,[8] demonstrated the validity of the original WRIT test as a measure of EF and its stronger relationship than computerized tests to functional performance (assessed by the TUG). Other systems have measured EF during functional activity [9] but to our knowledge, this study was the first to utilize an HMD AR device and IMU to provide a novel portable system that measured EF during functional movements. Additionally, once combined with a dedicated analysis program, the device may allow immediate measurement and display of ACC, LAT and EF in any clinical setting.
Further research utilizing this method is merited for investigating findings related to other age groups and specific pathologies. However, the absence of adverse effects with this testing method also makes it a safe option.
This research received no specific grant from any funding agency in the public, commercial, or not-for-profit sectors.
The Author declares that there is no conflict of interest.
Portions of this manuscript were derived from a Dissertation project submitted to the Faculty of the University of Miami in partial fulfillment of the requirements for the degree of Doctor of Philosophy.
Appendix

Table 1.
Subjects Demographics.
| Older adult cohort | |||
| Variable | Men | Women | Sample |
| N | 22 | 23 | 45 |
| Age | 69.5 ± 10.4 | 69.6 ± 9.8 | 69.5 ± 10.0 |
| Height (in) | 70.47 ± 3.15* | 64.17 ± 3.54 | 67.32 ± 4.72 |
| Weight (lb) | 198.2 ± 29.98* | 143.52 ± 29.1 | 170.42 ± 40.12 |
| Younger adult cohort | |||
- Variable Men Women Sample
- N 21 23 44
- Age 26 ± 6.74 26.47 ± 6.36 26.25 ± 6.47
- Height (in) 70.76 ± 2.3* 64 ± 3.11 67.23 ± 4.37
- Weight (lb) 182.95 ± 30.32* 145.87 ± 28.79 163.57 ± 34.68
- All values are Mean ± SD *Significantly greater than women, p<.001.
Table 2.
Correlation analyses between HMD-WRIT to BTS.
| Variable | N | HMD-WRIT | BTS | r | p |
| ACC (%) | 41 | 81.5 ± 19.1 | 81.5 ± 20.20 | .994* | <.0001 |
| LAT (s) | 41 | 1.29 ± 0.24 | 1.29 ± 0.20 | .916* | <.0001 |
| EF | 41 | 103.66 ± 24.80 | 103.05 ± 26.52 | .936* | <.0001 |
Values are Mean ± SD. Results presented represent 343 trials. * Significant at p< .01 (2- tailed). HMID-WRIT = Walking Response Inhibition Test on Head-Mounted Augmented Reality Display, BTS = SMART-DX 7000, BTS Bioengineering, EF = Executive Function, LAT = Latency; ACC = Accuracy, r = Coefficient of correlation.
Table 3.
Results for bias and LOA for Accuracy, Latency and Executive Function between BTS and HMD-WRIT trials (n=41).
Table 3.
Results for bias and LOA for Accuracy, Latency and Executive Function between BTS and HMD-WRIT trials (n=41).
| Variable | Bias ± SD | Bias 95% CI |
LOA | Lower LOA 95% CI |
Upper LOA 95% CI |
| Accuracy (%) | 0.00 ± 2.48 |
-0.78 to 0.78 | -4.87 to 4.87 | -6.23 to -3.51 | 3.51 to 6.23 |
| Latency (s) | 0.00 ± 0.96 |
-0.03 to 0.03 | -0.03 to 0.03 | -0.24 to -0.13 | 0.14 to 0.24 |
| EF |
-0.51 ± 0.90 |
-0.98 to -0.05 | -2.27 to 1.25 |
-3.08 to -1.47 | 0.44 to 2.051 |
HMD-WRIT = Head mounted devise-based Walking Response Inhibition test; BTS = BTS 3D Movement Analysis System; LOA= limits of agreement; SD= standard deviation; CI= confidence interval.
Table 4.
Correlation analyses of HMD-WRIT and 3 Computerized Cognition Tests.
| Variable | N | HMD-WRIT | Flanker | r | p |
| ACC (%) | 41 | 81.5± 19.1 | 99.98 ± 0.16 | .310† | .052 |
| LAT (s) | 41 | 1.29 ± 0.21 | 0.90 ± 0.18 | .166 | .306 |
| EF | 41 | 103.37 ± 25.05 | 89.78 ± 17.48 | .146 | .368 |
| Variable | N | HMD-WRIT | List Sort | r | p |
| ACC (%) | 41 | 81.5 ± 19.1 | 63.40 ± 10.65 | .076 | .640 |
| Variable | N | HMD-WRIT | Stroop | r | p |
| ACC (%) | 41 | 81.5 ± 19.1 | 94.90 ± 9.39 | .053 | .748 |
| LAT (s) | 41 | 1.29 ± 0.21 | 1.49 ± 0.43 | .170 | .295 |
| EF | 41 | 103.37 ± 25.05 | 139.88 ± 34.82 | .236 | .142 |
Values are Mean ± SD. †Trend toward significant at p< .05 (2-tailed). HMD-WRIT = Walking Response Inhibition Test with Head-Mounted Augmented Reality Display, Flanker = Flanker test; List Sort = List Sort test; Stroop = Stroop test; EF = Executive Function, LAT = Latency; ACC = Accuracy, r = Coefficient of correlation.
Table 5.
Correlation analyses between HMD-WRIT to QTM for EF.
| Variable | N | HMD-WRIT | QTM | r | p |
EF 43 94.22 ± 39.37 96.59 ± 37.30 0.977* <.001
Values are Mean ± SD. Results presented represent 381 trials. * Significant at p< .01 (2- tailed). HMD-WRIT =
Walking Response Inhibition Test on Head-Mounted Augmented Reality Display, QTM = Qualsys 3D Motion
Analysis System, EF = Executive Function, r = Coefficient of correlation.
Table 6.
ANOVA of HMD-WRIT results by gender.
| Variable | N | Males (n=21) | Females (n=22) | F | p |
| ACC (%) | 43 | 85.89 ± 12.57 | 71 ± 21.28 | 7.799* | 0.008 |
| LAT (s) | 43 | 0.76 ± 0.11 | 0.92 ± 0.19 | 9.946* | 0.003 |
| EF | 43 | 64.67 ± 9.19 | 61.77 ± 12.62 |
Values are Mean ± SD. Results presented represent 381 trials. * Significant at p< .01 (2- tailed).
Table 7.
Corr elations of TUG to LAT, TUG to group EF, MoCA to ACC%, and MoCA to group EF.
| Variable | N | Mean | r (TUG) r (MoCA) | p | |
| ACC (%) | 43 | 78.27 ± 17.03 | .398* | .007 | |
| LAT (s) | 43 | 0.84 ± 0.15 | .071 | .647 | |
| EF TUG (s) MoCA |
43 43 43 |
63.19 ± 10.94 5.097 ± 1.01 28.47 ± 1.25 |
-.202 .331* | .189, .028 |
Values are Mean ± SD. Results presented represent 381 trials. r = Pearson correlation, * Significant at p< .05 (2- tailed).
Table 8.
Comparison of the two age groups.
| Variable | Younger Males | Younger Females | Older adults |
| Latency (LAT) sec | 0.76 ± 0.11 | 0.92 ± 0.19 | 1.29 ± 0.24 |
| Accuracy (ACC) % | 85.89 ± 12.57 | 71.00 ± 21.28 | 81.50 ± 19.10 |
| EF | 64.67 ± 9.19 | 61.77 ± 12.62 | 103.66 ± 26.52 |
| Younger Adults | Older Adults | ||
| EF Variance 122.99 | 703.31 | ||
| TUG 5.09 ± 1.00 | 6.23 ± 1.46 | ||
| MoCA 28.47 ± 1.25 | 28.07 ± 1.84 | ||
All values are mean ± SD.
References
- Huang SF, Liu CK, Chang CC, et al. Sensitivity and specificity of executive function tests for Alzheimer’s disease. Appl Neuropsychol Adult 2017; 24(6):493- 504. [CrossRef]
- Kudlicka A, Hindle JV, Spencer LE, and Clare L. Everyday functioning of people with Parkinson’s disease and impairments in executive function: a qualitative investigation. Disabil Rehabil 2018; 40(20):2351-2363. [CrossRef]
- Eman Abdulle A and VDNaalt J. The role of mood, post-traumatic stress, post-concussive symptoms and coping on outcome after MTBI in elderly patients. Int Rev Psychiatry 2020; 32(1):3-11.
- Mirelman A, Herman T, Brozgol M, et al. Executive function and falls in older adults: new findings from a five-year prospective study link fall risk to cognition. PLoS One. 2012;7(6):e40297. doi: 10.1371/journal.pone.0040297. Epub 2012 Jun 29. PMID: 22768271; PMCID: PMC3386974. [CrossRef]
- Hall CD, Herdman SJ, Whitney SL, et al. Treatment for vestibular disorders: How does your physical therapist treat dizziness related to vestibular problems? J Neurol Phys Ther 2016; 40(2):156.
- Alsalaheen BA, Whitney SL, Marchetti GF, et al. Relationship between cognitive assessment and balance measures in adolescents referred for vestibular physical therapy after concussion. Clin J Sport Med 2016; 26(1):46-52. [CrossRef]
- Gottshall KR and Hoffer ME. Tracking recovery of vestibular function in individuals with blast-induced head trauma using vestibular-visual-cognitive interaction tests. J Neurol Phys Ther 2010; 34(2):94-7. [CrossRef]
- Leyva A, Balachandran A, Britton JC, et al. The development and examination of a new walking executive function test for people over 50 years of age. Physiol Behav 2017; 171:100-109. [CrossRef]
- Perrochon A, Kemoun G, Watelain E, et al. The Stroop Walking Task: An innovative dual-task for the early detection of executive function impairment. Neurophysiol Clin 2015; 45(3):181-90. [CrossRef]
- Sulway S and Whitney SL. Advances in vestibular rehabilitation. Adv Otorhinolaryngol 2019; 82:164-169.
- Dunlap PM, Holmburg JM, and Whitney SL. Vestibular rehabilitation: advances in peripheral and central vestibular disorders. Curr Opin Neurol 2019; 32(1):137- 144. [CrossRef]
- Malinska M, Zuzewicz K, Bugajska J, et al. Subjective sensations indicating simulator sickness and fatigue after exposure to virtual reality. Med Pr 2014; 65(3):361-71. [CrossRef]
- Aldaba CN, White PJ, Byagowi A, et al. Virtual reality body motion induced navigational controllers and their effects on simulator sickness and pathfinding. Annu Int Conf IEEE Eng Med Biol Soc 2017; 4175-4178.
- Kiryu T and So RH. Sensation of presence and cybersickness in applications of virtual reality for advanced rehabilitation. J Neuroeng Rehabil 2007; 4:34.
- Tal D, Wiener G, and Shupak A. Mal de debarquement, motion sickness and the effect of an artificial horizon. J Vestib Res 2014; 24(1):17-23. [CrossRef]
- Baus O and Bouchard S. Moving from virtual reality exposure-based therapy to augmented reality exposure-based therapy: a review. Front Hum Neurosci 2014; 8:112.
- Buskirk JK. Validation of a Head Mounted Display Augmented Reality Device with Inertial Measurement Unit for Anywhere Administration for Executive Function Testing. PhD Dissertation, University of Miami, USA, 2021.
- Sobolewski EJ, Thompson BJ, Conchola EC, et al. Development and examination of a functional reactive agility test for older adults. Aging Clin Exp Res 2017; 30(4):293-298. [CrossRef]
- Eriksen BA and Eriksen CW. Effects of noise letters upon identification of a target letter in a non-search task. Percept Psychophys 1974; 16:143-149. doi: 10.3758, bf03203267.
- Davelaar EJ. When the ignored gets bound: Sequential effects in the Flanker Task. Front Psychol 2013; 3:552. [CrossRef]
- Tulsky DS, Carlozzi N, Chiaravalloti ND, et al. NIH Toolbox Cognition Battery (NIHTB-CB): list sorting test to measure working memory. J Int Neuropsychol Soc 2014; 20(6):599-610. [CrossRef]
- Lamers MJ. Selective attention and response set in the Stroop Task. Memory & Cognition 2010; 38(7):893-904. [CrossRef]
- Stroop JR. Studies of interference in serial verbal reactions. J Exp Psychol 1935; 18(6):643-662.
- Scarpina F and Tagini S. The Stroop Color and Word Test. Front Psychol 2017; 8:557.
- Howieson DB, Lezak MD, and Loring DW. Orientation and attention: Neuropsychological assessment. Oxford [Oxfordshire]: Oxford University Press. 2004 p.365–367. ISBN 978-0-19-511121-7.
- Strauss E, Sherman E, and Spreen O. A compendium of neuropsychological tests: Administration, norms, and commentary. Oxford [Oxfordshire]: Oxford University Press. 2006. p. 477–499. ISBN 978-0-19-515957-8.
- Podsiadlo D and Richardson S. The Timed Up and Go: a test of basic functional mobility for frail elderly persons. J Am Geriatr Soc 1991; 39(2):142-148.
- Tan JP, Li N, Gao J, et al. Optimal cutoff scores for dementia and mild cognitive impairment of the Montreal Cognitive Assessment among elderly and oldest-old Chinese population. J Alzheimers Dis 2015; 43(4):1403-12. [CrossRef]
- Moriwaka F, Tashiro K, and Itoh K. Prevalence of Parkinson’s disease in Hokkaido, the northernmost island of Japan. Intern Med 1996; 35:276. [CrossRef]
- Cabeza R, Grady CL, Nyberg L, et al. Age-related differences in neural activity during memory encoding and retrieval: A positron emission tomography study. J Neurosci 1997; 17:391–400. [CrossRef]
- Madden DJ, Turkington TG, Provenzale JM, et al. Adult age differences in the functional neuroanatomy of verbal recognition memory. Hum Brain Mapp 1999; 7:115–135.
- Reuter-Lorenz PA, Jonides J, Smith EE, et al. Age differences in the frontal lateralization of verbal and spatial working memory revealed by PET. J Cogn Neurosci 2000; 12:174–187. [CrossRef]
- Logan JM, Sanders AL, Snyder AZ, et al. Under- recruitment and nonselective recruitment: Dissociable neural mechanisms associated with aging. Neuron 2002; 33:827–840.
- Rosen AC, Prull MW, O’Hara R, et al. Variable effects of aging on frontal lobe contributions to memory. Neuroreport 2002; 13:2425–2428. [CrossRef]
- Juan MC, Mendez-Lopez M, Perez-Hernandez E, et al. Augmented reality for the assessment of children’s spatial memory in real settings. PLoS One 2014; 9(12):e113751. [CrossRef]
- Gothe NP, Fanning J, Awick E, et al. Executive function processes predict mobility outcomes in older adults. J Am Geriatr Soc 2014; 62(2):285-90. [CrossRef]
- Gothe NP, Fanning J, Awick E, et al. Executive function processes predict mobility outcomes in older adults. J Am Geriatr Soc 2014; 62(2):285-290.
- Mitchell M and Miller LS. Prediction of functional status in older adults: the ecological validity of four Delis–Kaplan executive function system tests. J Clin Exp Neuropsychol 2008; 30(6): 683-690. [CrossRef]
- De Weerd P, Reinke K, Ryan L, et al. Cortical mechanisms for acquisition and performance of bimanual motor sequences. Neuroimage 2003; 19(4):1405-16.
- Studenski S, Perera S, Patel K, et al. Gait speed and survival in older adults. JAMA 2011; 305(1):50-8.
- Hultsch DF, MacDonald SW, and Dixon RA. Variability in reaction time performance of younger and older adults. J Gerontol B Ssychol Sci Soc Sci 2002; 57(2):101- 115. [CrossRef]
- Gorus E, DRaedt R, and Mets T. Diversity, dispersion and inconsistency of reaction time measures: effects of age and task complexity. Aging Clin Exp Res 2006; 18(5):407-17. [CrossRef]
- Grand JH, Stawski RS, and MacDonald SW. Comparing individual differences in inconsistency and plasticity as predictors of cognitive function in older adults. J Clin Exp Neuropsychol 2016; 38(5):534-50. [CrossRef]
- Bielak AA, Hultsch DF, Strauss E, et al. Intraindividual variability is related to cognitive change in older adults: evidence for within-person coupling. Psychol Aging 2010; 25(3):575-86. [CrossRef]
- Kail R and Salthouse TA. Processing speed as a mental capacity. Acta Psychol (Amst) 1994; 86(2-3):199-225.
- Engel BT, Thorne PR, and Quilter RE. On the relationship among sex, age, response mode, cardiac cycle phase, breathing cycle phase, and simple reaction time. J Gerontol 1972; 27(4):456-460. [CrossRef]
Figure 1.
Representation of the WRIT/HMD test commands.
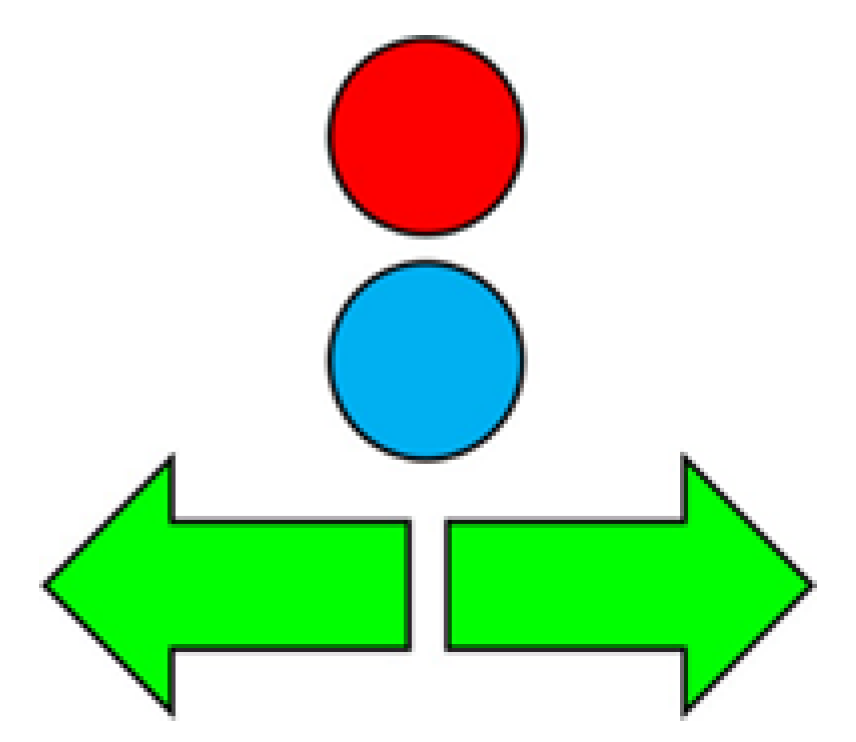
Figure 3.
Representation of the original WRIT test course (from Leyva et al., 2017)[7] with commands shown on a wall-mounted screen (replaced in both studies by the portable Hololens 2 device).
Figure 3.
Representation of the original WRIT test course (from Leyva et al., 2017)[7] with commands shown on a wall-mounted screen (replaced in both studies by the portable Hololens 2 device).
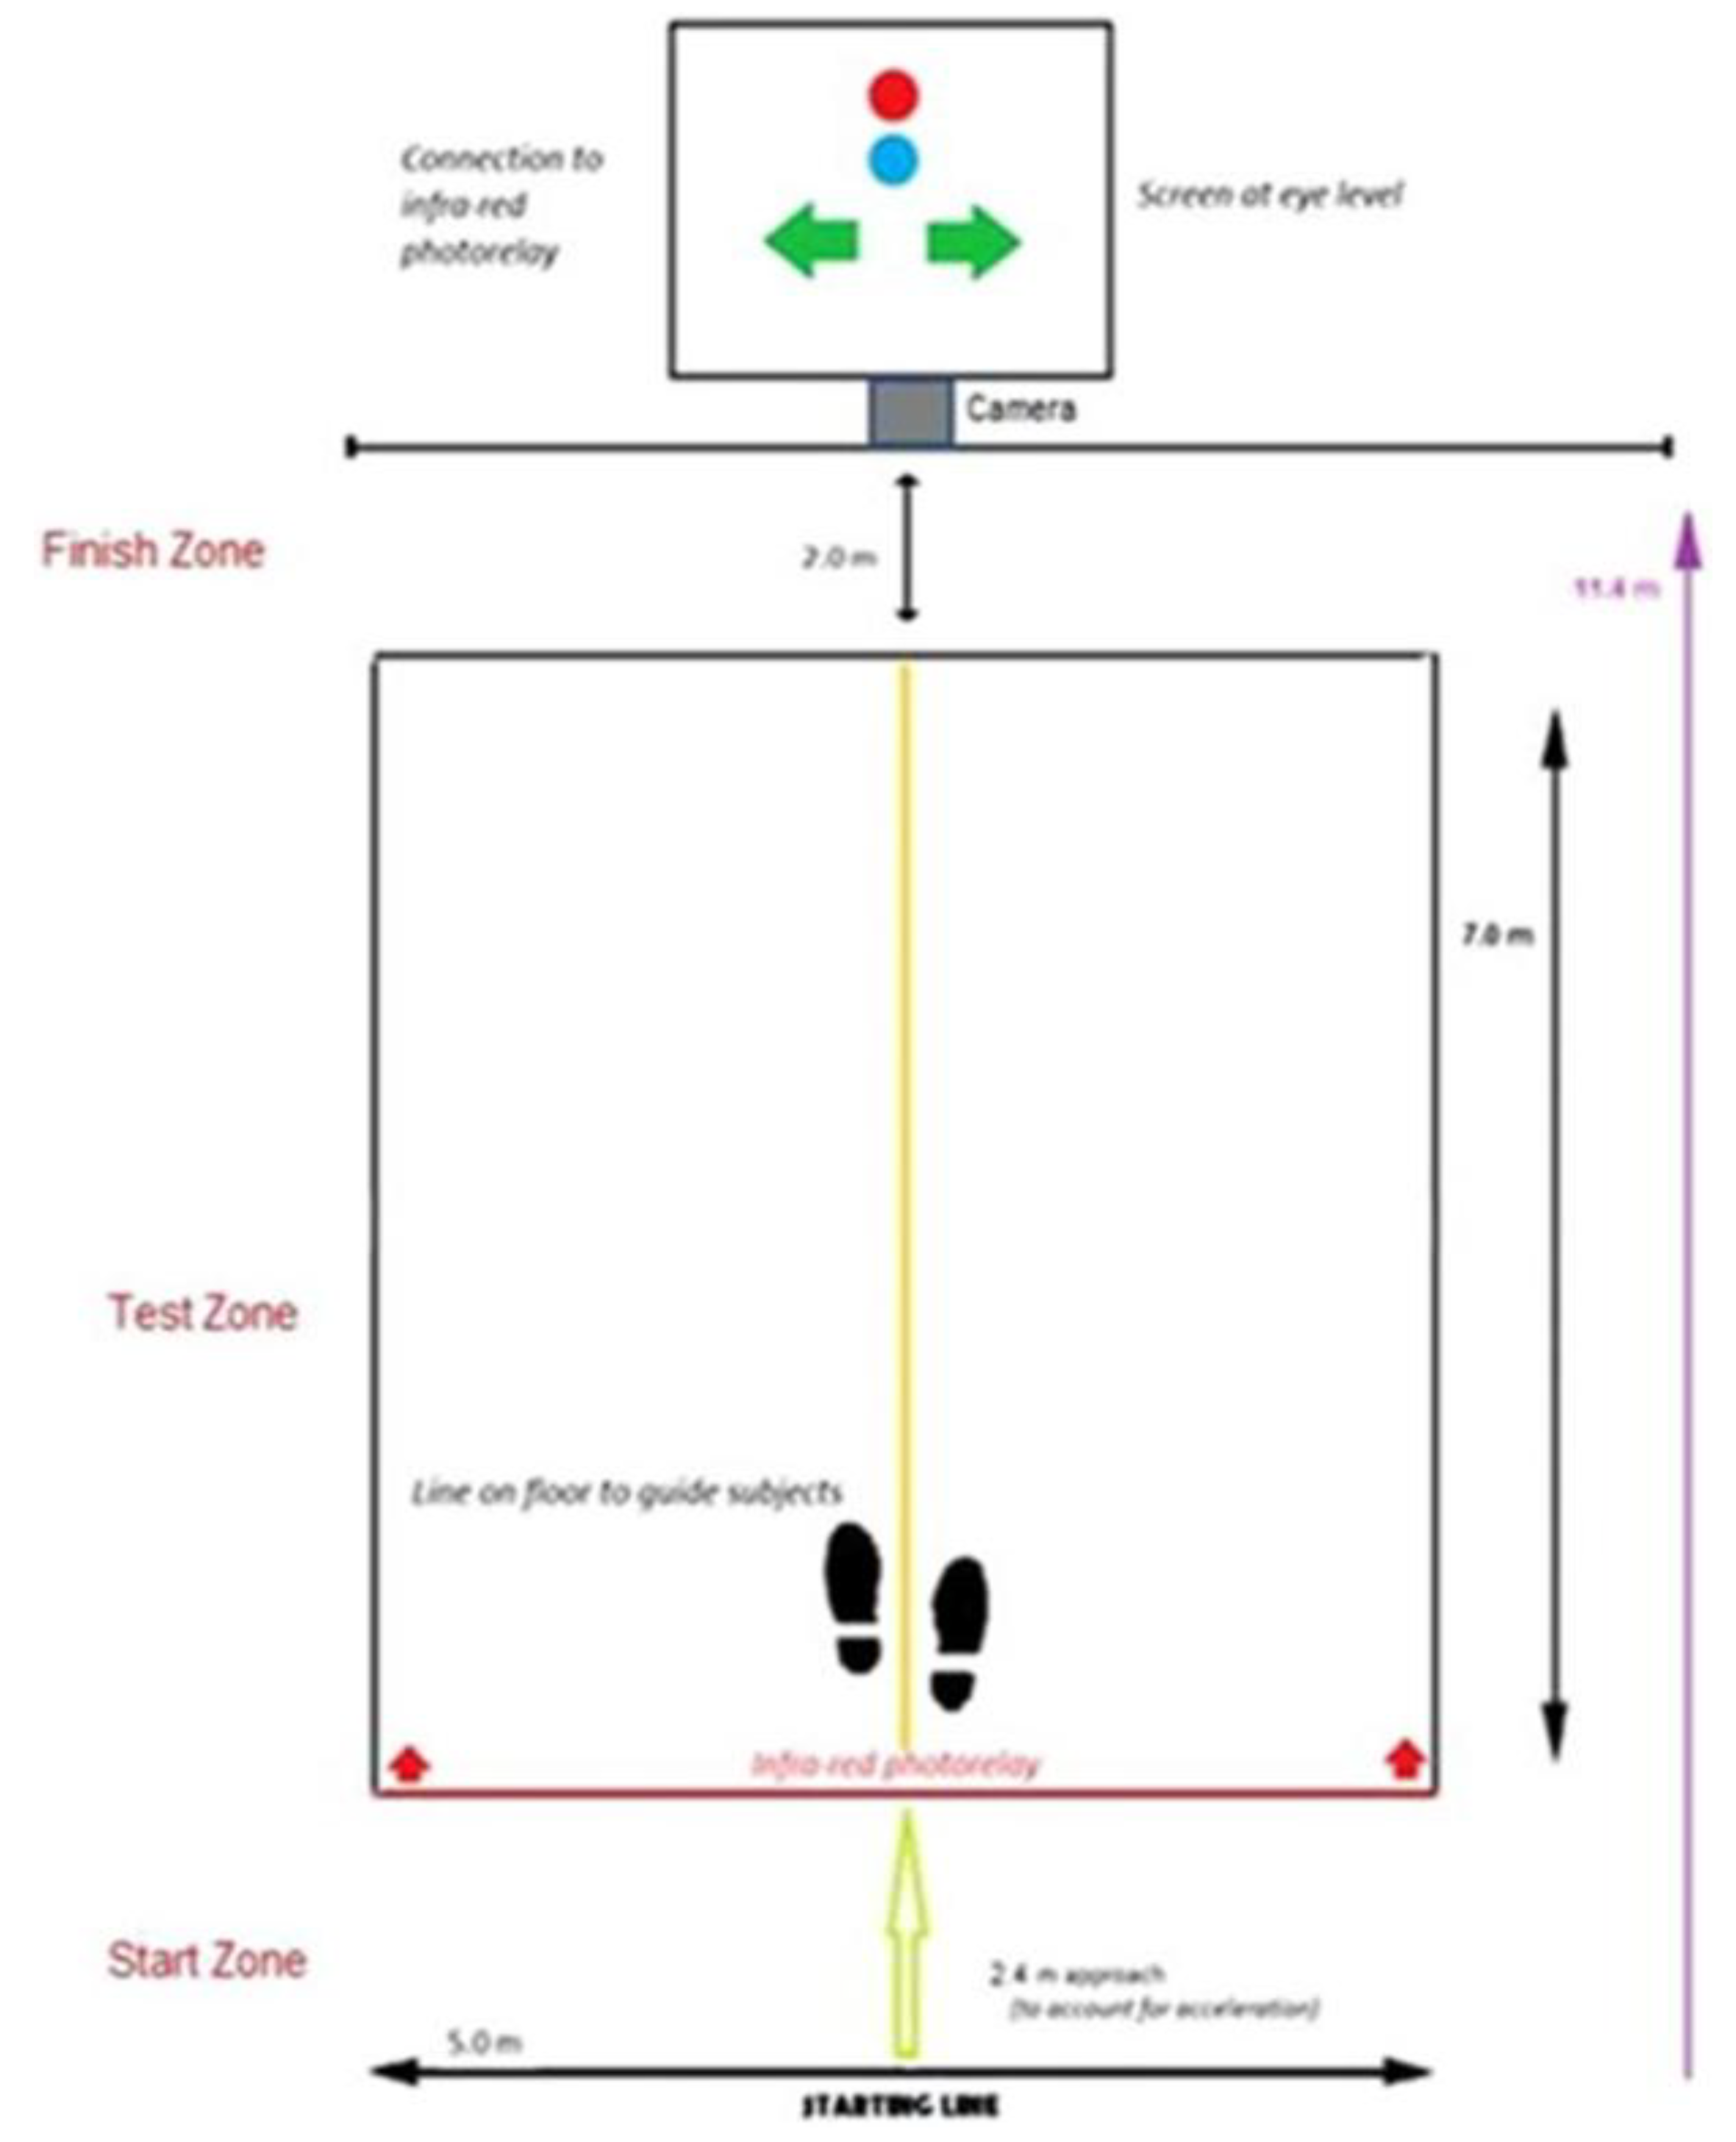
Figure 4.
Regression analysis comparing HMD-WRIT and BTS values for executive function (EF).
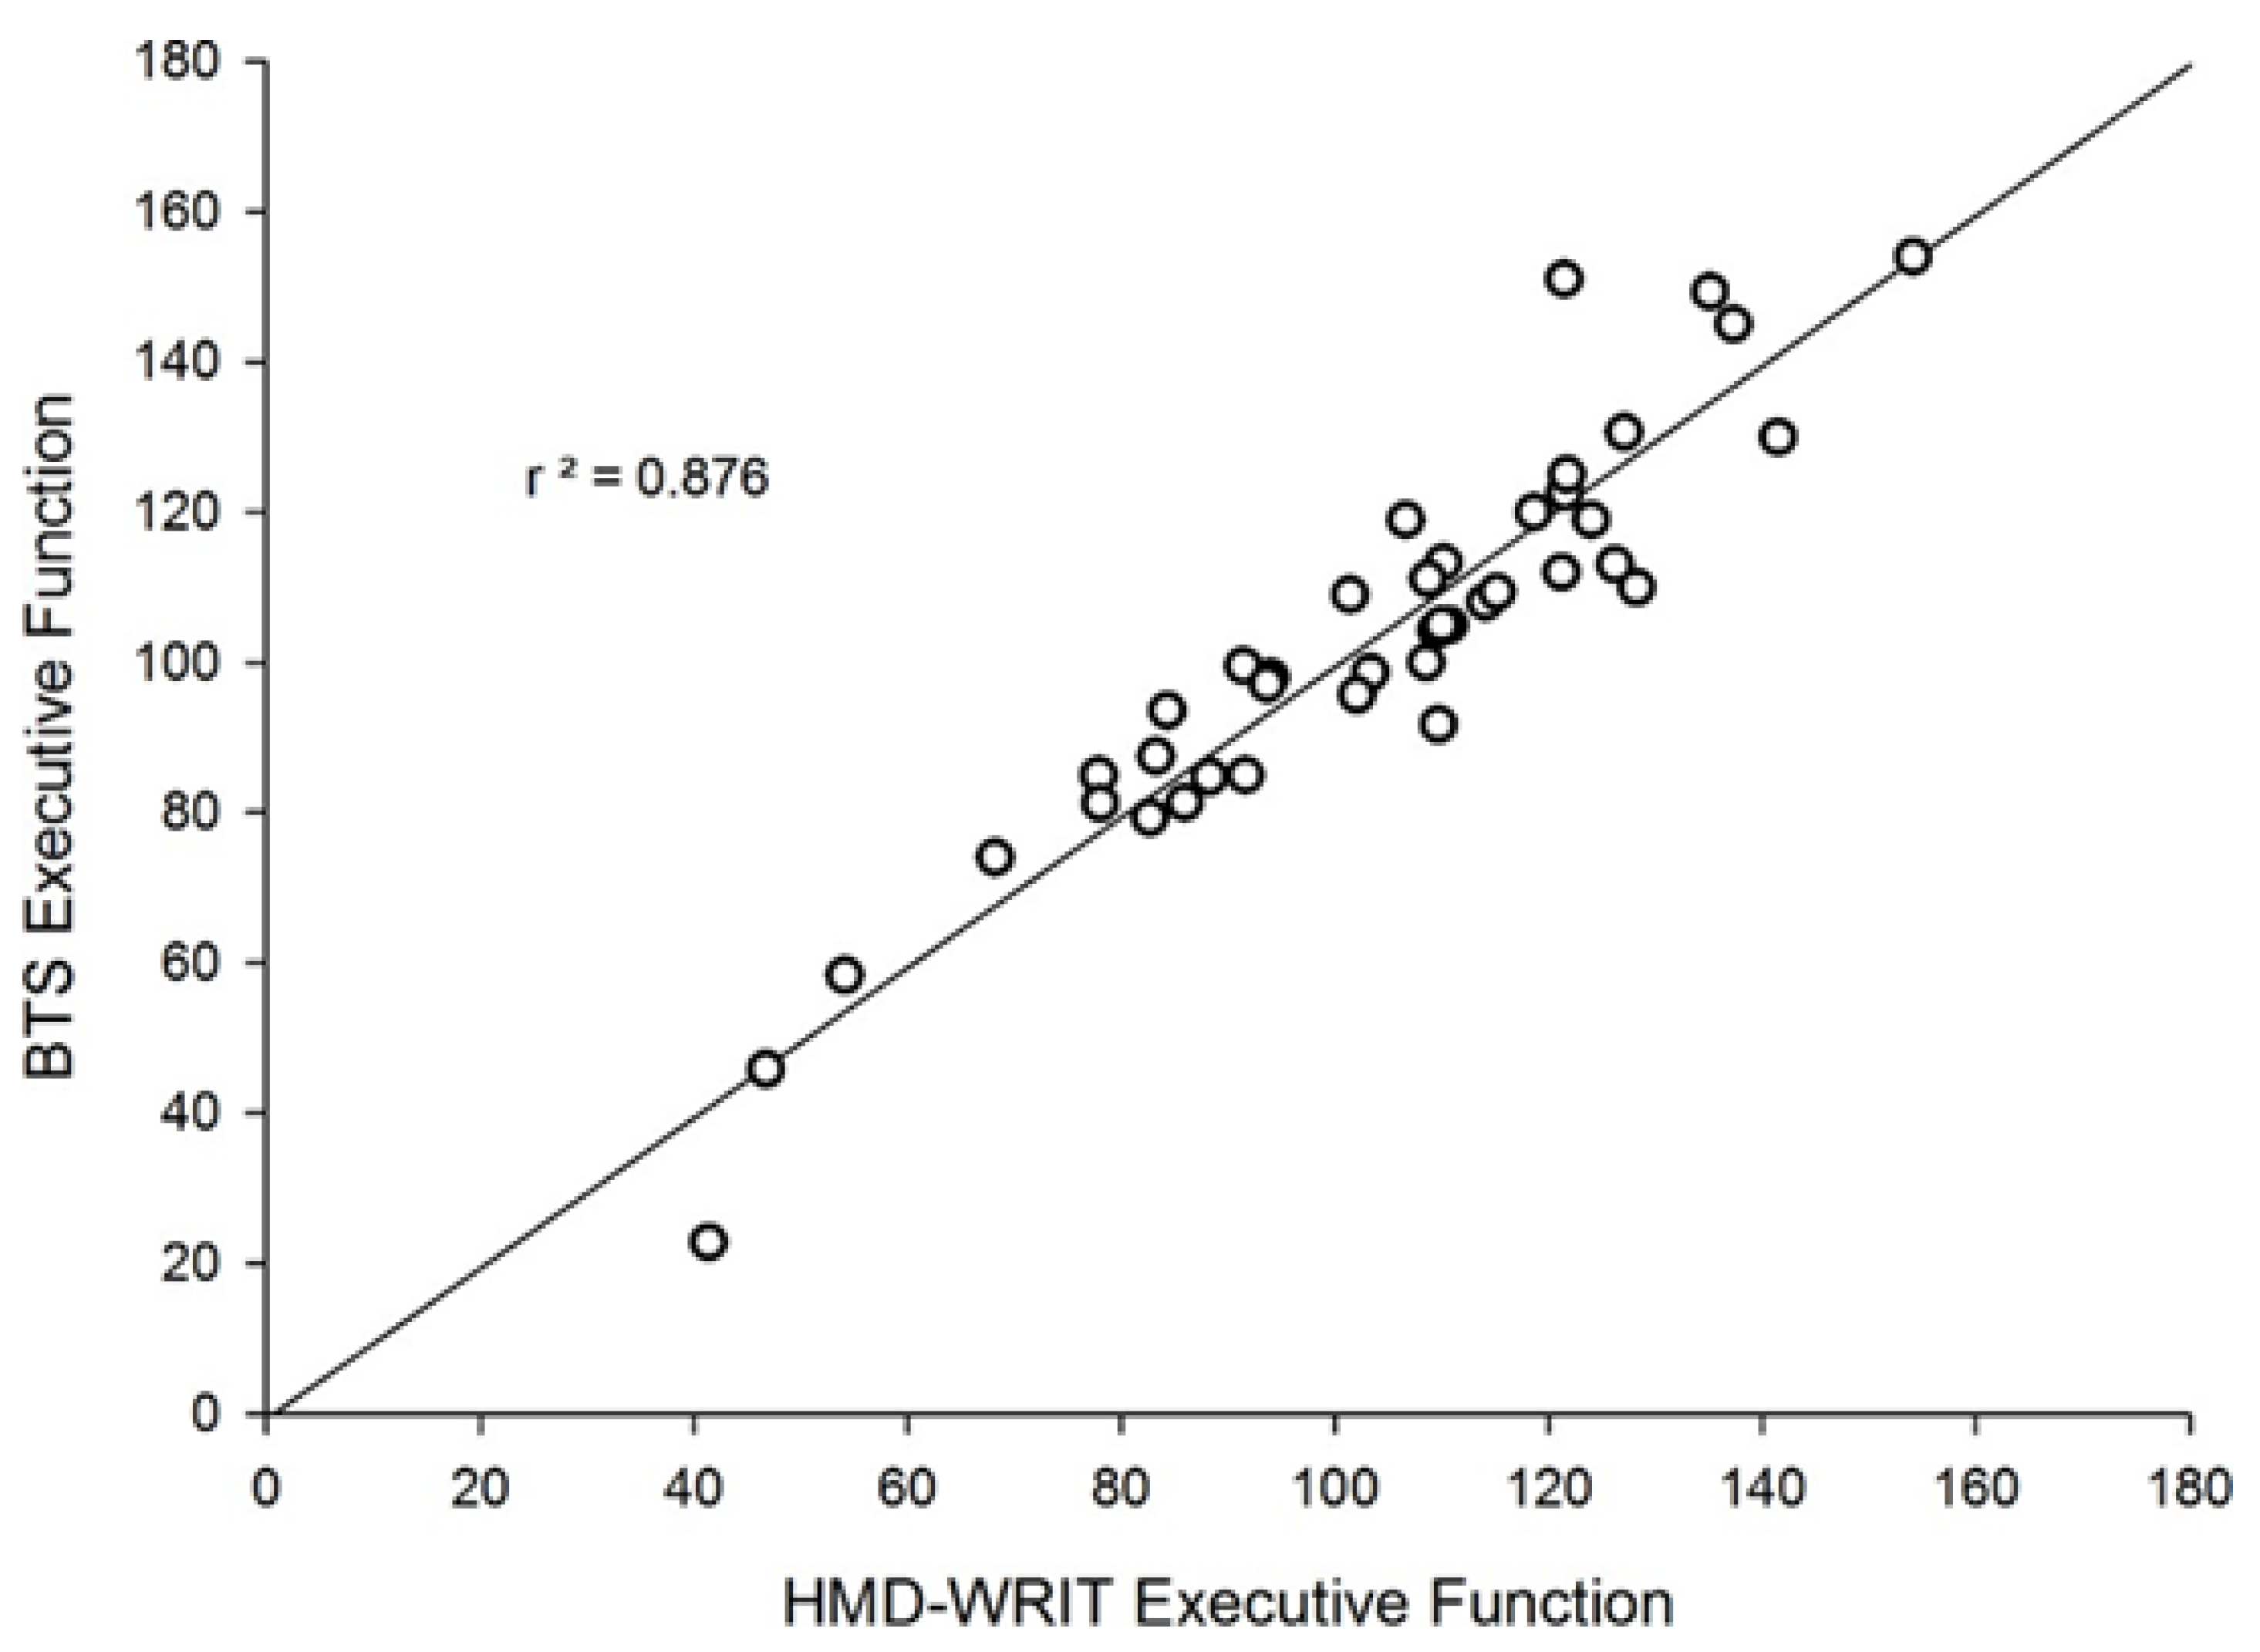
Figure 5.
Bland-Altman plot comparing HMD-WRIT and BTS EF values.
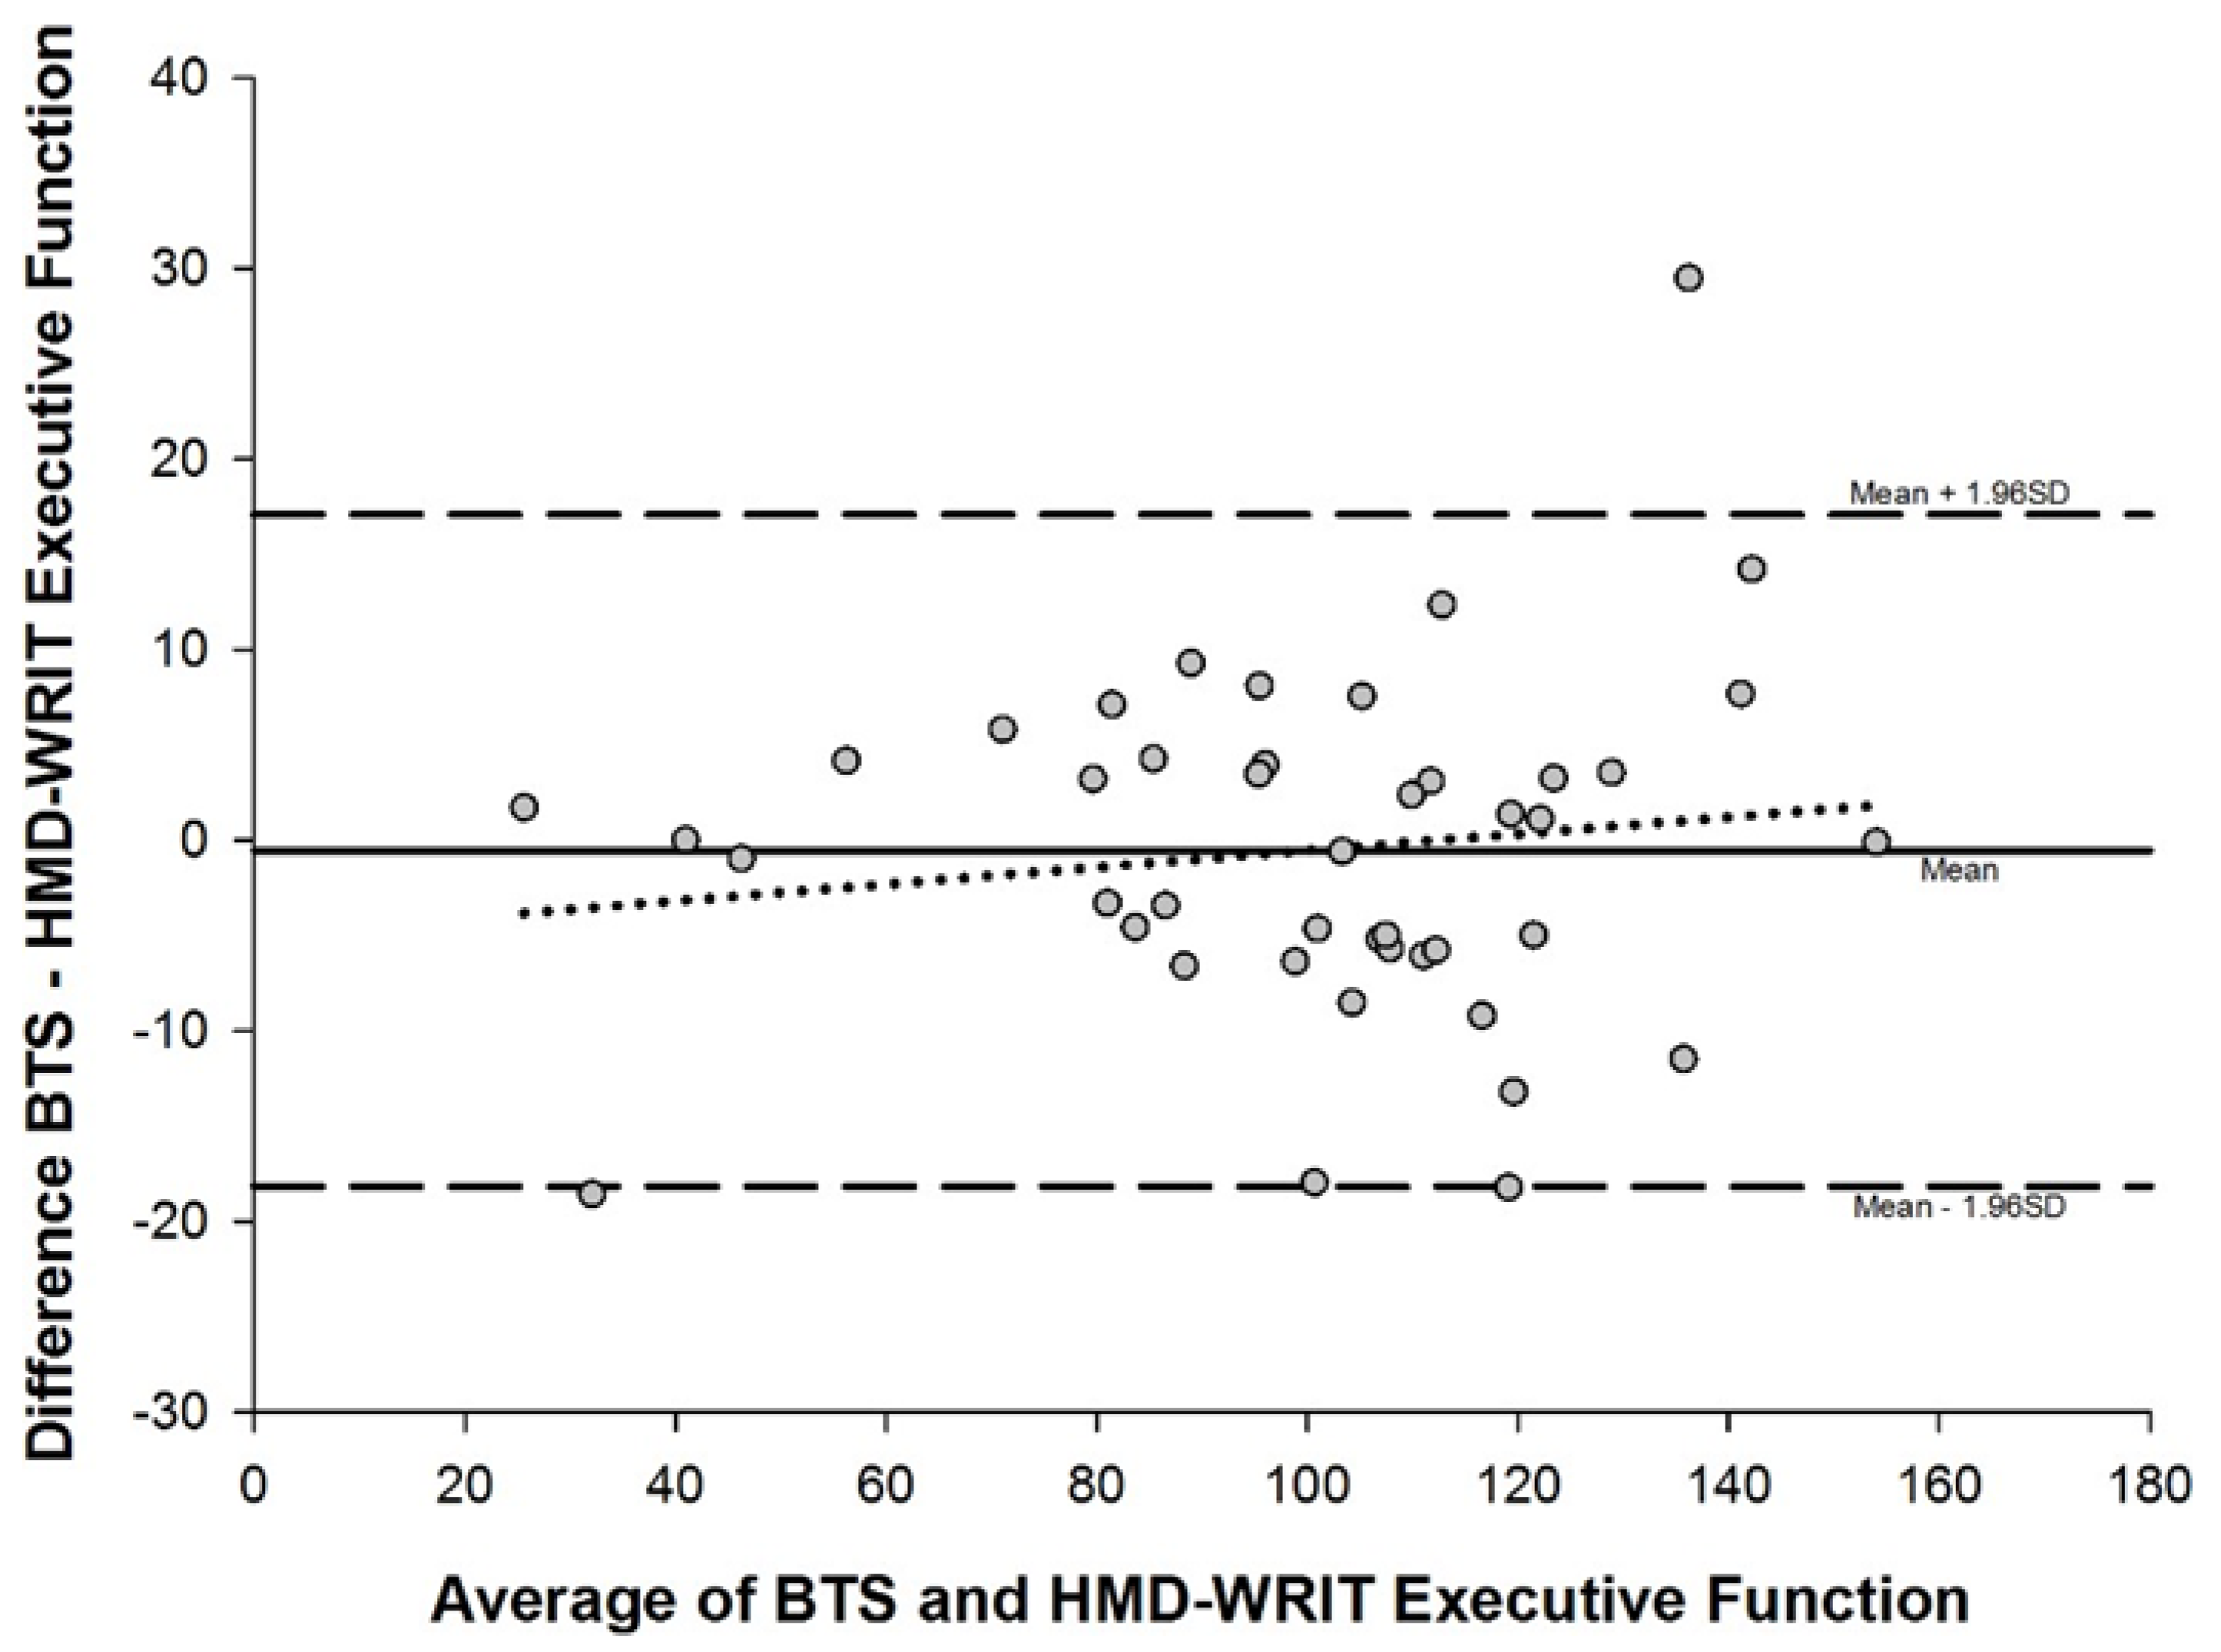
Figure 6.
Bland-Altman plot comparing HMD-WRIT and QTM EF values.
Disclaimer/Publisher’s Note: The statements, opinions and data contained in all publications are solely those of the individual author(s) and contributor(s) and not of MDPI and/or the editor(s). MDPI and/or the editor(s) disclaim responsibility for any injury to people or property resulting from any ideas, methods, instructions or products referred to in the content. |
© 2025 by the authors. Licensee MDPI, Basel, Switzerland. This article is an open access article distributed under the terms and conditions of the Creative Commons Attribution (CC BY) license (http://creativecommons.org/licenses/by/4.0/).
Copyright: This open access article is published under a Creative Commons CC BY 4.0 license, which permit the free download, distribution, and reuse, provided that the author and preprint are cited in any reuse.


