Submitted:
04 October 2025
Posted:
06 October 2025
You are already at the latest version
Abstract
Invasive alien species (IAS) can cause extinction of native species. However, debate continues over the significance of IAS as drivers of extinction globally, the level of threat IAS poses to endangered species, and whether conservation efforts against IAS should take priority over other factors, such as habitat loss or climate change. This study investigates the link between IAS and extinction and provides new insights from the IUCN Red List, focusing on species classified as extinct or extinct in the wild linked exclusively to IAS. However, many extinction events are caused by multiple synergistic threats, including IAS, but their relative contribution is unknown. We suggest using Structural Equation Models (SEM) to tease out the impact of IAS and other synergistic factors on threatened species, to better understand the role of IAS in potential extinction.
Keywords:
drivers
; introduced species
; non-indigenous species
; non-native species
; threats
Introduction
Invasive alien species (IAS) are globally recognised as ecologically devastating, due to their role as drivers in native floral and faunal population declines. The impacts of IAS on native species can be either direct (e.g. through predation without natural regulation) or indirect (e.g. through competition for resources), but both can ultimately lead to species extinction (Russell and Blackburn, 2017). Even before a species is driven to global extinction, short-term local extinctions can severely impact local ecosystems (Hogue and Breon, 2022) by altering species composition in communities (Donlan and Wilcox, 2008), leading to reductions in ecosystem function and accelerating population declines (Dueñas et al., 2018).
However, the effects of most IAS are not well understood due to the lack of quantitative data, with most available data limited to a small number of taxonomic groups, regions, and habitats (Dueñas et al., 2018). This has led to scepticism regarding the significance of IAS as drivers of ecological change and their potential to drive native species to extinction (Gurevitch and Padilla, 2004). Variation in methods of data analysis, as is seen throughout the literature, has also led to debate over the value of IAS as drivers of extinction. For example, Clavero and García-Berthou (2005) challenged and reanalysed data used by Gurevitch and Padilla (2004) revealing an increase from 2% to 25% in extinction events caused by IAS. This occurred after closer examination and re-evaluation of the extinction drivers for each species. Variation will also likely occur between databases due to difference in data availability and the threat classification system used.
Many current studies also focus solely on the impact of IAS to threatened species or regional biodiversity, rather than extinction (Doherty et al., 2016, Leclerc et al., 2018). One of the earliest and most widely cited IAS studies (Wilcove et al., 1998) found that habitat loss was the highest-ranked threat, followed by IAS, which affected 85% and 49% of threatened species respectively. However, predicting the probability of extinction for threatened species is almost impossible, and assessing biodiversity loss usually does not help us to understand trends in extinction across species groups or taxa (Cassey et al., 2005). Changes in human activities over time will also inevitably lead to corresponding changes to the level of threat posed by IAS (Wilcove et al., 1998). Therefore, even after over two decades of discussion surrounding IAS, their role as drivers of extinction is still poorly understood (Bellard et al., 2016b).
Despite these debates, it is widely accepted that anthropogenic activities are responsible for a large proportion of biological invasions (Ridley et al., 2022). Humans have and always will play a crucial role in enabling many non-native species to cross biogeographical barriers, whether intentionally or accidentally (Pyšek et al., 2020, Bellard et al., 2016a). Considering rapid global changes, understanding the impact of IAS on extinction and implementing relevant conservation measures is becoming increasingly vital to prevent further loss of species and ecological harm (Ricciardi and Ryan, 2018).
The relationship between IAS and species extinctions has previously been evaluated through comparing the number of extinctions or threatened species impacted by each type of threat. However, this has led to increased focus on which threat is greatest, rather than understanding trends of IAS impact on extinction, as we aim to do in this study. One of the main difficulties in evaluating the significance of IAS as drivers of extinction arises from context-dependant variation (Bellard et al., 2022).
The role of IAS as a driver of extinction is also complicated by the fact that most imperilled species face multiple threats, many of which are synergistic (Gurevitch and Padilla, 2004). Habitat destruction and disturbance often create conditions that promote the invasion or spread of IAS and increase the likelihood of interactions between native and non-native species (Pyšek et al., 2020). For example, urban habitats are highly recognised hotspots for alien plant colonisation (Pyšek et al., 2020). Habitat loss also reduces available refugia for native species making then more vulnerable to predation or competition effects from IAS (Berglund et al., 2013). The most common co-occurring drivers with IAS are biological resource use and agriculture (Blackburn et al., 2019). According to the IUCN, 80% of species are exposed to more than one threat (Blackburn et al., 2019). When IAS are listed as drivers of extinction, they are typically associated with 1.00 ± 1.24 other extinction drivers (Blackburn et al., 2019). The cumulative impact of multiple threats can worsen the damage caused by IAS (Capdevila et al., 2022).
Here, we aim to investigate the relationship between invasive alien species and extinction. Firstly, we provide a synthesis of the IUCN data on IAS as the single cause of extinction, to help us better understand the link between IAS and extinction. Secondly, we evaluate the significance of IAS in cases where multiple threats have been identified as the cause of extinction. Lastly, we explore how the effects of IAS can be better understood when multiple threats are present.
Methods
The IUCN Red List of Threatened Species is considered the most comprehensive database for evaluating species' extinction risk (Leclerc et al., 2018, Bellard et al., 2016a). The database has been compiled by hundreds of global expert volunteer contributors and over 100,000 species have been assessed against the IUCN Red list threat level classification scheme (Harfoot et al., 2021). We conducted a novel synthesis of the IUCN database, focusing on species classified as extinct or extinct in the wild (338 species, as of October 2023) linked exclusively to IAS. The taxonomic group of both extinct species and IAS, region, insularity (island vs mainland), and habitat type were noted for each species.
Results and Discussion
Establishing the Relationship Between IAS and Extinction
A synthesis of Extinction Linked Only to Invasive Alien Species
The greatest hotspot for IAS driven extinctions is Oceania, as also previously recorded (Bellard et al., 2016a, Leclerc et al., 2018), with other hotspot regions including Africa, and Asia. Furthermore, 91% of extinction events occurring in island territories (Figure 1c-d); as expected from the literature (Pyšek et al., 2020, Bellard et al., 2017), and the majority of extinct species were from tree-dominated habitats (Figure 1e).
Considering the distribution of species classes represented across both the extinct species and IAS, the most prevalent class were molluscs (Figure 1a-b), largely due to the impact of the carnivorous Rosy Wolfsnail (E. rosea) on Partula snails (Partulidae) (Régnier et al., 2009). This predatory snail was introduced to several pacific islands as biocontrol for the invasive African land snail, but ultimately had its own dramatic impact on the native snails, including the eradication of 51 endemic Partulidae species in less than ten years (Régnier et al., 2009). The devastating impact of the Rosy Wolfsnail serves as a reminder of the devastation that one IAS can cause. Although the impacts of IAS on molluscs are well known, they rarely receive recognition as the most impacted group, especially as most studies focus on vertebrates (Bellard et al., 2016a, Doherty et al., 2016).
Another taxonomic group that are highly represented as extinct species are birds, as expected from the literature (see Ducatez and Shine (2017)), however many bird extinctions, especially seabirds (Dueñas et al., 2018), are also driven by other factors such as overexploitation. For the synthesis only included extinctions where IAS were recorded as the singular threat, they are not recorded here as the most impacted group, however multiple threat extinctions are addressed later in this report.
Mammals and plants were prevalent as IAS (Figure 1b). Extinctions caused by invasive alien mammals are well documented, often linked to human colonisation and the arrival of black rats, cats, dogs, and livestock (Doherty et al., 2016). These taxa have been identified as impacting the greatest number of threatened species globally after Batrachochytrium dendrobatidis (Bd), a chytrid fungus that causes the disease chytridiomycosis in amphibians (Bellard et al., 2016b). This is likely because IAS who have originated from regions of historically intensive human land use, will be better adapted for persistence as invaders in other human disturbed landscapes (Fristoe et al., 2023). Introduced rodents and cats are thought to be casual drivers in 44% of modern bird, mammal, and reptile extinctions (Doherty et al., 2016). Furthermore, grazing and trampling by livestock is a much greater threat to native plants than herbivory by other non-native species (Gurevitch and Padilla, 2004). On the other hand, invasive plants are not frequently cited as the main cause of extinction, primarily causing displacement and community change rather than species extinction (Gurevitch and Padilla, 2004). For example, nearly 20% of North America’s vascular plant community is represented by exotic plant species that have become naturalised, however there is little to no evidence of resulting native species extinctions (Davis, 2003).
As most IAS plants exert a competition pressure on native plants, rather than a predatory pressure, the mechanisms that will drive a native plant species to extinction will be saturation or competition based (Gurevitch and Padilla, 2004). It is only at the saturation point for a given habitat (the maximum number of species that a habitat can support based on its resource availability (MacArthur and Wilson, 1963)), that species turnover could be expected. Further additions of an exotic species would then result in native species loss, with extinction rate increasing as colonisation rate increases (Sax and Gaines, 2008). Therefore, if exotic species continue to colonise extinction vulnerable areas (such as islands), future dramatic increases in plant extinctions could be expected (Sax and Gaines, 2008). Competition-based extinctions are recorded far less frequently than predation-based extinctions, however it is unclear if competition-based extinctions are just uncommon or whether they simply take longer to occur (Davis, 2003).
Limitations to Evaluation of the Threat of IAS
There are multiple factors that limit the accurate evaluation of IAS as drivers of extinction. First, we must address the issue of time lags, defined as the amount of time it takes for a species to become extinct after being impacted (otherwise defined as the ‘relaxation time’) (Diamond, 1972). It can take many generations or hundreds of years for a species to go extinct (Sax and Gaines, 2008), during which time, if the population has become spatially isolated or unable to reproduce, it remains in extinction debt (Gilbert and Levine, 2013). As it is unlikely that all currently threatened species will go extinct, estimating the potential cost of the current extinction lag created by IAS is difficult (Bellard et al., 2021). However, it is important to consider these species, nonetheless.
There are numerous factors that influence a species extinction lag time, which include both intrinsic factors (e.g. the longevity of individuals, the species sensitivity to inbreeding depression and the presence of a seed bank), and extrinsic factors (e.g. the quality and scale of the remaining natural habitat). Plants, for example, appear to have very few recorded extinctions caused by IAS, even on well-studied islands such as New Zealand (Sax et al., 2002). This is likely due to plants long extinction debt, which can be attributed to their seed banks, and long lifespans, particularly for woody species, whose lifespans can rarely be matched by animals (Cronk, 2016).
Plants extinction risk from IAS is greatly underestimated because of extinction debt, as has been shown through multiple studies. Reduced seed bank size has been found for many native species in sites with invasive Acacia (Holmes and Cowling, 1997), and significantly reduced community seed band density and richness was found due to an invasive alien grass species (Gooden and French, 2014). Furthermore, reduced seed production in native perennial herbs has been documented as a result of invasive honeysuckle (Miller and Gorchov, 2004). Reduced recruitment is a direct representation of extinction debt in these populations. Despite knowledge of a significant extinction debt for plant species, estimating these time lags is impossible, and therefore, it is unclear whether ongoing invasions among native plant communities may eventually result in a mass extinction event (Sax and Gaines, 2008). Time lags will predictably vary among taxonomic groups depending on the susceptibility of a species to extinction following population depression (Sax et al., 2002).
Another important factor to consider is the lack of knowledge of extinct species. Proving species absence is far more difficult than proving its existence, and for many species, determining and recording an extinction usually takes years of searching (Cronk, 2016). Furthermore, cause of extinction is only known for approximately one quarter of current species extinctions (Dueñas et al., 2018). Even for more documented extinctions, there is still speculation about the factors responsible, as few species or populations have been carefully monitored from the point of invasion to extinction (Sax and Gaines, 2008, Venter et al., 2006). There is also debate about the accuracy of determining species native ranges, which species have been introduced, and the extent of an ecosystem's invasion (Sagoff, 2018).
Many species also remain unrecorded or are largely unknown. In 2016, only 40% of the world’s reptile species had been assessed for the IUCN red list (Meiri and Chapple, 2016). Furthermore, data-deficient species represent 15% of the entire mammal dataset (Bellard et al., 2021), despite there being disproportional research effort and numbers of research scientists working on mammals and birds compared to other species groups such as invertebrates (Régnier et al., 2009). Data biases, created by research focused on specific taxonomic groups, are apparent across the literature (Roberts et al., 2013). Geographical bias can also occur in research due to limited information availability in developing countries (McGeoch et al., 2010). For example, the bias distribution of all mollusc extinctions, can be partly attributed to where taxonomists are based, which often do not cover the most species rich areas (Régnier et al., 2009). Consequently, there is always a high potential for underestimating the risk of extinction due to IAS.
Establishing the Significance of IAS for Cases Where There Are More Than One Threat
A synthesis of the Importance of Invasive Alien Species Linked to Extinction
Our synthesis from the IUCN Red List showed that 25% of IAS impacted extinct and extinct in the wild species had IAS listed as the sole driver of extinction. The remaining 75% of cases were caused by multiple factors, including IAS or likely including IAS when the exact drivers are less clear (Figure 2a). This is common due to a lack of monitoring before species loss, as these extinctions are often associated with invasive mammals introduced during human colonization. In agreement with the literature (Blackburn et al., 2019), the most common drivers associated with IAS were biological resource use and agriculture, followed by natural system modification, such as changes to waterways and fire management (Figure 2b).
Extinct Species-Invasive Alien Species Networks
For this study, networks were created to compare the proportions of each taxonomic group involved in the extinction events. The network approach, which is largely missing from IAS studies (Bellard et al., 2017), can help us to visualise where the greatest threats lie within the IAS extinction framework, and help to identify where conservation efforts should be targeted. Comparing the two networks (one for species where IAS was the only extinction driver (Figure 3a), and the other for species with multiple drivers listed (Figure 3b)) reveals differences in their structure. Mollusc extinctions in the network for species driven to extinction only by IAS have a significant influence on the relative proportions of other taxonomic groups (Figure 3a). As a result, the network for species with multiple drivers has a proportional increase in representation for each taxonomic group and a more complex interaction network (Figure 3b). When multiple drivers are considered (Figure 3b), birds are proportionally the most impacted by IAS.
Furthermore, fish have become the second highest group impacted by IAS in this multi-driver network, reflecting the prevalence of invasive fish species in wetland systems that are introduced alongside other human disturbances, such as aquaculture (Figure 3b). Although the single largest recent extinction of vertebrate species was the loss of approximately 300 endemic cichlid species in Lake Victoria following the introduction of the Nile perch, this was exacerbated by eutrophication and overexploitation (McNeely, 2001). This explains why fish were not well represented when IAS-only extinctions were considered.
When multiple drivers are recorded, mammals become the largest proportional class of IAS (Figure 3b). This is likely since the threats most associated with IAS, such as biological resource use and agriculture, are often linked to human colonization and the resulting common invasive mammals, such as black rats, cats, and livestock. For example, domestic cats have been found to contribute to at least 14% of all bird, reptile, and mammal extinctions (Medina et al., 2011). Fortunately eradication is possible for IAS species, with 88% of Rattus rattus eradication programmes across islands having been successful (Bellard et al., 2016b). Birds, which are rarely driven to extinction by other bird species, also show an increase in the number of taxonomic groups acting as extinction driving IAS (Figure 3b). This demonstrates how important interactions could be missed if only considering extinction events in which IAS are the only driver.
Conservation Challenges
It is difficult to determine the independent effects and value of threats as drivers of extinction because of the frequent correlations between them (Clavero et al., 2009). This can make it challenging to prioritize conservation efforts for IAS, as it is unclear what the main threat or extinction driver is. For example, in some cases, IAS may be the final driver of extinction for a species whose population has already declined due to other threats, such as habitat loss (González-Suárez et al., 2013). In these situations, it could be debated which threat should be the priority for conservation efforts.
Elucidating the Effect of IAS Where There Are More Than One Threats
Despite increased attention to the negative impacts of IAS, the efforts to manage IAS are hindered by the lack of a comprehensive global strategy and targets. To effectively address this issue, it is crucial to develop a unified strategy for data synthesis that brings together scientific research, policy making, and management practices (Meyerson et al., 2022, Anderson et al., 2004). The policies addressing IAS primarily focus on reducing global biodiversity loss (Cruz and Johnson, 2022). For example, in 2010, the United Nations Convention on Biological Diversity (CBD) established the “Strategic Plan for Biodiversity (2011-2020)”, in which Aichi Target 9 aimed to identify, and control or eradicate priority IAS and their pathways, and to establish management systems to prevent their further spread and establishment (Essl et al., 2020). However, the IAS indicators were only applied at regional or national scales, preventing data synthesis across species groups, ecosystems, and regions (McGeoch et al., 2010).
Due to limited progress in achieving the IAS targets by 2020, and growing concern about invasive species (such as the arrival of the Murder Hornet in the US and Canada), the Convention on Biological Diversity (CBD) developed a new "Post-2020 Global Biodiversity Framework" (Essl et al., 2020). This framework, which uses a new IUCN database on invasive species as one of its indicators, outlines a timeline for effectively managing significant introduction pathways, regulating harmful IAS, and restoring and recovering from their impacts (Essl et al., 2020). While this framework considers key factors for understanding IAS, it is also important to monitor the size and extent of the threat posed by IAS (McGeoch et al., 2010). This raises the question of how to determine the impact of IAS when there are multiple threats.
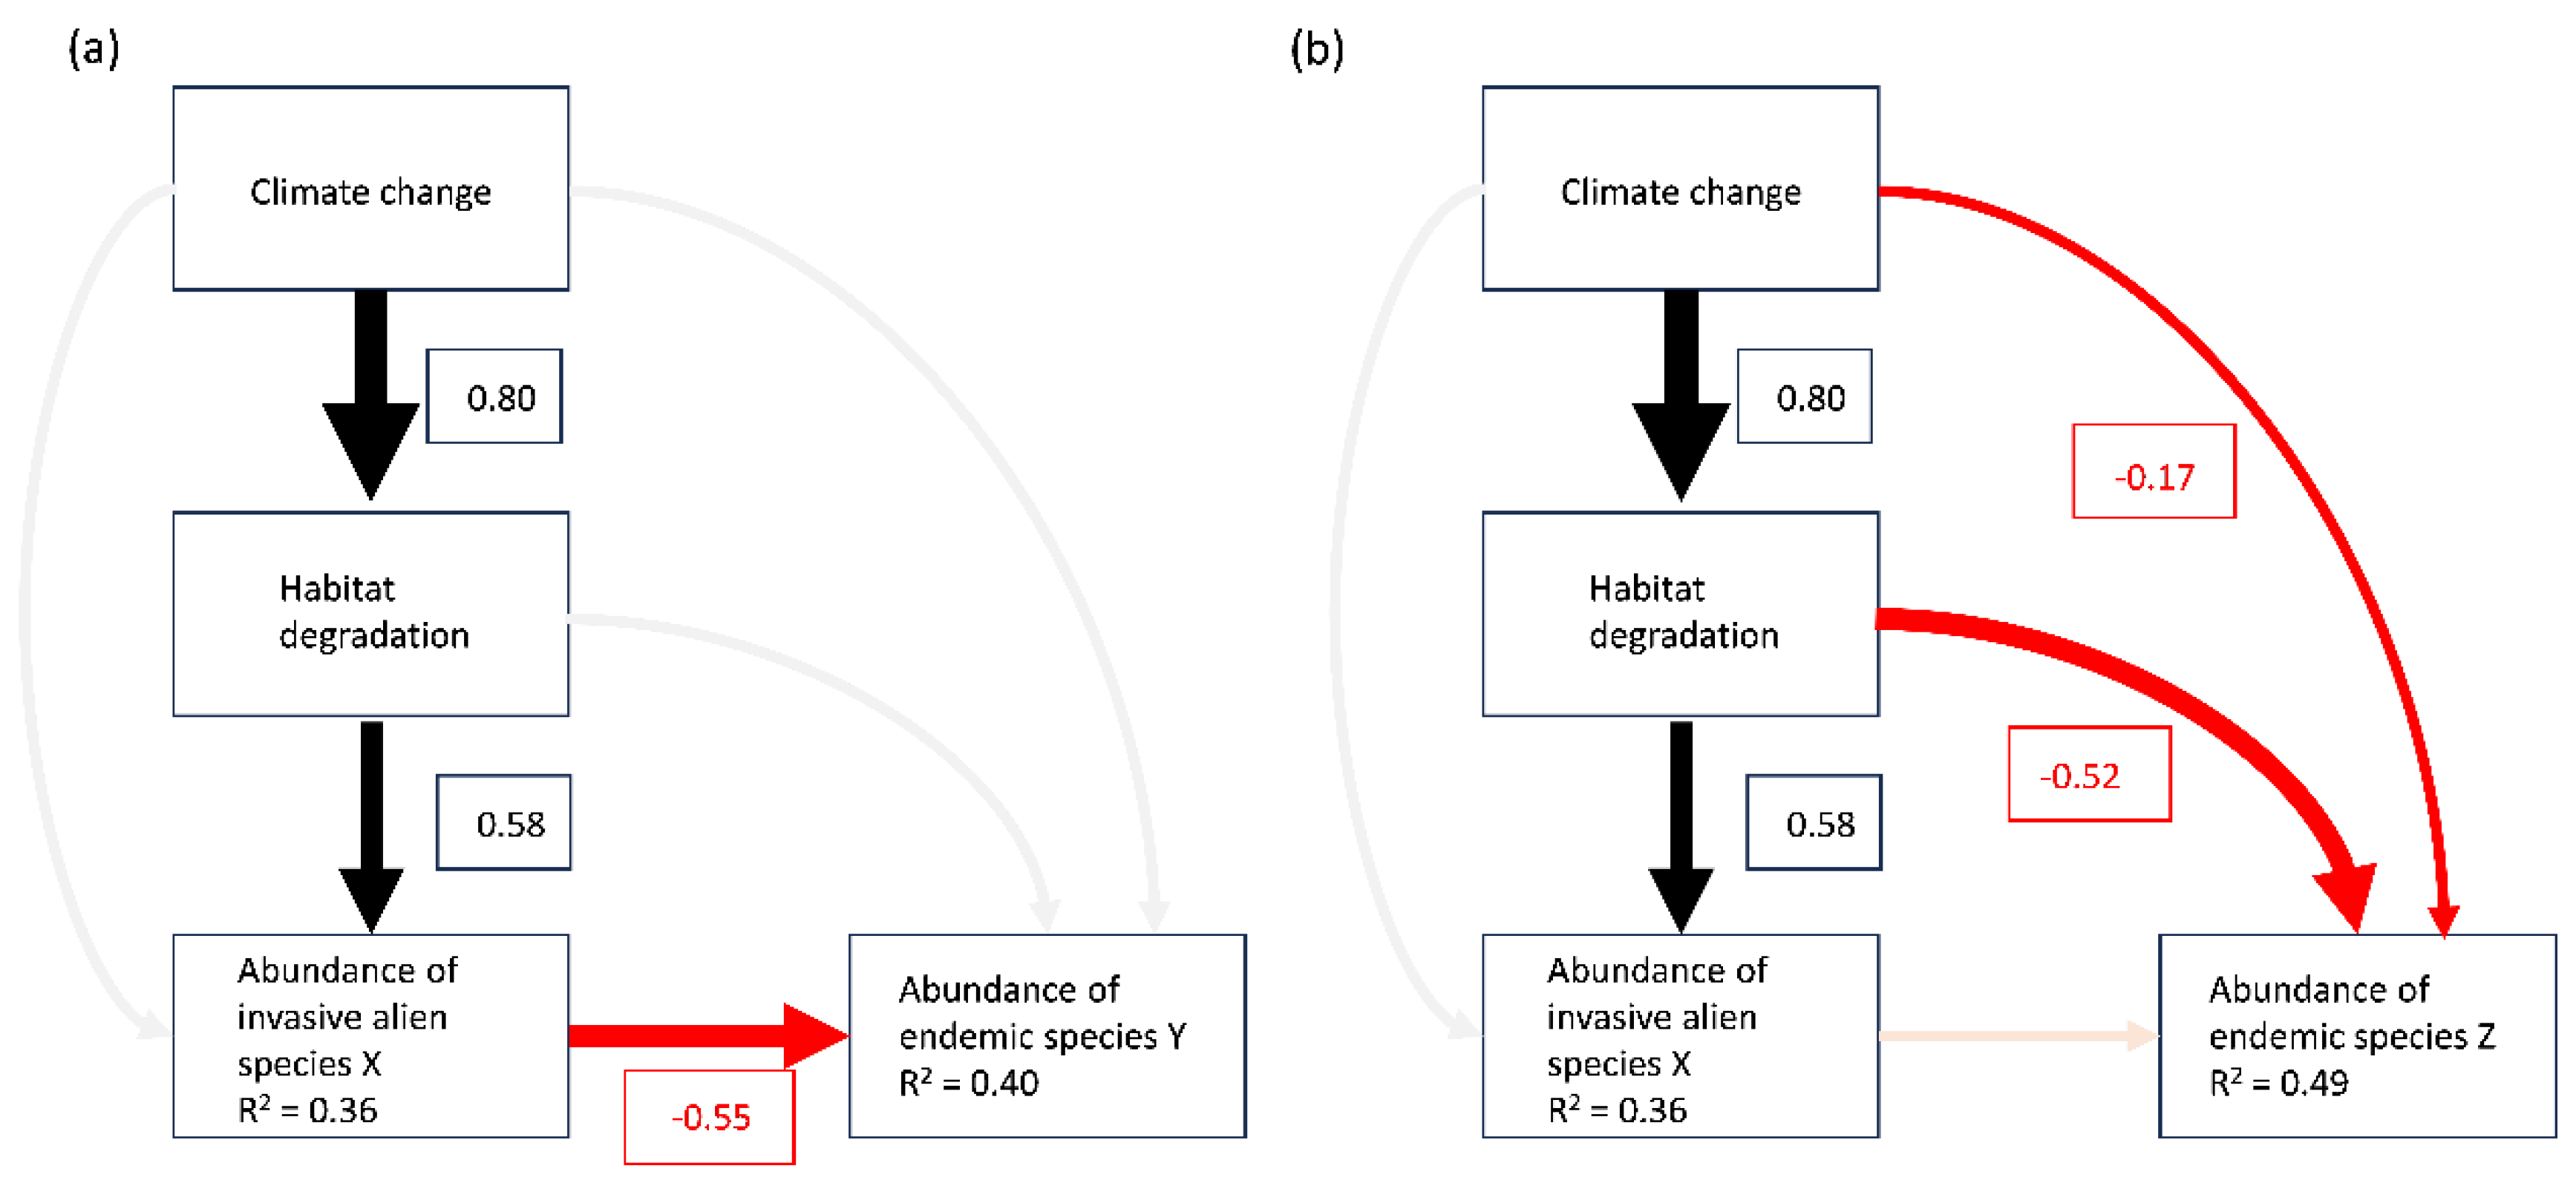
Assessing the impact of IAS can be improved by using a modelling framework, such as Structural Equation Models (SEM), to evaluate IAS as a driver of extinction for threatened and vulnerable species where multiple threats exist. SEM is a form of path analysis that allows for the evaluation of complex relationships within ecological networks (Lefcheck, 2016). The strength of SEM lies it its ability to identify direct and indirect effects, and distinguish between related pathways that have high potential to influence each other (Eisenhauer et al., 2015). This ability to test hypotheses for multiple processes within the same system has made SEM of great interest to ecologists (Fan et al., 2016), and examples of its previous use in ecological studies includes evaluating the direct and indirect causes of both habitat degradation (Santibáñez-Andrade et al., 2015) and growth inhibition (Chapin et al., 2016).
SEM will make it possible to determine the contribution of IAS alongside other extinction drivers such as climate change and habitat degradation (for a hypothetical example, see Figure 4). By better understanding the impact of different drivers, the most harmful IAS and IAS pathways, as well as vulnerable regions, can be accurately identified, as part of the new "Post-2020 Global Biodiversity Framework." This will also provide insight into which threats are most associated with each other and which threats should be targeted to achieve the most effective conservation outcomes for currently endangered and threatened species. Even if IAS is not the primary threat in some cases, addressing another threat like habitat loss could also slow the impact of IAS. Having a system for synthesizing IAS data will be crucial for advising policy and conservation strategies in a rapidly changing world. This modelling framework provides a way to establish such a system.
Conclusion
The threat posed by IAS to global ecosystems is alarming and cannot be ignored. In fact, it is estimated that IAS are impacting more than 60% of threatened species (Leclerc et al., 2018). Even though the threat magnitude, varies based on taxonomic group, region, and habitat, it is undeniable that IAS have contributed to numerous extinction events. The value of our unique native species, and their role in maintaining ecosystem services, means that it is crucial to clearly understand the regional and ecological trends in extinction events, and how we can prevent future species loss. The current lack of synthesized data on the impacts of IAS makes it challenging to implement targeted conservation measures; however, using a modelling framework such as SEM could help prioritize conservation efforts. Despite differing opinions on the significance of IAS as extinction drivers, their impacts must remain a top priority for policy makers.
Author Contributions statemen
Both authors contributed equally to the conception of the work, data synthesis, manuscript preparation, and revision.
Acknowledgments
This work was supported by the Natural Environment Research Council (subproject code: 519352512).
Ethics statement
Not applicable.
Data Availability statement
Not applicable as no new data were generated in this work.
Conflicts of Interest statement
Conflicts of interest: None.
References
- ANDERSON, P. K., CUNNINGHAM, A. A., PATEL, N. G., MORALES, F. J., EPSTEIN, P. R. & DASZAK, P. 2004. Emerging infectious diseases of plants: pathogen pollution, climate change and agrotechnology drivers. Trends in ecology & evolution, 19, 535-544. [CrossRef]
- BELLARD, C., BERNERY, C. & LECLERC, C. 2021. Looming extinctions due to invasive species: Irreversible loss of ecological strategy and evolutionary history. Global Change Biology, 27, 4967-4979.
- BELLARD, C., CASSEY, P. & BLACKBURN, T. M. 2016a. Alien species as a driver of recent extinctions. Biology letters, 12, 20150623.
- BELLARD, C., GENOVESI, P. & JESCHKE, J. M. 2016b. Global patterns in threats to vertebrates by biological invasions. Proceedings of the Royal Society B: Biological Sciences, 283, 20152454. [CrossRef]
- BELLARD, C., MARINO, C. & COURCHAMP, F. 2022. Ranking threats to biodiversity and why it doesn’t matter. Nature Communications, 13, 2616.
- BELLARD, C., RYSMAN, J.-F., LEROY, B., CLAUD, C. & MACE, G. M. 2017. A global picture of biological invasion threat on islands. Nature Ecology & Evolution, 1, 1862-1869.
- BERGLUND, H., JÄREMO, J. & BENGTSSON, G. 2013. Associations of invasive alien species and other threats to IUCN Red List species (Chordata: vertebrates). Biological Invasions, 15, 1169-1180. [CrossRef]
- BLACKBURN, T. M., BELLARD, C. & RICCIARDI, A. 2019. Alien versus native species as drivers of recent extinctions. Frontiers in Ecology and the Environment, 17, 203-207.
- CAPDEVILA, P., NOVIELLO, N., MCRAE, L., FREEMAN, R. & CLEMENTS, C. F. 2022. Global patterns of resilience decline in vertebrate populations. Ecology Letters, 25, 240-251.
- CASSEY, P., BLACKBURN, T. M., DUNCAN, R. P. & CHOWN, S. L. 2005. Concerning invasive species: Reply to Brown and Sax. Austral Ecology, 30, 475-480.
- CHAPIN, F. S., CONWAY, A. J., JOHNSTONE, J. F., HOLLINGSWORTH, T. N. & HOLLINGSWORTH, J. 2016. Absence of net long-term successional facilitation by alder in a boreal Alaska floodplain. Ecology, 97, 2986-2997.
- CLAVERO, M., BROTONS, L., PONS, P. & SOL, D. 2009. Prominent role of invasive species in avian biodiversity loss. Biological Conservation, 142, 2043-2049.
- CLAVERO, M. & GARCÍA-BERTHOU, E. 2005. Invasive species are a leading cause of animal extinctions. Trends in ecology & evolution, 20, 110. [CrossRef]
- CRONK, Q. 2016. Plant extinctions take time. Science, 353, 446-447.
- CRUZ, J. G. & JOHNSON, M. F. 2022. Invasive Species in Post-2020 Global Environmental Politics. Global Environmental Politics, 22, 12-22.
- DAVIS, M. A. 2003. Biotic Globalization: Does Competition from Introduced Species Threaten Biodiversity? BioScience, 53, 481-489. [CrossRef]
- DIAMOND, J. M. 1972. Biogeographic Kinetics: Estimation of Relaxation Times for Avifaunas of Southwest Pacific Islands. Proceedings of the National Academy of Sciences, 69, 3199-3203.
- DOHERTY, T. S., GLEN, A. S., NIMMO, D. G., RITCHIE, E. G. & DICKMAN, C. R. 2016. Invasive predators and global biodiversity loss. Proceedings of the National Academy of Sciences, 113, 11261-11265.
- DONLAN, C. J. & WILCOX, C. 2008. Diversity, invasive species and extinctions in insular ecosystems. Journal of Applied Ecology, 1114-1123. [CrossRef]
- DUCATEZ, S. & SHINE, R. 2017. Drivers of Extinction Risk in Terrestrial Vertebrates. Conservation Letters, 10, 186-194.
- DUEÑAS, M.-A., RUFFHEAD, H. J., WAKEFIELD, N. H., ROBERTS, P. D., HEMMING, D. J. & DIAZ-SOLTERO, H. 2018. The role played by invasive species in interactions with endangered and threatened species in the United States: a systematic review. Biodiversity and Conservation, 27, 3171-3183. [CrossRef]
- EISENHAUER, N., BOWKER, M. A., GRACE, J. B. & POWELL, J. R. 2015. From patterns to causal understanding: Structural equation modeling (SEM) in soil ecology. Pedobiologia, 58, 65-72.
- ESSL, F., LATOMBE, G., LENZNER, B., PAGAD, S., SEEBENS, H., SMITH, K., WILSON, J. R. & GENOVESI, P. 2020. The Convention on Biological Diversity (CBD)’s Post-2020 target on invasive alien species–what should it include and how should it be monitored? NeoBiota, 62, 99-121.
- FAN, Y., CHEN, J., SHIRKEY, G., JOHN, R., WU, S. R., PARK, H. & SHAO, C. 2016. Applications of structural equation modeling (SEM) in ecological studies: an updated review. Ecological Processes, 5, 19.
- FRISTOE, T. S., BLEILEVENS, J., KINLOCK, N. L., YANG, Q., ZHANG, Z., DAWSON, W., ESSL, F., KREFT, H., PERGL, J., PYŠEK, P., WEIGELT, P., DUFOUR-DROR, J.-M., SENNIKOV, A. N., WASOWICZ, P., WESTERGAARD, K. B. & VAN KLEUNEN, M. 2023. Evolutionary imbalance, climate and human history jointly shape the global biogeography of alien plants. Nature Ecology & Evolution. [CrossRef]
- GILBERT, B. & LEVINE, J. M. 2013. Plant invasions and extinction debts. Proceedings of the National Academy of Sciences, 110, 1744-1749.
- GONZÁLEZ-SUÁREZ, M., GÓMEZ, A. & REVILLA, E. 2013. Which intrinsic traits predict vulnerability to extinction depends on the actual threatening processes. Ecosphere, 4, 1-16.
- GOODEN, B. & FRENCH, K. 2014. Impacts of alien grass invasion in coastal seed banks vary amongst native growth forms and dispersal strategies. Biological Conservation, 171, 114-126.
- GUREVITCH, J. & PADILLA, D. K. 2004. Are invasive species a major cause of extinctions? Trends in Ecology & Evolution, 19, 470-474. [CrossRef]
- HARFOOT, M. B., JOHNSTON, A., BALMFORD, A., BURGESS, N. D., BUTCHART, S. H., DIAS, M. P., HAZIN, C., HILTON-TAYLOR, C., HOFFMANN, M. & ISAAC, N. J. 2021. Using the IUCN Red List to map threats to terrestrial vertebrates at global scale. Nature ecology & evolution, 5, 1510-1519.
- HOGUE, A. S. & BREON, K. 2022. The greatest threats to species. Conservation Science and Practice, e12670.
- HOLMES, P. M. & COWLING, R. M. 1997. The Effects of Invasion by Acacia saligna on the Guild Structure and Regeneration Capabilities of South African Fynbos Shrublands. Journal of Applied Ecology, 34, 317-332.
- LECLERC, C., COURCHAMP, F. & BELLARD, C. 2018. Insular threat associations within taxa worldwide. Scientific Reports, 8, 6393.
- LEFCHECK, J. S. 2016. piecewiseSEM: Piecewise structural equation modelling in r for ecology, evolution, and systematics. Methods in Ecology and Evolution, 7, 573-579. [CrossRef]
- MACARTHUR, R. H. & WILSON, E. O. 1963. An Equilibrium Theory of Insular Zoogeography. Evolution, 17, 373-387.
- MCGEOCH, M. A., BUTCHART, S. H., SPEAR, D., MARAIS, E., KLEYNHANS, E. J., SYMES, A., CHANSON, J. & HOFFMANN, M. 2010. Global indicators of biological invasion: species numbers, biodiversity impact and policy responses. Diversity and Distributions, 16, 95-108.
- MCNEELY, J. 2001. Invasive species: a costly catastrophe for native biodiversity. Land Use and Water Resources Research, 1.
- MEDINA, F. M., BONNAUD, E., VIDAL, E., TERSHY, B. R., ZAVALETA, E. S., JOSH DONLAN, C., KEITT, B. S., LE CORRE, M., HORWATH, S. V. & NOGALES, M. 2011. A global review of the impacts of invasive cats on island endangered vertebrates. Global Change Biology, 17, 3503-3510.
- MEIRI, S. & CHAPPLE, D. G. 2016. Biases in the current knowledge of threat status in lizards, and bridging the ‘assessment gap’. Biological Conservation, 204, 6-15. [CrossRef]
- MEYERSON, L. A., PAUCHARD, A., BRUNDU, G., CARLTON, J. T., HIERRO, J. L., KUEFFER, C., PANDIT, M. K., PYŠEK, P., RICHARDSON, D. M. & PACKER, J. G. 2022. Moving toward global strategies for managing invasive alien species. Global plant invasions. Springer.
- MILLER, K. E. & GORCHOV, D. L. 2004. The invasive shrub, Lonicera maackii , reduces growth and fecundity of perennial forest herbs. Oecologia, 139, 359-375.
- PYŠEK, P., HULME, P. E., SIMBERLOFF, D., BACHER, S., BLACKBURN, T. M., CARLTON, J. T., DAWSON, W., ESSL, F., FOXCROFT, L. C., GENOVESI, P., JESCHKE, J. M., KÜHN, I., LIEBHOLD, A. M., MANDRAK, N. E., MEYERSON, L. A., PAUCHARD, A., PERGL, J., ROY, H. E., SEEBENS, H., VAN KLEUNEN, M., VILÀ, M., WINGFIELD, M. J. & RICHARDSON, D. M. 2020. Scientists' warning on invasive alien species. Biological Reviews, 95, 1511-1534.
- RÉGNIER, C., FONTAINE, B. & BOUCHET, P. 2009. Not Knowing, Not Recording, Not Listing: Numerous Unnoticed Mollusk Extinctions. Conservation Biology, 23, 1214-1221.
- RICCIARDI, A. & RYAN, R. 2018. The exponential growth of invasive species denialism. Biological Invasions, 20, 549-553. [CrossRef]
- RIDLEY, F. A., HICKINBOTHAM, E. J., SUGGITT, A. J., MCGOWAN, P. J. & MAIR, L. 2022. The scope and extent of literature that maps threats to species globally: a systematic map. Environmental Evidence, 11, 1-26.
- ROBERTS, P. D., DIAZ-SOLTERO, H., HEMMING, D. J., PARR, M. J., WAKEFIELD, N. H. & WRIGHT, H. J. 2013. What is the evidence that invasive species are a significant contributor to the decline or loss of threatened species? A systematic review map. Environmental Evidence, 2, 5.
- RUSSELL, J. C. & BLACKBURN, T. M. 2017. Invasive Alien Species: Denialism, Disagreement, Definitions, and Dialogue. Trends in Ecology & Evolution, 32, 312-314.
- SAGOFF, M. 2018. Invasive species denialism: a reply to Ricciardi and Ryan. Biological Invasions, 20, 2723-2729. [CrossRef]
- SANTIBÁÑEZ-ANDRADE, G., CASTILLO-ARGÜERO, S., VEGA-PEÑA, E., LINDIG-CISNEROS, R. & ZAVALA-HURTADO, J. 2015. Structural equation modeling as a tool to develop conservation strategies using environmental indicators: The case of the forests of the Magdalena river basin in Mexico City. Ecological Indicators, 54, 124-136.
- SAX, D. F. & GAINES, S. D. 2008. Species invasions and extinction: The future of native biodiversity on islands. Proceedings of the National Academy of Sciences, 105, 11490-11497. [CrossRef]
- SAX, D. F., GAINES, S. D. & BROWN, J. H. 2002. Species Invasions Exceed Extinctions on Islands Worldwide: A Comparative Study of Plants and Birds. The American Naturalist, 160, 766-783.
- VENTER, O., BRODEUR, N. N., NEMIROFF, L., BELLAND, B., DOLINSEK, I. J. & GRANT, J. W. A. 2006. Threats to Endangered Species in Canada. BioScience, 56, 903-910. [CrossRef]
- WILCOVE, D. S., ROTHSTEIN, D., DUBOW, J., PHILLIPS, A. & LOSOS, E. 1998. Quantifying threats to imperiled species in the United States. BioScience, 48, 607-615.
Figure 1.
(a) Proportions of species classes for all extinct and extinct in the wild species whose extinctions were caused exclusively by IAS. (b) Proportions of IAS class for the extinction events of all extinct and extinct in the wild species in which the class of IAS was known and IAS were the only extinction driver. (c) Proportions of native geographic regions for all extinct and extinct in the wild species whose extinctions were caused exclusively by IAS. (d) Proportions of island vs inland species for all extinct and extinct in the wild species whose extinctions were caused exclusively by IAS. (e) Proportions of native habitat types for all extinct and extinct in the wild species whose extinctions were caused exclusively by IAS. All data was collected from the IUCN red list (2022), and only reports data for species whose extinction was caused by IAS as the only extinction driver.
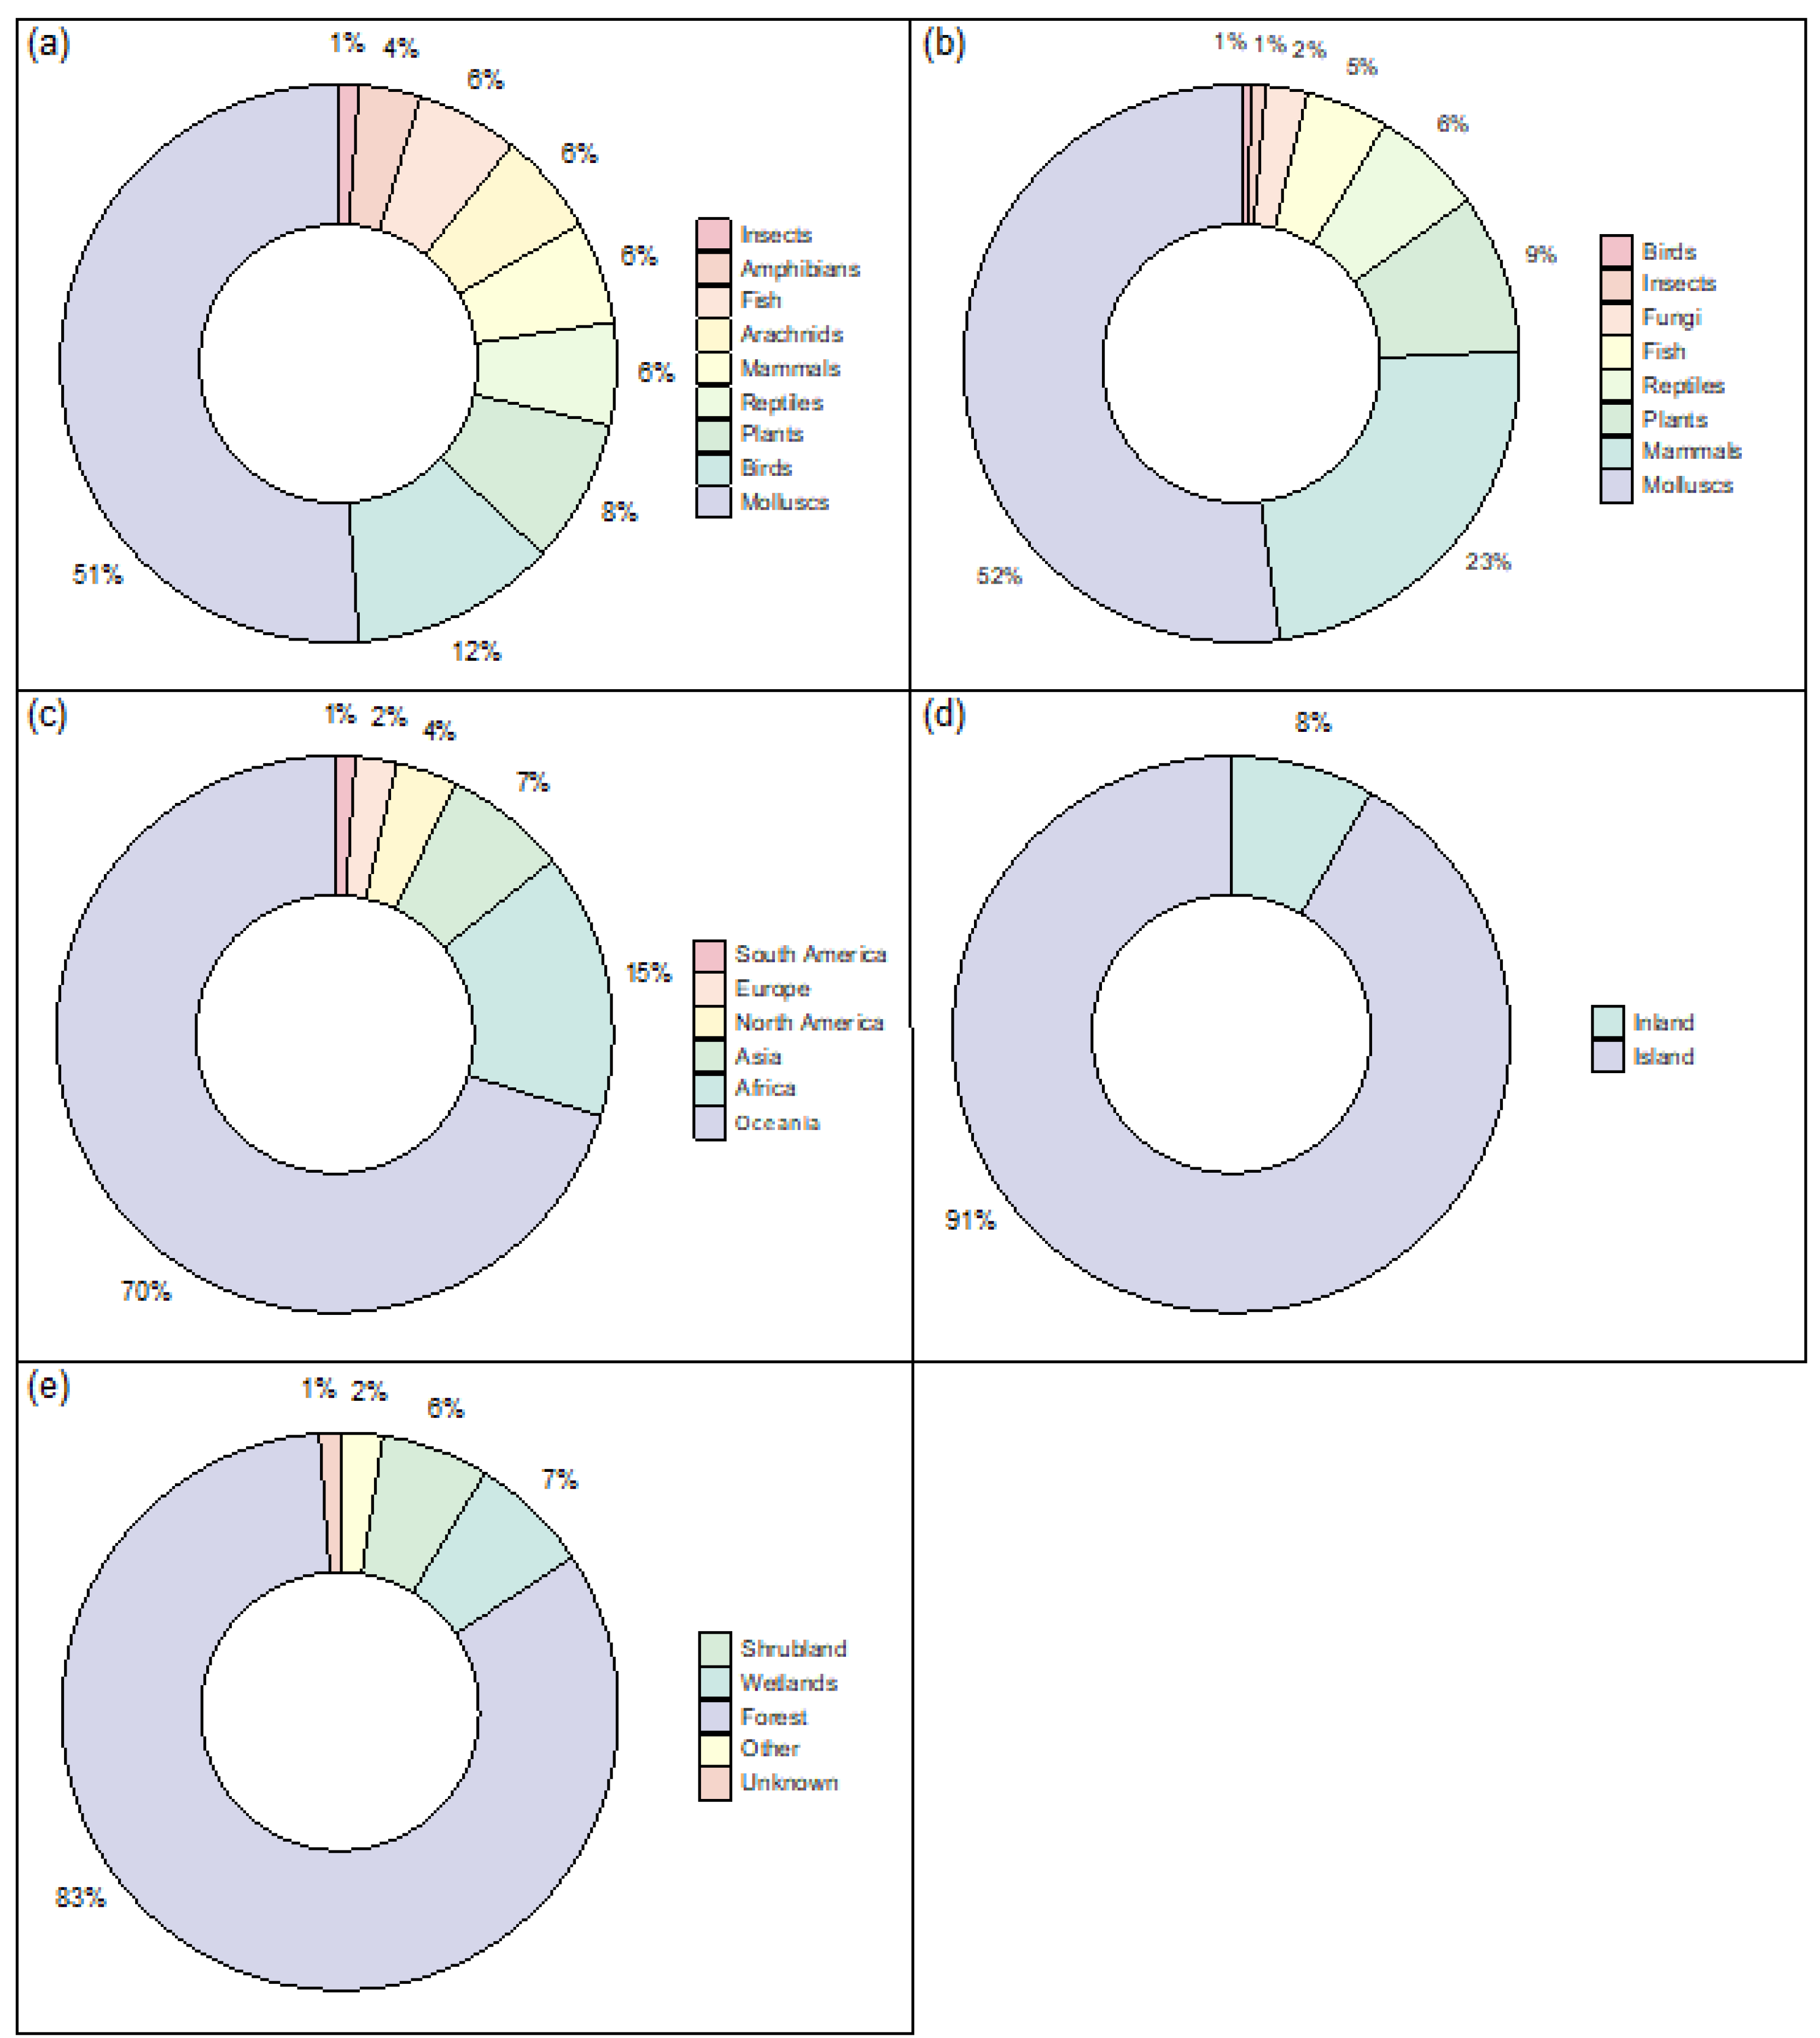
Figure 2.
(a) Proportions of extinct and extinct in the wild species (total 981 species as of XX December 2022) (i) only caused by IAS (ii) caused by multiple drivers including IAS (iii) caused by multiple drivers likely including IAS (iv) caused by multiple drivers possibly including IAS (v) caused by other factors not including IAS. (b) Proportions of other drivers associated with the extinction of species that were also caused by or associated with IAS.
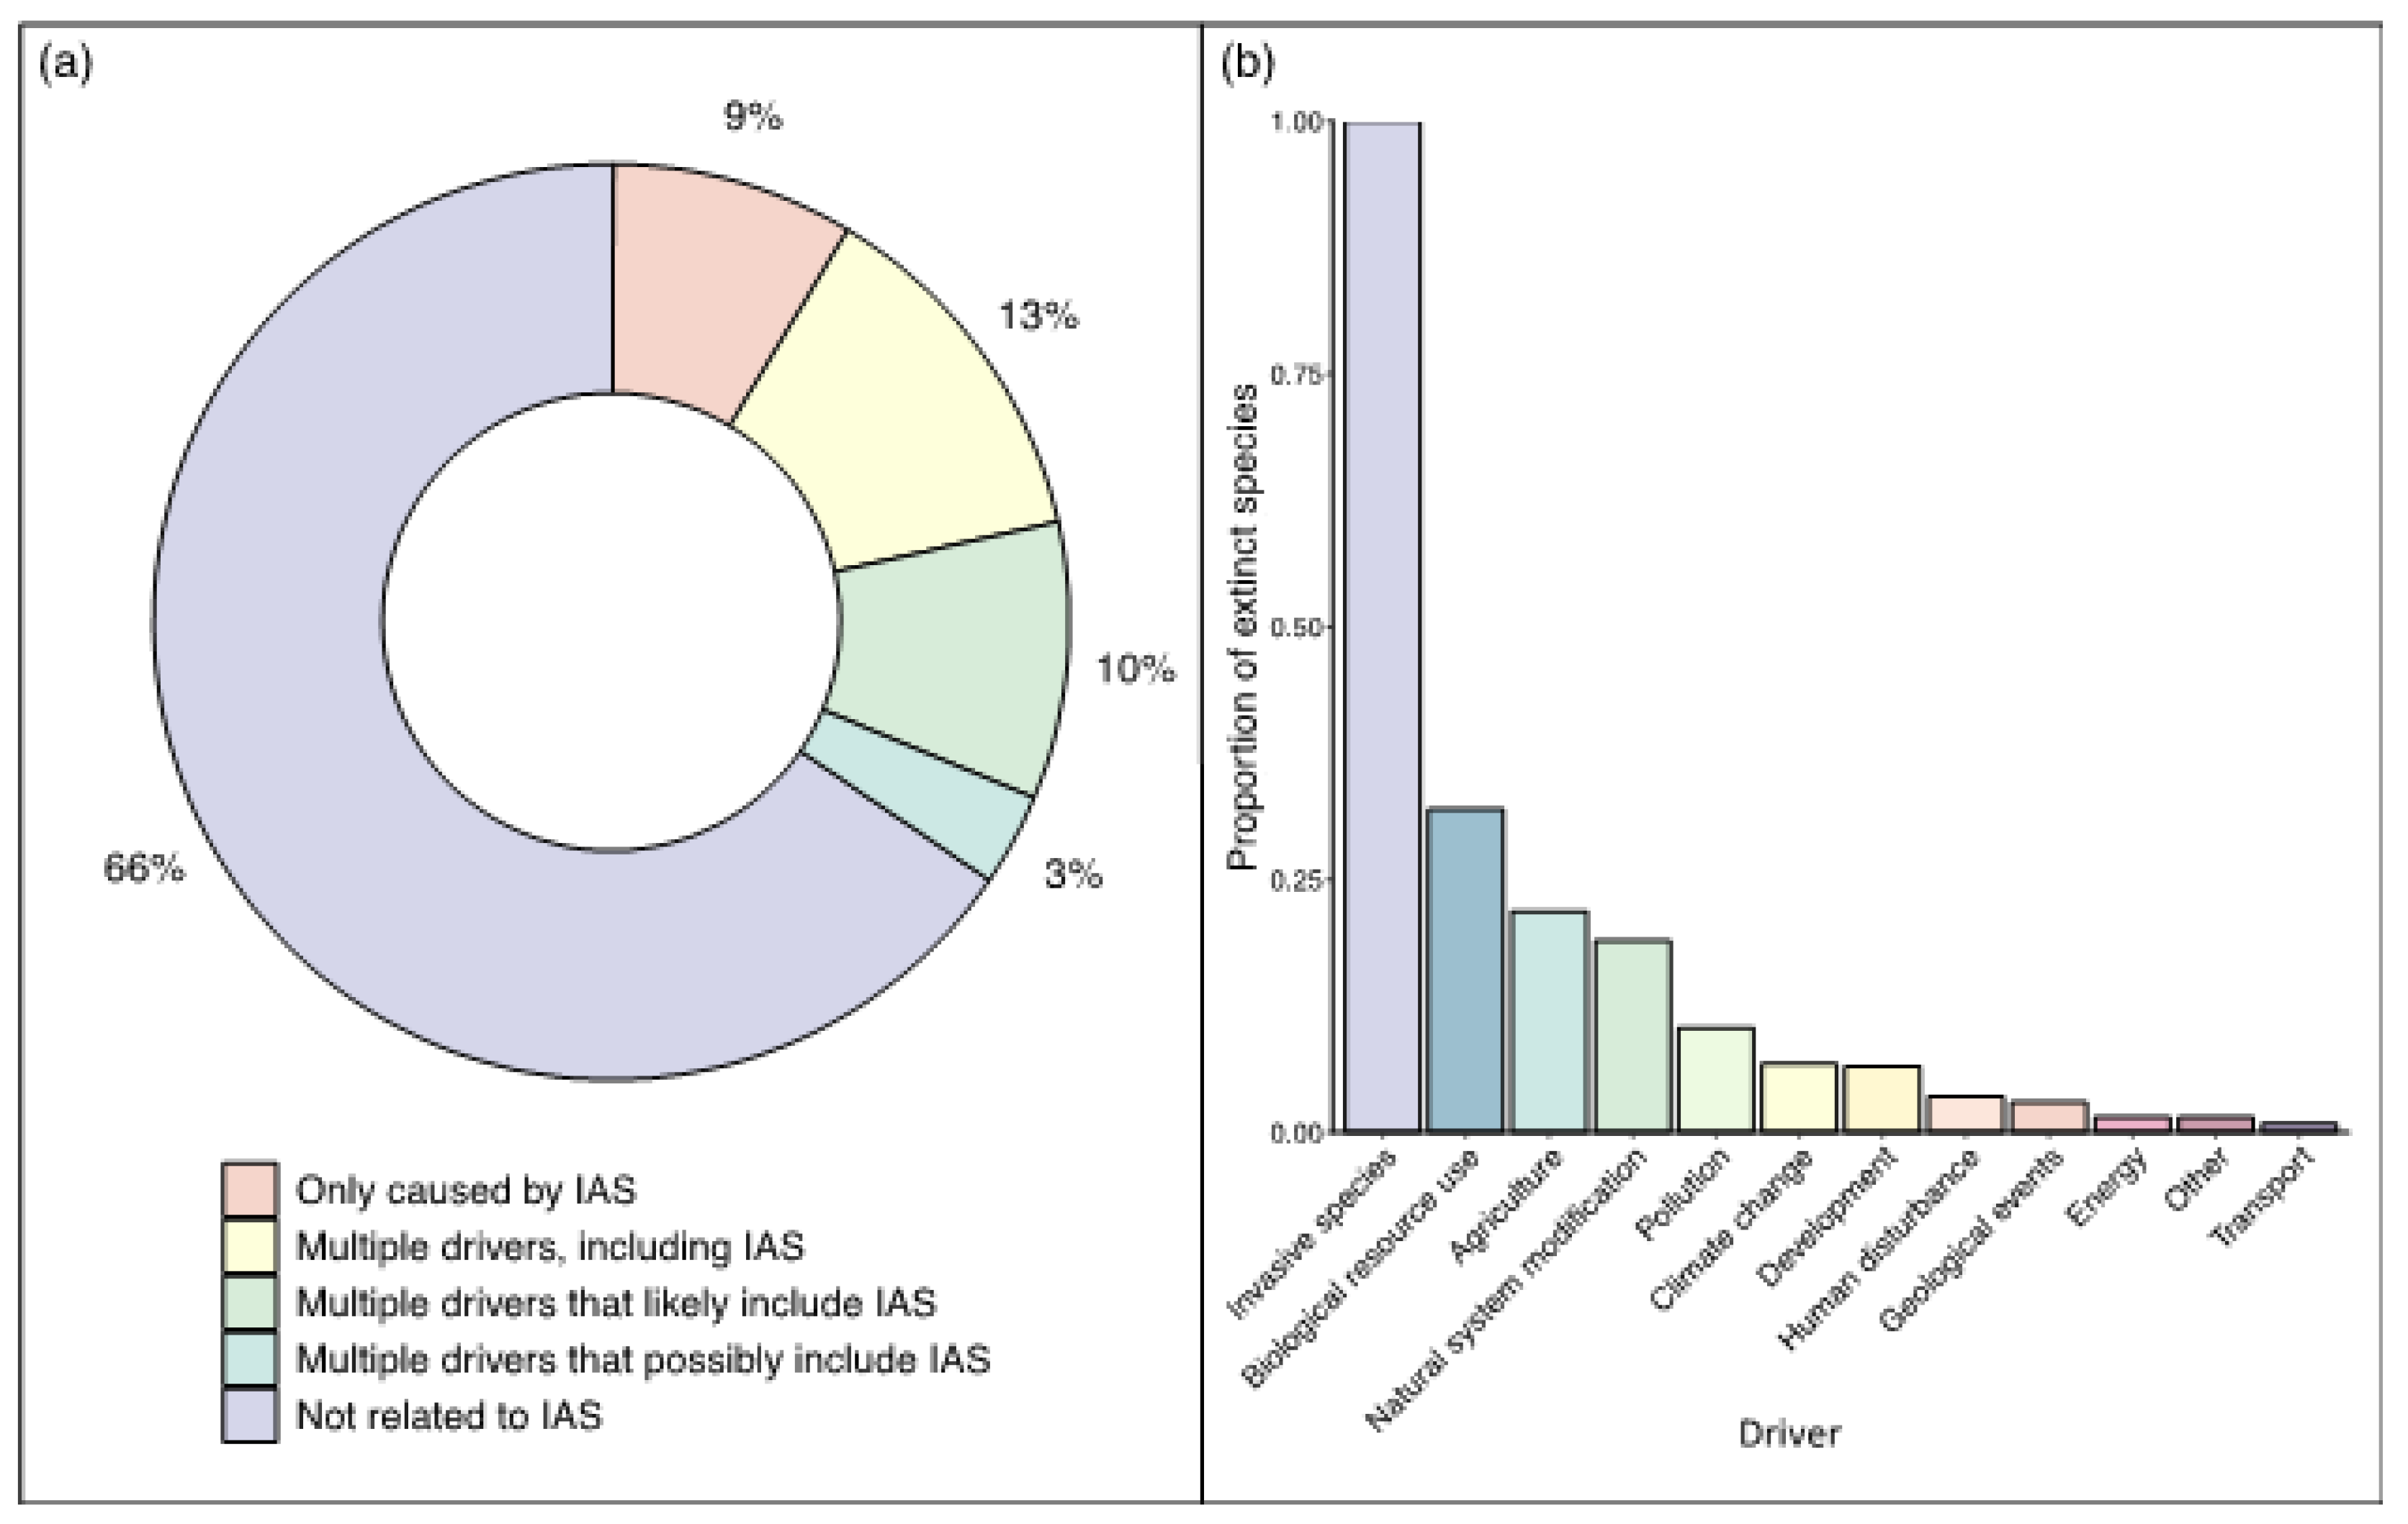
Figure 3.
(a) Network showing links between extinct species classes (left) and IAS classes (right) for all extinct and extinct in the wild species whose extinctions were only caused by IAS. Size of bars and links between higher and lower-level species classes are proportional to the number of species and number of interactions respectively. (b) Network showing links between extinct species classes (left) and IAS classes (right) for all extinct and extinct in the wild species whose extinctions were caused by multiple drivers including IAS. Size of bars and links between higher and lower-level species classes are proportional to the number of species and number of interactions respectively.
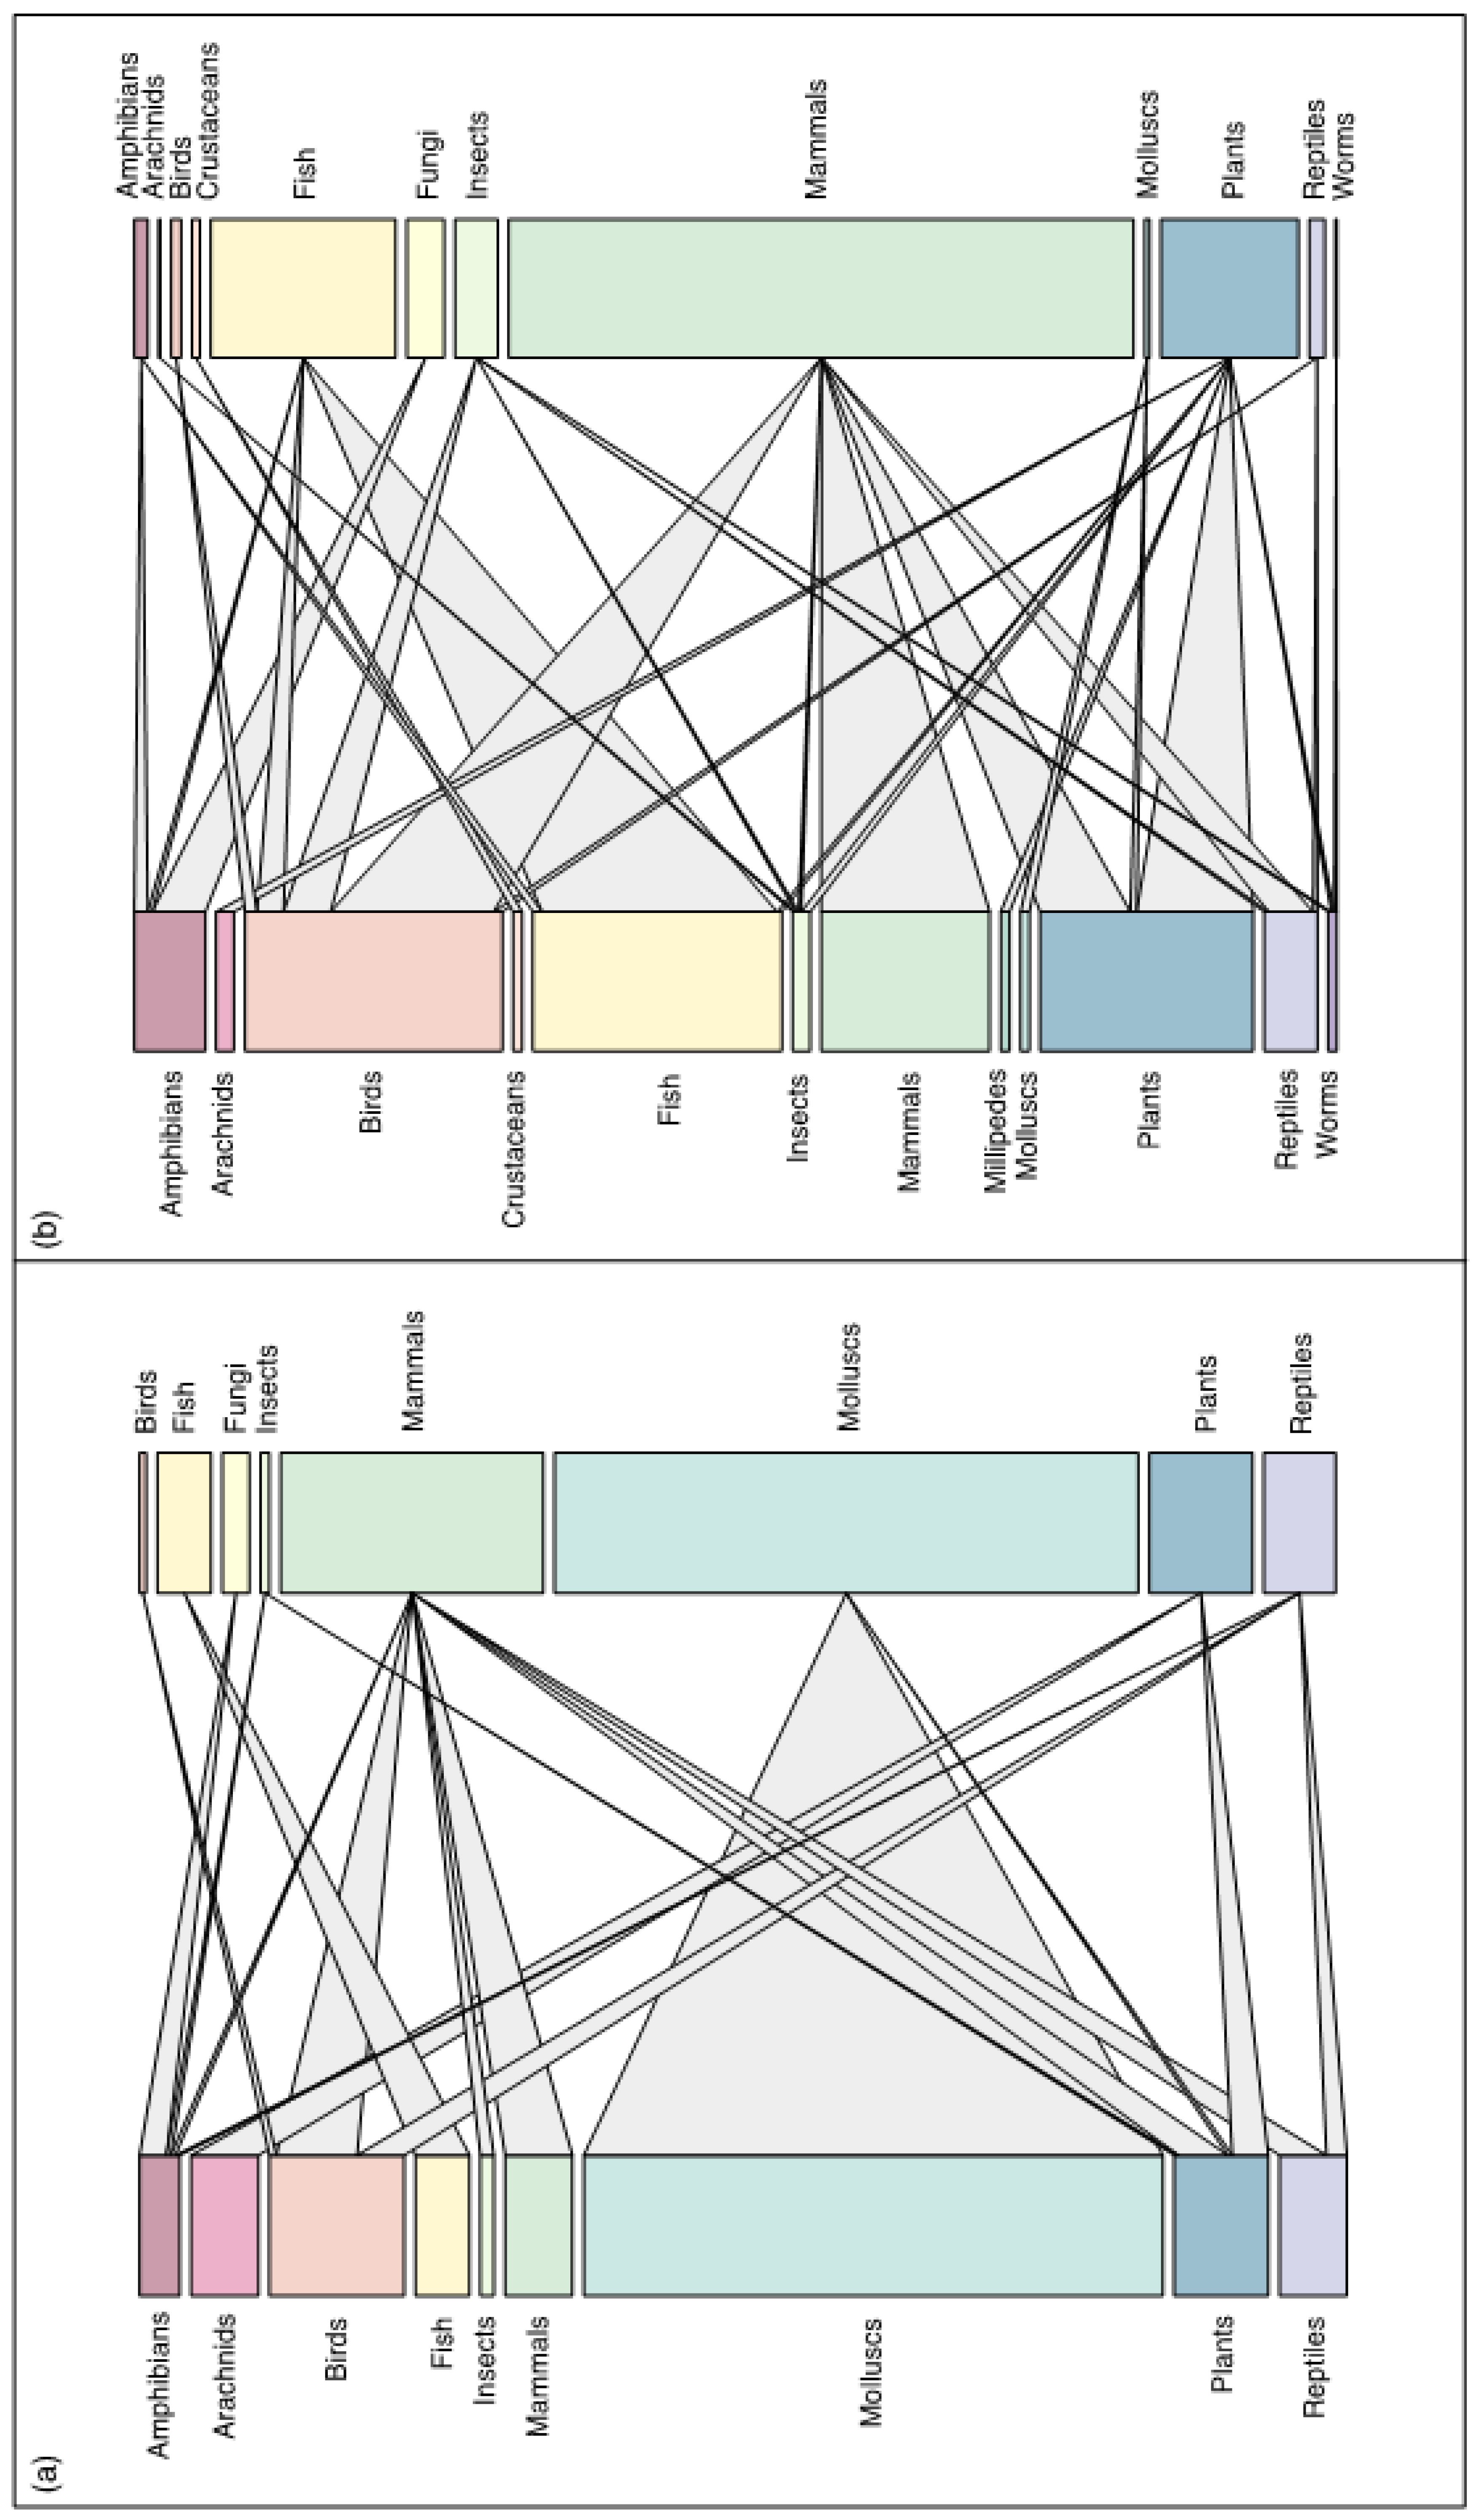
Figure 4.
Hypothetical examples to illustrate piecewise structural equation model (SEM) exploring the relationships among climate change, habitat degradation, abundance of an invasive alien species X, and abundance of two endemic species Y and Z. Arrows represent unidirectional relationships among variables. Arrows for significant positive and negative significant relationships are in black and red, respectively. Semi-transparent arrows denote non-significant paths (P ≥0.05). The thickness of the significant paths represents the magnitude of the standardised regression coefficient, given in the associated box. R2 values for component models are given in the boxes of response variable. (a) piecewise SEM showing that invasive alien species X being the sole driver to the decline of endemic species Y. (b) piecewise SEM showing that invasive alien species X has contributed to the decline of endemic species Z, but not significantly compared to other threats.
Disclaimer/Publisher’s Note: The statements, opinions and data contained in all publications are solely those of the individual author(s) and contributor(s) and not of MDPI and/or the editor(s). MDPI and/or the editor(s) disclaim responsibility for any injury to people or property resulting from any ideas, methods, instructions or products referred to in the content. |
© 2025 by the authors. Licensee MDPI, Basel, Switzerland. This article is an open access article distributed under the terms and conditions of the Creative Commons Attribution (CC BY) license (http://creativecommons.org/licenses/by/4.0/).
Copyright: This open access article is published under a Creative Commons CC BY 4.0 license, which permit the free download, distribution, and reuse, provided that the author and preprint are cited in any reuse.


