
Submitted:
04 October 2025
Posted:
06 October 2025
You are already at the latest version
Abstract
Knee osteoarthritis (OA), once considered a cartilage disorder, is now recognized as a whole-joint disease involving the cartilage, subchondral bone, synovium, ligaments, and muscles implicated by biomechanical stress, inflammation, and immune responses. Bone marrow lesions (BMLs), closely linked to pain and disease progression, represent an
important therapeutic target. Recent regenerative strategies include extracorporeal shockwave therapy (ESWT), platelet-rich plasma, autologous protein solution (APS), and mesenchymal stromal cells (MSCs), yet the optimal approach remains uncertain. This study compared ESWT alone, APS + ESWT, and intra-articular MSC + ESWT (MSC-A + ESWT) and retrospectively evaluated a newly developed combined intra-articular and intra-osseous MSC + ESWT (MSC-B + ESWT) in patients with OA and BMLs (2020–2024). Knee injury and Osteoarthritis Outcome Scores (KOOSs) at baseline, 3, and 6 months were analyzed. ESWT improved KOOS by 6 months, although with less improvement in cases with surface collapse. APS + ESWT accelerated improvement by 3 months, especially in cases without subchondral bone plate (SBP) tear. MSC-A + ESWT yielded the highest early gains but plateaued thereafter. MSC-B + ESWT showed marked improvement in SBP tear-type BMLs without collapse. Overall, ESWT was effective, APS enhanced early outcomes, and MSC-B + ESWT was promising for advanced cases.
Keywords:
knee osteoarthritis
; bone marrow lesions
; Knee injury and Osteoarthritis Outcome Score
; subchondral bone plate
; Kellgren-Lawrence grade 4
; mesenchymal stroma cells
; autologous protein solution
; combination therapy
; intra-articular administration
; intra-osseous administration
1. Introduction
Knee osteoarthritis (knee OA) was once primarily regarded as a simple cartilage disorder caused by cartilage wear or deterioration. Recent research, however, shows that it is a comprehensive joint disorder affecting multiple structures, including the subchondral bone, synovium, ligaments, and muscles, with an intricate interplay of biomechanical forces, inflammatory processes, and immune responses rather than cartilage alone [1,2]. Aso et al. [3] conducted a magnetic resonance imaging (MRI) study, finding that subchondral bone marrow lesions (BMLs), effusion-synovitis, cartilage defects, osteophytes, and meniscus extrusion were associated with knee OA pain. Specifically, BML and synovitis were independently associated with pain.
Bone marrow lesions (BMLs) stand out as a significant contributor to knee OA progression and pain. Once thought to represent bone marrow edema or necrosis, BMLs are now understood to indicate localized microfractures, disrupted bone trabecular remodeling, and heightened bone metabolic activity [4]. Zanetti et al.’s histological work [5] describes BMLs as a mix of tissue alterations, including marrow necrosis, fatty marrow, remodeled trabeculae, edema, and vascular leakage. Moreover, Aso et al. reported that increased nerve growth factor expression and osteoclast density are associated with subchondral BMLs [6]. Additionally, Li et al. [7] highlighted that BMLs are linked to pathological triggers from matrix fragments, irregular stress transfer through cartilage defects, subchondral cyst development from synovial fluid seepage, and the collapse of subchondral bone support.
BMLs are deeply involved not only in pain but also in the structural progression of knee OA. Koushesh et al. [8] proposed the osteoarthritis bone score (OABS), revealing that BML tissue characteristics, such as cyst formation, fibrosis, angiogenesis, trabecular thickening, tidemark disruption, and inflammatory cell infiltration, are mediators of OA pain. These findings underscore BMLs as a critical therapeutic target for pain and structural changes in knee OA.
Treatments for BMLs are diverse. Pharmacological approaches include bisphosphonates [9], while regenerative therapies involve biologics like platelet-rich plasma (PRP), autologous protein solution (APS), mesenchymal stromal cells (MSCs), and bone marrow aspirate concentrate (BMAC). Localized administration of growth factors, such as FGF-2 or BMP-7, has also been explored. Among physical therapies, extracorporeal shockwave therapy (ESWT) has potentially improved BMLs, contributing to subchondral bone remodeling and pain reduction [10]. Surgically, procedures like high tibial osteotomy and BML decompression are under consideration [11].
Since its establishment in 2009, our clinic (N Clinic) has primarily employed conservative treatments such as intra-articular hyaluronic acid injections and physical therapy. However, for cases with persistent pain that do not warrant surgery but are resistant to improvement, effective treatment options have been limited. In 2018, we implemented ESWT after its reported efficacy in treating osteochondral defects (OCD) or stress fractures in athletes, observing its benefits in a 40-year-old male patient with knee OA accompanied by osteonecrosis and BMLs. Since then, ESWT has been recommended for BMLs unresponsive to hyaluronic acid injections, although it has not been universally effective. Particularly, for BMLs associated with synovitis, combining ESWT with APS therapy was attempted; nonetheless, satisfactory outcomes were not achieved in all cases. Seeking greater efficacy, we introduced intra-articular MSC administration combined with ESWT in 2023. However, comparisons with APS+ESWT showed no significant benefit to justify the approximately threefold higher cost, leading to the discontinuation of this approach in the same year. Recent reports suggest that combined intra-articular and intra-osseous administration of PRP or MSCs may enhance therapeutic effects [12,13], and pairing with ESWT could promote BML repair [14]. Accordingly, in 2024, our clinic adopted a combined intra-articular and intra-osseous MSC administration combined with ESWT.
BMLs are a critical pathology reflecting early structural changes in the progression of knee OA. They are not merely bone marrow edema signals but are closely tied to subchondral bone structural failure and irreversible joint surface deformity, as demonstrated by pathological and imaging studies [15,16]. Subchondral bone plate (SBP) tear is considered a severe lesion indicating loss of subchondral bone support, directly contributing to cartilage damage and worsening pain. Additionally, joint surface collapse is associated with progressive changes, such as loss of load distribution capacity, trabecular remodeling, and bone sclerosis, serving as a key indicator of treatment response and long-term prognosis [1,17]. Comprehensive evaluation of these structural features allows for a more accurate understanding of BML severity and pathological diversity, contributing to the development of individualized treatment strategies. Aso et al. [3] reported that BMLs with SBP tear exhibit significantly increased inflammatory cell infiltration, fibroblast proliferation, angiogenesis, osteoclast activity, and abnormal cartilage formation, leading to elevated OABS scores (Figure 1a and b).
These findings indicate that SBP tear plays a decisive role in BML severity and pain mechanisms, suggesting its importance as a pathological marker in designing knee OA treatment strategies based on BMLs. Consequently, in our conservative treatment strategies targeting subchondral bone, we have prioritized the presence or absence of SBP tear and joint surface collapse (Figure 2a,b and Figure 3a,b).
These insights stem from our clinic’s experience with conservative treatments such as ESWT. We have recognized that ESWT is not universally effective for all BML cases, particularly showing limited efficacy in severe BMLs with SBP tear. However, we have observed numerous cases where long-term, repeated ESWT applications led to pain relief and structural improvements, such as BML reduction. Upon re-evaluating MRI scans of cases with poor outcomes, it became evident that many exhibited joint surface collapse at initial diagnosis or during treatment, leading us to conclude that the presence or absence of joint surface collapse is a critical structural marker for treatment selection and prognosis evaluation.
2. Subjects and Methods
Subjects
This study evaluated patients who received one of three treatments, with Knee injury and Osteoarthritis Outcome Score (KOOS) assessments conducted before treatment and at 3 and 6 months post-treatment: extracorporeal shockwave therapy alone (ESWT alone), autologous protein solution combined with ESWT (APS + ESWT), and intra-articular mesenchymal stromal cell administration paired with ESWT (MSC-A + ESWT)
The ESWT alone group included patients who completed treatment within 3 months. For the APS + ESWT and MSC-A + ESWT groups, only patients with 6-month follow-up data were included. Using pre- and post-treatment KOOS scores, we analyzed changes within each treatment group, compared outcomes across groups, and examined treatment effects based on BML severity, specifically the presence or absence of SBP tear and joint surface collapse.
To ensure a consistent comparison across the three treatments, the analysis focused solely on cases with SBP tear but no joint surface collapse.
2.1. ESWT Alone
2.1.1. Patients and Indications
Patients diagnosed with knee OA who showed no improvement following intra-articular hyaluronic acid injections and had confirmed BMLs on MRI were deemed eligible for ESWT. The study included 40 patients (41 knees; 15 men, 25 women; mean age of 65.4 ± 9.2 years) who underwent three or more ESWT sessions (number of knees initially treated: 72) between September 2020 and March 2022, with KOOS evaluations at baseline, 3 months, or 6 months. Kellgren-Lawrence grade (KL) grades were distributed as follows: KL2: eight knees, KL3: 20 knees, KL4: 13 knees. SBP tear was present in 13 knees and absent in 28 knees; joint surface collapse was present in six knees and absent in 35 knees. Among these, 21 knees (KL2: two, KL3: 12, KL4: seven; SBP tear present: eight, absent: 13; joint surface collapse present: three, absent: 18) had KOOS evaluations at all three time points (baseline, 3 months, and 6 months).
2.1.2. ESWT Treatment Procedure
The treatment targeted pain sites corresponding to BML locations identified in the femoral condyle or tibial plateau. The DUOLITH SD1 (STORZ MEDICAL, Tägerwilen, Switzerland) was used. After identifying BML sites via MRI, the patient’s knee was maximally flexed, and an ultrasound probe was used to locate areas of cartilage thinning to determine the irradiation target. The handpiece was held perpendicularly, with output increased up to 0.25 mJ/mm2 within the patient’s pain tolerance, and the entire lesion was irradiated three-dimensionally. The standard protocol involved 2,500 shots at 4 Hz, administered at 2-week intervals for a minimum of three sessions. Additional sessions were added every 2–4 weeks if improvement was insufficient. The average number of sessions was 4.4 (±1.3) for cases followed up for 3 months and 6.0 (±2.4) for those followed up for 6 months.
2.2. APS+ESWT
2.2.1. Patients and Indication
Patients showing no improvement after five intra-articular hyaluronic acid injections, with synovitis and BML confirmed on MRI, were included. From 2020 to 2023, 47 patients (54 knees; 12 men, 35 women; mean age: 69.8 ± 10.2 years) who received APS + ESWT and had KOOS evaluations at baseline, 3 months, and 6 months were studied. The distribution was KL2: nine knees, KL3: 15 knees, and KL4: 30 knees; SBP tear was present in 30 knees, absent in 24 knees, while joint surface collapse was present in eight knees, absent in 46 knees.
2.2.2. APS Preparation and Administration Procedure
APS (Autologous Protein Solution) was prepared using the nSTRIDE APS kit (Zimmer Biomet, Warsaw, IN, USA) as follows.
- Blood collection: 55 mL of blood was mixed with 4 mL of anticoagulant (citrate dextrose solution A, Citra Labs, MA, USA).
- Centrifugation: The nSTRIDE cell separator was used at 3200 rpm for 15 min to isolate approximately 6 mL of PRP.
- Concentration: The PRP was transferred to the nSTRIDE concentrator, processed with polyacrylamide beads, and centrifuged at 2000 rpm for 2 min to yield 2–3 mL of APS.
During APS preparation, ESWT was administered with 3,500 shots. After preparation, APS was injected intra-articularly under ultrasound guidance. If joint effusion was present, aspiration was performed beforehand. ESWT was administered by standard protocol at least three times at 2-week intervals. The average number of ESWT sessions following APS administration was 7.0 (±3.2).
2.3. MSC-A+ESWT
2.3.1. Patients and Indication
Seeking enhanced therapeutic outcomes beyond APS + ESWT, MSC-A + ESWT was conducted from April to December 2023. Of 22 knees, 12 (16 knees; five men, seven women; mean age 72.2 ± 10.6 years) with 6-month follow-up data were analyzed. The distribution was KL2: one knee, KL3: four knees, and KL4: 11 knees; SBP tear was present in 14 knees, absent in two knees, while joint surface collapse was present in four knees, absent in 12 knees.
2.3.2. MSC Preparation and Administration Procedure
Adipose tissue was collected and transported refrigerated to a cell processing center, where it underwent enzymatic treatment to isolate stem cells, followed by subculturing for proliferation. Cells passing sterility tests were collected, cryopreserved, thawed, washed, and dispensed into syringes for use. In this study, 100 million cells were prepared and injected intra-articularly under ultrasound guidance. ESWT was administered by standard protocol immediately before and three times at 2-week intervals after MSC administration, followed by additional sessions every 4 weeks. The average number of ESWT sessions post-MSC administration was 7.5 (±3.5).
2.4. Combined Intra-Articular and Intraosseous MSC Administration with ESWT (MSC-B + ESWT)
Drawing from the results of studies I–III, we initiated a novel treatment in 2024 combining MSC delivery into the joint and bone with ESWT, referred to as MSC-B + ESWT (Figure 8). This approach was developed due to: (1) certain BML cases showing no response to ESWT alone; (2) the separate progression of joint-related issues (like synovitis) and BML, requiring distinct interventions; (3) the limited impact of intra-articular MSC on bone lesions; and (4) the potential for MSC to penetrate bone via SBP tear sites, enhancing the repair of SBP damage and bone lesions when paired with ESWT [18,19]. Philippe Hernigou et al. found that intraosseous MSC or BMAC delivery supports long-term subchondral bone repair and pain reduction [20], while Diego Delgado et al. highlighted the benefits of combined intra-articular and intraosseous administration [21]. Based on these insights, our facility introduced MSC-B + ESWT.
Figure 4.
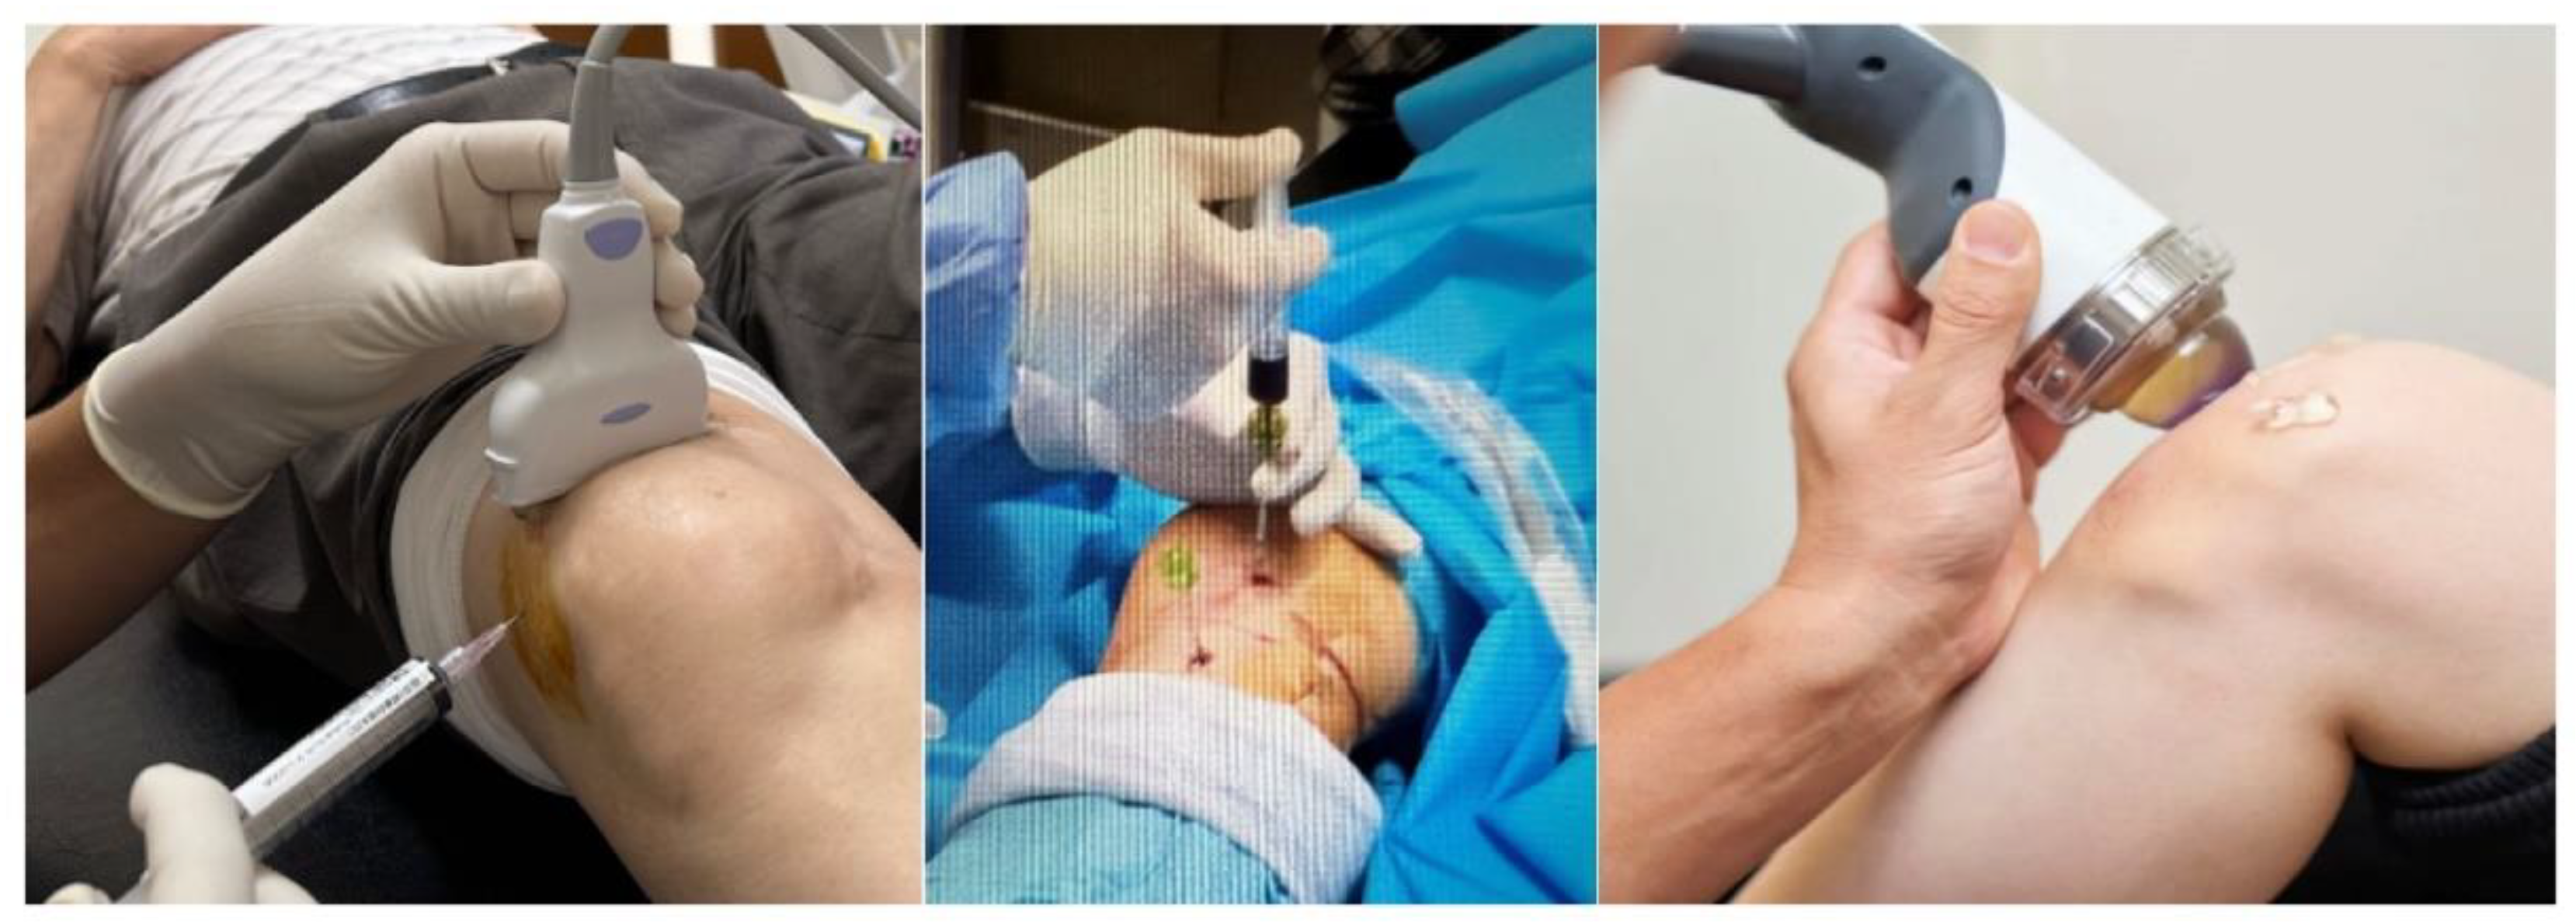
MSC Intra-articular and Intraosseous Administration in Combination With ESWT. Left: Intra-articular injection of MSCs (adipose-derived stromal cells). Central: Intraosseous administration of MSCs (intramedullary cavity). Right: Focused extracorporeal shock wave therapy (ESWT). If there is a tear in the SBP but no articular surface collapse, the combination of MSC and ESWT may be possible to repair bone lesions and SBP tears from the medial and lateral articular surfaces.
Figure 4.
MSC Intra-articular and Intraosseous Administration in Combination With ESWT. Left: Intra-articular injection of MSCs (adipose-derived stromal cells). Central: Intraosseous administration of MSCs (intramedullary cavity). Right: Focused extracorporeal shock wave therapy (ESWT). If there is a tear in the SBP but no articular surface collapse, the combination of MSC and ESWT may be possible to repair bone lesions and SBP tears from the medial and lateral articular surfaces.
2.4.1. Procedure for MSC-B + ESWT
Preoperative MRI was used to map BML, bone cysts, and SBP tear sites, guiding the selection of insertion points, angles, and depths for intraosseous MSC delivery. The procedure started with ESWT (3,500 shots) aimed at the BML zone for preconditioning, followed by a blend of nerve block, local, and intravenous anesthesia. In medial knee OA, Doppler ultrasound locates arteries near the medial superior and inferior genicular nerves for anesthesia, supplemented by local numbing. Once anesthesia was confirmed, a needle (Arthrex, featuring a tip and side holes) was inserted under X-ray fluoroscopy per the planned trajectory. With the needle’s side holes facing the joint surface, its position was verified, and the inner core was removed to relieve intraosseous pressure for about 5 min. During this time, MSC was administered into the joint under ultrasound guidance, followed by gradual intraosseous MSC injection. To ensure MSC retention in the bone, a whole blood-thrombin mix from Arthrex’s thrombin kit was injected. For cases with BML in the femoral condyle and medial tibia, the process was applied to both areas. After injection, the site was compressed to prevent leakage, and patients rested for roughly 1 h before leaving.
The following day, the wound was checked, and an additional ESWT session (3,500 shots) was performed. ESWT was administered by standard protocol for biweekly sessions thereafter, averaging 12.9 (±3.4) sessions post-intraosseous MSC administration.
2.5. Statistical Analysis
Pre- and post-treatment KOOS scores were compared using paired t-tests. Differences in KOOS Improvements (Improvement Value, IV) between treatment groups were assessed with unpaired t-tests. Statistical significance thresholds were set at p < 0.05, p < 0.01, and p < 0.001. All analyses were conducted using Microsoft Excel 2016 (Microsoft Corp., Redmond, WA, USA).
3. Results
3.1. Baseline Characteristics of All Patients (Table 1)
Table 1 presents data for all patients included in the study. The ESWT alone group comprised 40 patients (41 knees), the APS+ESWT group included 47 patients (54 knees), and the MSC-A+ESWT group consisted of 12 patients (16 knees). The mean ages were 65.4±9.2, 69.8±10.2, and 72.2±10.6 years, respectively. Sex distribution (M: F) was 15:25 in the ESWT alone group, 12:35 in the APS+ESWT group, and 5:7 in the MSC-A+ESWT group. KL grade distribution (2:3:4) was 8:20:13 in the ESWT alone group, 9:15:30 in the APS+ESWT group, and 1:4:11 in the MSC-A+ESWT group. SBP tear (present: absent) was observed as 13:28 in the ESWT alone group, 30:24 in the APS+ESWT group, and 14:2 in the MSC-A+ESWT group. Joint surface collapse (present: absent) was documented as 6:35 in the ESWT alone group, 8:46 in the APS+ESWT group, and 4:12 in the MSC-A+ESWT group. The number of ESWT sessions was 4.4±1.3 over 3 months in the ESWT alone group, 6.0±2.4 over 6 months in the APS+ESWT group, and 7.5±3.5 over 6 months in the MSC-A+ESWT group. All treatment groups received therapy at 2–4 week intervals.
3.2. ESWT Alone
3.2.1. Assessment at 3 Months (n = 41)
The overall KOOS score (AVG) improved from 51.0 ± 17.3 pretreatment to 69.0 ± 19.5 at 3 months, with an improvement (IV, pre-3M) of 18.1 ± 16.6: SBP tear-present group (n = 13): KOOS score significantly improved from 52.4 ± 19.8 at pretreatment to 64.0 ± 18.7 at 3 months (IV, pre-3M = 11.6 ± 16.4) (p = 0.024 < 0.05).
In the SBP tear-absent group (n =28), the KOOS score improved from 50.3 ± 16.3 at pretreatment to 71.3 ± 19.7 (IV, pre-3M = 21.0 ± 16.1) at 3 months, which was highly significant (p = 0.00000002 < 0.001).
No significant difference in IV (pre-3M) was found between the SBP-tear present and absent groups (p = 0.09 > 0.05) (Figure 5a).
In the joint surface collapse present group (n = 6), the KOOS score improved from 58.2 ± 11.6 at pretreatment to 59.4 ± 15.7 (IV, pre-3M = 1.3 ± 7.2) at 3 months, with no significant difference observed.
In the joint surface collapse absent group (n = 35), the KOOS score improved from 49.7 ± 17.9 at pretreatment to 70.7 ± 19.8 (IV, pre-3M = 20.9 ± 16.1) at 3 months with a significant improvement (p <0.05).
A significant difference in IV (pre-3M) was found between groups of patients having and not having joint surface collapse (p = 0.0058 < 0.01) (Figure 5b).
3.2.2. Assessment at 6 Months (n = 21)
The overall KOOS score improved from 54.1 ± 20.4 pretreatment to 64.9 ± 20.6 at 3 months and 70.7 ± 16.2 at 6 months.
Improvements were IV (pre-3 months) = 10.9 ± 12.0, IV (3—6 months) = 5.7 ± 13.1, and IV (pre-6 months) = 16.6 ± 14.0.
- SBP tear-present group (n=10): Pretreatment: 54.2 ± 21.4: 3 months: 63.8 ± 10.3; 6 months: 70.6 ± 16.5.
- Improvements were IV (pre-3 months) = 9.6 ± 12.2, IV (3–6 months) = 6.8 ± 9.7; IV (pre-months) = 16.4 ± 14.2.
- SBP tear-absent group (n=11): Pretreatment: 54.0 ± 20.5; 3 months: 66.0 ± 22.6; 6 months: 70.7 ± 16.8.
- Improvements were IV (pre-3 months) = 12.0 ± 14.0, IV (3–6 months) = 4.7 ± 16.0, IV (pre-6 months) = 16.7 ± 14.5.
- No significant differences were observed between the SBP tear present and absent groups at 3 months (p = 0.686 > 0.05) or 6 months (p = 0.961 > 0.05).
- Joint surface collapse present group (n = 3): Pretreatment: 55.5 ± 10.6; 3 months: 56.0 ± 10.2; 6 months: 59.9 ± 12.0.
- Improvements were IV (pre-3 months) = 0.5 ± 6.1, IV (3–6 months) = 3.9 ± 1.8, IV (pre-6 month = 4.4 ± 6.5.
- Joint surface collapse absent group (n = 18): Pretreatment: 53.8 ± 21.8; 3 months: 66.4 ± 21.7; 6 months: 72.5 ± 16.4.
- Improvements were IV (pre-3 months) = 12.6 ± 13.0, IV (3–6 months) = 6.0 ± 14.2, IV (pre-6 months) = 18.6 ± 13.9.
Patients in the joint surface collapse absent group showed significant improvement at 6 months (p<0.05).
Figure 6a (case 1) shows sagittal MRI images of the knee before and 1 year after treatment with ESWT. A large BML was evident before treatment. After 13 ESWT sessions over 1 year, the BML area was markedly reduced. In addition, the previously torn SBP appeared repaired, and the thickness of the articular cartilage layer increased. These findings suggest that ESWT may exert structural improvements in the subchondral bone and the articular cartilage.
The knee in Figure 6b (case 2) underwent a total of 50 ESWT sessions (once per month) from 2019. The left image shows the coronal MRI before treatment, and the right image shows the MRI after 5 years of therapy. While bone sclerosis was evident before treatment, the long-term images demonstrated not only improvement of sclerosis but also a clear thickening of the articular cartilage layer, as indicated by the yellow arrows. These findings suggest that long-term ESWT may contribute to cartilage protection and regeneration.
3.3. APS+ESWT (n = 54)
The overall KOOS score improved from 45.4 ± 16.5 pretreatment to 59.4 ± 20.3 at 3 months and 62.0 ± 20.7 at 6 months.
Improvements were IV (pre-3 months) = 13.9 ± 13.5, IV (3–6 months) = 2.7 ± 9.5, IV (pre-6 months) = 16.6 ± 15.6.
- SBP tear-present group (n = 30): Pretreatment: 42.0 ± 14.7; 3 months: 52.4 ± 19.1; 6 months: 55.0 ± 19.8.
- Improvements were IV (pre-3 months) = 10.4 ± 13.3, IV (3–6 months) = 2.6 ± 9.7, IV (pre-6 months) = 13.0 ± 15.2.
- SBP tear-absent group (n = 24): Pretreatment: 49.7 ± 17.9; 3 months: 68.1 ± 18.6; 6 months: 70.8 ± 18.6.
- Improvements were IV (pre-3 months) = 18.4 ± 12.7, IV (3–6 months) = 2.7 ± 9.4, IV (pre-6 months) = 21.1 ± 15.3.
- At 3 months, the SBP tear-absent group showed significantly greater improvement (p = 0.029 < 0.05). No significant difference was observed at 6 months.
- Joint surface collapse present group (n = 8): Pretreatment: 34.8 ± 8.8; 3 months: 47.0 ± 12.1;6 months: 47.8 ± 13.1.
- Improvements were IV (pre-3 months) = 12.2 ± 13.5, IV (3–6 months) = 0.8 ± 14.3, IV (pre-6 months) = 13.0 ± 17.4.
- Joint surface collapse absent group (n = 46): Pretreatment: 47.3 ± 16.9; 3 months: 61.5 ± 20.7; 6 months: 64.5 ± 20.8.
Improvements were IV (pre-3 months) = 14.2 ± 13.6, IV (3–6 months) = 3.0 ± 8.6, IV (pre-6 months) = 17.2 ± 15.4.
No significant differences were observed between patients having and not having joint surface collapse at 3 or 6 months.
3.3. MSC-A+ESWT (n = 16)
The overall KOOS score improved from 52.0±18.3 pretreatment to 63.6±19.5 at 3 months and 61.3±18.9 at 6 months.
Improvements were IV (pre-3 months) = 11.6±11.8, IV (3–6 months) = -2.3±9.0, IV (pre-6 months) = 9.3±12.5.
- SBP tear-present group (n = 14): Pretreatment: 47.0±12.5; 3 months: 60.9±18.1; 6 months: 58.1±17.9.
- Improvements were IV (pre-3 months) = 13.9±10.1, IV (3–6 months) = -2.8±7.8, IV (pre-6 months) = 11.1±12.2.
- SBP tear-absent group (n = 2): Pretreatment: 87.4±11.6; 3 months: 82.7±24.5; 6 months: 84.1±4.7.
- Improvements were IV (pre-3 months) = -4.7±12.9, IV (3–6 months) = 1.4±19.8, IV (pre-6 months) = -3.3±6.9.
- At 3 months, the SBP tear present group showed significantly greater improvement (p = 0.032 < 0.05). At 6 months, no significant difference was observed.
- Joint surface collapse present group (n = 4): Pretreatment: 42.6±12.8; 3 months: 47.5±12.8; 6 months: 39.3±9.8.
- Improvements were IV (pre-3 months) = 4.9±7.4, IV (3–6 months) = -8.2±3.8, IV (pre-6 months) = -3.3±5.2.
- Joint surface collapse absent group (n = 12): Pretreatment: 55.2 ± 19.2; 3 months: 69.0 ± 18.7; 6 months: 68.7 ± 15.0.
Improvements were IV (pre-3 months) = 13.8±12.4, IV (3–6 months) = -0.3±9.5, IV (pre-6 months) = 13.5±11.4.
At 6 months, improvement was significantly greater in the group without joint surface collapse (p = 0.014 < 0.05).
3.4. Comparison of Three Groups (ESWT Alone, APS + ESWT, MSC-A + ESWT) Under Consistent Conditions (SBP Tear Present, No Joint Surface Collapse)
To facilitate a more rigorous comparison, we acknowledged that the backgrounds of the patients in groups I, II, and III were not uniform. Therefore, the analysis was limited to cases that, on MRI, met the specific criteria of having an SBP tear but no evidence of joint surface collapse. This stratification allowed for a more precise evaluation of the therapeutic effects of each treatment on a specific pathological condition.
Table 2 presents a subgroup analysis of patients with SBP tear but without joint surface collapse. This subgroup included eight patients (eight knees) in the ESWT alone group, 20 patients (22 knees) in the APS+ESWT group, and seven patients (10 knees) in the MSC-A+ESWT group. The mean ages were 64.1±8.7, 69.9±8.1, and 71.1±13.0 years, respectively. Sex distribution (M: F) was 4:4 in the ESWT alone group, 4:16 in the APS+ESWT group, and 4:3 in the MSC-A+ESWT group. KL grade distribution (3:4) was 4:4 in the ESWT alone group, 4:18 in the APS+ESWT group, and 4:7 in the MSC-A+ESWT group. All patients in this subgroup had SBP tear, and none had joint surface collapse. The number of ESWT sessions in 6 months was 6.5±2.6 in the ESWT alone group, 4.8±3.8 in the APS+ESWT group, and 8.1±3.8 in the MSC-A+ESWT group. All treatment groups received therapy at 2–4 week intervals.
- ESWT alone: Pretreatment: 50.0 ± 22.2; 3 months: 59.0 ± 18.6; 6 months: 65.8 ± 14.7.
- Improvement values were IV (pre-3 months) = 9.0 ± 13.8, IV (3–6 month) = 6.8 ± 11.0, IV (pre-6 months) = 15.8 ± 16.0.
- Improvement at 3 months was not significant (p = 0.107 > 0.05), but a significant difference was observed at 6 months (p = 0.027 < 0.05).
- APS + ESWT: Pretreatment: 44.6 ± 15.7;3 months; 54.4 ± 21.0; 6 months: 57.6 ± 21.4.
- Improvement values were IV (pre-3 months) = 9.7 ± 13.4, IV (3—6 months) = 3.3 ± 7.7, IV (pre-6 months) = 13.0 ± 14.7.
- Significant differences were observed between pretreatment and 3 months (p = 0.0027 < 0.01) and between pretreatment and 6 months (p = 0.00047 < 0.001).
- MSC-A + ESWT: Pretreatment: 48.8 ± 12.6; 3 months: 66.2 ± 17.6; 6 months: 65.6 ± 14.5.
Improvement values were IV (pre-3 months) = 17.5 ± 8.9, IV (3—6 months) = -0.6 ± 8.1, IV (pre-6 months) = 16.8 ± 8.9.
Significant improvements were observed between pretreatment and 3 months (p = 0.00016 < 0.001) and between pretreatment and 6 months (p = 0.00021 < 0.001).
KOOS score changes in cases with SBP rupture without joint surface collapse are shown in Figure 7a.
This figure demonstrates longitudinal changes in KOOS scores in patients with SBP tear but without joint surface collapse. All groups showed improvement after treatment. The MSC-A + ESWT group exhibited the most significant improvement at 3 months; however, further gain by 6 months was limited. In contrast, the ESWT alone and APS + ESWT groups showed more gradual improvement, narrowing the gap with the MSC-A group at 6 months. These findings suggest that while MSC-A administration contributes to rapid short-term improvement, differences compared with other groups diminish in the mid-term.
Figure 7b compares improvement values (IV) among treatment groups in patients with SBP tear but without joint surface collapse. The MSC-A+ESWT group showed the greatest improvement at 3 months (17.5 points); however, additional improvement between 3 and 6 months was limited, resulting in a plateau. In contrast, the ESWT alone and APS+ESWT groups showed gradual improvement, with total 6-month IVs of 15.8, 13.0, and 16.8, respectively, with no significant differences among the three groups. These findings suggest that MSC-A administration provides a marked short-term benefit but converges to a comparable level of improvement with ESWT alone and APS+ESWT in the mid-term.
3.5. Short-Term Clinical Outcomes MSC-B + ESWT
MSC-B was applied to KL4 knee OA cases, and nine knees from nine patients (two males, seven females, with an average age of 71.1 ± 8.5 years) were followed for at least 6 months using KOOS scores. SBP tear was present in all cases, and four knees also had joint surface collapse. In the entire MSC-B cohort (n = 9), KOOS scores rose from 45.7 ± 16.7 before treatment to 57.3 ± 16.3 at 3 months and 56.9 ± 18.6 at 6 months, with IV (pre-3M) = 11.6 ± 15.4, IV (3M-6M) = -0.4 ± 8.6, and IV (pre-6M) = 11.2 ± 16.8. In the joint surface collapse group (n = 4), KOOS scores shifted from 43.8 ± 11.3 pretreatment to 51.7 ± 10.4 at 3 months and 48.5 ± 12.9 at 6 months, with improvement values of IV (pre-3M) = 7.9 ± 15.6, IV (3M-6M) = -3.2 ± 7.6, and IV (pre-6M) = 4.7 ± 13.0. In the group without joint surface collapse (n = 5), KOOS scores improved from 47.2 ± 21.4 pretreatment to 61.8 ± 19.9 at 3 months and 63.6 ± 21.0 at 6 months, with improvement values of IV (pre-3M) = 14.6 ± 16.4, IV (3M-6M) = 1.8 ± 9.5, and IV (pre-6M) = 16.4 ± 19.0. The small sample size prevented statistical significance, but the group without collapse displayed a more pronounced improvement trend. Some patients also regained the ability to engage in activities like golf, tennis, basketball, and aerobics, which were restricted before treatment.
3.5.1. Case Reports
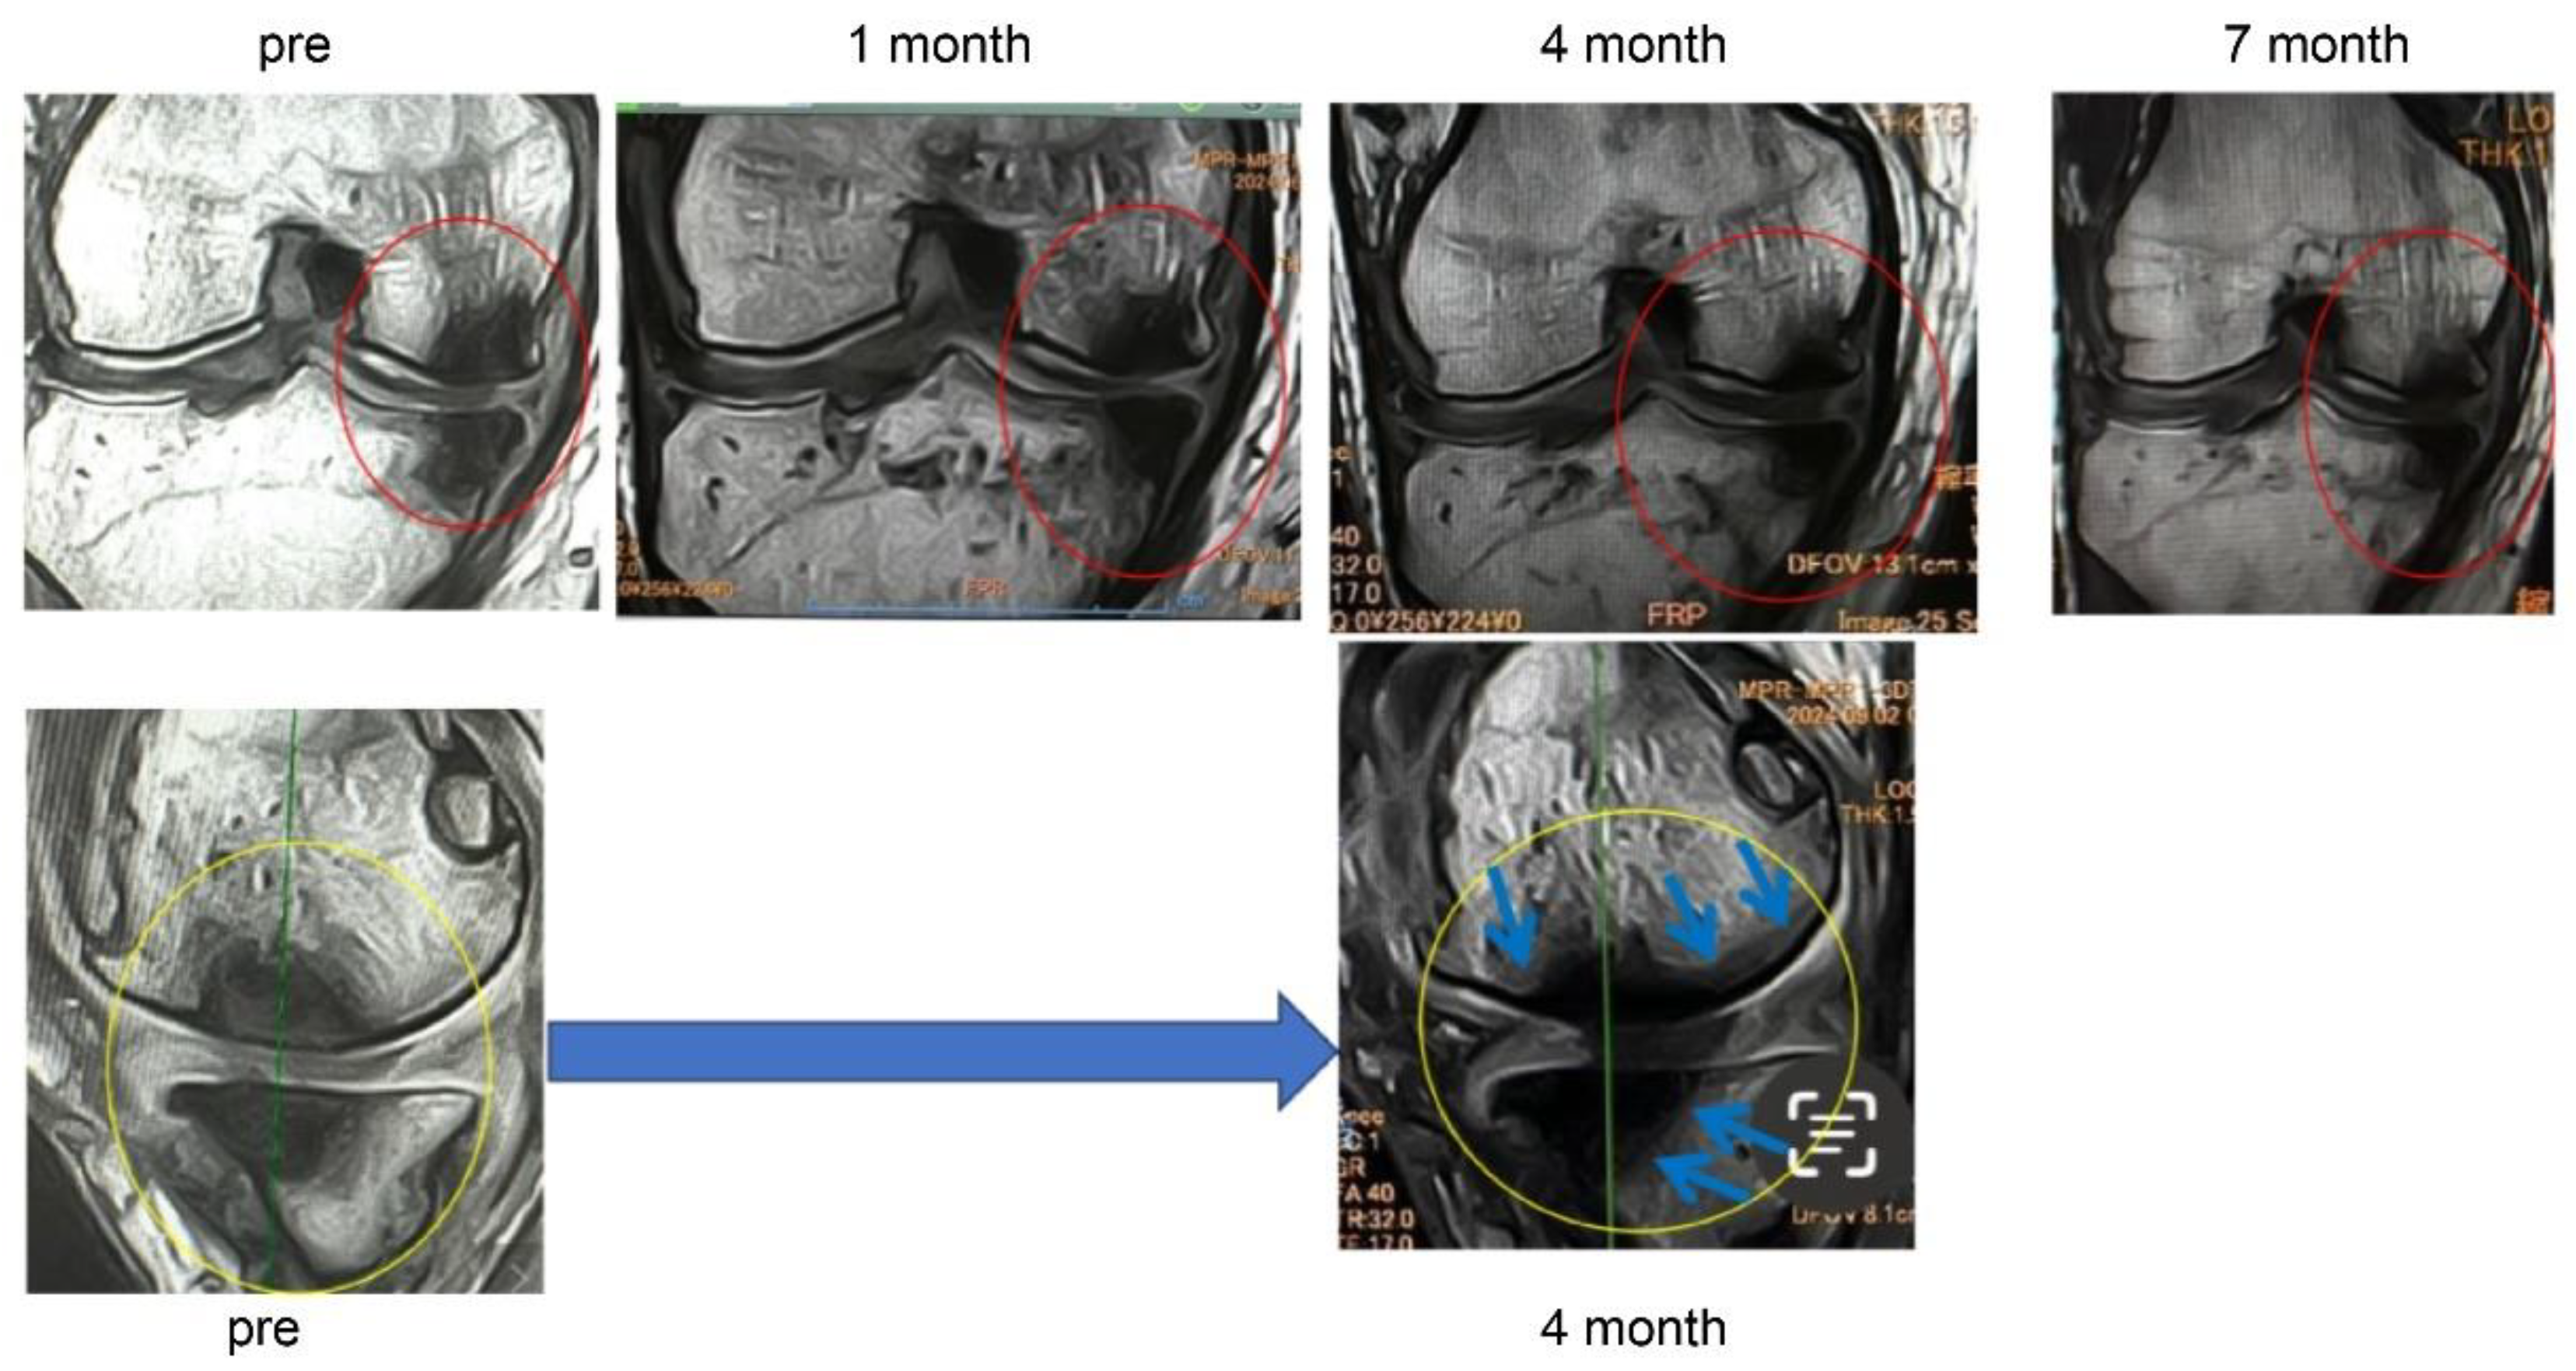
In Case 3 (Figure 8), a 70-year-old male, at baseline, MRI revealed the disappearance of the cartilage layer and subchondral bone plate tear associated with a BML in the medial femoral condyle and tibial plateau. At 1-month post-treatment, mosaic-like high-signal areas extended throughout the region surrounding the BML. At 4 months, the mosaic-like areas and a reduction in BML were observed. At 7 months, although no improvement in the cartilage layer was detected, areas of bone sclerosis had expanded to cover the joint surface, indicating progression of bone repair. It was considered that the repair process was still in progress.
Figure 8.
Temporal MRI changes after treatment. At baseline, a BML with cartilage layer loss and SBP tear was observed in the medial femoral condyle and tibial plateau. At 1 month, mosaic-like high-signal areas spread around the BML. At 4 months, BML reduction and mosaic-like changes were seen. At 7 months, no cartilage recovery was evident, but bone sclerosis expanded to cover the joint surface.
In Case 4 (Figure 9), a 63-year-old male, sequential MRI changes following combined treatment with intra-articular and intraosseous MSC administration and ESWT were evaluated. At baseline, irregularities of the articular surface and a tear of the SBP were observed. At 1 month, early signs of repair became evident, and at 3 months, further progression of structural restoration was noted. At 6 months, near-complete reconstruction of the articular surface and SBP was achieved. These findings suggest that the synergistic effect of MSC administration combined with ESWT may contribute to the regeneration of cartilage and subchondral bone (Figure 9a).
These images (Figure 9b) represent magnified views of the joint surface from the T2-weighted images shown in Figure 10a. Pretreatment findings revealed a BML and disruption of the articular surface. Progressive repair was observed at 1 month and 3 months after treatment. At 6 months, near-complete restoration of the articular surface and subchondral bone plate was evident.
Figure 10 (Case 5) shows T2-weighted MRI findings at 1 and 4 months after intraosseous MSC administration. In sagittal and coronal views, progressive subchondral bone collapse and depression of the articular surface were observed, which became more pronounced between 1 and 4 months. These morphological changes were accompanied by alterations in joint congruity, suggesting ongoing structural compromise that may predispose to secondary osteoarthritic changes.
Particularly in cases with extensive BML located adjacent to the articular surface, MSC administration may increase bone fragility, indicating the need for careful rehabilitation and load management.
3.6. Comparison Between MSC-A and Other Therapies
Figure 11a shows the comparison of KOOS scores at baseline (pre), 3 months (3M), and 6 months (6M) after treatment. At baseline, the scores were 50 in the ESWT-alone group, 44.6 in the APS+ESWT group, 48.8 in the MSC-A+ESWT group, and 44.9 in the MSC-B+ESWT group. At 3 months, significant improvements were observed in all groups, with MSC-A+ESWT (66.2) and MSC-B+ESWT (69.1) showing the greatest gains. At 6 months, the MSC-B+ESWT group demonstrated the highest score (70.4), followed by MSC-A+ESWT (65.6), ESWT (65.8), and APS+ESWT (57.6). While the MSC-A+ESWT group showed a plateau in improvement after 3 months, the MSC-B+ESWT group exhibited continued gains at 6 months. This difference may be attributed to greater MSC penetration into the bone, facilitating macrophage-driven bone formation [7,22]. These findings suggest that combined intra-articular and intraosseous administration of MSCs, when used in conjunction with ESWT, may provide more sustained and superior clinical improvement.
Figure 11b illustrates the changes in mean KOOS scores (KOOS AVG) at baseline (pre), 3 months (3M), and 6 months (6M) across the treatment groups. All groups demonstrated significant improvement by 3 months; however, at 6 months, the MSC-B group maintained the highest level of improvement. Notably, the MSC-B group showed a tendency for continued improvement from 3 to 6 months, suggesting sustained therapeutic benefits depending on the mode of MSC administration.
4. Discussion
This study compared ESWT, APS + ESWT, and MSC-A + ESWT and demonstrated that treatment outcomes significantly depend on the presence or absence of joint surface collapse and SBP tear. ESWT as a standalone treatment resulted in notable KOOS score enhancements from baseline to 3 months, with continued progress observed at 6 months. However, in cases with joint surface collapse, the treatment showed little benefit, with significant improvements limited to patients without collapse. The histological discontinuity of the subchondral bone plate observed in pathology often manifests as a tear on MRI, which is thought to reflect not just a simple structural break, but a more severe pathological condition involving local microfractures, increased bone metabolic activity, and inflammatory reactions. This is likely because ESWT’s mechanism relies on repairing microfractures within BMLs, stimulating blood vessel formation, and normalizing bone turnover, which may not be effective when the joint surface is already structurally compromised.
Kang et al. [23] found that ESWT reduces bone marrow edema (BME) in patients with knee OA, with MRI evidence of significant BME reduction or resolution at 6 months. In contrast, Zang et al.’s [24] meta-analysis suggests that while ESWT improves pain and function, these clinical benefits do not always align with BML reduction or imaging changes, a finding that corresponds with this study’s observations.
APS contains elevated levels of anti-inflammatory cytokines (such as interleukin-1 receptor antagonists) compared with PRP, making it particularly effective at reducing synovitis and inflammation-related pain [25]. In this study, the APS + ESWT group exhibited significant pain and functional improvements by 3 months, with benefits persisting at 6 months. Notably, patients without SBP tear showed a markedly higher improvement rate at 3 months, indicating that APS’s early control of inflammation likely amplifies ESWT’s ability to repair bone tissue.
Although the impact of joint surface collapse was not distinctly different between groups, some improvement was observed even in the collapse group. This suggests that APS may alleviate pain even in cases with advanced structural bone damage by targeting synovitis.
The group treated with intra-articular MSC administration combined with ESWT achieved the most substantial KOOS score improvement at 3 months (IV pre-3 months = 17.5 ± 8.9); however, this progress leveled off by 6 months. It is plausible that MSCs migrated into the subchondral bone at SBP tear sites, facilitating early tissue repair. However, since MSCs are cleared from the joint cavity relatively quickly, their long-term benefits were limited.
In patients with joint surface collapse, KOOS scores showed a tendency to decline, potentially due to temporary weakening of the subchondral bone during MSC-induced bone formation, which could exacerbate collapse under mechanical stress. This observation is consistent with animal studies [26] indicating that MSC-mediated bone regeneration is influenced by the surrounding tissue environment.
In the three-group comparison (SBP tear present, joint surface collapse absent), APS + ESWT and MSC-A + ESWT demonstrated earlier improvements at 3 months compared to standalone ESWT. However, by 6 months, no significant difference was observed between APS + ESWT and MSC-A + ESWT, suggesting that the high cost of MSC offers limited advantages from a cost-effectiveness perspective.
Huang et al. [27] indicate in their review that conservative treatments (such as braces, electromagnetic therapy, and bisphosphonates) show some efficacy in improving BML. However, combining ESWT-based physical therapy with biologics appears to yield faster and more sustained clinical improvements.
This study underscores the importance of “joint surface structural assessment” as a critical indicator for treatment selection in knee OA with BML. For BML-positive cases without joint surface collapse, ESWT alone or in combination with APS is effective, while MSC may be a valuable strategy for carefully selected cases targeting short-term improvement.
Moving forward, developing a treatment prediction model through MRI-based quantification of BML size and location, measurement of pain biomarkers, and correlation analysis with inflammation and neurogenesis markers represents a key future challenge [28].
Recently, ESWT has gained recognition as an effective treatment, especially for knee OA accompanied by BML. Systematic reviews have shown that ESWT can significantly improve pain and functional outcomes, measured by Western Ontario and McMaster Universities Osteoarthritis Index, visual analog scale, and range of motion scores, while causing minimal side effects [29]. Since 2018, we have applied ESWT to patients who did not respond to intra-synovial injections, but only after confirming the presence of BML via MRI. In these cases, ESWT reduced pain, decreased BML size on MRI, and improved the condition of the subchondral bone unit, consistent with previous reports [30,31].
Aso et al. (2013) reported that pain in knee OA can originate independently from BML and from synovitis, and therefore each requires a distinct treatment approach [32]. Based on this finding, for patients presenting with BML and synovitis, we combined ESWT with second-generation platelet-rich plasma (APS), which has been shown to suppress synovitis more effectively than earlier formulations. This combined therapy produced pain and functional improvements comparable to ESWT alone at three months, but significantly greater benefits at six months [33].
However, when we introduced a combined MSC and ESWT protocol (MSC-A + ESWT), the results showed that, despite being roughly three times more expensive than APS, the clinical benefits were not markedly superior. This may be because intra-articular MSCs are readily absorbed by the synovium, limiting their retention and delivery to bone tissue [34,35].
To overcome this limitation, in 2024, we began using a refined protocol that combines simultaneous intra-articular and intra-osseous MSC administration with ESWT (MSC-B + ESWT). Hernigou et al. (2021) demonstrated that intra-osseous BMAC can sustain long-term clinical benefits, while Delgado et al. (2022) reported that delivering PRP intra-osseously and intra-articularly enhances MSC proliferation and clinical outcomes [35,36]. In our study, the MSC-B approach improved KOOS scores and MRI findings, suggesting a reparative effect on lesions, likely due to the more direct delivery of MSCs to bone.
Early OA progression is marked by increased bone metabolic activity, angiogenesis, and neurogenesis preceding cartilage changes, with BML serving as an early indicator [33]. Consequently, we examined whether the presence of SBP tear might influence disease severity and treatment responsiveness. In our study, ESWT alone was effective even in SBP tear cases, but prior reports indicate that when joint surface collapse is present, therapeutic efficacy is markedly reduced. The International Society for Medical Shockwave Treatment (ISMST) guidelines recommend ESWT for OCD and osteonecrosis only in the absence of articular derangement, excluding such cases from treatment. By extension, ESWT for knee OA with BML may also be best indicated only when no articular derangement is present [37,38].
In MSC-B cases with SBP tear, we observed KOOS improvement and MRI-documented lesion repair in patients where MSC effects could be expected from the articular and intraosseous sides. These findings suggest that a higher concentration of MSC in bone with MSC-B, compared to MSC-A, may have accelerated repair. Furthermore, intra-osseous and intra-articular PRP co-administration has been reported to enhance MSC proliferation and stress resistance, supporting our observations [39,40].
However, immediately after MSC administration, the bone may become transiently fragile, creating a risk of joint surface collapse; therefore, a period of weight-bearing restriction is necessary. While MSC-B tended to sustain improvements at 6 months, the small number of cases limited statistical analysis. Future studies should address booster dosing, MSC quality enhancement, and long-term follow-up.
As Zhen et al. have noted, future treatment strategies for knee OA may benefit from appropriately delivering orthobiologics and growth factors into bone and joint spaces, combined with physical modalities such as ESWT, to repair and modulate the subchondral bone microenvironment [41].
5. Conclusions
In BML cases without SBP tear, ESWT alone can be expected to provide sufficient therapeutic benefit. In cases with synovitis, APS + ESWT is effective for early improvement. In cases with SBP tear, MSC-B + ESWT may be a promising option. This study contributes toward developing pathology-specific, individualized treatment strategies for BML in knee OA. MSC-B suggests the potential for better long-term improvement compared to intra-articular administration in cases of BML with SBP tear; however, its applicability is limited in cases with joint surface collapse. To establish clear criteria for its optimal use, further studies with larger sample sizes and long-term clinical and imaging analyses are necessary.
Author Contributions
Conceptualization, S.N.; methodology, S.N.; software, S.N.; validation, T.K., T.T., and T.M.; formal analysis; investigation, S.N.; resources, S.N., T.K., T.T., and T.M.; data curation, S.N.; writing - original draft preparation, S.N.; writing - review and editing, S.N., K.A., N.T. and T.K.; visualization, S.N.; supervision, T.K.; Project administration, T.K. All authors have read and agreed to the published version of the manuscript.
Funding
This research received no external funding.
Institutional Review Board Statement
The study was conducted in accordance with the Declaration of Helsinki and approved by the Institutional Review Board of Waseda University (Application No.: 2024-529).
Informed Consent Statement
Informed consent was obtained from all subjects involved in the study.
Data Availability Statement
Not applicable.
Acknowledgments
We would like to thank Editage (www.editage.jp) for English language editing.
Conflicts of Interest
The authors declare no conflict of interest.
Abbreviations
The following abbreviations are used in this manuscript:
| APS | autologous protein solution |
| BMAC | bone marrow aspirate concentrate |
| BME | bone marrow edema |
| BML | bone marrow lesion |
| CT | computed tomography |
| ESWT | extracorporeal shockwave therapy |
| HE | hematoxylin and eosin |
| IV | improvement value |
| KL | Kellgren–Lawrence |
| KOOS | Knee injury and Osteoarthritis Outcome Score |
| MRI | magnetic resonance imaging |
| MSC | mesenchymal stromal cell |
| MSC-A | intra-articular mesenchymal stromal cell administration |
| MSC-B | intra-articular and intraosseous mesenchymal stromal cell administration |
| OA | osteoarthritis |
| OABS | osteoarthritis bone score |
| OCD | osteochondral defect |
| PRP | platelet-rich plasma |
| SBP | subchondral bone plate |
| SD | standard deviation |
References
- Loeser, R.F.; Goldring, S.R.; Scanzello, C.R.; Goldring, M.B. Osteoarthritis: A disease of the joint as an organ. Arthritis Rheum. 2012, 64, 1697–1707. [Google Scholar] [CrossRef]
- Hunter, D.J.; Bierma-Zeinstra, S. Osteoarthritis. Lancet 2019, 393, 1745–1759. [Google Scholar] [CrossRef]
- Aso, K.; Shahtaheri, S.M.; McWilliams, D.F.; Walsh, D.A. Association of subchondral bone marrow lesion localization with weight-bearing pain in people with knee osteoarthritis: data from the osteoarthritis Initiative. Arthritis Res. Ther. 2021, 23, 35. [Google Scholar] [CrossRef]
- Mont, M.A.; Jones, L.C.; Hungerford, D.S. Bone marrow lesions in osteoarthritis. Rheum. Dis. Clin. N. Am. 2011, 37, 429–438. [Google Scholar]
- Zanetti, M.; Bruder, E.; Romero, J.; Hodler, J. Bone marrow edema pattern in osteoarthritic knees: correlation between MR imaging and histologic findings. Radiology 2000, 215, 835–840. [Google Scholar] [CrossRef] [PubMed]
- Aso, K.; Sugimura, N.; Wada, H.; Deguchi, S.; Ikeuchi, M. Increased nerve growth factor expression and osteoclast density are associated with subchondral bone marrow lesions in osteoarthritic knees. Osteoarthr. Cartil. Open 2024, 6, 100504. [Google Scholar] [CrossRef] [PubMed]
- Li, G.; Yin, J.; Gao, J.; Cheng, T.S.; Pavlos, N.J.; Zhang, C.; Zheng, M.H. Subchondral bone in osteoarthritis: insight into risk factors and microstructural changes. Arthritis Res. Ther. 2013, 15, 223. [Google Scholar] [CrossRef]
- Koushesh, S.; Shahtaheri, S.M.; McWilliams, D.F.; Walsh, D.A.; Sheppard, M.N.; Westaby, J.; Haybatollahi, S.M.; Howe, F.A.; Sofat, N. The osteoarthritis bone score (OABS): A new histological scoring system for the characterisation of bone marrow lesions in osteoarthritis. Osteoarthritis Cartilage 2022, 30, 746–755. [Google Scholar] [CrossRef]
- Yao, L.; Yip, A.L.; Shrader, J.A.; Mesdaghinia, S.; Volochayev, R.; Jansen, A.V.; Miller, F.W.; Rider, L.G. Magnetic resonance measurement of muscle T2, fat-corrected T2 and fat fraction in the assessment of idiopathic inflammatory myopathies. Rheumatology 2016, 55(3), 441–449. [Google Scholar] [CrossRef]
- Zhang, Y.; Min, L.; Lu, M.; Wang, J.; Wang, Y.; Luo, Y.; Zhou, Y.; Duan, H.; Tu, C. Three-dimensional-printed customized prosthesis for pubic defect: prosthesis design and surgical techniques. J. Orthop. Surg. Res. 2020, 15, 261. [Google Scholar] [CrossRef]
- Sanders, T.L.; Kremers, H.M.; Bryan, A.J.; Kremers, W.K.; Stuart, M.J.; Krych, A.J. Procedural intervention for arthrofibrosis after ACL reconstruction: trends over two decades. Knee Surg. Sports Traumatol. Arthrosc. 2017, 25, 532–537. [Google Scholar] [CrossRef]
- Sánchez, M.; Delgado, D.; Sánchez, P.; Muiños-López, E.; Paiva, B.; Granero-Moltó, F.; Prósper, F.; Pompei, O.; Pérez, J.C.; Azofra, J.; Padilla, S.; Fiz, N. combination of intra-articular and intraosseous injections of platelet rich plasma for severe knee osteoarthritis: A pilot study. Biomed Res. Int. 2016, 2016, 4868613. [Google Scholar] [CrossRef] [PubMed]
- Daniel, D.; et al. Mesenchymal stem cells and shock-wave therapy synergistically promote osteochondral regeneration. Stem Cells Int. 2021, 8871645. [Google Scholar]
- Fujino, A.; Fuchimoto, Y.; Baba, Y.; Isogawa, N.; Iwata, T.; Arai, K.; Abe, M.; Kanai, N.; Takagi, R.; Maeda, M.; Umezawa, A. First-in-human autologous oral mucosal epithelial sheet transplantation to prevent anastomotic re-stenosis in congenital esophageal atresia. Stem Cell Res. Ther. 2022, 13, 35. [Google Scholar] [CrossRef] [PubMed]
- Hayashi, D.; Roemer, F.W.; Guermazi, A. Imaging for osteoarthritis. Ann. Phys. Rehabil. Med. 2016, 59, 161–169. [Google Scholar] [CrossRef]
- Bansback, N.; Marra, C.A.; Finckh, A.; Anis, A. The economics of treatment in early rheumatoid arthritis. Best Pract. Res. Clin. Rheumatol. 2009, 23, 83–92. [Google Scholar] [CrossRef]
- Karim, A.R.; Cherian, J.J.; Jauregui, J.J.; Pierce, T.; Mont, M.A. Osteonecrosis of the Knee: Review. Ann. Transl. Med. 2015, 3, 6. [Google Scholar] [CrossRef]
- Hernigou, P.; Flouzat Lachaniette, C.H.; Delambre, J.; Zilber, S.; Duffiet, P.; Chevallier, N.; Rouard, H. Biologic augmentation of rotator cuff repair with mesenchymal stem cells during arthroscopy improves healing and prevents further tears: A case-controlled study. Int. Orthop. 2014, 38, 1811–1818. [Google Scholar] [CrossRef]
- Madry, H.; Kon, E.; Condello, V. Bone marrow lesions and subchondral bone pathology of the knee joint: review of pathophysiology and therapeutic implications. Cartilage 2020, 11, 465–483. [Google Scholar]
- Hernigou, P.; Auregan, J.C.; Dubory, A.; Flouzat Lachaniette, C.H.; Chevallier, N.; Rouard, H. Subchondral Bone or Intra-Articular Injection of Bone Marrow Concentrate for Treating Knee Osteoarthritis: 15-Year Follow-Up of a Randomized Prospective Study. Int. Orthop. 2021, 45, 365–373. [Google Scholar] [CrossRef]
- Kumar, S.; Kumar, A.; Kumar, M.; Kumar, A.; Arora, R.; Sehrawat, R. Feasibility of telemedicine in maintaining follow-up of orthopaedic patients and their satisfaction: A preliminary study. J. Clin. Orthop. Trauma 2020, 11 (Suppl. 5), S704–S710. [Google Scholar] [CrossRef] [PubMed]
- Sanchez, M.; Delgado, D.; Sanchez, P. Combining intraosseous and intraarticular biologic therapies for knee osteoarthritis: mechanistic insights and clinical outcomes. Front. Bioeng. Biotechnol. 2022, 10, 947231. [Google Scholar]
- Kang, S.; Gao, F.; Han, J.; Mao, T.; Sun, W.; Wang, B.; Guo, W.; Cheng, L.; Li, Z. Extracorporeal shock wave treatment can normalize painful bone marrow edema in knee osteoarthritis: A comparative historical cohort study. Medicine (Baltimore) 2018, 97, e9796. [Google Scholar] [CrossRef] [PubMed]
- Zang, X.; Ma, Y.; Wu, J.; Zhang, Y.; Ma, J. Efficacy of extracorporeal shock wave therapy for bone marrow lesions and pain in knee osteoarthritis: A meta-analysis. Pain Res. Manag. 2024, 11970530. [Google Scholar]
- Jo, Y.H.; Lee, C.H. Ultrasonic properties of a stone architectural heritage and weathering evaluations based on provenance site. Appl. Sci. 2022, 12. [Google Scholar] [CrossRef]
- Wang, R.; Jiang, W.; Zhang, L.; Xie, S.; Zhang, S.; Yuan, S.; Jin, Y.; Zhou, G. Intra-articular delivery of extracellular vesicles secreted by chondrogenic progenitor cells from MRL/MpJ superhealer mice enhances articular cartilage repair in a mouse injury model. Stem Cell Res. Ther. 2020, 11, 93. [Google Scholar] [CrossRef]
- Huang, Y.; Huang, H.; Yan, Z.; Xu, D.; Chen, L. Conservative treatments for bone marrow lesions in knee osteoarthritis: A systematic review. J. Rehabil. Med. 2023, 55, jrm00328. [Google Scholar]
- Aso, K.; Shahtaheri, S.M.; McWilliams, D.F.; Walsh, D.A. Association of subchondral bone marrow lesion localization with weight-bearing pain in people with knee osteoarthritis: data from the Osteoarthritis Initiative. Arthritis Res. Ther. 2021, 23, 35. [Google Scholar] [CrossRef]
- Ko, N.Y.; Chang, C.N.; Cheng, C.H.; Yu, H.K.; Hu, G.C. Comparative Effectiveness of Focused Extracorporeal versus Radial Extracorporeal Shockwave Therapy for Knee Osteoarthritis-Randomized Controlled Study. Int. J. Environ. Res. Public Health 2022, 19, 9001. [Google Scholar] [CrossRef]
- Avendaño-Coy, J.; Comino-Suárez, N.; Grande-Muñoz, J.; Avendaño-López, C.; Gómez-Soriano, J. Extracorporeal shockwave therapy improves pain and function in subjects with knee osteoarthritis: A systematic review and meta-analysis of randomized clinical trials. Int. J. Surg. 2020, 82, 64–75. [Google Scholar] [CrossRef]
- Li, X.; Williams, P.; Curry, E.J.; Choi, D.; Craig, E.V.; Warren, R.F.; Gulotta, L.V.; Wright, T. Trabecular bone microarchitecture and characteristics in different regions of the glenoid. Orthopedics 2015, 38, e163–e168. [Google Scholar] [CrossRef]
- Murata, M.; Yudoh, K.; Shimizu, H.; Beppu, M.; Nakamura, H.; Kato, T.; Masuko, K. Layilin, a talin-binding hyaluronan receptor, is expressed in human articular chondrocytes and synoviocytes and is down-regulated by interleukin-1β. Mod. Rheumatol. 2013, 23, 478–488. [Google Scholar] [CrossRef]
- Nakasato, S.; Kumai, T.; Mitsuoka, T.; Teramura, T.; Akagi, M. Combination therapy of autologous protein solution and extracorporeal shock wave therapy for severe knee osteoarthritis. Appl. Sci. 2024, 14, 1498. [Google Scholar] [CrossRef]
- Pasculli, R.M.; Kenyon, C.D.; Berrigan, W.A.; Mautner, K.; Hammond, K.; Jayaram, P. Mesenchymal stem cells for subchondral bone marrow lesions: from bench to bedside. Rep. Bone Rep. 2022, 17, 101630. [Google Scholar] [CrossRef] [PubMed]
- Hernigou, P.; Bouthors, C.; Bastard, C.; Flouzat Lachaniette, C.H.; Rouard, H.; Dubory, A. Subchondral bone or intra-articular injection of bone marrow concentrate mesenchymal stem cells in bilateral knee osteoarthritis: What better postpone knee arthroplasty at fifteen years? A randomized study. International Orthopaedics 2021, 45, 365–373. [Google Scholar] [CrossRef] [PubMed]
- Ganguly, P.; Fiz, N.; Beitia, M.; Owston, H.E.; Delgado, D.; Jones, E.; Sánchez, M. Effect of combined intraosseous and intraarticular infiltrations of autologous platelet-rich plasma on subchondral bone marrow mesenchymal stromal cells from patients with hip osteoarthritis. J. Clin. Med. 2022, 11, 3891. [Google Scholar] [CrossRef]
- Alkhawashki, H.M.; Al-Boukai, A.A.; Al-Harbi, M.S.; Al-Rumaih, M.H.; Al-Khawashki, M.H. The use of extracorporeal shock wave therapy (ESWT) in treating osteonecrosis of the femoral head (AVNFH): a retrospective study. Int. Orthop. 2023, 47, 2953–2960. [Google Scholar] [CrossRef]
- International Society for medical shock wave treatment. Consensus statement on indications and contraindications for extracorporeal shock wave treatment (ESWT): osteochondritis dissecans and avascular necrosis without articular derangement only (ISMST guidelines). In ISMST, 2016; pp. 1–5.
- Artamonov, M.Y.; Sokov, E.L. Intraosseous versus MSCA: enhanced subchondral bone MSC abundance and repair potential following intraosseous plus intraarticular administration. J. Rege Bone Res 2024, 12, 45–56. [Google Scholar]
- Xue, Y.; Zhang, L.; Xu, H.; Ma, T.; Ma, J. Combined intraosseous and intraarticular platelet-rich plasma injection for the treatment of hip osteoarthritis: Effects on subchondral bone marrow mesenchymal stem cells. J. Orthop. Translat. 2022, 34, 150–158. [Google Scholar] [CrossRef]
- Hu, Y.; Chen, X.; Wang, S.; Jing, Y.; Su, J. Subchondral bone microenvironment in osteoarthritis and pain. Bone Res. 2021, 9, 20. [Google Scholar] [CrossRef]
Figure 1.
Histological evaluation of (a) subchondral bone plate (SBP) tear and (b) bone marrow lesion (BML) at the SBP-tear site (provided by K. Aso). (a) Representative histological images stained with hematoxylin and eosin (HE) are presented. In the SBP-intact sample (left), the SBP beneath the cartilage remains continuous, exhibiting a smooth and well-defined structure. In contrast, in the SBP-tear sample (right), the continuity of the SBP is clearly interrupted, as indicated by the yellow arrow, with evident structural breakdown and tear. SBP, subchondral bone plate. (b) HE-stained histological sections from the SBP-disrupted (+) site are presented. As indicated by the yellow arrow, the continuity of the SBP is clearly interrupted. Pathological alterations are evident within the bone marrow region, and high-magnification images reveal neovascularization (upper right), infiltration of inflammatory cells (lower right), and proliferation of fibroblasts (lower left). These findings suggest the progression of bone remodeling, inflammatory responses, and reparative fibrosis at the site of SBP tear. SBP, subchondral bone plate; HE, hematoxylin and eosin.
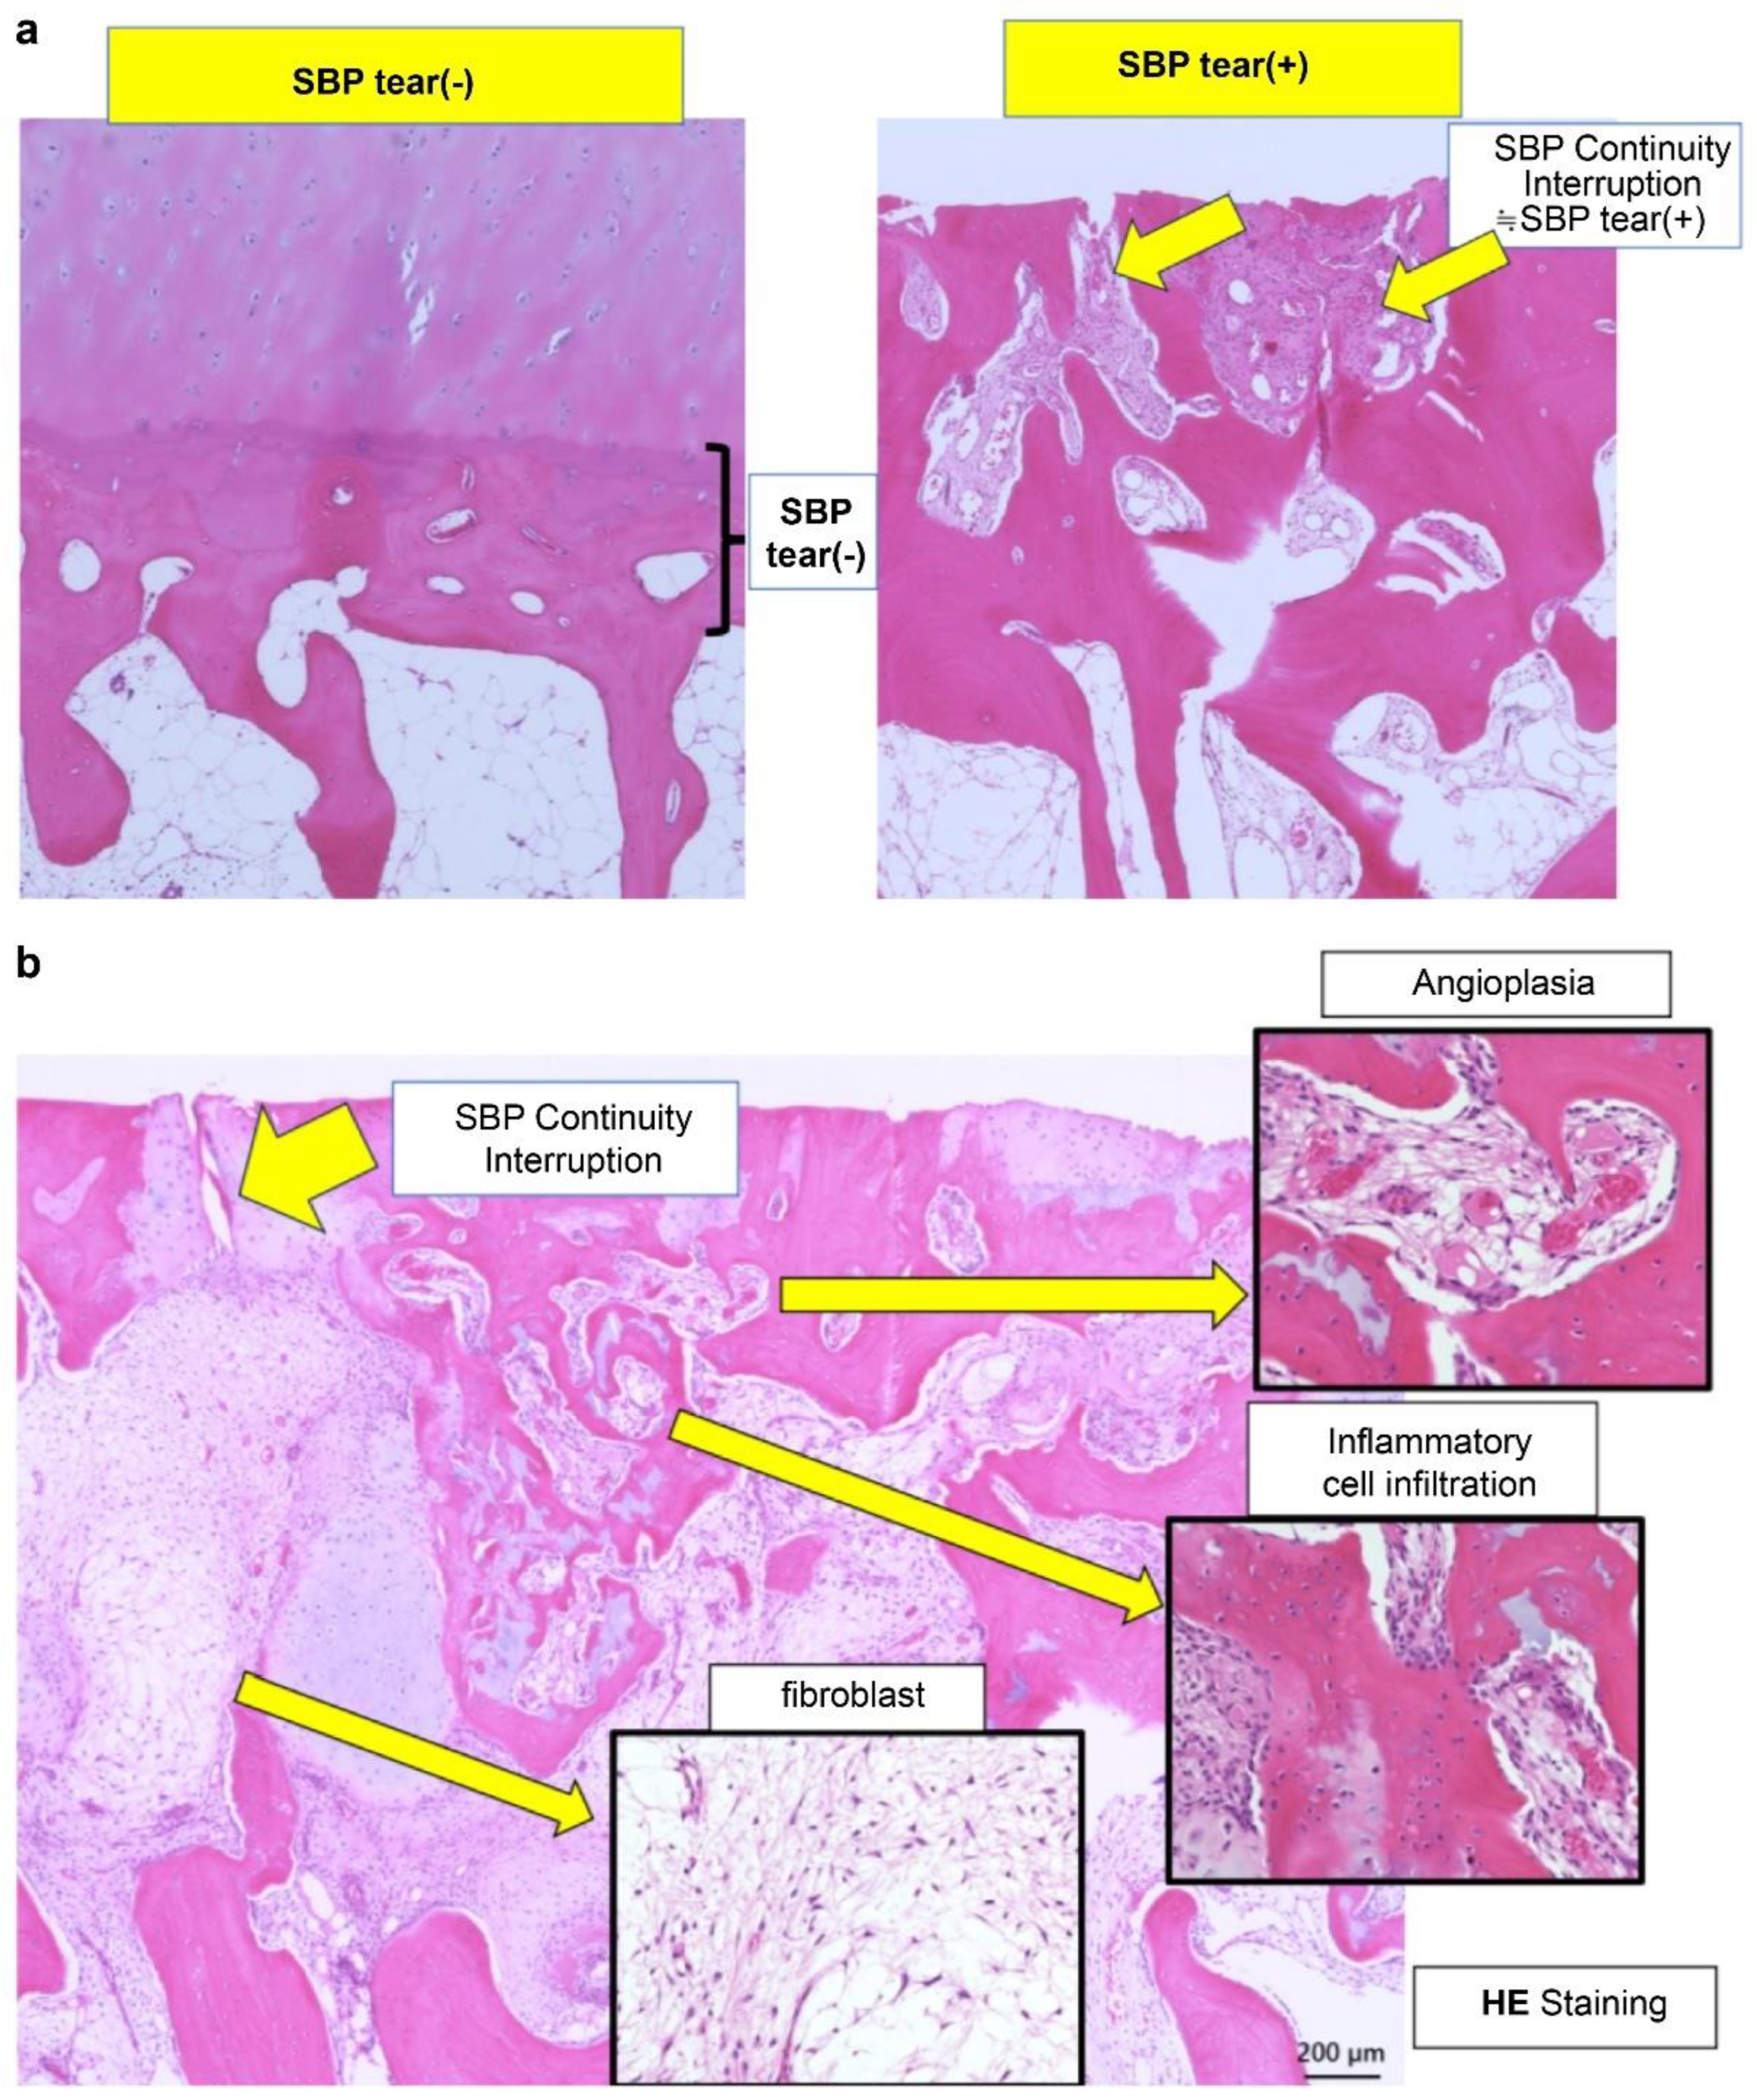
Figure 2.
Imaging findings of normal and ruptured subchondral bone plate (SBP-tear). (a) Magnetic resonance imaging (MRI) findings of normal and ruptured subchondral bone plate (SBP-tear). Coronal sections of the knee joint are shown on T1-weighted (left) and T2-weighted (right) images. The SBP appears as a low-signal band, similar to cortical bone. The normal SBP, indicated by yellow arrows, demonstrates preserved continuity and a smooth contour. In contrast, the areas marked with red arrows show apparent disruption and irregularity of the SBP. Notably, on T2-weighted images, the presence of joint fluid signal extending into the marrow cavity suggests SBP disruption. (b) Evaluation of SBP disruption using MRI and computed tomography (CT). The left upper panel shows a T1-weighted MRI image, the left lower panel shows a T2-weighted MRI image, and the right panel presents a coronal CT image. In the MRI images, the areas indicated by yellow arrows demonstrate a clear loss of SBP continuity (SBP-tear). On T2-weighted images, the disruption is more distinctly visualized due to the contrast with joint fluid signals. When the detection of SBP tear is challenging on MRI, CT imaging can provide clearer visualization of the cortical tear in the SBP.
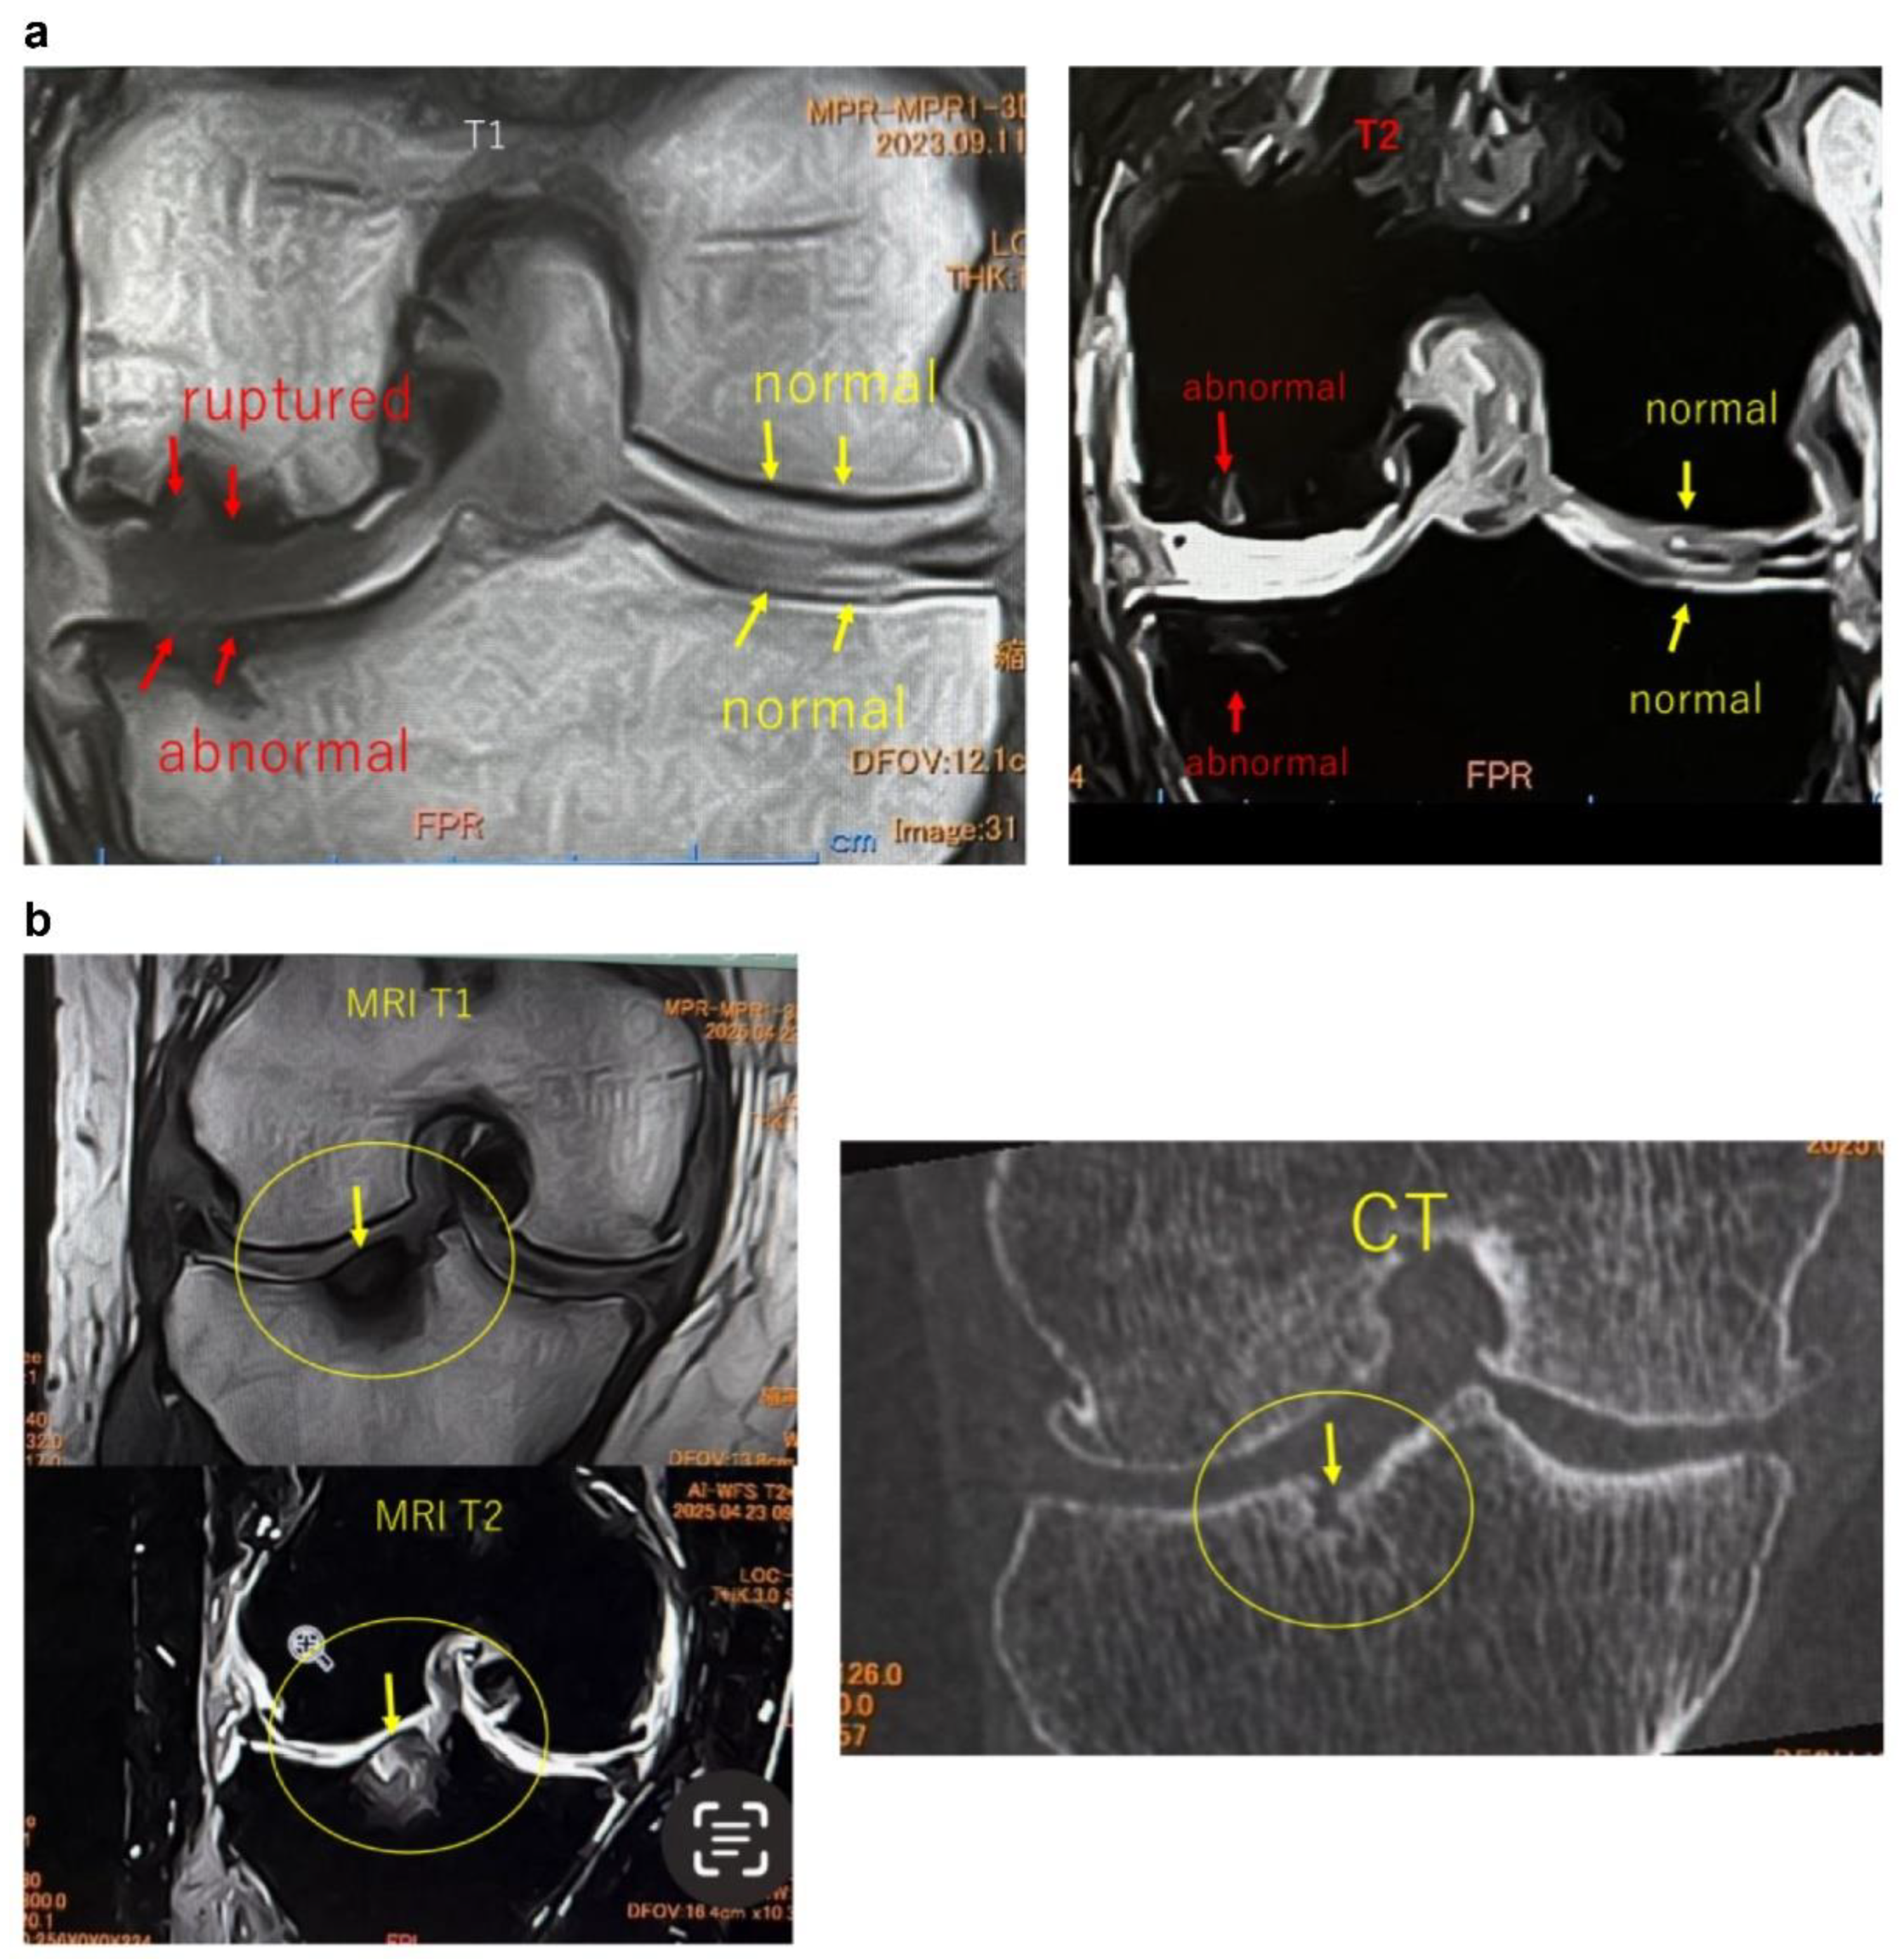
Figure 3.
MRI findings of (a) femoral articular surface collapse in the knee joint and (b). (a) Representative MRI images on T1-weighted and T2-weighted sequences (coronal and sagittal planes) are shown. In the area indicated by yellow circles, the articular surface exhibits marked irregularity with loss of cartilage continuity. At the sites indicated by red arrows, SBP disruption and cortical collapse are evident, demonstrating structural failure of the articular surface. Furthermore, on T2-weighted images, joint fluid signals extend into the bone marrow, suggesting the presence of bone marrow lesions (BML) and edematous changes within the subchondral bone. (b) MRI findings demonstrating tibial articular surface collapse. Coronal and sagittal T1- and T2-weighted MRI images are presented. In the regions outlined by yellow circles, the tibial articular surface exhibits marked irregularity, and at the sites indicated by red arrows, there is evident loss of continuity of the SBP with cortical depression and collapse of the articular surface. On T2-weighted images, the hyperintense joint fluid signal extends into the bone marrow, suggesting the presence of BMLs and associated edematous changes.
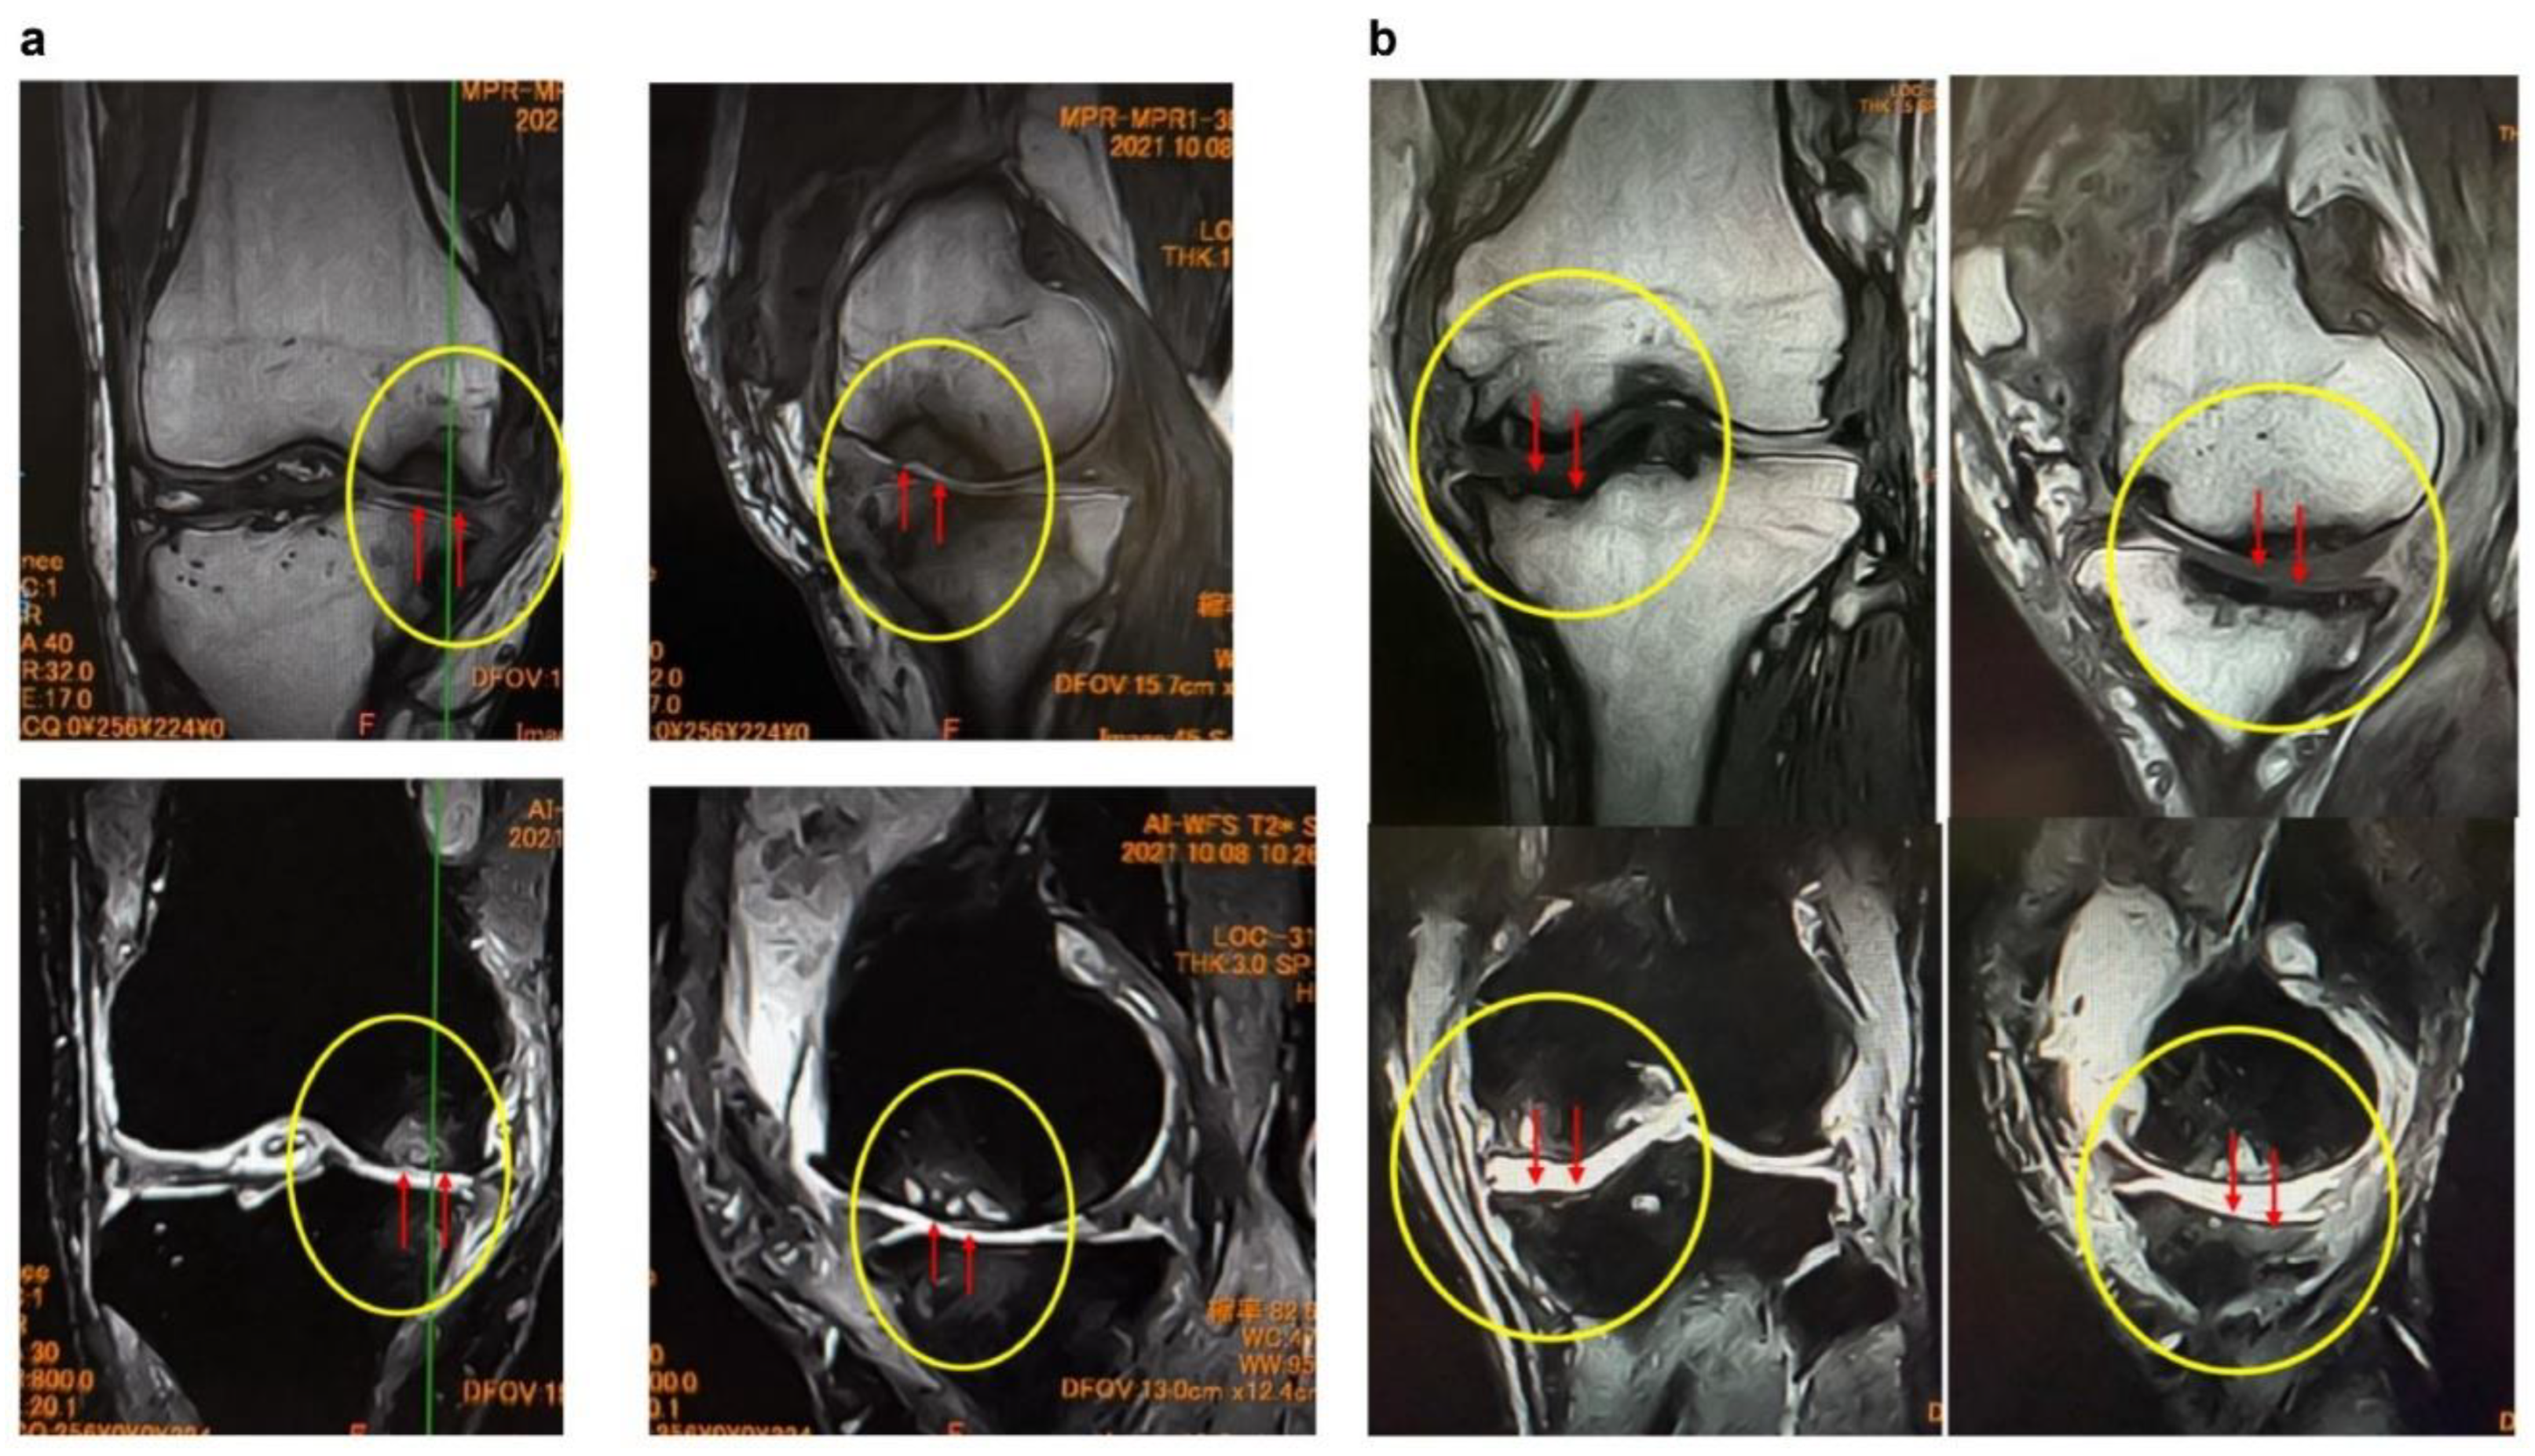
Figure 5.
Comparison of ESWT outcomes at 3 months based on the presence or absence of (a) SBP tear and (b) articular surface collapse. (a) The left graph illustrates the mean scores before ESWT (pre) and at 3 months post-treatment (3 months) in the SBP tear (−) and SBP tear (+) groups. The SBP tear (−) group demonstrated a greater improvement (from 50.3 to 71.3), whereas the SBP tear (+) group showed a relatively smaller improvement (from 52.4 to 64). The right graph presents the improvement values (IVs) over the 3 months, with the SBP tear (−) group showing a mean change of 21 compared with 11.6 in the SBP tear (+) group. However, the difference between the two groups was not statistically significant (p = 0.0929 > 0.05). SBP, subchondral bone plate; IV, improvement value. (b) The left panel shows the changes in KOOS scores from baseline (pre) to 3 months post-treatment (3 months) in the collapse (−) and collapse (+) groups. The right panel illustrates the improvement values (IV) over the same period. The collapse (−) group demonstrated a significantly greater improvement (IV: mean 21), whereas the collapse (+) group exhibited limited improvement (IV: mean 11.6), with the difference between groups reaching statistical significance (p = 0.0058 < 0.01). KOOS AVG, mean KOOS Knee injury and Osteoarthritis Outcome Score.
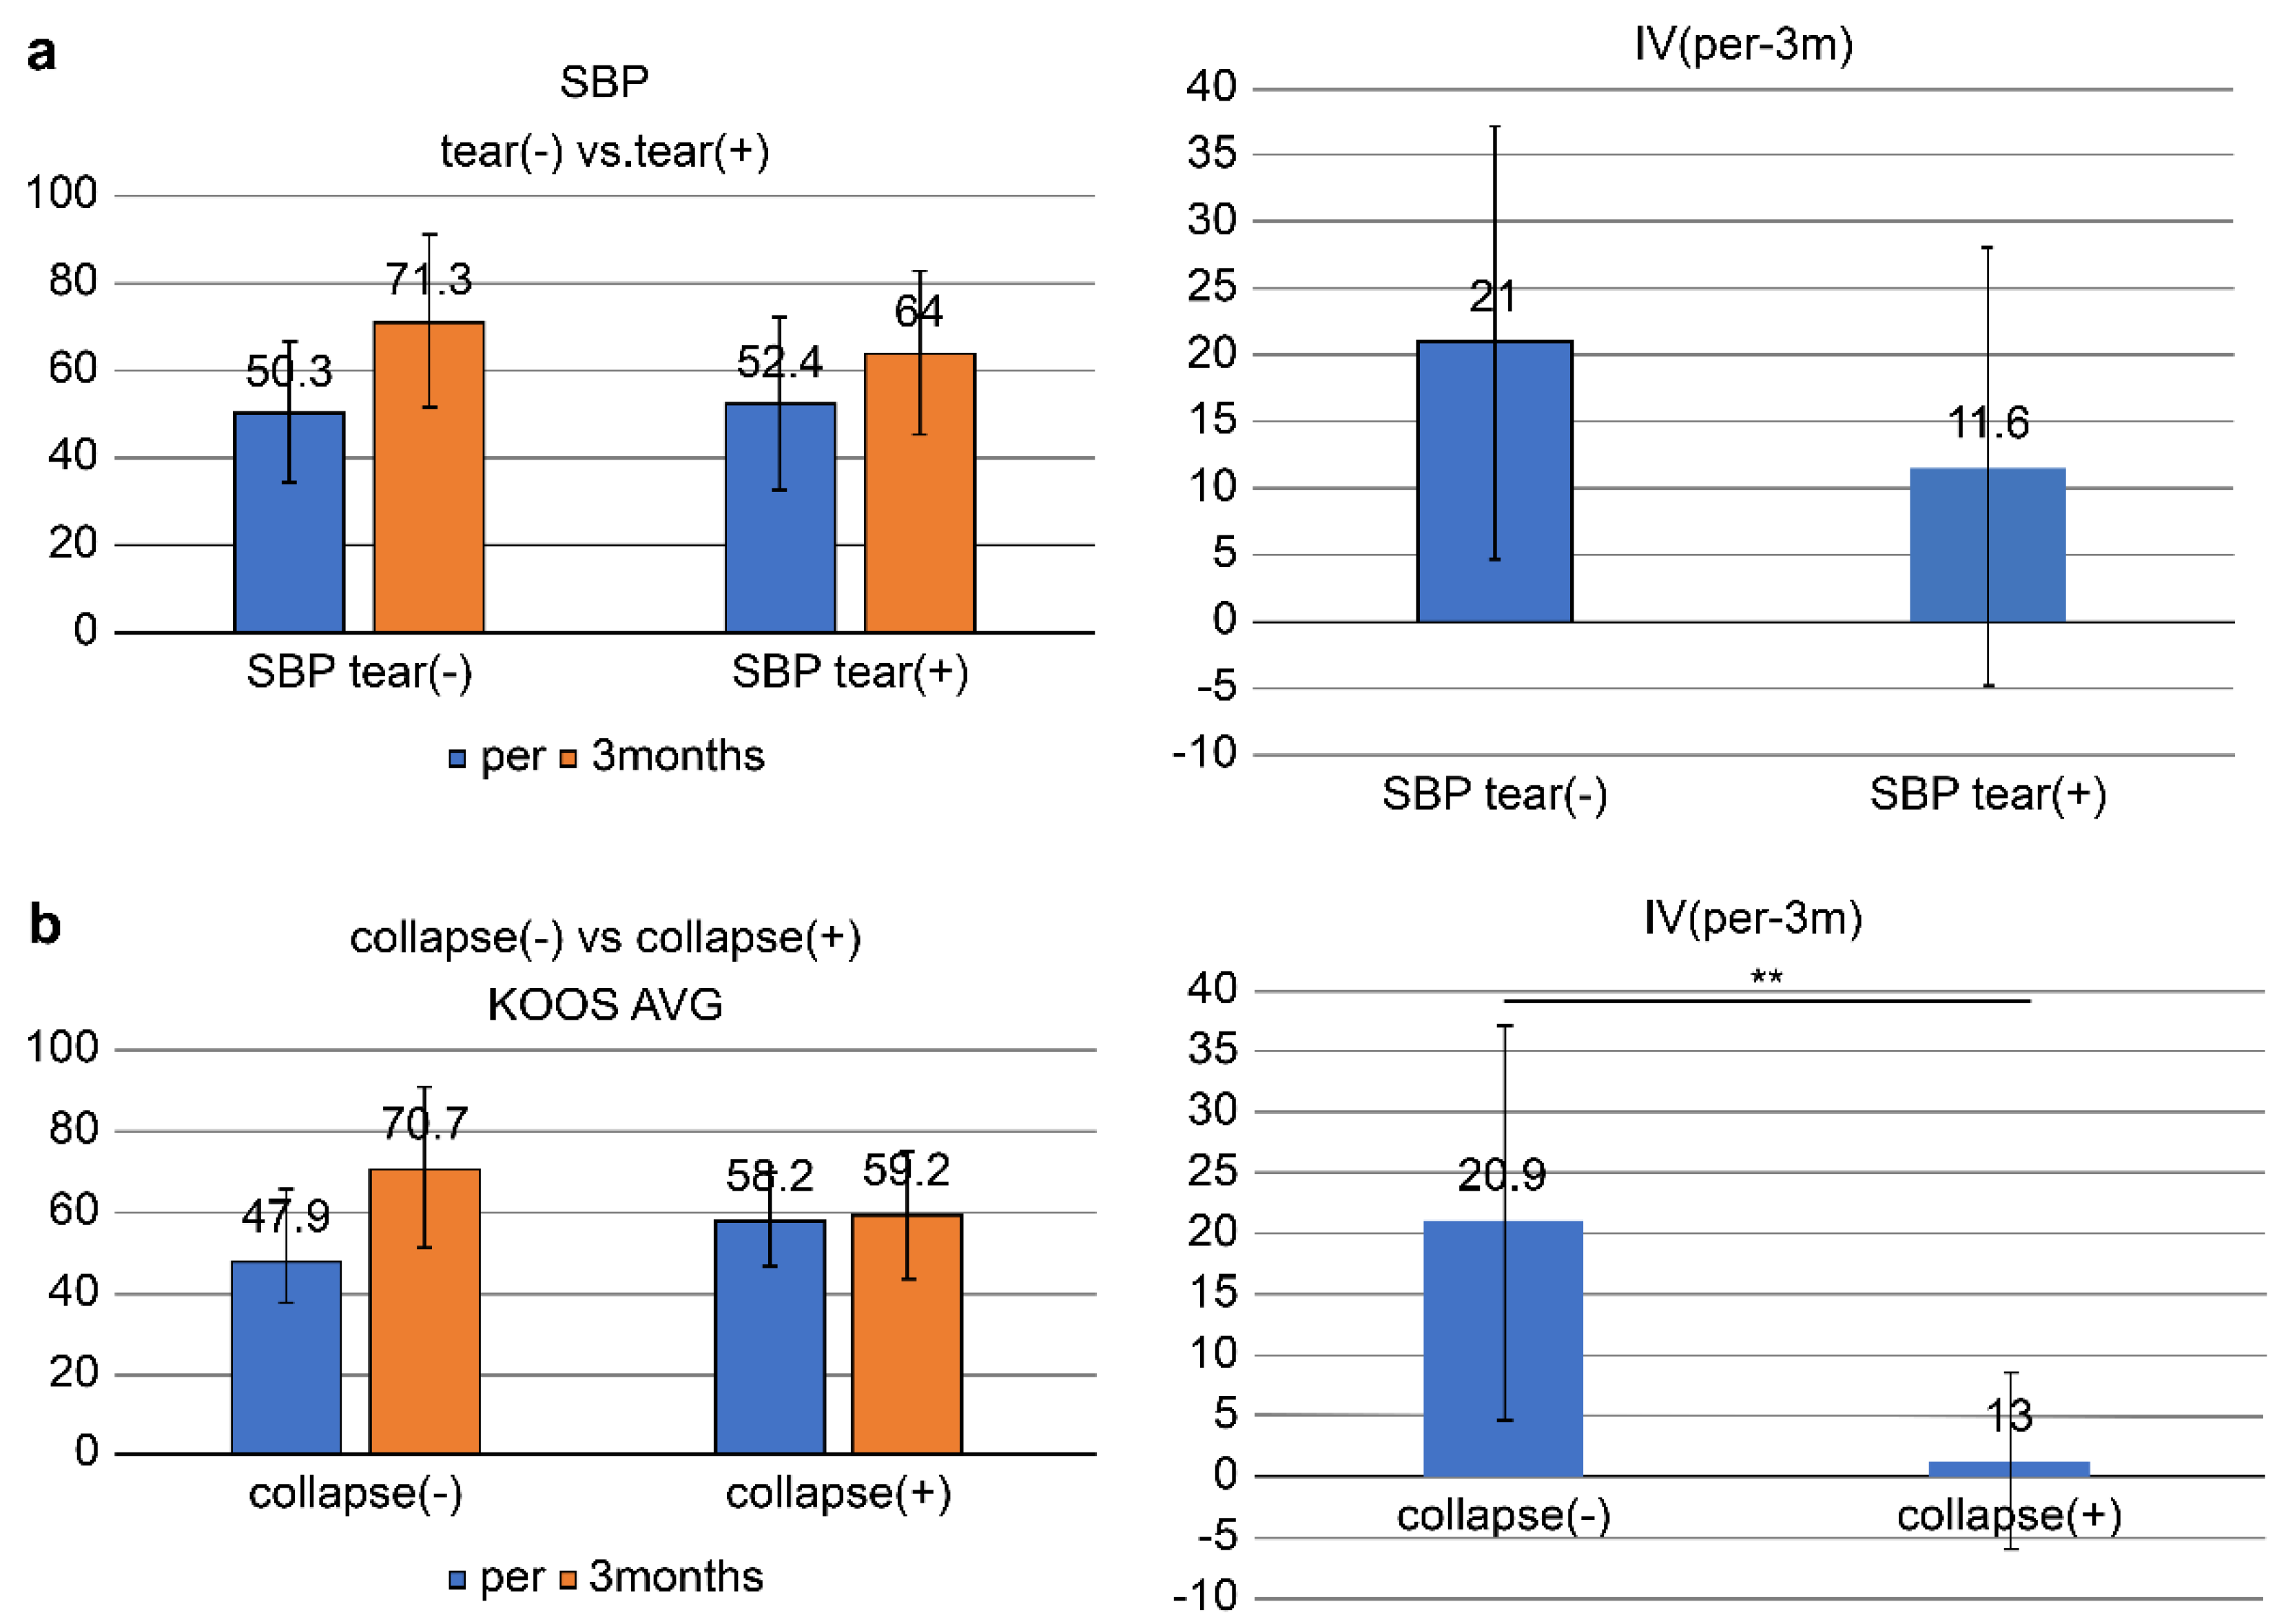
Figure 6.
(a) MRI images of the knee (Case 1). Comparison of pretreatment and 1-year follow-up MRI images shows a reduction in the BML, repair of the SBP tear, and increased cartilage thickness. BML, bone marrow lesion. (b) MRI images of the knee (Case 2). Compared with baseline, the 5-year MRI shows improvement of bone sclerosis and clear thickening of the cartilage layer (yellow arrows), suggesting long-term cartilage protection and regeneration.
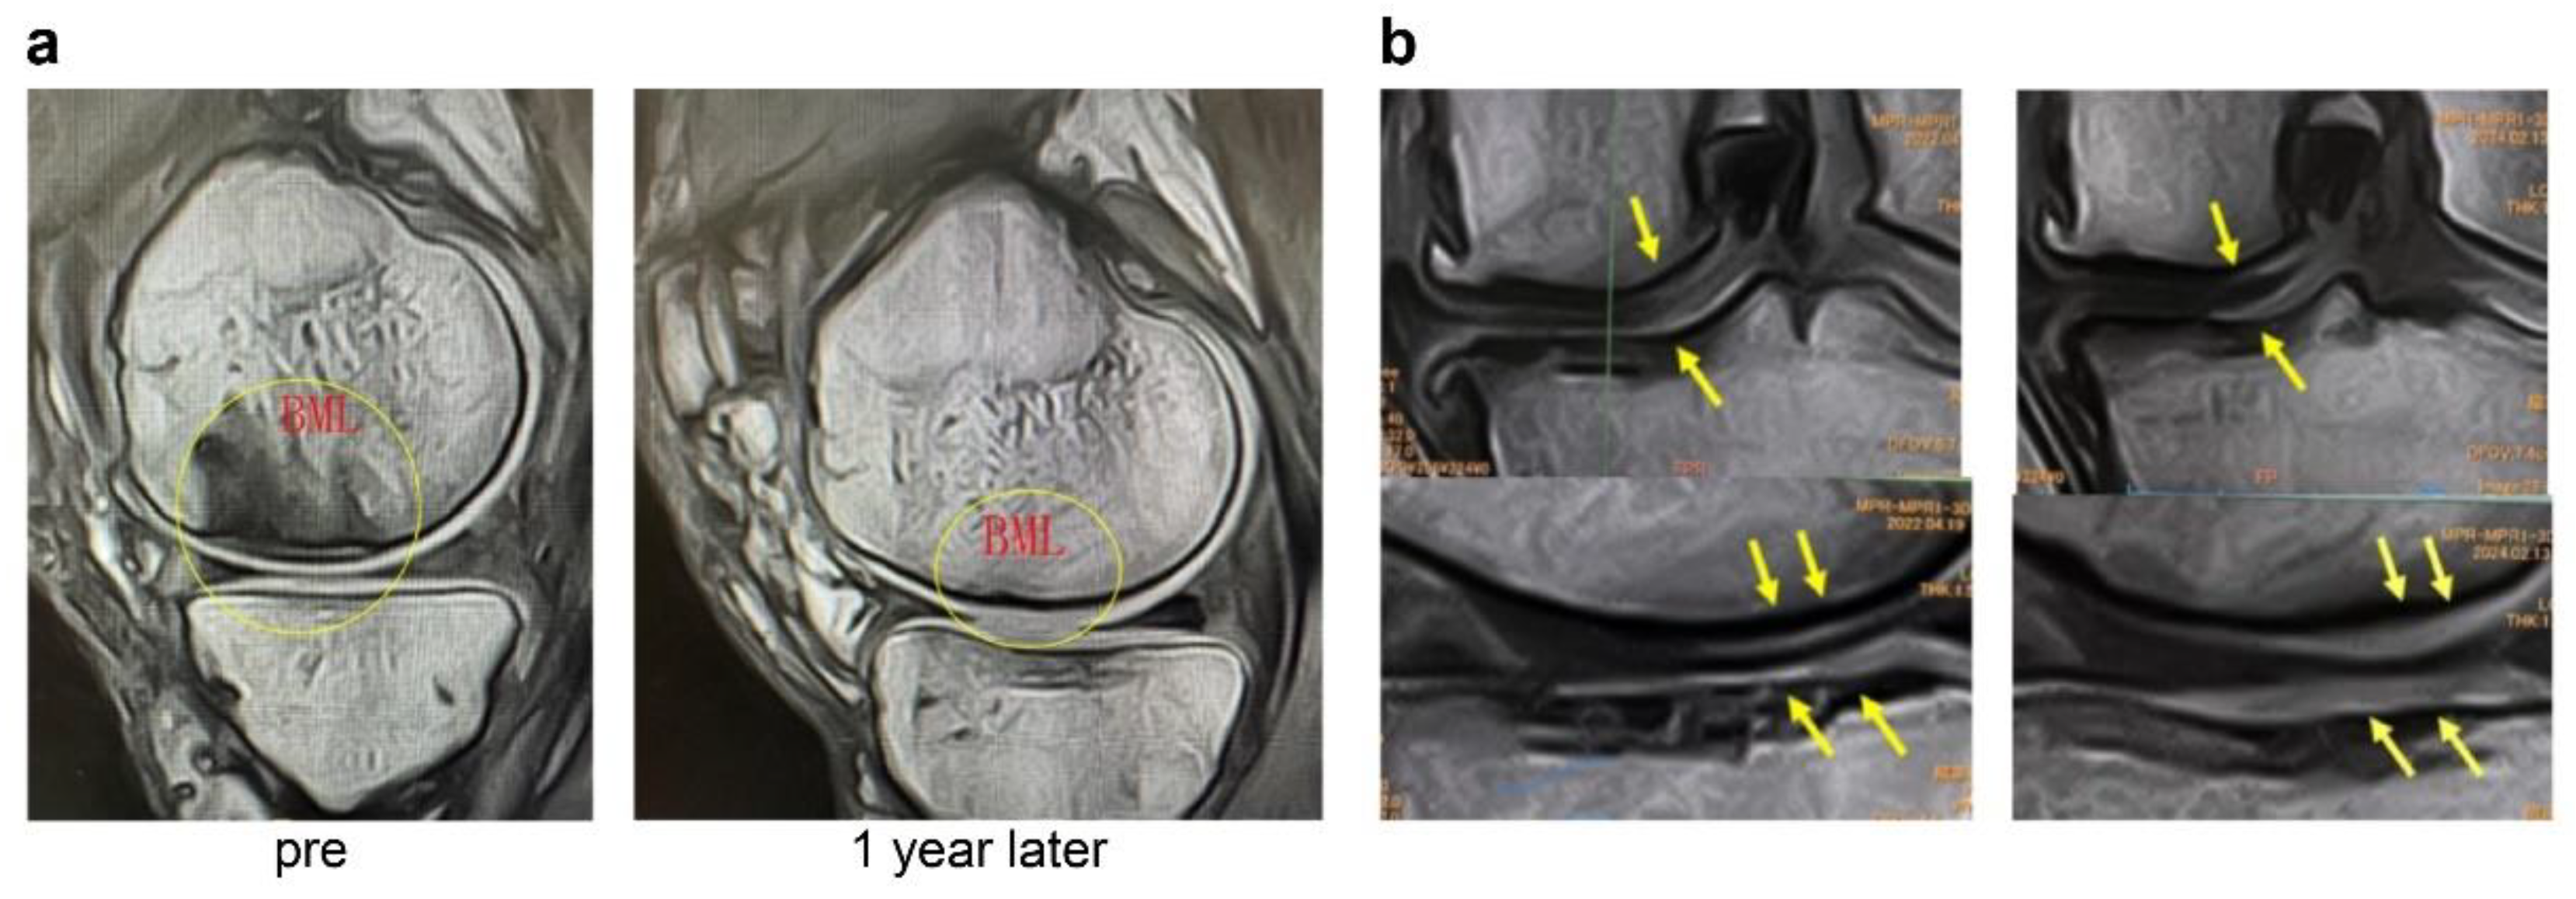
Figure 7.
(a) KOOS score changes in the subgroup. In cases with SBP tear but no joint surface collapse, all groups showed KOOS improvement. The MSC-A + ESWT group demonstrated the greatest gain at 3 months, but subsequent improvement was limited. ESWT alone and APS + ESWT showed more gradual progress, narrowing the difference with MSC-A by 6 months. APS + ESWT, autologous protein solution + extracorporeal shockwave therapy; ESWT, extracorporeal shockwave therapy; MSC-A + ESWT, intra-articular mesenchymal stromal cell administration + extracorporeal shockwave therapy; KOOS, Knee Injury and Osteoarthritis Outcome Score. (b) Comparison of improvement values (IV) among groups. The MSC-A+ESWT group showed the greatest improvement at 3 months, but by 6 months, there were no significant differences compared with ESWT alone or APS+ESWT. APS + ESWT, autologous protein solution + extracorporeal shockwave therapy; ESWT, extracorporeal shockwave therapy; MSC-A, intra-articular mesenchymal stromal cell administration; IV, improvement value.
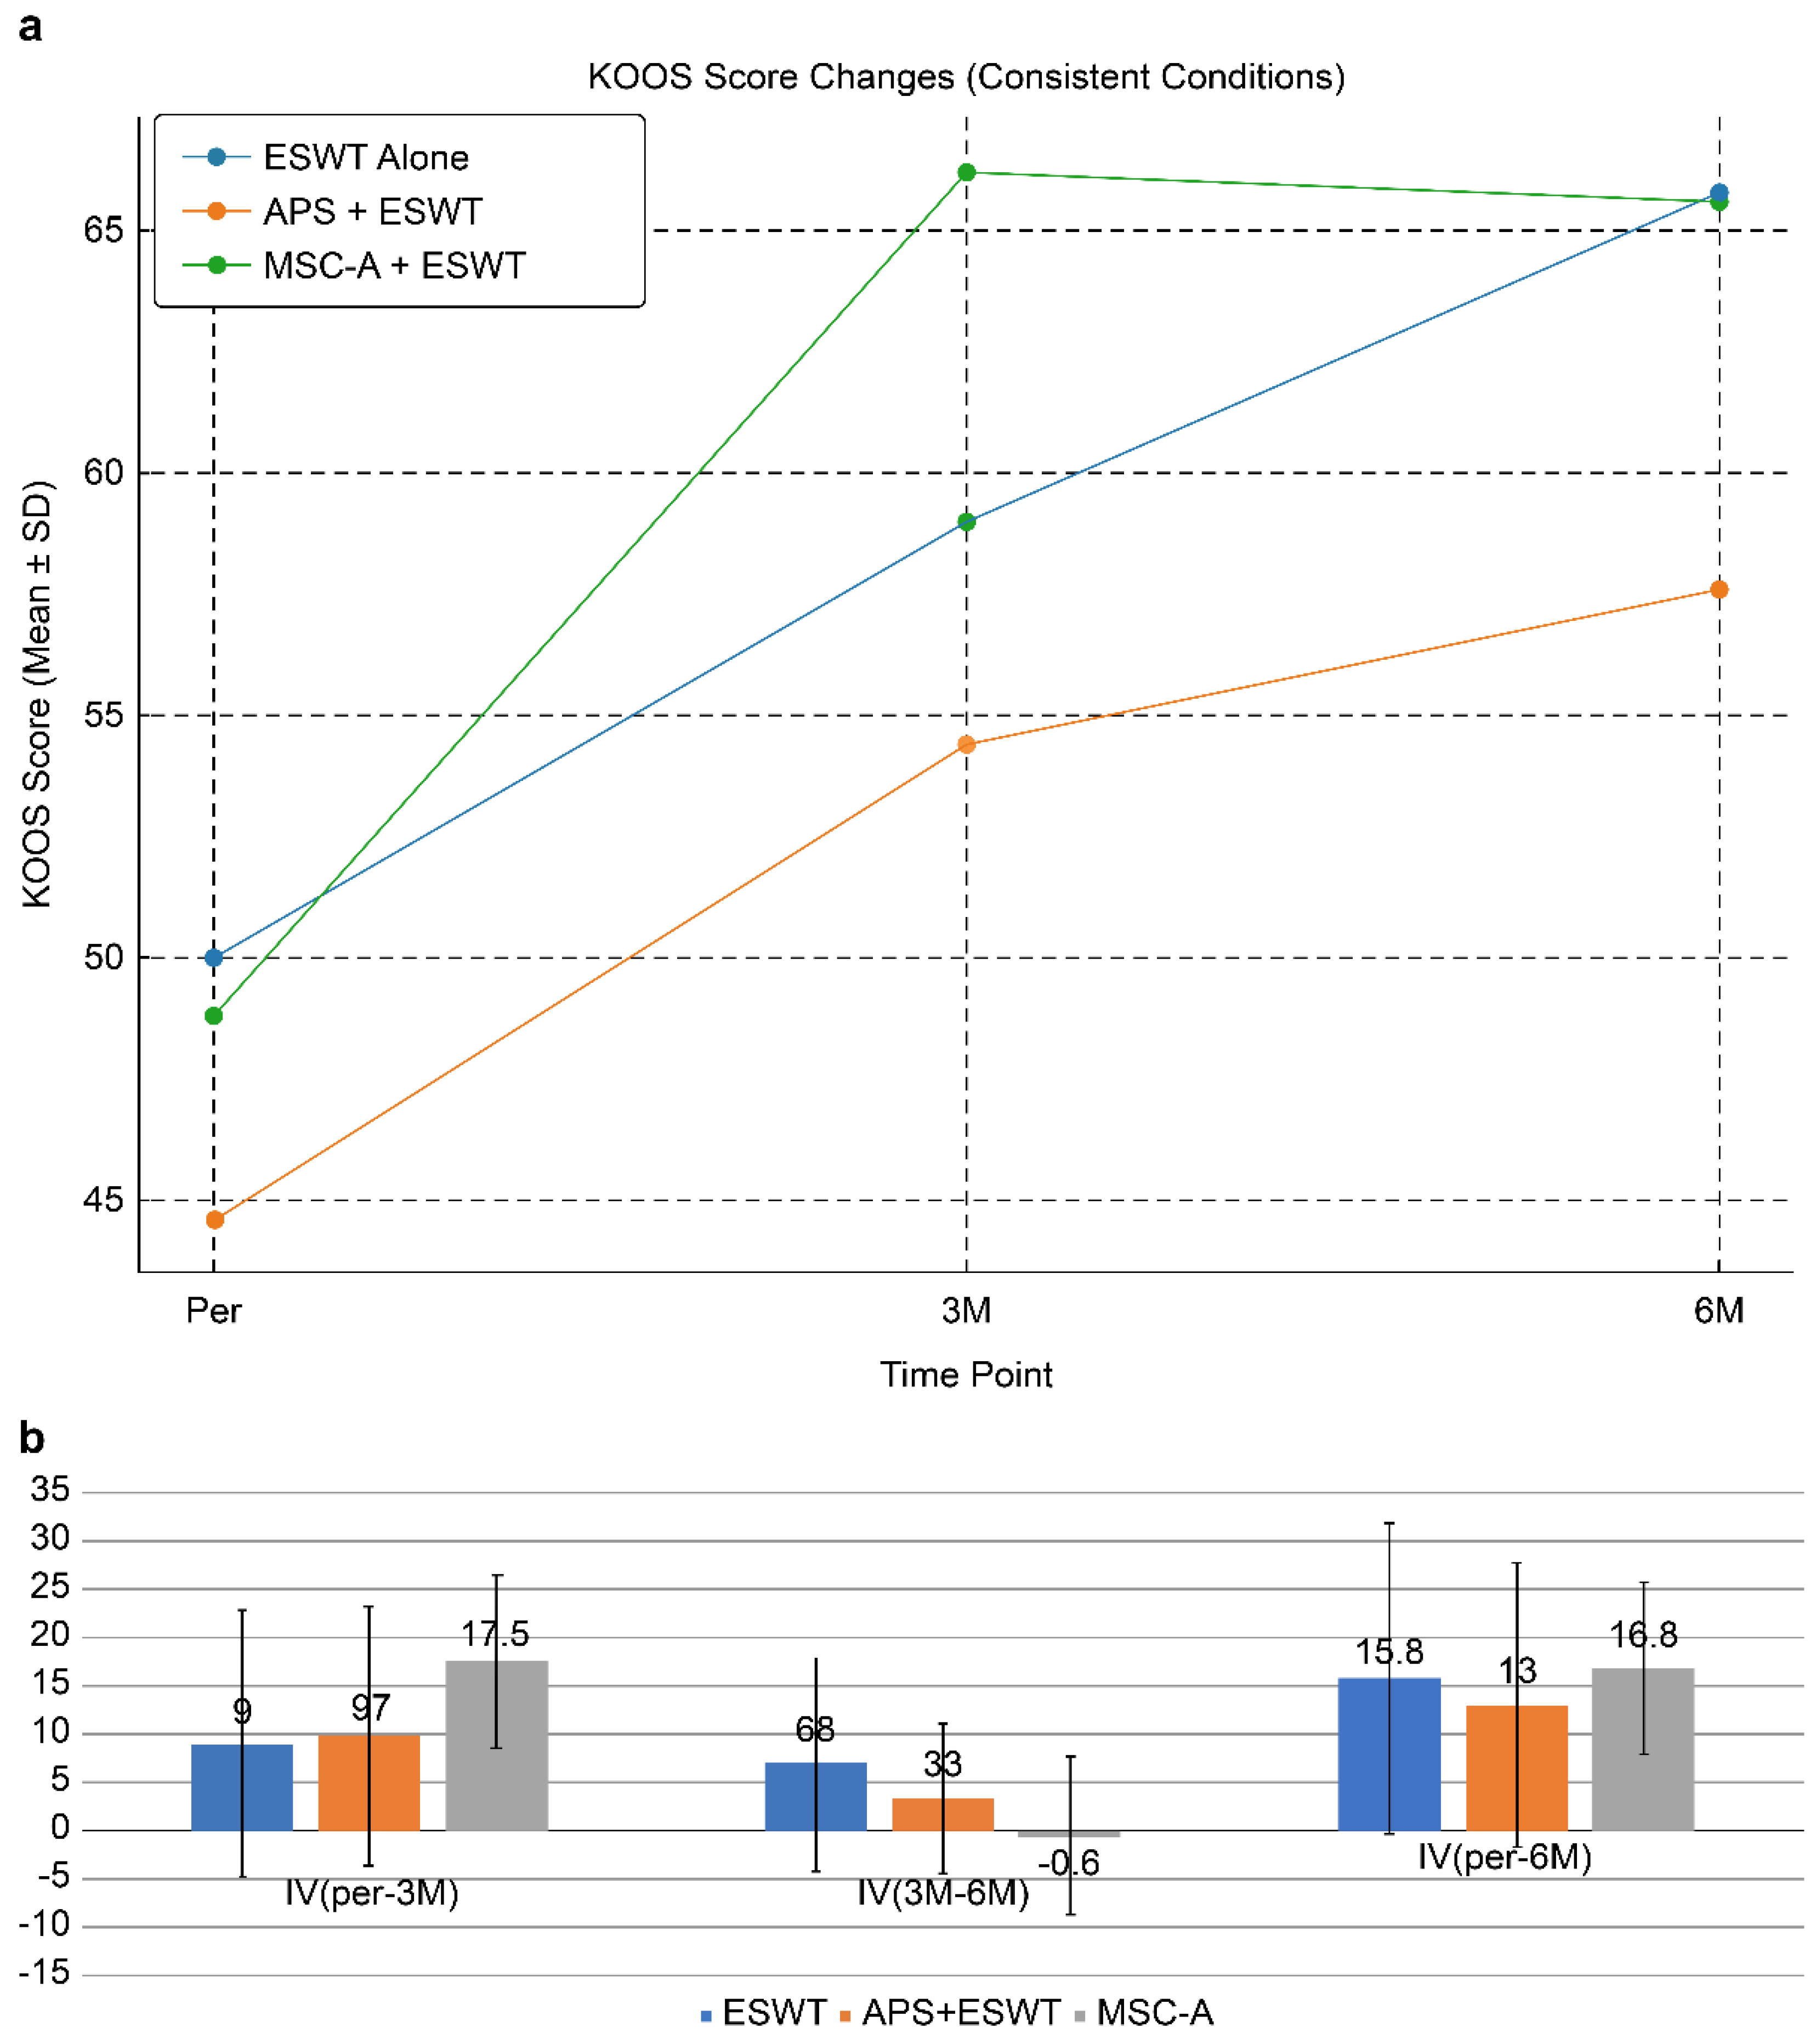
Figure 9.
(a) MRI changes after combined intra-articular/intraosseous MSC administration and ESWT in a 63-year-old male. T1-weighted coronal views (top row) and T2-weighted coronal views (bottom row) at baseline, 1, 3, and 6 months. The targeted area (yellow circles) demonstrated near-complete restoration of the articular surface and SBP at 6 months. (b) Detailed observation of lesions in T2-weighted images. Enlarged views of the joint surface from the T2-weighted images shown in Figure 10-a. The BML and articular surface disruption observed pretreatment showed progressive repair at 1 and 3 months, with near-complete restoration achieved by 6 months.
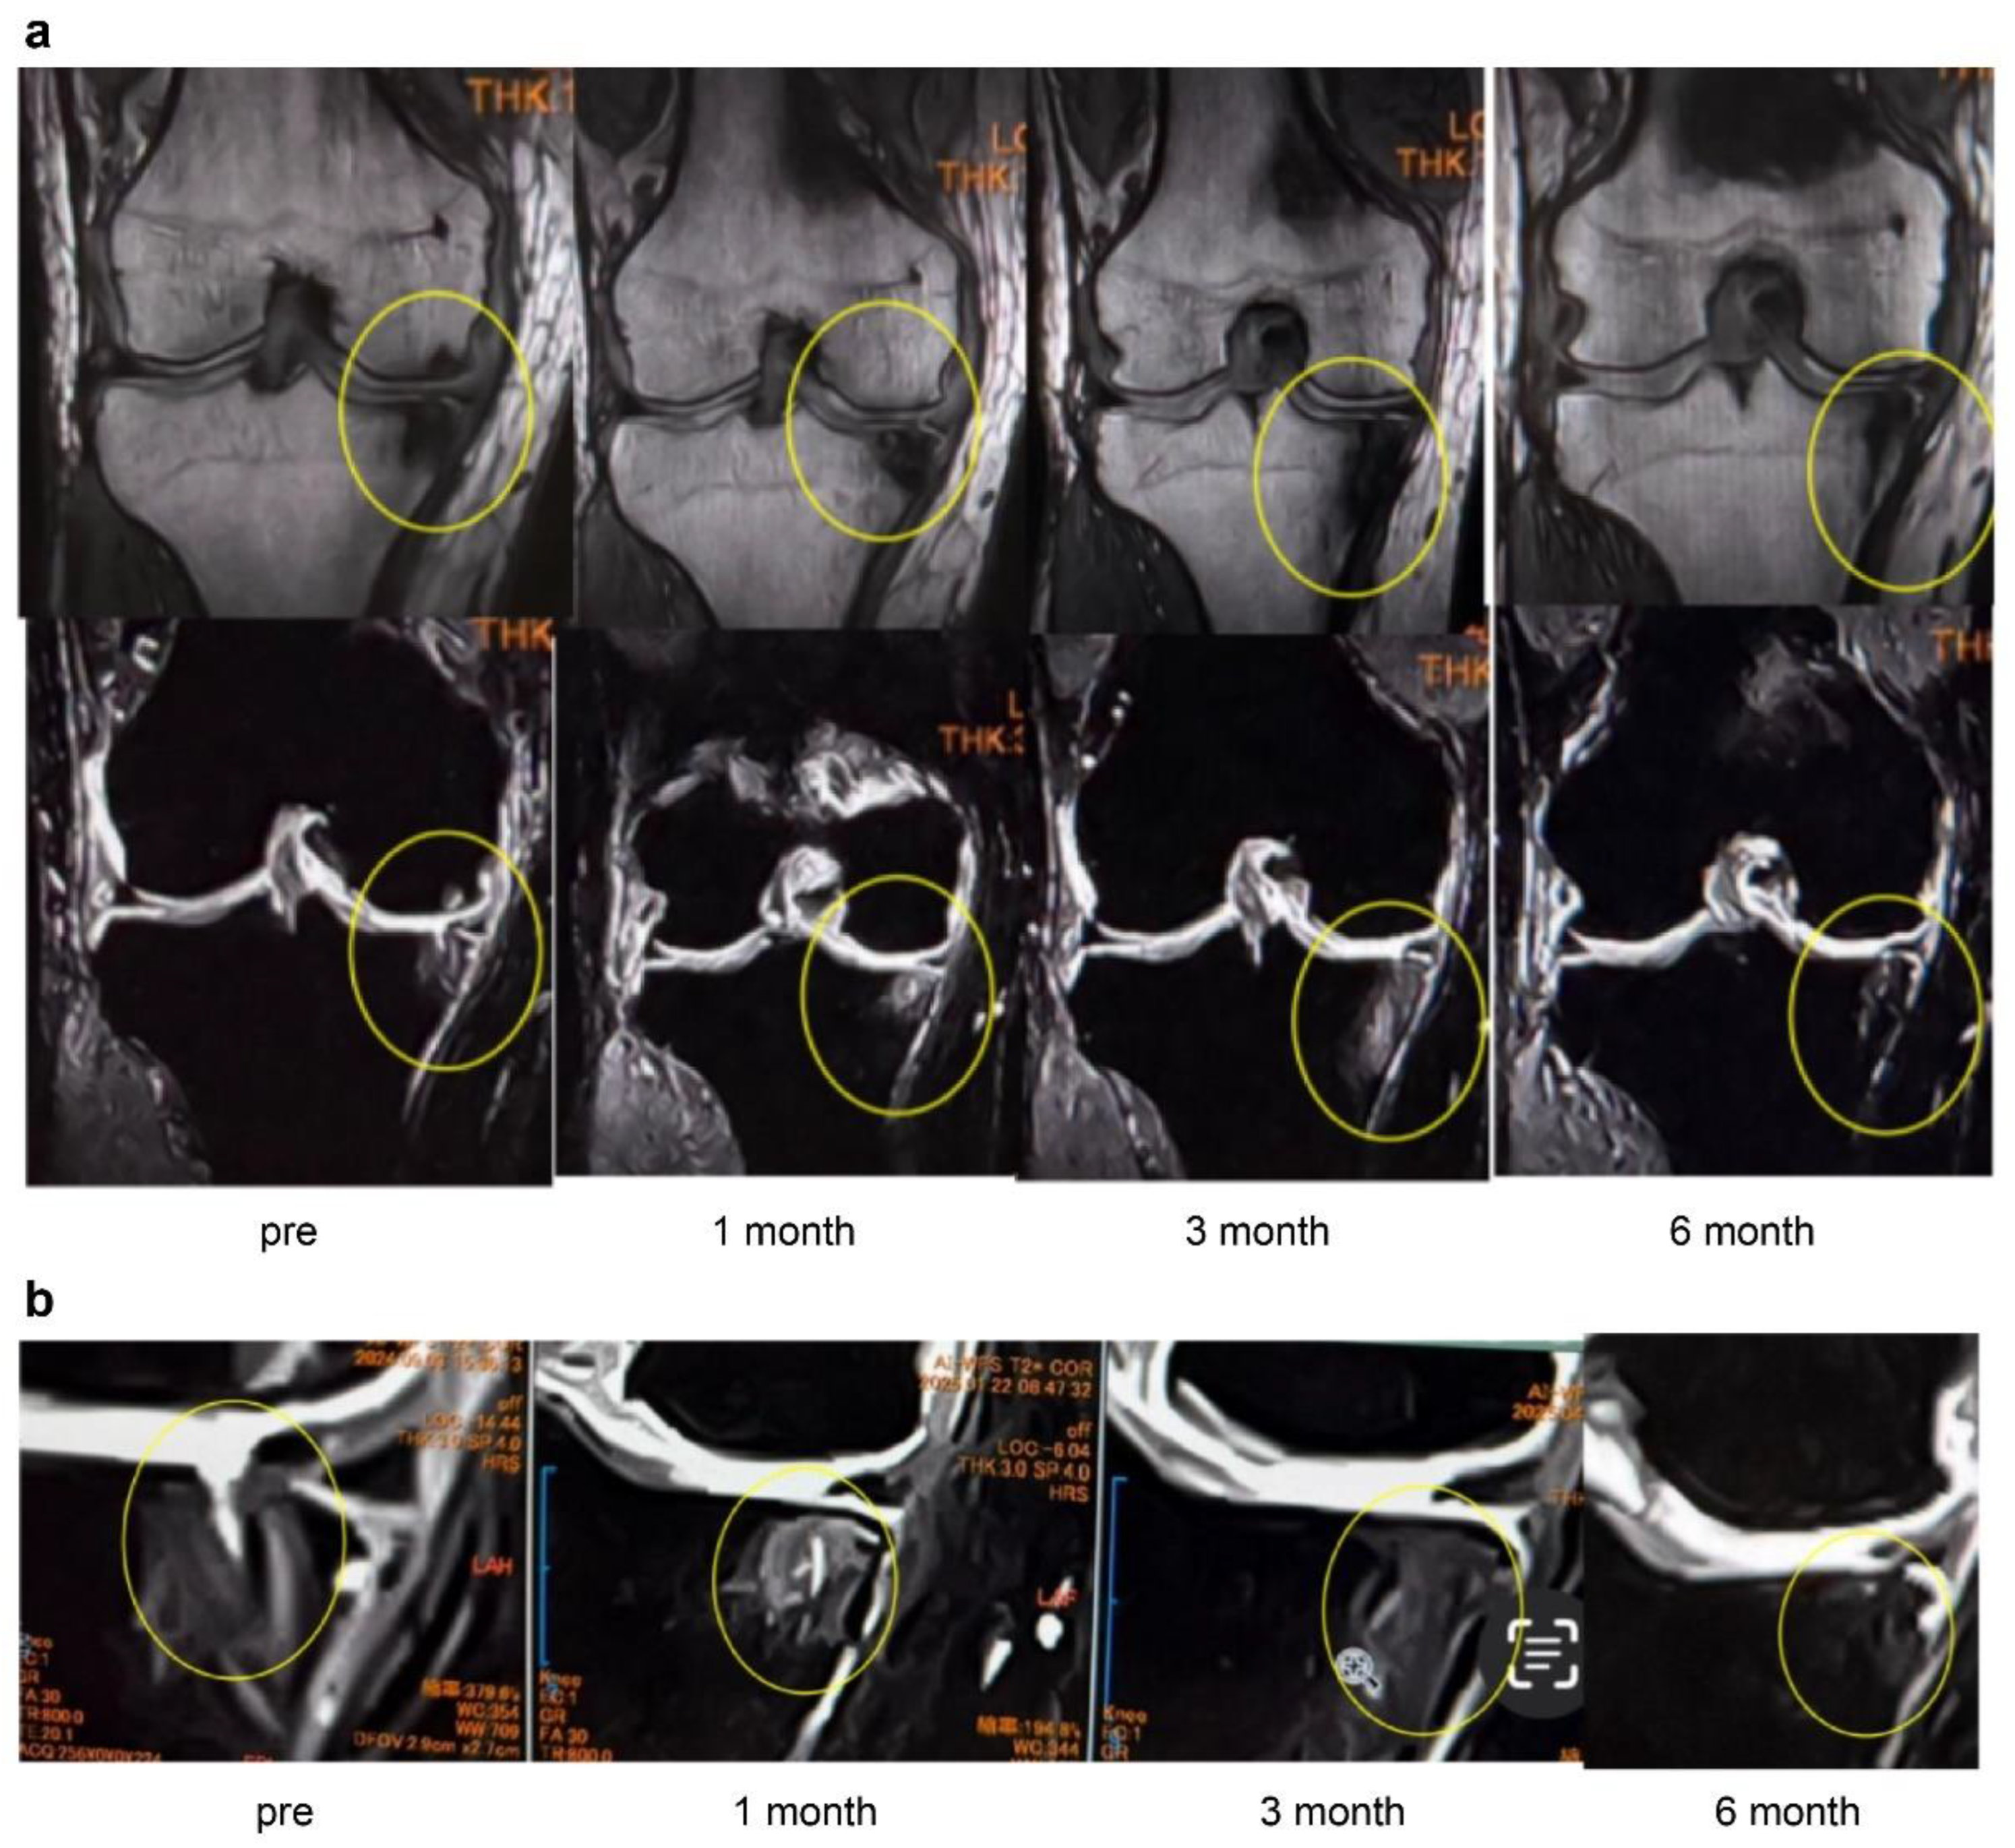
Figure 10.
Progression of subchondral bone collapse after intraosseous MSC administration (T2-weighted images). MRI scans at 1 month and 4 months post-treatment. The left images show sagittal views, and the right images show coronal views. Yellow circles and red arrows indicate progressive subchondral bone collapse and depression of the articular surface from 1–4 months. In cases with extensive BML near the articular surface, MSC administration may increase bone fragility, necessitating cautious rehabilitation and load management.
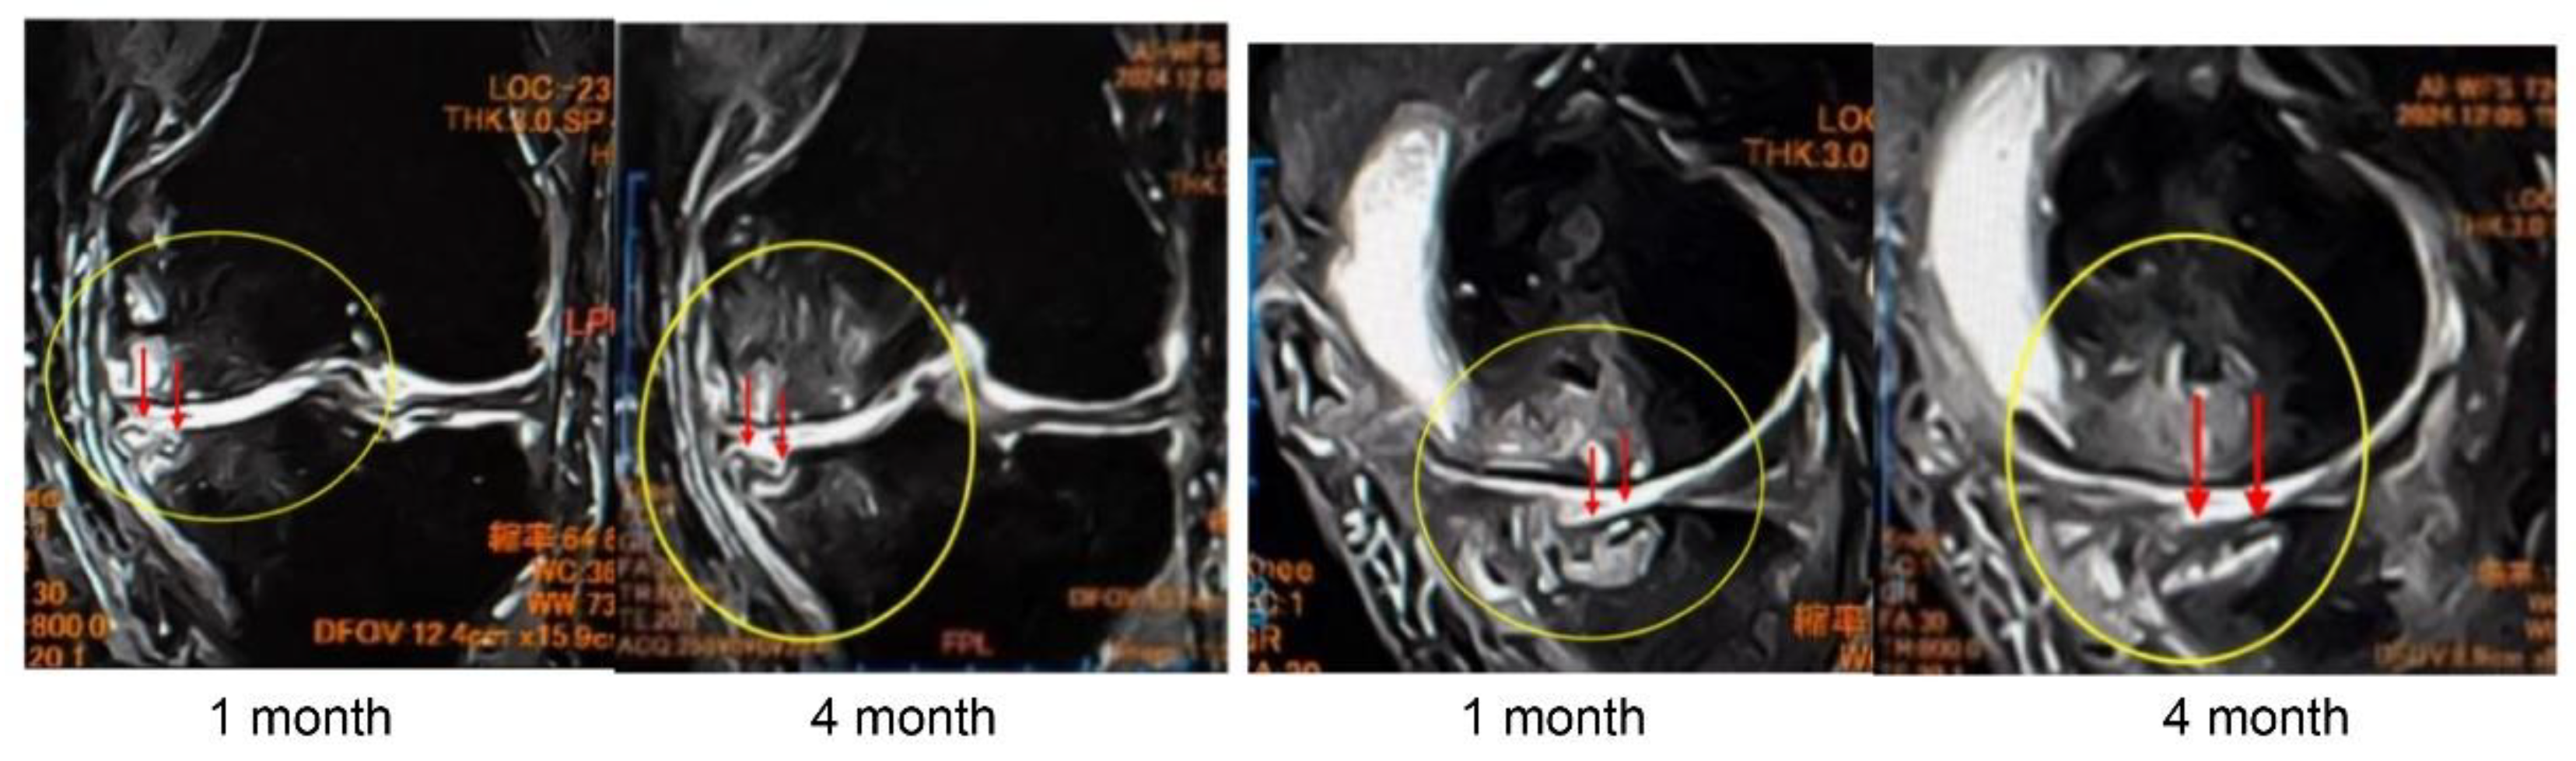
Figure 11.
(a) Changes in KOOS scores (pre, 3M, 6M). All groups improved, with MSC-B+ESWT showing the greatest improvement, while MSC-A+ESWT plateaued after 3 months. APS + ESWT, autologous protein solution + extracorporeal shockwave therapy; ESWT, extracorporeal shockwave therapy; MSC-A + ESWT, intra-articular mesenchymal stromal cell administration + extracorporeal shockwave therapy; MSC-B + ESWT, intra-articular and intraosseous mesenchymal stromal cell administration + extracorporeal shockwave therapy; KOOS AVG, mean Knee injury and Osteoarthritis Outcome Score. (b) Comparison of KOOS scores among treatment groups. Mean KOOS scores at baseline (pre), 3 months (3M), and 6 months (6M) are shown. All groups demonstrated improvement, with the MSC-B group maintaining the highest improvement at 6 months. APS + ESWT, autologous protein solution + extracorporeal shockwave therapy; ESWT, extracorporeal shockwave therapy; MSC-A + ESWT, intra-articular mesenchymal stromal cell administration + extracorporeal shockwave therapy; MSC-B + ESWT, intra-articular and intraosseous mesenchymal stromal cell administration + extracorporeal shockwave therapy; KOOS AVG, mean Knee injury and Osteoarthritis Outcome Score.
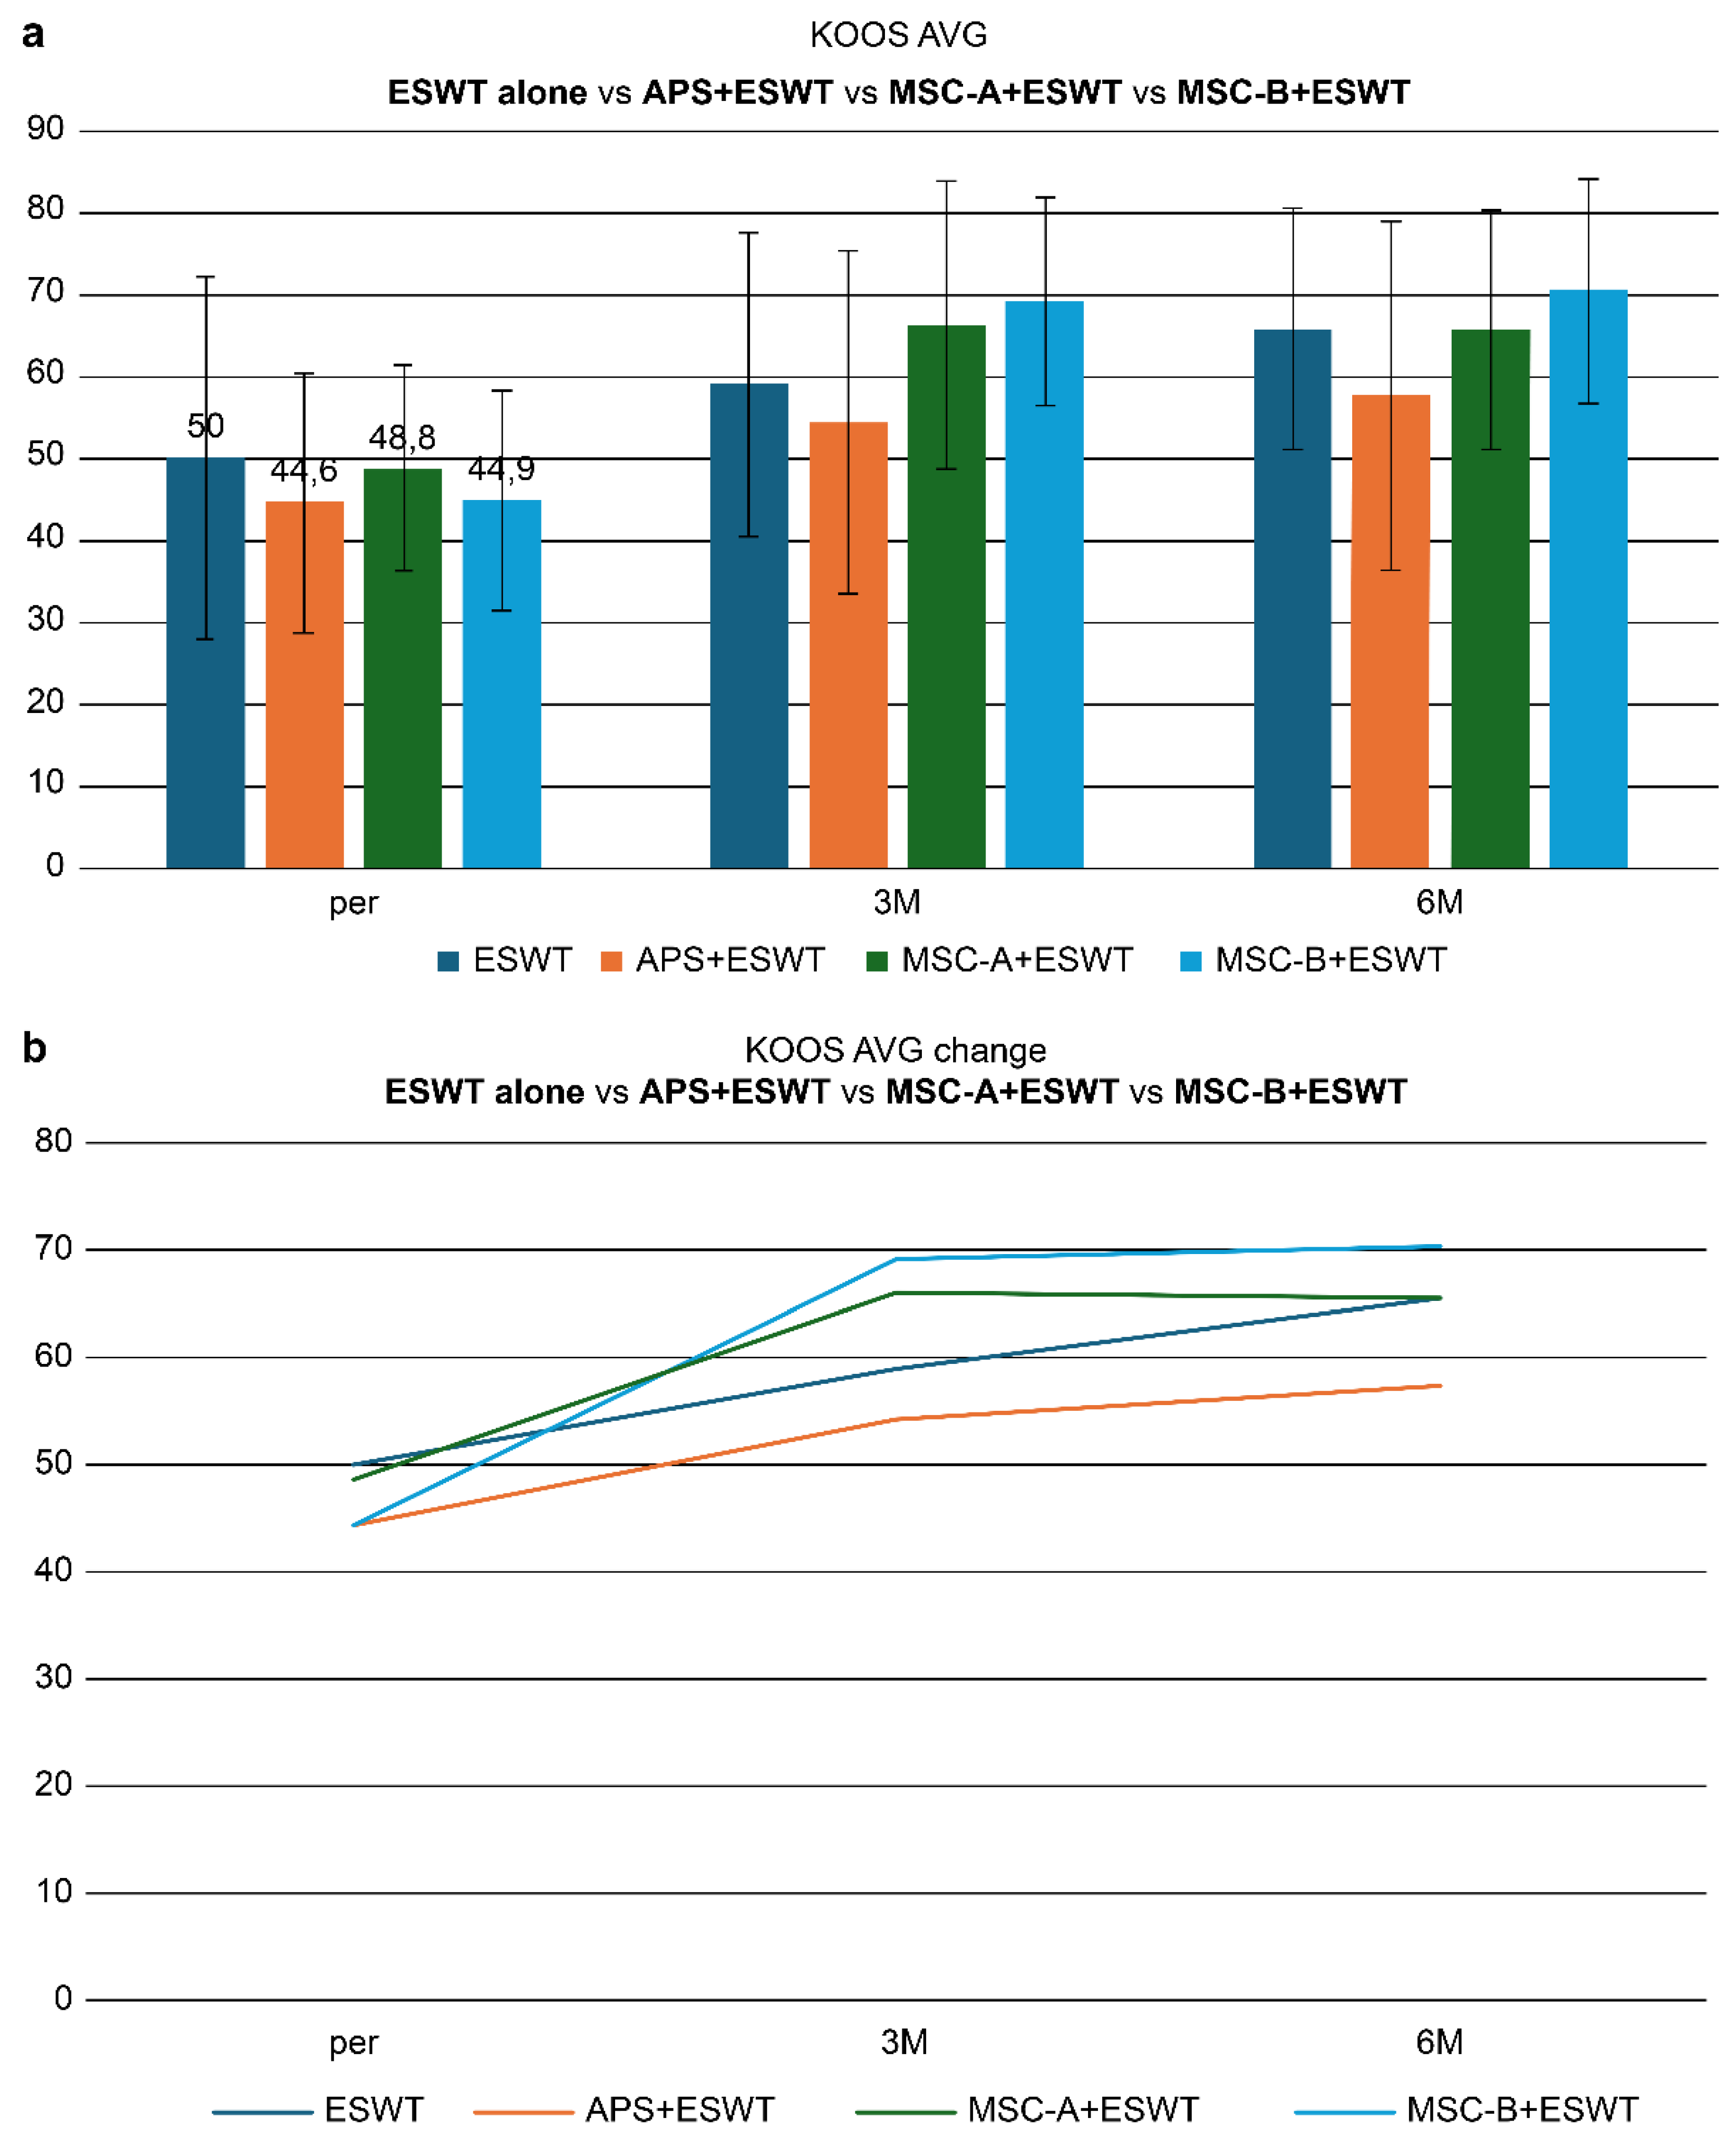

Table 1.
Baseline characteristics of all patients.
| Parameter | ESWT alone | APS + ESWT | MSC-A + ESWT |
|---|---|---|---|
| Number of patients (knees) | 40 (41) | 47 (54) | 12 (16) |
| Age (mean ± SD) | 65.4 ± 9.2 | 69.8 ± 10.2 | 72.2 ± 10.6 |
| Sex (M: F) | 15:25 | 12:35 | 5:7 |
| KL grade (2:3:4) | 8:20:13 | 9:15:30 | 1:4:11 |
| SBP tear (present: absent) | 13:28 | 30:24 | 14:2 |
| Joint surface collapse (present: absent) | 6:35 | 8:46 | 4:12 |
| ESWT sessions (mean ± SD) |
4.4 ± 1.3 (3-month) 6.0 ± 2.4 (6-month) |
7.0 ± 3.2 (6-month) |
7.5 ± 3.5 (6-month) |
| Treatment duration | 2–4 weeks intervals | 2–4 weeks intervals | 2–4 weeks intervals |
Age, sex, KL grade, SBP tear, joint surface collapse, and treatment sessions are shown across groups. All therapies were performed at 2–4 week intervals. ESWT, Extracorporeal shockwave therapy; APS, Autologous protein solution; MSC, Mesenchymal stromal cells; SBP, Subchondral bone plate; SD, standard deviation.
Table 2.
Baseline characteristics of subgroup: SBP tear(+) and joint surface rupture(-).
| Parameter | ESWT alone | APS + ESWT | MSC-A + ESWT |
| Number of patients (knees) | 8 (8) | 20 (22) | 7 (10) |
| Age (mean ± SD) | 64.1 ± 8.7 | 69.9 ± 8.1 | 71.1 ± 13.0 |
| Sex (M:F) | 4:4 | 4:16 | 4:3 |
| KL grade (3:4) | 4:4 | 4:18 | 4:7 |
| SBP tear (present:absent) | 8 all | 22 all | 10 all |
| Joint surface collapse (present:absent) | 0 | 0 | 0 |
| ESWT sessions (mean ± SD) |
6.5 ± 2.6 times (6-month) |
4.8 ± 3.8 times (6-month) |
8.1 ± 3.8 times (6-month) |
| Treatment duration | 2–4 weeks intervals | 2–4 weeks intervals | 2–4 weeks intervals |
APS, autologous protein solution; ESWT, extracorporeal shockwave therapy; F, female; KL, Kellgren–Lawrence; M, male; MSC-A, microfat stromal cell–augmented; SBP, subchondral bone plate; SD, standard deviation.
Disclaimer/Publisher’s Note: The statements, opinions and data contained in all publications are solely those of the individual author(s) and contributor(s) and not of MDPI and/or the editor(s). MDPI and/or the editor(s) disclaim responsibility for any injury to people or property resulting from any ideas, methods, instructions or products referred to in the content. |
© 2025 by the authors. Licensee MDPI, Basel, Switzerland. This article is an open access article distributed under the terms and conditions of the Creative Commons Attribution (CC BY) license (http://creativecommons.org/licenses/by/4.0/).
Copyright: This open access article is published under a Creative Commons CC BY 4.0 license, which permit the free download, distribution, and reuse, provided that the author and preprint are cited in any reuse.


