
Submitted:
26 September 2025
Posted:
06 October 2025
You are already at the latest version
Abstract
This article examines the impact of students’ prior experience with English on their academic success in an English course at university. The study is based on a survey conducted with students majoring in Computer Science, Business Information Technology (BIT), and Software Technology and Design (STD) at the Faculty of Mathematics and Informatics (FMI), University of Plovdiv, at the beginning of their general English language course. We focus on students’ self-assessed language competence at the start of the course and examine how these self-assessments correspond to their actual test results. Using high-performance machine learning methods, we identify background factors that influence academic achievement, including the number of years spent learning English, the type of high school attended, and informal exposure to English. The findings aim to support more effective and tailored approaches to teaching English in technical and scientific disciplines.
Keywords:
predicting educational skills
; bachelor degree students
; CART Ensemble and bagging method
1. Introduction and Preliminaries
This study examines the impact of prior English learning experience on students’ academic success in university-level English courses. It draws on data from a survey completed by first-year students enrolled in Computer Sciences and related degree programs (majors) at FMI before their English course.
In this article, we focus on how students rate their own English skills at the beginning of the course and whether these perceptions are confirmed by their actual test performance. We also investigate which background factors – such as previous exposure to English inside and outside school – are most closely related to success in the course.
To understand what best predicts achievement, we apply a high-performance machine learning (ML) method, CART Ensemble and Bagging (CART Ebag), to both the survey responses and the students’ language test results. The goal is to gain insight into how different types of prior experience influence performance and, in turn, inform more responsive teaching strategies tailored to students in STEAME-related fields. This study builds upon previous research that explores how social, economic, and motivational factors contribute to students’ success in learning English as a foreign language. Several recent studies have examined the impact of learner attitudes, beliefs, and emotions on English language outcomes in diverse contexts. Previous research has examined similar issues, including work in [6,8,9,10,11,13,16,17,18,21].
One such investigation was conducted by El-Omari, in [14], who surveyed 496 secondary school students in Jordan using a 16-item yes/no questionnaire. His study found that students who reported more positive attitudes toward English, greater informal exposure to the language, and stronger parental support achieved higher academic results. Factors such as higher family income, having a quiet study space, and access to English media (including TV, newspapers, and dictionaries) were also associated with better performance. While El-Omari focused on secondary-school learners and relied on a basic yes/no questionnaire format, our study targets university-level bachelor’s degree students. It employs a more detailed survey including Likert-scale statements and open-ended questions. Additionally, we employ regression analysis to investigate which background variables, such as type of school, years of prior study, or self-assessed skills, can predict academic achievement in English. In doing so, we aim to extend previous findings to a new learner profile and educational context by focusing on students in a university setting.
A recent study, in [15], further underscores the intricate relationship between learners’ experiences and their motivation to learn English. Focusing on Japanese elementary school students, the authors examined how external influences such as family, school environment, and exposure to English-language media shape what is known as the ”ideal L2 self“, or learners’ future-oriented vision of themselves as competent English users. Using hierarchical regression analysis, they found that while past exposure through cram schools and travel abroad initially appeared significant, these factors were outweighed by the ongoing influence of parents, teachers, and media. The study confirms that the surrounding social and educational environment plays a critical role in sustaining students’ motivation to learn English, suggesting that long-term success may depend less on isolated experiences and more on consistent support from key figures and resources in learners’ daily lives.
Another relevant study in [19] examined how students’ beliefs about learning English affect their achievement, both directly and indirectly, through emotional factors. The researchers surveyed 440 Ethiopian university students and found that learners who held more sophisticated beliefs, such as confidence in their own efforts, openness to risk-taking, and a realistic view of English difficulty, performed better on English tests. These beliefs were also linked to reduced levels of anxiety and embarrassment and, in some cases, increased enjoyment. Using structural equation modelling, the study confirmed that emotional factors mediate the impact of learning beliefs on academic performance. The findings highlight the importance of promoting both advanced language learning beliefs and supportive emotional experiences to enhance students’ success in English, particularly in STEAME-related fields.
Liu and Li in [18] also examined how internal learner factors, specifically classroom anxiety and motivation, affect English achievement. Surveying over 570 Chinese university students, they found that higher levels of English classroom anxiety were significantly associated with lower test scores and self-rated proficiency. At the same time, both intrinsic and extrinsic motivation were positively associated with better outcomes. Interestingly, the study also showed that students’ motivation and anxiety were inversely related, suggesting that reducing anxiety may boost motivation and vice versa. Drawing on self-determination theory, the authors recommend addressing emotional barriers and fostering motivational support as key strategies for improving performance in foreign language learning.
[8] examine how fuzzy logic can provide a fairer assessment of students’ mathematical knowledge by integrating written and oral grades with standardized test results. Using data from Italian high school students who also took the national INVALSI (the Italian National Institute for the Evaluation of the Education and Training System) math exam, they applied two defuzzification methods – centre of gravity and mean of maximum – to generate final grades. Both methods yielded lower average scores than traditional teacher assessments, with the centre of gravity approach producing the most conservative results.
Building on the idea of alternative evaluation methods, [6] proposed an intelligent, computer-based testing system tailored for humanities students, who often provide narrative answers to open-ended questions. The system employs the shingle algorithm, together with stemming and MD5 hashing, to compare student answers against an ideal reference response. It measures the degree of matching (S), completeness (P), and overall effectiveness using the F-measure (F). Tested on a sample of 120 humanities students aged , the system achieved an optimal processing time (t) of approximately and an F-measure of , demonstrating a balance of accuracy and efficiency.
[9] propose a fuzzy logic model that integrates students’ school grades (written and oral) with their results on the national INVALSI mathematics assessment to provide a more balanced evaluation of knowledge. Using data from more than Italian students in grades 8, 10, and 13 during the 2018 – 2019 school year, the authors applied fuzzification, inference rules, and defuzzification to generate "hypothetical grades." The analysis reveals that these fuzzy logic-based grades are consistently and significantly lower than traditional teacher-assigned grades across all levels, indicating that the model mitigates grade inflation and teacher bias.
Similarly, applying fuzzy logic, [16] focused on predicting students’ academic performance based on perceptions of instructors. Using a Mamdani fuzzy inference model with survey data from 1,250 students, they evaluated the impact of trust, perception, and usefulness of instructors. The results indicated that trust and usefulness were strongly correlated with end-of-semester outcomes, demonstrating that fuzzy logic can effectively capture subjective perceptions to predict academic success.
The influence of contextual factors on fuzzy assessment is explored by [10]. Using hierarchical linear regression, they analyzed demographic variables, including gender, school type, and socioeconomic background. The study revealed that while fuzzy grading offers a more flexible evaluation framework, demographic differences continue to be significant predictors of academic outcomes.
Finally, [11] investigated the predictive power of machine learning, applying Random Forest regression to student performance on the INVALSI mathematics assessment. Combining traditional school grades with fuzzy-based grades, they compared linear models and Random Forest predictions. Their findings demonstrated that Random Forest regression improved predictive accuracy and highlighted the added value of fuzzy grades, which offer a more objective representation of student knowledge than teacher-assigned marks alone.
The present study aims to investigate the impact of key factors on knowledge acquisition in English language learning among students in computer science majors. At the same time, we expand the predictor model by including variables with more than binary values (yes/no) and increasing their total number to twelve. The relative influence of these predictors is assessed using the CART Ebag method. To our knowledge, such techniques have not been systematically applied in the context of English language education in technical majors. By introducing data-driven methods into language education research, this work expands the analytical toolkit available for exploring predictors of academic performance.
The findings aim to inform more responsive teaching strategies, tailored to the needs of students in STEAME-related fields, and to extend previous research that has examined how social, educational, and motivational factors affect English learning outcomes.
1.1. English Language Education at FMI
At FMI, English is a compulsory part of first-year studies. Its relevance is obvious: in the IT field, terminology, documentation, and professional communication are primarily conducted in English. Despite this, many students in mathematics and IT-related majors view English more as a tool than an academic subject. Because many have studied English in secondary school or independently, they often assume their language skills are already sufficient and not directly linked to their academic success. As a result, student motivation can vary considerably and often depends on their self-perceived competence and prior experience.
This study aims to identify which aspects of that prior experience best predict success in English at university.
Most students take English only during their first academic year: General English in the first semester and English for Specific Purposes (ESP) in the second. An exception is students majoring in Business Information Technology, who also take a course in Business English in their final year. At the start of the academic year, all students complete a placement test, and based on the results, they are placed in language groups of approximately 20 students with similar proficiency levels.
The General English course develops both language skills and cultural knowledge. Students complete tasks such as paraphrasing, summarising, proofreading, and note-taking. Broader academic topics, such as plagiarism, are also addressed. Cultural aspects are explored through discussions of stereotypes, idioms, gestures, and other nuances.
Students work individually or in small groups, submitting tasks through the Classroom platform or presenting them in class. In the first semester, students collaborate on a team project that includes building a website, giving a presentation, and creating a test.
In the English for Specific Purposes course in the second semester, the emphasis shifts to technical vocabulary and soft skills. Project work becomes individual, with students researching and presenting on technology-related topics.
Each week, students complete homework assignments, which may include recorded presentations, audio files, written tasks, or quizzes. These are uploaded to the Classroom platform before a set deadline. In addition to a midterm test, students take a final test covering the material studied during the course. Assessment is continuous and based on:
- Classwork (attendance and participation):
- Homework and project work:
- Final in-class test:
1.2. Participants and Data Collection
The study involved a random sample of 61 first-year students majoring in Computer Science (focused on programming), Business Information Technology (focused on the use of information technology in business), and Software Technology and Design (focused on the application of software products). The data included scores from the placement test and grades from various components of the course, including classwork, homework, project work, and final tests from both semesters, as well as self-assessments of knowledge and skills.
The first survey was conducted before the General English course (in the 2024/2025 academic year). It included closed-ended questions on gender, age, background, years of studying English, and type of secondary education. Other questions explored the intensity of school-based English learning, possession of English language certificates, and experiences using English abroad (e.g., reason for travel, duration, language challenges). Students were also asked about how frequently they practice English, their preferred activities, and their comfort level in participating in discussions in English. A final section used Likert-scale items to assess students’ views on the cultural aspects of language learning and asked them to identify their strongest and weakest language skills.
The second survey, conducted after the first semester, was shorter in length. Students were asked to self-assess their language progress on a scale ranging from ”significant improvement“ to ”slight worsening“, and to explain their response. They also suggested what might motivate them to put more effort into the English course in the second semester and offered recommendations for course improvement. The dataset also includes the results from the placement test and the final grades in General English and English for Specific Purposes (GRADE 1 and GRADE 2).
2. Initial Analysis and Research Methods
2.1. Initial Analysis
The sample includes 61 students (44 male and 17 female) enrolled in Computer Science programs at the Faculty of Mathematics and Informatics, University of Plovdiv ”Paisii Hilendarski“. They are distributed across three majors within the field of Informatics and Computer Science: Informatics (30 students), Business Information Technology (BIT) (14 students), and Software Technology and Design (STD) (17 students).
Most respondents (52) are between 18 and 20 years old, while nine fall in the range. By place of residence, 22 come from large cities, 33 from small towns, and six from villages. All participants studied English during secondary school: 25 for years, 27 for years, and only 9 for years. Eleven graduated from language schools, 16 from mathematics high schools, 13 from vocational schools, 16 from general high schools, and five from other types of schools.
In terms of intensity, had English lessons times per week, while reported receiving additional instruction outside the regular school curriculum. Ten students hold internationally recognized English language certificates. Nearly of the respondents have travelled abroad, most often for excursions.
A key part of Survey 1 was students’ self-assessment of the four language skills - reading Figure 1 (a), writing Figure 1 (b), listening Figure 1 (c), and speaking Figure 1 (d). Figure 1 presents bar charts of the distribution of these four indicators.
The self-assessments were coded on a scale from 2 to 6, as follows: 2 - awful, 3 - poor, 4 - good, 5 - very good, 6 - fluent. Each student’s average self-assessment was calculated as the arithmetic mean of the four coded scores. Descriptive statistics for these variables are presented in Table 1. The mean values show that the highest self-assessment is for reading (, CI ), followed by listening (, CI ). For both skills, the median is , indicating that more than half of the participants perceive themselves as very good in these areas. Lower mean scores are observed for speaking () and writing (), with a median of , which suggests some difficulties in these productive skills. The standard deviations () indicate moderate variability in the responses, with the greatest dispersion found in speaking. The overall average self-assessment across all four skills is ( CI ), with a median of , indicating that participants generally evaluate their language competence positively, but with distinctly higher results in receptive skills (reading and listening) compared to productive skills (speaking and writing).
Table 2 presents the descriptive statistics of the placement test, GRADE 1, and GRADE 2. The mean score for the Placement test is , while the median () is slightly higher, indicating a mild negative skewness; in other words, most students scored above the mean, but a few lower results pulled the average down. The standard deviation () shows moderate dispersion around the mean.
The mean grade for GRADE 1 is , with a narrow confidence interval (). The median () is close to the mean, suggesting a relatively symmetric distribution. The standard deviation is the smallest of the three, which indicates the least variation in results.
For GRADE 2, once again, the median is higher than the mean, showing negative skewness: more results are above the mean, but a few weaker performances lower the average. The standard deviation () is the highest among the three groups, which means that the results are more dispersed and heterogeneous.
The table also shows that average results improve from the placement test () to GRADE 1 () and remain relatively high for GRADE 2 (), though with greater variability. This suggests, on the one hand, progress in achievement, but also a wider spread of results in GRADE 2, with more weaker performances present.
3. Research Methods and Statistical Measures
CART (Classification and Regression Trees) is a method for building decision trees that can be used for both classification and regression [5]. To reduce CART’s tendency toward overfitting, a technique called Bagging (bootstrap aggregating), developed by [3], is applied. By combining multiple models trained on different bootstrap subsets, Bagging achieves lower variance and better generalization. The algorithm includes the following steps: drawing multiple subsets with replacement (bootstrap sampling); training a CART tree on each subset; aggregating predictions through averaging (for regression) or voting (for classification). For performance evaluation, cross-validation (CV) is the most commonly used method. This results in an ensemble model that is more stable and robust, while still retaining the interpretability of individual CART trees, even though the transparency of the ensemble as a whole decreases [3].
Establishing the influence of predictors in CART combined with Bagging is achieved through variable importance measures. The most commonly used approaches are Mean Decrease in Impurity (MDI) and Permutation Importance (MDA). The former accounts for the accumulated improvement in splitting criteria, while the latter measures the deterioration in accuracy when predictor values are randomly shuffled [4]. Bagging allows these estimates to be made directly using out-of-bag (OOB) observations, providing an objective measure of predictor importance. However, in the presence of highly correlated variables and variables with differing variance, MDI may be biased; therefore, permutation importance is often considered the more reliable method [25]. The primary hyperparameters of the Arcing ensemble include: the number of trees in the ensemble (T), form of cross-validation (CV), the minimum admissible size of parent nodes (m1) and child nodes (m2), and the number of predictors randomly selected at each node split.
In order to evaluate the created models, we use the following statistical measures: Root Mean Square Error (RMSE), Mean Absolute Percentage Error (MAPE), and coefficient of determination:
where and are the values of dependent and predictor variables, respectively, and , are their means, n is the sample size. Statistical analyses were performed using Salford Predictive Modeler 8.2 (SPM) [23] and IBM SPSS statistics software, version 29.0 [24] on a laptop (Lenovo, Intel Core i7, CPU 3.3 GHz)
4. Results
4.1. Examining Factors Influencing Students’ Self-Assessments
The self-assessment of the four core language skills (reading, listening, speaking, and writing) is an important element in the process of learning English as a foreign language. It helps learners recognise their strengths and weaknesses and develop self-regulated learning skills. [1] note that when learners actively engage in self-assessment, they develop a deeper understanding of the criteria for success. [20] also emphasizes that self-assessment is a crucial tool for enhancing language awareness and achieving higher communicative competence.
In this section, we investigate which factors influence students’ self-assessments by applying the ensemble method with CART Ebag decision trees. As the dependent variable, we use the average of students’ self-assessments across the four language skills.
Models were built with all 12 predictors described in Table 3. The hyperparameters were set as follows: number of trees in the ensemble ; training with cross-validation (CV10); minimum number of observations in parent and child nodes ; and number of randomly selected predictors for each .
The Bagging model M1, which showed the best statistical performance (, , ), was achieved with trees in the ensemble. It should be noted that the relative influence of the predictors remained stable across variations of the ensemble hyperparameters. Table 3 presents the relative importance of the selected predictors.
The strongest factors shaping students’ self-assessments are:
TimePractice () – frequency of English practice is the decisive factor, showing that the more regularly learners use the language, the higher their self-assessment.
GroupDiscussion () – participation and comfort in English discussions is the second most significant factor, highlighting the importance of communicative environments and real-life language use.
Moderately important factors include:
YearLearn () and IntensiveStudy () – years of study and intensity of English learning at school have a moderate influence, suggesting that duration and workload alone do not guarantee higher self-assessments without practical application.
Less influential factors are:
Major () – the specific major has a negligible effect.
TypeSchool () and background () – the type of high school and family background have relatively little influence, suggesting that social and educational context matters, but is not decisive.
The remaining factors – Abroad, Certificate, TypeStudy, Age, Gender (all ) – appear to have no significant effect on the dependent variable. Possessing a certificate, time spent abroad, or personal characteristics such as age and gender do not appear to influence significantly how students evaluate their language proficiency.
We first modelled the dependent variable SelfEval with all predictors, and then removed the insignificant ones. We selected a model with trees in the ensemble. In this case, the statistical indicators of the new model M2 are better: , , .
The most significant factor remains TimePractice () Figure 2, which clearly establishes it as the decisive predictor for self-evaluation.
On the Y-axis is the degree of significance (Var. Importance), i.e., the importance of the predictor, measured by how much the use of a given variable reduces the error Figure 2 (e.g., Gini Impurity or MSE in regression). If the first variable has an influence of , the others are expressed relative to it. On the X-axis are the variables included in the analysis. The blue bars (the box plot) show the variation in the importance of the corresponding predictor, calculated across the different trees in the ensemble. The longer the bar, the greater the fluctuations in the predictor’s importance, meaning that in some trees of the ensemble, it had a strong effect, while in others its influence was weak. Columns with a wide range indicate that the importance of this predictor is less stable across the trees. The pink squares + green line (Mean) represent the average importance of each predictor, averaged across all trees in the ensemble.
We also examine two additional variables that play an important role in the analysis. The first concern is how often students practice English, and the second is how comfortable they feel in group discussions.
Figure 3 presents the frequency distributions of TimePractice. As can be seen, of the respondents report practising English all the time, almost every day, or daily.
The second most important factor is GroupDiscussion (), showing that confidence in participating in group discussions is a strong and stable predictor. The box plot is moderately narrow, indicating a relatively consistent effect across all trees in the ensemble. Figure 4 shows that of students state that they feel comfortable or very comfortable participating in group discussions in English.
YearLearn () ranks as a moderately important factor, but with a wide variation, meaning that the effect of years of study is unstable – highly significant in some trees of the model and negligible in others. This depends on the randomly selected predictors used to construct each tree. IntensiveStudy shows a medium () relative influence with a moderate range of variation. In other words, the intensity of English study at school has an effect, but not a consistently strong one – it may be useful for some groups but is not decisive overall. Weaker predictors include Major () and Background (). For Major, there is again a significant variation in predictor importance, suggesting that its more substantial influence emerges only under certain conditions. By contrast, TypeSchool () shows minimal effect, indicating that the mode of study (school only, additional lessons, or self-study) has little impact on how students evaluate their skills. It should be noted that varying the hyperparameters of the ensemble does not change the ranking of predictor influence. Moreover, this ranking remains consistent (with minor exceptions among the least influential factors) in both models M1 and M2, which demonstrates the stability and robustness of the models as well as of the determined predictor influences. In conclusion, the most important determinants of a high self-evaluation of English proficiency are regular practice and active participation in communicative situations.
4.2. Examining the Factors Influencing Students’ Placement Test Results
The placement test serves as the initial benchmark for assigning students to proficiency levels. Based on their prior language experience, knowledge, and skills, as demonstrated in the test, students are placed into groups of similar ability to ensure more effective and targeted instruction. Unlike most other academic subjects at the Faculty of Mathematics and Informatics, where students attend classes in their enrollment-based academic groups, English classes are organized by proficiency level as determined by the placement test.
The test itself is a standardized instrument designed explicitly for the needs of English language teaching at FMI. It contains 80 multiple-choice questions arranged in ascending order of difficulty, progressing from more straightforward to more complex tasks. The items assess students’ knowledge of vocabulary and grammar through a range of task types. Developed by the English language instructors at FMI, the test provides a reliable and practical tool for placing learners into appropriate groups. The use of closed-ended questions allows for greater objectivity, faster evaluation, and comparability across a large student cohort. We constructed and examined a series of CART EBag models with the dependent variable PlacementTestGrade – the students’ placement test results. The best-performing model was obtained with T = 40 trees, training method: 10-fold cross-validation (CV10), a minimum number of observations in the parent and child nodes of each tree in the ensemble set to , and three randomly selected predictors used for the construction of each tree. The performance indicators of the resulting model M3 were as follows: , , and . The relative influence of the predictors on the placement test results is shown in Table 5.
From Table 5, students’ Major exerts the most decisive influence on their performance in the placement test. This is expected, given that admission to different majors is determined by their entrance scores from secondary school. Next in importance is the average self-evaluation of language skills, which suggests that students’ self-assessments are a reliable predictor of their placement results. Following these are TimePractice and GroupDiscussion, which is natural, considering their significance for the actual language use and confidence. They are followed by the intensity of English study at school (IntensiveStudy) and the number of years of learning (YearLearn). The appearance of these factors is logical, given that the placement test is a written exam, similar to the testing practices students often experienced in secondary school, which helped shape their attitudes and habits. We can conclude that the most decisive influence on the placement test results is the students’ major, which is directly related to their admission score - determined by the entrance exam and their overall high school performance and followed by their self-assessment and the amount of practice they have completed.
4.3. Investigating the Factors Influencing Students’ Results in GRADE 1 (Final General English Score)
At the end of the first semester, students receive a grade in the General English course. In this case, the dependent variable is the examination test taken at the end of the course, which we denote as ScoreGrade1. The predictors include the previously examined dependent variables SelfEval and PlacementTestGrade, as well as TimePractice, GroupDiscussion, YearLearn, IntensiveStudy, Major, TypeSchool, Background, Abroad, Certificate, and TypeStudy.
We constructed and examined a series of CART EBag models with the dependent variable ScoreGrade1 – the students’ final results in General English. The best-performing model was obtained with trees, training method: 10-fold cross-validation (CV10), a minimum number of observations in the parent and child nodes of each tree in the ensemble set to , and three randomly selected predictors used for the construction of each tree. The performance indicators of the resulting model M4 were: , , . The relative influence of the predictors on these results is presented in Table 6 in percentages.
The most substantial relative influence is exerted by the average self-evaluation (SelfEval). This means that students with higher self-assessments are more motivated and confident, and in fact achieve better results. The second most influential factor is PlacementTestGrade, which is expected, since stronger initial skills are likely to lead to higher final outcomes. The type of high school completed (TypeSchool) shows a relatively high influence of , indicating the degree to which students are trained to perform successfully in an academic environment. This is followed by TimePractice, GroupDiscussion, YearLearn, and Major, which exert a moderate influence. Weaker factors include IntensiveStudy, Background, and TypeStudy.
One notable finding in this model is the significantly reduced influence of Major. The chosen degree program reflects the motivation of students in their final year of high school to achieve high grades, perform well on external assessments, and succeed in competitive entrance examinations in order to be admitted to their desired major. However, the results after the first year of university indicate that this temporary motivation in secondary school does not play a substantial role in academic achievement at the bachelor’s level.
In this model, it is evident that almost all selected variables affect the final assessment in General English, and they can be grouped into three categories:
- Self-evaluation and placement test – i.e., subjective and objective measures of language competence, which are the most significant predictors of final results;
- Educational background and engagement factors – such as the type of high school and frequency of practice, which also play an important role;
- Duration of learning and social background – which exert relatively weak influence.
This shows that the quality and intensity of study, as well as personal engagement, are more important than the sheer number of years spent learning English.
4.4. Investigating the Factors Influencing Students’ Results in GRADE 2 (ESP)
After completing the first semester, students continue in the second semester with a course in English for Specific Purposes (ESP), focusing on English for Technology-related contexts. This subject is connected with the terminology and discourse features specific to the different majors. In computer science–related majors, the language is generally more straightforward in terms of grammar, but it nonetheless has its own distinctive features. Unlike the General English course, where students are grouped by proficiency level, in ESP, they are not regrouped by ability but continue to learn within their academic cohorts. At the end of the course, students take a final examination. In this case, the dependent variable is ScoreGrade2, and the predictors used are the same set of factors examined in the previous models. To construct a model and identify the influence of variables on students’ final results in English for Specific Purposes, we built a series of CART EBag models while varying different hyperparameters. The best statistical performance was obtained with model M5, with trees in the ensemble, training method: 10-fold cross-validation (CV10), minimum number of observations in parent and child nodes of each tree set to , and three randomly selected predictors used for the construction of each tree. The statistical indicators of the constructed model M5 were: , , . The relative influence of the predictors on these results is presented in Table 7.
5. Discussion
Several new variables emerge as relevant for students’ results in English for Specific Purposes, such as the type of high school, possession of an English certificate, and students’ self-assessment of improvement after the first semester. These factors have a logical impact, considering the focus on specialized language learning. It is also noteworthy that the variable Major, which had a strong influence on placement test results, does not appear in this model. This suggests that the differences among students across degree programs become blurred and eventually disappear after one year of English language study at university.
By considering all results together (Table 8), we can draw a comprehensive picture of how students’ outcomes depend on the predictors under study.
Self-evaluation (SelfEval) is most strongly influenced by the time devoted to practice (TimePractice, ) and the group discussion skills (GroupDiscussion, ). This suggests that students’ self-perception of their knowledge is not merely subjective but is closely tied to concrete learning behaviors. The more time students invest in practice and the more they engage in collaborative learning, the more confident they feel in their own competence. These findings align with the theory of self-efficacy [2], which emphasizes that mastery experiences and social persuasion are key determinants of confidence, and with [22] showing that cooperative learning enhances both motivation and achievement. By contrast, formal institutional factors – such as the type of school attended (TypeSchool), years of prior study (YearLearn), or declared major (Major) – play only a minor role. Thus, students appear to evaluate their knowledge primarily based on individual effort and peer interaction, rather than institutional context.
PlacementTestGrade is most decisively influenced by the students’ chosen Major (). This indicates that students who deliberately select specific majors are more likely to demonstrate higher initial performance, likely because of stronger motivation and preparation. [12] argue that educational choices such as major selection are strongly driven by motivational beliefs and goals, which in turn predict performance outcomes. Secondary but still meaningful influences are found from TimePractice (), GroupDiscussion (), and SelfEval (). Interestingly, the type of school is negligible here, showing that once students enter the university, their school background no longer determines their performance. Overall, entrance performance reflects a combination of intrinsic motivation (major choice), study behaviors (practice and discussion), and self-perception, while institutional background fades in importance.
ScoreGrade1 (basic English knowledge) is primarily driven by self-evaluation (), showing that students’ own assessment of their knowledge aligns closely with actual outcomes. This finding is consistent with [27], who highlights the strong link between self-efficacy and learning achievement. PlacementTestGrade also contributes significantly (), confirming that earlier acquired knowledge transfers effectively to this first stage of assessment [7]. TimePractice () and TypeSchool () also retain a noticeable influence, showing that school preparation still matters during the foundational stage. GroupDiscussion () and YearLearn () play a moderate but non-negligible role. Therefore, success in the basic exam is influenced by both prior learning foundations and subjective self-assessment, while continuous effort and institutional support remain relevant.
ScoreGrade2 (specialized English knowledge) is determined almost entirely by ScoreGrade1 (), making clear that without a strong foundation in basic English, specialized success is unattainable. Secondary influences include SelfEval () and PlacementTestGrade (), indicating that self-confidence and initial knowledge still play a role, but only after a solid base is established. TimePractice () and TypeSchool () have a diminished effect, while GroupDiscussion () plays only a minor role. Specialized success is therefore strongly path-dependent: foundational knowledge reflects later performance.
From these findings, several broader conclusions can be drawn. Self-perception is not trivial. Although subjective, SelfEval is a strong predictor of both basic exam success (ScoreGrade1, ) and entrance performance (PlacementTestGrade, ). This supports research showing that motivated and confident students tend to perform better [2,27].
Study habits matter. TimePractice and GroupDiscussion consistently contribute to both self-assessment and measurable performance, though their effect is strongest in earlier stages and weakens in later, more specialized exams. This is consistent with evidence that cooperative and engaged learning improves outcomes [22,26].
School background plays only a temporary role. TypeSchool and YearLearn remain somewhat relevant for ScoreGrade1, but are negligible for PlacementTestGrade and ScoreGrade2.
The choice of major is decisive at the initial stage. The major exerts its strongest influence immediately after enrollment ( on PlacementTestGrade), but subsequent outcomes depend less on this factor and more on effort and foundational mastery [12].
Strong foundations are essential. Specialized exam success (ScoreGrade2) is almost entirely determined by prior mastery of basic English knowledge (ScoreGrade1, ). This confirms findings that prior knowledge is a decisive predictor of advanced learning [7].
These results suggest that teachers and lecturers should encourage consistent practice and group discussions, as these strongly shape students’ self-confidence and initial performance. At the same time, curricula should prioritize the development of basic knowledge (ScoreGrade1), since success at this stage is the critical determinant of advanced performance. Institutional profiling and background are less important than active student engagement and effective learning behaviors.
6. Conclusions
The analysis of the relative influence of the predictors shows clearly differentiated differences across the variables. The most significant factor is ScoreGrade1 (), making it the dominant predictor of performance in GRADE2. It is followed by the group of variables with approximately influence, namely SelfEval and PlacementTestGrade. The next group, with around influence, consists of TimePractice and TypeSchool. The final group, with about influence, includes GroupDiscussion, Certificate, and SelfImprovement.
This study highlights how prior experience influences English language performance in students enrolled in Computer Science and related majors. The findings can support more effective ESP course design, enabling instructors to tailor instruction to students’ diverse backgrounds. Taking students’ prior learning into account can improve both engagement and outcomes in technical English education.
This study demonstrates that students’ academic success in university English courses is shaped less by institutional background factors and more by individual engagement, self-perception, and the strength of their foundational knowledge. While the type of high school and years of study play a limited role, self-evaluation emerges as a significant predictor of both entrance performance and subsequent exam outcomes. Consistent practice and collaborative learning activities not only enhance students’ confidence but also contribute to measurable performance gains, particularly in the early stages of study.
The analysis further highlights that specialized achievement in English depends almost entirely on mastery of basic knowledge, confirming the path-dependent nature of language learning. Entrance performance is strongly influenced by students’ choice of major, suggesting that motivation and academic orientation are decisive at the point of transition to higher education, but diminish in importance once the course is underway.
These findings suggest that university English programs, especially in technical and scientific fields, should emphasize the development of foundational skills while also encouraging study habits and peer interaction that foster self-confidence. Targeted support at the basic level of instruction is crucial, as success at this stage determines later specialization. By focusing less on institutional background and more on learning behaviors, educators can design more effective and tailored approaches to support diverse cohorts of students in technical disciplines.
The present study is limited by its reliance on self-reported measures of language competence, which may introduce bias despite the strong predictive value of self-evaluation. In addition, the analysis is based on a single faculty and three specific majors, which may constrain the generalization of the results to other disciplines or institutions. Future research should expand the scope to include larger and more diverse student populations, explore longitudinal effects across multiple semesters, and incorporate additional predictors such as informal language exposure or digital learning practices. Integrating qualitative methods, such as interviews or focus groups, may also provide richer insights into the mechanisms by which study habits and self-perception influence academic outcomes.
Importantly, this study demonstrates the value of applying machine learning methods in educational research. The CART Ensemble and Bagging approaches provided robust models that revealed nuanced relationships between prior experience, self-assessment, and academic outcomes, offering methodological innovation for the field of language education. The findings emphasize that success in English depends less on institutional background and more on consistent practice, self-confidence, and strong foundational knowledge. University language teachers in technical fields can use these insights to design courses that combine skill-building with reflection, promote active engagement, and provide early support in General English as the basis for later ESP achievement.
7. Surveys’ Questions
7.1. English Language Learning Survey PART 1
Dear students,
This survey seeks to explore your English learning experiences prior to university and assess how these experiences influence your motivation and achievement in your English studies at the University of Plovdiv. It also offers you an opportunity to reflect on your journey of learning English. Please remember that there are no right or wrong answers. Your responses will be kept strictly confidential and used solely for research purposes. The success of this study depends on your participation.
Thank you for your cooperation!
Part A: Demographic Information
Question 1: Student’s name and surname
Question 2: Student’s full number
Question 3: Gender
- Male
- Female
- Prefer not to say
Question 4: Age
- younger than 20
- 20 - 25
- 26 - 30
- 31 or older
Question 5: Country of origin
- Bulgaria
- Other:
Question 6: Family background
- Big city
- Small town
- Village
- Other:
Question 7: Years of learning English
- 1-5
- 6-10
- 11-15
- more than 15
Question 8: Type of high school you graduated from:
- Secondary School of Mathematics
- Language School
- General High School (Gymnasium, focused on academic education)
- Technical School (Technikum, focused on professional skills)
- Other:
Question 9: How intensively did you study English at school? (You may select more than one option.)
- 1-2 periods per week
- 3-5 periods per week
- Over 5 periods per week
- Additional classes at a private school or with a private tutor
- Studied independently
Question 10: Do you have an English language certificate?
- Yes, an internationally recognized one
- Yes, issued by a local company
- No
Question 11: If you have a language certificate, what is your score or language level?
Write it down
Question 12: Have you been abroad before coming to study at Plovdiv University?
- Yes
- No
Question 13: What was the purpose of your visit abroad? (You may select more than one option.)
- An excursion
- A student exchange program
- I lived (and studied) abroad
- For business
- N/A
- Other:
Question 14: How long did you stay abroad (altogether)?
- Less than a week
- A few weeks
- A few months
- About a year
- Longer than a year
- N/A
Question 15: How did you feel about communicating in English while in a foreign country ?
- Confident and comfortable
- A bit shy but effective
- Very shy to the point of avoiding speaking
- I did not communicate in English
- N/A
Question 16: What kind of problems have you encountered while in a foreign country? (You may select more than one option.)
- Difficulty understanding the local accent
- Local people had difficulty understanding my accent
- Finding the right words
- Explaining the essence of what I had in mind
- Culture-related misunderstandings (critical incidents)
- N/A
- Other:
Part B - Language Practice
Question 17: How often do you practice English?
- All the time
- Every day
- Almost every day
- Every week
- From time to time
- Only if I can’t avoid it
Question 18: What kind of activities do you use English for most often? (You may select more than one option.)
- Reading (books, news, articles, etc.)
- Online shopping
- Playing games/ interacting with game teammates
- Writing (emails, reports, creative writing, etc.)
- Listening (to podcasts, the radio, music, etc.)
- Watching videos/movies/TV shows
- Social media or online forums
- Speaking with friends or colleagues
- Doing homework in your English studies
- Other:
Question 19: How comfortable do you feel participating in group discussions in English?
- Very comfortable
- Comfortable
- A bit uncomfortable
- Very uncomfortable
- I avoid group discussions in English
Question 20: I think it is necessary to know about the culture (e.g., customs, stereotypes, gestures, values) of English-speaking countries to learn the language well.
- Strongly agree
- Agree
- Neither agree nor disagree
- Disagree
- Strongly disagree
Question 21: Understanding common gestures in English-speaking countries helps with language learning.
- Strongly agree
- Agree
- Neither agree nor disagree
- Disagree
- Strongly disagree
Question 22: Knowing about cultural stereotypes affects my communication in English.
- Strongly agree
- Agree
- Neither agree nor disagree
- Disagree
- Strongly disagree
Question 23: Learning about English-speaking values and traditions helps me use the language more naturally.
- Strongly agree
- Agree
- Neither agree nor disagree
- Disagree
- Strongly disagree
Part C - Self-Evaluation of English Language Skills
Question 24: How would you evaluate your own English language skills?
Reading
- Fluent
- Very good
- Good
- Poor
- Awful
Question 25: Listening with comprehension
- Fluent
- Very good
- Good
- Poor
- Awful
Question 26: Speaking
- Fluent
- Very good
- Good
- Poor
- Awful
Question 27: Writing
- Fluent
- Very good
- Good
- Poor
- Awful
Question 28: My greatest language strengths lie in: (You may select more than one option.)
- Extensive vocabulary
- Grammar
- Listening with understanding
- Reading with understanding
- Speaking
- Expressing my thoughts clearly in writing
- Writing texts of specific formats (e.g., articles, reports, business correspondence)
- Making presentations/talking in front of large audiences
Question 29: My greatest language weaknesses are: (You may select more than one option.)
- Extensive vocabulary
- Grammar
- Listening with understanding
- Reading with understanding
- Speaking
- Expressing my thoughts clearly in writing
- Writing texts of specific formats (e.g., articles, reports, business correspondence)
- Making presentations/talking in front of large audiences
Thank you very much for your time!
7.2. English Language Learning Survey PART 2
Dear Students,
Thank you for participating in this follow-up survey. It is designed to evaluate your English language skills at the end of your first semester at the University of Plovdiv and to reflect on your learning experience. This survey will help us explore how your prior English learning experiences influence your motivation and achievements and identify ways to enhance your future learning opportunities. Your responses are invaluable for this research and for improving the English course. Please note that:
- There are no right or wrong answers.
- Your responses will remain strictly confidential and will be used solely for research purposes.
Your participation is crucial to the success of this study, and I deeply appreciate your cooperation.
Question 1: Student’s name and surname
Question 2: Student’s full number
Question 3: How would you evaluate your own English language skills after the first semester at FMI?
- Significant improvement
- Moderate improvement
- Slight improvement
- No change
- Slight worsening
Question 4: In your opinion, what is the reason for that (lack of) change? (Select all that apply)
- My participation in classwork
- The homework assignments I completed
- The project work I undertook
- The test based on a short story
- Collaboration with other students
- The teacher
- Other:
Question 5: What could motivate you to work harder in English during the second semester? (Select all that apply)
- More engaging classwork assignments
- More interesting homework assignments
- Challenging project assignments
- More opportunities for collaboration with other students
- Studying specialized vocabulary
- Studying grammar
- Other:
Question 6: What are your recommendations for improving English classes or for the teacher?
Write it down
Thank you once again for your time and valuable input!
Author Contributions
The mentioned authors participated equally to the study and are arranged in alphabetical order as follows: conceptualization, methodology, investigation, writing—original draft preparation, writing—review and editing: V.I., H.K., and B.Z. All authors have read and agreed to the published version of the manuscript.
Funding
The study is partially funded by the Bulgarian National Science Fund (BNSF), Grant number KP-06-N52/9.
Data Availability Statement
The original contributions presented in the study are included in the article; further inquiries can be directed to the corresponding author.
Conflicts of Interest
The authors declare no conflicts of interest.
References
- Andrade, H., and Du, Y. 2007. Student responses to criteria-referenced self-assessment. Assessment & Evaluation in Higher Education 32: 159-181. [CrossRef]
- Bandura, A. 1997. Self-efficacy: The exercise of control. W.H. freeman and Company, New York, USA.
- Breiman, L. 1996. Bagging predictors. Machine Learning 24: 123-140. [CrossRef]
- Breiman, L. 2001. Random forests. Machine Learning 45: 5-32.
- Breiman, L., Friedman, J.H., Olshen, R.A., and Stone, C.J. 1984. Classification and regression trees. Chapman and Hall/CRC, New York, USA.
- Brimzhanova, S., Atanov, S., Moldamurat, K., Baymuhambetova, B., Brimzhanova, K., and Seitmetova A. 2022. An intelligent testing system development based on the shingle algorithm for assessing the academic achievements of humanities students. Education and Information Technologies. [CrossRef]
- Dochy, F., Segers, M., and Buehl, M. M. 1999. The relation between assessment practices and outcomes of studies: The case of research on prior knowledge. Review of Educational Research 69: 145-186. [CrossRef]
- D. Doz, D., Felda, D., and Cotič, M. 2022a. Assessing Students’ Mathematical Knowledge with Fuzzy Logic Education Sciences 12: 266. [CrossRef]
- D. Doz, D., Felda, D., and Cotič, M. 2022b. Combining Students’ Grades and Achievements on the National Assessment of Knowledge: A Fuzzy Logic Approach Axioms 11: 359. [CrossRef]
- D. Doz, D., Felda, D., and Cotič, M. 2023a. Demographic Factors Affecting Fuzzy Grading: A Hierarchical Linear Regression Analysis Mathematics 11: 1488. [CrossRef]
- D. Doz, D., Cotič, M., and Felda, D., 2023b. Random Forest Regression in Predicting Students’ Achievements and Fuzzy Grades Mathematics 11: 4129. [CrossRef]
- Eccles J.S., Wigfield A. 2002. Motivational beliefs, values, and goals Annual Review of Psychology 53: 109-132. [CrossRef]
- Ellis, R. 2008. The Study of Second Language Acquisition. Oxford University Press, United Kingdom.
- El-Omari, A.H. 2016. Factors affecting students’ achievement in English language learning. Journal of Language Teaching and Research 7: 896–902. [CrossRef]
- Ishida, A., Manalo, E., and Sekiyama, T. 2023. Students’ motivation to learn English: The importance of external influence on the ideal L2 self. Frontiers in Education 8: 1264624. [CrossRef]
- Kavitha R.K., Jayakanthan, N., and Harishma, S. 2022. Predicting Students’ Outcomes with Respect to Trust, Perception, and Usefulness of Their Instructors in Academic Help Seeking Using Fuzzy Logic Approach. Communications in Computer and Information Science, 1759 CCIS, Pages 233 – 243, 1st International Conference on Advancements in Smart Computing and Information Security, ASCIS 2022, Rajkot. [CrossRef]
- Lightbown, P. M., and Spada, N. 2013. How Languages are Learned (4th ed.). Oxford University Press, United Kingdom.
- Liu, M., and Du, N. 2024. A Study of Chinese University Students’ English Learning Motivation, Anxiety, Use of English and English Achievement. Sustainability 16: 8707. [CrossRef]
- Mulualem, Y.G., Mulu, Y.E., and Gebremeskal, T.G. 2022. Effects of English learning beliefs on English achievement: academic emotions as mediators. Heliyon 8: e09829. [CrossRef]
- Oscarson, A.D. 2009. Self-assessment of writing in learning English as a foreign language. Göteborg University, Sweden.
- Shang, Y., and Ma, L. 2024. Classroom anxiety, learning motivation, and English achievement of Chinese college students: The mediating role of self-efficacy. Acta Psychologica 251: 104550. [CrossRef]
- Slavin R.E. 2014. Cooperative learning and academic achievement: Why does groupwork work? Anales de Psicologia 30: 785-791. [CrossRef]
- SPM—Salford Predictive Modeler. 2022. Available online: https://www.minitab.com/en-us/products/spm/.
- IBM SPSS Statistics 29. 2023. Available online: https://www.ibm.com/products/spss-statistics (accessed on 9 February 2023).
- Strobl, C., Boulesteix, A. L., Zeileis, A., and Hothorn, T. 2007. Bias in Random Forest Variable Importance Measures: Illustrations, Sources, and a Solution. BMC Bioinformatics 8: 25. [CrossRef]
- Tinto V. 1997. Classrooms as communities: Exploring the educational character of student persistenc. Journal of Higher Education 68: 599-623. [CrossRef]
- Zimmerman B.J. 2000. Self-Efficacy: An Essential Motive to Learn. Contemporary Educational Psychology 25: 82-91. [CrossRef]
Figure 1.
Bar charts of the distribution of students’ self-assessments of the four language skills: (a) Reading. (b) Listening. (c) Writing. (d) Speaking.
Figure 1.
Bar charts of the distribution of students’ self-assessments of the four language skills: (a) Reading. (b) Listening. (c) Writing. (d) Speaking.
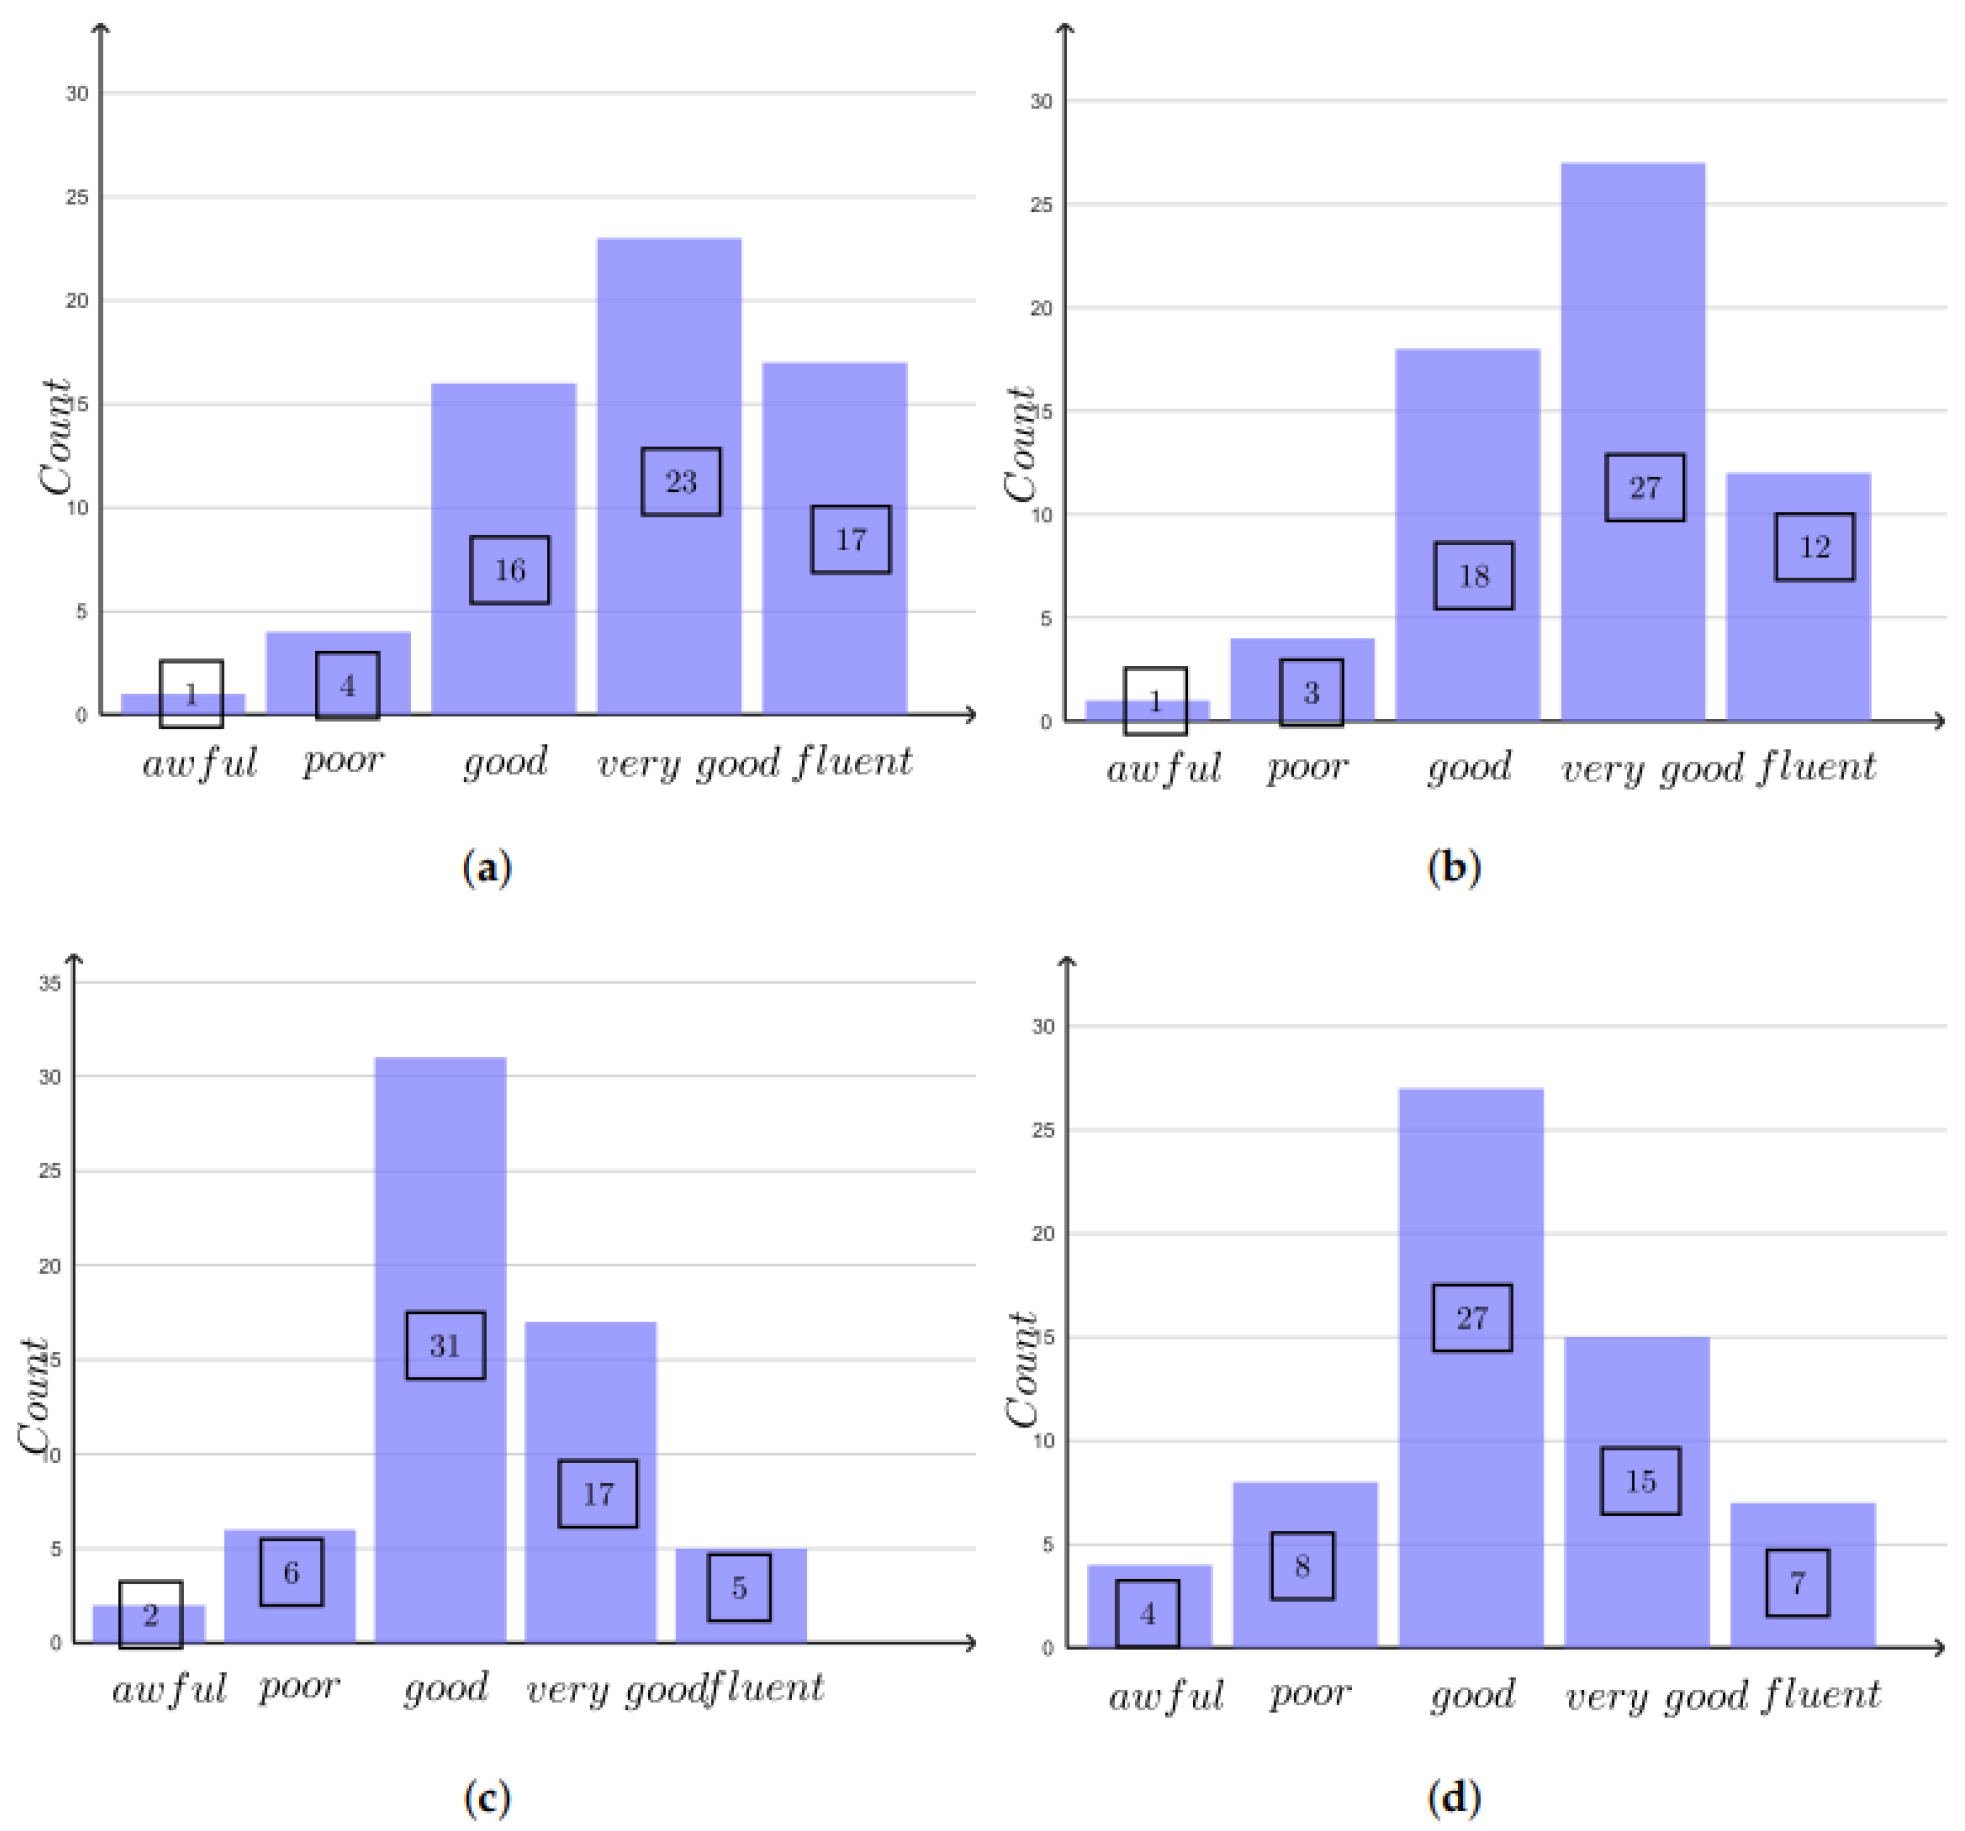
Figure 2.
Relative variable importance for Table 4.
Figure 2.
Relative variable importance for Table 4.
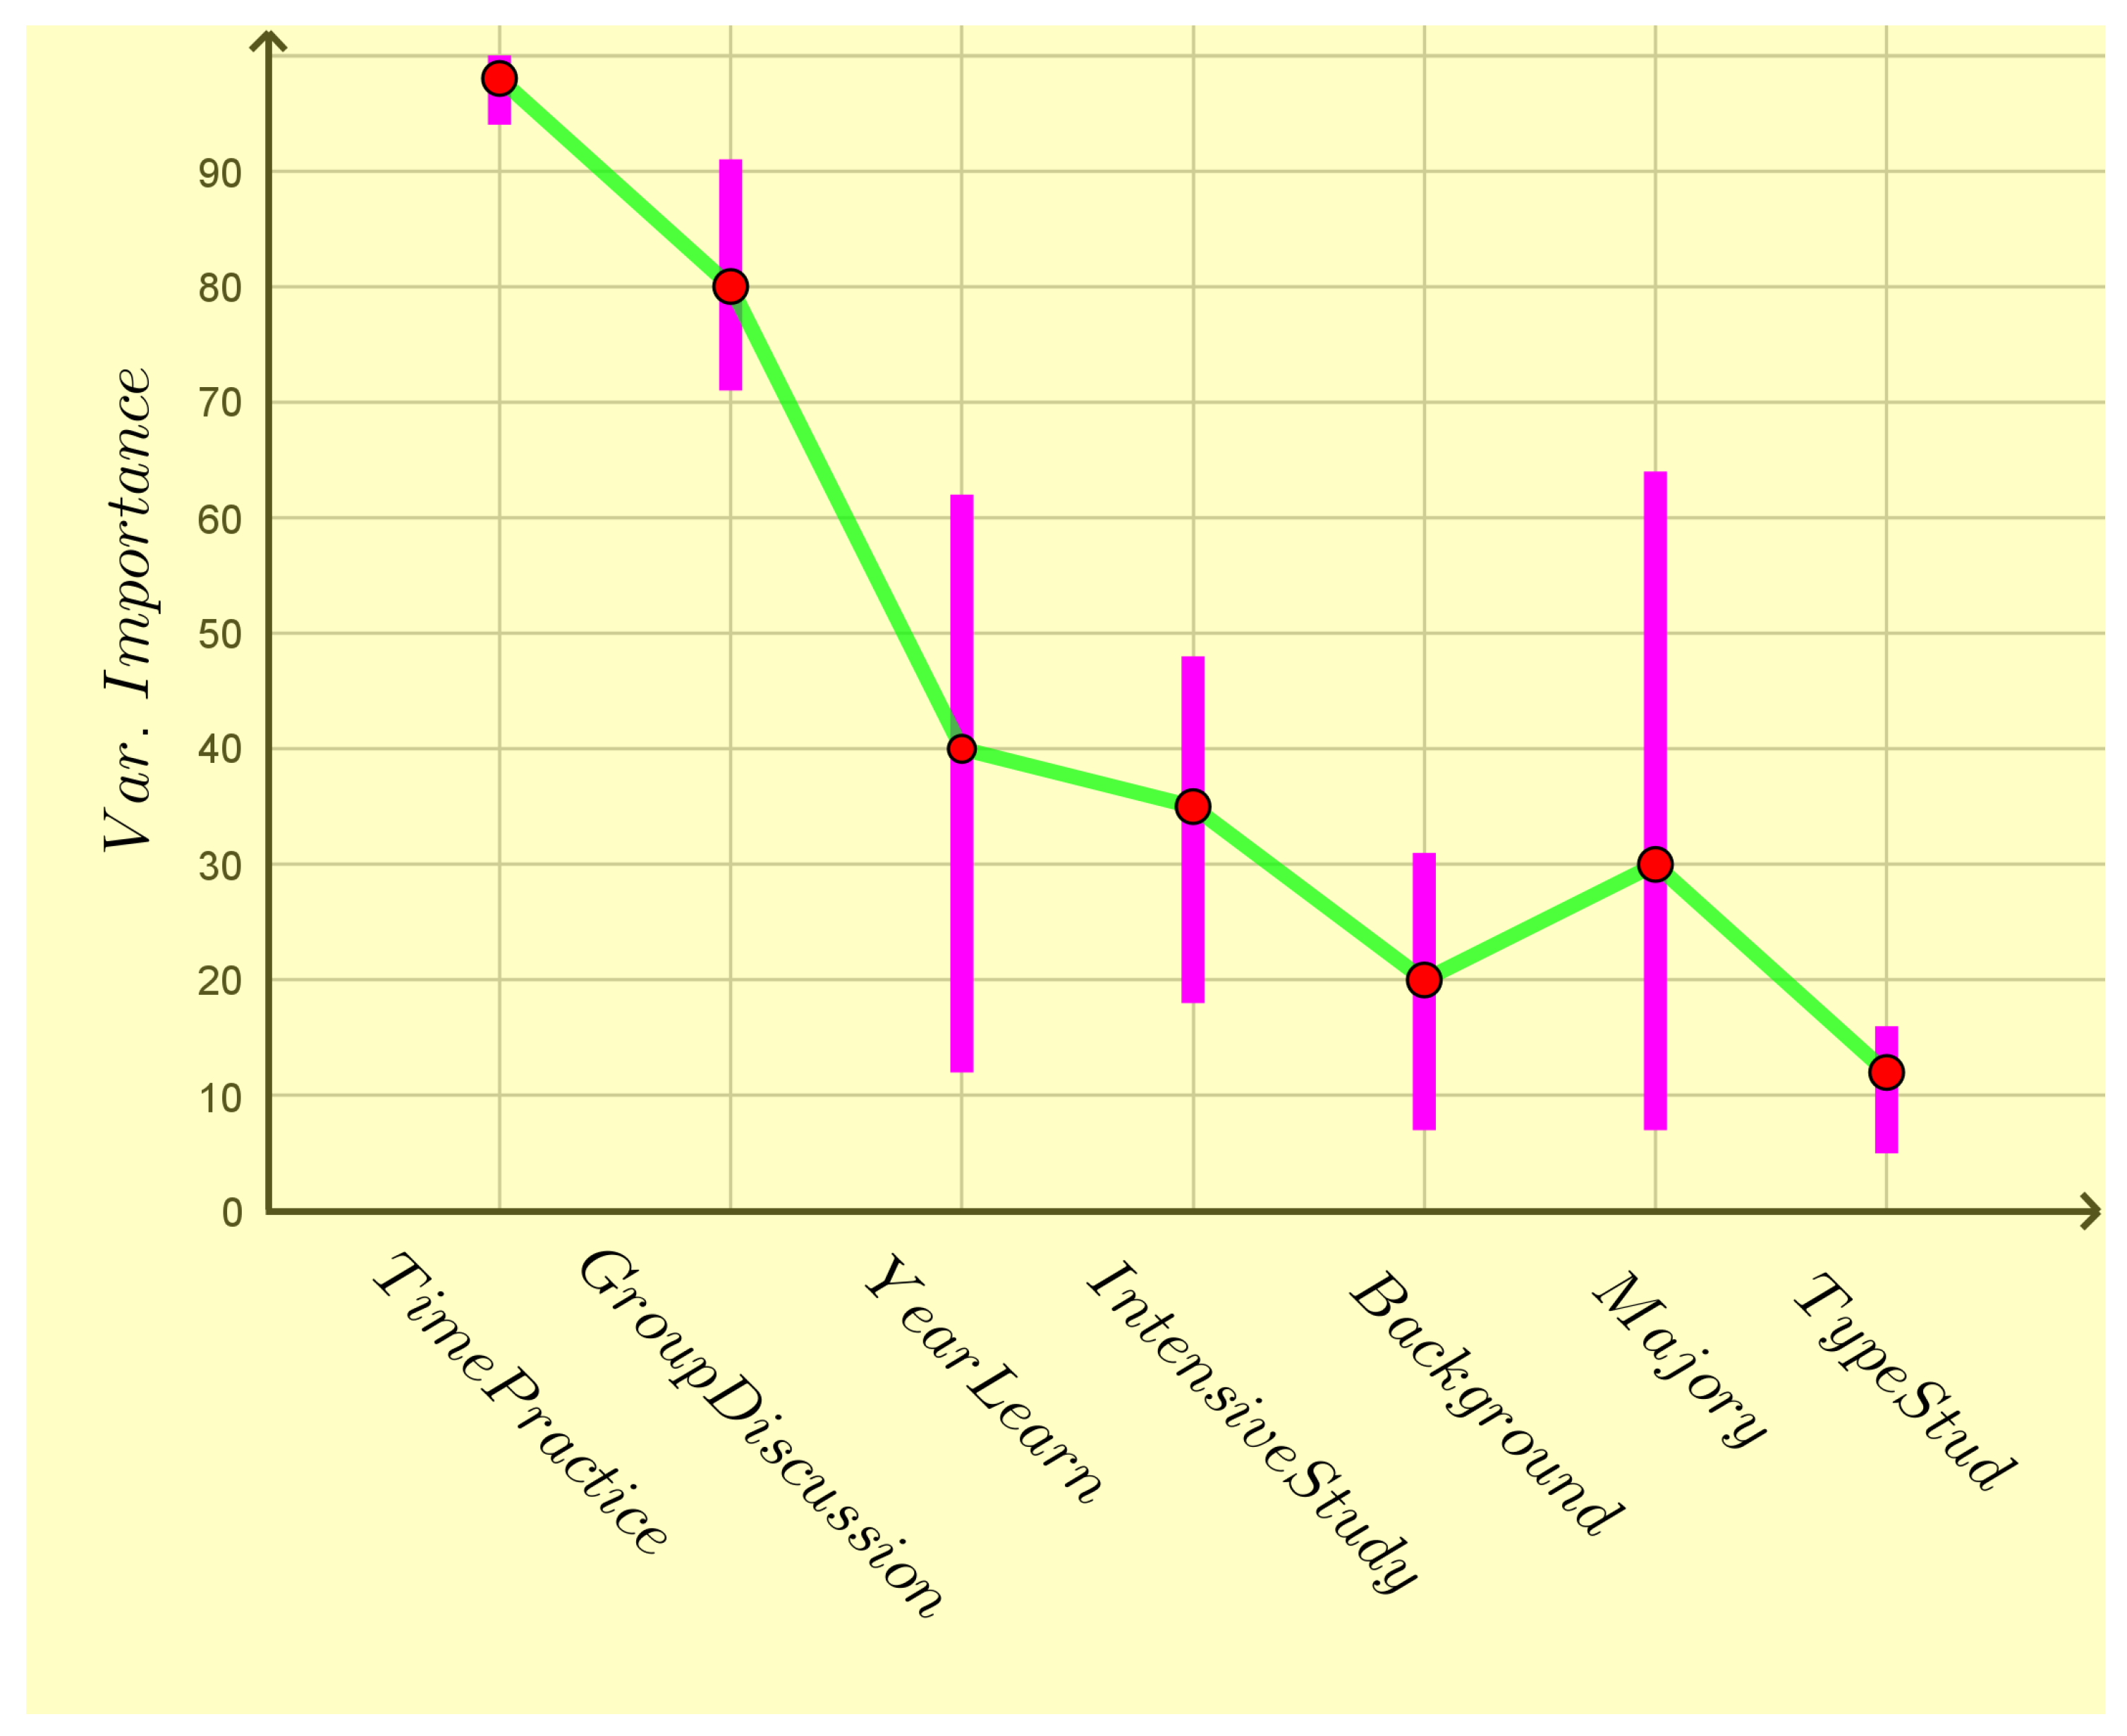
Figure 3.
Bar chart of the variable TimePractice (”How often do you practice English? “).
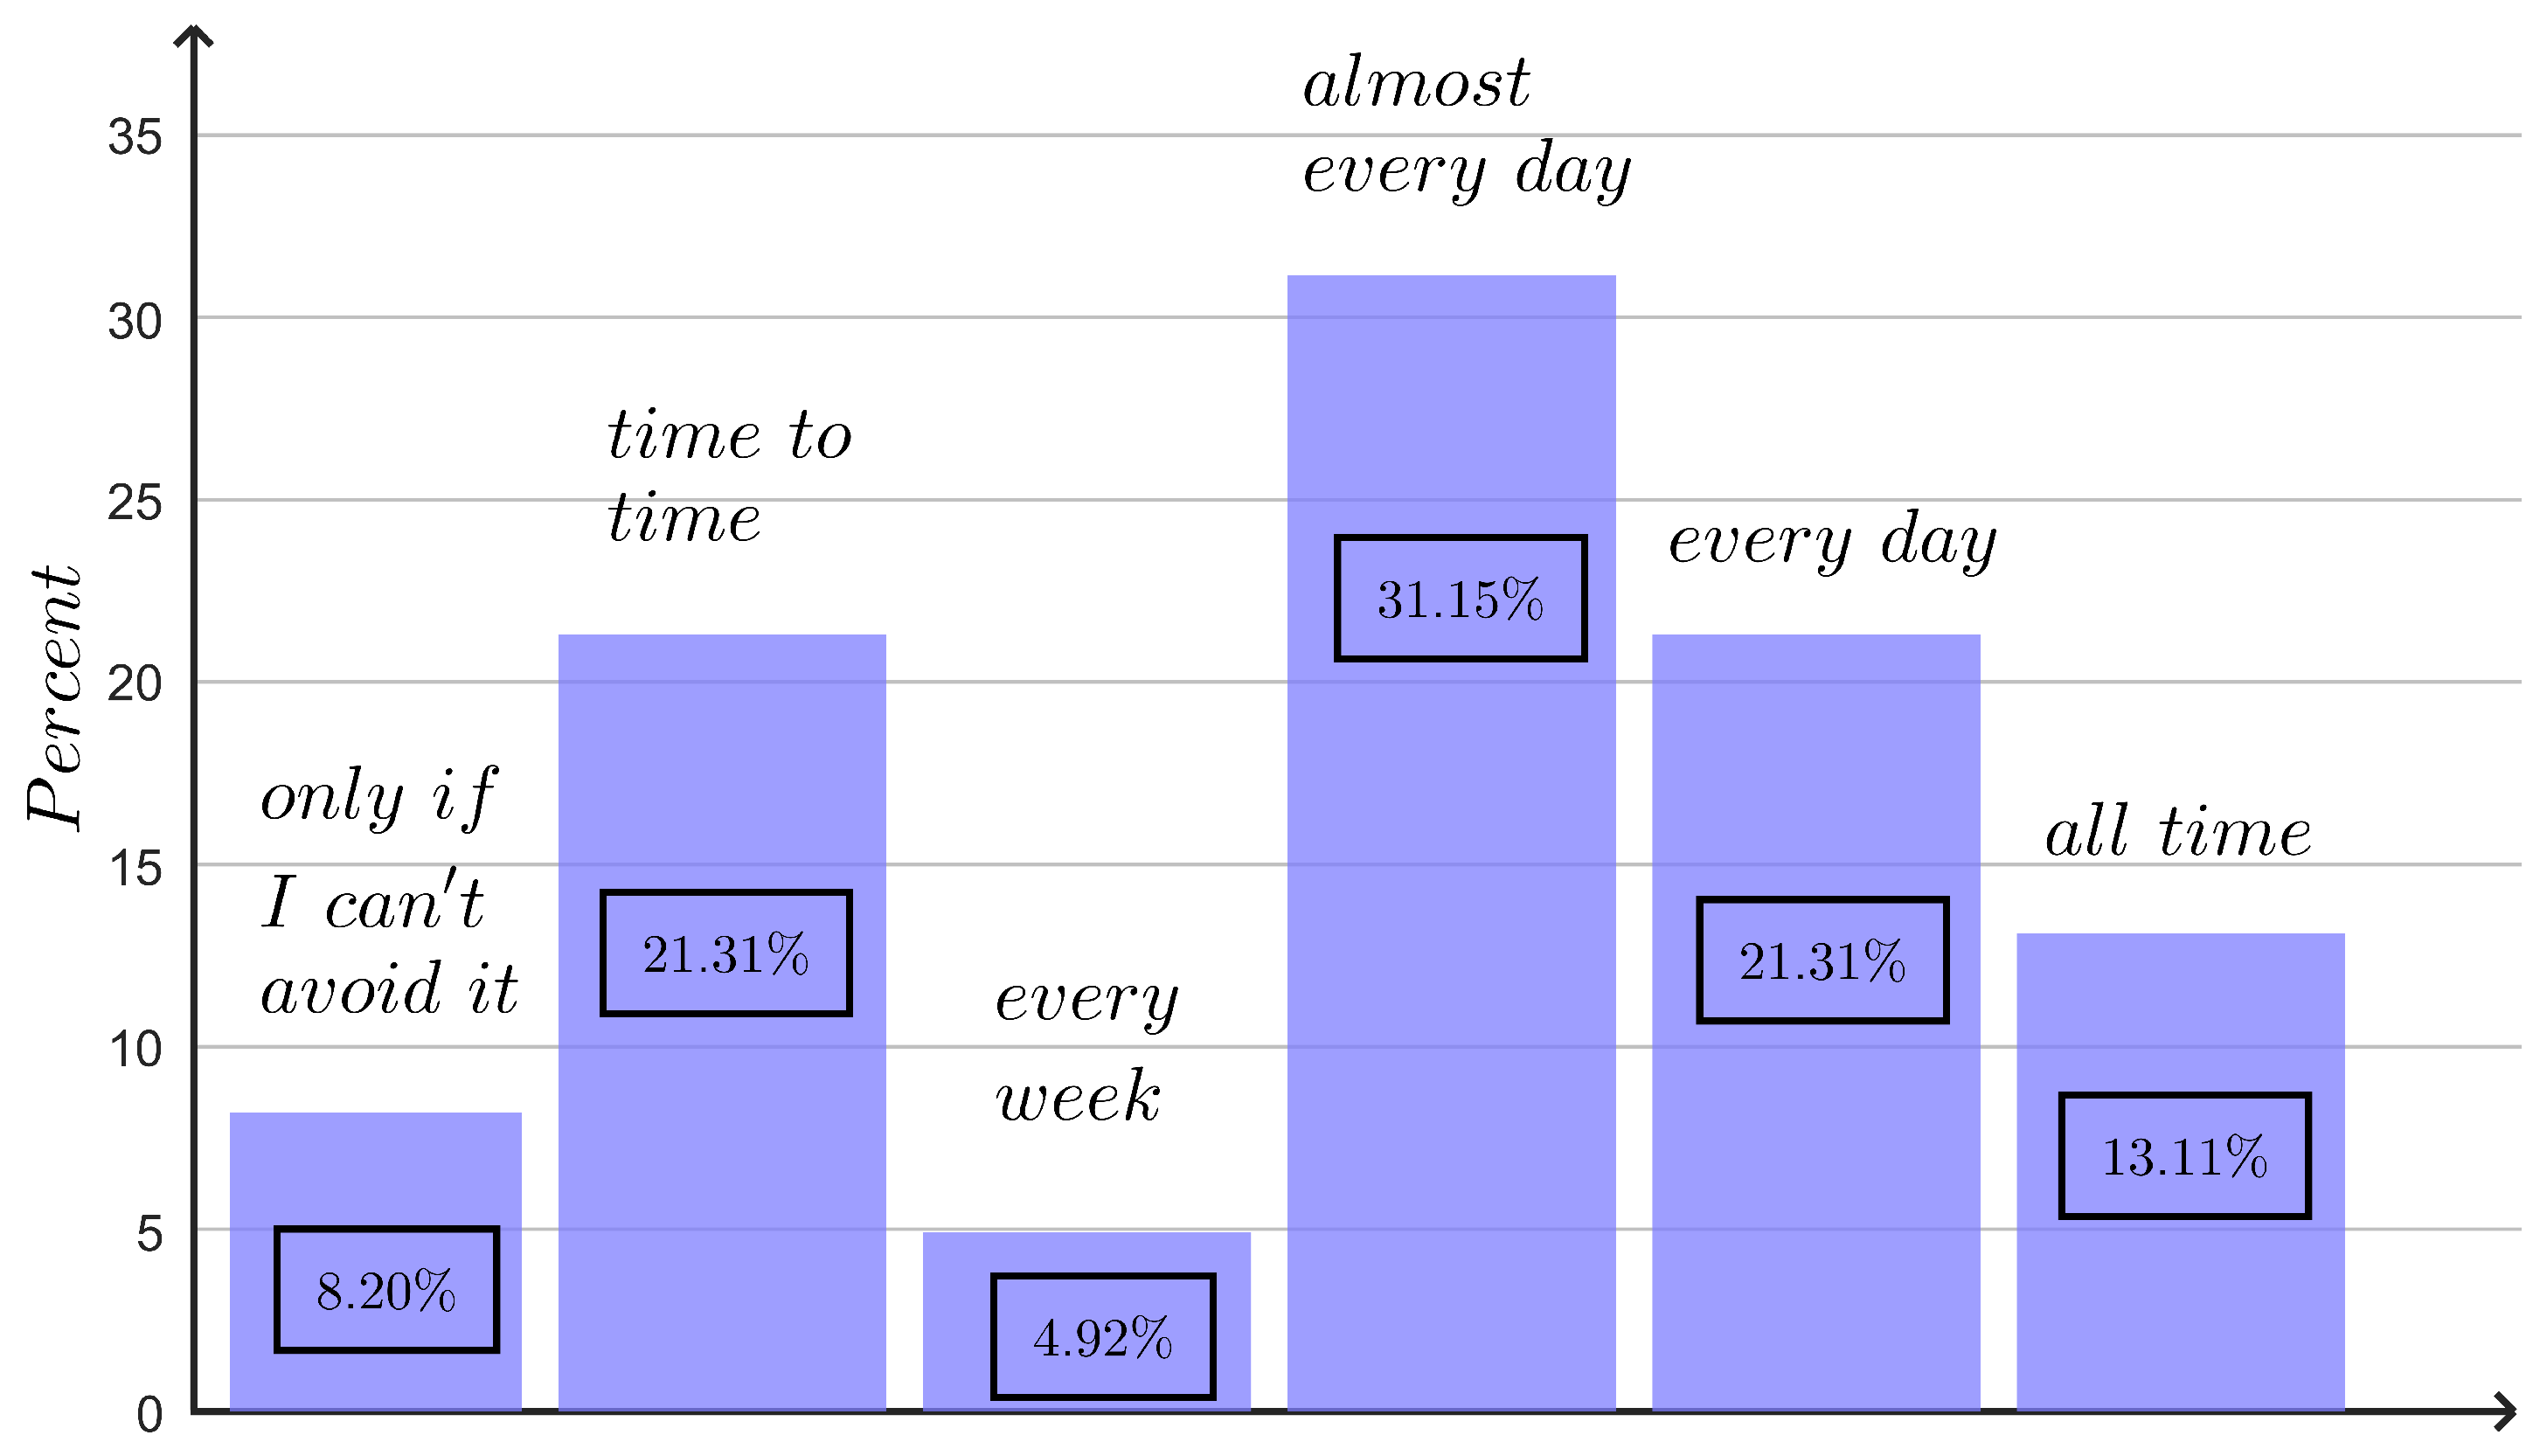
Figure 4.
Bar chart of the variable GroupDiscussion (”How comfortable do you feel participating in group discussions in English? “).
Figure 4.
Bar chart of the variable GroupDiscussion (”How comfortable do you feel participating in group discussions in English? “).
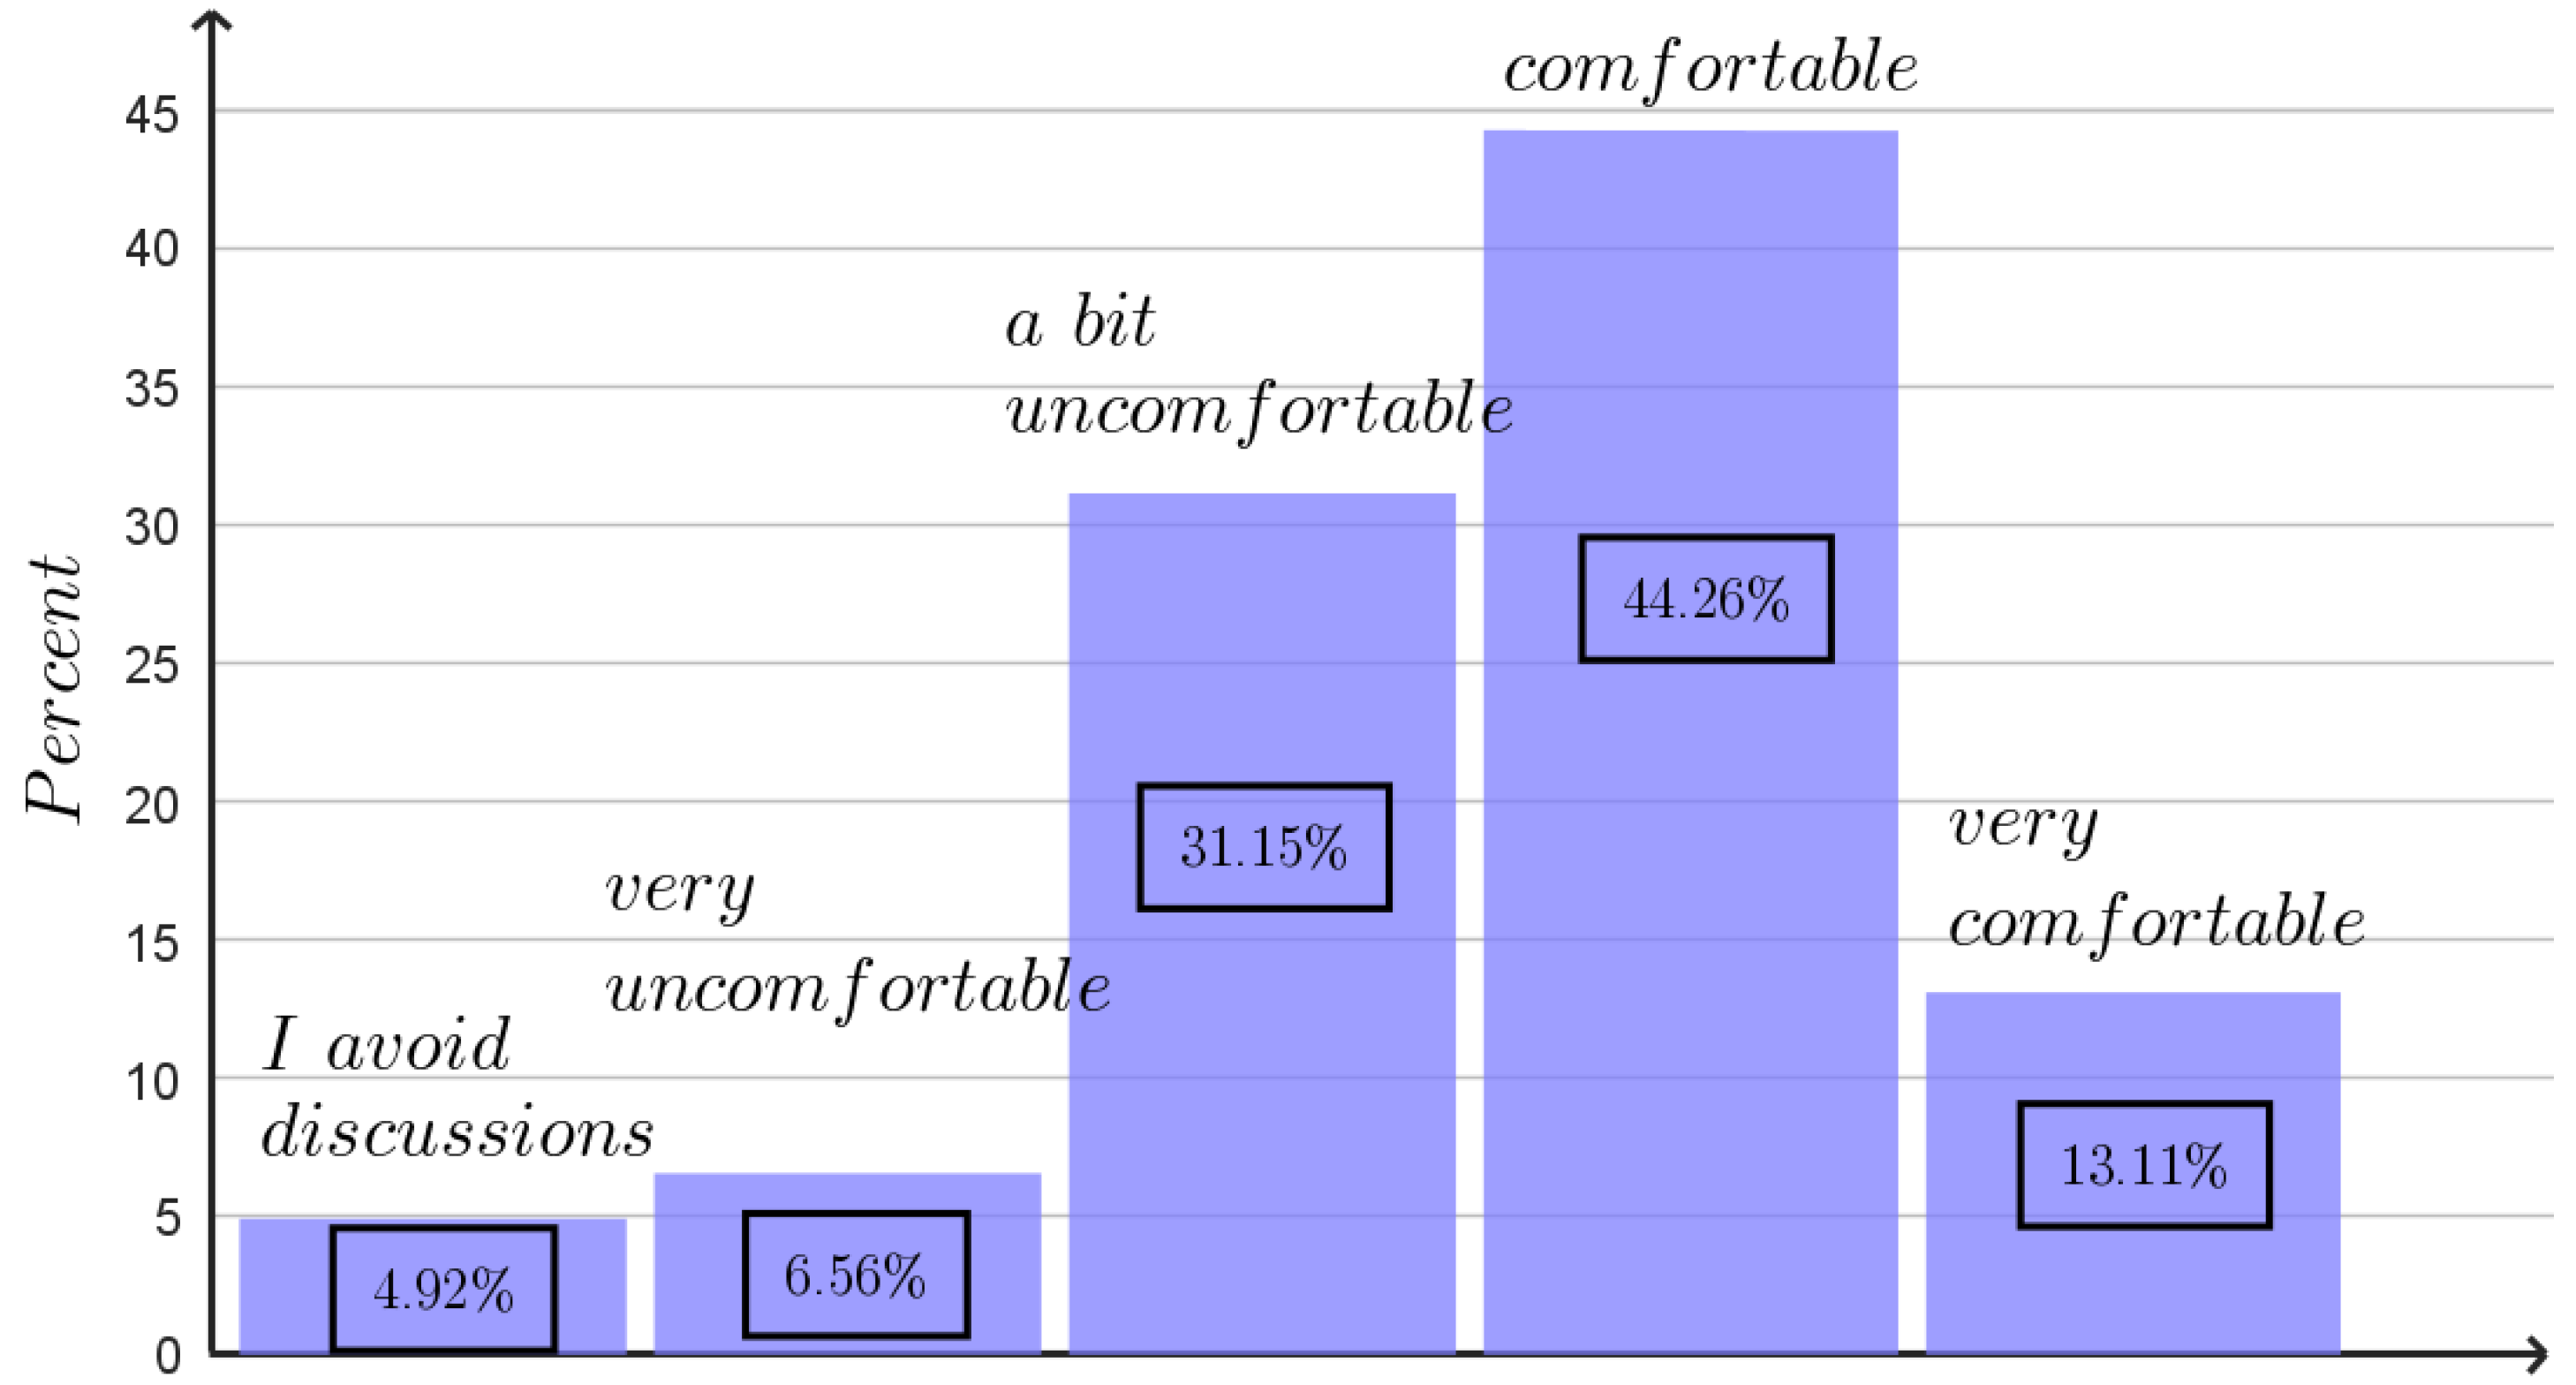

Table 1.
Descriptive statistics of students’ self-assessments of the four language skills.
| Mean | Confidence Interval for Mean | Median | Std. Deviation | |
|---|---|---|---|---|
| Self-evaluation of reading | () | |||
| Self-evaluation of listening | () | |||
| Self-evaluation of speaking | () | |||
| Self-evaluation of writing | () | |||
| Average self-evaluation | () |
Table 2.
Descriptive statistics of the placement test, GRADE 1, and GRADE 2.
| Mean | Confidence Interval for Mean | Median | Std. Deviation | |
|---|---|---|---|---|
| Placement test | () | |||
| GRADE 1 | () | |||
| GRADE 2 | () |
Table 3.
Relative influence of predictors in the CART Ebag model M1.
| Variable | Description | Relative Influence |
|---|---|---|
| SelfEval (dependent variable) | Average self-evaluation | |
| TimePractice | Frequency of English practice | |
| GroupDiscussion | Level of comfort when participating in group discussions in English | |
| YearLearn | Years of learning English | |
| IntensiveStudy | Intensity of English study | |
| Major | Major | |
| TypeSchool | Type of high school graduated from | |
| Background | Family background | |
| Abroad | Time spent abroad | |
| Certificate | Possession of a language certificate | |
| TypeStudy | Type of language study | |
| Age | Age | |
| Gender | Gender |
Table 4.
Relative influence of predictors in the CART Ebag model M1.
| Variable | Description | Relative Influence |
|---|---|---|
| SelfEval (dependent variable) | Average self-evaluation | |
| TimePractice | Frequency of English practice | |
| GroupDiscussion | Level of comfort when participating in group discussions in English | |
| YearLearn | Years of learning English | |
| IntensiveStudy | Intensity of English study | |
| Major | Major | |
| Background | Family background | |
| TypeSchool | Type of high school graduated from |
Table 5.
Relative influence of predictors in the CART EBag model M3 on students’ placement test results.
Table 5.
Relative influence of predictors in the CART EBag model M3 on students’ placement test results.
| Variable | Description | Relative Influence |
|---|---|---|
| PlacementTestGrade (dependent variable) | Placement test result | |
| Major | Major | |
| SelfEval | Average self-evaluation | |
| TimePractice | Frequency of English practice | |
| GroupDiscussion | Level of comfort when participating in group discussions in English | |
| IntensiveStudy | Intensity of English study | |
| YearLearn | Years of learning English |
Table 6.
Relative influence of predictors in the CART EBag model M4 on students’ GRADE 1 results.
| Variable | Description | Relative Influence |
|---|---|---|
| ScoreGrade1 (dependent variable) | Final General English score | |
| SelfEval | Average self-evaluation | |
| PlacementTestGrade | Placement test result | |
| TypeSchool | Type of high school graduated from | |
| TimePractice | Frequency of English practice | |
| GroupDiscussion | Level of comfort when participating in group discussions in English | |
| YearLearn | Years of learning English | |
| Major | Major |
Table 7.
Relative influence of predictors in the CART EBag model M5 on students’ results in GRADE 2 (ESP).
Table 7.
Relative influence of predictors in the CART EBag model M5 on students’ results in GRADE 2 (ESP).
| Variable | Description | Relative Influence |
|---|---|---|
| ScoreGrade2 (dependent variable) | Final result in ESP | |
| ScoreGrade1 | Final result in General English | |
| SelfEval | Average self-evaluation | |
| PlacementTestGrade | Placement test result | |
| TimePractice | Frequency of English practice | |
| TypeSchool | Type of high school graduated from | |
| GroupDiscussion | Level of comfort when participating in group discussions in English | |
| Certificate | Possession of a language certificate | |
| SelfImprovement | Perceived improvement in English after the first semester |
Table 8.
SelfEval, Placement test, GRADE 1, and GRADE 2 together.
| ScoreGrade2 | ScoreGrade1 | PlacementTest | SelfEval | |
|---|---|---|---|---|
| ScoreGrade1 | ||||
| PlacementTestGrade | ||||
| SelfEval | ||||
| TimePractice | ||||
| TypeSchool | insignificant | |||
| GroupDiscussion | ||||
| YearLearn | insignificant | |||
| Major | insignificant | |||
| IntensiveStudy | insignificant |
Disclaimer/Publisher’s Note: The statements, opinions and data contained in all publications are solely those of the individual author(s) and contributor(s) and not of MDPI and/or the editor(s). MDPI and/or the editor(s) disclaim responsibility for any injury to people or property resulting from any ideas, methods, instructions or products referred to in the content. |
© 2025 by the authors. Licensee MDPI, Basel, Switzerland. This article is an open access article distributed under the terms and conditions of the Creative Commons Attribution (CC BY) license (http://creativecommons.org/licenses/by/4.0/).
Copyright: This open access article is published under a Creative Commons CC BY 4.0 license, which permit the free download, distribution, and reuse, provided that the author and preprint are cited in any reuse.


