MSI (Microsatellite Instability) refers to a state of genomic instability caused by defects in the DNA mismatch repair (MMR) system, which prevents the correction of errors in the replication of small repetitive DNA sequences (microsatellites) during cell division [
1,
2]. MSS (Microsatellite Stability) refers to a state of stable microsatellites. MSI tumors account for approximately 3%-5% of all rectal cancers. Compared with MSS tumors, patients with stage II MSI-high (MSI-H) rectal cancer have a significantly lower recurrence risk and longer overall survival after surgery. Meanwhile, MSI-H/deficient MMR (dMMR) is the strongest biomarker for predicting the efficacy of immune checkpoint inhibitors [
3,
4]. However, the current assessment of MSI status in rectal cancer relies on biopsy, and conventional imaging methods cannot directly evaluate the MSI status of rectal cancer [
5,
6]. The purpose of this study was to investigate the feasibility of preoperatively predicting the MSI status of rectal cancer using T
2mapping technique combined with ADC value.
1. Materials and Methods
This study complied with the Declaration of Helsinki and was approved by the Ethics Committee of Heze Hospital Affiliated to Shandong Provincial Hospital. Since the study was a retrospective analysis with all patient data de-identified and no interventional procedures involved, it was exempt from requiring informed consent upon review by the Ethics Committee. and the approval number was 2025-KJKY022-074.
1.1. General Data
A retrospective analysis was conducted on 152 cases of pathologically confirmed rectal cancer in our hospital from January 2022 to June 2025.
Inclusion criteria: (1) All cases had complete pathological results, and the MSI status was confirmed by immunohistochemistry (IHC) (detecting MLH1, MSH2, MSH6, and PMS2) combined with MSI-PCR (detecting 5 microsatellite loci: BAT25, BAT26, D5S346, D2S123, and D17S250); (2) All MRI examinations were completed before any treatment (including biopsy, chemotherapy, and radiotherapy); (3) Image quality score ≥ 1 (see
Section 1.3 for definition).
Exclusion criteria: (1) Severe artifacts (foreign body or motion artifacts) affecting image measurement (image quality score = 0); (2) Receipt of intestinal anti-inflammatory treatment (e.g., 5-aminosalicylic acid) within 3 months before surgery; (3) Incomplete clinical or follow-up data.
Sample size calculation: Based on the previously reported T2 value difference of 9.06 ± 7.00 between the MSI and MSS groups in a prior study [
13], and using parameters set at α = 0.05 and power = 0.90, the minimum sample size for the MSI group was calculated as 35 using G*Power 3.1. To ensure statistical robustness, this study included 40 MSI patients.
1.2. Equipment and Methods
A 3.0T superconducting MRI scanner (Philips Elition, Philips Healthcare, the Netherlands, with an 18-channel phased-array body coil; and Siemens Prisma, Siemens Healthineers, Germany, with a 32-channel phased-array body coil) was used. Patients were instructed to empty their rectums before the examination and were placed in the supine position during scanning.
Scanning parameters: (1) Oblique axial high-resolution T2-weighted imaging (T2WI): Perpendicular to the long axis of the lesion; repetition time (TR) = 2500 ± 100 ms, echo time (TE) = 100 ± 5 ms, field of view (FOV) = 20-22 cm × 20-22 cm, matrix = 320 × 240, slice thickness = 3 mm, slice gap = 0.4 mm; fat suppression method: chemical shift suppression. (2) Diffusion-weighted imaging (DWI): TR = 4360 ± 200 ms, TE = 77 ± 3 ms, FOV = 30 cm × 22 cm, matrix = 168 × 168, slice thickness = 3 mm, slice gap = 0.4 mm, b-values = 50 and 800 s/mm2, diffusion directions = 15. (3) T2 mapping: Using the mDIXON QUANT sequence; TR = 1700 ± 50 ms, TE = 13, 26, 39, 52, 65, 78 ms, flip angle (FA) = 90°, echo train length (ETL) = 22, FOV = 38 cm × 38 cm, number of excitations (NEX) = 1, slice thickness = 3.5 mm, slice gap = 2.5 mm.
To evaluate the consistency of measurement results between different MRI scanners (Philips Elition and Siemens Prisma), we randomly selected 20 patients. The same radiologist measured the T2 values and ADC values respectively on the images generated by the two different scanners, and Bland-Altman analysis was used to perform consistency testing.
1.3. Image Analysis
Three senior radiologists with more than 8 years of experience in abdominal MRI diagnosis independently measured the T2 values and ADC values using Philips Intellispace Portal (Version 11.1) or Siemens Syngo VIA workstation in a blinded manner (unaware of patients’ clinical/pathological data).
Criteria for drawing the region of interest (ROI): (1) Slice selection: 3 slices (the maximum cross-section of the lesion + 1 adjacent slice above and below); (2) ROI range: Covering the entire solid component of the tumor, avoiding visible necrotic areas (T2WI signal ≥ 2 times the muscle signal), hemorrhagic areas, mucus, and the muscular layer of the intestinal wall; (3) ROI area: 15-30 mm
2 per slice; the final value was the average of the 3 slices [
10].
Consistency verification: If the measurement difference among the 3 radiologists exceeded 10%, a consensus was reached through joint image review; otherwise, the average value was taken. The coefficient of variation (CV, ≤ 15% considered acceptable) was used to evaluate intra-group consistency, and the intraclass correlation coefficient (ICC, ≥ 0.90 considered excellent) was used to assess inter-observer consistency.
Image quality scoring: 0 points: Severe artifacts (tumor boundary unidentifiable, unable to draw ROI); 1 point: Mild artifacts (tumor boundary clear, no impact on ROI drawing); 2 points: No artifacts (uniform tumor signal, clear structure).
1.4. Statistical Analysis
SPSS 26.0 and R 4.3.1 software were used for statistical analysis. (1) Grouping criteria: MSS group: All 4 IHC markers positive or only 1 marker missing [MSI-low (MSI-L)]; MSI group: ≥ 2 IHC markers missing, confirmed by MSI-PCR. (2) Normality test: Kolmogorov-Smirnov test; Homogeneity of variance test: Levene test. (3) Univariate analysis: Independent samples t-test (comparison of T2/ADC values between groups); one-way analysis of variance (ANOVA) (comparison of different clinical stages). (4) Multivariate analysis: Binary logistic regression combined with SMOTE oversampling (to address class imbalance,oversampling ratio = 1:1,k-nearest neighbors = 5) and L2 regularization (to avoid overfitting,λ=0.01) was used, and confounding factors (BMI, tumor location, image quality score) were included in the model. (5) Model validation: 10-fold cross-validation (Stratified by MSI status) and Bootstrap resampling (1000 times) were used to evaluate stability; Delong test was applied to compare the AUC of single/combined parameters.
2. Results
2.1. Baseline Characteristics of Patients
A total of 152 patients with pathologically confirmed rectal cancer were included in this study and divided into two groups according to microsatellite status: 40 cases in the MSI group (accounting for 26.3%, with 12/18/10 cases in clinical stage I/II/III, respectively) and 112 cases in the MSS group (accounting for 73.7%, with 28/50/34 cases in clinical stage I/II/III, respectively). There were no statistically significant differences in baseline characteristics such as age, gender, BMI, tumor location, clinical stage, and image quality score between the two groups (all p > 0.05), indicating comparability; only the T
2 value and ADC value showed significant differences between the two groups (p < 0.001). The statistical data are shown in
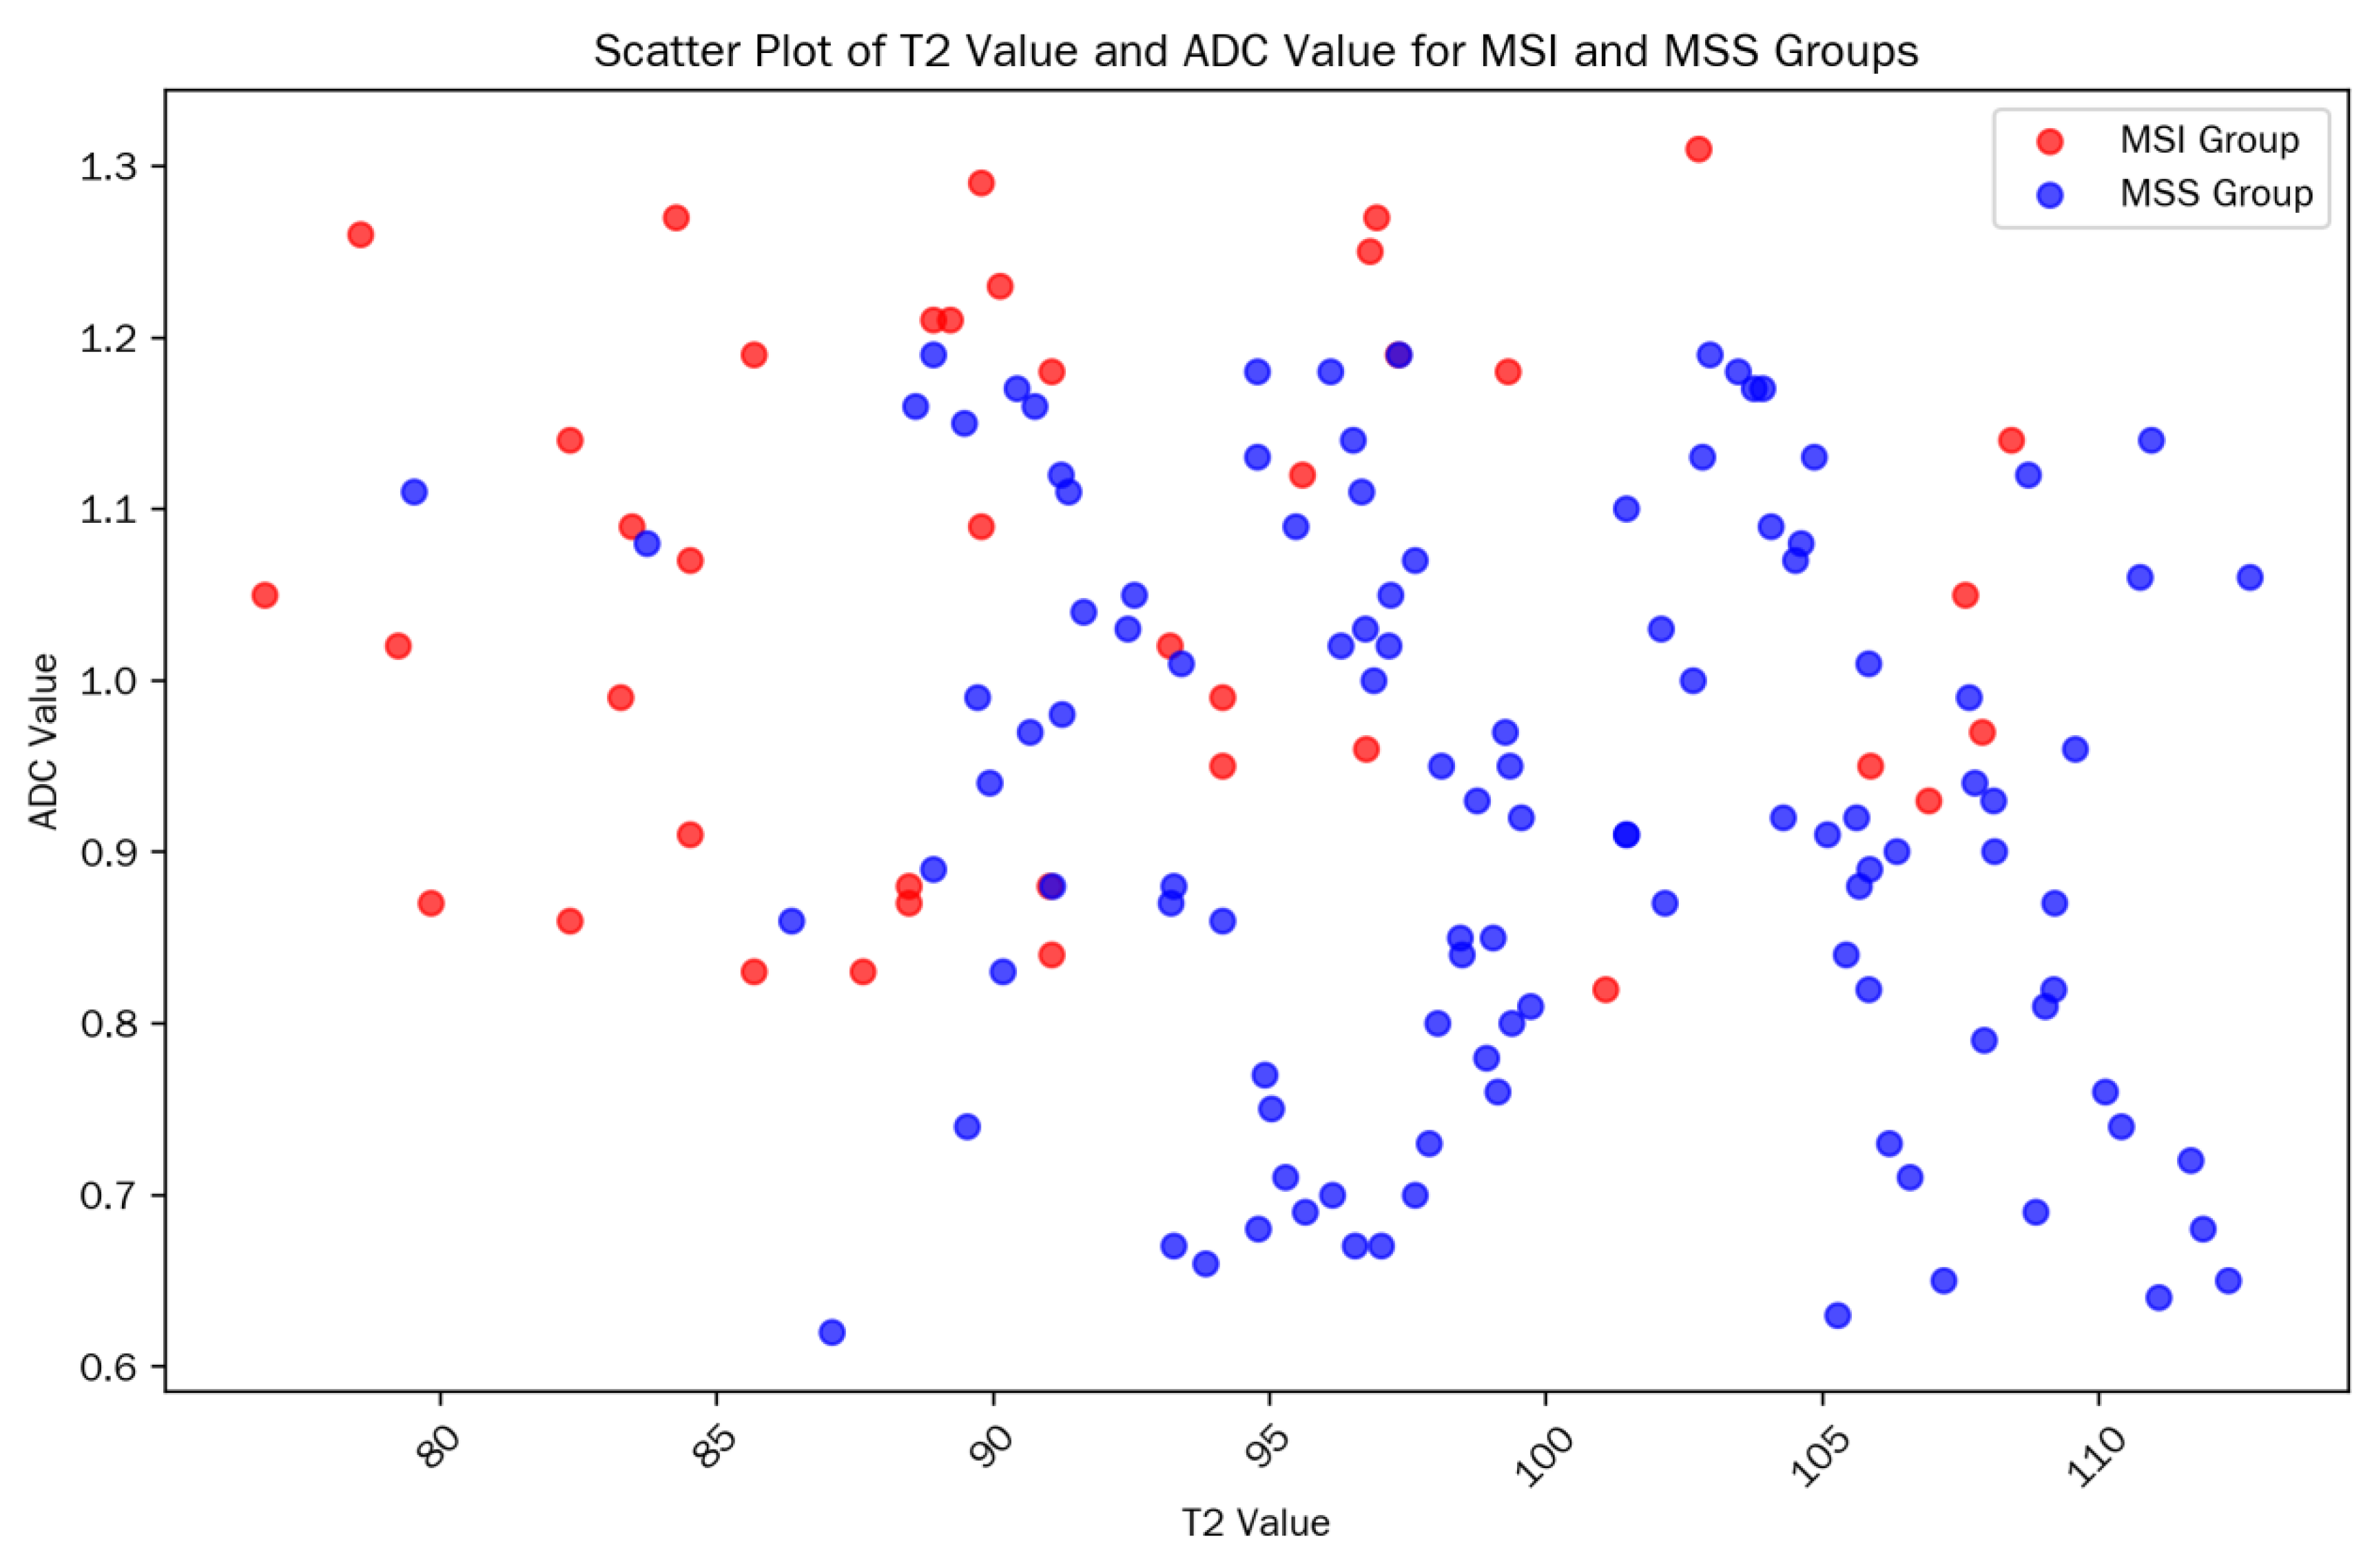
Table 1. The scatter plot of T2/ADC values in each group is shown in
Figure 1.
The consistency of measurement results among three radiologists was evaluated using the intraclass correlation coefficient (ICC). The results showed that the measurements of T2 values and ADC values both exhibited excellent inter-rater consistency (ICC_T2 = 0.94, 95% CI: 0.91-0.96; ICC_ADC = 0.92, 95% CI: 0.88-0.95).
The consistency between IHC and MSI-PCR results was excellent: Kappa value = 0.92 (95% confidence interval [CI]: 0.85-0.99), with 145 consistent cases (accounting for 95.4%), including 38 consistent cases in the MSI group (95.0%) and 107 consistent cases in the MSS group (95.5%), which verified the reliability of MSI status determination. In terms of image quality, 110 cases (72.4%) scored 2 points (no artifacts, uniform tumor signal, clear structure), and 42 cases (27.6%) scored 1 point (mild artifacts, no impact on ROI drawing); no cases scored 0 points (severe artifacts), which met the measurement requirements.
2.2. Results of Univariate Analysis
T2 value: The T2 value in the MSI group was significantly lower than that in the MSS group (92.18 ± 7.21 ms vs. 99.47 ± 7.85 ms, t = -5.89, p < 0.001), suggesting that MSI-type tumors have lower signals on T2 mapping images.
ADC value: The ADC value in the MSI group was significantly higher than that in the MSS group (1.06 ± 0.18 vs. 0.91 ± 0.19 × 10⁻³ mm2/s, t = 4.78, p < 0.001), indicating that MSI-type tumors have less restricted water molecule diffusion.
There were no statistically significant differences in T2 values and ADC values measured by different brands of MRI scanners (Philips Elition and Siemens Prisma) within the MSI group (T2 value: 91.52 ± 6.21 vs. 91.38 ± 6.25 ms, p = 0.921; ADC value: 1.05 ± 0.15 vs. 1.04 ± 0.16 × 10⁻³ mm2/s, p = 0.876), indicating that scanner differences had no significant impact on the measurement results.
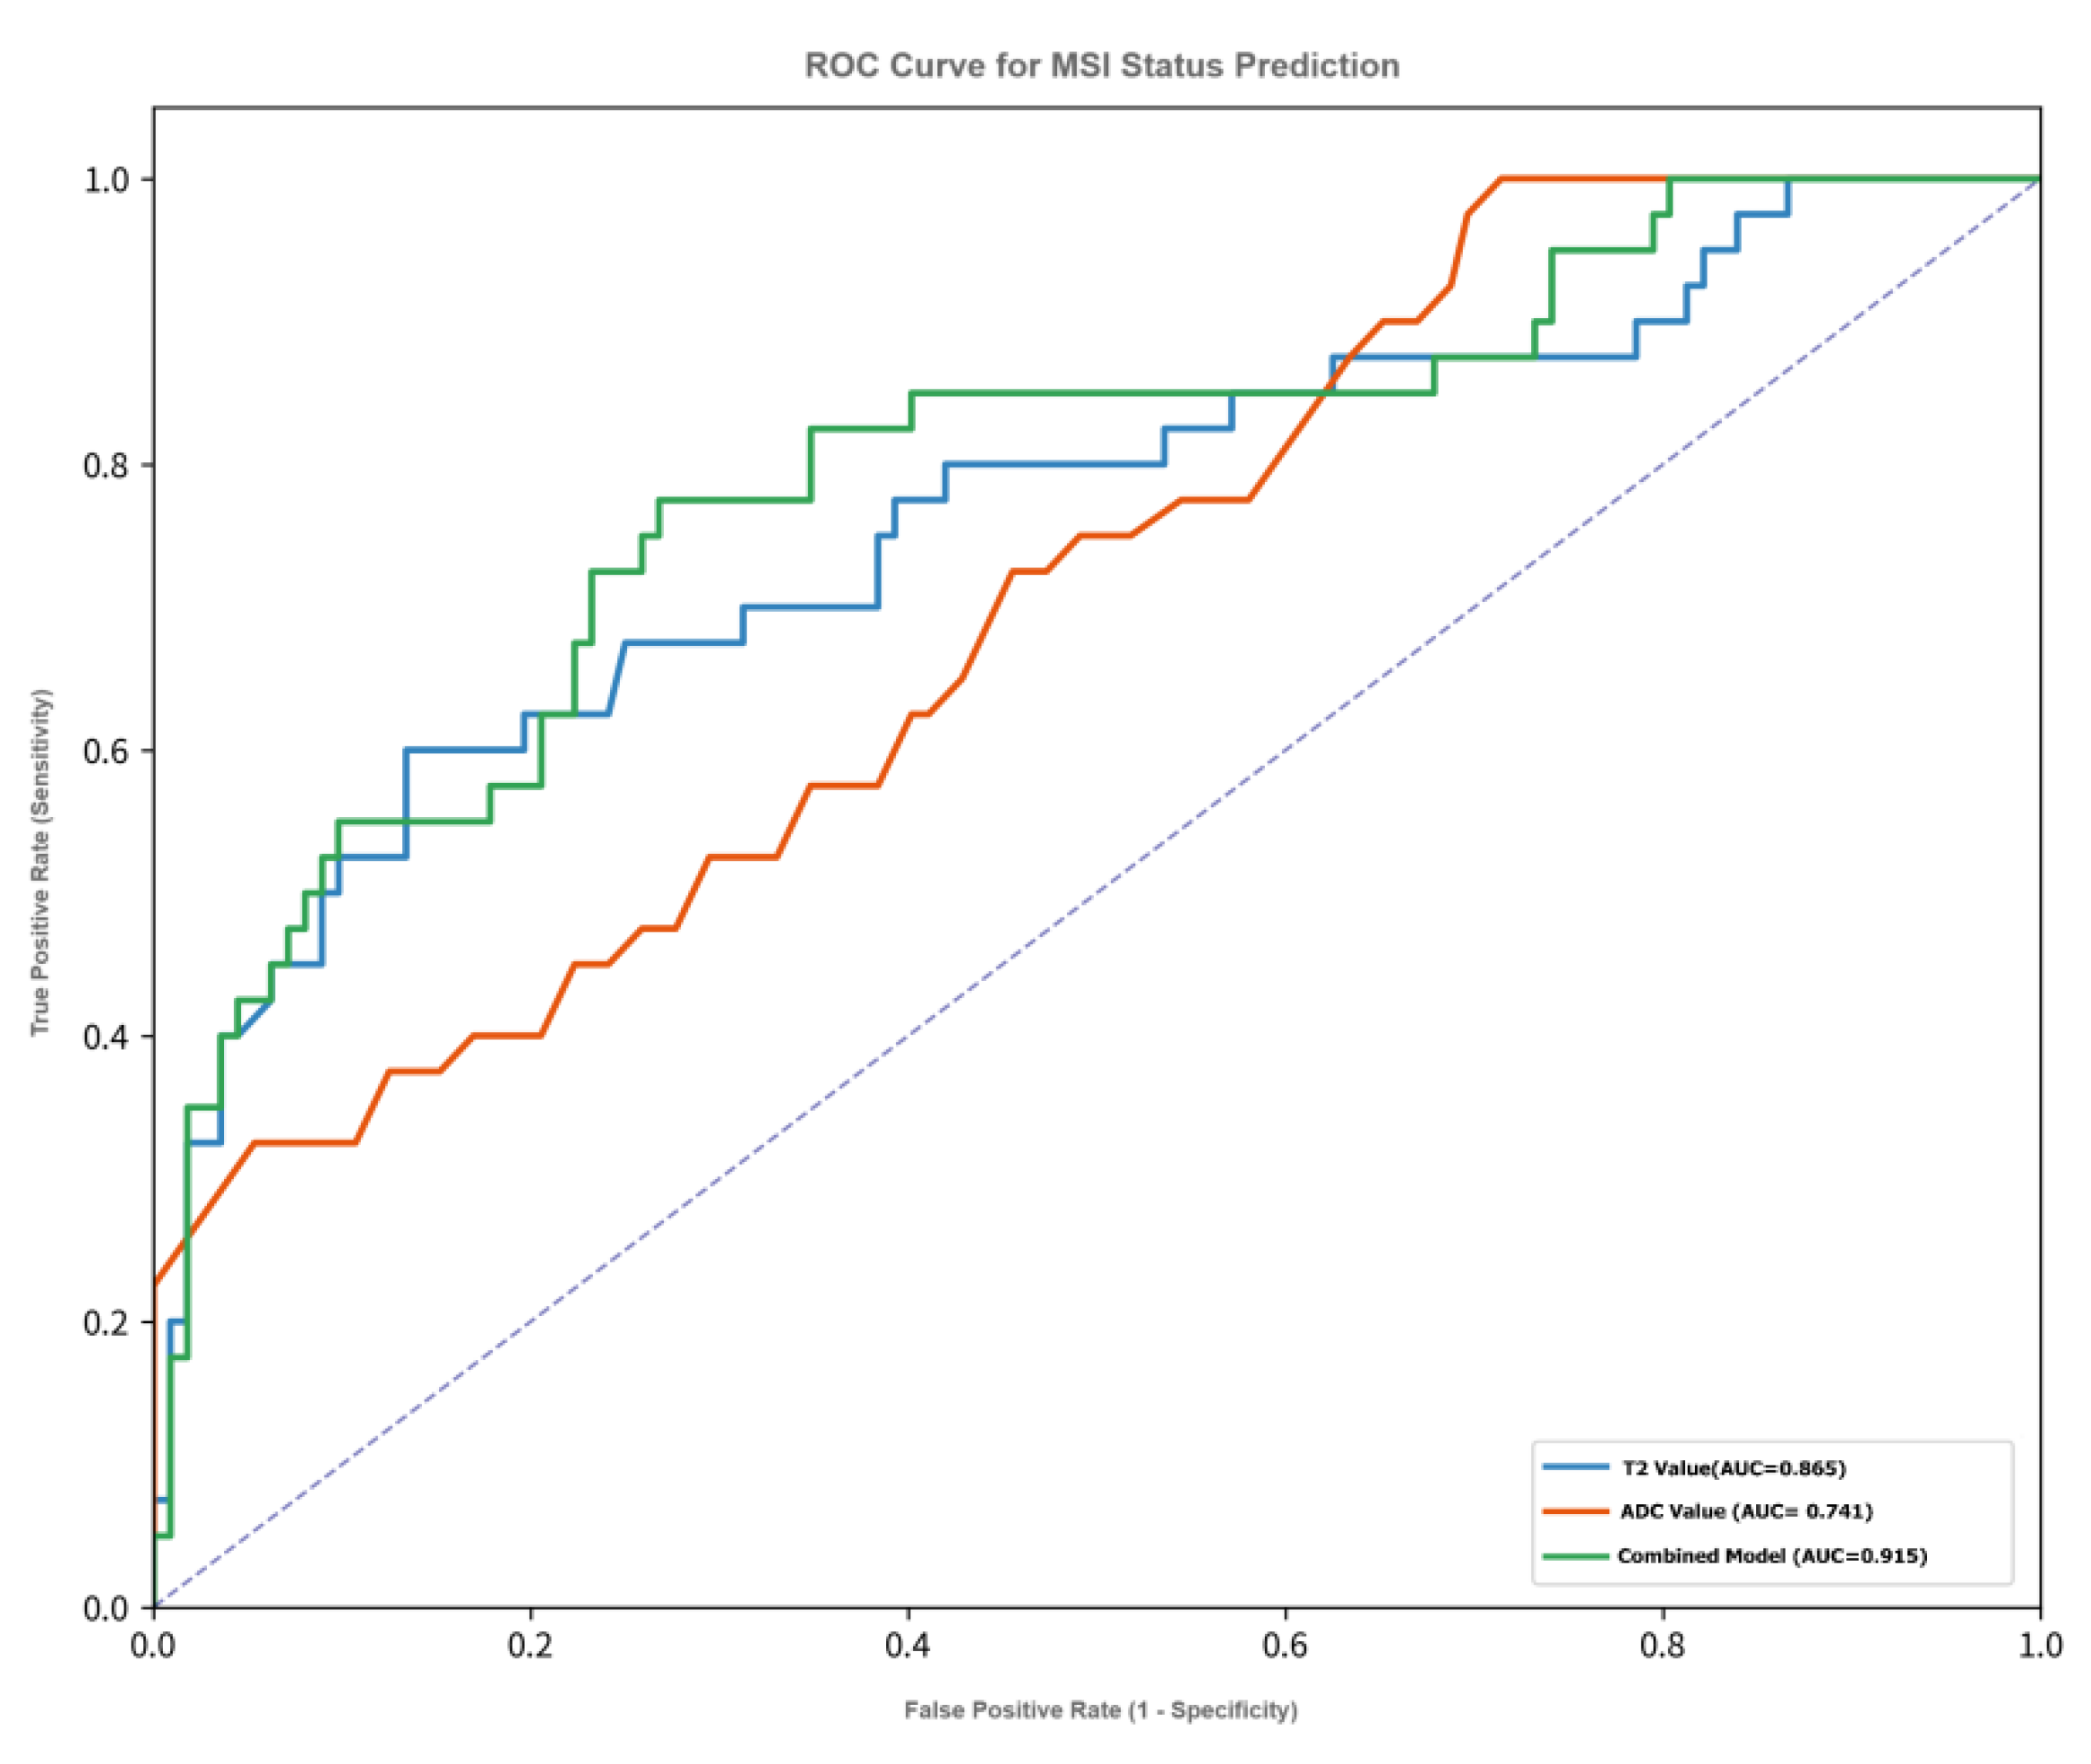
ROC curve analysis (see
Figure 2) showed that single imaging parameters had predictive value for the MSI status of rectal cancer:
T2 value: AUC = 0.865 (95% CI: 0.798-0.932), optimal cutoff value = 94.5 ms, Maximum Youden Index=66.4%,corresponding sensitivity = 82.5%, specificity = 83.9%, positive predictive value (PPV) = 66.0%, negative predictive value (NPV) = 92.7%.
ADC value: AUC = 0.741 (95% CI: 0.652-0.830), optimal cutoff value = 0.97 × 10⁻³ mm2/s, Maximum Youden Index=46.4%,sensitivity = 75.0%, specificity = 71.4%, PPV = 51.7%, NPV = 87.5%.
In comparison, the diagnostic efficacy of T2 value was significantly superior to that of ADC value (Delong test: Z = 2.41, p = 0.016).
2.3. Comparison of Imaging Parameters Among Different Clinical Stages (Table 2)
One-way ANOVA results showed:
T2 value: There was a statistically significant difference among different clinical stages (F = 3.48, p = 0.033). Specifically, the T2 value in stage III (99.75 ± 6.90 ms) was significantly higher than that in stage I (96.72 ± 7.50 ms, p = 0.043), suggesting that the T2 value tends to increase with tumor progression.
ADC value: There was no statistically significant difference among different clinical stages (F = 0.93, p = 0.401), indicating that the ADC value is less affected by tumor stage.
Table 2.
Diagnostic Performance of the Combined Model Across Different Clinical Stages.
Table 2.
Diagnostic Performance of the Combined Model Across Different Clinical Stages.
| Clinical Stage |
Number of Cases (MSI/MSS) |
AUC (95% CI) |
Sensitivity (%) |
Specificity (%) |
PPV (%) |
NPV (%) |
| Stage I |
12/28 |
0.89 (0.81-0.97) |
83.3 |
89.3 |
76.2 |
92.9 |
| Stage II |
18/50 |
0.92 (0.86-0.98) |
82.2 |
90.0 |
77.8 |
92.3 |
| Stage III |
10/34 |
0.90 (0.82-0.98) |
80.0 |
88.2 |
72.7 |
91.2 |
2.4. Construction of Multivariate Logistic Regression Model
Taking “MSI status” as the dependent variable, a binary logistic regression model was constructed by including T
2 value, ADC value, and potential confounding factors (BMI, tumor location, image quality score) (combined with SMOTE oversampling to address class imbalance and L2 regularization to avoid overfitting). The results are shown in
Table 3:
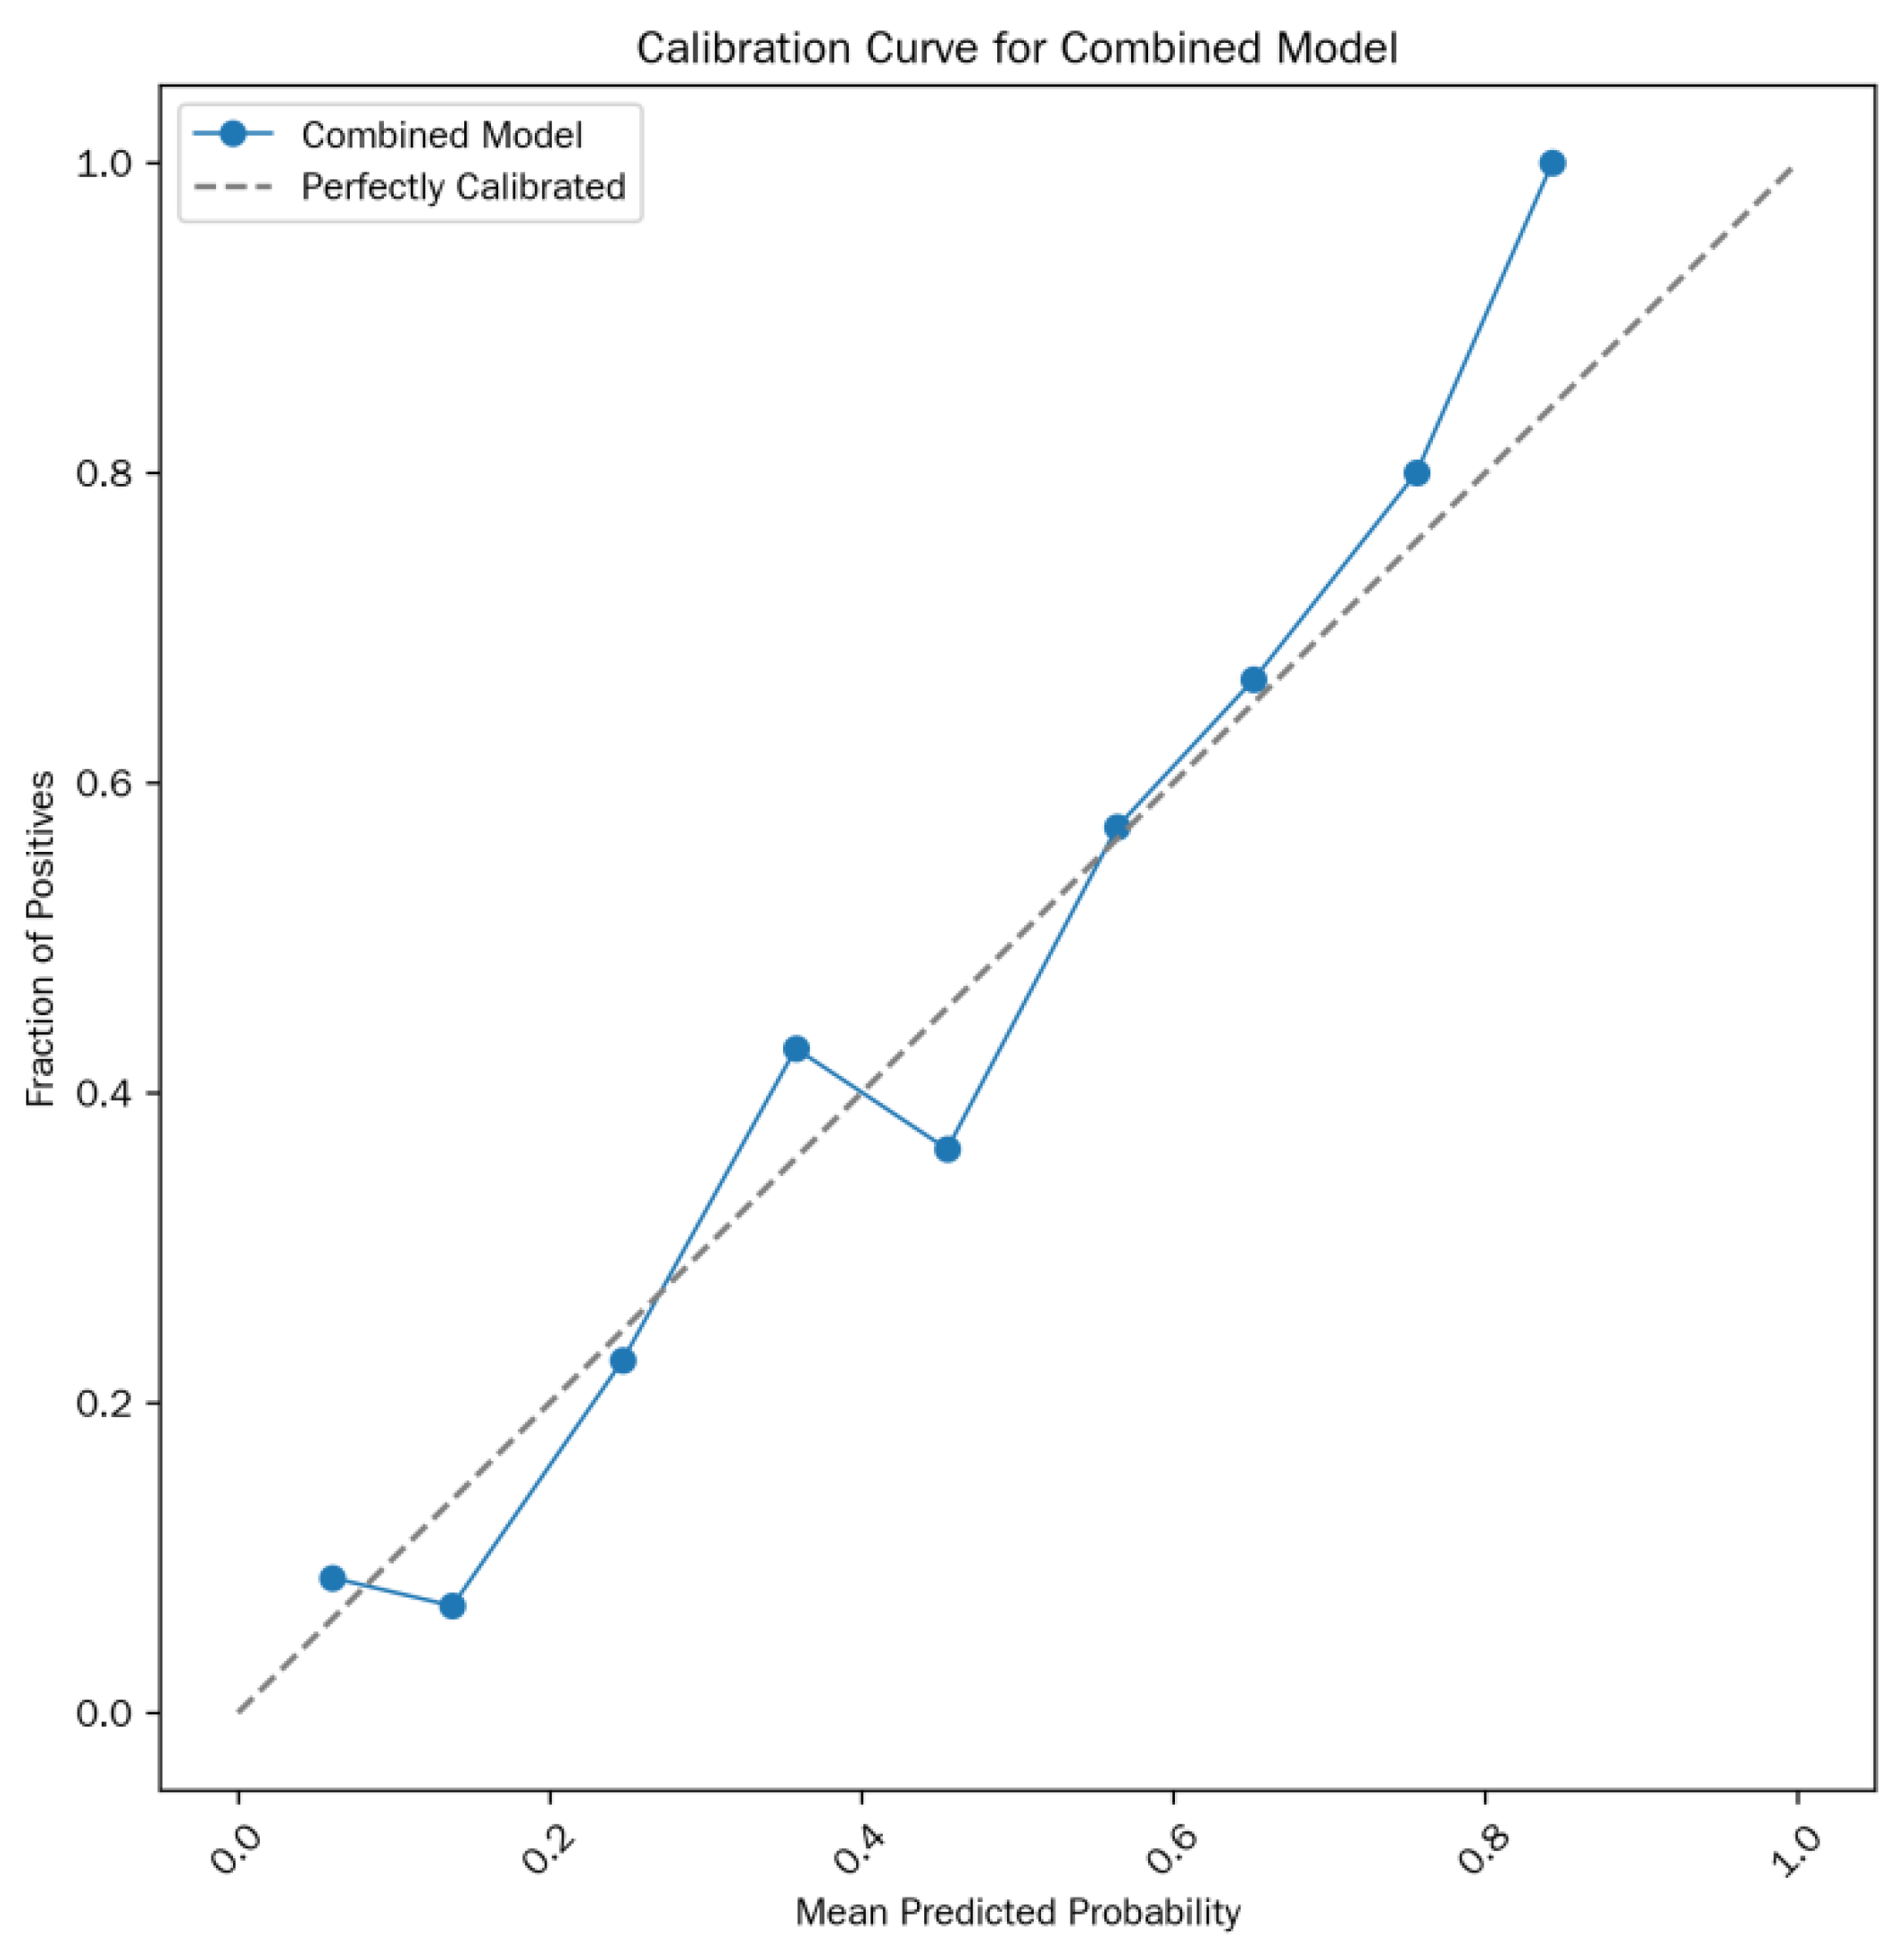
Model formula: Logit(P) =-13.15 + 0.09×T
2 value + 4.32×ADC value (where P is the predicted probability of MSI status). The calibration curve is shown in
Figure 3.
2.5. Diagnostic Efficacy of the Combined Model
The diagnostic performance of the combined prediction model based on T2 value + ADC value was significantly superior to that of single parameters:
ROC curve (see
Figure 2): AUC = 0.915 (95% CI: 0.865-0.965), Maximum Youden Index=71.8%,sensitivity = 82.5%, specificity = 89.3%, PPV = 75.0%, NPV = 93.8%.
Comparison with single parameters: The AUC of the combined model was significantly higher than that of T2 value (Z = 2.43, p = 0.015) and ADC value (Z = 4.05, p < 0.001).
Two methods were used to verify model stability:
10-fold cross-validation: Mean AUC = 0.906 (95% CI: 0.850-0.962), and the AUC fluctuation range across folds was < 5%.
Bootstrap resampling (1000 times): Mean AUC = 0.913 (95% CI: 0.865-0.961), indicating that the model maintained stable diagnostic performance across different sample subsets.
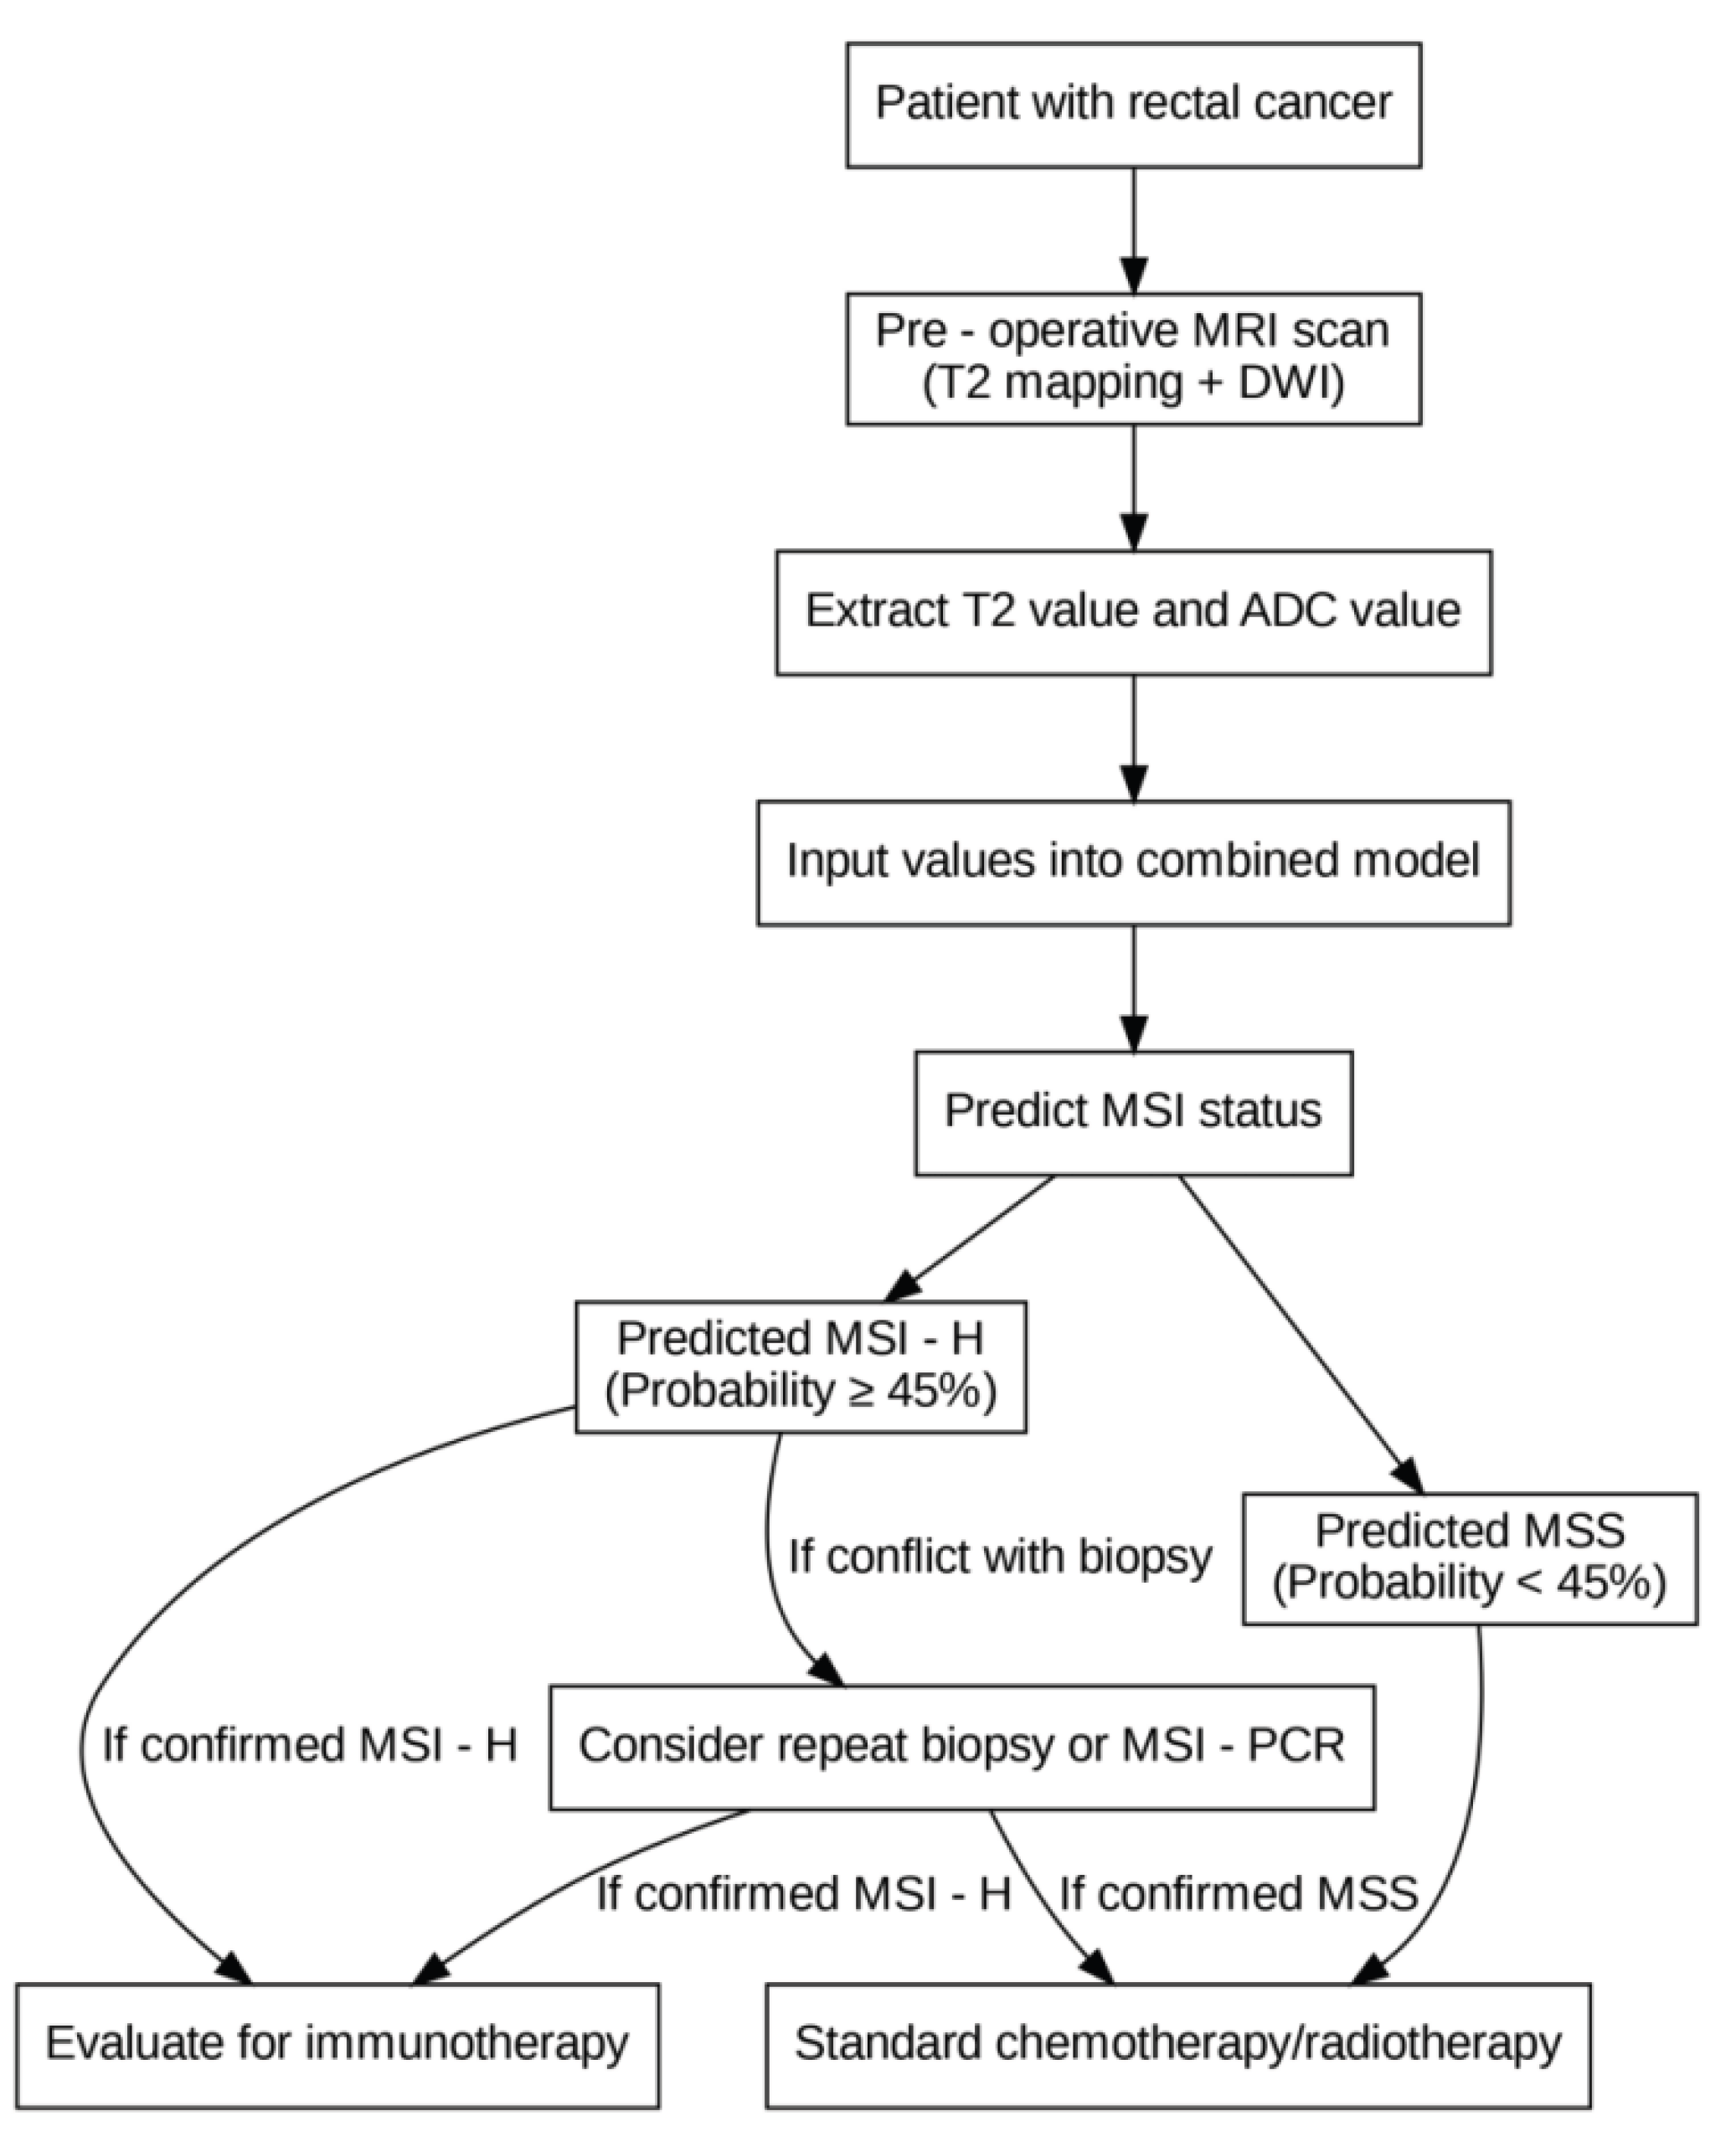
The clinical decision-making flowchart for MSI prediction is shown in
Figure 4.
3. Discussion
Microsatellite instability (MSI) status in rectal cancer is a key biomarker guiding postoperative prognostic evaluation and immunotherapy decision-making. However, the current invasive assessment relying on biopsy has limitations such as sampling bias (e.g., insufficient representativeness of local samples due to tumor heterogeneity) and reporting delay (3–5 days of turnaround time), which cannot meet the clinical needs of preoperative precise stratification. By analyzing preoperative MRI data from 152 patients with pathologically confirmed rectal cancer, this study systematically verified the synergistic value of T2 mapping quantitative parameters (T2 value) and apparent diffusion coefficient (ADC value) in predicting MSI status for the first time. Its core findings not only provide new evidence for non-invasive assessment but also expand existing knowledge from the perspectives of imaging-pathology correlation and clinical adaptability.
3.1. Pathological Mechanisms and Biological Significance of Imaging Parameter Differences
This study observed that the T
2 value in the MSI group was significantly lower than that in the microsatellite stability (MSS) group (92.18±7.21 ms vs. 99.47±7.85 ms), while the ADC value in the MSI group was significantly higher than that in the MSS group (1.06±0.18 vs. 0.91±0.19×10
−3 mm
2/s). This difference is not merely a numerical phenomenon but may be directly related to the unique tumor microenvironment characteristics of MSI-type rectal cancer. Existing studies have confirmed that MSI-high (MSI-H)/deficient mismatch repair (dMMR) rectal cancer is often accompanied by significant enrichment of tumor-infiltrating lymphocytes (TILs) and reduced stromal fibrosis [
7,
11]. On one hand, the decrease in stromal fibrosis means a reduction in the proportion of bound water in tissues and a relative increase in free water. This change in the state of water molecules may shorten the T
2 relaxation time, thereby manifesting as low signal intensity on T
2 mapping [
9]. On the other hand, although TILs are cellular components, they have lower cytoplasm abundance and nuclear density compared with tumor cells, resulting in a weaker restrictive effect on water molecule diffusion. Additionally, reduced fibrosis further decreases the obstruction of extracellular matrix to diffusion, collectively leading to an increase in the ADC value in the MSI group [
12]. It should be noted that this study has not yet conducted precise matching analysis between preoperative MRI and postoperative large tissue sections. The aforementioned mechanisms are still reasonable inferences based on literature. Future studies need to clarify the quantitative correlation between T
2 value, ADC value, TILs density, and stromal fibrosis degree through imaging-pathology correlation research to verify this hypothesis.
3.2. Differences in Diagnostic Efficacy Between Single Parameters and Combined Models: Basis for Clinical Selection
Receiver operating characteristic (ROC) analysis showed that the area under the curve (AUC) of T
2 value alone for predicting MSI (0.865) was significantly better than that of ADC value (0.741), suggesting that T
2 mapping may be a superior single-modal marker. This result is consistent with the conclusion of Zheng et al. [
10] regarding the advantages of T
2-weighted imaging (T
2WI) in evaluating the microstructure of rectal cancer. However, this study further improved the diagnostic stability through quantitative analysis (rather than qualitative scoring). After measurement by three senior radiologists, the intraclass correlation coefficient (ICC) of both T
2 value and ADC value exceeded 0.90, confirming the inter-observer consistency of quantitative parameters. Notably, although the ADC value has relatively weak diagnostic efficacy when used alone, there was no significant difference in ADC value across different clinical stages (F=0.93, p=0.401), while the T
2 value showed a significant upward trend with the progression of clinical stages (Stage III: 99.75±6.90 ms vs. Stage I: 96.72±7.50 ms, p=0.043). This characteristic suggests that the ADC value may be a stage-independent stable predictor for MSI, especially suitable for advanced-stage (Stage II/III) rectal cancer. At this stage, the increased degree of fibrosis in the tumor microenvironment may interfere with the judgment of T
2 value, while the ADC value is less affected by staging and can serve as a supplementary indicator. In contrast, the T
2 value has higher diagnostic value in early-stage (Stage I) rectal cancer, as it can more sensitively reflect the microenvironmental differences of early MSI tumors.
The combined model constructed based on the above characteristics (Logit(P) = -13.15 + 0.09×T
2 value + 4.32×ADC value) increased the AUC to 0.915. Compared with the T
2 value alone, the specificity (89.3%) and negative predictive value (93.8%) of the combined model increased by 5.4% and 1.1%, respectively. The clinical significance of this improvement lies in the following aspects: high specificity can effectively reduce the probability of misclassifying MSS patients as MSI, thereby avoiding unnecessary immunotherapy recommendations (especially for MSS patients with limited benefit from immunotherapy); high negative predictive value can reliably rule out MSI status, providing a basis for clinical selection of traditional chemotherapy regimens. Compared with the previous MSI prediction model based on radiomics by Zhang et al. [
13] (AUC=0.88), the combined model in this study does not require complex feature extraction and machine learning algorithms. It can obtain quantitative parameters only through routine MRI post-processing, which is more conducive to promotion in primary hospitals and has higher clinical translation feasibility.
3.3. Optimization Value for the Precision Diagnosis and Treatment Workflow of Rectal Cancer
In the current preoperative evaluation of rectal cancer, high-resolution MRI has been routinely used for tumor staging (T/N staging) and circumferential resection margin assessment, but it has not yet been integrated into MSI status evaluation. This study confirmed that by adding T2 mapping and diffusion-weighted imaging (DWI) sequences (both are clinically commonly used sequences without additional scanning time) to routine MRI examinations and measuring T2 value and ADC value, one-stop assessment of “tumor staging + MSI status” can be achieved. The advantages of this integrated model are reflected in the following three aspects:
Reducing invasive procedures: It avoids the risks of bleeding and perforation caused by separate biopsies, especially for patients with deeply located tumors (high rectal cancer) or complicated with intestinal stenosis.
Overcoming sampling bias: MRI quantitative parameters reflect the overall microenvironmental characteristics of the tumor rather than local biopsy tissues, which can avoid misdiagnosis caused by tumor heterogeneity (e.g., biopsy samples are accidentally taken from non-MSI regions).
Accelerating treatment decision-making: MRI reports can be issued simultaneously with staging results, without waiting for 3–5 days for pathological biopsy results, thereby gaining treatment time for MSI-H patients who require preoperative neoadjuvant immunotherapy [
4].
In addition, subgroup analysis across different clinical stages in this study showed that the combined model maintained high diagnostic efficacy in Stage I–III rectal cancer (AUC=0.89–0.92), with the best performance in Stage II rectal cancer (AUC=0.92). Considering that patients with Stage II MSI-H rectal cancer have significantly lower postoperative recurrence risk than MSS patients [
1] and that immunotherapy has clear benefits for MSI-H patients [
3], this model can provide important references for the selection of postoperative adjuvant therapy for Stage II patients: for patients predicted to be MSI by the combined model, postoperative chemotherapy may be exempted, and close follow-up or immunotherapy maintenance may be chosen instead; for patients predicted to be MSS, routine adjuvant chemotherapy is required to achieve individualized treatment stratification.
3.4. Study Limitations and Future Research Directions
This study has limitations in three aspects, which need to be improved in subsequent studies:
Single-center and sample size limitations: This study is a single-center retrospective study. Although the sample size of the MSI group (n=40) is consistent with the overall incidence of MSI-H in rectal cancer (3%–5%), it may lead to insufficient statistical power of the model in subgroup analysis (e.g., Stage III patients, n=10). Moreover, the parameter consistency of single-center equipment (Philips Elition and Siemens Prisma) may not fully represent the performance of MRI equipment from different brands. Future multi-center prospective studies are needed to include MRI equipment of different brands and field strengths (1.5T/3.0T) to verify the external validity of the model.
Limitations in parameter dimensions: This study only included T
2 value and ADC value, and did not incorporate parameters reflecting tumor angiogenesis (such as dynamic contrast-enhanced MRI [DCE-MRI], e.g., Ktrans and Ve values) or parameters reflecting the heterogeneity of water molecule diffusion (diffusion kurtosis imaging [DKI]) [
16,
17]. Existing studies have confirmed that DCE-MRI parameters are related to vascular density in the tumor microenvironment, and MSI-H tumors are often accompanied by reduced angiogenesis [
17]. In the future, these parameters can be integrated into the model to further improve diagnostic efficacy.
Lack of imaging-pathology correlation: As mentioned earlier, the correlation between imaging parameters and pathological features (TILs, fibrosis) in this study is only an inference and has not been verified by postoperative large tissue sections. Subsequent studies need to adopt spatial matching technology of pathological sections and MRI images (e.g., imaging-pathology fusion) to quantitatively analyze the correlation between T2 value, ADC value, and pathological indicators, thereby providing direct evidence for the biological significance of imaging parameters.
In addition, with the development of circulating tumor DNA (ctDNA) detection technology, future studies can explore combining MRI quantitative parameters with MSI locus mutations in ctDNA [
18,
19] to construct an “imaging-molecular” combined model, further improving the accuracy of MSI prediction, especially for advanced patients who cannot obtain tumor tissue.
3.5. Conclusions
This study confirms for the first time that T2 mapping combined with ADC value can serve as a reliable method for non-invasive assessment of MSI status in rectal cancer. The combined model not only has better diagnostic efficacy than single parameters but also maintains stable performance across different clinical stages, demonstrating the potential for one-stop integration into routine MRI evaluation. Despite limitations such as single-center design and small sample size, this study provides a new paradigm for imaging-based evaluation of MSI in rectal cancer. Through simple and reproducible quantitative parameters, preoperative prediction of MSI status can be achieved, providing a basis for precision stratified treatment (e.g., screening for immunotherapy candidates). In the future, through multi-center validation, technical standardization, and multimodal integration, this method is expected to become an important part of routine preoperative evaluation of rectal cancer, promoting the advancement of rectal cancer diagnosis and treatment toward “imaging-guided individualized treatment”.
Author Contributions
Study design and conceptualization: Zhao Xiaoxin, Hou Yuejiao; Data acquisition: Zhao Xiaoxin, Ma Hongzhou; Data analysis and interpretation: Zhao Xiaoxin, Hou Yuejiao; Manuscript drafting and revision: Zhao Xiaoxin, Ma Hongzhou; Final approval of the manuscript: All authors.
Funding
This research did not receive any specific grant from funding agencies in the public, commercial, or not-for-profit sectors
Institutional Review Board Statement
This study was approved by the Ethics Committee of Heze Hospital Affiliated to Shandong Provincial Hospital (Approval No.: 2025-KJKY022-074). As this was a retrospective study using de-identified data without any interventional procedures, the requirement for informed consent was waived by the Ethics Committee
Data Availability Statement
The data that support the findings of this study are available from the corresponding author upon reasonable request. The authors declare that all data supporting the fundings of this study are available within the paper and its source data for the figures and tables in this study are available from the corresponding authors upon request
Acknowledgments
The authors thank the Department of Radiology and Pathology of Heze Hospital Affiliated to Shandong Provincial Hospital for their support in data collection and processing
Conflicts of Interest
All authors declare that they have no conflicts of interest.
Abbreviations
| ANOVA |
Analysis of Variance |
| AUC |
Area Under the Curve |
| BMI |
Body Mass Index |
| CI |
Confidence Interval |
| dMMR |
Deficient Mismatch Repair |
| MMR |
Mismatch Repair |
| MRI |
Magnetic Resonance Imaging |
| MSI |
Microsatellite Instability |
| MSI-H |
Microsatellite Instability-High |
| MSI-L |
Microsatellite Instability-Low |
| MSS |
Microsatellite Stability |
| ROI |
Region of Interest |
| ROC |
Receiver Operating Characteristic |
References
- Swets, M.; Graham Martinez, C.; van Vliet, S.; et al. Microsatellite instability in rectal cancer: what does it mean? A study of two randomized trials and a systematic review of the literature. Histopathology 2022, 81, 352–362. [Google Scholar] [CrossRef]
- O’Connell, E.; Reynolds, I.S.; McNamara, D.A.; Prehn, J.H.M.; Burke, J.P. Microsatellite instability and response to neoadjuvant chemoradiotherapy in rectal cancer: A systematic review and meta-analysis. Surg Oncol 2020, 34:57-62. [CrossRef]
- Desir, A.D.; Ali, F.G. Microsatellite Instability in Colorectal Cancer: The Evolving Role of Immunotherapy. Dis Colon Rectum 2023, 66, 1303–1307. [Google Scholar] [CrossRef] [PubMed]
- Xia, F.; Wang, Y.; Wang, H.; et al. Randomized Phase II Trial of Immunotherapy-Based Total Neoadjuvant Therapy for Proficient Mismatch Repair or Microsatellite Stable Locally Advanced Rectal Cancer (TORCH). J Clin Oncol 2024, 42, 3308–3318. [Google Scholar] [CrossRef] [PubMed]
- Cai, Z.; Xu, Z.; Chen, Y.; et al. Multiparametric MRI subregion radiomics for preoperative assessment of high-risk subregions in microsatellite instability of rectal cancer patients: a multicenter study. Int J Surg 2024, 110, 4310–4319. [Google Scholar] [CrossRef] [PubMed]
- Mahmoud, N.N. Colorectal Cancer: Preoperative Evaluation and Staging. Surg Oncol Clin N Am 2022, 31, 127–141. [Google Scholar] [CrossRef] [PubMed]
- Ludford, K.; Ho, W.J.; Thomas, J.V.; et al. Neoadjuvant Pembrolizumab in Localized Microsatellite Instability High/Deficient Mismatch Repair Solid Tumors. J Clin Oncol 2023, 41, 2181–2190. [Google Scholar] [CrossRef] [PubMed]
- REACCT Collaborative. Microsatellite instability in young patients with rectal cancer: molecular findings and treatment response. Br J Surg 2022, 109, 251–255. [CrossRef]
- Yu, J.H.; Xiao, B.Y.; Li, D.D.; et al. Neoadjuvant camrelizumab plus apatinib for locally advanced microsatellite instability-high or mismatch repair-deficient colorectal cancer (NEOCAP): a single-arm, open-label, phase 2 study. Lancet Oncol 2024, 25, 843–852. [Google Scholar] [CrossRef] [PubMed]
- Zheng, X.; Lu, T.; Tang, Q.; Yang, M.; Fan, Y.; Wen, M. The clinical value of applying diffusion-weighted imaging combined with T2-weighted imaging to assess diagnostic performance of muscularis propria invasion in mid-to-high rectal cancer. Abdom Radiol (NY) 2025, 50, 598–607. [Google Scholar] [CrossRef] [PubMed]
- Tosi, F.; Salvatore, L.; Tamburini, E.; et al. Curative immune checkpoint inhibitors therapy in patients with mismatch repair-deficient locally advanced rectal cancer: a real-world observational study. ESMO Open 2024, 9, 103929. [Google Scholar] [CrossRef] [PubMed]
- Alshenaifi, J.Y.; Vetere, G.; Maddalena, G.; et al. Mutational and co-mutational landscape of early onset colorectal cancer. Biomarkers 2025, 30, 64–76. [Google Scholar] [CrossRef] [PubMed]
- Zhang, W.; Huang, Z.; Zhao, J.; et al. Development and validation of magnetic resonance imaging-based radiomics models for preoperative prediction of microsatellite instability in rectal cancer. Ann Transl Med 2021, 9, 134. [Google Scholar] [CrossRef] [PubMed]
- Li, Y.; Tan, L.; Chen, N.; et al. Neoadjuvant Immunotherapy Alone for Patients With Locally Advanced and Resectable Metastatic Colorectal Cancer of dMMR/MSI-H Status. Dis Colon Rectum 2024, 67, 1413–1422. [Google Scholar] [CrossRef] [PubMed]
- Zhang, H.; Huang, J.; Xu, H.; et al. Neoadjuvant immunotherapy for DNA mismatch repair proficient/microsatellite stable non-metastatic rectal cancer: a systematic review and meta-analysis. Front Immunol 2025, 16:1523455. Published 2025 Jan 27. [CrossRef]
- Su, W.; Ling, Y.; Yang, X.; Wu, Y.; Xing, C. Tumor microenvironment remodeling after neoadjuvant chemoradiotherapy in local advanced rectal cancer revealed by single-cell RNA sequencing. J Transl Med 2024, 22, 1037. [Google Scholar] [CrossRef] [PubMed]
- Cianchi, F.; Palomba, A.; Messerini, L.; et al. Tumor angiogenesis in lymph node-negative rectal cancer: correlation with clinicopathological parameters and prognosis. Ann Surg Oncol 2002, 9, 20–26. [Google Scholar] [CrossRef] [PubMed]
- Ambrosini, M.; Rousseau, B.; Manca, P.; et al. Immune checkpoint inhibitors for POLE or POLD1 proofreading-deficient metastatic colorectal cancer. Ann Oncol 2024, 35, 643–655. [Google Scholar] [CrossRef] [PubMed]
- Junior, J.N.A.; Preto, D.D.’.; Lazarini, M.E.Z.N.; et al. PD-L1 expression and microsatellite instability (MSI) in cancer of unknown primary site. Int J Clin Oncol 2024, 29, 726–734. [CrossRef] [PubMed]
- Wang, Y.; Xie, B.; Wang, K.; et al. Multi-parametric MRI Habitat Radiomics Based on Interpretable Machine Learning for Preoperative Assessment of Microsatellite Instability in Rectal Cancer. Acad Radiol. Published online February 26, 2025. [CrossRef]
- Yao, X.; Deng, S.; Han, X.; et al. Deep Learning Algorithm--Based MRI Radiomics and Pathomics for Predicting Microsatellite Instability Status in Rectal Cancer: A Multicenter Study. Acad Radiol 2025, 32, 1934–1945. [Google Scholar] [CrossRef] [PubMed]
- Xing, X.; Li, D.; Peng, J.; Shu, Z.; Zhang, Y.; Song, Q. A combinatorial MRI sequence-based radiomics model for preoperative prediction of microsatellite instability status in rectal cancer. Sci Rep 2024, 14, 11760. [Google Scholar] [CrossRef] [PubMed]
- Zheng, C.Y.; Zhang, J.M.; Lin, Q.S.; et al. Noninvasive prediction of microsatellite instability in stage II/III rectal cancer using dynamic contrast-enhanced magnetic resonance imaging radiomics. World J Gastrointest Oncol 2025, 17, 108362. [Google Scholar] [CrossRef] [PubMed]
|
Disclaimer/Publisher’s Note: The statements, opinions and data contained in all publications are solely those of the individual author(s) and contributor(s) and not of MDPI and/or the editor(s). MDPI and/or the editor(s) disclaim responsibility for any injury to people or property resulting from any ideas, methods, instructions or products referred to in the content. |
© 2025 by the authors. Licensee MDPI, Basel, Switzerland. This article is an open access article distributed under the terms and conditions of the Creative Commons Attribution (CC BY) license (http://creativecommons.org/licenses/by/4.0/).