Preprint
Article

This version is not peer-reviewed.

Identification of Phenotypically Distinct Cancer Stem Cell Subpopulations in Oral Squamous Cell Carcinoma

A peer-reviewed article of this preprint also exists.

Submitted:

03 October 2025

Posted:

03 October 2025

You are already at the latest version

Abstract

Background: Several markers have been shown to define subpopulations enriched for cancer stem cells (CSCs) and correlate with poor clinical outcome in oral squamous cell carcinoma (OSCC). Objective: To investigate the pattern of expression and correlation with clinical parameters of two CSC markers, namely p75NTR and ALDH1A1, in both patient samples and cell lines. Methods: Archival formalin-fixed paraffin embedded samples from normal human oral mucosa (NHOM, n=31), oral dysplasia (OD, n=10) or OSCC (n=177) were subjected to multiple immunohistochemistry and some to qRT-PCR for expression of CSC and proliferation-related markers, BMI1 and Ki67. Correlations between CSC marker expression and clinical parameters were investigated. Primary cells and cell lines derived from NHOM, OD or OSCC were FACS- analyzed for the same markers. Results: A higher frequency of cells positive for CSC markers was detected in OD and OSCC compared to NHOM. Co-localization of the two markers was a rare finding in OSCC as compared to NHOM or OD and was more heterogeneous in OSCC cell lines than in OD and NHOM cells. Cells positive for p75NTR exhibited higher expression of proliferative and self-renewal markers in comparison to ALDH1A1+ or double ALDH1A1+/p75NTR+ cells. Cells positive for p75NTR were more frequent in small size tumors, poorly to moderately differentiated tumors, and correlated with poor survival of patients otherwise (clinically) deemed as of better prognosis. Higher frequency of ALDH1A1+ cells was found to be associated with lymph node metastasis. Both p75NTR+ cells and ALDH1A1+ cells could emerge de novo from the respective negative sub-population after FACS sorting and in vitro growth, but with different kinetics. Conclusion: Here we show that several stem cell sub-populations with distinct phenotypes co-exist in a tumor, each having impact on different clinical parameters. The cell subpopulations identified by use of different CSC markers were found to be dynamic populations, able to switch between phenotypes. In addition, our data suggest also that the stem cell heterogeneity is acquired and evolve parallel with carcinoma progression.

Keywords: 
;  ;  ;  ;  ;  ;  

1. Introduction

The cancer stem cell (CSC) model for tumorigenesis [1] offers an explanation for some of the phenotypic and functional heterogeneity of cancer cells, and may also elucidate some of the cancer associated phenomena such as metastasis, therapy resistance and tumor recurrence [2]. Unlike the classical clonal evolution theory [3], the CSC theory proposes that tumorigenic ability is an exclusive characteristic of a subpopulation of cancer cells with stem cell-like properties. These cells give rise to progeny that generate the heterogeneous bulk of the tumor cells through differentiation; and hence the hierarchical organization of a tumor [1]. Identification of distinctive markers for distinguishing CSCs in a particular tumor type is still regarded as one of the key challenges in the CSC field [4]. Nevertheless, various markers for enriching for CSCs have been reported by studies of the same tumor type [reviewed in [2,4,5] and references therein], and therefore it has been speculated that the combinatorial use of sets of these markers might yield a purer CSC subpopulation [5].
Oral squamous cell carcinoma (OSCC), the most common type of head and neck cancer, with over 377,000 new cases worldwide in 2020 [6], remains an under-studied solid tumor. The conventional treatment approach of surgical resection followed by targeting rapidly proliferating tumor cells by radio- or chemotherapy, results in only about half of the patients surviving beyond five years [7], which indicates the need for new treatment strategies. Immunotherapy for recurrent or metastatic cases has improved survival with a few months, but only in a subset of patients [8]. The search for markers defining CSC in OSCC has also recently gained increasing attention, with several candidate markers reported [9,10,11,12]. The low-affinity nerve growth factor receptor p75NTR is a putative marker of normal oral and esophageal keratinocyte stem cells [13,14] and has also been suggested as a marker of CSCs in malignant melanoma and esophageal carcinoma [15], [16], as well as a determinant of poor prognosis in OSCC [17,18]. Recent investigations done by our group showed that the p75NTR+ OSCC subpopulation harbors cells with stem cell-like properties [19]. Aldehyde Dehydrogenase 1 (ALDH1) is an intracellular detoxifying enzyme with a well-established role in embryogenesis [20]. High activity of ALDH1 has been suggested to be a characteristic of both normal and cancer stem cells in the human colon [21] and breast [22]. ALDH1 activity has also been reported as a CSC marker in many other human cancers [23]. In OSCC, the isoform ALDH1A1 has been suggested as a CSC marker [9], and research has shown an overlap between ALDH1High subpopulations and cells staining for CD44 [10], another marker generally accepted to identify and isolate a subpopulation of cells that is enriched for CSCs in OSCC [11,12].
In the present study, we employed triple immunohistostaining technique [24] to investigate the overlap of p75NTR and ALDH1A1 positive cell subpopulations in OSCC as compared to normal human oral mucosa (NHOM) and oral dysplasia (OD). Self-renewal and proliferation abilities of the CSC-like subpopulations were also investigated in tissue samples by staining for BMI1[25] and Ki-67 [26] respectively. The possible association between the frequency of positive cells, clinical parameters and the overall survival of OSCC patients was investigated as well. Our results show marked heterogeneity in the expression, distribution and overlap of p75NTR and ALDH1A1 among OSCC patients. The intra- and inter-tumoral phenotypic diversity of CSC-like subpopulations demonstrated here raises novel challenges in terms of their use as predictive biomarkers and as efficient therapeutic targets for oral squamous cell carcinoma.

2. Materials and Methods

Patient Material

Archived formalin fixed paraffin embedded (FFPE) tissues of patients with oral dysplasia (OD, n=10) and OSCC (n=177) were collected from Haukeland University Hospital and University Hospital of North Norway (UNN). Normal human oral mucosa tissues (NHOM, n=31) were donated by patients having wisdom tooth extraction at Department of Oral Surgery, Haukeland University Hospital, Bergen, Norway after informed consent. The samples from UNN were constructed in a tissue microarray (TMA) using Micro Tissue Arrayer (Beecher Instruments Inc., Wisconsin, USA). The tumor tissue was identified by comparing HE-sections with the associated paraffin blocks. Two duplicate cores of 0.6 mm were taken from the representative tumor tissue and inserted into a recipient paraffin microarray block. The specimens were distributed on three different recipient microarray blocks. Paired material from lymph nodes positive for metastasis from 19 patients was also included.
All patients included in the study were newly diagnosed with SCC of the oral cavity, and had no history of chemo- or radiotherapy prior to surgery. Tumors included in the study were from tongue, buccal mucosa, lip, gingiva, floor of mouth and alveolar rim. Tumors involving more than one of these sites were recorded as overlapping oral lesions. Sample collection was approved by the Research Ethics Council of North and West Norway (REK 2010/148). Material from 266 patients was initially selected but 89 patients were later excluded from the study because they did not satisfy the above-mentioned inclusion criteria, or because of insufficient material or unavailable clinical data. The study followed the REMARK guidelines [27].

Triple Immunohistochemistry (IHC)

The following mouse monoclonal antibodies were used for IHC: anti-p75NTR (Merk Millipore, Clone ME20.4, 1: 2500), targeting the low-affinity nerve growth factor receptor located in the cell membrane, anti- ALDH1A1 (BD Biosciences, Clone 44/ALDH, 1:250), targeting the enzyme aldehydedehydrogenase-1 isoform A1, anti-BMI1 (Merk Millipore, Clone F6, 1:1500), targeting the transcription factor polycomb complex protein BMI1, generally accepted as a marker of self-renewal, and anti-Ki67 (Dako, Clone MIB-1,1:1500), targeting the proliferation marker mindbomb E3 ubiquitin protein ligase-1. Multiple immune-histochemical reactions combining three of the above antibodies were performed consecutively, in each of the sections, as described elsewhere [24].

Evaluation of the Staining

Sections were evaluated using a light microscope equipped with X63 objective (Leica microsystems) and Zeiss digital camera operated by Zen 2011 software (Carl Zeiss AG).
For tumors in the tissue microarray, 2-4 cores were evaluated for each patient. The minimum number of cells accepted for a core was set at 300 cells. For the whole biopsy samples, four consecutive fields from the center of the tumor were evaluated, and when available, two fields from the para-tumor cancer-free surface epithelium (n=62) and 2-4 fields from the invading front (n=24). Nerve tissues and lymphocytes in the whole biopsy samples were used as internal positive controls for p75NTR and ALDH1A1/BMI1 respectively. Individual marker scoring was performed semi quantitatively and scored into 4 levels as shown in Supplementary Table S1. Co-localization of all or pairs of the three markers was performed as shown in supplementary table S1, except for p75NTR+ALDH1A1+ which was scored as positive or negative. Inter-observer variation was controlled by calibrating the evaluation by three investigators (TAO, DEC and ACJ). Afterwards, all samples were evaluated by one investigator (TAO). The percentage of proliferating cells within p75NTR+, ALDH1A1+ and p75NTR+ALDH1A1+ subpopulations were obtained by counting Ki-67 positive and negative nuclei. No apparent difference in immune-staining was observed between the TMAs and the whole OSCC biopsy samples.

Laser Microdissection of FFPE OSCCs

Sections of FFPE were cut at 15µm thickness, placed on membrane coated glass slides (MembraneSlide NF 1.0 PEN, Zeiss) activated with UV light. Slides were incubated at 56 °C for 2 hours, de-paraffinized in xylene, rehydrated in graded ethanol, stained with methylene green (S1962, Dako), and dehydrated in reverse graded ethanol and xylene. Tissue specimens 50-100 µm2 size were laser microdissected from the tumor center and the corresponding invading front of each OSCC specimen using a Zeiss Axiovert 200 inverted microscope equipped with a microlaser system (P.A.L.M Microlaser Technologies). Microdissected tissues were collected in nuclease free tubes (AdhesiveCap 500 clear, Zeiss).

Data Collection and Entry

Information collected for OSCC patients included age, gender, date of diagnosis, date of death or date of last follow up, site of tumor, lymph node involvement, tumor size, TNM stage, recurrence of tumor, tumor differentiation. No information regarding the medical history, or socio-demographics was available for most of the NHOM donors.
For analysis, additional variables were generated from the information collected. Survival time was calculated as months from the interval between date of diagnosis and date of death or date of last appointment. Patients who were still alive at the time of investigation were recorded as “alive”, while patients who died for reasons other than cancer were censored, and only patients who died because of cancer were marked as “dead”. Another categorical variable was generated from survival time by grouping patients into those who survived five years or less, those who survived five to ten years, and those who survived more than 10 years. Age was recoded in decades, lymph node metastasis and tumor recurrence as binary data (‘yes’ or ‘no’), while tumor size, TNM stage and tumor differentiation were dichotomized (Supplementary Table S2).
Individual IHC scores for each of the markers were dichotomized as ‘high’ or ‘low’, with the cut off determined according to the maximum score recorded for the respective marker in NHOM samples (Figure 1D-E, Figure 2B). Co-localization scores were dichotomized as ‘yes’ or ‘no’.

Cell Lines and Culture

A panel of cell lines was used in this study. The OSCC- derived cell lines: CaLH3 [28], 5PT, Neo (known as PE-CA/PJ15) [29], LuC4 [28], and the OD-derived cell lines: DOK, Poe9n [30] and D20 [31]. Normal oral keratinocytes (NOK) were isolated from NHOM donated by three patients undergoing wisdom tooth extraction at Haukeland University Hospital after informed consent (REK2010/148). All OSCC- derived cell lines and also D20 and DOK, were grown in DMEM medium supplemented with 25% nutrient mixture F-12 Ham, 50 µg/ml L ascorbic acid, 0.4 µg/ml hydrocortisone, 10 ng/ml epithelial growth factor (all from Sigma-Aldrich), 10% fetal bovine serum (FBS) and 5 µg/ml insulin (both from Life Technologies), also known as FAD medium [32], while NOK and Poe9n were grown in keratinocyte serum free medium (KSFM), supplemented with 10 ng/ml epithelial growth factor and 25 µg/ml bovine pituitary extract (all from Life Technologies). All cells were grown under standard culture conditions.

Fluorescence-Activated Cell Sorting (FACS)

Cells were detached using 1X trypsin-EDTA (Sigma), re-suspended in PBS and incubated with mouse monoclonal anti-p75NTR antibody (Sigma, 1:250) for 5 minutes. Negative control mouse IgG1 (Dako) was used as isotype control. Alexa Fluor® 488 F(ab1)2 fragment of goat anti-mouse H+L (Invitrogen) was used as the secondary antibody. For the ALDEFLUORTM assay (STEMCELL), cells were incubated with the ALDEFLUORTM activated reagent with or without DEAB according to the manufacturer’s instructions prior to FACS. For both of the markers, the highest and lowest 4-5% cells were sorted, propagated under standard culture conditions and analyzed one week later.
To analyze cell lines simultaneously for the two markers, and also CD44, cells were stained for p75NTR first, using Alexa Fluor® 647 donkey anti-mouse IgG (H+L) (Invitrogen) as secondary antibody. After washing and re-suspension, the cells were incubated for 5 min with PE-mouse antihuman CD44 (BD biosciences 1:1000), followed by the ALDEFLUORTM protocol.
All FACS procedures used a BD FACSAria TM IIu (BD biosciences), using 525/50 BP filter for ALDEFLUORTM assay and Alexa Fluor 488, 660/20 for Alexa Fluor 647 and 575/26 for PE. Sorted cells were collected in FAD medium. Analysis of the results used Flowjo (version 10, Treestar) or BD FACSDIVA TM (BD Biosciences) (Supplementary Figure S1).

RNA Extraction, cDNA Synthesis and Quantitative RT-PCR (qRT-PCR)

Total RNA was extracted from p75NTRHigh/Low and ALDH1High/Low CaLH3 cells using RNeasy fibrous tissue mini kit protocol (Qiagen). RNeasy FFPE Kit (Qiagen) was used to extract RNA from laser microdissected tissues. Following the manufacturers’ instructions, 300 ng of total RNA was converted to cDNA using High-Capacity cDNA Archive Kit system (Applied Biosystems). All qRT-PCR amplifications were performed on ABI Prism Sequence Detector 7900 HT (Applied Biosystems) as described previously [33]. qRT-PCR was used to examine the expression levels of the following genes (TaqMan assays): PDPN (Hs00366766_m1), NGFR (Hs00609947_m1 for RNA extracted from cells, and Hs00609978_m1 for laser microdissected samples), BMI1 (Hs00180411_m1), CD44 (Hs01075861_m1), POU5F1(Hs 00999632_g1) and VIM (HS00185584_m1) . GAPDH (Hs99999905_m1) was used as endogenous control. Comparative 2-ΔΔ Ct method was used to quantify the relative mRNA expression.

Statistical Analysis

Analysis of the qRT-PCR data was performed in GraphPad Prism 6 (GraphPad, CA, USA) using the Student t-test, while all other statistical procedures were conducted in Statistical Package for Social Sciences (SPSS), version 19 (IBM, NY, USA). Association between pairs of categorical variables was investigated by Chi-Sqaure test or Fisher`s Exact test. For comparison of immunohistochemistry scores for the tumor center and for the tumor invading front or the lymph node metastatic tumors, the McNemar test was used. Differences in percentages of Ki-67+ cells between different subpopulations in the same sample were investigated using repeated measure ANOVA for normally distributed variables, while Friedman`s test was used for non-normally distributed variables. Further investigation between the same percentages within pairs of cell subpopulations was performed using Wilcoxon Rank test. Comparison between the mean percentages of cells positive for different combinations of markers as obtained by multiple FACS analysis were compared between the three types of samples using Kruscal-Wallis test.
Survival analysis was investigated using Kaplan-Meier`s analysis. To control for possible confounding factors for patient survival, the analysis was repeated after splitting the data according to those factors. Moreover, Cox proportional hazards model was applied, and the impact of stem cell markers was evaluated by comparing the HR of the unadjusted analysis, to those adjusted for clinical or histological variables. All survival analysis procedures were performed in two different ways: analysis 1 included all study participants, while analysis 2 was performed on only patients who survived 10 years or less. In all statistical tests, level of significance was set to 0.05.

3. Results

Clinical and Pathological Characteristics of the Study Cohort

The age of the patients included in this investigation (n= 177) ranged from 27 to 93 years (mean ± SD 65.31 ± 12.92 years). The patients were predominantly males (61.5%), older than 60 years old (62.1%), diagnosed with late-stage tumors (56.3%) mainly occurring in the tongue (52.0%). Survival time of the patients ranged from one to 295 months (64.08 ± 62.42) from the date of diagnosis. Higher survival probabilities were observed for patients aged ≤ 60 years (p= 0.001), diagnosed with stage 1 & 2 (p= 0.000) or with highly differentiated tumors (p= 0.012), as compared to those older than 60 years old, with late stage or poor to moderately differentiated tumors, respectively, using Kaplan-Meier analysis (Supplementary Figure S2). Further details about the clinical information of the study participants are presented in Supplementary Table S2.

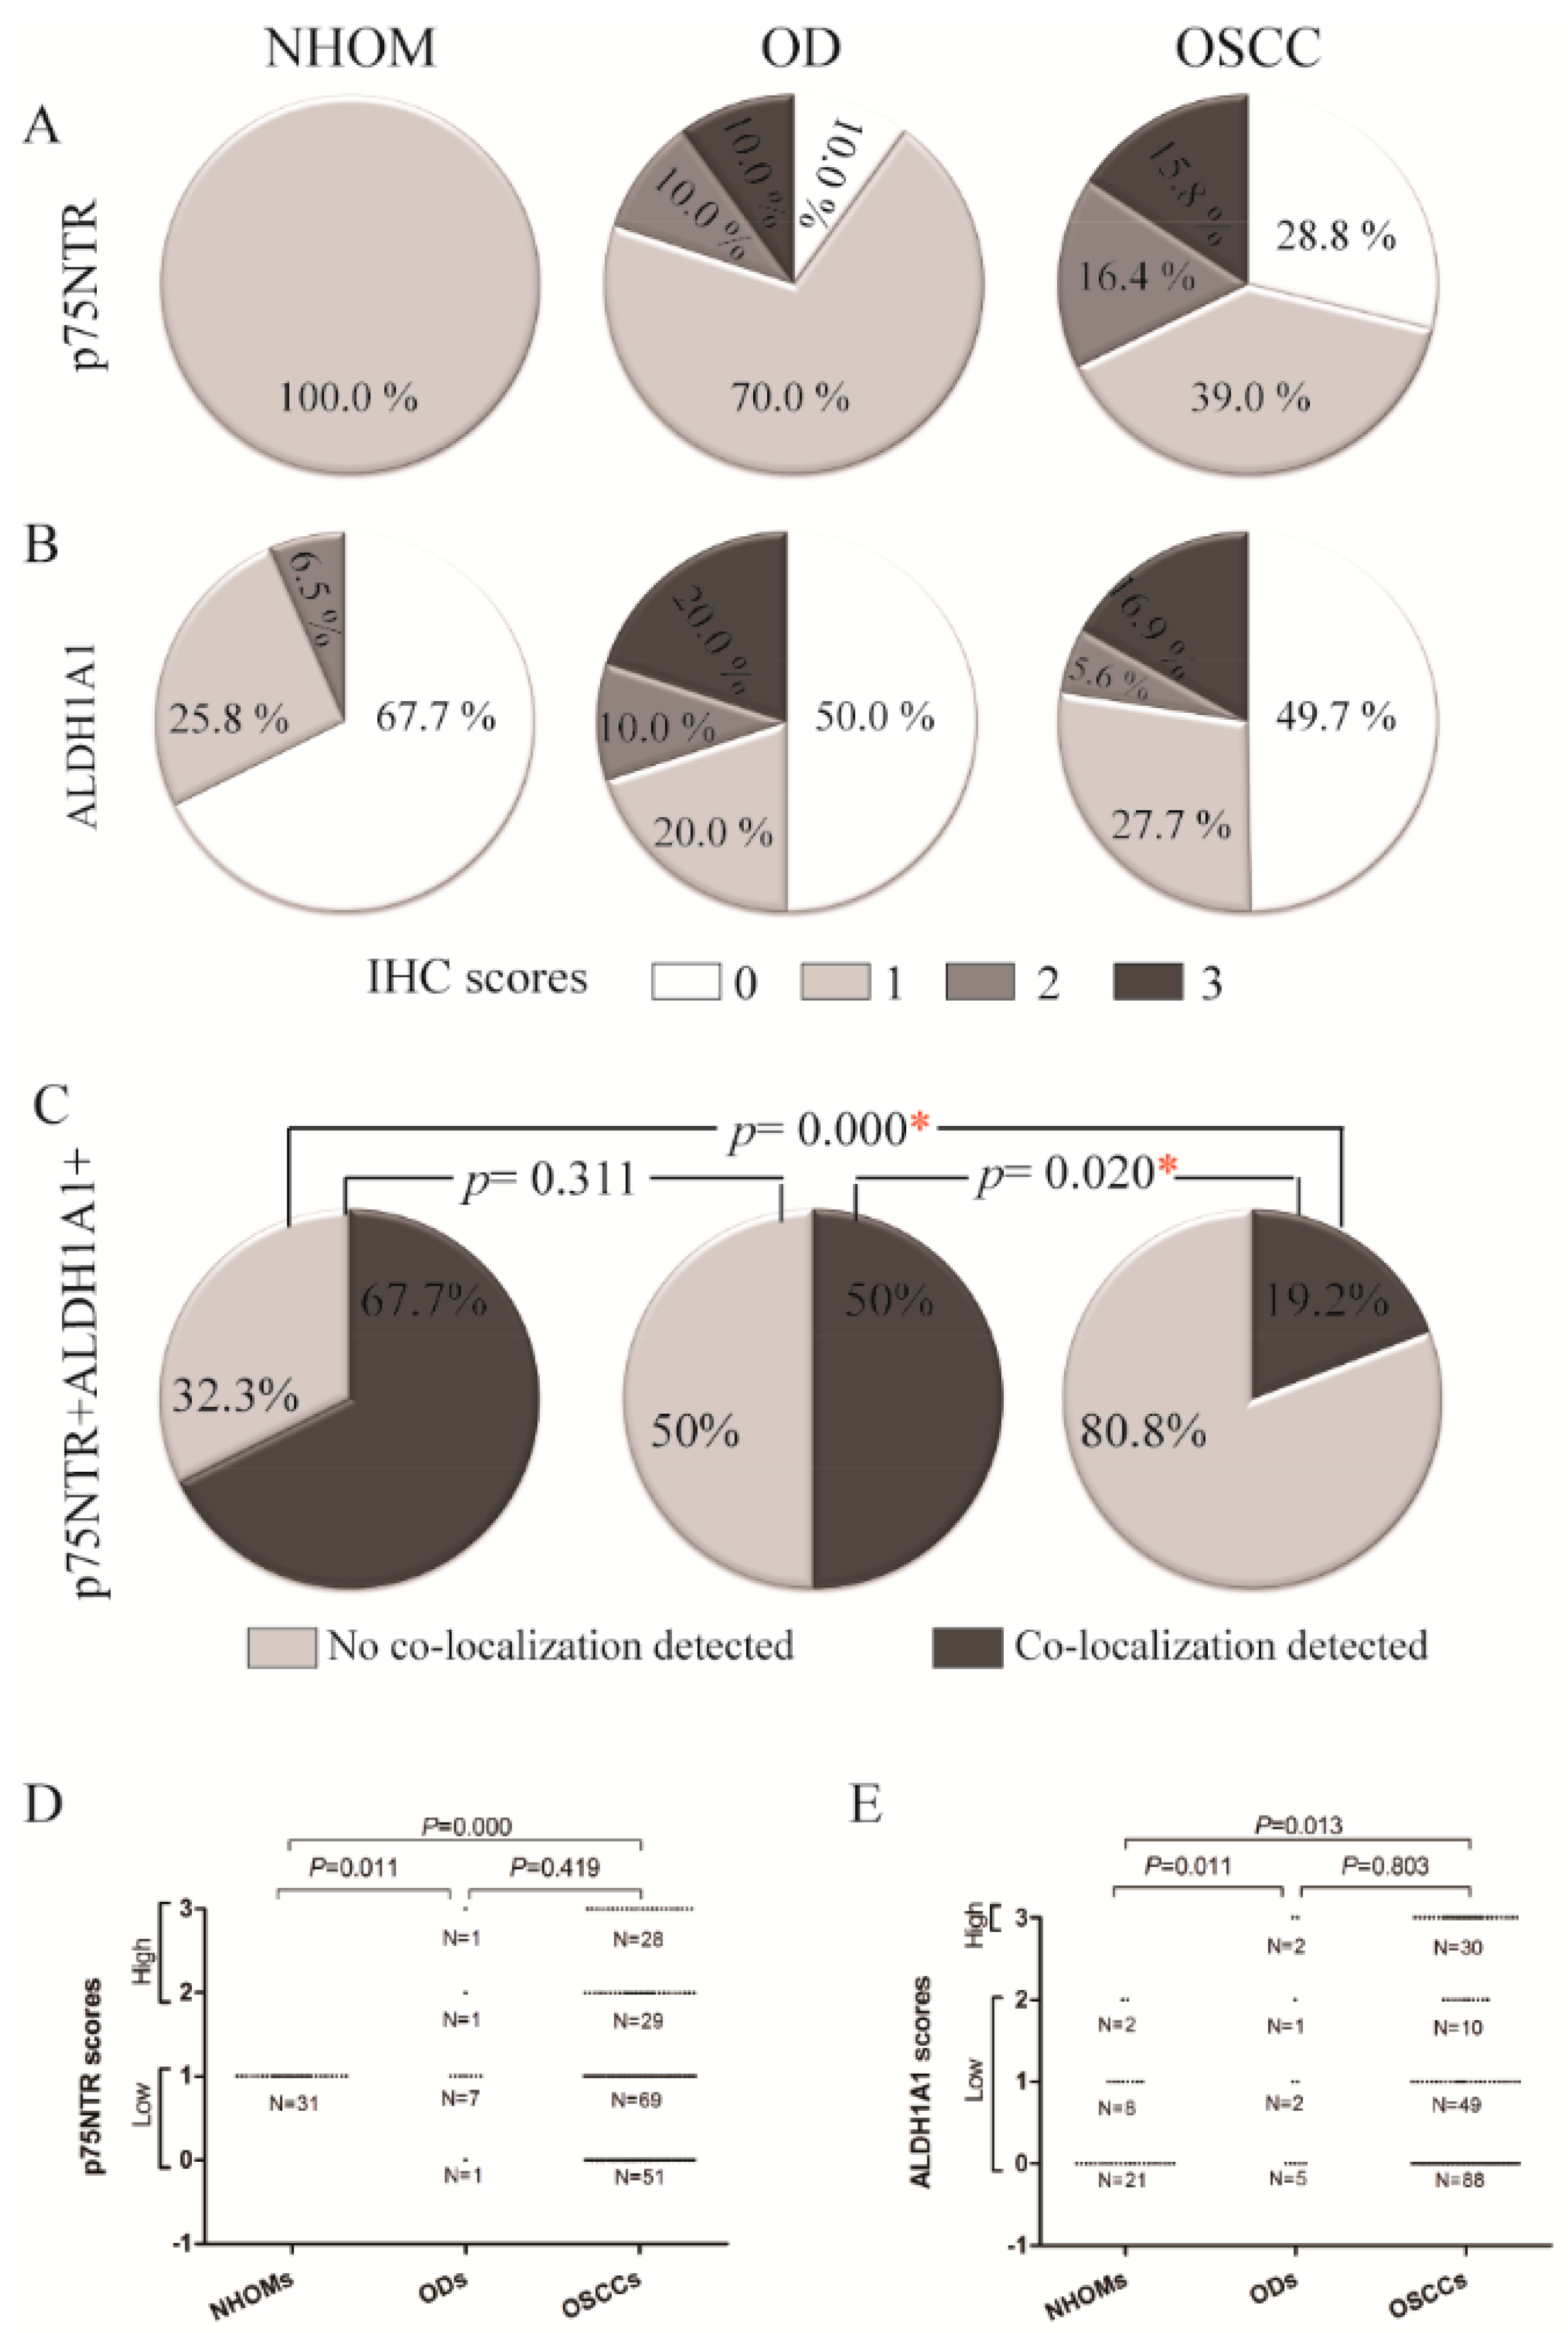
Increased Frequency of p75NTR+ and ALDH1A1+ Cells in OD and OSCC Compared to NHOM

In all NHOM samples p75NTR was visualized by IHC as a membranous staining of groups of epithelial cells (less than 10% of the total cell number) confined to the basal layer (Figure 1A, Figure 2A,B, Supplementary Figure S3A). Same pattern was observed in 70% of the OD samples, with the rest displaying an increase in the frequency of cells expressing p75NTR (Figure 1A, Figure 2E, Supplementary Figure S3A). The heterogeneity of P75NTR staining pattern further escalated in OSCC (Figure 1A), with only 9% showing a preserved NHOM pattern, while 15.8% of OSCCs contained more than 50% p75NTR+ cells (Figure 2O,P), and interestingly, 28.8% of OSCC showed loss of P75NTR staining (scoring less than 1% or being completely negative for p75NTR+ in the epithelial compartment). It is noteworthy that in the latter case, positive staining of nerves ruled out technical issues in detecting p75NTR (Figure 2S,T). Distribution of p75NTR+ cells was predominantly in less differentiated tumor or the peripheral basaloid cell layer of the more differentiated tumor islands (Figure 2I-N). Importantly, detection of p75NTR+ cells in the more differentiated central parts occured only in samples with high frequency of p75NTR+ cells (Figure 2O,P).
ALDH1A1 was detected as a cytoplasmic IHC reaction with occasional nuclear involvement, in sporadic cells of the basal and spinous cell layers of NHOM (Figure 2A,B), with the exception of two samples where ALDH1A1+ cells were detected as a vertical patch of stratified keratinocytes (Figure 2C,D). Expression of ALDH1A1 was generally low in NHOM samples, with 67.7% of samples displaying less than 5% ALDH1A1+ cells (Figure 1B, Supplementary Figure S3B), and among these 8 samples (25.8 %) showed no ALDH1A1+ epithelial cells at all. Higher (5-25%) expression levels of ALDH1A1 were found to be infrequent in NHOM (Figure 1B, Figure 2C,D). The OD samples showed a wider range of scores for the frequency of ALDH1A1+ cells, with two samples expressing it by more than 50% of the cells (Figure 1B, Supplementary Figure S3B). In OSCC, the frequency of ALDH1A1+ cells was found to be even more heterogeneous than in OD (Figure 1B, Supplementary Figure S3B), with tumor islands showing more than 50% ALDH1A1+ cells being detected next to islands scoring 0% (Figure 2K-R).
A statistically significant difference in the frequency of each of the two markers was detected when the dichotomized IHC scores of OD and OSCC were compared to NHOM samples (Figure 1D,E). Co-localization of p75NTR and ALDH1A1 was found to be more frequent in NHOM (67.7%) and OD (50%) than in OSCC (19.2%) (p < 0.001, Chi-Square) (Figure 1C). This co-localization was detected mainly in samples with high scores of the two markers, but also in those that had very low scores (<1% positive cells for p75NTR and <5% positive cells for ALDH1A1) for one or both of the markers (Supplementary Figure S3). The presence of double stained cells did not correlate to any of the clinical parameters investigated.

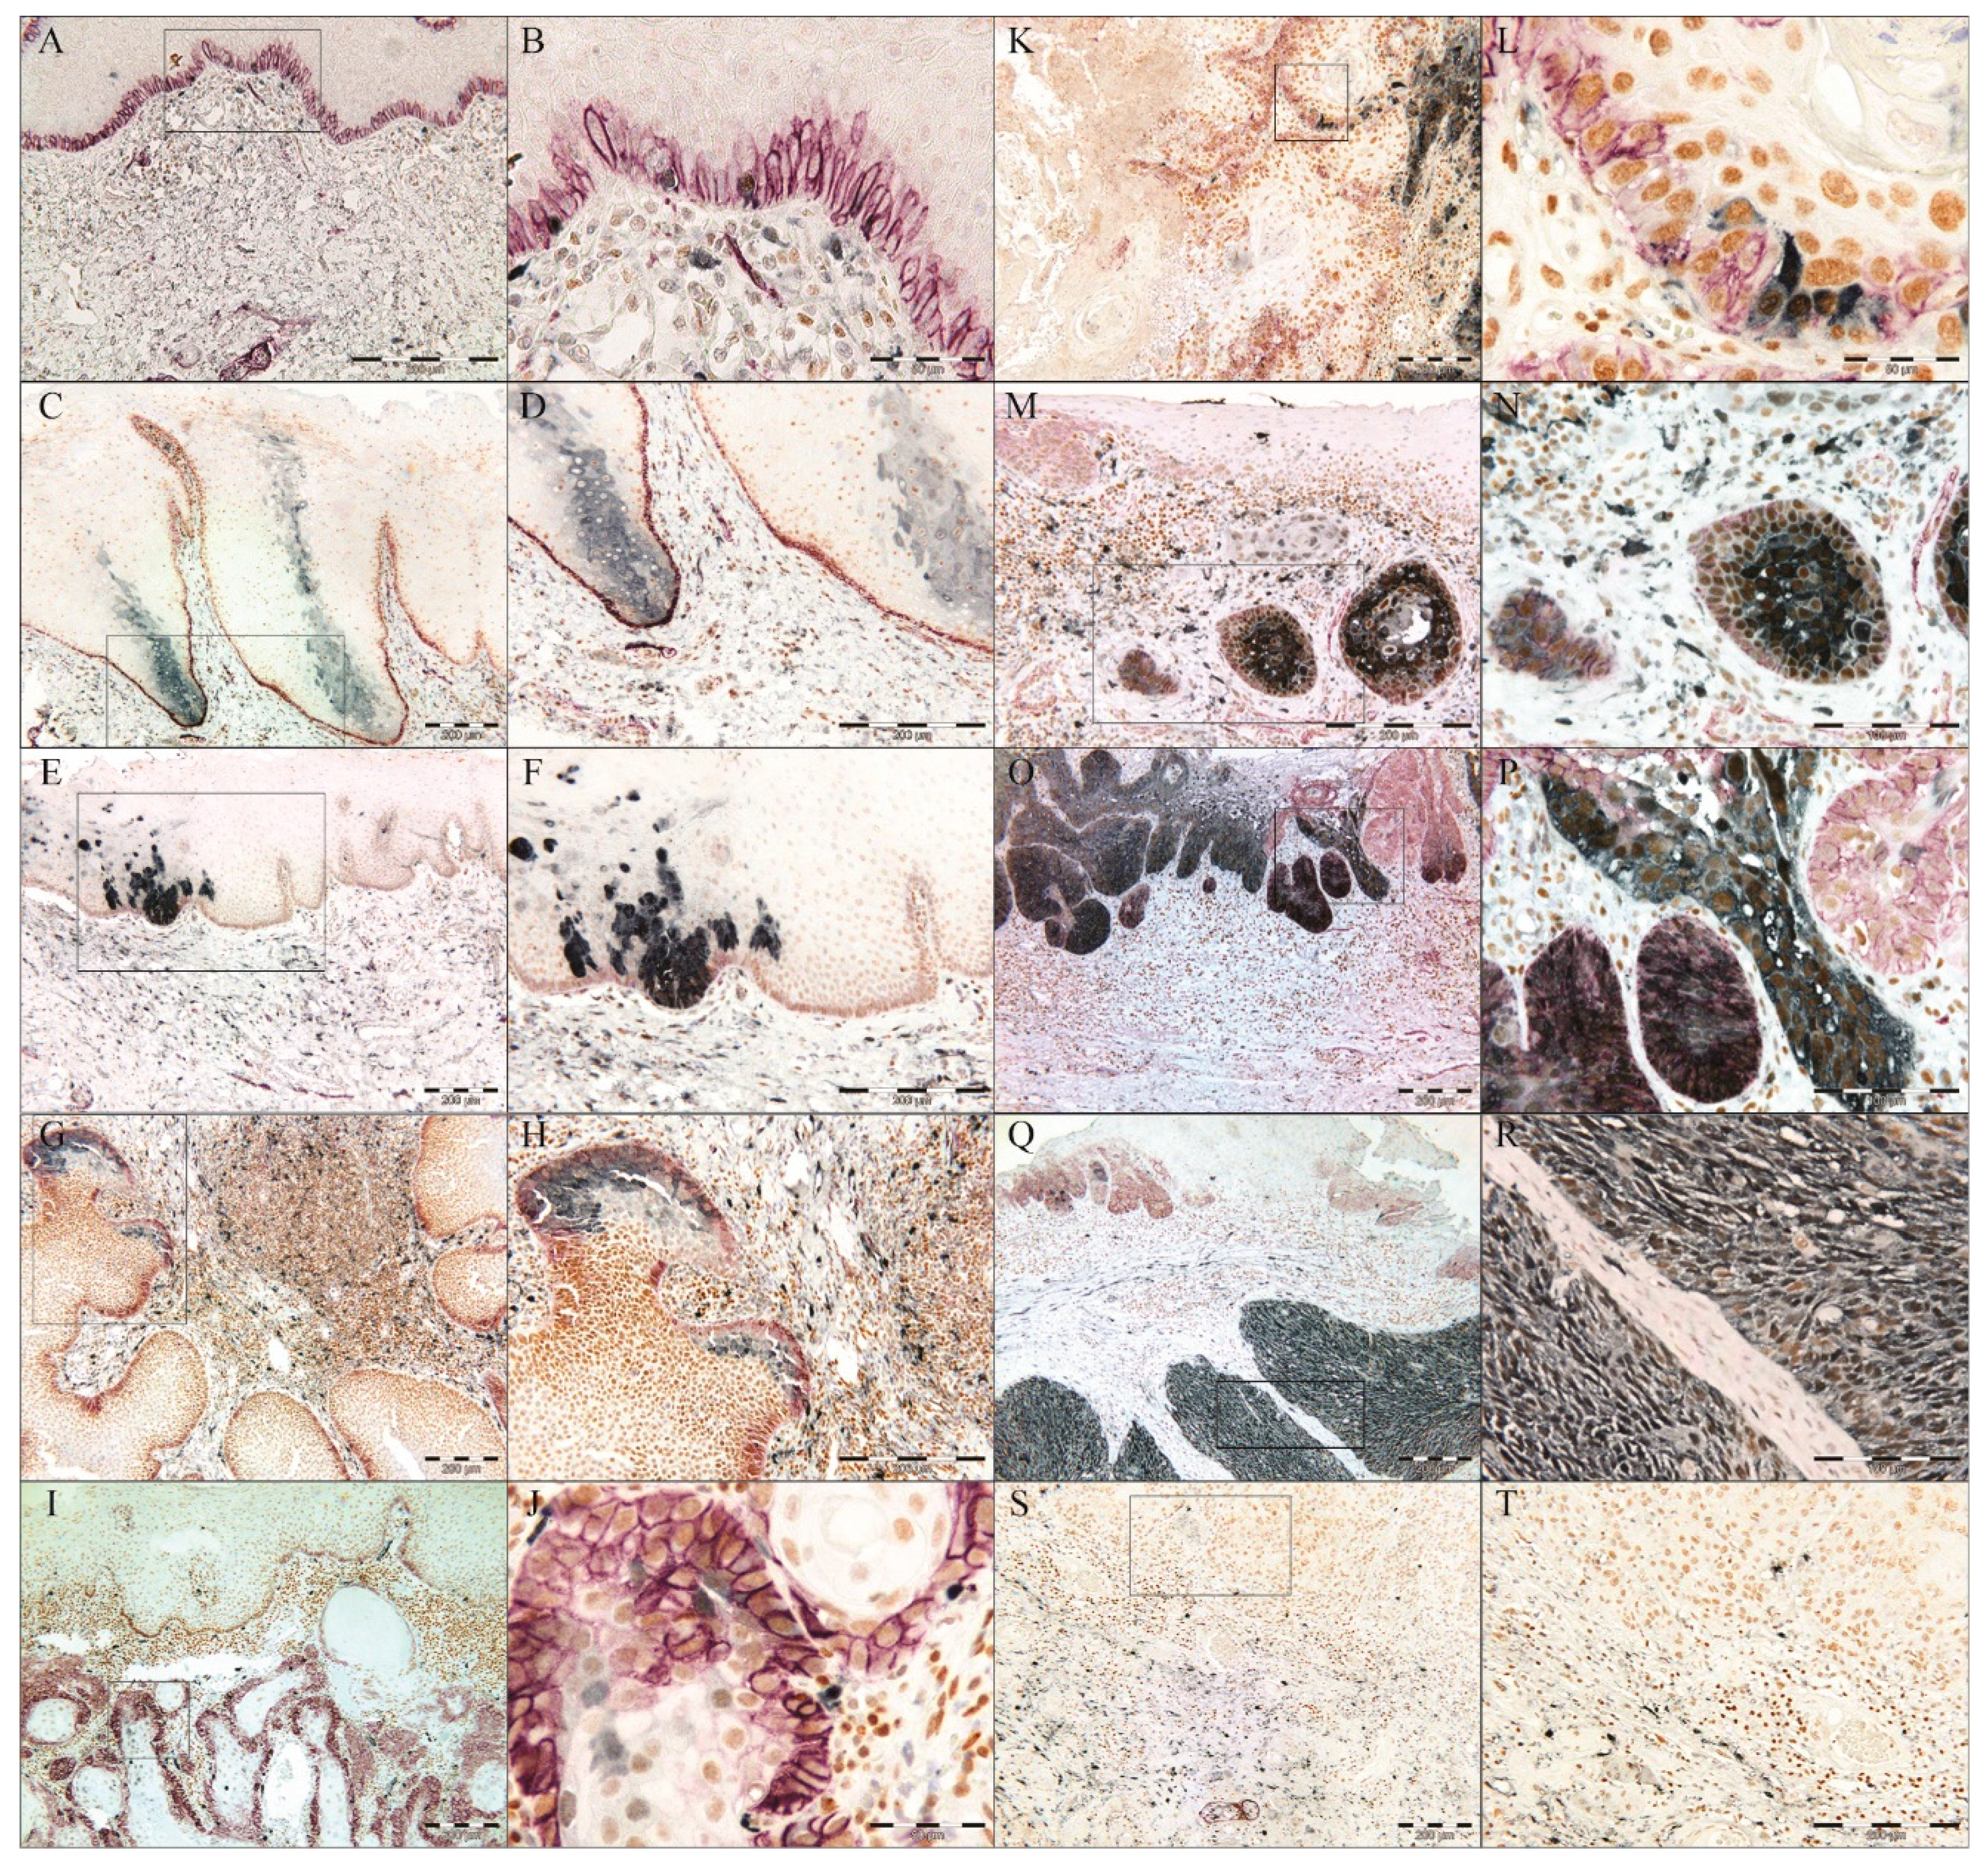
Identification of a Pattern Resembling a Clone-Like Distribution of ALDH1+ Cells

In the two NHOM samples (6.5 %) that had higher frequency of ALDH1A1 cells ( 25-50%), the ALDH1A1 was detected as a clone-like pattern extending from the basal layer and involving 3-4 layers of the spinous cell layer (Figure 2C,D). This distribution pattern of ALDH1A1 expressing cells was also detected in 30% of OD cases (Figure 2E,F), and in the para-tumor epithelium of 56.6% of the OSCC samples that included such areas (n= 62) (data not shown). This distribution pattern was found not to be associated with any of the clinical parameters included in the analysis but indicates that some of the more differentiated epithelial cells can express ALDH1A1.

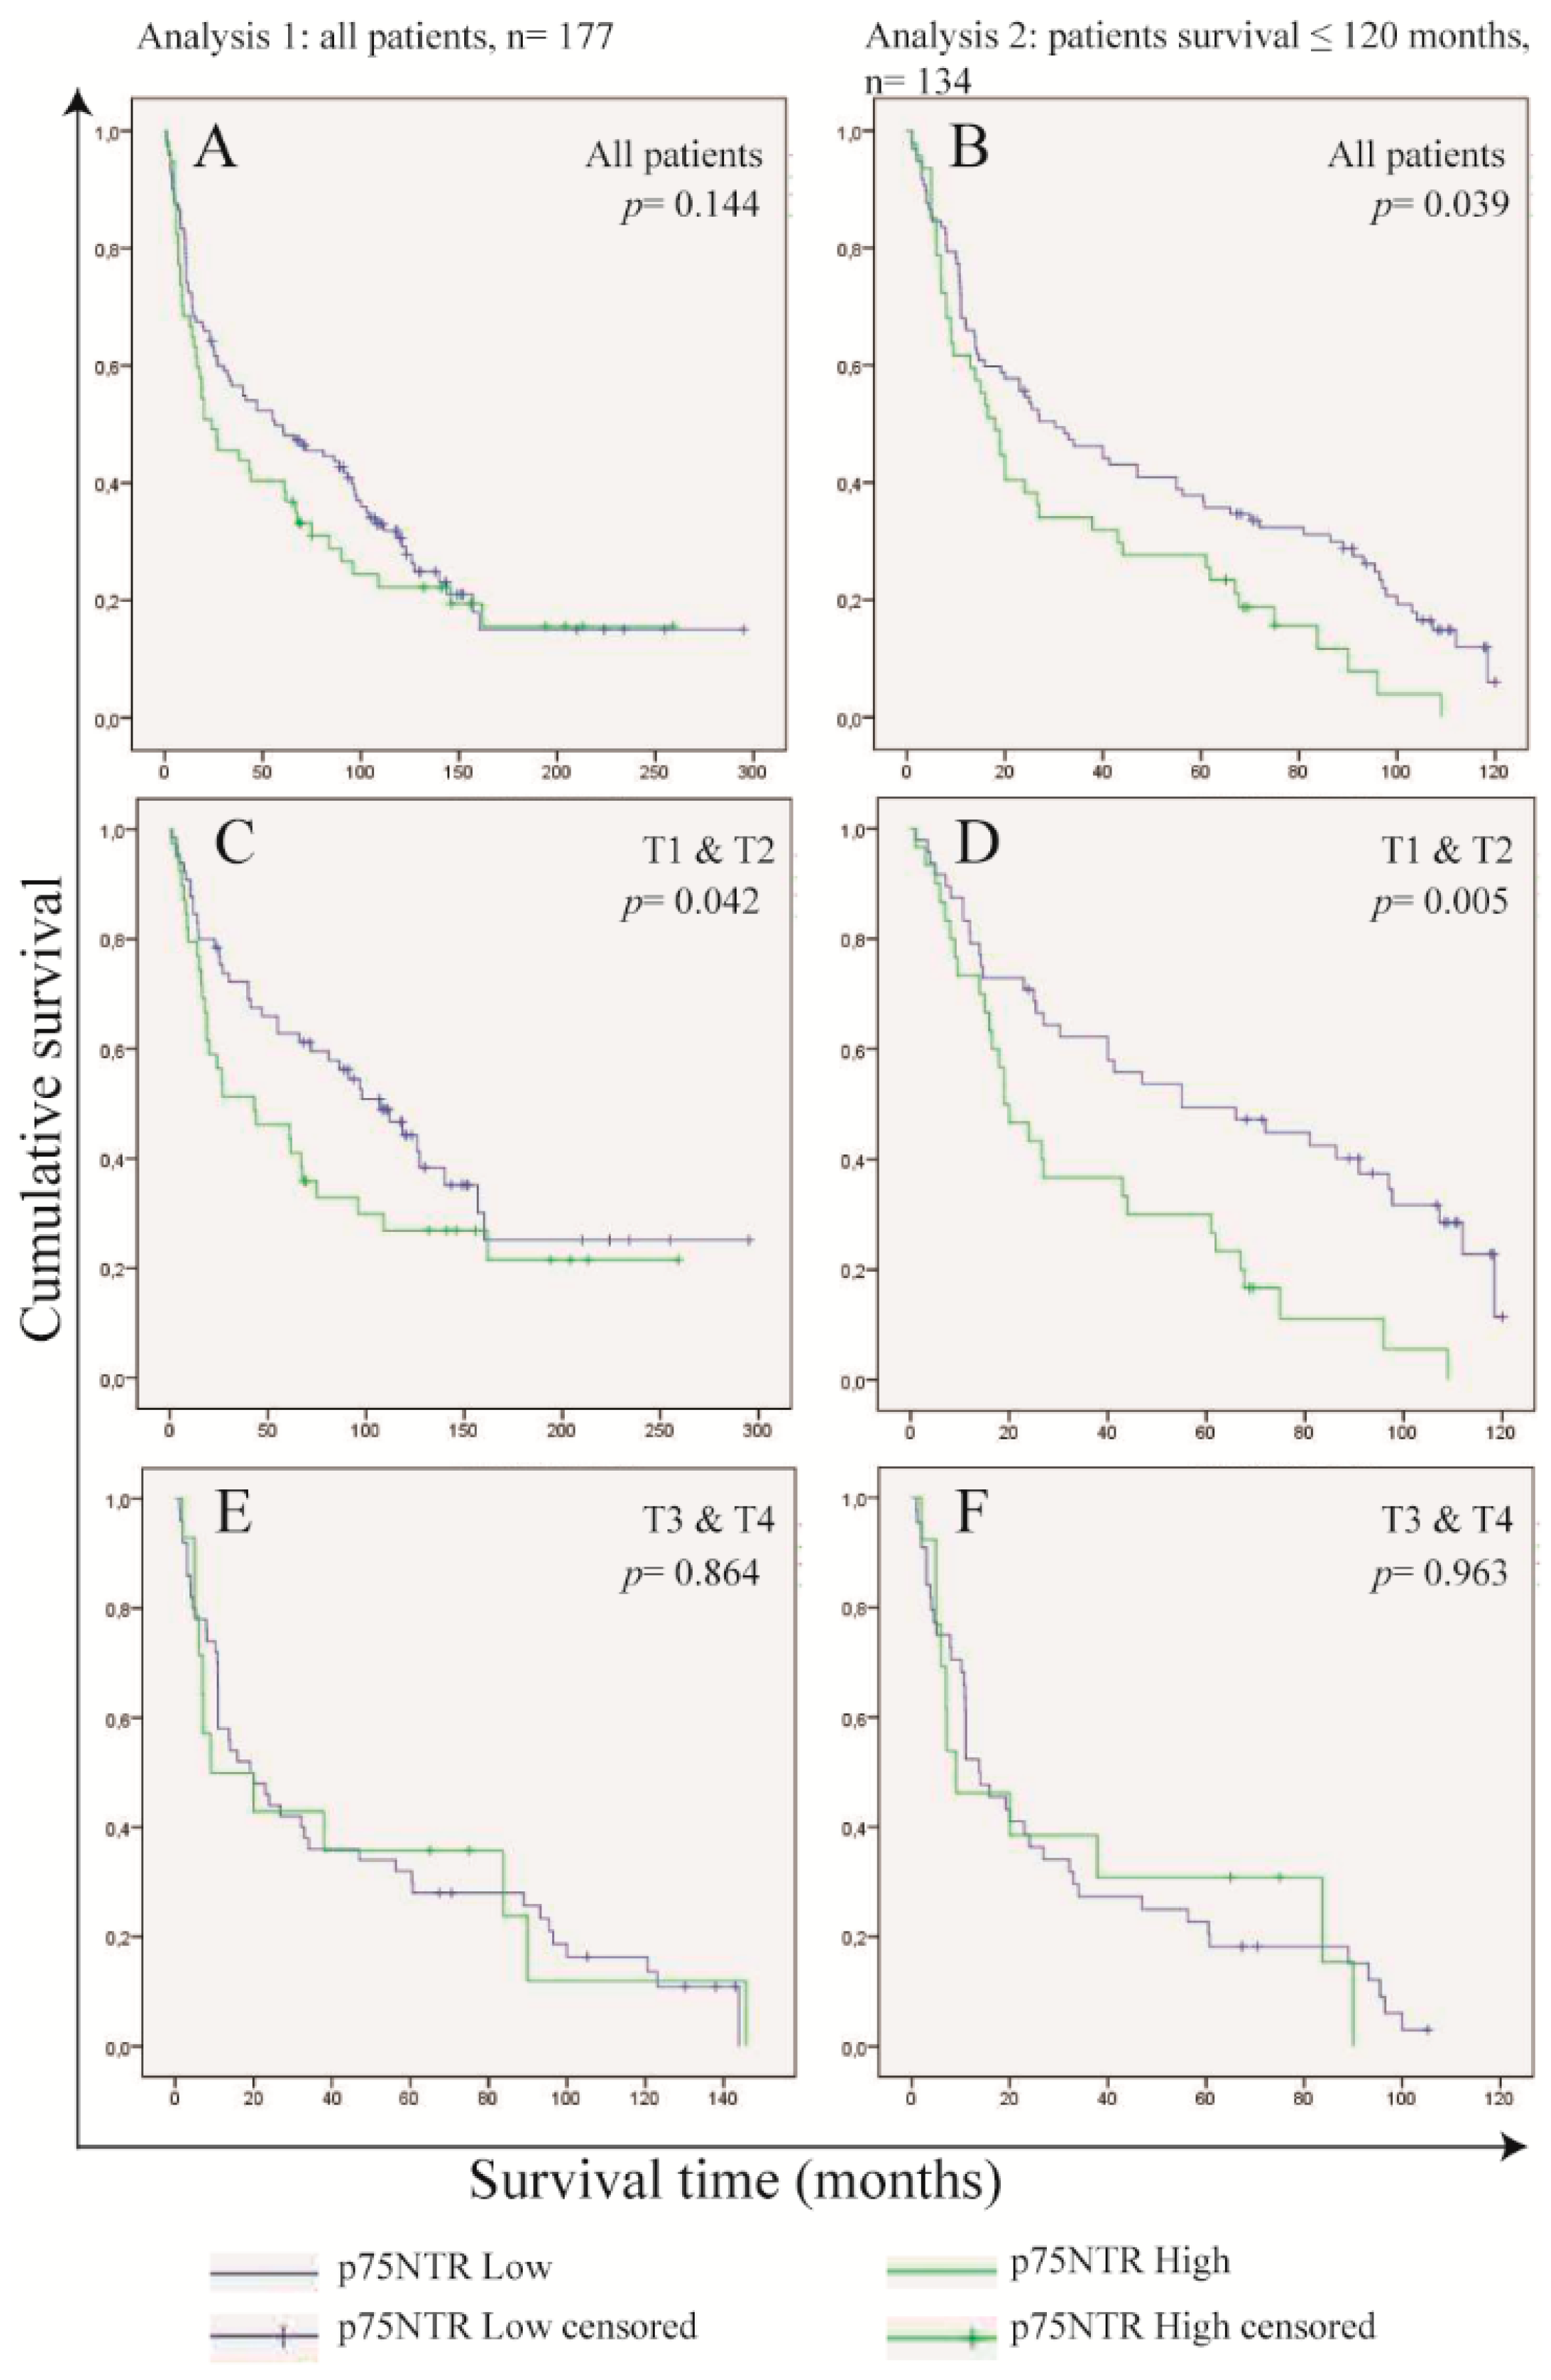
Frequency of p75NTR+ Cells in OSCC Cells Predicts Survival in Patients with Small Tumor Size (T1 and T2)

High frequency of p75NTR+ cells inversely correlated to tumor differentiation and tumor size (p = 0.034 for both, Chi-square). No association was found between p75NTR frequency and tumor recurrence, lymph node metastasis or TNM stage. High frequency of ALDH1A1+ cells was found to be associated with lymph node metastasis (p = 0.035, Chi-Square test) (Supplementary Figure S4).
Kaplan-Meier`s analysis indicated a lower survival probability of patients whose tumors were found to express high levels of p75NTR, but without statistical significance (0.144, Tarone-Ware), and the survival probabilities were similar after 120 months from the date of diagnosis (Figure 3A). Comparing the characteristics of patients whom survived beyond 120 months (n= 33), we found that most of these patients were diagnosed at ≤ 60 years (69.7%), with T1 & T2 tumors (61.9%), had no lymph node metastasis (72.7%) at the time of diagnosis and had no tumor recurrence afterwards (81.8%) (Supplementary Table S2, Supplementary Figure S2). Excluding these patients from the analysis revealed a statistically significant difference (0.039, Tarone-Ware) in the survival probabilities between patients with p75NTRHigh tumors and those with p75NTRLow tumors (Figure 3B).
Knowing that high expression of p75NTR was associated with small size tumors, we performed Kaplan-Meier`s analysis by stratifying for tumor size and we found p75NTR of predictive value only in patients diagnosed at T1 & T2 (0.042, Tarone-Ware) (Figure 3C-F). Therefore, we investigated the role of tumor size as a confounding factor by Cox regression hazard models (Supplementary Table S3). The models showed a marked reduction in the hazard ratio of p75NTR when adjusted for tumor size. This was observed when the models were applied to the whole study group (analysis 1), as well as when applied to patients whom have survived 120 month or less (analysis 2). However, statistical significance of the interaction term between p75NTR expression and tumor size was only observed in analysis 2.
These data show that the effect of p75NTR in patient survival is of importance in patients with tumors of small size.

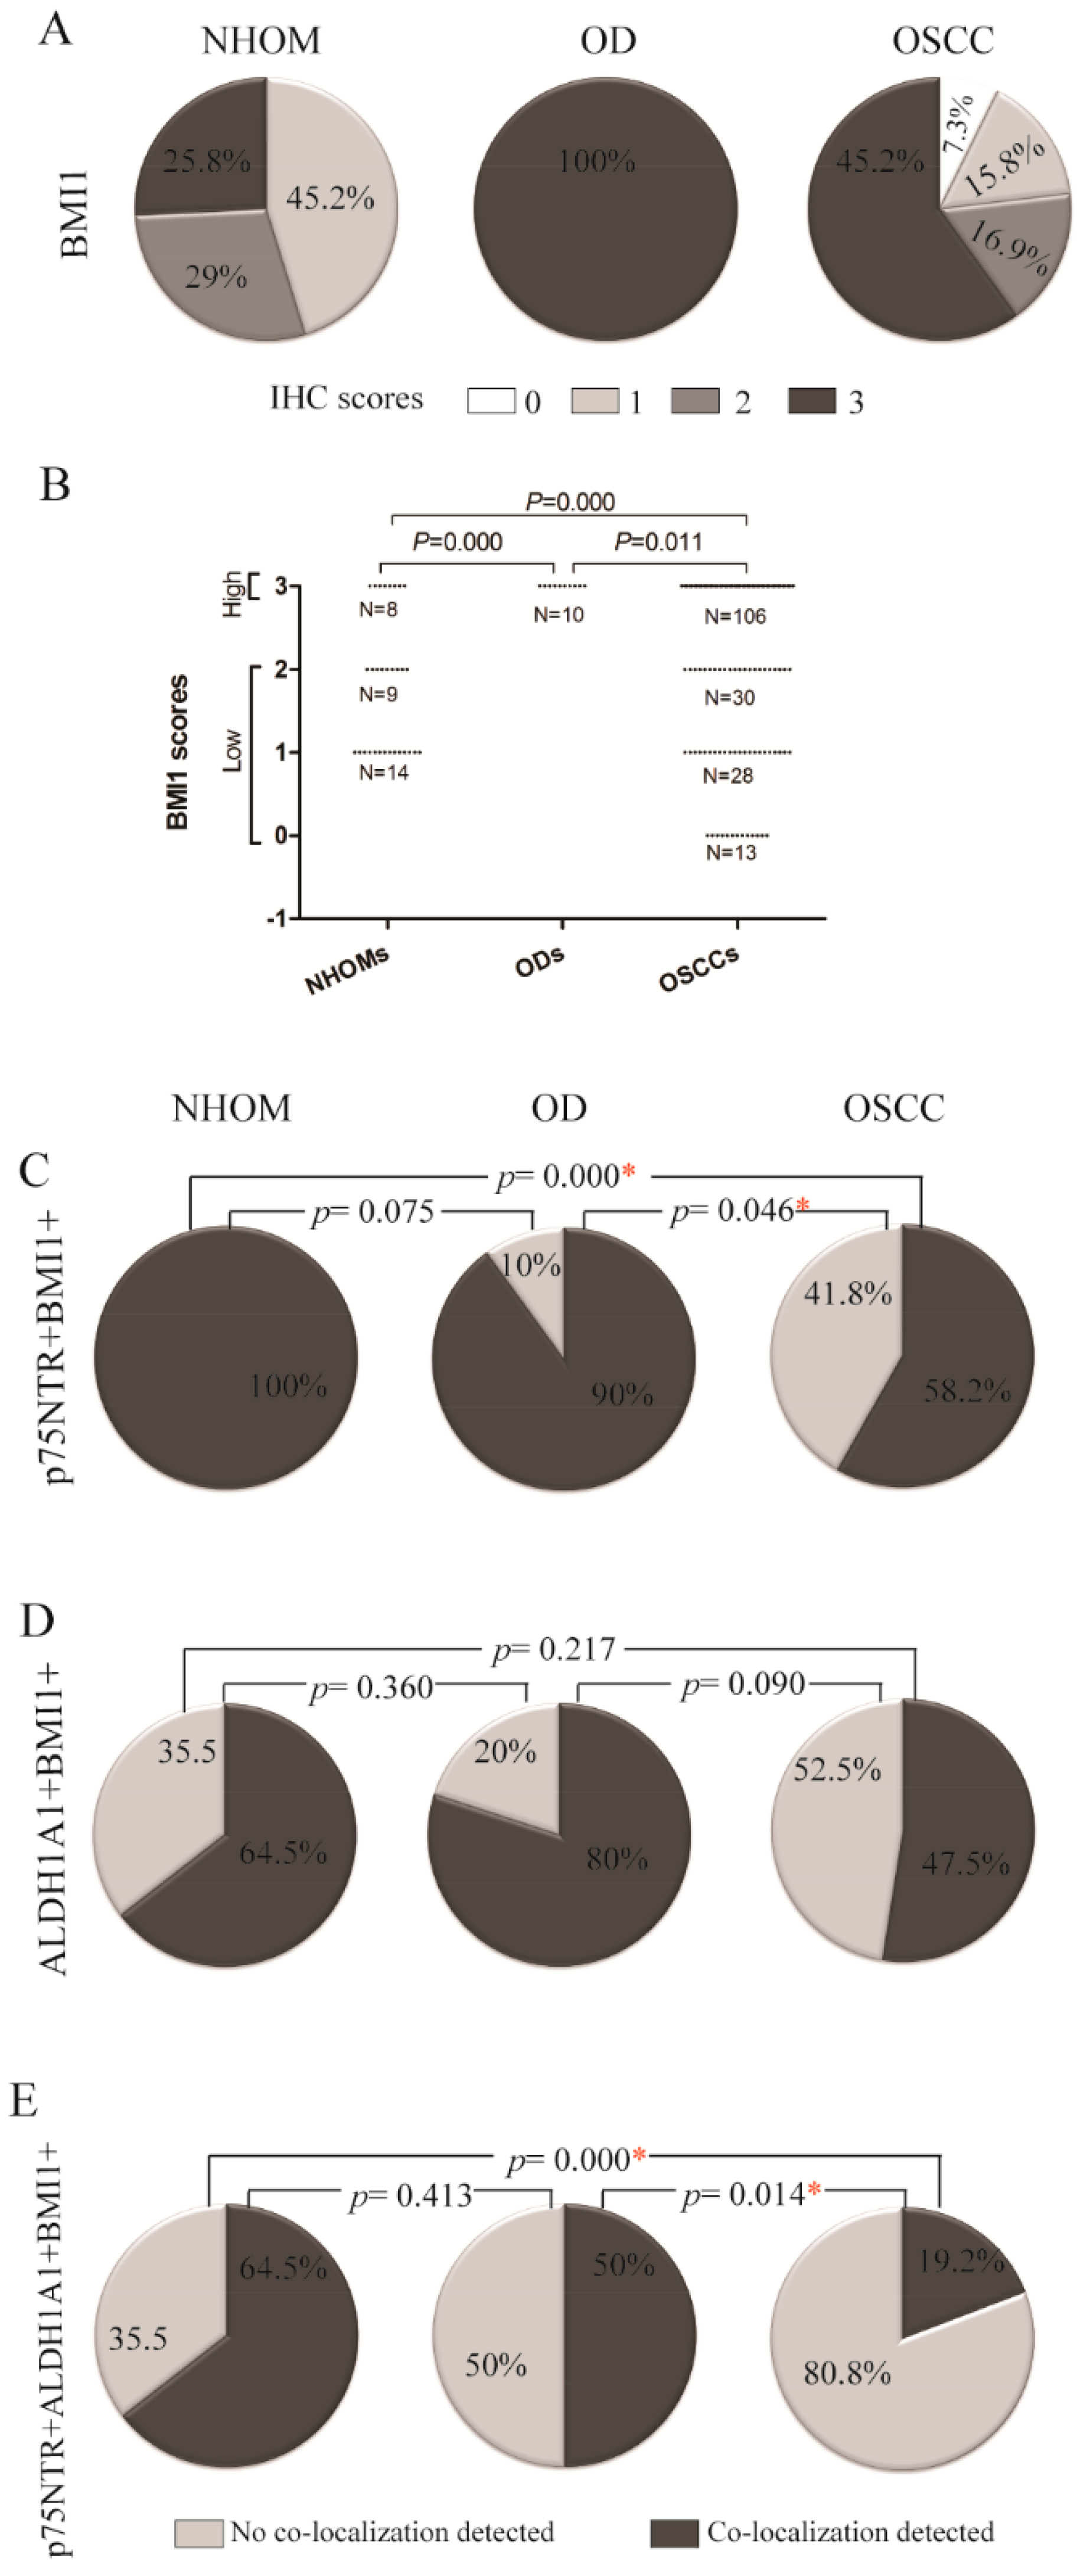
Highest Expression of Self-Renewing Marker BMI1 Was Detected in OD

Expression of the self-renewal marker BMI1 was quite frequent in all samples examined.
Nuclear staining for BMI1 was detected both in the basal and spinous layers of the epithelium in all NHOM samples, and high frequency of positive cells (>50%) was detected in 8 samples (25.8%) (Figure 4A). High expression of BMI1 was observed in all OD samples (Figure 4A). In OSCC, the expression of BMI1 was variable, with only 59.9% (n=106) of the samples displaying high frequency of BMI1+ cells, while 7.3% (n=10) displayed less than 1% BMI1+ cells (Figure 4A). BMI1 expression was found to be significantly higher in OD as compared to both NHOM and OSCC samples (Figure 4B, Supplementary Figure S3C). The BMI1 score did not correlate with any of the clinical parameters investigated.

A Greater Number of p75NTR+ Cells Co-Expressed BMI1 Compared to ALDH1A1+ Cells

An overlap between p75NTR and BMI1 subpopulation was detected in all NHOM samples, and 90% of OD samples, but only in 58.2% of the OSCC samples (Figure 4C, Supplementary Figure S3D). It is worth mentioning here that out of the OSCC samples that showed no co-localization between p75NTR and BMI1 (n=74), 51 samples (68.9%) and 13 samples (17.6%) had very low percentage of positive cells for p75NTR and BMI1 respectively, meaning that this co-localization was detected mostly in samples with high scores of the two markers. On the other hand, co-localization of ALDH1A1 and BMI1 was found to be a more frequent finding in OD samples, but the finding was not statistically significant (Figure 4D, Supplementary Figure S3E). The frequency of this co-localization was found not to be associated with any of the clinical parameters investigated.
Cells positive for both stem cell markers p75NTR and ALDH1A1 and the self-renewal marker BMI1, were detected within basal layer cells of 64.5% of NHOM, 50% of ODs and only 19.2% of OSCC (Figure 4E, Supplementary Figure S3F). Out of the OSCC samples that showed co-localization (19.2%, n=34), three cases (8.8%) showed co-localization of the three markers in more than 50% of the tumor cells (Supplementary Figure S3F). No statistically significant association with any of the clinical parameters was found.

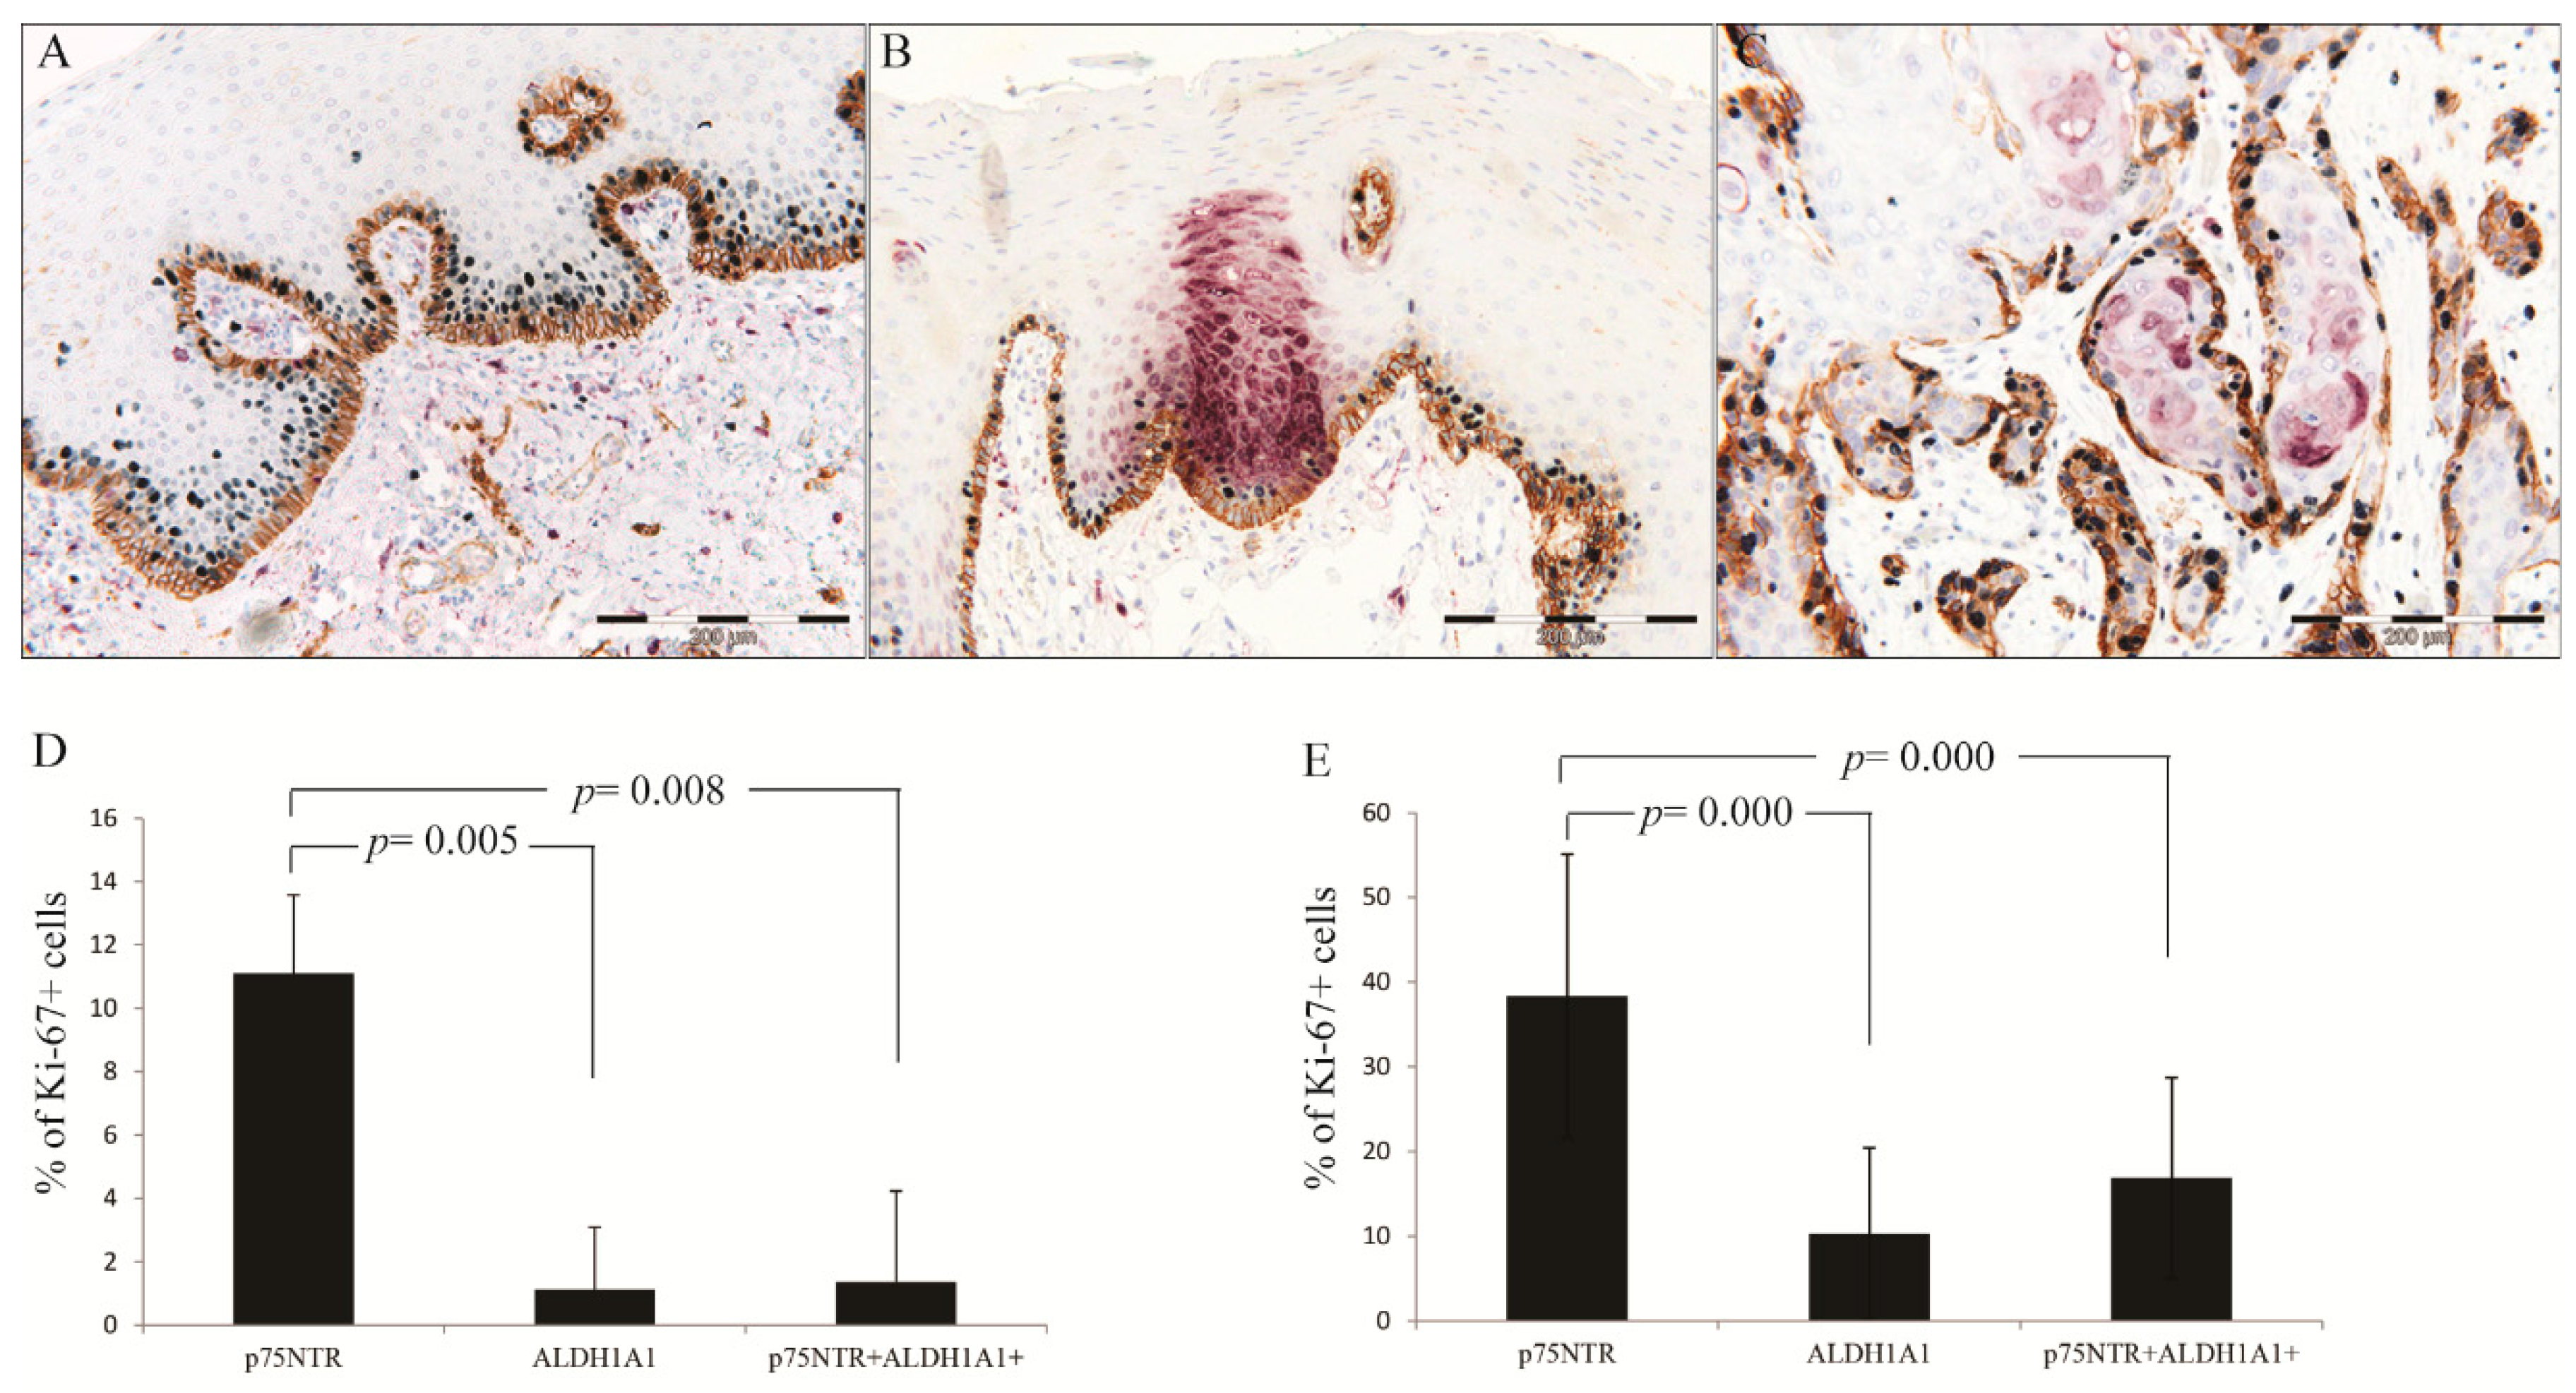
p75NTR+ Cells Were More Proliferative than ALDH1A1 in NHOM and OSCC

Comparison of the mean percentages of Ki-67+ cells within p75NTR+, ALDH1A1+ and p75NTR+ALDH1A1+ cell subpopulations was performed only in samples scoring more than 0 for both CSC markers [NHOM (n=19) and OSCC samples (n= 58)]. Friedman test revealed a significant difference between the percentages of proliferating cells in the three cell subpopulations in NHOM (p = 0.006) as well as in OSCC (p < 0.001), and higher percentage of proliferating cells was observed in p75NTR+ subpopulation (Figure 5). Further comparison of pairs of the three cell subpopulations using Wilcoxon-Rank test revealed a significant difference between p75NTR+ and ALDH1A1+ in NHOM (p = 0.005) and OSCC (p = 0.000). Another statistically significant difference was found between p75NTR+ and p75NTR+ALDH1A1+ subpopulations in NHOM (p = 0.008) and in OSCC (p < 0.001), but not between ALDH1A1+ and p75NTR+ALDH1A1+ subpopulations in either NHOM (p = 0.217) or OSCC (p = 0.273) (Figure 5D-E).

No Difference in p75NTR, ALDH1A1 or BMI1 Expression Between the Tumor Center and Invading Front or Lymph Nodes Metastasis

The scores obtained from IHC for the CSC markers and BMI1 from the tumor center were compared to the scores obtained at the tumor invading front (n = 25) or in matched metastatic lymph node tumor islands (n = 19) as pairs. No statistically significant difference was observed for any of the three markers investigated (Supplementary Figure S5A-D, Supplementary Table S4).
Expression levels of p75NTR and ALDH1A1 were also compared at the mRNA level between laser micro-dissected pieces from the tumor center and tumor invading front in OSCC samples (n = 23). No reaction product was detected in some of the samples, and the pair-wise comparison was valid only in seven samples for ALDH1A1, and eight for p75NTR. No statistically significant difference was found (Supplementary Figure S5E).

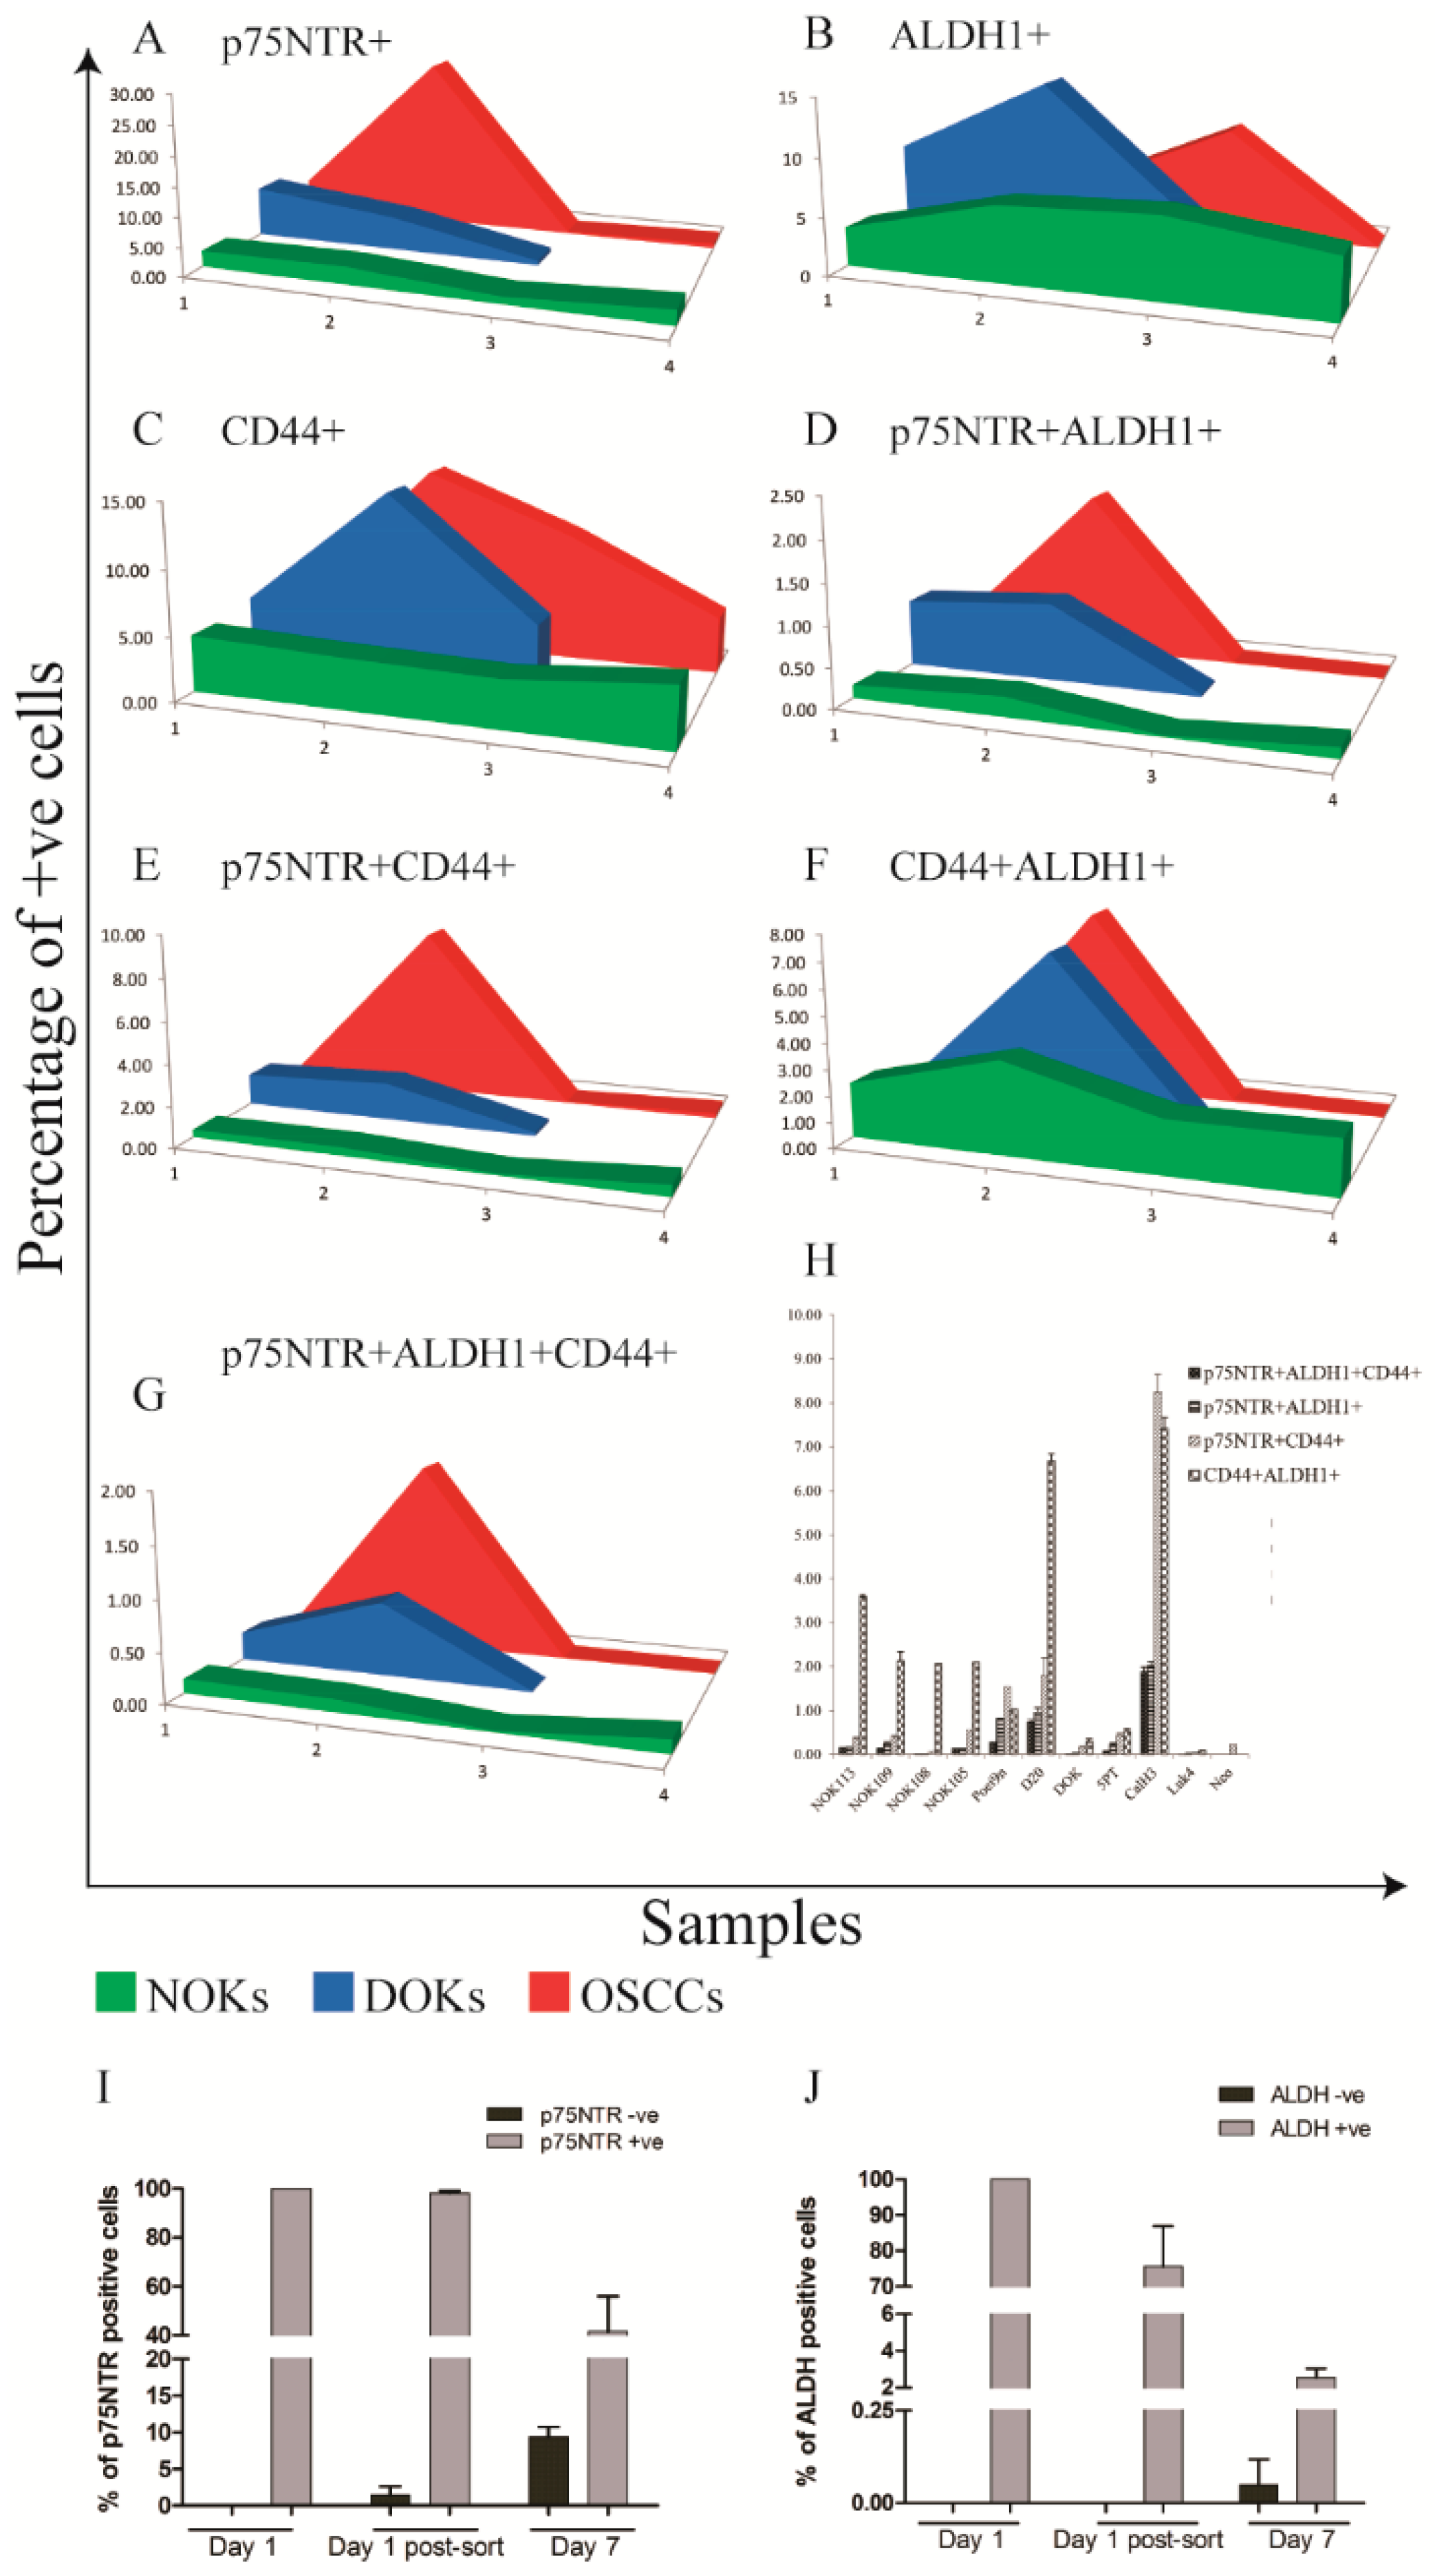
Increased Heterogeneity of CSC Markers Expression with Cancer Progression In Vitro

When expression of p75NTR, ALDH1 and CD44 was analyzed simultaneously by FACS (Supplementary Figure S1) of cell lines and primary cells comprising an in vitro progression model of OSCC [33], a pattern similar to that identified by IHC was detected. FACS analysis showed that expression levels of p75NTR, ALDH1 and CD44 displayed a wider range in OD and OSCC cells as compared to NOKs and overlap between the three subpopulation was a rare finding (Figure 6, Supplementary Tables S5, S6).
ALDH1High and p75NTRHigh CaLH3 cells sorted by FACS displayed distinct gene expression profiles for CSC related genes when analyzed by qRT-PCR. Significantly higher mRNA levels of previously suggested CSC markers (CD44, PDPN encoding Podoplanin, POU5 F1 encoding the transcription factor Oct4A) were detected on p75NTRHigh cells in comparison to p75NTRLow (Supplementary Figure S6). This pattern was the opposite in cells sorted according to ALDH1 expression. Instead, vimentin expression, which indicates epithelial-to-mesenchymal transition was higher in ALDH1High cells when compared to ALDH1Low cells. Of interest, the qRT-PCR results showed higher expression of epithelial differentiation markers (IVL and KRT10) by ALDH1High as compared to ALDH1Low cells while the opposite was observed for cells sorted for p75NTR expression. This indicates a less differentiated phenotype for the p75NTRHigh cells compared to ALDH1High cells.

Distinct Kinetics of ALDH1 and p75NTR Expression in OSCC-Derived Cells Propagated In Vitro

OSCC-derived Cells sorted for p75NTR or ALDH1 expression were propagated in culture for a week, and FACS analysis was performed as before. Based on the concomitant isotype control, cells propagated from the sorted p75NTRLow cells contained 8.06% p75NTRHigh cells after one week propagation in culture, while p75NTRHigh sorted subpopulation was found to contain 59.9% p75NTRHigh cells after the same period in culture (Figure 6I). Assessment of ALDH1 activity after one week propagation in culture showed that cells propagated from ALDH1Low cells contained 0.17% ALDH1High cells, while cells propagated from ALDH1High subpopulation contained only 3.99% ALDH1High cells (Figure 6J, Supplementary Figure S7). These data show that expression of these two stem cell markers has a complex and differential regulation and indicates that p75NTRHigh and ALDH1High OSCC-derived cells can arise de novo with different kinetics.

4. Discussion

One of the key findings of this work was the marked heterogeneity in expression of the two CSC markers ALDH1 and p75NTR in OD and OSCC as compared to NHOM. This corroborates previous findings on CSC markers from both OSCC [12,30,34], as well as other cancer models. In OSCC, CD44+ cells varied from 0.1% to 41.72% in a previous study [12]. In acute myeloid leukemia, the frequency of ALDH1+ cells was found to vary from 1-16% [35] and another study found that CD34+CD38- varied by a 1000 fold in a cohort of 16 patients [36]. Of note, we also found that the co-expression of the two markers by OSCC cells was an infrequent finding in both OSCC patient material as well as in OSCC-derived cell lines. Although some OSCC samples were completely lacking the expression of the two markers, significantly higher frequency of positive cells was detected in OSCC and OD when compared to NHOM. This study shows for the first time by our knowledge that multiple cell subpopulations expressing different stem cell markers co-exist in both normal and neoplastic oral mucosa and that the consequent inter-patient CSC heterogeneity increases with malignant progression. Of interest, we could detect some OD and OSCC cases in which not all the CSC phenotypes were present. We could identify several co-existent stem cell phenotypes in all NHOM samples and NOK cell strains, although with much lower frequency and co-localization, while in most of OSCC samples and cell lines only one stem cell phenotype seemed to be dominant at a certain time point. This phenomenon could be observed already in OD samples. The fact that some OSCCs were negative for both of the CSC markers investigated in this study indicates also that a CSC subpopulation with a yet different phenotype could have occurred with cancer progression in those particular cases, different from the stem cell phenotype of the original normal mucosa. In addition, the lack of expression of the self-renewing marker BMI1 in addition to the two CSC markers observed in few of OSCC in this study (n = 5), indicates that progression of these particular tumors is driven by another phenotype that does not oblige BMI1 involvement indicating either that BMI1 is not essential for a stem cell hierarchy to exist or that these tumors might not follow a stem cell hierarchy [4].
p75NTR+ cells were found to have higher proliferation rate than ALDH1+ cells. As a receptor of the TNF superfamily, p75NTR can promote diverse cellular events from apoptosis to cell proliferation, depending on its own level of expression, post-translational modifications, dimerization, ligand binding and engagement with co-receptors as well as intracellular partners [37,38,39,40]. However, a role of this receptor in promoting survival of oral and esophageal keratinocyte stem cells has been suggested [13,41]. Additionally, a role in promoting proliferation in mouse embryonic stem cells was also reported [42]. Self-renewal, evidenced by expression of BMI1 was also a consistent finding in p75NTR+ cells in all samples. This is in agreement with our previous findings that an oncogene FOXM1, which could transactivate BMI1, promoted the clonogenicity of primary oral human keratinocytes expressing high levels of p75NTRHigh but not in p75NTRLow cells [43,44]. The association between p75NTR and less differentiated OSCC cells, generally believed to be associated to poor prognosis [45] and to include CSCs [34], points to the p75NTR+ subpopulation as a population of cells enriched for cells with stem-cell properties. in vitro and in vivo analysis of p75NTRHigh and p75NTRLow OSCC cells supports the finding that this marker is associated with a group of less differentiated OSCC cells [19]. Of interest, a markedly high frequency of positive cells (more than 50% p75NTR+ cells) was found in 15.8% of OSCCs and in one OSCC derived cell line (CaLH3) but not in any NHOM or in any of the NOK strains analyzed. Our results also showed an association between the frequency of p75NTR+ cells and poorer survival of patients with T1 & T2 tumors. This suggests a significance of the presence of p75NTR+ cells in that group of patients, and it is in line with previous publications that have also reported the significance of p75NTR in prostate [46] and pancreatic [47] cancers , melanoma [15], oral [18], oesaphageal [16,48,49] and laryngeal squamous cell carcinoma [50]. This might indicate that the p75NTR+ population is only important at early tumor stages, while larger tumors can progress without input from this cell subpopulation.
High expression of ALDH1A1 was detected in OD patient material and derived cell lines, as well as in the pre-tumor epithelium of OSCC patients. High expression of ALDH1A1 was found to be associated with higher likelihood of lymph node metastasis. The clone like distribution pattern of ALDH1A1 expressing cells was not found to be associated with clinical information or patient survival, but significantly high frequency of ALDH1A1+ cells was detected in an OD derived cell line by flow cytometry (Figure 6B). Together with the association of lymph node metastasis, and the similarity between the tumor center and lymph node metastasis, it is plausible that ALDH1A1 expressing cells might play a role in invasion as suggested before in inflammatory breast cancer [51] or metastasis as suggested before in OSCC [52]. Of note, ALDH1+ cells were suggested before as being the CSC undergoing EMT, and in this line we also found ALDH1 High cells to express higher levels of vimentin than the p75NTR High cells. However, our qRT-PCR results also showed a higher expression of epithelial differentiation markers by ALDH1High as compared to p75NTRHigh, indicates a less differentiated phenotype for the p75NTRHigh cells compared to ALDH1High cells. p75NTR+ cells were also suggested previously to be the feeding reservoir of the tumor cells and the self-renewal compartment [43].
Of interest, all subpopulations of cells sorted either for ALDH1 or for p75NTR high or low expression, showed that they can regenerate from each other. The fact that the subpopulation enriched for stem cells such as the ALDH1high or p75NTR high cells generate non-stem cells was expected and fits well in the stem cell hierarchy theory, but the ability of the subpopulations depleted for CSC markers (ALDH1low or p75NTR low) to generate de novo subpopulations highly expressing these CSC markers (ALDH1high or p75NTR high cells) was unexpected. The dynamism we observed here is in line with the recent suggestions from research on CD44High and CD44Low cells isolated from breast cancers that displayed a contextually highly regulated equilibrium between stem cell-like cells and transit amplifying neoplastic progenitors [53].One can theorize that this equilibrium might have been disturbed in our case by the removal of one CSC phenotype, and then the natural tendency to regain the equilibrium between CSC phenotypes with each other, or with non-CSC compartment induced the highly plastic cancer cells to regenerate the missing CSC phenotype.
The low level of co-localization, both in patient samples and in cell lines, indicates also that p75NTR+ and ALDH1A1+ cells comprise two separate subpopulations with minimal overlap in OSCC. Although partial overlap between the two subpopulations was detected in some OSCC samples, no effect of the presence of this subpopulation was detected by looking into the clinical variables of the patients. The observed statistical association between ALDH1A1+ cells and lymph node metastasis, and between p75NTR+ cells and shorter survival of patients with favorable prognosis, suggests that CSCs subpopulation in OSCC is a highly dynamic subpopulation showing different phenotypes at different time points of tumor progression, probably with different clinical connotations.

5. Conclusions

Taken together, the data presented here demonstrate an intra- and inter-tumor phenotypic diversity of CSC. This raises novel challenges in terms of the use of CSC markers as predictive biomarkers and indicates that a more personalized approach is needed for their use as efficient therapeutic target for oral squamous cell carcinoma, since every OSCC might have its specific CSC-phenotype, and some might not follow a stem cell hierarchy at all.

Supplementary Materials

The following supporting information can be downloaded at the website of this paper posted on Preprints.org, Figure S1: Density plots illustrating analysis of FACS data of LuC4 cells for all three markers.; Figure S2: Histogram showing survival time of the study participants (A). Kaplan-Meier`s curves showing difference in survival probabilities between patients according to different demographic and clinical information (B-F).;Figure S3: Heat Maps illustrating the IHC scores for each of the samples individually. Samples are in the same order in all heat maps (A-F).; Figure S3: Heat Maps illustrating the IHC scores for each of the samples individually. Samples are in the same order in all heat maps (A-F).; Figure S4: Comparison of the clinical variables between patients scoring High or Low in IHC for p75NTR and ALDH1A1.; Figure S5: FFPE OSCC tissues subjected for triple IHC for p75NTR (purple), ALDH1A1 (gray) and BMI1 (brown). Tumor center (A) and invading front (B) from same patient. Tumor center (C) and lymph node metastasis (D) from same patient. Comparison of the relative mRNA expression of the two CSC markers between tumor center and invading front from a laser micro-dissected FFPE samples (E), error bars represent SD.;Figure S6: qRT-PCR of FACS sorted CalH3 cells for CSC (A) and differentiation markers (B) ; Figure S7: density plots illustrating FACS sorting of CalH3 cells for ALDH1 at Day 1 (A-C), and ALDH1High (D,E) and ALDH1Low (F,G) cells after propagation in culture.; Figure S7: density plots illustrating FACS sorting of CalH3 cells for ALDH1 at Day 1 (A-C), and ALDH1High (D,E) and ALDH1Low (F,G) cells after propagation in culture. Table S1: Scores used to quantify IHC of the studied CSC markers and their co-localization.; Table S2: Patients demographic and clinical information cross-tabulated against survival.; Table S3: Cox regression hazard models to investigate the effect of tumor size on p75NTR as an independent predictor of survival.; Table S4: Comparison of the IHC scores between tumor center and invading front or lymph nodes metastasis.; Table S5: Results of the multiple FACS analysis of NHOM, OD and OSCC-derived cells.; Table S6: Results of the multiple FACS analysis (continued).

Author Contributions

Conceptualization, DEC, TAO and ACJ ; Methodology, TAO, XL, MT and DS; Validation, TAO, DEC and ACJ; Formal Analysis, TAO, DS; Investigation, DEC, ACJ, DS, OR, LUH, TAO, AB and IM; Resources, DEC, AJC, LUH and OR; Data Curation, TAO; Writing – Original Draft Preparation, TAO and DEC; Writing – Review & Editing, all others have critically reviewed the manuscript; Visualization, TAO, DEC and DS; Supervision, DEC and ACJ; Project Administration, DEC; Funding Acquisition, DEC and TAO.

Funding

The Research Council of Norway through its Centers of Excellence funding scheme (project number 22325), Helse Vest (DEC, grant nr. 912260/2019 and F-13105/2024), Norwegian Government through Quota Programme (TAO), and Center for International Health (ACJ).

Institutional Review Board Statement

The study was conducted in accordance with the Declaration of Helsinki, and sample and clinical data collection was approved by the Research Ethics Council of North and West Norway (REK 2010/148).

Informed Consent Statement

Informed consent was obtained from all alive subjects involved in the study.

Data Availability Statement

Data can be obtained upon reasonable request to the corresponding author.

Acknowledgments

The: Authors would like to thank Bjorn Mæle and Olav Boe for their valuable contribution to the statistical analysis, Marianne Enger for her technical assistance with the FACS analysis, Gunnvor Øijordsbakken and Edith Fick for their technical assistance with immunohistochemistry.
Conflicts: of interest: None to declare.

References

  1. Clarke MF, Dick JE, Dirks PB, Eaves CJ, Jamieson CH, Jones DL, et al. Cancer stem cells--perspectives on current status and future directions: AACR Workshop on cancer stem cells. Cancer Res. 2006;66(19):9339-44. [CrossRef]
  2. Meacham CE, Morrison SJ. Tumour heterogeneity and cancer cell plasticity. Nature. 2013;501(7467):328-37. [CrossRef]
  3. Nowell PC. The clonal evolution of tumor cell populations. Science (New York, NY). 1976;194(4260):23-8.
  4. Shackleton M, Quintana E, Fearon ER, Morrison SJ. Heterogeneity in cancer: cancer stem cells versus clonal evolution. Cell. 2009;138(5):822-9.
  5. Visvader JE, Lindeman GJ. Cancer stem cells in solid tumours: accumulating evidence and unresolved questions. Nature reviews Cancer. 2008;8(10):755-68.
  6. Sung H, Ferlay J, Siegel RL, Laversanne M, Soerjomataram I, Jemal A, et al. Global cancer statistics 2020: GLOBOCAN estimates of incidence and mortality worldwide for 36 cancers in 185 countries. CA: a cancer journal for clinicians. 2021;71(3):209-49.
  7. Coleman MP, Gatta G, Verdecchia A, Esteve J, Sant M, Storm H, et al. EUROCARE-3 summary: cancer survival in Europe at the end of the 20th century. Annals of oncology : official journal of the European Society for Medical Oncology/ESMO. 2003;14 Suppl 5:v128-49. [CrossRef]
  8. Vermorken JB, Mesia R, Rivera F, Remenar E, Kawecki A, Rottey S, et al. Platinum-based chemotherapy plus cetuximab in head and neck cancer. N Engl J Med. 2008;359(11):1116-27.
  9. Chen YC, Chen YW, Hsu HS, Tseng LM, Huang PI, Lu KH, et al. Aldehyde dehydrogenase 1 is a putative marker for cancer stem cells in head and neck squamous cancer. Biochem Biophys Res Commun. 2009;385(3):307-13.
  10. Clay MR, Tabor M, Owen JH, Carey TE, Bradford CR, Wolf GT, et al. Single-marker identification of head and neck squamous cell carcinoma cancer stem cells with aldehyde dehydrogenase. Head Neck. 2010. [CrossRef]
  11. Okamoto A, Chikamatsu K, Sakakura K, Hatsushika K, Takahashi G, Masuyama K. Expansion and characterization of cancer stem-like cells in squamous cell carcinoma of the head and neck. Oral Oncol. 2009;45(7):633-9.
  12. Prince ME, Sivanandan R, Kaczorowski A, Wolf GT, Kaplan MJ, Dalerba P, et al. Identification of a subpopulation of cells with cancer stem cell properties in head and neck squamous cell carcinoma. Proc Natl Acad Sci U S A. 2007;104(3):973-8.
  13. Nakamura T, Endo K, Kinoshita S. Identification of human oral keratinocyte stem/progenitor cells by neurotrophin receptor p75 and the role of neurotrophin/p75 signaling. Stem Cells. 2007;25(3):628-38. [CrossRef]
  14. Marynka-Kalmani K, Treves S, Yafee M, Rachima H, Gafni Y, Cohen MA, et al. The lamina propria of adult human oral mucosa harbors a novel stem cell population. Stem Cells. 2010;28(5):984-95.
  15. Civenni G, Walter A, Kobert N, Mihic-Probst D, Zipser M, Belloni B, et al. Human CD271-positive melanoma stem cells associated with metastasis establish tumor heterogeneity and long-term growth. Cancer Res. 2011;71(8):3098-109.
  16. Huang SD, Yuan Y, Liu XH, Gong DJ, Bai CG, Wang F, et al. Self-renewal and chemotherapy resistance of p75NTR positive cells in esophageal squamous cell carcinomas. BMC Cancer. 2009;9:9.
  17. Kiyosue T, Kawano S, Matsubara R, Goto Y, Hirano M, Jinno T, et al. Immunohistochemical location of the p75 neurotrophin receptor (p75NTR) in oral leukoplakia and oral squamous cell carcinoma. Int J Clin Oncol. 2011.
  18. Soland TM, Brusevold IJ, Koppang HS, Schenck K, Bryne M. Nerve growth factor receptor (p75 NTR) and pattern of invasion predict poor prognosis in oral squamous cell carcinoma. Histopathology. 2008;53(1):62-72.
  19. Osman TA, Parajuli H, Sapkota D, Ahmed IA, Johannessen A, Costea DE. The low-affinity nerve growth factor receptor p75NTR identifies a transient stem cell-like state in oral squamous cell carcinoma cells. Journal of oral pathology & medicine : official publication of the International Association of Oral Pathologists and the American Academy of Oral Pathology. 2015;44(6):410-9.
  20. Duester G. Retinoic acid synthesis and signaling during early organogenesis. Cell. 2008;134(6):921-31. [CrossRef]
  21. Huang EH, Hynes MJ, Zhang T, Ginestier C, Dontu G, Appelman H, et al. Aldehyde dehydrogenase 1 is a marker for normal and malignant human colonic stem cells (SC) and tracks SC overpopulation during colon tumorigenesis. Cancer Res. 2009;69(8):3382-9. [CrossRef]
  22. Ginestier C, Hur MH, Charafe-Jauffret E, Monville F, Dutcher J, Brown M, et al. ALDH1 is a marker of normal and malignant human mammary stem cells and a predictor of poor clinical outcome. Cell Stem Cell. 2007;1(5):555-67.
  23. Douville J, Beaulieu R, Balicki D. ALDH1 as a Functional Marker of Cancer Stem and Progenitor Cells. Stem Cells Dev. 2008.
  24. Osman TA, Oijordsbakken G, Costea DE, Johannessen AC. Successful triple immunoenzymatic method employing primary antibodies from same species and same immunoglobulin subclass. European journal of histochemistry : EJH. 2013;57(3):e22. [CrossRef]
  25. Park IK, Qian D, Kiel M, Becker MW, Pihalja M, Weissman IL, et al. Bmi-1 is required for maintenance of adult self-renewing haematopoietic stem cells. Nature. 2003;423(6937):302-5.
  26. Gerdes J. An immunohistological method for estimating cell growth fractions in rapid histopathological diagnosis during surgery. International journal of cancer Journal international du cancer. 1985;35(2):169-71. [CrossRef]
  27. McShane LM, Altman DG, Sauerbrei W, Taube SE, Gion M, Clark GM. REporting recommendations for tumour MARKer prognostic studies (REMARK). British journal of cancer. 2005;93(4):387-91.
  28. Gammon L, Biddle A, Heywood HK, Johannessen AC, Mackenzie IC. Sub-sets of cancer stem cells differ intrinsically in their patterns of oxygen metabolism. PLoS One. 2013;8(4):e62493.
  29. Gammon L, Biddle A, Fazil B, Harper L, Mackenzie IC. Stem cell characteristics of cell sub-populations in cell lines derived from head and neck cancers of Fanconi anemia patients. Journal of oral pathology & medicine : official publication of the International Association of Oral Pathologists and the American Academy of Oral Pathology. 2011;40(2):143-52. [CrossRef]
  30. Dalley AJ, Abdulmajeed AA, Upton Z, Farah CS. Organotypic culture of normal, dysplastic and squamous cell carcinoma-derived oral cell lines reveals loss of spatial regulation of CD44 and p75(NTR) in malignancy. Journal of oral pathology & medicine : official publication of the International Association of Oral Pathologists and the American Academy of Oral Pathology. 2012.
  31. Muntoni A, Fleming J, Gordon KE, Hunter K, McGregor F, Parkinson EK, et al. Senescing oral dysplasias are not immortalized by ectopic expression of hTERT alone without other molecular changes, such as loss of INK4A and/or retinoic acid receptor-beta: but p53 mutations are not necessarily required. Oncogene. 2003;22(49):7804-8.
  32. Costea DE, Dimba AO, Loro LL, Vintermyr OK, Johannessen AC. The phenotype of in vitro reconstituted normal human oral epithelium is essentially determined by culture medium. Journal of oral pathology & medicine : official publication of the International Association of Oral Pathologists and the American Academy of Oral Pathology. 2005;34(4):247-52.
  33. Sapkota D, Bruland O, Costea DE, Haugen H, Vasstrand EN, Ibrahim SO. S100A14 regulates the invasive potential of oral squamous cell carcinoma derived cell-lines in vitro by modulating expression of matrix metalloproteinases, MMP1 and MMP9. European journal of cancer (Oxford, England : 1990). 2011;47(4):600-10.
  34. Chiou SH, Yu CC, Huang CY, Lin SC, Liu CJ, Tsai TH, et al. Positive correlations of Oct-4 and Nanog in oral cancer stem-like cells and high-grade oral squamous cell carcinoma. Clin Cancer Res. 2008;14(13):4085-95.
  35. Ran D, Schubert M, Pietsch L, Taubert I, Wuchter P, Eckstein V, et al. Aldehyde dehydrogenase activity among primary leukemia cells is associated with stem cell features and correlates with adverse clinical outcomes. Experimental hematology. 2009;37(12):1423-34.
  36. Eppert K, Takenaka K, Lechman ER, Waldron L, Nilsson B, van Galen P, et al. Stem cell gene expression programs influence clinical outcome in human leukemia. Nature medicine. 2011;17(9):1086-93. [CrossRef]
  37. Roux PP, Barker PA. Neurotrophin signaling through the p75 neurotrophin receptor. Progress in neurobiology. 2002;67(3):203-33.
  38. Aggarwal BB. Signalling pathways of the TNF superfamily: a double-edged sword. Nature reviews Immunology. 2003;3(9):745-56. [CrossRef]
  39. Barker PA, Murphy RA. The nerve growth factor receptor: a multicomponent system that mediates the actions of the neurotrophin family of proteins. Molecular and cellular biochemistry. 1992;110(1):1-15.
  40. Tomellini E, Lagadec C, Polakowska R, Le Bourhis X. Role of p75 neurotrophin receptor in stem cell biology: more than just a marker. Cellular and molecular life sciences : CMLS. 2014.
  41. Okumura T, Shimada Y, Imamura M, Yasumoto S. Neurotrophin receptor p75(NTR) characterizes human esophageal keratinocyte stem cells in vitro. Oncogene. 2003;22(26):4017-26.
  42. Moscatelli I, Pierantozzi E, Camaioni A, Siracusa G, Campagnolo L. p75 neurotrophin receptor is involved in proliferation of undifferentiated mouse embryonic stem cells. Experimental cell research. 2009;315(18):3220-32. [CrossRef]
  43. Gemenetzidis E, Elena-Costea D, Parkinson EK, Waseem A, Wan H, Teh MT. Induction of human epithelial stem/progenitor expansion by FOXM1. Cancer Res. 2010;70(22):9515-26.
  44. Teh MT, Hutchison IL, Costea DE, Neppelberg E, Liavaag PG, Purdie K, et al. Exploiting FOXM1-orchestrated molecular network for early squamous cell carcinoma diagnosis and prognosis. International journal of cancer Journal international du cancer. 2013;132(9):2095-106.
  45. Eneroth CM, Hjertman L, Moberger G. Squamous cell carcinomas of the palate. Acta oto-laryngologica. 1972;73(5):418-27.
  46. Walch ET, Marchetti D. Role of neurotrophins and neurotrophins receptors in the in vitro invasion and heparanase production of human prostate cancer cells. Clinical & experimental metastasis. 1999;17(4):307-14. [CrossRef]
  47. Dang C, Zhang Y, Ma Q, Shimahara Y. Expression of nerve growth factor receptors is correlated with progression and prognosis of human pancreatic cancer. Journal of gastroenterology and hepatology. 2006;21(5):850-8.
  48. Okumura T, Tsunoda S, Mori Y, Ito T, Kikuchi K, Wang TC, et al. The biological role of the low-affinity p75 neurotrophin receptor in esophageal squamous cell carcinoma. Clin Cancer Res. 2006;12(17):5096-103.
  49. Tsunoda S, Okumura T, Ito T, Mori Y, Soma T, Watanabe G, et al. Significance of nerve growth factor overexpression and its autocrine loop in oesophageal squamous cell carcinoma. British journal of cancer. 2006;95(3):322-30. [CrossRef]
  50. Li X, Shen Y, Di B, Li J, Geng J, Lu X, et al. Biological and clinical significance of p75NTR expression in laryngeal squamous epithelia and laryngocarcinoma. Acta oto-laryngologica. 2012;132(3):314-24.
  51. Charafe-Jauffret E, Ginestier C, Iovino F, Tarpin C, Diebel M, Esterni B, et al. Aldehyde dehydrogenase 1-positive cancer stem cells mediate metastasis and poor clinical outcome in inflammatory breast cancer. Clin Cancer Res.16(1):45-55.
  52. Biddle A, Liang X, Gammon L, Fazil B, Harper LJ, Emich H, et al. Cancer stem cells in squamous cell carcinoma switch between two distinct phenotypes that are preferentially migratory or proliferative. Cancer Res. 2011;71(15):5317-26.
  53. Chaffer CL, Brueckmann I, Scheel C, Kaestli AJ, Wiggins PA, Rodrigues LO, et al. Normal and neoplastic nonstem cells can spontaneously convert to a stem-like state. Proc Natl Acad Sci U S A. 2011;108(19):7950-5. [CrossRef]
Figure 1. Comparison of the crude IHC scores of p75NTR (A) and ALDH1A1 (B) in NHOM, OD and OSCC. Comparison of the co-localization of the two markers in NHOM, OD and OSCC (C). comparison of the dichotomized variables in the three types of samples (D,E).
Preprints 179400 g001
Figure 2. FFPE tissue subjected for triple IHC for p75NTR (purple), ALDH1A1 (grey) and BMI1 (brown) in NHOM (A-D), OD (E-H) and OSCC (I-T).
Preprints 179400 g002
Figure 3. Kaplan-Meier`s curves showing the difference in survival probabilities between ptients with high or low p75NTR expression. Analysis was performed in all patients (Left), and in patients survived ≤ 10 years (right).
Preprints 179400 g003
Figure 4. Comparison of the crude (A) and the dichotomized (B) IHC scores of BMI1 (A) in NHOM, OD and OSCC. Comparison of the frequency of p75NTR+BMI1+ (C), ALDH1A1+BMI+ (D), p75NTR+ALDH1A1+BMI1+ (E), between the three types of samples.
Preprints 179400 g004
Figure 5. FFPE tissues subjected to triple IHC for p75NTR (brown), ALDH1A1 (purple) and Ki-67 (Dark grey). Samples are from NHOM (A), para-tumor epithelium (B) and OSCC (C). Bar charts representing the difference in Ki-67+ cells within p75NTR+, ALDH1A1+ and p75NTR+ALDH1A1+ in NHOM (D) and OSCC (E).
Preprints 179400 g005
Figure 6. Area charts representing the results of multiple FACS analysis in NHOM, OD and OSCC-derived cells (E-H). De novo generation of p75NTR+ and ALDH1A1+ CalH3 cells (I,J) error bars represent SD.
Preprints 179400 g006
Disclaimer/Publisher’s Note: The statements, opinions and data contained in all publications are solely those of the individual author(s) and contributor(s) and not of MDPI and/or the editor(s). MDPI and/or the editor(s) disclaim responsibility for any injury to people or property resulting from any ideas, methods, instructions or products referred to in the content.
Copyright: This open access article is published under a Creative Commons CC BY 4.0 license, which permit the free download, distribution, and reuse, provided that the author and preprint are cited in any reuse.
Prerpints.org logo

Preprints.org is a free preprint server supported by MDPI in Basel, Switzerland.

Subscribe

Disclaimer

Terms of Use

Privacy Policy

Privacy Settings

© 2025 MDPI (Basel, Switzerland) unless otherwise stated