
Submitted:
01 October 2025
Posted:
02 October 2025
You are already at the latest version
Abstract
Congenital anomalies are an important cause of infant morbidity and mortality and have a high prevalence, especially in low- and middle-income countries. This retrospective cohort study evaluated the prevalence, distribution, and outcomes of congenital anomalies in Southeast Turkey over a 10-year period and investigated prognostic factors affecting survival. A total of 956 pregnant women referred to a tertiary care centre with suspected or confirmed fetal anomaly between January 2015 and December 2024 were included in the study. Maternal demographic, obstetric and clinical data and fetal characteristics were obtained from hospital records. Anomalies were classified according to organ systems and birth weights were categorised according to World Health Organization definitions. Congenital anomalies were observed in 956 (7.3%) of 13,089 births. Central nervous system anomalies were the most common (44.2%), followed by cystic hygroma (10.3%), cardiac (9.4%) and urinary system anomalies (8.7%). Neural tube defects were present in 31.8% of cases and spina bifida was the dominant type (51.0%). Survival was 89.9% at ≥24 weeks compared to only 1% at less than 24 weeks (p<0.001). Logistic regression identified gestational age as the only independent predictor of survival (OR=0.744, 95% confidence interval:0.555-0.997, p=0.048). These findings emphasise the importance of early diagnosis, prenatal screening and region-specific preventive strategies.
Keywords:
congenital anomalies
; Neural tube defects
; survival
; Southeast
; Turkey
1. Introduction
Congenital anomalies are defined as structural or functional abnormalities that arise during intrauterine life and cause health problems after birth. They represent a major global health concern, contributing substantially to infant morbidity and mortality [1,2]. Worldwide, approximately 6% of births are affected by congenital anomalies, although prevalence varies across studies and populations [2,3]. These conditions account for nearly 20% of neonatal deaths, making them one of the leading causes of infant mortality [4,5]. Their prevalence is considerably higher among stillbirths, with reported rates ranging from 14% to 27% [6,7].
Multiple risk factors have been identified, including maternal exposure to medications such as nonsteroidal anti-inflammatory drugs (NSAIDs), which have been linked to cleft lip and spinal anomalies. Environmental toxins and chemicals also contribute significantly to their etiology [3,8]. Socioeconomic status, cultural practices, and access to healthcare strongly influence both the occurrence and timely diagnosis of congenital anomalies, underlining the importance of comprehensive healthcare systems in risk reduction [3].
Key aspects in the study of congenital anomalies include the identification of anomaly types, their regional distribution, and associations with underlying conditions [2,9]. Prenatal diagnosis has enabled the early detection of many anomalies, offering prospective parents opportunities for informed decision-making and early intervention [10]. However, inequalities persist in access to and quality of prenatal screening worldwide.
Cultural factors, such as consanguinity, significantly contribute to prevalence in certain regions, particularly in low- and middle-income countries [11]. Public health efforts should focus on education, community awareness, and addressing broader determinants of child health [11,12]. While congenital anomalies may arise from genetic, infectious, nutritional, or environmental causes, in many cases the exact etiology remains unclear. Preventive measures include adequate nutrition, vaccination programs, folic acid and iodine supplementation, and comprehensive antenatal and postnatal care [13].
Global comparisons highlight regional differences in prevalence and outcomes, indicating that effective strategies must be tailored to local epidemiological and cultural contexts [14,15]. Our study aimed to investigate the epidemiological characteristics, distribution, and outcomes of congenital anomalies in a large retrospective cohort from Southeast Turkey. By analyzing long-term, region-specific data, this study seeks to fill a critical gap in national literature, contribute to global epidemiological databases, and guide targeted prenatal screening, optimized perinatal management, and culturally sensitive preventive interventions.
2. Materials and Methods
Study Design and Setting
This retrospective, observational cohort study was conducted at the Faculty of Medicine, Dicle University Hospital, a tertiary referral centre in Diyarbakır, Southeastern Turkey. The hospital provides advanced maternal–fetal care and receives referrals from several neighbouring provinces, thereby representing a large and diverse patient population. The study period extended from January 2015 to December 2024.
Study Population
A total of 956 pregnant women who presented to, or were referred to, our centre with suspected or confirmed fetal anomalies were included. Maternal demographic characteristics (age, parity, gravidity, and residence), obstetric and medical histories, and details of the current pregnancy (gestational age, antenatal follow-up, previous abortions, and complications) were collected retrospectively from electronic medical records. Fetal data included ultrasonographic findings, type and distribution of anomalies, gestational age at diagnosis, pregnancy outcome (live birth, stillbirth, or termination), birth weight, neonatal sex, and survival outcomes.
Inclusion and Exclusion Criteria
Inclusion criteria: All singleton pregnancies with a confirmed diagnosis of congenital anomaly based on ultrasound or postnatal examination between January 2015 and December 2024.
Exclusion criteria: Multiple pregnancies, stillbirths unrelated to congenital anomalies, and cases with incomplete or inaccessible data.
Data Collection
Data were retrieved from the Hospital Information Management System (HIMS). Standardised forms were used to collect sociodemographic and clinical information. Congenital anomalies were classified according to the International Classification of Diseases, 10th Revision (ICD-10), and grouped by organ system (e.g., central nervous system, cardiovascular, gastrointestinal, musculoskeletal, genitourinary, chromosomal, and others).
Statistical Analysis
SPSS Statistics version 21.0 (IBM Corp. (2012). IBM SPSS Statistics for Windows, Version 21.0. Armonk, NY: IBM Corp) statistical package programme will be used. The Kolmogorov-Smirnov test will be used to determine whether the data fit the normal distribution. Measurement variables will be presented as mean ± standard deviation (SD), median, minimum value, maximum value, correlation coefficient (r), coefficient of variation (CV%), 95% confidence interval (95% CI), consistency ratio and weighted kappa (κ), categorical variables will be presented as number (n) and percentage (%). Pearson Chi-square (χ2) test, Yates Chi-square (χ2) test, Fisher Chi-square (χ2) test will be used to compare qualitative variables. Pearson/Spearman correlation analysis will be performed for the relationship between variables. Birth weight will be classified according to WHO definitions and gestational age-specific categories. Correlation analyses will be performed between maternal age, gravida, parity, history of abortion and selected anomalies, and survival rates will be compared between maternal and fetal characteristics using chi-square tests. Univariate and multivariate logistic regression analyses were planned to identify independent predictors of survival. Results will be expressed as odds ratios with 95% confidence intervals (CI). Other additional statistical analyses will be performed as needed. Hypotheses will be taken as two-sided, and a statistically significant result will be accepted if p≤0.05.
Ethical Considerations
The study protocol was approved by the Ethics Committee of Dicle University Faculty of Medicine (Approval No: 306, Date: 17/09/2025). The study was conducted in accordance with the Declaration of Helsinki. Owing to the retrospective design, informed consent was not required. No additional financial burden was imposed on the participants.
3. Results
Among the 956 mothers included, 39.6% were younger than 25 years, 34.7% were between 25–35 years, and 25.6% were older than 35 years. Regarding gestational age at delivery (n = 951), 43.6% of births occurred before 24 weeks, 25.1% between 24–36 weeks, 30.8% between 37–41 weeks, and 0.4% at ≥42 weeks. Maternal BMI data (n = 295) showed that 2.0% of mothers were underweight, 27.5% had normal weight, 45.4% were overweight, and 25.1% were obese. Among the 557 mothers with available comorbidity data, 87.6% had no comorbidities. Hypertension was the most frequent comorbidity (3.2%), followed by anemia (2.3%), diabetes mellitus (1.4%), thyroid disorders (1.1%), and cardiac disease (0.9%). Regarding mode of delivery (n = 895), caesarean section was the most common (43.4%), followed by therapeutic abortion (35.2%), vaginal delivery (15.4%), and hysterotomy (1.0%). Fetal sex distribution (n = 764) was 52.1% male, 46.3% female, and 1.6% undetermined (Table 1). Analysis of fetal birth weight showed that 40.1% of cases had normal weight, while 36.0% were classified as extremely low birth weight. Low birth weight was observed in 14.5% of cases, very low birth weight in 6.5%, and high birth weight in 2.1%. The majority of very low birth weight cases were associated with deliveries before 24 weeks, most of which were pregnancy terminations due to fetal anomalies, with a substantial proportion being therapeutic abortions (Figure 1).
The majority of pregnant women included in the study were admitted from Diyarbakır (31.5%; n = 298), which corresponds to our hospital’s primary referral area. Diyarbakır was followed by Mardin (21.6%; n = 204), Şırnak (18.7%; n = 177), Batman (8.0%; n = 76), and Siirt (3.8%; n = 36). In addition, 3.4% (n = 32) of the women were Syrian refugees, and 3.3% (n = 31) were referred from other provinces. Lower proportions of patients were admitted from Şanlıurfa (3.2%; n = 30), Bitlis (2.5%; n = 24), Bingöl (2.1%; n = 20), and Muş (1.9%; n = 18) (Table 2).
Among the 951 fetuses with anomalies, central nervous system (CNS) anomalies were the most frequent, accounting for 44.2% of cases. These were followed by cystic hygroma (10.3%), cardiac anomalies (9.4%), multiple anomalies (8.9%), urinary anomalies (8.7%), gastrointestinal anomalies (4.8%), suspected chromosomal abnormalities (4.3%), musculoskeletal anomalies (3.1%), thoracic anomalies (2.8%), abdominal wall anomalies (2.4%), and facial anomalies (0.4%). Genital anomalies were rare, representing only 0.1% of cases. Neural tube defect (NTD) data were available for 939 fetuses, of which 31.8% had NTD, while 68.2% showed no evidence of such defects (Table 3).
In this 10-year study conducted at our hospital, a total of 13,089 births were analysed, of which 956 involved congenital anomalies, corresponding to a prevalence of 7.3%. This figure, however, is unusually high and does not accurately reflect the prevalence in the city or region, as our hospital serves as the primary tertiary referral centre and receives nearly all regional cases requiring advanced follow-up, including congenital anomalies. When the regional distribution of anomalies was evaluated, central nervous system (CNS) anomalies were most frequently observed in Şırnak (26.2%; n = 102), Diyarbakır (23.4%; n = 91), and Mardin (22.1%; n = 86). Cardiac anomalies were most common in Diyarbakır (44.4%; n = 40), while urinary anomalies were also highest in Diyarbakır (35.7%; n = 30). Multiple anomalies were particularly prominent in Diyarbakır (40.2%; n = 33). Cystic hygroma was most frequent in Diyarbakır (33.6%; n = 39), followed by Mardin (25.9%; n = 30) and Şırnak (15.5%; n = 18). Neural tube defects (NTDs) were most common in Şırnak (30.4%; n = 91), followed by Diyarbakır (21.1%; n = 63) and Mardin (20.7%; n = 62). Lower frequencies of NTDs were recorded in Batman (5.4%; n = 16), Siirt (4.3%; n = 13), Şanlıurfa (3.3%; n = 10), and Bitlis (3.3%; n = 10) (Table 4).
The mean maternal age was 28.37 ± 6.68 years (median: 28.0). The mean number of pregnancies was 3.62 ± 2.59 (median: 3.0), mean parity was 2.03 ± 2.10 (median: 2.0), and mean number of miscarriages was 0.61 ± 1.06 (median: 0). The mean number of live births was 1.87 ± 1.97 (median: 1.0). The mean gestational age at delivery was 27.65 ± 9.66 weeks (median: 29.75 weeks), and the mean fetal weight was 1841.83 ± 1305.15 g (median: 2100 g). The mean maternal BMI was 27.48 ± 4.42 kg/m² (median: 27.20 kg/m²). The mean duration of hospital stay was 2.60 ± 1.23 days (median: 2.0 days) (Table 5).
When the annual distribution was analysed among 954 infants with known birth years, the highest number of anomalies was recorded in 2015 (n = 204; 21.4%), followed by 2016 (n = 152; 15.9%) and 2018 (n = 111; 11.6%). The lowest rates were observed in 2022 (n = 47; 4.9%) and 2024 (n = 45; 4.7%). A notable increase was observed during 2019–2021 (2019: n = 100; 10.5%, 2020: n = 58; 6.1%, 2021: n = 101; 10.6%), whereas a significant decline occurred in 2022 and 2024 (Figure 2).
When the yearly distribution of congenital anomalies was analysed, central nervous system (CNS) anomalies were the most common group in all years. The proportion of CNS anomalies was 42.2% in 2015, 34.9% in 2016, 29.1% in 2017, 45.9% in 2018, 35.0% in 2019, 36.2% in 2020, 55.4% in 2021, 36.2% in 2022, 52.6% in 2023, and 46.7% in 2024. Cardiac anomalies, which accounted for 12.7% in 2015, 19.1% in 2016, and 17.7% in 2017, decreased markedly after 2019 and were not observed in 2023–2024. Urinary system anomalies showed annual fluctuations, ranging from 3.0% to 12.3%, with the highest rate observed in 2023 (12.3%). The prevalence of cystic hygroma remained relatively stable over the years, ranging from 11.8% to 14.0% during 2015–2021, but decreased to 8.8% in 2023 and 2.2% in 2024. Multiple anomalies varied between 3.4–13.5% during 2015–2018 and 6.7–14.9% during 2019–2024. Suspected chromosomal abnormalities ranged between 2.0% and 10.5%, with the highest prevalence in 2015 (8.8%) and 2018 (8.1%). Regarding neural tube defect (NTD) subtypes, spina bifida was the most frequent (51.0%; n = 151), followed by anencephaly (34.8%; n = 103) and encephalocele (13.2%; n = 39). Iniencephaly, a rare form, was identified in three cases (1.0%). In three additional cases, the NTD subtype could not be determined. In total, 296 cases were classified as NTD, with approximately half of these being spina bifida (Figure 3). No significant association was found between NTDs and maternal BMI, as 71.2% of mothers with NTD-affected fetuses had overweight or obese BMI compared with 69.8% of those without NTDs (p> 0.05). All cases of iniencephaly, 97.1% of anencephaly, and 69.2% of encephalocele were terminated early. In contrast, 49% of spina bifida cases were delivered at ≥36 weeks of gestation.
The patients were stratified into two groups according to gestational age. Among 397 pregnancies below 24 weeks with available survival data, only four cases (1.0%) resulted in live birth, while the remaining pregnancies were terminated due to family request or medical necessity. In contrast, among 507 pregnancies at ≥24 weeks, 51 cases (10.1%) resulted in stillbirth, whereas 456 (89.9%) were born alive (Figure 4).
In pregnancies beyond 24 weeks, survival rates were assessed according to maternal and fetal variables. No statistically significant difference was observed between maternal age groups (p = 0.144). Among live births, 33.1% occurred in mothers <25 years, 51.8% in those aged 25–35 years, and 15.1% in those >35 years. Among stillbirths, 19.6% occurred in women <25 years, 62.7% in those aged 25–35 years, and 17.6% in those >35 years. Mode of delivery showed a significant association with survival (p <0.001). Of live births, 86.6% were delivered by caesarean section and 13.4% by vaginal delivery. In contrast, among stillbirths, caesarean section and vaginal delivery each accounted for 49.0%, and therapeutic abortion was observed exclusively in this group (2.0%). Gestational age was also significantly related to survival (p <0.001). While 62.5% of live births occurred between 37–41 weeks, 94.1% of stillbirths occurred between 24–36 weeks. Birth weight demonstrated a strong correlation with outcome (p <0.001). Normal birth weight was present in 67.8% of live births, whereas stillbirths were most frequent in cases of extremely low birth weight (36.0%) and very low birth weight (34.0%). Regarding fetal sex, 51.1% of live births were male, while 62.7% of stillbirths were female; however, this difference did not reach statistical significance (p = 0.061) (Table 6).
When the survival rate was analysed according to the type of anomaly in pregnancies over 24 weeks, it was observed that live births were most commonly associated with urinary system anomalies (62.0%), followed by cardiac anomalies (16.4%) and CNS anomalies (37.3%). The most common groups in stillbirths were CNS anomalies (39.2%) and urinary anomalies (38.0%), while multiple anomalies (19.6%) and cystic hygroma (17.6%) were observed at significantly higher rates compared to live births. Facial anomalies, thoracic anomalies and gastrointestinal anomalies were observed only in live births, whereas abdominal wall anomalies, musculoskeletal anomalies and genital anomalies were found at similar rates in both groups. In general, a significant correlation was found between the type of anomaly and survival (p <0.001). When the distribution according to the year of birth was analysed, it was observed that the live birth rate was the highest in 2015 with 25.2% and gradually decreased in the following years. The highest rate of stillbirths was observed in 2020, with 17.6%. The differences in survival rates according to years were found to be statistically significant (p = 0.002) (Table 7).
According to the correlation analysis, significant positive associations were observed between history of abortion and maternal age, gravida, and parity. Although the correlation between abortion and maternal age was weak, it remained statistically significant (r = 0.271; p <0.001). A strong positive correlation was found between gravida and abortion (r = 0.627; p <0.001), suggesting that a higher number of pregnancies increases the likelihood of abortion. The correlation between parity and abortion was low but significant (r = 0.284; p <0.001). These findings indicate that the risk of abortion tends to rise with maternal obstetric history (Table 8). In addition, a significant negative correlation was identified between gestational age and the occurrence of cystic hygroma (r = –0.247; p <0.001).
In univariate analysis, gestational age, fetal birth weight, maternal BMI, and low birth weight were significantly associated with survival. Increasing gestational age markedly improved survival (B = –0.411, p < 0.001, OR = 0.663, 95% CI: 0.606–0.726). Similarly, higher fetal birth weight was positively correlated with survival (B = –0.002, p < 0.001, OR = 0.998, 95% CI: 0.998–0.999). Elevated maternal BMI was negatively associated with survival (B = 0.170, p = 0.034, OR = 0.844, 95% CI: 0.721–0.987). Low birth weight emerged as a strong risk factor, reducing survival by nearly 13-fold (B = 2.580, p < 0.001, OR = 13.193, 95% CI: 6.040–28.819). Maternal age, gravida, parity, miscarriage history, duration of hospital stay, fetal sex, and the presence of neural tube defects did not show statistically significant associations with survival (p > 0.05). In multivariate analysis, only gestational age remained an independent predictor of survival (B = –0.296, p = 0.048, OR = 0.744, 95% CI: 0.555–0.997). Fetal birth weight (B = –0.001, p = 0.085) and maternal BMI (B = 0.113, p = 0.323) lost significance in the adjusted model, and low birth weight (B = –0.310, p = 0.857) was not confirmed as an independent risk factor (Table 9).
4. Discussion
Congenital anomalies remain a major public health concern due to their contribution to infant morbidity and mortality. In our cohort, central nervous system (CNS) anomalies were the most common, and survival was strongly associated with gestational age, underscoring the multifactorial nature of mortality risk.
Demographic Characteristics
In our series, most mothers were under 35 years, with a considerable proportion younger than 25. Overweight and obesity were predominant, similar to reports from Libya and Morocco, while other studies from Ghana, Lebanon, and Iran also confirmed young maternal age and male predominance among affected newborns [16,17,18,19,20]. Although low birth weight has been linked to anomalies in some reports [21], our data showed a predominance of extremely low birth weight, mainly due to early terminations. Unlike previous evidence associating maternal obesity with neural tube defects [23,24,25,26,27], no significant relationship was observed in our study, possibly due to the retrospective design, missing BMI data, and an overweight-dominant cohort.
Types of Congenital Anomalies
Consistent with international studies, CNS anomalies were the leading group, followed by cystic hygroma, cardiac, and urinary anomalies. Neural tube defects, particularly spina bifida, were highly prevalent, reflecting possible nutritional and antenatal care factors in the region. While other studies reported higher frequencies of musculoskeletal and chromosomal anomalies [18,19,20,21], our series demonstrated a lower rate, supporting the regional specificity of anomaly patterns. The higher prevalence in our hospital (7.3%) compared with literature values is attributed to its role as a tertiary referral center and does not reflect true population prevalence [22,28].
Factors Associated with Survival and Mortality
Survival improved significantly with advancing gestational age, exceeding 98% in term pregnancies, in line with previous findings [16,18,19,20,21]. Multiple anomalies and cystic hygroma were associated with the highest mortality, while gastrointestinal and thoracic anomalies showed favorable outcomes. Although caesarean delivery appeared linked to higher survival, this likely reflects its indication in viable cases rather than a causal relationship. Lower survival during 2019–2022 may be partly explained by increased pregnancy terminations during the COVID-19 pandemic.
Public Health and Preventive Effects
Our findings highlight the urgent need for preventive strategies, particularly periconceptional folic acid supplementation, nutritional counseling, and expanded antenatal screening in Southeastern Turkey. Region-specific factors such as consanguineous marriage [18,21] and limited access to diagnostic tools must also be addressed. The identification of gestational age and neural tube defects as independent prognostic factors underscores the importance of early detection and targeted perinatal management.
5. Conclusion
Our findings provide comprehensive, long-term epidemiological data on congenital anomalies in south-eastern Turkey, revealing a predominance of central nervous system anomalies, especially neural tube defects. In this large retrospective cohort, survival outcomes of foetuses with congenital anomalies were primarily defined by gestational age as an independent risk factor. Survival rates varied according to anomaly type and year of birth, but improved markedly with advancing gestational age and normal birth weight. These findings highlight the critical role of early diagnosis, optimised antenatal care and perinatal management strategies in improving survival in regions with a high prevalence of congenital anomalies. We recommend the implementation of region-wide pre-conception folic acid supplementation programmes, expansion of antenatal screening services focusing on the detection of high-risk anomalies, and the establishment of a regional congenital anomaly registry. It is also crucial to address modifiable maternal risk factors such as overweight and obesity through integrated nutrition counselling in reproductive health services. Furthermore, improved access to advanced prenatal diagnostic tools as well as culturally tailored interventions addressing blood-based marriages are critical to reduce the incidence and severity of congenital anomalies in this high-risk region.
Author Contributions
Resources, Ronahi Polat, Reyhan Gündüz, Mehmet Sait İçen, İsmail Yıldız and Mehmet Sıddık Evsen; Writing – review & editing, Senem Yaman Tunç.
Funding
This research received no external funding
Institutional Review Board Statement
The study protocol was approved by the Ethics Committee of Dicle University Faculty of Medicine (Approval No: 306, Date: 17/09/2025).
Informed Consent Statement
Owing to the retrospective design, informed consent was not required
Data Availability Statement
The data presented in this study are available on request from the corresponding author. (please specify the reason for restriction, e.g., the data are not publicly available due to privacy or ethical restrictions.)
References
- World Health Organization (WHO). (2021). Primary health care approaches for prevention and control of congenital and genetic disorders : report of a WHO meeting, Cairo, Egypt, 6–8 December 1999. Retrieved November 21, 2021, from https:// apps. who.int/ iris/ handle/ 10665/ 66571.
- World Health Organization. Congenital anomalies [Internet]. Geneva: World Health Organization; [cited 2025 Aug 6]. Available from: https://www.who.int/health-topics/congenital-anomalies#tab=tab_1.
- Bashir M., Javed J., Ameer R., Khan R., & Khan H. Frequency and pattern of git anomalies in neonates: a retrospective study at nicu mayo hospital lahore. PJMHS 2022;16(5):937-938. [CrossRef]
- Khoshnood B. , Greenlees R. , Loane M. , & Dolk H. Paper 2: eurocat public health indicators for congenital anomalies in europe. Birth Defects Research Part A: Clinical and Molecular Teratology 2011;91(S1). [CrossRef]
- Bhide P., Gund P., & Kar A. Prevalence of congenital anomalies in an indian maternal cohort: healthcare, prevention, and surveillance implications. Plos One 2016;11(11):e0166408. [CrossRef]
- Alahakoon A., Ratnayake C., Karunakaran K., & Tennakoon S. Do anomalous stillbirths have risk to be delivered preterm? a cross-sectional study conducted in kandy, sri lanka. 2021. [CrossRef]
- Kapurubandara S, Melov SJ, Shalou ER, Mukerji M, Yim S, Rao U, et al. A perinatal review of singleton stillbirths in an Australian metropolitan tertiary centre. PLoS One. 2017;12(2):e0171829. [CrossRef]
- Yudiasari P., Pramatirta A., & Gondodiputro S. Suspectable risk factors of congenital anomaly in dr. hasan sadikin general hospital bandung, indonesia. Althea Medical Journal 2017;4(2):257-260. [CrossRef]
- Self L., Dagenais L., & Shevell M. Congenital non-central nervous system malformations in cerebral palsy: a distinct subset?. Developmental Medicine & Child Neurology 2012;54(8):748-752. [CrossRef]
- Boyle B., Addor M., Arriola L., Barišić I., Bianchi F., Csáky-Szunyogh M.et al. Estimating global burden of disease due to congenital anomaly: an analysis of european data. Archives of Disease in Childhood - Fetal and Neonatal Edition 2017;103(1):F22-F28. [CrossRef]
- Sheridan E. , Wright J. , Small N. , Corry P. , Oddie S. , Whibley C. et al. Risk factors for congenital anomaly in a multiethnic birth cohort: an analysis of the born in bradford study. The Lancet 2013;382(9901):1350-1359. [CrossRef]
- Sallout, B., Obedat, N., Shakeel, F., Mansoor, A., Walker, M., & Al-Badr, A. (2015). Prevalence of major congenital anomalies at king fahad medical city in saudi arabia: a tertiary care centre-based study. Annals of Saudi Medicine, 35(5), 343-351. [CrossRef]
- Dolk H, Loane M, Garne E. The prevalence of congenital anomalies in Europe. Adv Exp Med Biol. 2010;686:349–64. PMID: 20824455. [CrossRef]
- Goldsmith S. , McIntyre S. , Hansen M. , & Badawi N. Congenital anomalies in children with cerebral palsy: a systematic review. Journal of Child Neurology 2019;34(12):720-727. [CrossRef]
- Atkinson D., Amin F., Russell S., & D’Souza S. Fetal congenital anomalies diagnosed by ultrasound in asian and non-asian women. Journal of Obstetrics and Gynaecology 2008;28(7):678-682. [CrossRef]
- Anane-Fenin B, Opoku DA, Chauke L. Prevalence, pattern, and outcome of congenital anomalies admitted to a neonatal unit in a low-income country—a ten-year retrospective study. Matern Child Health J. 2023;27(6):837–849. [CrossRef]
- Zedan A, El-Sayed H, Sanfaz SMF. Frequency of Congenital Malformation in Neonatal Intensive Care Unit in Benghazi–Libya. Zagazig Univ Med J. 2020;26(1):148–155. [CrossRef]
- Rizk F, Salameh P, Hamadé A. Congenital anomalies: prevalence and risk factors. Univ J Public Health. 2014;2(2):58–63. [CrossRef]
- Mashhadi Abdolahi H, Kargar Maher MH, Afsharnia F, Dastgiri S. Prevalence of congenital anomalies: a community-based study in the northwest of Iran. ISRN Pediatr. 2014;2014:920940. [CrossRef]
- Elghanmi A, Razine R, Jou M, Berrada R. Congenital malformations among newborns in Morocco: A retrospective study. Pediatr Rep. 2020;12(1):7405. [CrossRef]
- El Koumi MA, Al Banna EA, Lebda I. Pattern of congenital anomalies in newborn: a hospital-based study. Pediatr Rep. 2013;5(1):e5. [CrossRef]
- Luo P, Li Q, Yan B, Xiong Y, Li T, Ding X and Mei B (2024) Prevalence, characteristics and risk factors of birth defects in central China livebirths, 2015–2022. Front. Public Health 12:1341378.
- Rasmussen, S. A., Chu, S. Y., Kim, S. Y., Schmid, C. H., & Lau, J. (2008). Maternal obesity and risk of neural tube defects: a metaanalysis. American journal of obstetrics and gynecology, 198(6), 611-619.
- Davidoff MJ, Petrini J, Damus K, Russell RB, Mattison D. Neural tube defect-specific infant mortality in the United States. Teratology 2002;66(suppl):S17-22.
- Ouyang L, Grosse SD, Armour BS, Waitzman NJ. Health care expenditures of children and adults with spina bifida in a privately insured US population. Birth Defects Res A Clin Mol Teratol 2007;79:552-8.
- Petterson B, Bourke J, Leonard H, Jacoby P, Bower C. Co-occurrence of birth defects and intellectual disability. Paediatr Perinat Epidemiol 2007;21:65-75.
- Oakeshott P, Hunt GM. Long-term outcome in open spina bifida. Br J Gen Pract 2003; 53:632-6.
- De La Vega A, Lopez-Cepero R. Seasonal variations in the incidence of some congenital anomalies in Puerto Rico based on the timing of conception. P R Health Sci J. 2009;28(2):121–6.
Figure 1.
Fetal birth weight grouping.
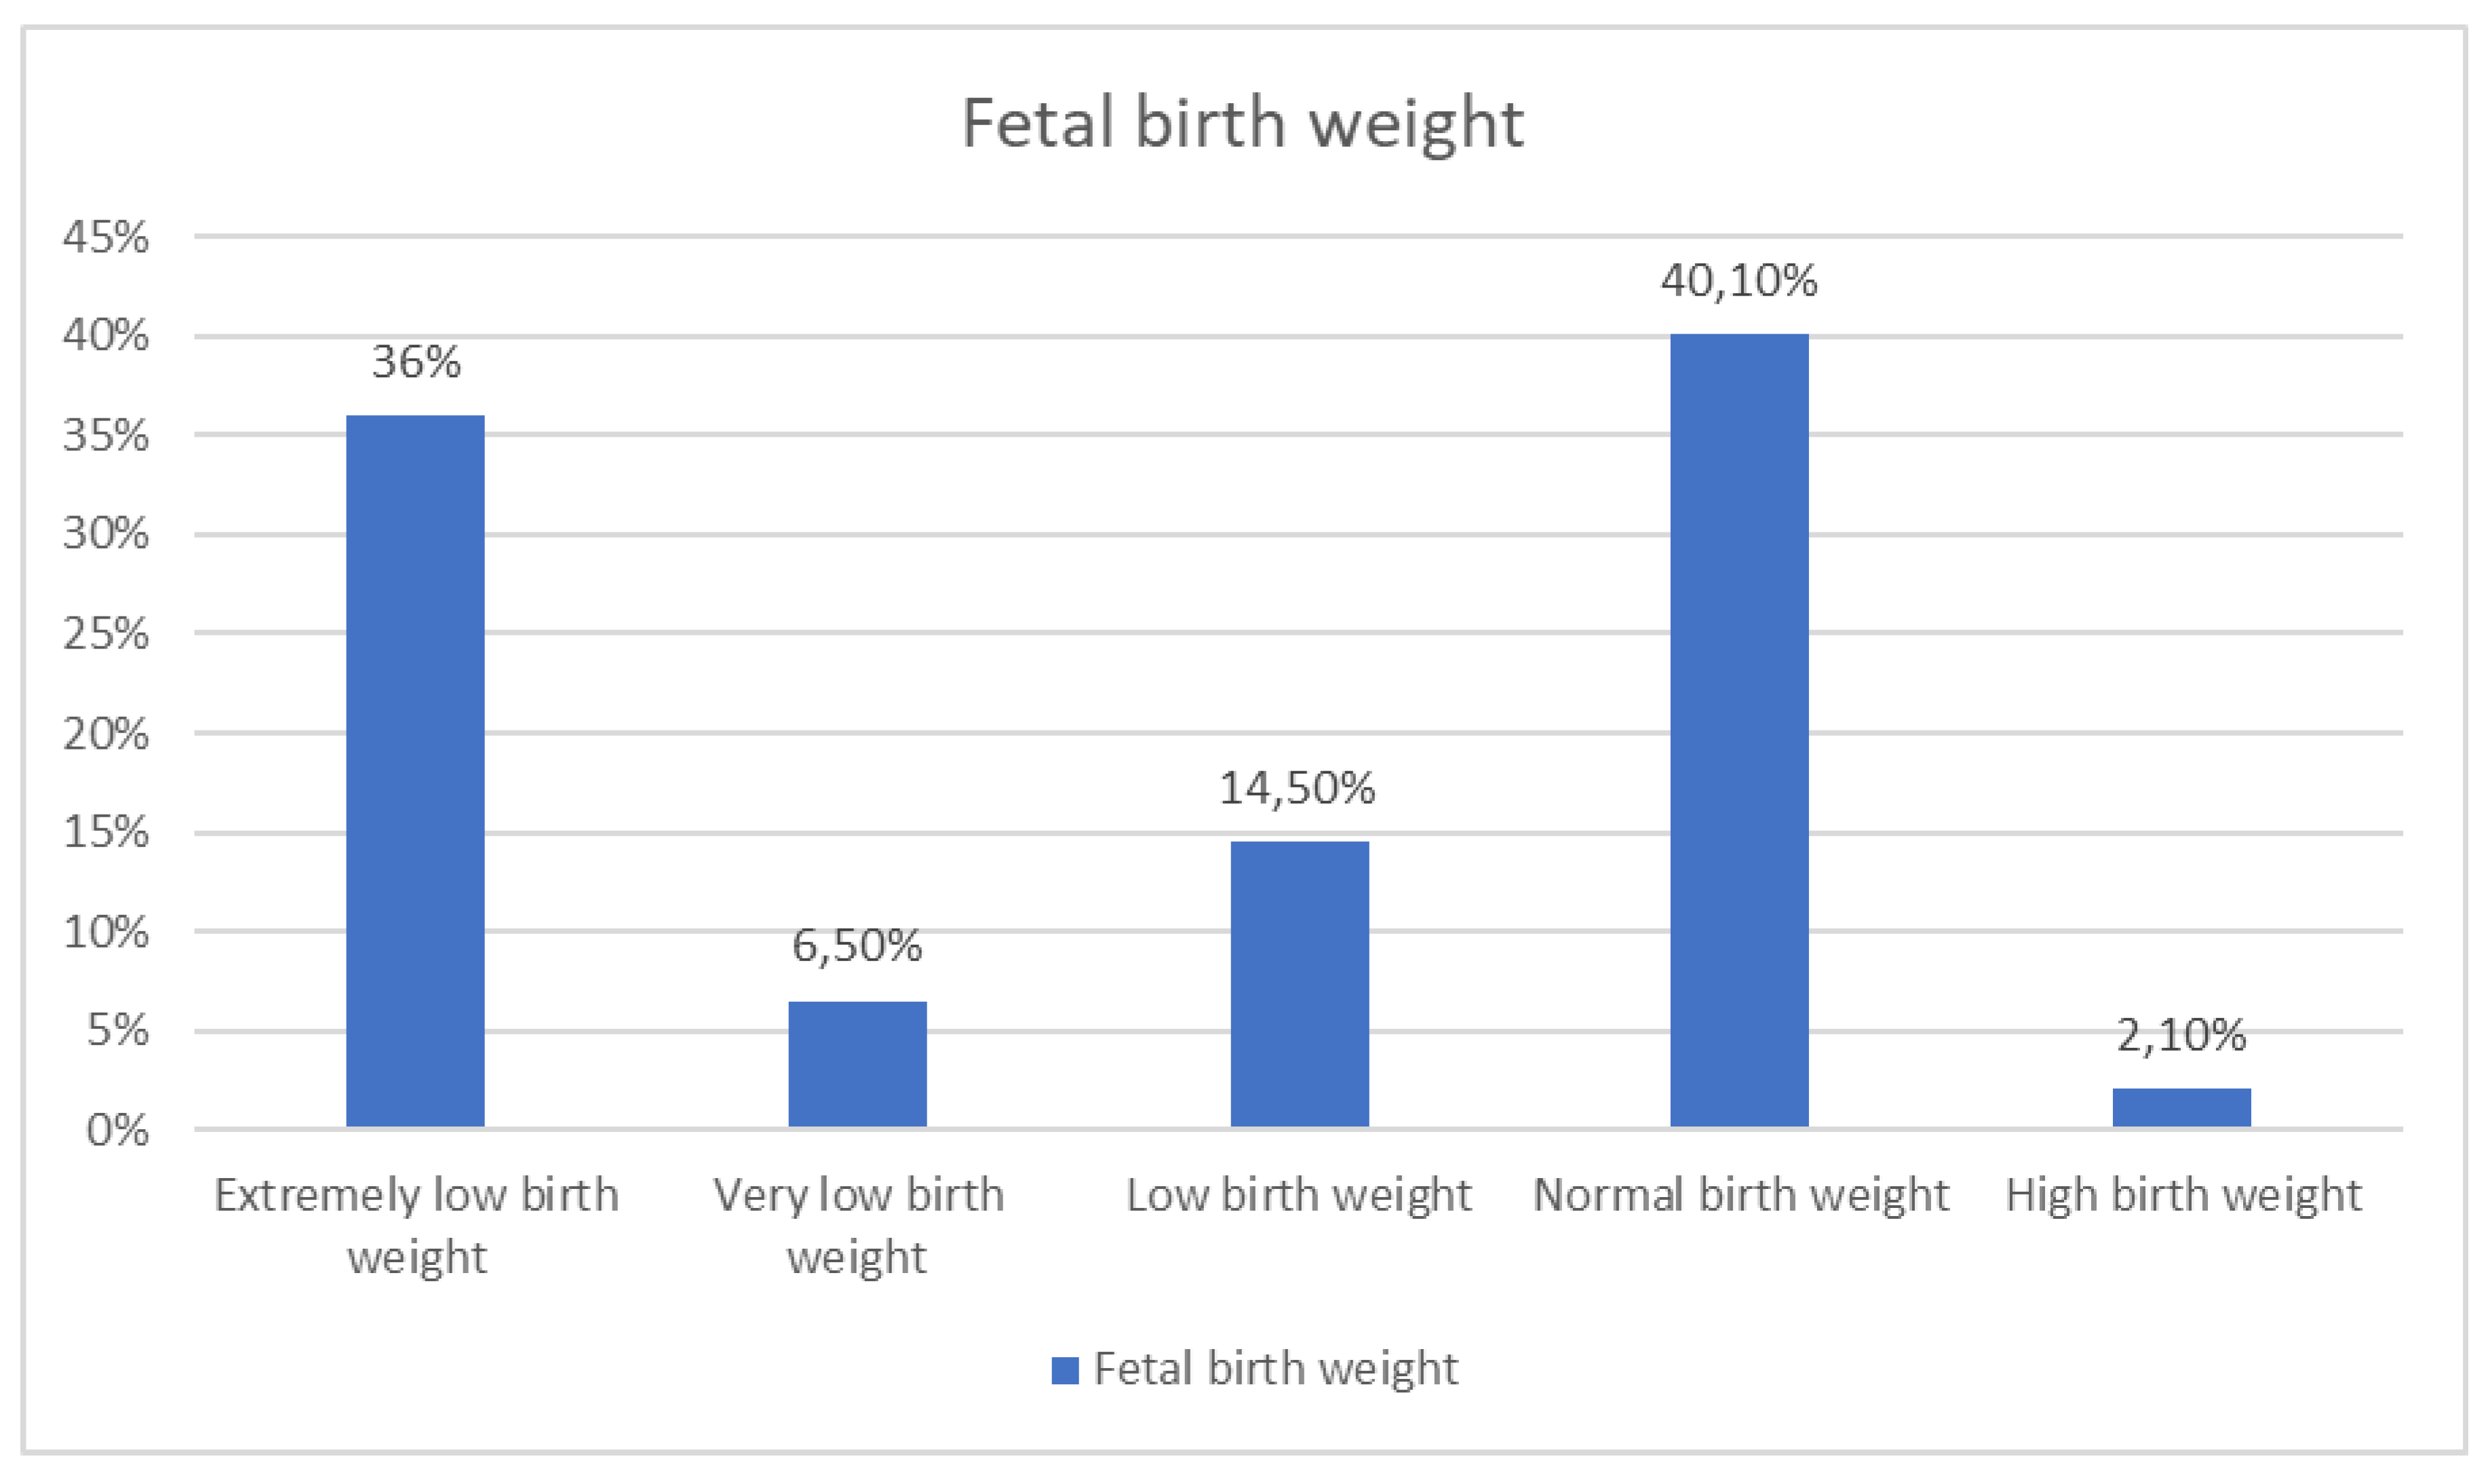
Figure 2.
Years of birth of babies with anomalies.
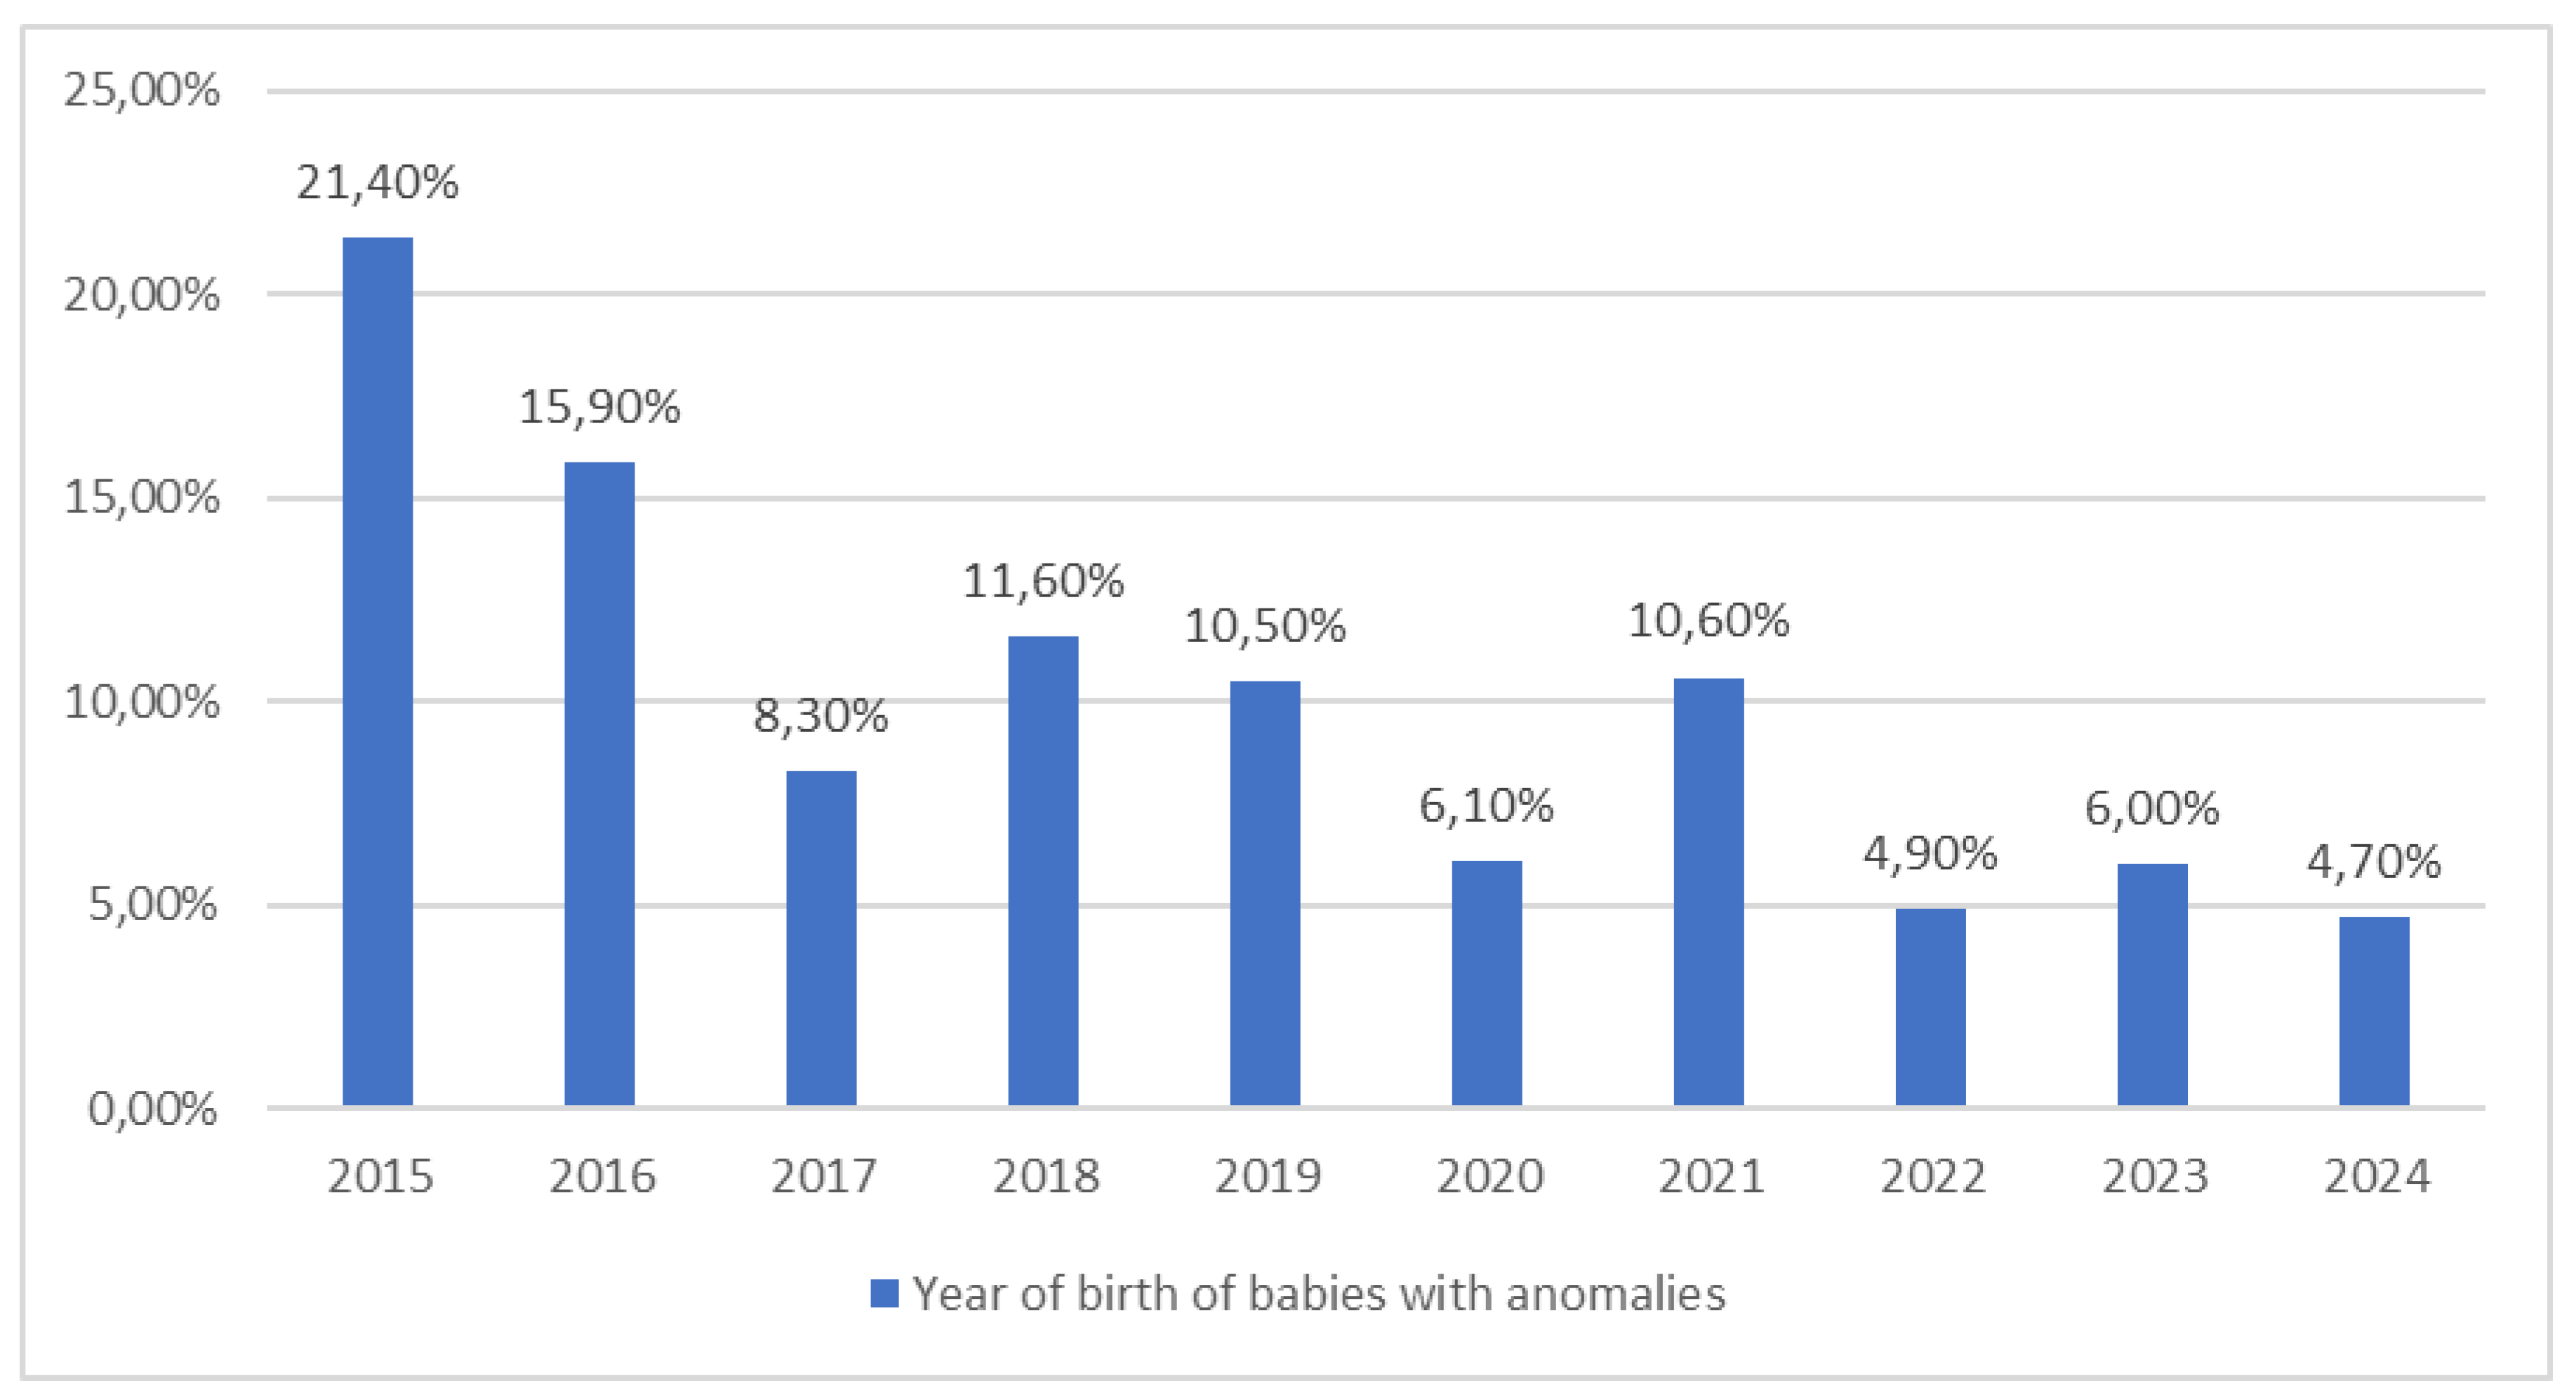
Figure 3.
NTD species detected.
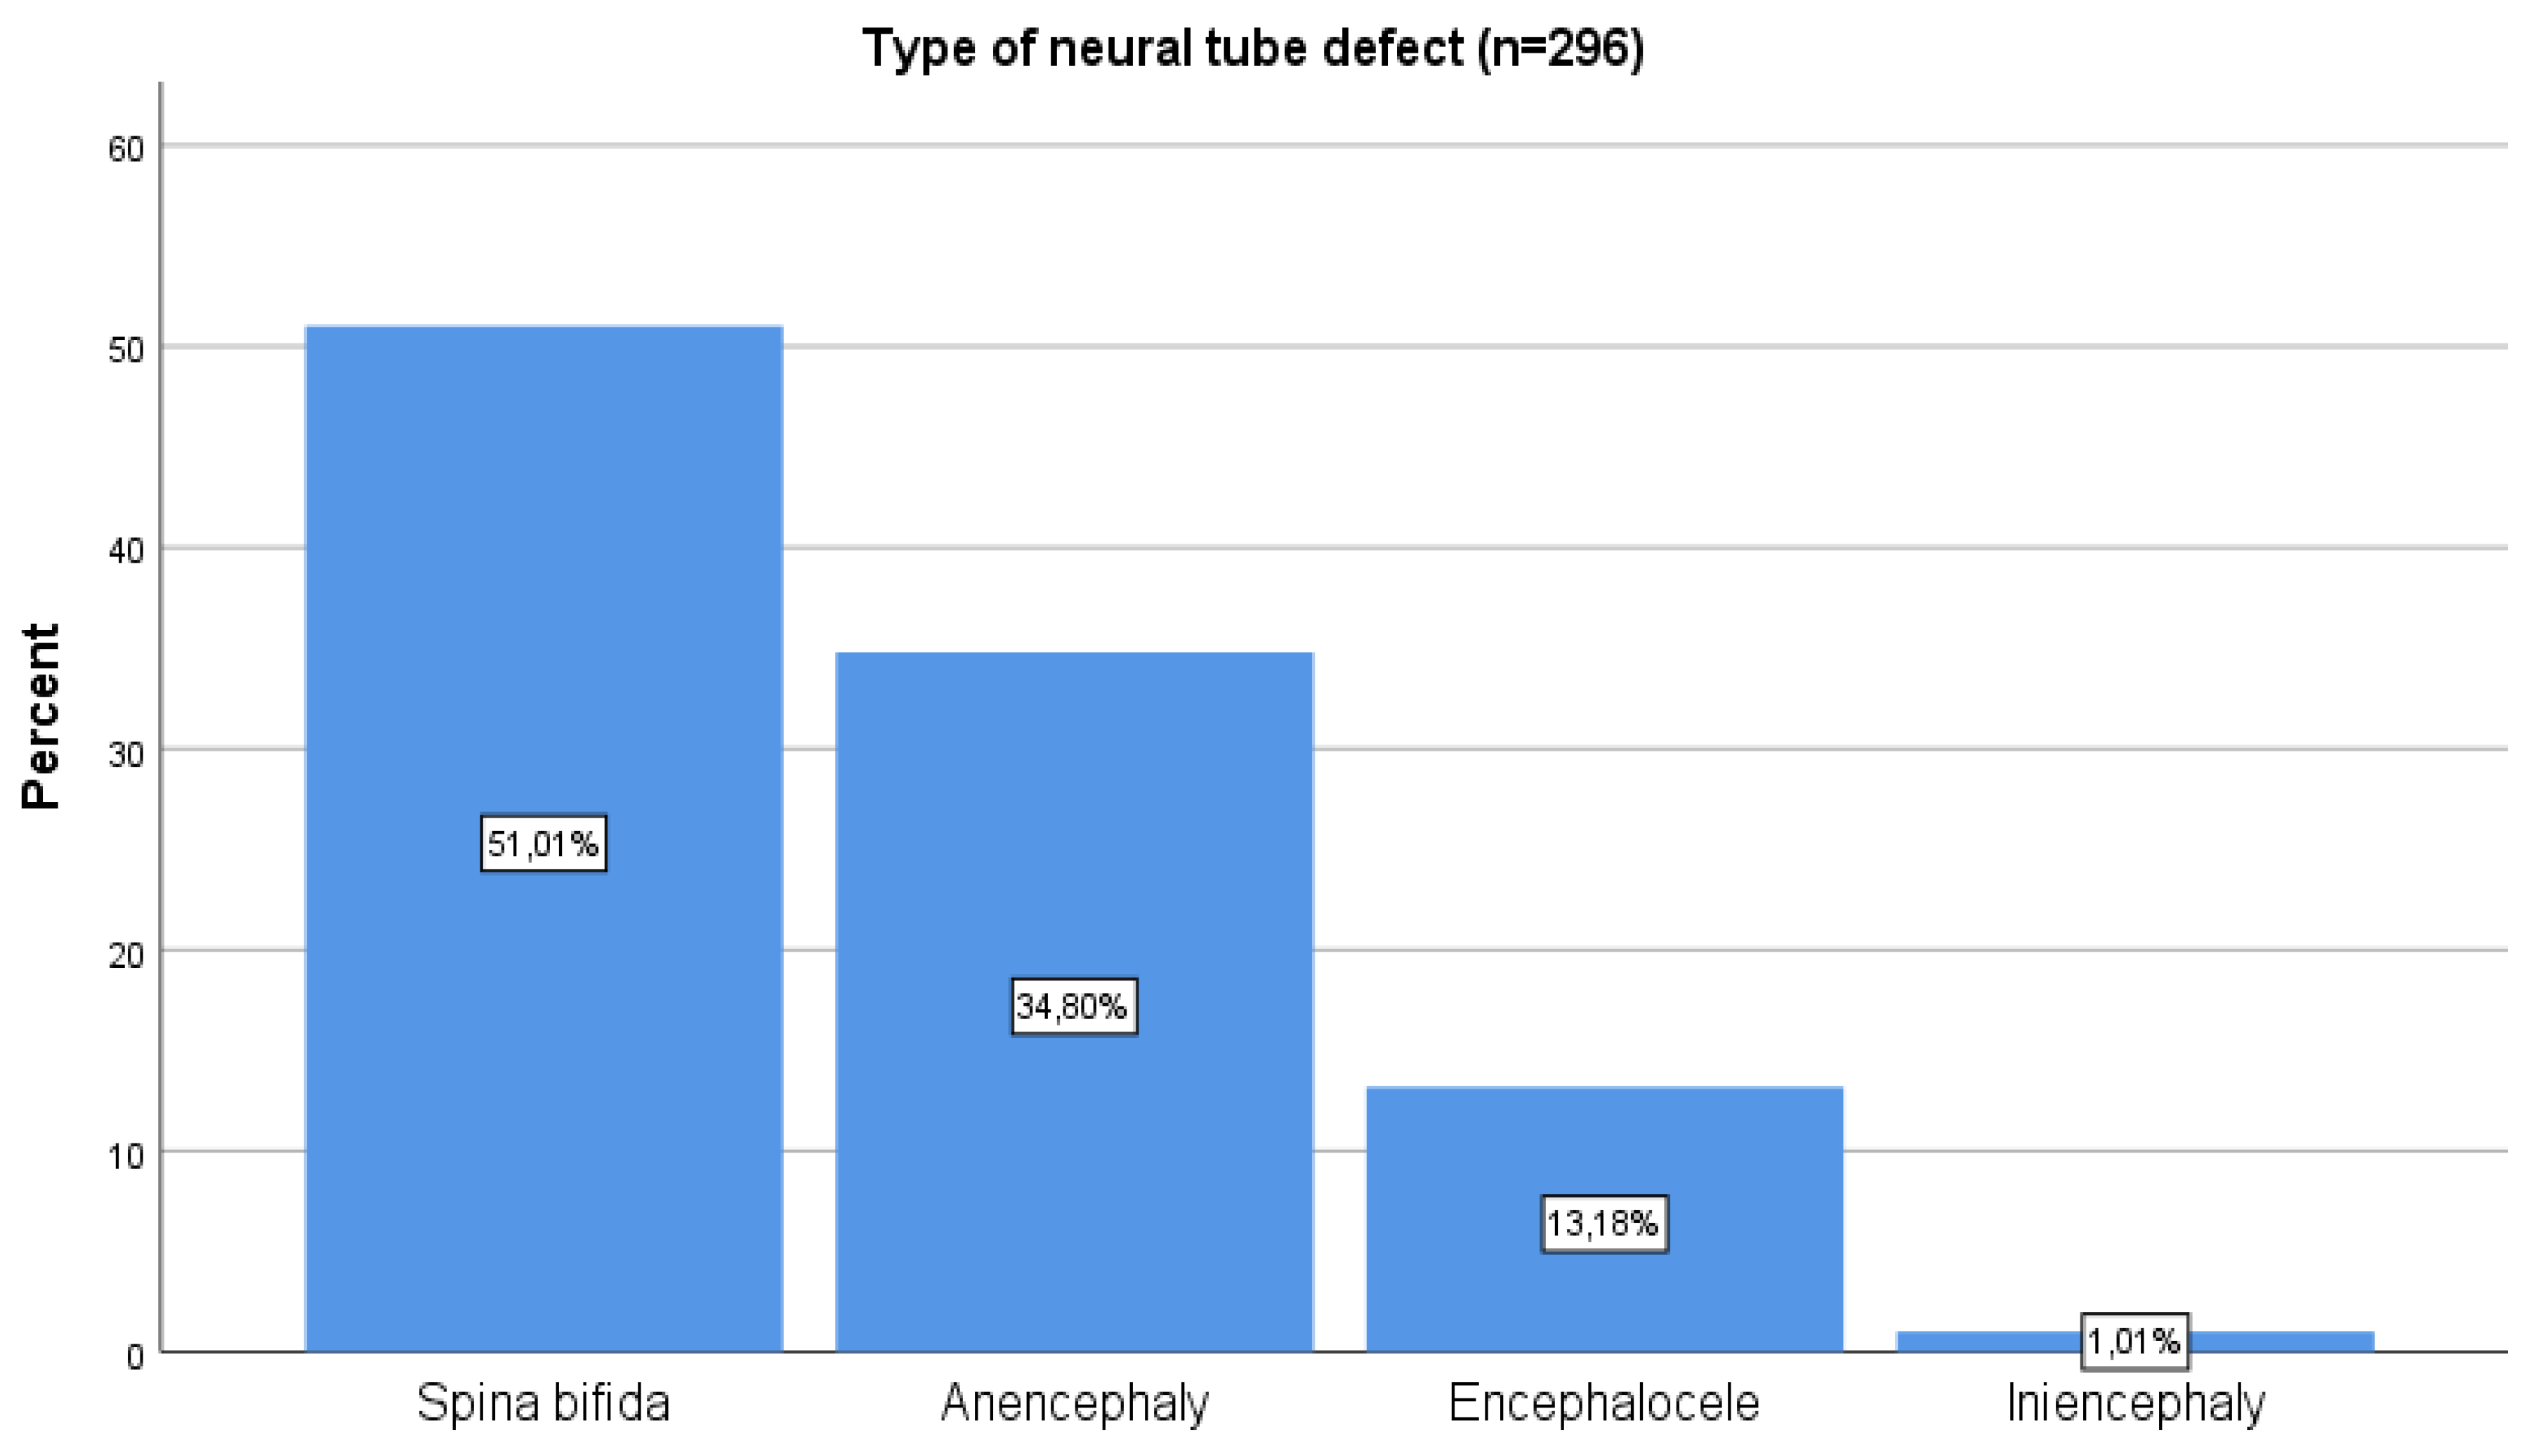
Figure 4.
Survival rates.
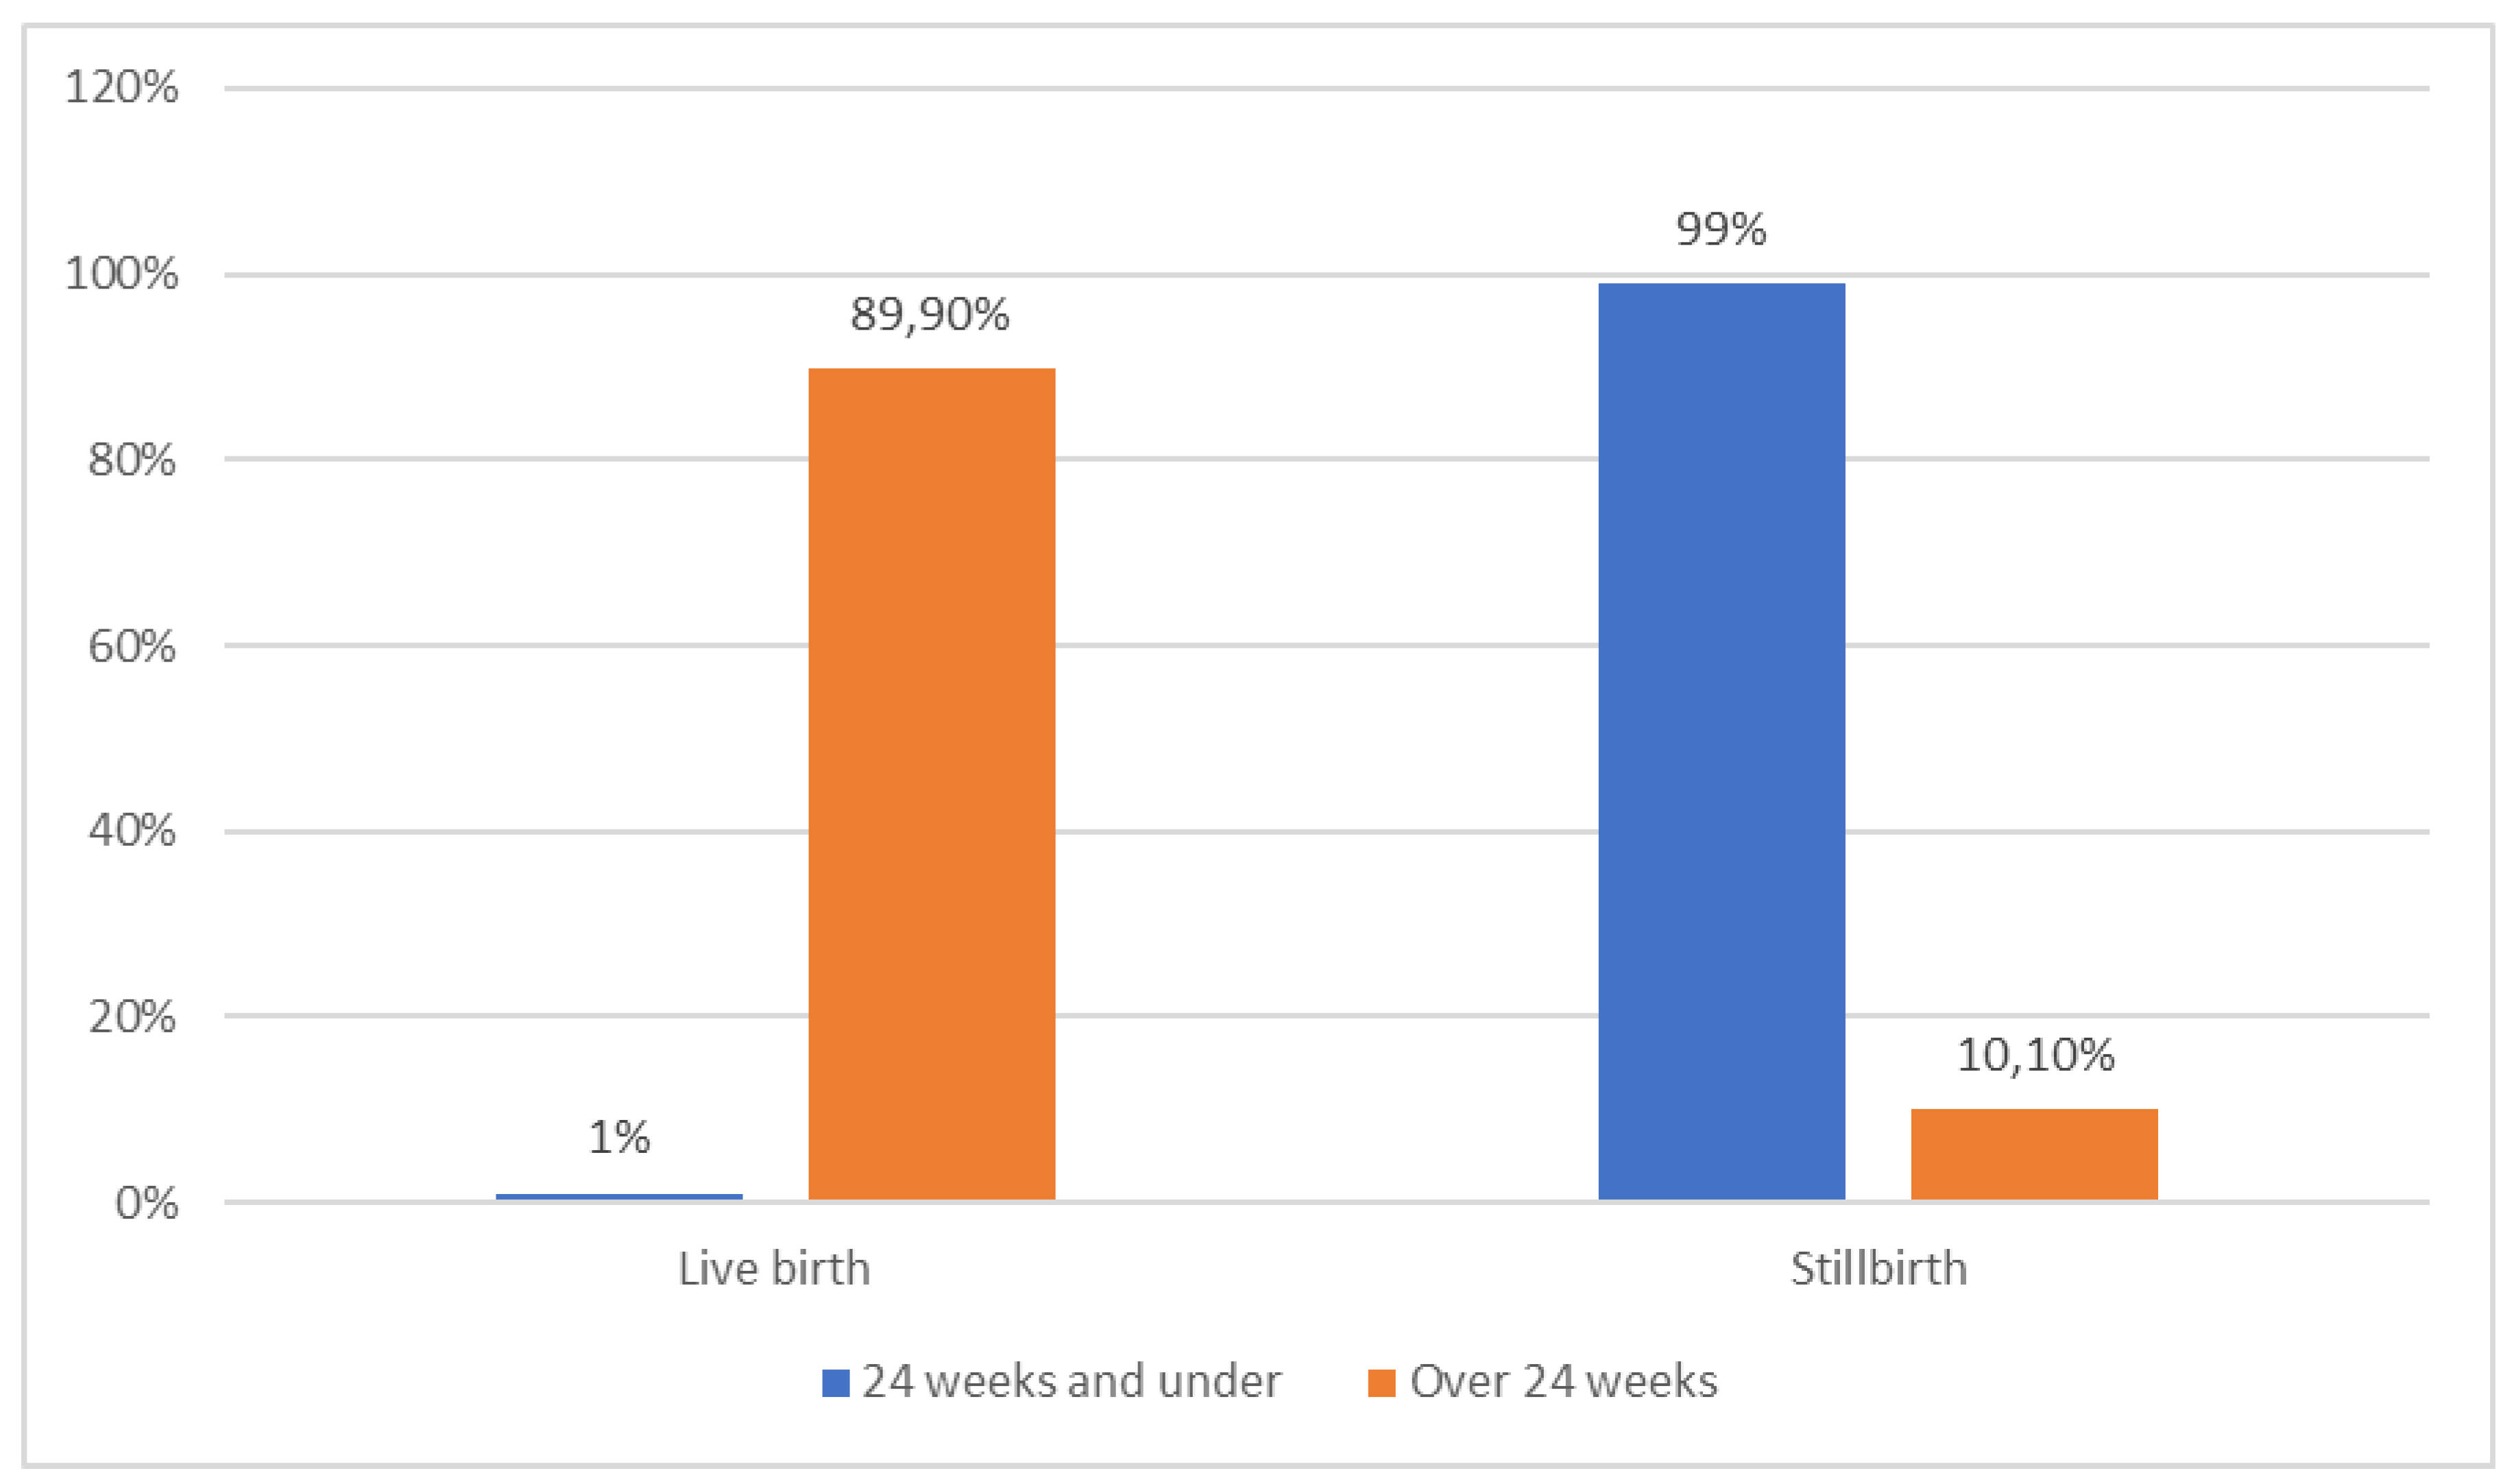

Table 1.
Maternal and fetal demographic characteristics.
| n | % | ||
|---|---|---|---|
| Maternal age (n=956) | Under 25 years old | 379 | 39,6 |
| 25-35 years | 332 | 34,7 | |
| Over 35 years old | 245 | 25,6 | |
|
Pregnancy week (n=951) |
Under 24 weeks | 415 | 43,6 |
| 24-36 weeks | 239 | 25,1 | |
| 37-41 weeks | 293 | 30,8 | |
| 42 weeks and over | 4 | 0,4 | |
|
Maternal BMI (n=295) |
Underweight (<18.5 kg/m2) | 6 | 2,0 |
| Normal (18.5-24.9 kg/m2) | 81 | 27,5 | |
| Overweight (25-29.9 kg/m2) | 134 | 45,4 | |
| Obese (≥30 kg/m2) | 74 | 25,1 | |
|
Maternal comorbidities (n=557) |
None | 488 | 87,6 |
| Diabetes Mellitus | 8 | 1,4 | |
| Thyroid function disorders | 6 | 1,1 | |
| Anaemia | 13 | 2,3 | |
| Cardiac diseases | 5 | 0,9 | |
| Hypertension | 18 | 3,2 | |
| Other | 19 | 3,4 | |
| Mode of delivery (n=895) | Normal birth | 138 | 15,4 |
| Caesarean section | 433 | 43,4 | |
| Therapeutic abortion | 315 | 35,2 | |
| Hysterotomy | 9 | 1,0 | |
| Fetal sex (n=764) | Girl | 354 | 46,3 |
| Male | 398 | 52,1 | |
| Undetectable | 12 | 1,6 | |
Table 2.
City distribution of the detected anomalies.
| n | % | ||
|---|---|---|---|
| City | Diyarbakır | 298 | 31,5% |
| Mardin | 204 | 21,6% | |
| Şırnak | 177 | 18,7% | |
| Batman | 76 | 8,0% | |
| Siirt | 36 | 3,8% | |
| Urfa | 30 | 3,2% | |
| Bitlis | 24 | 2,5% | |
| Bingöl | 20 | 2,1% | |
| Muş | 18 | 1,9% | |
| Syrian refugee | 32 | 3,4% | |
| Others | 31 | 3,3% | |
Table 3.
Detected anomalies.
| n | % | ||
|---|---|---|---|
| Anomalous types (n=951) | CNS anomalies | 423 | 44,2 |
| Facial anomalies | 4 | 0,4 | |
| Musculoskeletal anomalies | 30 | 3,1 | |
| Cardiac anomalies | 90 | 9,4 | |
| Abdominal wall anomalies | 23 | 2,4 | |
| Thoracic anomalies | 27 | 2,8 | |
| Urinary anomalies | 83 | 8,7 | |
| Genital anomalies | 1 | 0,1 | |
| Gastrointestinal system anomalies | 46 | 4,8 | |
| Suspected chromosomal abnormalities | 41 | 4,3 | |
| Multiple anomalies | 85 | 8,9 | |
| Cystic hygroma | 98 | 10,3 | |
| Neural tube defect (n=939) | Yes | 299 | 31,8 |
| No | 640 | 68,2 | |
Table 4.
Distribution of common anomalies according to cities.
| Anomalous types | ||||||||||||
|---|---|---|---|---|---|---|---|---|---|---|---|---|
| CNS | Cardiac | Urinary | Multiple | Cystic hygroma | Neural tube defect | |||||||
| n | % | n | % | n | % | n | % | n | % | n | % | |
| Diyarbakır | 91 | 23,4 | 40 | 44,4 | 30 | 35,7 | 33 | 40,2 | 39 | 33,6 | 63 | 21,1 |
| Mardin | 86 | 22,1 | 19 | 21,1 | 18 | 21,4 | 16 | 19,5 | 30 | 25,9 | 62 | 20,7 |
| Şırnak | 102 | 26,2 | 6 | 6,7 | 10 | 11,9 | 10 | 12,2 | 18 | 15,5 | 91 | 30,4 |
| Batman | 25 | 6,4 | 8 | 8,9 | 7 | 8,3 | 10 | 12,2 | 9 | 7,8 | 16 | 5,4 |
| Siirt | 16 | 4,1 | 3 | 3,3 | 6 | 7,1 | 2 | 2,4 | 3 | 2,6 | 13 | 4,3 |
| Bingöl | 11 | 2,8 | 3 | 3,3 | 1 | 1,2 | 2 | 2,4 | 2 | 1,7 | 7 | 2,3 |
| Urfa | 13 | 3,3 | 6 | 6,7 | 2 | 2,4 | 0 | 0,0 | 2 | 1,7 | 10 | 3,3 |
| Bitlis | 11 | 2,8 | 2 | 2,2 | 4 | 4,8 | 0 | 0,0 | 2 | 1,7 | 10 | 3,3 |
| Muş | 7 | 1,8 | 0 | 0,0 | 3 | 3,6 | 5 | 6,1 | 1 | 0,9 | 4 | 1,3 |
| Syrian refugee | 18 | 4,6 | 1 | 1,1 | 0 | 0,0 | 1 | 1,2 | 6 | 5,2 | 15 | 5,0 |
| Others | 9 | 2,3 | 2 | 2,2 | 3 | 3,6 | 3 | 3,7 | 4 | 3,4 | 8 | 2,7 |
Table 5.
Maternal and fetal numerical data.
| Mean | Standard deviation | Median | |
|---|---|---|---|
| Age of mother (years) | 28.37 | 6.68 | 28.00 |
| Number of gravida | 3.62 | 2.59 | 3.00 |
| Number of parities | 2.03 | 2.10 | 2.00 |
| Number of abortions | 0.61 | 1.06 | 0.00 |
| Number of live births | 1.87 | 1.97 | 1.00 |
| Pregnancy week | 27.65 | 9.66 | 29.75 |
| Fetal weight (grams) | 1841.83 | 1305.15 | 2100.00 |
| Maternal BMI (kg/m2) | 27,48 | 4,42 | 27.20 |
| Length of hospital stay (days) | 2.60 | 1.23 | 2.00 |
Table 6.
Association of survival outcomes with maternal and fetal variables in pregnancies ≥24 weeks.
Table 6.
Association of survival outcomes with maternal and fetal variables in pregnancies ≥24 weeks.
| Survival | p | |||
|---|---|---|---|---|
| Live birth (%) | Stillbirth (%) | |||
| Maternal age | Under 25 years old | 33,1 | 19,6 |
0.144 |
| 25-35 years | 51,8 | 62,7 | ||
| Over 35 years old | 15,1 | 17,6 | ||
| Mode of delivery | Normal birth | 13,4 | 49,0 |
<0.001 |
| Caesarean section | 86,6 | 49,0 | ||
| Therapeutic abortion | 0,0 | 2,0 | ||
| Pregnancy week | 24-36 weeks | 36,6 | 94,1 |
<0.001 |
| 37-41 weeks | 62,5 | 5,9 | ||
| 42 weeks and over | 0,9 | 0,0 | ||
|
Fetal birth weight |
Extremely low birth weight | 1,3 | 36,0 |
<0.001 |
| Very low birth weight | 6,4 | 34,0 | ||
| Low birth weight | 21,9 | 14,0 | ||
| Normal birth weight | 67,8 | 10,0 | ||
| Excess birth weight | 2,6 | 6,0 | ||
| Fetal sex | Girl | 48,9 | 62,7 | 0.061 |
| Boy | 51,1 | 37,3 | ||
Table 7.
Survival rates according to anomaly type and year of birth in patients with gestation over 24 weeks.
Table 7.
Survival rates according to anomaly type and year of birth in patients with gestation over 24 weeks.
| Survival | p | |||
|---|---|---|---|---|
| Live birth (%) | Stillbirth (%) | |||
| Anomalous types | CNS anomalies | 37,3 | 39,2 | <0.001 |
| Facial anomalies | 0,9 | 0,0 | ||
| Musculoskeletal anomalies | 3,9 | 3,9 | ||
| Cardiac anomalies | 16,4 | 5,9 | ||
| Abdominal wall anomalies | 4,6 | 3,9 | ||
| Thoracic anomalies | 5,0 | 0,0 | ||
| Urinary anomalies | 62.0 | 38.0 | ||
| Genital anomalies | 10,5 | 7,8 | ||
| GIS anomalies | 5,9 | 0,0 | ||
| Suspected chromosomal abnormalities | 4,2 | 2,0 | ||
| Multiple anomalies | 4,8 | 19,6 | ||
| Cystic hygroma | 6,4 | 17,6 | ||
| Year of birth | 2015 | 25,2 | 19,6 | 0,002 |
| 2016 | 19,7 | 13,7 | ||
| 2017 | 11,0 | 15,7 | ||
| 2018 | 10,5 | 13,7 | ||
| 2019 | 6,8 | 5,9 | ||
| 2020 | 3,5 | 17,6 | ||
| 2021 | 7,7 | 3,9 | ||
| 2022 | 3,7 | 5,9 | ||
| 2023 | 5,7 | 3,9 | ||
| 2024 | 6,1 | 0,0 | ||
Table 8.
Correlation of number of abortions with maternal age and obstetric history.
| Number of abortions | ||
|---|---|---|
| Maternal age | r | 0,271 |
| p | <0,001 | |
| Gravida | r | 0,627 |
| p | <0,001 | |
| Parities | r | 0,284 |
| p | <0,001 | |
Table 9.
Analyses of the factors affecting survival in patients with pregnancy over 24 weeks.
| Survival regression analysis | ||||||||||
|---|---|---|---|---|---|---|---|---|---|---|
| Univariate analysis | Multivariate analysis | |||||||||
| B | p |
Exp (B) |
95.0% Confidence Interval for B |
B |
p |
Exp (B) |
95.0% Confidence Interval for B | |||
| Lower Bound | Upper Bound | Lower Bound | Upper Bound | |||||||
| Age of mother | 0,035 | 0,122 | 1,035 | 0,991 | 1,082 | |||||
| Number of gravida | 0,045 | 0,395 | 1,046 | 0,942 | 1,162 | |||||
| Number of parities | 0,045 | 0,501 | 1,046 | 0,917 | 1,194 | |||||
| Number of abortions | 0,094 | 0,435 | 1,098 | 0,868 | 1,391 | |||||
| Pregnancy week | -0,411 | <0,001 | 0,663 | 0,606 | 0,726 | -0,296 | 0,048 | 0,744 | 0,555 | 0,997 |
| Fetal birth weight | -0,002 | <0,001 | 0,998 | 0,998 | 0,999 | -0,001 | 0,085 | 0,999 | 0,997 | 1,000 |
| Maternal BMI | 0,170 | 0,034 | 0,844 | 0,721 | 0,987 | 0,113 | 0,323 | 0,893 | 0,714 | 1,118 |
| Length of hospital stay | 0,033 | 0,783 | 1,034 | 0,817 | 1,308 | |||||
| Fetal sex (girl) | -0,565 | 0,063 | 0,568 | 0,313 | 1,032 | |||||
| Fetal birth weight (low) | 2,580 | <0,001 | 13,193 | 6,040 | 28,819 | -0,310 | 0,857 | 0,734 | 0,026 | 21,101 |
| Neural tube defect (present) | -0,574 | 0,068 | 0,563 | 0,304 | 1,043 | |||||
Disclaimer/Publisher’s Note: The statements, opinions and data contained in all publications are solely those of the individual author(s) and contributor(s) and not of MDPI and/or the editor(s). MDPI and/or the editor(s) disclaim responsibility for any injury to people or property resulting from any ideas, methods, instructions or products referred to in the content. |
© 2025 by the authors. Licensee MDPI, Basel, Switzerland. This article is an open access article distributed under the terms and conditions of the Creative Commons Attribution (CC BY) license (http://creativecommons.org/licenses/by/4.0/).
Copyright: This open access article is published under a Creative Commons CC BY 4.0 license, which permit the free download, distribution, and reuse, provided that the author and preprint are cited in any reuse.


