Submitted:
01 October 2025
Posted:
02 October 2025
You are already at the latest version
Abstract
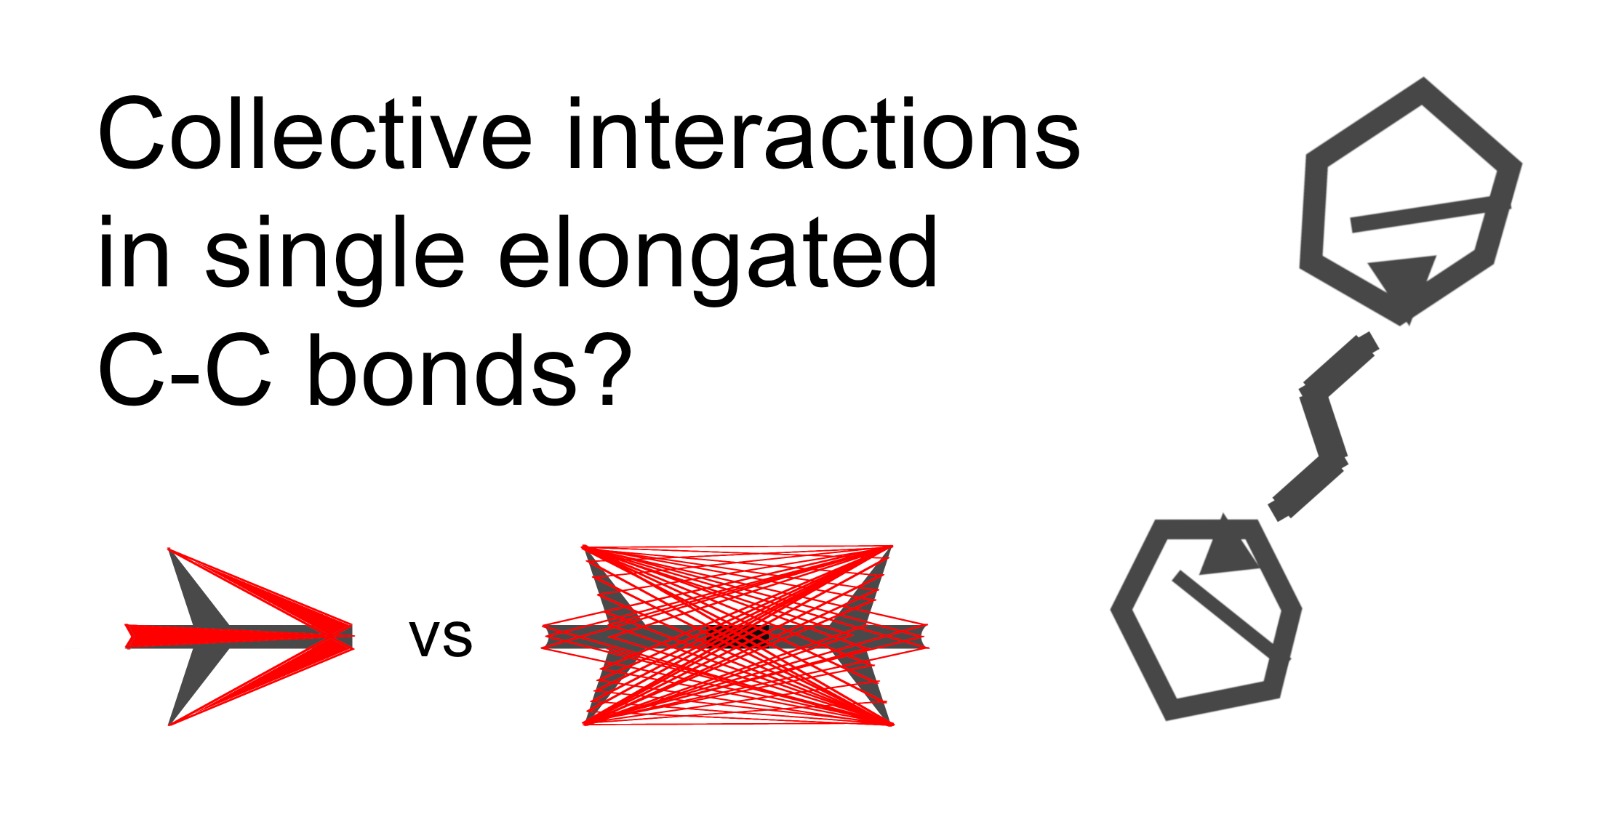
Chemical bonds among carbon are central to Chemistry. A general working principle regarding these interactions is that these contacts get stronger as the carbon atoms become closer to each other. Nevertheless, there are long, yet strong single C–C bonds which challenge this interpretation. Herein, we perform a quantitative thorough decomposition of the electronic energy of hexaphenylethane and several derivatives of this molecule with increasingly bulkier substituents. For this purpose, we exploited state-of-the-art methods of wave function analysis for the examination of the chemical bonding scenario in the examined systems, namely the Quantum Theory of Atoms in Molecules (QTAIM) and the Interacting Quantum Atoms (IQA) electronic energy partition. Our results reveal the predominance of collective non-covalent interactions over the central, covalent one in the chemical bonding of the examined molecules, in particular for those which have been synthesised in the laboratory. The QTAIM and IQA methods also showed that besides London dispersion, electron sharing comprises and important contribution to the above mentioned collective interactions. Overall, our results give valuable insights about the importance of collective interactions in the investigated systems and they aid in the understanding of the nature or long, yet stable single C–C bonds.
Keywords:
interacting quantum atoms
; IQA
; quantum theory of atoms in molecules
; QTAIM
; London dispersion
; long carbon carbon bonds
; energy decomposition analysis
1. Introduction
Bonds between carbon atoms lie at the heart of organic chemistry, underlying a variety of phenomena from the reactivity of small molecules to the architecture of advanced polymers. A basic tenet of chemical bonding holds that shorter bonds are typically stronger, reflecting greater orbital overlap and electron sharing, while long bonds indicate instability [1,2,3]. This correlation between bond length and bond strength underpins much of our chemical intuition and is used constantly in the design of stable molecular frameworks [4,5]. However, a growing number of structurally characterised compounds appear to defy this expectation, displaying carbon–carbon single bonds that stretch well beyond conventional distances while remaining remarkably stable under ambient conditions [6,7,8]. Some of the most noticeable examples of this feature are diamondoid dimers, e.g., the molecule [121]tetramantane-diamantane 1 (Figure 1) which is a very stable molecule with melting point of 246 °C, and yet it has the longest C–C bond for an alkane up to now (1.71 Å) [9]. Another molecule having long, stable single C–C bonds is 1,1,2,2-tetra--buthyl ethane 2 (m.p. 150 °C) which presents three single C–C bonds wherein d(C–C) > 1.58 Å [10]. Likewise, 2,3-di-1-adamantyl-2,3-dimethyl butane 3 has three C–C bonds whose bond lengths are larger than 1.64 Å, and still, the corresponding crystal has a melting point of 167 °C [11,12]. These anomalously long yet stable bonds challenge textbook models of covalent bonding and raise fundamental questions about what forces can sustain such elongated chemical bonds [12].
Among the forces capable of stabilising weak interactions between atoms, London Dispersion (LD), a long-range, non directional interaction, plays a uniquely universal role. Arising from correlated fluctuations in the electron positions, LD acts as an attractive force acting on all matter, growing stronger with increasing molecular size and polarisability [13,14]. In systems with large, flexible substituents,this effect becomes particularly significant. What might appear at first glance as simple steric crowding can instead give rise to a network of favorable dispersion contacts that compensate for the energetic cost of bond elongation. Rather than destabilising a stretched C–C bond, bulky groups may in some cases aid in its stabilisation by collectively lowering the total energy of the system via LD [15]. A particularly conspicuous example is the effect of alkyl substituents on the hypothetical hexaphenylethane (HPE), (Ph)3C–C(Ph)3. Indeed, the introduction of large tert-butyl groups in all meta positions leads to the isolation of hexa(3,5-di-tert-butylphenyl) ethane which can be even characterised via X-ray crystal diffraction [16,17].
Experimental support for this view emerged most notably from the work of Schreiner and co-workers, who reported a series of remarkably stable alkanes with very long C–C bond lengths as previously shown in Figure 1. These species, stabilised by bulky alkyl groups, are thought to owe their persistent long C–C single bonds largely to LD forces rather than conventional covalent bonding. This interpretation is based on computational studies, typically using dispersion-corrected density functional theory (e.g., PBE0-D3BJ) or high-level ab initio methods, such as CCSD(T), which suggest a central role for dispersion in the stabilisation of these molecules. However, a detailed understanding of the energetic balance that makes such bonding possible remains incomplete. In particular, disentangling the physical contributions that stabilise very long C–C bonds remains a central challenge. Many energy decomposition schemes, though informative, rely on perturbative approximations or artificial fragmentations [18]. These choices can misattribute stabilisation among exchange, electrostatics and dispersion, introduce strong basis and fragmentation dependence, and produce trends that vary with the partitioning scheme. Together, these issues hinder quantitative comparison across a series and can lead to misleading design rules [19,20]. In contrast, real-space approaches within the field of Quantum Chemical Topology (QCT) like the Quantum Theory of Atoms in Molecules (QTAIM) enable a fully non-perturbative, atom-centric view of bonding [21]. Among these, the Interacting Quantum Atoms (IQA) method offers a rigorous decomposition of the total energy into chemically interpretable intra- and interatomic components [22,23]. IQA has been successfully applied to a wide range of problems, including the analysis of hydrogen bonding, [24,25] non-covalent interactions, [26,27,28,29] transition-metal complexes, [30,31] and cooperative and anticooperative effects in non covalent assemblies [32,33,34,35].
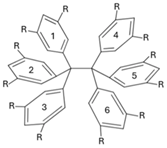
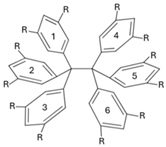
In this work, we apply QTAIM-based wave function analyses and the IQA partition of the electronic energy throughout a homologous series of compounds with long central C–C bonds to identify the most important energetic contributions in their stabilisation. More specifically, we focused on the series of compounds shown in Figure 2, i.e., a set of HPE derivatives with progressively bulkier substituents, allowing us to track interaction energies and to examine the chemical bonding scenario evolution across this set of compounds. Altogether, our results reveal that the QCT characterisation of the strength of the central chemical C–C bond in the molecules shown in Figure 2 does not align with the computed dissociation energy of these systems. This observation indicates that there other factors which contribute to stabilisation apart from the sole interaction between the carbon bonds in the ethane moiety. Indeed, the IQA analysis reveal the relevance of collective covalent 1–3 and more importantly 1–4 contacts in the compounds schematised in Figure 2 apart from LD. More broadly, these results highlight the essential features and the relevance of collective interactions and they aid in the understanding of both non-covalent interactions and covalent bonding in highly congested environments.
2. Theoretical Framework
The field of QCT comprises a series of methods of wave function analysis based on the topological study of distinct scalar fields derived from the electronic vector state. The origin of QCT resides on the Quantum Theory of Atoms in Molecules which relies on the topographical examination of the electron density, . Because the electron density is the expectation vaue of a Dirac observable, i.e., , the QTAIM analysis is orbital-invariant and independent on elements of the particular model of computation (e.g., basis sets). The QTAIM involves the determination of the critical points of , i.e., points wherein vanishes. Typically, molecular stable strucutures present critical points with range , that is to say, whith three curvatures (the eigenvalues of the Hessian of evaluated at the corresponding critical point) different from zero. Besides the rank, critical points of are characterised according to their signature, s, which equals to the algebraic sum of the signs of the curvatures at the critical point. In other words, critical points can be associated with the ordinate pair . The critial points with are related with different elements of molecular structure. Namely, the critical points with , i.e., , , and indicate the occurrence of nuclei, chemical bonds between two atoms, rings and cages, respectively. Hence, these critical points are respectively denoted as Nuclear Critical Points (NCP), Bond Critical Points (BCP), Ring Critical Points (RCP) and Cage Critical Points (CCPs). Indeed, the chemical bond between two atoms, can be characterised via the values of as well as of other scalar fields at the corresponding BCP. These scalar fields include, for example, , and the density of energy [21,36,37]
By considering the dynamical system established by , the QTAIM defines a division of the 3D space in atomic basins, A, B, …which are related with the atoms of chemistry [37]. An atomic basin is defined as the stable manifold of an NCP. The atomic basins in QTAIM are separated by an interatomic surface, i.e., the stable manifold of a BCP. Because QTAIM atomic basins are proper open quantum subsystems, one can calculate atomic expectation values of quantum mechanical operators. For example, the average number of electrons within an atom A is,
and the corresponding QTAIM charge is
The QTAIM also defines the delocalisation index between two atoms A, and B, , as
wherein is the covariance of the two random variables x and y and is defined in Equation (1). The value of is the number of electrons shared by the basins A and B and therefore it is a measure of the relevance of covalency in the interacton of these two QTAIM atoms.
After establishing a partition of the 3D space into atomic basins, as QTAIM provides, one can divide the electronic energy (E) in intra- () and interatomic components (),[22,23,38]
The contributions to and can be computed completely in terms of the first order reduced density and the pair density . Although Kohn-Sham DFT does not define any of these scalar fields, it is possible to carry out to introduce very reasonable approximations that allow an IQA partition energy based on the Kohn-Sham DFT pseudo wave functions. The IQA interaction energy between atoms A and B, , can be split into classical () and exchange-correlation components, ()
which are respectively associated with the ionic and the covalent contributions of the interaction between atoms A and B. The consideration of the leading terms of the multipole expansion of and permits to approximate these two quantites as,
The IQA partition energy allows for the gathering of atoms in functional groups, …whose net and interaction energies are given by,
respectively. A similar equation to expression (5) holds for and , so that,
Finally, the energy associated to the formation of a adduct, ,
is given by
wherein () is the deformation energy of within the adduct , i.e., the difference in energy of in (i) the adduct and in (ii) its isolated, equilibrium configuration.
The noncovalent interaction (NCI) index provides a simple real–space scalar field to locate and visualise weak interactions by analysing regions of low electron density and low density gradient [39]. It is based on the reduced density gradient
whose small values highlight spatial domains where noncovalent contacts occur. To distinguish the nature of these contacts, NCI maps are coloured using , where is the second eigenvalue of the Hessian of : negative (blue) indicates attractive interactions such as hydrogen bonding or dispersion–dominated contacts, values near zero (green) correspond to weak van der Waals regimes, and positive (red) signals steric repulsion. Plotting isosurfaces of at a low threshold, coloured by , thus yields an intuitive picture of where weak interactions stabilise or destabilise a structure. NCI does not provide energies by itself, but it complements QTAIM and IQA by revealing the spatial extent and character of the interactions that those methods quantify.
3. Computational Details
All molecular structures were optimized with ORCA (version 6) [40] using the PBE0 functional [41] with D3 dispersion including Becke–Johnson damping [42,43,44] and the def2-SVP basis set [45]. The resolution-of-the-identity approximation [46,47] was employed for the Coulomb term and the Chain-of-Spheres (COSX) approximation [48,49] for the exchange-correlation one with the corresponding def2/J auxiliary basis [50]. Thermochemical corrections were obtained from analytical harmonic frequency calculations at the same level of theory. QTAIM analyses were performed with AIMAll (version 19.10.12) [51]; full IQA partitions and delocalization indices were computed for ethane and hexaphenylethane, whereas for the remaining derivatives we employed the first-order approximation to the IQA interatomic energies. Noncovalent Interaction (NCI) analysis was carried out with Multiwfn [52,53], and the isosurfaces were rendered with VMD [54].
4. Results and Discussion
4.1. Potential Energy Curves and Thermodynamic Potentials
Figure 3 reports the potential energy curves associated to the formation of the molecules schematised in Figure 2 from the corresponding free radicals. The associated enthalpy and Gibbs free energy of formation are reported in Table 1. We note that the aromatic groups severely impair the formation of the corresponding central C–C bond with respect to ethane. The potential energies curves reveal, as expected, the formation of a molecular complex which results from the interaction of the two free radicals followed by the occurrence of an energetic barrier preceding the formation of the central C–C bond. As it can be noted from Table 1, the alkyl groups substituted on the phenyl groups, increase the magnitude of the formation enthalpy of the central C–C bond, . This rise in is consistent with the larger stability of HPEtBut with respect to HPE as reflected in the feasibility of the synthesis of HPEtBut as opposed to the elusiveness of the synthesis of HPE. Indeed, the formation of HPE from (Ph)3C· radicals is an endergonic process ( kcal/mol) whereas the generation of HPEtBut from the corresponding (3,5,dibutylC6H3)C· radicals is an exergonic reaction ( kcal/mol) in the gas phase.
4.2. Quantum Theory of Atoms in Molecules Analysis
The above observations point to (i) a noticeable weakening of the C–C interaction due to the replacement of the hydrogens of ethane by phenyl groups, resulting in the molecules shown in Figure 2 and (ii) the strengthening of the central C–C bond as a result of the substitution with alkyl radicals of the meta position of the phenyl grups of HPE. Regarding the characterisation of the chemical bonding scenario in these compounds, Table 2 reports selected topological properties of the electron density in the BCP associated to the central C–C bond of ethane along with those of the compounds presented in Figure 2. The same chart displays the calculated bond lengths and formation energies of the corresponding systems. We note that the substitution of the ethane hydrogen atoms with aryl groups leads to a considerable reduction of the magnitude of the bond formation energy of the investigated central C–C bonds which equals up to 85% of . The corresponding changes in , and are much subtler, i.e., roughly 25%, 15% and 40%, respectively. Certainly, the topological descriptors of of HPE, HPEMe, …HPEtBut are virtually the same, although the value of the formation energy of HPEtBut is twice as large as that of HPE. In other words, whilst the topological properties of are clearly different for (i) ethane on one hand, and (ii) the molecules shown in Figure 2 on the other, the same features of the topology of are very similar for HPE and its substituted analogues. Therefore, we proceed to examined the chemical bonding scenario in these systems using other methods in the theoretical framework of QCT.
4.3. NCI Analyses
Figure 4 shows NCI isosurfaces () coloured by (scale at bottom right). A clear monotonic trend appears across panels (A)–(E): as substituents grow, the number and extent of low-gradient regions increase, forming a dense network of contacts around the central C–C bond and between facing aryl/alkyl surfaces. The green lobes (weak van der Waals regime) percolate into quasi-continuous shells in the bulkiest systems, signalling extensive dispersion surfaces rather than isolated pairwise contacts. Red patches (repulsive) mark local steric clashes at short C-C non-bonded encounters. The overall picture supports that bulkiness amplifies the number of weak attractive contacts despite local repulsion, being consistent with a cooperative, many-contact stabilization that our IQA analysis attributes largely to dispersion.
4.4. Interacting Quantum Atoms analyses
Regarding the division of the formation energy into deformation and interaction energies according to Equation (12), Table 3 reports the values of these quantities for the corresponding radicals involved in the formation of ethane and HPE. We performed this analysis in these two molecules because we could carry out the complete IQA analysis of these two species without any approximation. We note that although the IQA interaction energy between the Ph3C· radicals ( kcal/mol) is larger in magnitude than it is for the ·CH3 species ( kcal/mol), the very large deformation energy (300.870 kcal/mol) of the former system overwhelms its IQA interaction energy. This large deformation energy is related with the loss of planarity of the Ph3C· radicals along with the reduction of the conjugated system of these radicals when the central C–C bond is formed in HPE. Indeed, the delocalisation indices of the ipso carbons of the phenyl groups with the corresponding central carbon atom in hexaphenylethane is in average 0.95 a.u. whereas in the (Ph3)C· radical the corresponding values is 1.13 a.u. In other words, there are roughly 0.20 less pairs or electrons shared between the central carbons with the ipso C due to the formation of the central C–C bond in HPE. Another relevant aspect of Table 3 is that the IQA interaction energy between the carbon atoms in ethane ( kcal/mol) is considerably larger than it is in HPE ( kcal/mol). The IQA interaction C–C energy in ethane represents roughly 88% of whereas in the case of hexaphenylethane it only amounts to 51% of . In other words, the interaction energy of the central bond in HPE contributes substantially less to the stability of the system than it does in ethane. Therefore, there must be other interactions which contribute to the stability of HPE (the formation of HPE from two Ph3C· radicals is an exothermic process as reported in Table 1 and Table 2) which we examine below.
4.5. Collective 1-3 Interactions
The fact that the central C–C interaction in HPE is considerably less stabilising than it is in ethane and the formation of the former molecule from its corresponding radicals is still an exothermic process is reminiscent of the concept of collective bonding. This notion refers to the existence of strong stabilising chemical contacts which are neither associated with a chemical bond in the context of Lewis structures or with a BCP as established by the QTAIM theoretical framework [55]. An important type of collective interaction is of the type 1–3, as shown in Figure 5 (a). This is relevant in molecules such as and wherein sodium establishes strong interactions with H atoms and with the CN functional groups, respectively. Furthermore, collective 1–3 interactions have been also described in organometallic systems such as organolithium and organomagnesium species [55]. Given this background, one one can also examine the 1–3 collective interactions between one central carbon atom and the aromatic groups bonded to the other central carbon for the molecules shown in Figure 2. Table 4 reports the approximate IQA interaction energy for collective 1–3 interactions in the molecules HPE, HPEMet, …HPEtBut. We note that 1–3 contacts have relevant contributions to the overall stability of the molecules HPE, HPEMe,…,HPEtBut. Nevertheless, the collective 1–3 interactions are very similar throughout the same series of molecules and therefore they are not the main reason for the larger stability of HPEtBut with respect to HPE. Hence, we decide to examine 1–4 interactions as depicted in Figure 5 (b), videlicet among the aromatic groups bonded to the central atoms in the molecules in the series HPE,…,HPEtBut. The last-mentioned interactions seem to be, upon an initial examination, similar to those existing among the fluorine atoms of XFn systems (X: B or C). [55]. These molecules present large F–F interatomic IQA exchange-correlation interactions throughout space.[55] This background made us hipothesise that 1–4 contacts are relevant in the chemical bonding of the examined systems and these contacts are discussed below.
4.6. Collective 1–4 Interactions
Table 5 reports the IQA interaction energy corresponding to collective 1–4 interactions in HPE, that is to say, among the aromatic groups bonded to the cental carbon atoms in the HPE molecule. This observation reveals the important role that these non-covalent interactions might have in the formation of the examined species. This situation occurs to the extent that the sum of the non-covalent interactions of the substituent phenyl groups as reported in Table 5 ( kcal/mol) is comparable with that of the central C–C bond in HPE ( kcal/mol). Yet, another significant difference concerning ethane, is the fact that the contribution from the dispersion energy is relevant in the formation HPE from the Ph3C· radicals. Without the dispersion energy component, the formation of HPE from these species would be computed as an endothermic process. Indeed, Table 3 indicates that without the dispersion correction, the formation energy of HPE from two ·C(Ph3) radicals is 9.637 kcal/mol whereas the contribution of LD adds up to kcal/mol, leading to an exothermic formation energy of kcal/mol. Still, the exothermic character of the interaction of two ·C(Ph3) is overcome by the entropy decrease that accompanies the formation of a chemical bond in gas phase.
Concerning the other compounds in Figure 2, Table 7 displays the approximate IQA interaction energies for the molecules shown in Figure 2 (Equations (5)–(7)). We note that the IQA interaction energies among the phenyl groups increase as the bulkiness of the alkyl substituents on the phenyl groups increases whereas the corresponding quantity for the central carbons in the molecules HPE, …HPEtBut remains virtually constant. The larger increase in such IQA interaction energies occurs in the change from HPEiPr ( kcal/mol) to HPEtBut ( kcal/mol) i.e., . This situation results in a larger IQA interaction energy among the aromatic groups than it is for the central carbon atoms in HPEEt ( wrt kcal/mol), HPEiPr ( wrt kcal/mol) and HPEtBut ( wrt kcal/mol). Another important issue is that the IQA interaction energy among the phenyl groups greatly surpasses the contributions to dispersion in the five examined molecules: HPE ( wrt kcal/mol), HPEMe ( wrt kcal/mol), HPEEt ( wrt kcal/mol), HPEiPr ( wrt kcal/mol) and HPEtBut ( wrt kcal/mol). This comparison indicates that other effects appart from LD, e.g., through-space electron sharing might be important in the chemical bonding of these molecules. Given the importance of the IQA interaction energy among the phenyl groups bonded to the central carbon atoms, we consider the division of the IQA interaction energy into their classical and exchange-correlation contributions according to Equations (5). Because of the similar electronegativities of carbon and hydrogen, the IQA classical component among the phenyl groups bonded to the central carbon atoms is negligible () and therefore the exchange-correlation component is dominant among these groups. This observation is relevant because of the suggestion that single elongated C–C bonds are stabilised via LD. The data in Table 7 indicates that the exchange-correlations among the phenyl groups in the examined molecules outweighs considerably the dispersion component. We do not imply with this statement that LD are irrelevant for the description of the chemical bonding within the investigated molecules. For example, we mentioned above that without LD the formation of HPE from the ·C(Ph3) free radicals would have been calculated as an endothermic process. Nevertheless, we emphasise that the covalent contributions are also significant in the interaction of the aromatic groups of HPE,…,HPEtBut. The relevance of covalency among the aromatic groups bonded to the central carbon atoms of the molecules shown in Figure 2 is evidenced by the delocalisation indices among these groups as shown in Table 8. The values of for the central carbon-carbon bond in the series HPE,…,HPEtBut are about – atom units. We note that the sum of the delocalisation indices between the aromatic rings is indeed greater than that between the central C–C atoms. This circumstance occurs to the extent that the number of delocalised pairs of electrons among individual aromatic rings 1–4 (0.593), 2–5 (0.594) and 3–6 (0.574) in Table 8 is comparable with the corresponding value for the central C–C bond (0.865). A similar situation occurs for the exchange-correlation energy among the above mentioned pairs of aromatic rings at the bottom of Table 7. The IQA exchange-correlation among the same aromatic rings represents circa 50% of the corresponding value for the central C–C bond in this system. These data support the relevance of electron-sharing among the aromatic rings in the chemical bonding of the molecules schematised in Figure 2, in particular, of HPEtBut, as well as the relevance of collective 1–4 interactions within this system.

Table 6.
Approximate IQA interaction energies (Equations (5)–(7) and (9)) among the phenyl groups bonded to the central carbon atoms of the molecules shown in Figure 2. The approximate IQA interaction energy for the central C–C is indicated in the last row for every system. The LD component is also reported. The numbering of the phenyl atoms is indicated in the Scheme. The values are reported in kcal/mol.
 | |||
| HPE | |||
| Phenyl groups | IQA partition | Dispersion correction | IQA-D |
| 1–4 | −15.934 | −3.586 | −19.520 |
| 1–5 | −7.340 | −1.372 | −8.713 |
| 1–6 | −0.546 | −0.587 | −1.133 |
| 2–4 | −0.540 | −0.585 | −1.124 |
| 2–5 | −15.933 | −3.639 | −19.572 |
| 2–6 | −7.391 | −1.368 | −8.760 |
| 3–4 | −7.341 | −1.367 | −8.709 |
| 3–5 | −0.544 | −0.590 | −1.134 |
| 3–6 | −15.866 | −3.636 | −19.502 |
| Total | −71.435 | −16.730 | −88.167 |
| C–C | −84.054 | ||
| HPEMe | |||
| Phenyl groups | IQA partition | Dispersion correction | IQA-D |
| 1–4 | −18.967 | −5.397 | −24.363 |
| 1–5 | −7.434 | −1.598 | −9.032 |
| 1–6 | −0.539 | −0.671 | −1.210 |
| 2–4 | −0.553 | −0.688 | −1.242 |
| 2–5 | −19.006 | −5.524 | −24.530 |
| 2–6 | −7.290 | −1.607 | −8.896 |
| 3–4 | −7.206 | −1.612 | −8.818 |
| 3–5 | −0.545 | −0.678 | −1.223 |
| 3–6 | −18.859 | −5.200 | −24.059 |
| Total | −80.399 | −22.975 | −103.373 |
| C–C | −82.055 | ||
| HPEEt | |||
| Phenyl groups | IQA partition | Dispersion correction | IQA-D |
| 1–4 | −24.763 | −6.914 | −31.677 |
| 1–5 | −8.542 | −1.962 | −10.503 |
| 1–6 | −0.538 | −0.693 | −1.231 |
| 2–4 | −0.551 | −0.714 | −1.265 |
| 2–5 | −26.218 | −7.562 | −33.780 |
| 2–6 | −8.503 | −1.958 | −10.462 |
| 3–4 | −9.453 | −2.259 | −11.711 |
| 3–5 | −0.532 | −0.680 | −1.212 |
| 3–6 | −21.566 | −6.345 | −27.911 |
| Total | −100.666 | −29.087 | −129.752 |
| C–C | −85.287 | ||
Table 7.
(Continuation) Approximate IQA interaction energies (Equations (5)–(7) and (9)) among the phenyl groups bonded to the central carbon atoms of the molecules shown in Figure 2. The dispersion component is also reported. The numbering of the phenyl atoms is indicated in the Scheme. The values are reported in kcal/mol.
 | |||
| HPEiPr | |||
| Phenyl groups | IQA partition | Dispersion correction | IQA-D |
| 1–4 | −20.122 | −6.327 | −26.448 |
| 1–5 | −19.190 | −5.635 | −24.826 |
| 1–6 | −0.717 | −0.676 | −1.393 |
| 2–4 | −0.684 | −0.651 | −1.335 |
| 2–5 | −15.569 | −4.708 | −20.277 |
| 2–6 | −15.065 | −4.781 | −19.847 |
| 3–4 | −16.745 | −5.091 | −21.836 |
| 3–5 | −0.666 | −0.625 | −1.291 |
| 3–6 | −17.111 | −5.284 | −22.394 |
| Total | −105.869 | −33.778 | −139.647 |
| C–C | −85.514 | ||
| HPEtBut | |||
| 1–4 | −30.997 | −9.567 | −40.558 |
| 1–5 | −12.906 | −3.607 | −16.513 |
| 1–6 | −0.544 | −0.861 | −1.405 |
| 2–4 | −0.560 | −0.870 | −1.430 |
| 2–5 | −31.056 | −9.567 | −40.623 |
| 2–6 | −11.584 | −3.477 | −15.061 |
| 3–4 | −12.949 | −3.610 | −16.559 |
| 3–5 | −0.560 | −0.870 | −1.430 |
| 3–6 | −29.729 | −9.674 | −39.403 |
| Total | −130.885 | −42.103 | −172.982 |
| C–C | −86.155 | ||
Table 8.
Delocalisation indices among the aromatic groups bonded to the central carbon atoms of the molecules shown in Figure 2. The delocalisation indices for the central C–C bonds are reported at the bottom of the chart. Atomic units are used throughout.
Table 8.
Delocalisation indices among the aromatic groups bonded to the central carbon atoms of the molecules shown in Figure 2. The delocalisation indices for the central C–C bonds are reported at the bottom of the chart. Atomic units are used throughout.
 | |||||
| Phenyl groups | HPE | HPEMe | HPEEt | HPEiPr | HPEtBut |
| 1–4 | 0.298 | 0.364 | 0.473 | 0.377 | 0.593 |
| 1–5 | 0.111 | 0.112 | 0.129 | 0.354 | 0.216 |
| 1–6 | 0.016 | 0.017 | 0.017 | 0.022 | 0.017 |
| 2–4 | 0.016 | 0.017 | 0.017 | 0.021 | 0.017 |
| 2–5 | 0.300 | 0.367 | 0.504 | 0.281 | 0.594 |
| 2–6 | 0.111 | 0.111 | 0.129 | 0.270 | 0.194 |
| 3–4 | 0.111 | 0.110 | 0.149 | 0.308 | 0.216 |
| 3–5 | 0.016 | 0.017 | 0.016 | 0.020 | 0.017 |
| 3–6 | 0.299 | 0.358 | 0.414 | 0.313 | 0.574 |
| Total | 1.278 | 1.471 | 1.847 | 1.966 | 2.438 |
| C–C | 0.853 | 0.841 | 0.860 | 0.861 | 0.865 |
4.7. Comparison Among Covalent 1-2 Versus Collective 1–3 and 1–4 Interactions
We proceed now to compare the relevance of the traditionally covalent 1–2 interactions with respect to the collective 1–3 and 1–4 interactions in the formation of the series HPE, HPEMe, …, HPEtBut from its corresponding free radicals. The data shown in Table 4 and Table 7 reveal that non-covalent interactions are relevant in the formation of these molecules via the process,
In order to quantitatively assess the relevance of non-covalent, collective 1–3 and 1–4 interactions over those of covalent 1–2 interactions, we define the index as
The smaller the value of , the more “conventional”, i.e., covalently-dominated the interaction between the free radicals in Equation (14). The larger the value of , the interaction between these radicals is more dominated by collective interactions. Table 9 reports the values of for the molecules examined throughout this investigation. We note that while is fairly small for ethane (0.141), while it is larger than unity for the molecules HPE, HPEMe, …, HPEtBut. This result means that collective contacts are more important than the central covalent C–C bond in the interaction of the species in Equation (14). This situation occurs to the point that for HPEtBu. If we consider the total of covalent and collective contacts in the interaction of the free radicals which comprise ultimately HPEtBu, the collective interactions represent circa 70% of the total IQA interaction energy among the two free radicals. The values reported in Table 4 and Table 7 imply that 1–4 collective contacts are more important than their 1–3 counterparts. Nevertheless, we note that the total contribution of the energy associated with these interactions is comparable to the dispersion interactions reported in Table 7. Furthermore, the approximations to the IQA interaction energy in Equations (5)–(7) underestimate the magnitude of as evidenced by comparing the values reported in Table 5 and in the top part of Table 7 concerning the interaction of the phenyl groups in opposited sides of the central C–C in this molecule. These observations indicate that in spite of the fact that the collective 1–3 interactions do not represent the dominant factor in the bonding of the investigated molecules, they represent a significant contribution similar to the dispersion of the aromatic moieties considered in Table 7 and therefore they should be taken into consideration in the formation of the investigated molecules from their corresponding radicals.
5. Conclusions
We presented herein a thorough examination of the chemical bonding scenario of HPE and its analogues substituted with methyl, ethyl, isopropyl, and tert-butyl in meta position with respect to the ipso carbon of the aromatic groups in these compounds. We found that the central C–C bond in this series of molecules is severely weakened as a result of the substitution of aromatic groups with respect to ethane. This weakening of the central C–C bond is ameliorated by non-covalent collective 1–3 and 1–4 interactions, the latter being considerably larger in magnitude. The collective 1–4 contacts are so important that they overwhelm the interaction energy of the central C–C bonds in the examined systems. The most conspicuous example of this statement is HPEtBu, for which collective interactions represent circa 70% of the interaction among the corresponding free radicals forming this molecule, as revealed by the anlysis of the index . Our results also evidence the importance of London dispersion in the chemical bonding of the examined species. Nevertheless, the QTAIM and IQA methods of wave function analysis reveal that electron sharing represent the most important contribution to the energetics of 1–4 collective contacts, and therefore, this component should be considered along with LD in the interpretation of the stability of the examined compounds. Altogether, the results of this investigation highlight the importance and nature of non-collective interations in the investigated systems and they aid in the understanding of the essential features of long, yet stable single C–C bonds.
Author Contributions
A.B.-E. performed the quantum-chemical calculations (optimizations and frequencies), generated the wavefunctions, carried out the QTAIM and IQA analyses, curated the datasets, and prepared figures. J.M.G.-V. developed the analysis workflows, implemented and tested IQA post-processing scripts, validated results across the series, contributed visualizations, and wrote the first draft. E.F. contributed to the theoretical and methodological aspects of the IQA framework, advised on analysis and interpretation, and reviewed and edited the text. T.R.-R. and Á.M.P. conceived and supervised the project, refined the study design and theoretical framing, contributed to methodology, oversaw validation, led critical revisions, co-wrote and revised the manuscript, and secured funding and project administration. All authors discussed the results, contributed to the final manuscript, and approved the version to be submitted.
Funding
We gratefully acknowledge DGTIC/UNAM for the computer time (project LANCADUNAM-DGTIC 250).
Conflicts of Interest
The authors declare no conflicts of interest.
References
- Pauling, L. The nature of the chemical bond and the structure of molecules and crystals: an introduction to modern structural chemistry; Vol. 18, Cornell university press, 1960.
- Kaupp, M.; Danovich, D.; Shaik, S. Chemistry is about energy and its changes: A critique of bond-length/bond-strength correlations. Coord. Chem. Rev. 2017, 344, 355–362. [CrossRef]
- Blokker, E.; Sun, X.; Poater, J.; van der Schuur, J.M.; Hamlin, T.A.; Bickelhaupt, F.M. The chemical bond: when atom size instead of electronegativity difference determines trend in bond strength. Chem. Eur. J. 2021, 27, 15616–15622. [CrossRef]
- Lobato, A.; Salvadó, M.A.; Recio, J.M.; Taravillo, M.; Baonza, V.G. Highs and lows of bond lengths: Is there any limit? Angew. Chem. Int. Ed. 2021, 133, 17165–17173. [CrossRef]
- Zhao, L.; Zhi, M.; Frenking, G. The strength of a chemical bond. Int. J. Quantum Chem. 2022, 122, e26773. [CrossRef]
- Ishigaki, Y.; Shimajiri, T.; Takeda, T.; Katoono, R.; Suzuki, T. Longest C–C single bond among neutral hydrocarbons with a bond length beyond 1.8 Å. Chem 2018, 4, 795–806. [CrossRef]
- Shimajiri, T.; Suzuki, T.; Ishigaki, Y. Flexible C- C Bonds: Reversible Expansion, Contraction, Formation, and Scission of Extremely Elongated Single Bonds. Angew. Chem. Int. Ed. 2020, 59, 22252–22257. [CrossRef] [PubMed]
- Fokin, A.A. Long but strong C–C single bonds: challenges for theory. Chem. Rec. 2024, 24, e202300170. [CrossRef]
- Tyborski, C.; Hückstaedt, T.; Gillen, R.; Otto, T.; Fokina, N.A.; Fokin, A.A.; Schreiner, P.R.; Maultzsch, J. Vibrational signatures of diamondoid dimers with large intramolecular London dispersion interactions. Carbon 2020, 157, 201–207. [CrossRef]
- Brownstein, S.; Dunogues, J.; Lindsay, D.; Ingold, K. Conformation and rotational barriers in sym-tetra-tert-butylethane and sym-tetra (trimethylsilyl) ethane. J. Am. Chem. Soc. 1977, 99, 2073–2078. [CrossRef]
- Meer, M.A.F.t.; Beckhaus, H.D.; Peters, K.; von Schnering, H.G.; Rüchardt, C. Thermolabile hydrocarbons, XXVII. 2, 3-Di-1-adamantyl-2, 3-dimethylbutane; long bonds and low thermal stability. Chem. Ber. 1985, 118, 4665–4673. [CrossRef]
- Schreiner, P.R.; Chernish, L.V.; Gunchenko, P.A.; Tikhonchuk, E.Y.; Hausmann, H.; Serafin, M.; Schlecht, S.; Dahl, J.E.; Carlson, R.M.; Fokin, A.A. Overcoming lability of extremely long alkane carbon–carbon bonds through dispersion forces. Nature 2011, 477, 308–311. [CrossRef]
- Gravillier, L.A.; Cockroft, S.L. Context-dependent significance of London dispersion. Acc. Chem. Res. 2023, 56, 3535–3544. [CrossRef]
- Zhang, B.; Zarić, S.D.; Zrilić, S.S.; Gofman, I.; Heck, B.; Reiter, G. London dispersion forces and steric effects within nanocomposites tune interaction energies and chain conformation. Commun. Chem. 2025, 8, 21. [CrossRef]
- Rösel, S.; Balestrieri, C.; Schreiner, P.R. Sizing the role of London dispersion in the dissociation of all-meta tert-butyl hexaphenylethane. Chem. Sci. 2017, 8, 405–410. [CrossRef]
- Stein, M.; Winter, W.; Rieker, A. Hexakis (2, 6-di-tert-butyl-4-biphenylyl) ethane—The First Unbridged Hexaarylethane. Angew. Chem. Int. Ed. 1978, 17, 692–694. [CrossRef]
- Kahr, B.; Van Engen, D.; Mislow, K. Length of the ethane bond in hexaphenylethane and its derivatives. J. Am. Chem. Soc. 1986, 108, 8305–8307. [CrossRef]
- Phipps, M.J.; Fox, T.; Tautermann, C.S.; Skylaris, C.K. Energy decomposition analysis approaches and their evaluation on prototypical protein–drug interaction patterns. Chem. Soc. Rev. 2015, 44, 3177–3211. [CrossRef] [PubMed]
- Gimferrer, M.; Danes, S.; Andrada, D.M.; Salvador, P. Merging the energy decomposition analysis with the interacting quantum atoms approach. J. Chem. Theory Comput. 2023, 19, 3469–3485. [CrossRef]
- Oestereich, T.; Tonner-Zech, R.; Westermayr, J. Decoding energy decomposition analysis: Machine-learned Insights on the impact of the density functional on the bonding analysis. J. Comput. Chem. 2024, 45, 368–376. [CrossRef] [PubMed]
- Bader, R.F. Atoms in molecules. Acc. Chem. Res. 1985, 18, 9–15. [CrossRef]
- Blanco, M.; Martín Pendás, A.; Francisco, E. Interacting quantum atoms: a correlated energy decomposition scheme based on the quantum theory of atoms in molecules. J. Chem. Theory Comput. 2005, 1, 1096–1109. [CrossRef]
- Francisco, E.; Martín Pendás, A.; Blanco, M. A molecular energy decomposition scheme for atoms in molecules. J. Chem. Theory Comput. 2006, 2, 90–102. [CrossRef] [PubMed]
- Martín Pendás, A.; Blanco, M.; Francisco, E. The nature of the hydrogen bond: A synthesis from the interacting quantum atoms picture. J. Chem. Phys. 2006, 125. [CrossRef] [PubMed]
- Duarte, L.J.; Alves, E.H.; Braga, A.A. Energetic Origins of the Hydrogen-Bond Redshift: IQA Partitioning of Normal Mode Force Constants. J. Phys. Chem. A 2025, 129, 6281–6288. [CrossRef]
- Badri, Z.; Foroutan-Nejad, C.; Kozelka, J.; Marek, R. On the non-classical contribution in lone-pair–π interaction: IQA perspective. Phys. Chem. Chem. Phys. 2015, 17, 26183–26190. [CrossRef]
- Alkorta, I.; Silva, A.F.; Popelier, P.L. An Interacting Quantum Atoms (IQA) and Relative Energy Gradient (REG) Study of the Halogen Bond with Explicit Analysis of Electron Correlation. Molecules 2020, 25, 2674. [CrossRef]
- Triestram, L.; Falcioni, F.; Popelier, P.L. Interacting Quantum Atoms and Multipolar Electrostatic Study of XH··· π Interactions. ACS omega 2023, 8, 34844–34851. [CrossRef] [PubMed]
- Hercigonja, M.; Milovanović, B.; Etinski, M.; Petković, M. Decorated crown ethers as selective ion traps: Solvent’s role in crown’s preference towards a specific ion. J. Mol. Liq. 2023, 381, 121791. [CrossRef]
- Tiana, D.; Francisco, E.; Blanco, M.; Macchi, P.; Sironi, A.; Martín Pendás, A. Bonding in classical and nonclassical transition metal carbonyls: the interacting quantum atoms perspective. J. Chem. Theory Comput. 2010, 6, 1064–1074. [CrossRef]
- Tiana, D.; Francisco, E.; Macchi, P.; Sironi, A.; Martín Pendás, A. An Interacting Quantum Atoms Analysis of the Metal–Metal Bond in [M2 (CO) 8] n Systems. J. Phys. Chem. A 2015, 119, 2153–2160. [CrossRef]
- Guevara-Vela, J.M.; Chávez-Calvillo, R.; García-Revilla, M.; Hernández-Trujillo, J.; Christiansen, O.; Francisco, E.; Martín Pendás, Á.; Rocha-Rinza, T. Hydrogen-Bond Cooperative Effects in Small Cyclic Water Clusters as Revealed by the Interacting Quantum Atoms Approach. Chem. Eur. J. 2013, 19, 14304–14315. [CrossRef]
- Guevara-Vela, J.M.; Romero-Montalvo, E.; Gómez, V.A.M.; Chávez-Calvillo, R.; García-Revilla, M.; Francisco, E.; Pendás, Á.M.; Rocha-Rinza, T. Hydrogen bond cooperativity and anticooperativity within the water hexamer. Phys. Chem. Chem. Phys. 2016, 18, 19557–19566. [CrossRef] [PubMed]
- Guevara-Vela, J.M.; Hess, K.; Rocha-Rinza, T.; Pendás, Á.M.; Flores-Álamo, M.; Moreno-Alcántar, G. Stronger-together: the cooperativity of aurophilic interactions. Chem. Commun. 2022, 58, 1398–1401. [CrossRef]
- Ahirwar, M.B.; Gadre, S.R.; Deshmukh, M.M. On the short-range nature of cooperativity in hydrogen-bonded large molecular clusters. J. Phys. Chem. A 2023, 127, 4394–4406. [CrossRef] [PubMed]
- Cremer, D.; Kraka, E. Chemical bonds without bonding electron density—does the difference electron-density analysis suffice for a description of the chemical bond? Angew. Chem. Int. Ed. 1984, 23, 627–628. [CrossRef]
- Bader, R.F.W. Theory of atoms in molecules, 1995.
- Guevara-Vela, J.M.; Francisco, E.; Rocha-Rinza, T.; Martin Pendas, A. Interacting quantum atoms—a review. Molecules 2020, 25, 4028. [CrossRef]
- Johnson, E.R.; Keinan, S.; Mori-Sánchez, P.; Contreras-García, J.; Cohen, A.J.; Yang, W. Revealing noncovalent interactions. J. Am. Chem. Soc. 2010, 132, 6498–6506. [CrossRef]
- Neese, F. Software update: The ORCA program system—version 6.0. Wiley Interdiscip. Rev. Comput. Mol. Sci. 2025, 15, e70019. [CrossRef]
- Adamo, C.; Barone, V. Toward reliable density functional methods without adjustable parameters: The PBE0 model. J. Chem. Phys. 1999, 110, 6158–6170. [CrossRef]
- Becke, A.D.; Johnson, E.R. A density-functional model of the dispersion interaction. J. Chem. Phys. 2005, 123. [CrossRef] [PubMed]
- Grimme, S.; Antony, J.; Ehrlich, S.; Krieg, H. A consistent and accurate ab initio parametrization of density functional dispersion correction (DFT-D) for the 94 elements H-Pu. J. Chem. Phys. 2010, 132. [CrossRef]
- Grimme, S.; Ehrlich, S.; Goerigk, L. Effect of the damping function in dispersion corrected density functional theory. J. Comput. Chem. 2011, 32, 1456–1465. [CrossRef]
- Weigend, F.; Ahlrichs, R. Balanced basis sets of split valence, triple zeta valence and quadruple zeta valence quality for H to Rn: Design and assessment of accuracy. Phys. Chem. Chem. Phys. 2005, 7, 3297–3305. [CrossRef]
- Vahtras, O.; Almlöf, J.; Feyereisen, M. Integral approximations for LCAO-SCF calculations. Chem. Phys. Lett. 1993, 213, 514–518. [CrossRef]
- Neese, F. An improvement of the resolution of the identity approximation for the formation of the Coulomb matrix. J. Comput. Chem. 2003, 24, 1740–1747. [CrossRef]
- Neese, F.; Wennmohs, F.; Hansen, A.; Becker, U. Efficient, approximate and parallel Hartree–Fock and hybrid DFT calculations. A ‘chain-of-spheres’ algorithm for the Hartree–Fock exchange. Chem. Phys. 2009, 356, 98–109. [CrossRef]
- Helmich-Paris, B.; de Souza, B.; Neese, F.; Izsák, R. An improved chain of spheres for exchange algorithm. J. Chem. Phys. 2021, 155. [CrossRef]
- Weigend, F. Accurate Coulomb-fitting basis sets for H to Rn. Phys. Chem. Chem. Phys. 2006, 8, 1057–1065. [CrossRef] [PubMed]
- Keith, T.A. AIMAll (Version 19.02.13). TK Gristmill Software, Overland Park KS, USA, 2019 (aim.tkgristmill.com).
- Lu, T.; Chen, F. Multiwfn: A multifunctional wavefunction analyzer. J. Comput. Chem. 2012, 33, 580–592. [CrossRef] [PubMed]
- Lu, T. A comprehensive electron wavefunction analysis toolbox for chemists, Multiwfn. J. Chem. Phys. 2024, 161. [CrossRef] [PubMed]
- Humphrey, W.; Dalke, A.; Schulten, K. VMD: visual molecular dynamics. J. Mol. Graph. 1996, 14, 33–38. [CrossRef] [PubMed]
- Sowlati-Hashjin, S.; Šadek, V.; Sadjadi, S.; Karttunen, M.; Martín-Pendás, A.; Foroutan-Nejad, C. Collective interactions among organometallics are exotic bonds hidden on lab shelves. Nat. Commun. 2022, 13. [CrossRef] [PubMed]
Figure 1.
Illustrative hydrocarbons with long central C–C bonds which have been synthesised in the laboratory. The numbers indicate the lengths of the indicated chemical bonds in angstroms.
Figure 1.
Illustrative hydrocarbons with long central C–C bonds which have been synthesised in the laboratory. The numbers indicate the lengths of the indicated chemical bonds in angstroms.
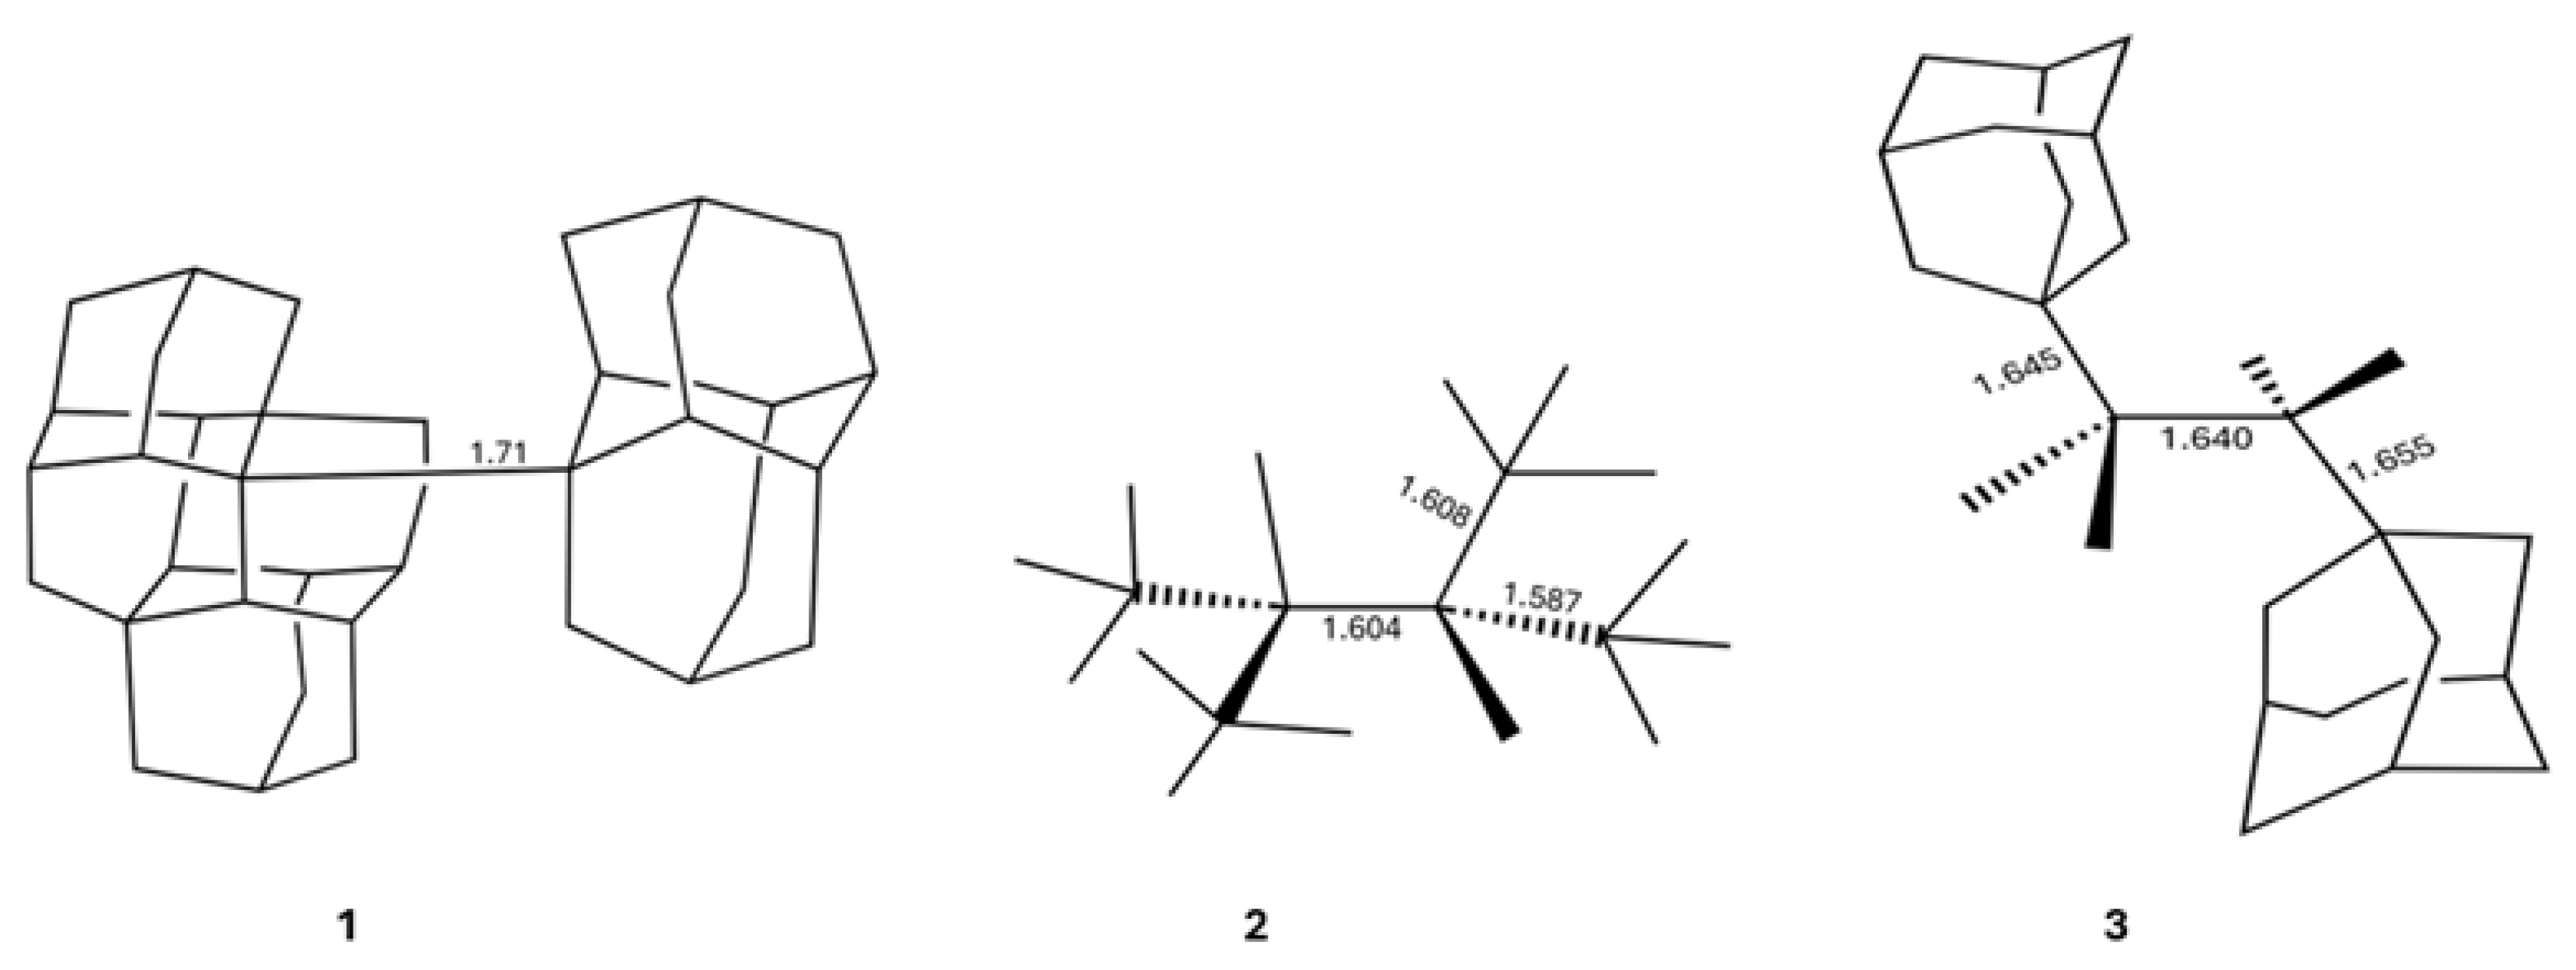
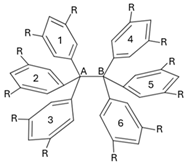
Figure 2.
Derivatives of hexaphenylethane addressed in this investigation.
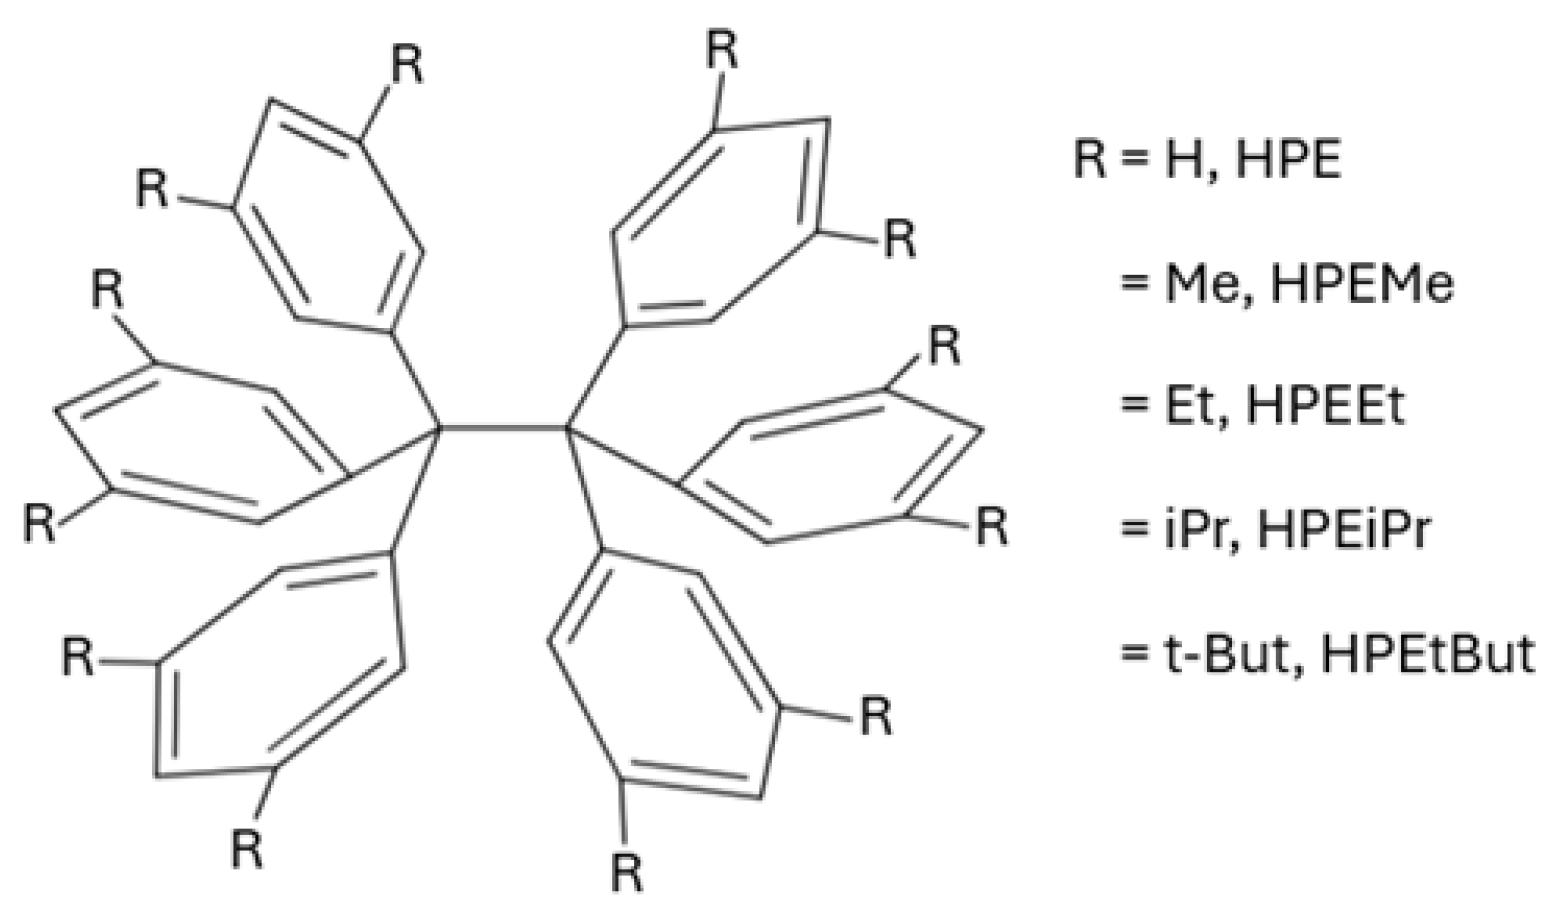
Figure 3.
Potential energy curves for the formation of the molecules shown in Figure 2 from the corresponding free radicals.
Figure 3.
Potential energy curves for the formation of the molecules shown in Figure 2 from the corresponding free radicals.
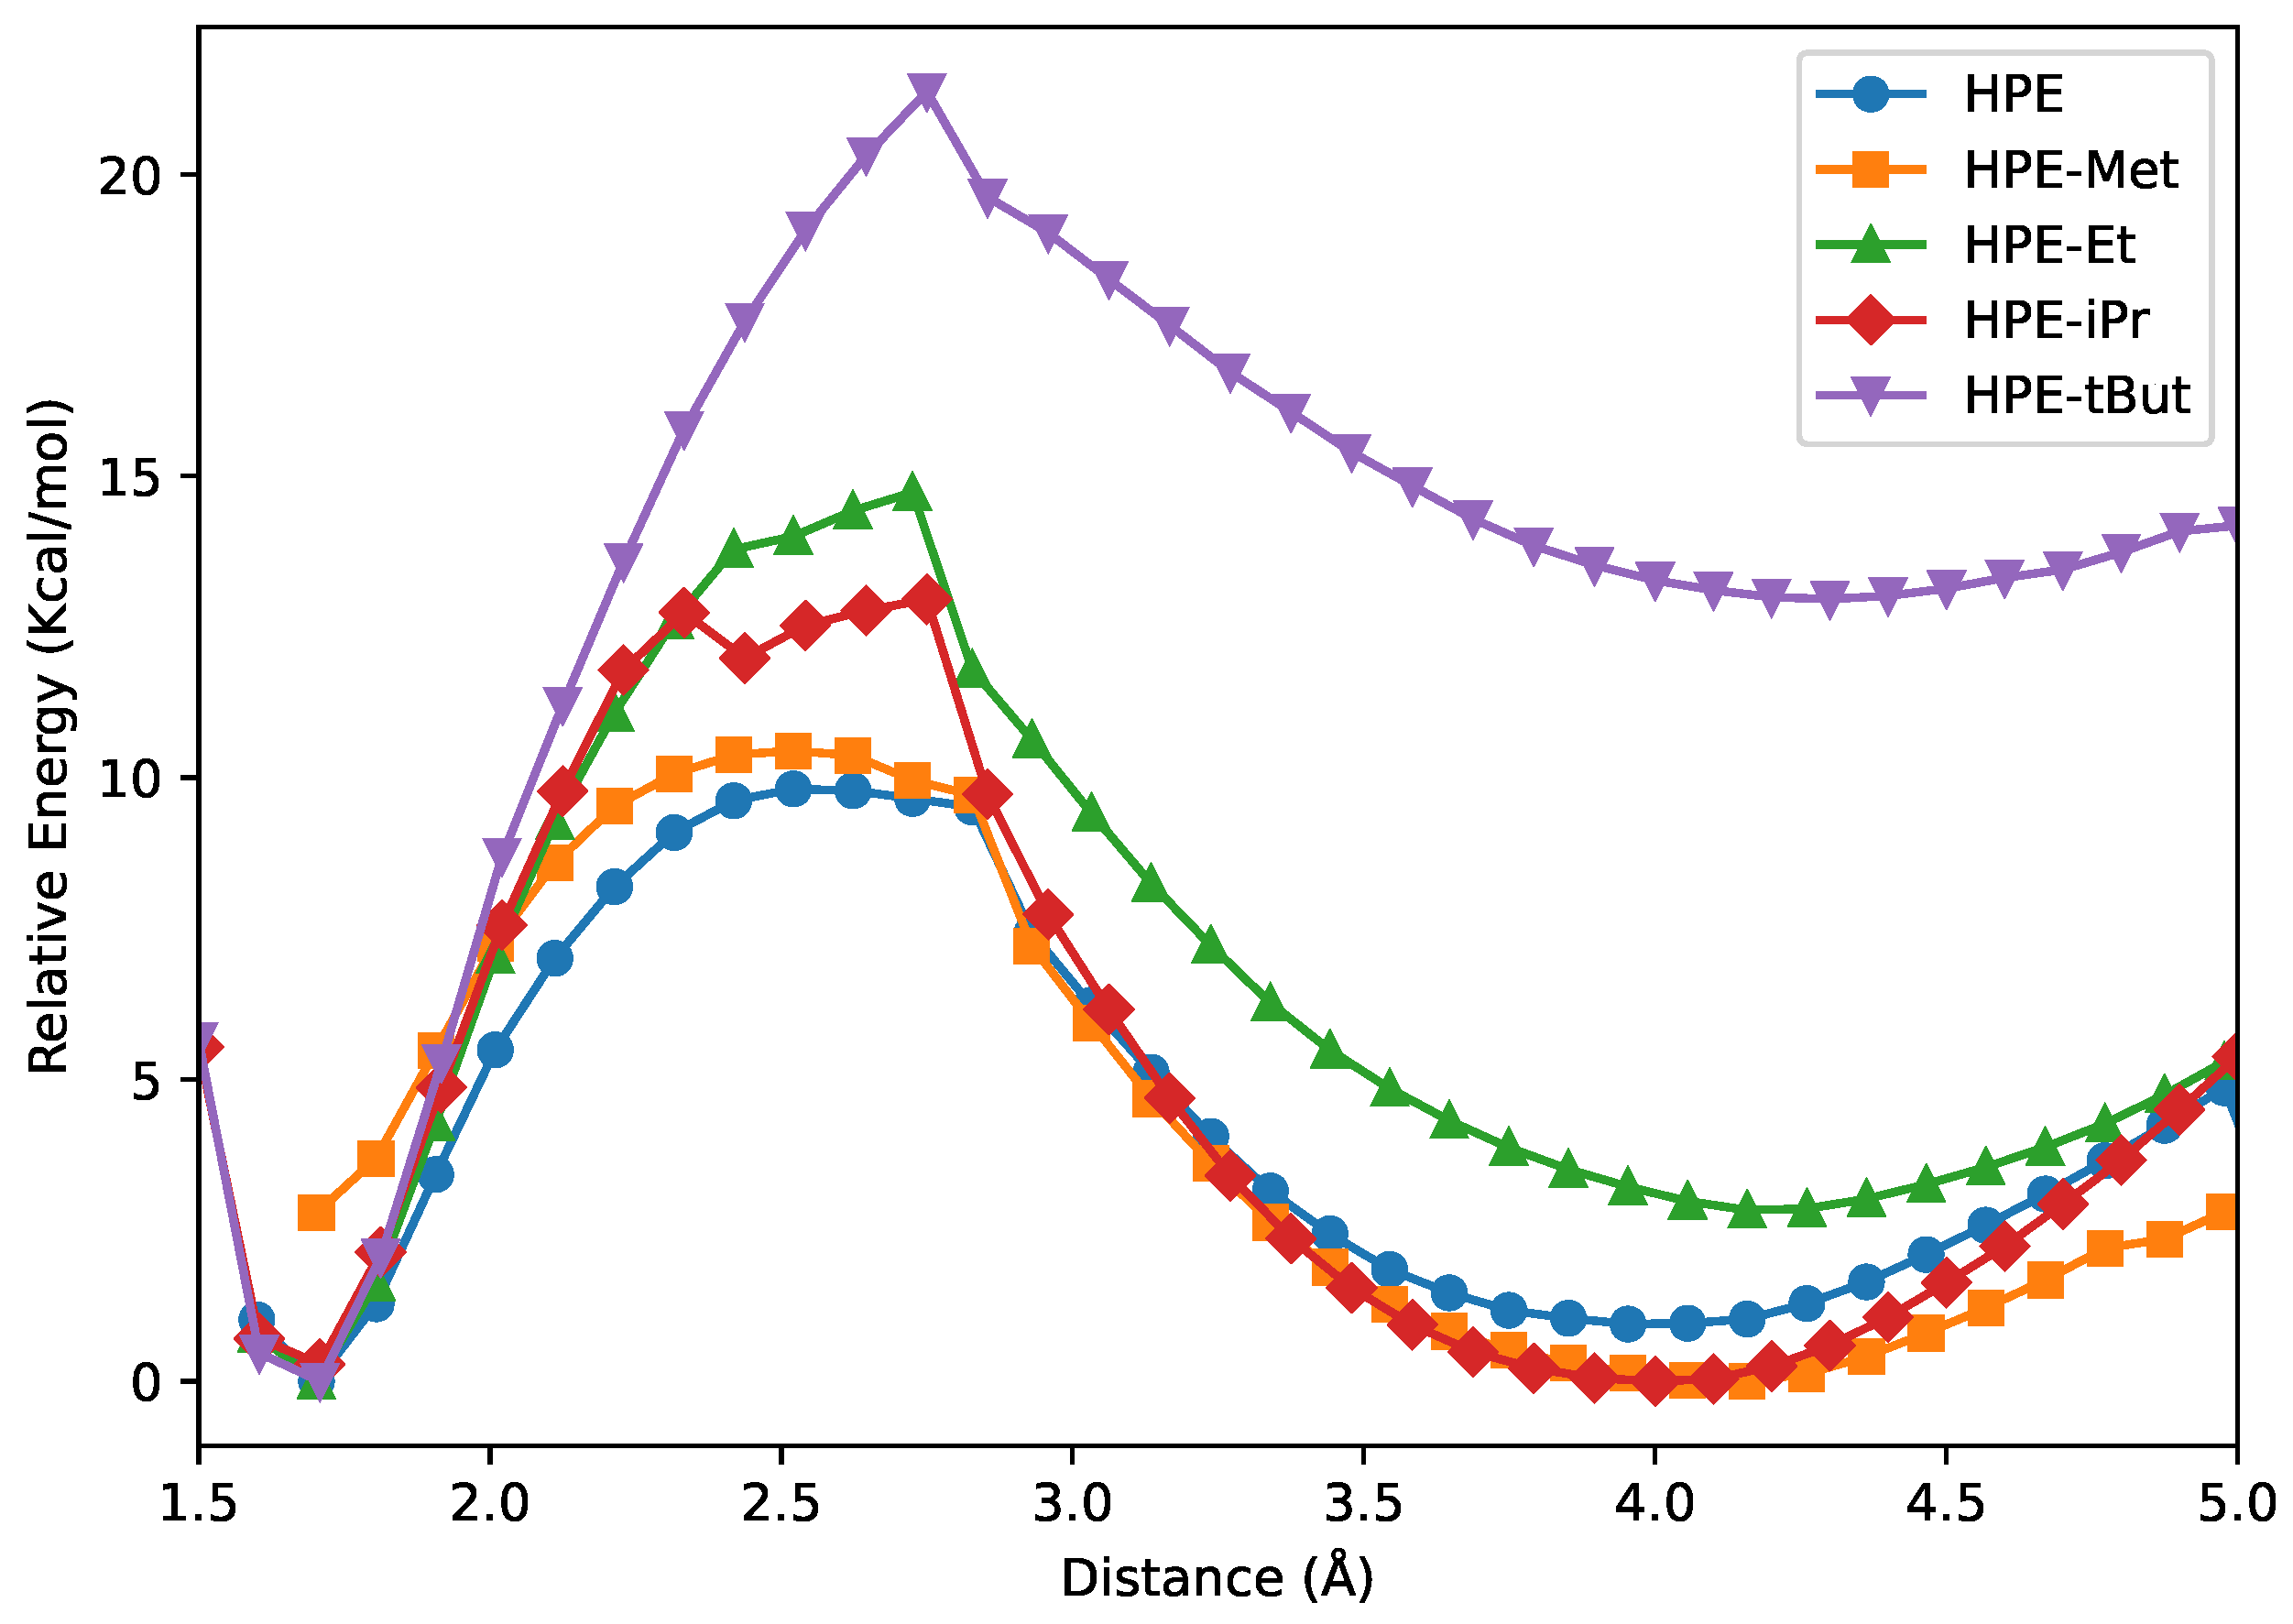
Figure 4.
NCI index surfaces ( 0.5 a.u.). We indicate the value of via the scale in the bottom of the figure.
Figure 4.
NCI index surfaces ( 0.5 a.u.). We indicate the value of via the scale in the bottom of the figure.
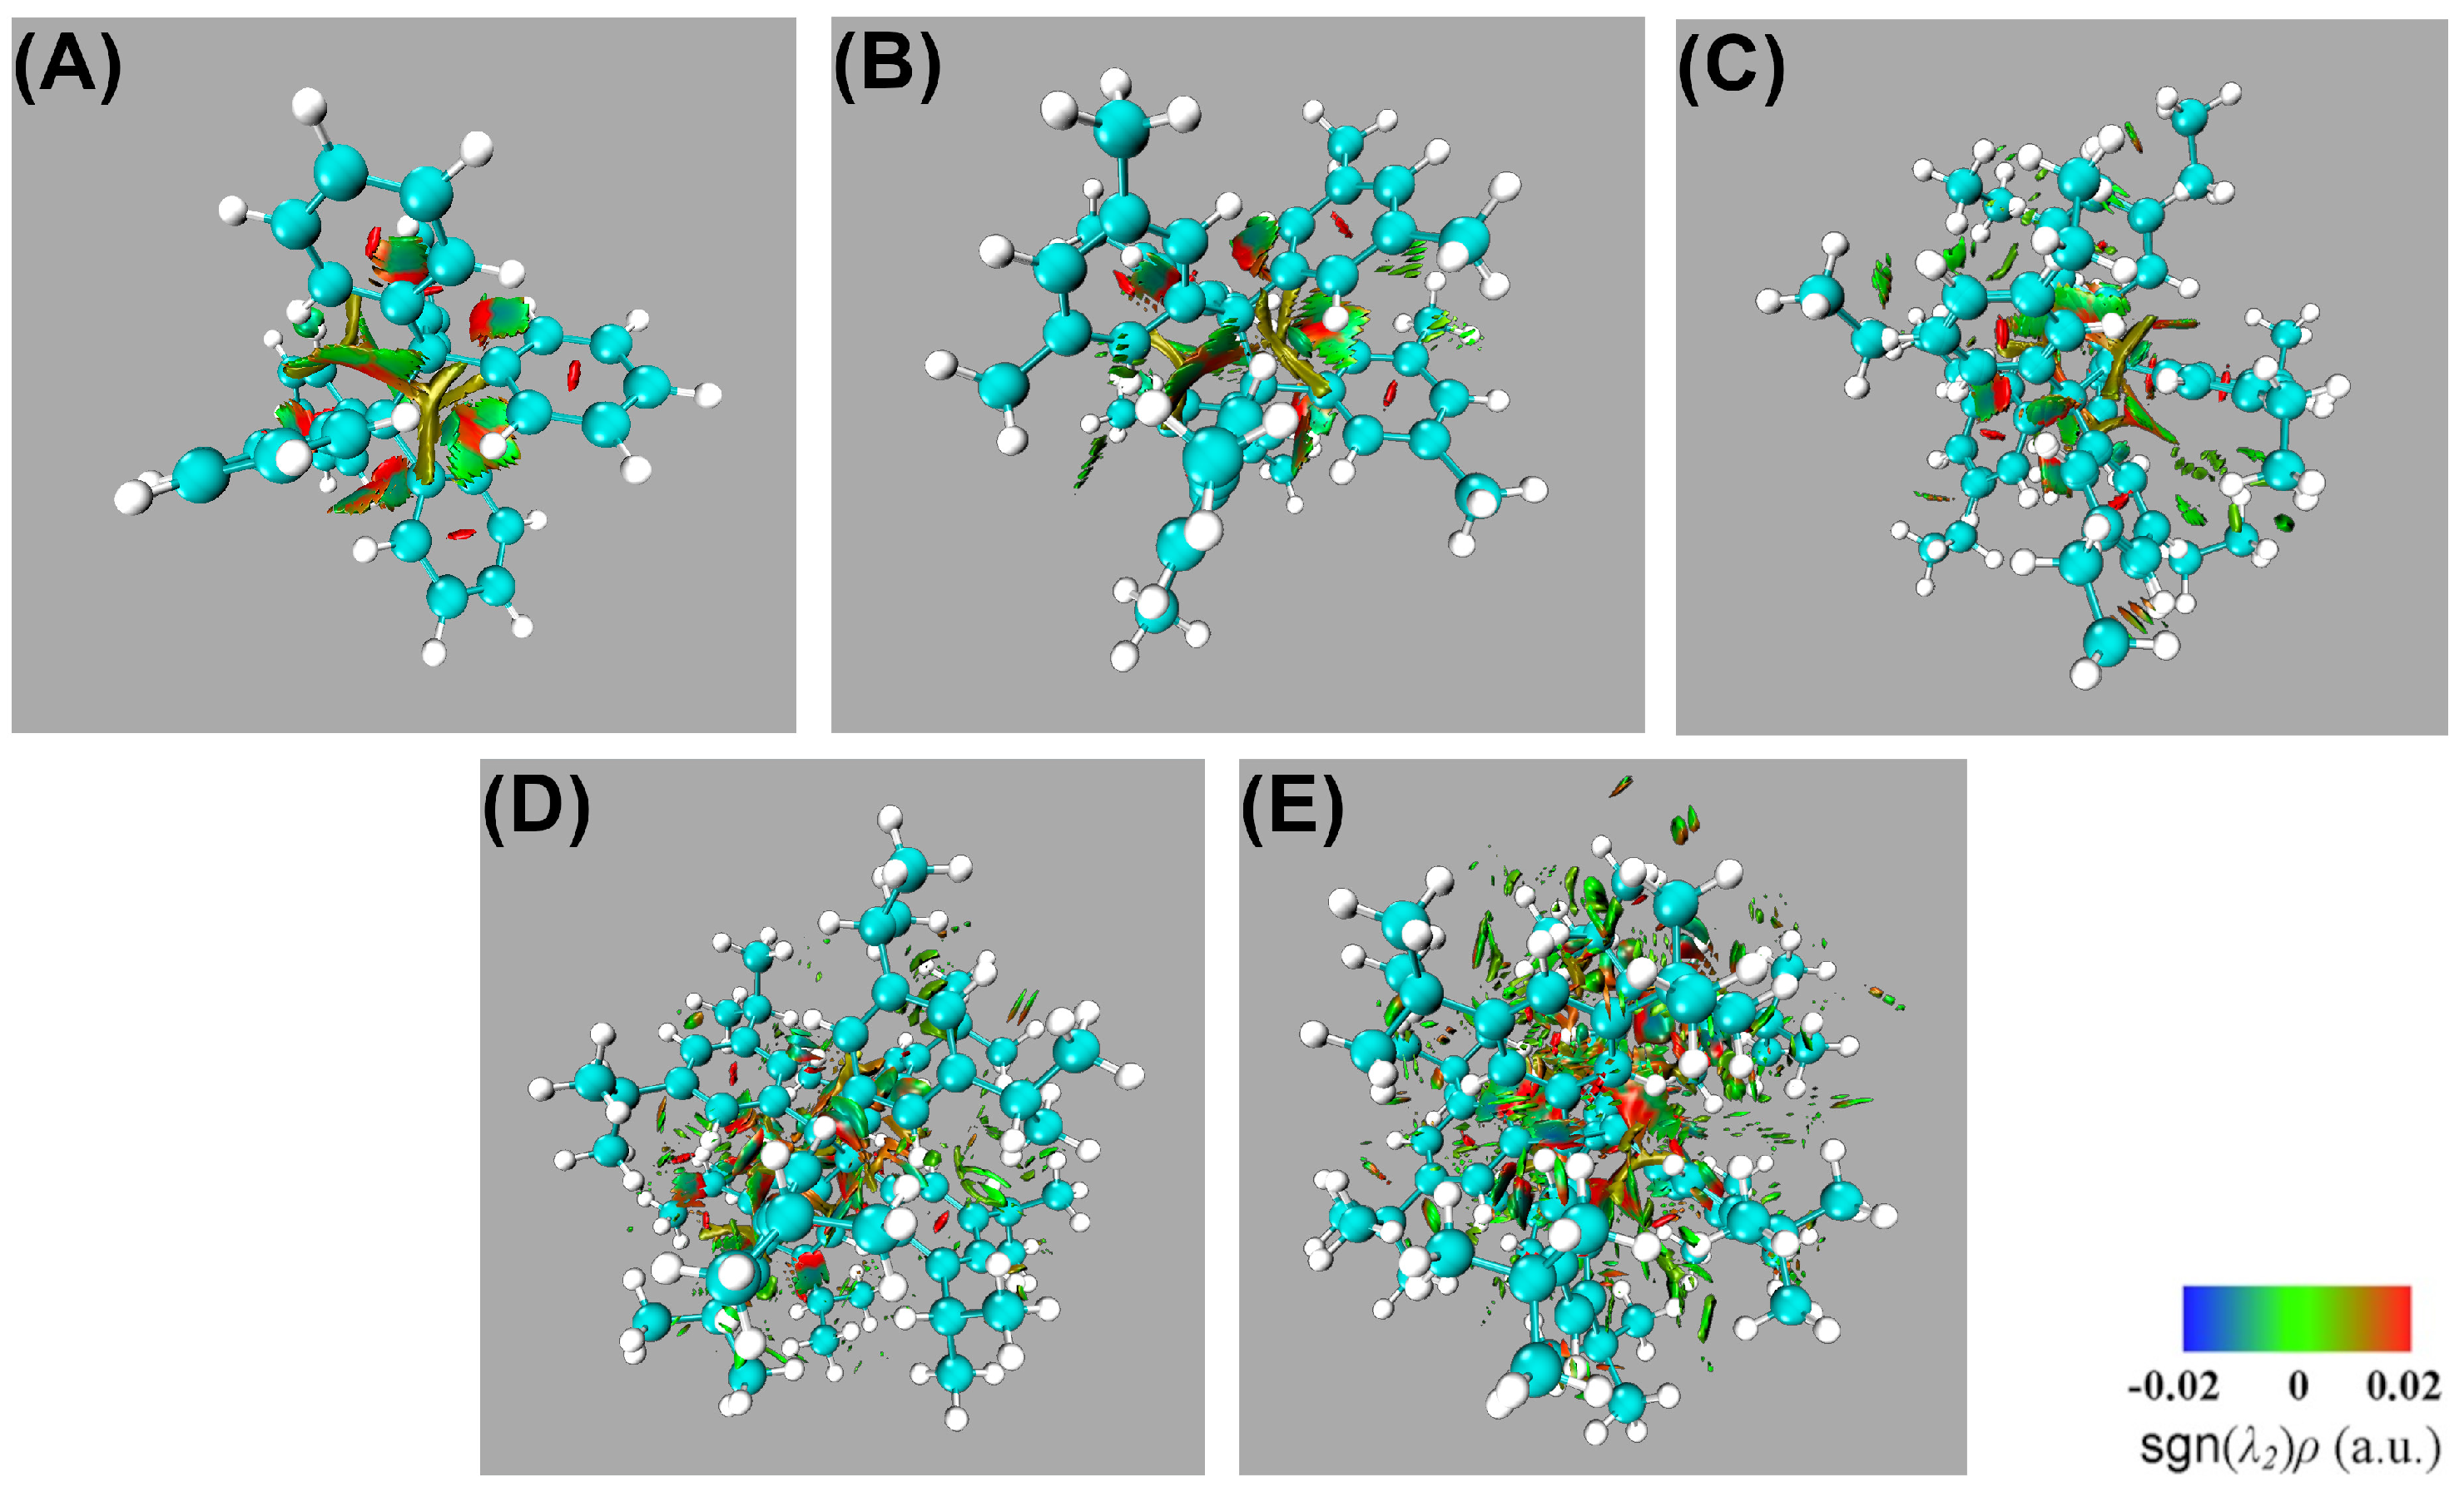
Figure 5.
Representation of collective interactions in organic systems. (a) Collective 1–3 interactions: there exist standard covalent bonds associated with bond paths and bond critical points for interactions 1–2 and 2–3. Nevertheless, the system also present relevant stabilising collective 1–3 interactions represented with dashed lines (b) Collective 1–4 interactions.: groups 1 and 4 which form standard covalent bonds with atoms 1 and 2, respectively, may present chemically stabilising interactions as also schematised with dashed lines.
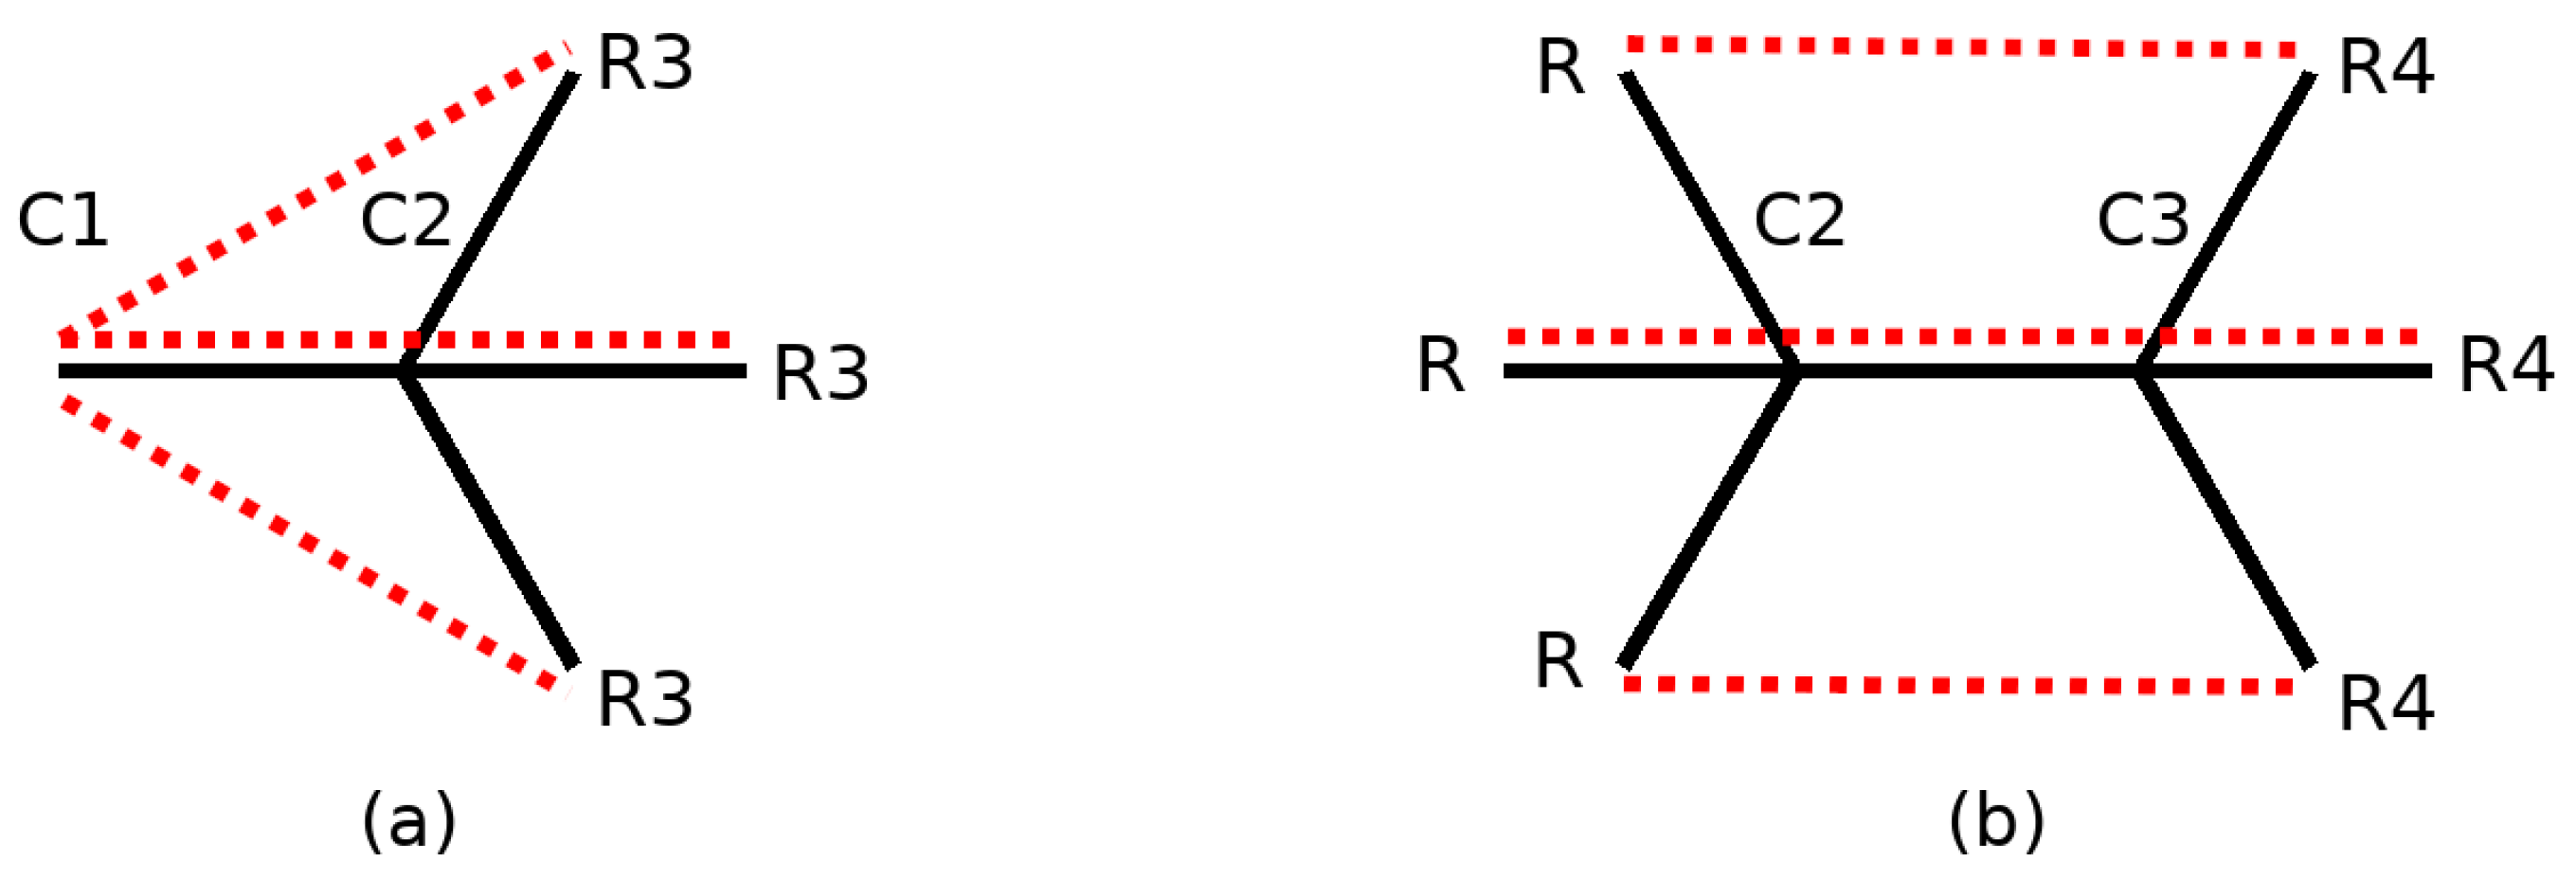
Table 1.
Enthalpy and Gibbs free energy of formation for ethane and the molecules schematised in Figure 2 from the corresponding free radicals whose interaction results in the central C–C bond of the molecule.
Table 1.
Enthalpy and Gibbs free energy of formation for ethane and the molecules schematised in Figure 2 from the corresponding free radicals whose interaction results in the central C–C bond of the molecule.
| Molecule | /kcal·mol−1 | /kcal·mol−1 | |
| Ethane | −92.32 | −81.42 | |
| HPE | −11.44 | 6.86 | |
| HPEMe | −15.90 | 2.56 | |
| HPEEt | −23.26 | −2.98 | |
| HPEiPr | −31.42 | −11.68 | |
| HPEtBut | −41.28 | −18.74 | |
Table 2.
Delocalisation indices and selected topological properties of the electron density in atomic units at the bond critical points of the central C–C bonds in ethane and the compounds schematised in Figure 2. The corresponding computed bond lengths (angstroms) and formation energies (kcal/mol) for the formation of these chemical bonds are reported as well.
| Molecule | ||||||
| H3C–CH3 | 1.006 | 0.244 | −0.5597 | −0.196 | 1.519 | −99.72 |
| HPE | 0.853 | 0.182 | −0.3325 | −0.121 | 1.685 | −14.85 |
| HPEMe | 0.841 | 0.176 | −0.3130 | −0.115 | 1.703 | −20.41 |
| HPEEt | 0.860 | 0.186 | −0.3451 | −0.125 | 1.674 | −26.86 |
| HPEiPr | 0.860 | 0.188 | −0.3531 | −0.128 | 1.667 | −36.49 |
| HPEtBut | 0.865 | 0.188 | −0.3528 | −0.127 | 1.669 | −45.64 |
Table 3.
IQA interaction and deformation energies (Equation (12)) for the formation of ethane and hexaphenylethane from the corresponding free radicals. The values are reported in kcal/mol. The IQA interaction energy for the central C–C bond is written in parentheses.
Table 3.
IQA interaction and deformation energies (Equation (12)) for the formation of ethane and hexaphenylethane from the corresponding free radicals. The values are reported in kcal/mol. The IQA interaction energy for the central C–C bond is written in parentheses.
| Ethane | |||
| IQA partition | Dispersion correction | IQA-D | |
| Interaction energy | −196.273 (−172.737) | −0.921 | −197.194 |
| Deformation energy | 97.248 | 0.092 | −97.340 |
| Formation energy | −99.026 | −0.829 | −99.854 |
| Hexaphenylethane | |||
| IQA partition | Dispersion correction | IQA-D | |
| Interaction energy | −291.233 (−147.689) | −20.192 | −311.425 |
| Deformation energy | 300.870 | −0.691 | 300.179 |
| Formation energy | 9.637 | −20.884 | −11.246 |
Table 4.
Collective 1–3 interactions schematised in Figure 5 within the compounds of Figure 2 computed as approximated IQA interaction energies. The magnitude of these interactions are calculated with Equations (5)–(7) and (9). The dispersion component is also reported. The values are reported in kcal/mol.
 | |||
| HPE | |||
| Groups | IQA partition | Dispersion correction | IQA-D |
| A–4 | −3.395 | −0.551 | −3.945 |
| A–5 | −3.387 | −0.551 | −3.938 |
| A–6 | −3.417 | −0.553 | −3.970 |
| B–1 | −3.407 | −0.552 | −3.960 |
| B–2 | −3.371 | −0.549 | −3.921 |
| B–3 | −3.416 | −0.553 | −3.969 |
| Total | −20.393 | −3.309 | −23.703 |
| HPEMe | |||
| Groups | IQA partition | Dispersion correction | IQA-D |
| A–4 | −3.391 | −0.574 | −3.965 |
| A–5 | −3.372 | −0.574 | −3.946 |
| A–6 | −3.471 | −0.581 | −4.052 |
| B–1 | −3.440 | −0.580 | −4.020 |
| B–2 | −3.367 | −0.573 | −3.939 |
| B–3 | −3.470 | −0.581 | −4.051 |
| Total | −20.511 | −3.462 | −23.972 |
| HPEEt | |||
| Groups | IQA partition | Dispersion correction | IQA-D |
| A–4 | −3.399 | −0.592 | −3.991 |
| A–5 | −3.350 | −0.587 | −3.937 |
| A–6 | −3.460 | −0.597 | −4.057 |
| B–1 | −3.436 | −0.599 | −4.035 |
| B–2 | −3.363 | −0.591 | −3.954 |
| B–3 | −3.443 | −0.595 | −4.035 |
| Totla | −20.451 | −3.560 | −24.011 |
| HPEiPr | |||
| Groups | IQA partition | Dispersion correction | IQA-D |
| A–4 | −3.363 | −0.640 | −4.002 |
| A–5 | −3.443 | −0.603 | −4.046 |
| A–6 | −3.436 | −0.613 | −4.049 |
| B–1 | −3.443 | −0.615 | −4.058 |
| B–2 | −3.460 | −0.604 | −4.063 |
| B–3 | −3.350 | −0.585 | −3.935 |
| Total | −20.495 | −3.659 | −24.154 |
| HPEtBut | |||
| Groups | IQA partition | Dispersion correction | IQA-D |
| A–4 | −3.428 | −0.638 | −4.067 |
| A–5 | −3.280 | −0.630 | −3.910 |
| A–6 | −3.470 | −0.641 | −4.111 |
| B–1 | −3.429 | −0.638 | −4.067 |
| B–2 | −3.279 | −0.630 | −3.910 |
| B–3 | −3.469 | −0.641 | −4.110 |
| Total | −20.356 | −3.819 | −24.175 |
Table 5.
IQA interaction energies (Equation (9)) among the phenyl groups bonded to the central carbon atoms of hexaphenylethane. The dispersion component is also reported. The numbering of the phenyl atoms is indicated in the Scheme. The values are reported in kcal/mol.
Table 5.
IQA interaction energies (Equation (9)) among the phenyl groups bonded to the central carbon atoms of hexaphenylethane. The dispersion component is also reported. The numbering of the phenyl atoms is indicated in the Scheme. The values are reported in kcal/mol.
 | |||
| Phenyl groups | IQA partition | Dispersion correction | IQA-D |
| 1–4 | −28.177 | −3.586 | −31.763 |
| 1–5 | −10.278 | −1.372 | −11.650 |
| 1–6 | −0.225 | −0.587 | −0.813 |
| 2–4 | −0.229 | −0.585 | −0.814 |
| 2–5 | −28.179 | −3.639 | −31.818 |
| 2–6 | −10.315 | −1.368 | −11.683 |
| 3–4 | −10.257 | −1.367 | −11.624 |
| 3–5 | −0.230 | −0.589 | −0.819 |
| 3–6 | −28.039 | −3.636 | −31.675 |
| Total | −115.928 | −16.731 | −132.659 |
Disclaimer/Publisher’s Note: The statements, opinions and data contained in all publications are solely those of the individual author(s) and contributor(s) and not of MDPI and/or the editor(s). MDPI and/or the editor(s) disclaim responsibility for any injury to people or property resulting from any ideas, methods, instructions or products referred to in the content. |
© 2025 by the authors. Licensee MDPI, Basel, Switzerland. This article is an open access article distributed under the terms and conditions of the Creative Commons Attribution (CC BY) license (http://creativecommons.org/licenses/by/4.0/).
Copyright: This open access article is published under a Creative Commons CC BY 4.0 license, which permit the free download, distribution, and reuse, provided that the author and preprint are cited in any reuse.


