
Submitted:
01 October 2025
Posted:
02 October 2025
You are already at the latest version
Abstract
The article presents a comparative analysis of two main chemometric regression methods in the determination of nine quality parameters of honey samples, through the analysis of their spectral data. 29 types of honey from 14 regions of Bulgaria form the experimental sample included in the study. The reference values of heavy metals - arsenic (As), cadmium (Cd), lead (Pb), iron (Fe), the amount of pH, reducing sugars, sweet disaccharide and water content were obtained in a certified laboratory. The spectral characteristics of the honey samples were obtained using an Ocean Optics spectrophotometer and are in the range of 100 - 1000 nm. The accuracy of the two chemometric regression methods PLSR and PCR for determining the quality parameters of honey samples was assessed. The results show that more accurate results are obtained with PLSR. The best results for predicting the main quality parameters of honey are shown by PLSR with values for the presence of heavy metals on R2 from 0.4881 for cadmium to 0.7981 for lead; as well as for the evaluation of the main physicochemical parameters from 0.4061 for reducing sugar to 0.5693 for Sweet disaccharide.
Keywords:
honey
; spectral analysis
; chemometric regression
; quality assessment
1. Introduction
The quality evaluation of food and agricultural products is a main topic with significant meaning and growing interest in the scientific field. The increasing efforts to ensure authenticity in the food industry have led to collective actions from producers and suppliers, together with regulators and researchers, to address the entire production and distribution cycle.
Honey and bee products are a true natural gift to humans. Honey is rightly called a superfood with a wide range of uses – not only delicious, high-nutritional, and healthy for everyday consumption, but also healing for internal and external use. The honey primarily consists of various carbohydrates, and its composition can vary depending on factors such as environmental conditions, climate, plant species, and also beekeeping practices.
Bulgaria has a large beekeeping production and a sustainable part in the honey distribution chain in Europe. Controlling honey quality indicators from the raw material to the product on the store shelf is a key factor in maintaining a good reputation for Bulgarian honey. The task is certainly difficult because of the diverse nature of that biological product. Honey purity, bio origin, and absence of harmful chemical ingredients present a growing challenge to food safety, food fraud detection, and consumer confidence.
The purpose of the qualification is to determine the quality and plant origin, ecological purity, and possible adulterations, as well as to establish whether it was obtained, processed, and stored under optimal conditions. This is achieved through a comprehensive study of the organoleptic and physicochemical properties, the amount of its main components, and various contaminants, combined with microscopic examination of the sediment after centrifugation of the aqueous solutions of honey /pollen analysis/. Pollen analysis is very often used to determine the plant origin of honey. It is based on the fact that honey always contains pollen from the plants from which the nectar was collected, on the one hand, and the differences in the size, shape, and structure of the shells of the pollen grains of individual plants.
Regarding the methods for analyzing honey, there is a trend towards the unification of analytical methods worldwide and the introduction of modern, accurate, and rapid methods with high reproducibility. The International Honey Commission has proposed such methods, which are recognized as official and are used in quality control. These methods are also included in the Bulgarian Regulation on Sampling and Methods of Analysis in the Control of Honey (Bogdanov et al., 1997; Ivanov, 2006).
Traditional methods for determining the physicochemical properties of honey are quite laborious, require special skills, consumables, and good analytical skills. In addition, they take a lot of time. This can be saved with the help of rapid analytical techniques, which can quickly and easily detect non-compliance with regulatory requirements. In recent years, many studies have been conducted to find fast and inexpensive methods for the qualification of food products.
As an alternative to traditional methods, spectroscopic analysis in the near-infrared region (near–infrared spectroscopy – NIRS) can be employed. A significant difference of this method compared to the others is that it analyzes the samples without preliminary chemical treatment, dissolution, or separation of components. The advantage of the method is that it is fast and does not require anything other than a spectrophotometer, software for processing spectral data, and a sample. In addition, the integrity of the sample is preserved, and it can be used for other analyses. Usually, in quantitative analysis, some kind of linear model is sought for the relationship between the NIRS information and the chemical information. The obtained results show good accuracy in determining glucose, fructose, di- and trisaccharides, moisture, electrical conductivity, optical activity, etc., which are important criteria for evaluating honey.
The main areas in which authors work on the topic of honey analysis are as follows: floral and geographic origin detection [Bogdanov, Maionea], authenticity [Zhang, 2023], adulteration recognition [Furong Huang, 2020; Md Abdullah Al Noman,2025; Hategan], quality assessment [Truong,2022; Zhang, 2021], and determination of chemical content [Silva; Koraqi, Nunes]. Information concerning the chemical content and presence of heavy metals in honey is crucial for producing high-quality honey for the food chain market.
[Bogdanov] reviewed multitude of known physico-chemical methods used for the determination of the botanical origin of honey. Using statistical methods such as principal component analysis (PCA); linear discriminant analysis (LDA) and cluster analysis (CA) the authors concluded, that a good classification of unifloral honeys in regard to different honey quality parameters - sugars; electrical conductivity; optical rotation; acidity, proline; and nitrogen content could be achived.
Routine physicochemical methods are used in the classical approach for the authentication of botanical origin, together with pollen and melissopalynological analysis. These methods are mostly validated and widely used in the routine control of honey, but this approach is laborious and depends on highly specialized personnel.
In the available scientific literature on the topic for assessing the origin of honey employment of several different analytical techniques such as gas chromatography coupled to mass spectrometry, vibrational spectroscopy, NMR, and physico-chemical properties has been discussed.
[Silva] This study used the inductively coupled plasma optical emission spectrometry technique (ICP OES) to determine the concentration of metals (Al; Ca; Cu; Fe; Li; K; Mg; Mn; Na and Zn) in honey samples to determine geographic origin and authenticity by use of statistical techniques and Machine Learning. This approach proved very efficient in discriminating the origin of the honey samples.
The study of [Kassa] evaluated heavy metal concentrations in honey samples collected from 5 regions in Ethiopia to assess the safety of the honey for consumption. Heavy metal content was quantified using an Atomic Absorption Spectrophotometer after sample digestion with an acid solution. Physicochemical parameters including moisture content; electrical conductivity; pH; ash content; and temperature were analyzed. The results showed that all honey samples met international quality standards.
[Koraqi H. ] This study examined the standard physicochemical properties; bioactive components and antioxidant activity of Kosovan honeys according to their floral source. The Kohonen Neural Network (KNN); and Principal Component Analysis (PCA) were used to identify and group botanical origin and the results showed the usefulness of two methods for dimensionality reduction and detecting the structure and general regularities.
[Maionea] in their review the application of multivariate data analysis and machine learning techniques for exploratory and prediction analysis of honey origin are reported. Most of the studies reviewed base their methods on atomic spectra and physicochemical properties as descriptive variables for honey. Sensorial data obtained from electronic tongue and nose; and color histograms of honey images also show high discriminative power for ascertaining honey origin. Principal component analysis (PCA); discriminant analysis (DA), and cluster analysis are the preferred techniques for performing exploratory and predictive analyses for the purpose of identifying origin.
Spectroscopic sensing techniques combined with chemometric approaches have been widely used for the quality evaluation of food and agro-products. The deep learning approach combined with NIR spectroscopic sensing techniques has shown great potential for quality evaluation of food and agro-products. Current advances in deep learning-based qualitative analysis include variety identification, geographical origin detection, and bruise detection, whereas quantitative analysis includes multiple-component content prediction for fruits, grains, and crops.
To obtain the information from spectral data, many linear and nonlinear chemometric methods, including partial least squares (PLS), artificial neural network (ANN), and support vector machine (SVM), have been developed to quantify the properties of food and agro-products. However, these nonlinear models usually produce many parameters and are confronted with the risk of overfitting.
Artificial neural networks (Schuhfried et al., 2016), decision and regression trees (Popek et al., 2017), regression models (Wei and Wang, 2014), and support vector machines (Gan et al., 2016) are among the popular machine learning algorithms for data classification, which are used in honey analyses. The CNNs are the first developed and widely used deep learning approaches for spectral analysis. In recent years, researchers have focused on deep learning methods. The critical characteristic of deep learning is the data-driven strategy for extracting hidden features from raw data without human engineering and prior knowledge.
[Nunes] aimed to determine the chemical profile of floral honey by ultraviolet and visible spectrophotometry (UV–vis) and near-infrared (NIR) vibrational spectroscopy. The analysis includes also the total phenolic content (TPC), considering two harvest years, geographic and botanical origins, and seasonality of samples collected in southern Brazil. The authors concluded that the total phenolic content (TPC) of honey showed great variation by geographic origin. Their work showed that the UV–vis range of 260–360 nm coupled to PCA can distinguish honey with higher and lower TPC. The NIR spectral data set revealed discrepancies in honey according to the harvest seasons. Nunes et. Al. proved UV–vis and NIR spectroscopies coupled to PCA to be a useful approach to distinguish honey samples as to possible adulterations and geographic origin associated with their higher and lower phenolic contents.
The study of Truong et al. [Truong] used analysis of spectral information (based on important spectral bands) and showed the good ability of Vis-NIRS to capture unique chemical information related to potency and purity. In the same study, Methylglyoxal (MGO) is set as the primary antibacterial in manuka honeys, but there are other chemical markers contributing to its value. Chemometric models using Partial Least Squares (PLS), Support Vector Machine (SVM), and discriminant analysis, PLS-DA, and SVM-DA (RBF) were developed to predict manuka honey potency and purity. The authors achieved a prediction of potency with 74 % accuracy by a PLS regression model. For prediction of botanical origin, PLS-DA and SVM-DA classifiers - 89 % overall accuracy, but for mono-floral manuka honeys, especially 92–97 % accuracy.
Furong Huang used Near-infrared spectroscopy (NIR) and mid-infrared (MIR) spectroscopy data for the detection of adulteration in honey together with an SVM classifier [Furong Huang; 2020]. The pre-processing step of raw data includes First Derivative (FD) transform, Second Derivative (SD) transform, Multiple Scattering Correction (MSC), and Standard Normal Variate Transformation (SNVT), as well as low-level and intermediate-level data fusion. Then, Grid Search (GS); Genetic Algorithm (GA), and Particle Swarm Optimization (PSO) were employed as the optimization algorithms to find the optimal SVM parameters and to establish the best model. The results reveal that intermediate-level data fusion significantly improves the detection model, as the accuracy, sensitivity, and specificity of the optimal SVM model reach 100%.
[Md Abdullah Al Noman;2025] proposed a rapid approach for authenticating honey and detecting multiple adulterants using visible, ultraviolet, and near infrared spectroscopy (200–900 nm). PCA was used to extract informative spectral regions. The Random Forest (RF); Support Vector Machine (SVM), and Soft Independent Modeling of Class Analogy (SIMCA) were used for predicting. RF model achieved the highest performance with classification accuracies between 99-100 % depending on adulterant type. Principal Component Analysis (PCA) was used to extract informative spectral regions, and the following ranges were established as significant: 350–450 nm for botanical classification; 200–600 nm for adulteration detection; and 596–605 nm for differentiating adulterants.
[Hategan] developed models for the prediction of honey botanical origin and harvesting year based on isotope and elemental fingerprints. For each classification criterion, significant focus was dedicated to the data preprocessing phase to enhance the models. The application of Artificial Neural Networks (ANNs) is highlighted as efficient, as the obtained classification performances, including accuracy scores, are higher than 86% during the test set.
In this background, the purpose of the present study is to find a rapid, accurate, and effective single analytical method for analyzing honey samples for heavy metal contamination. NIR spectroscopic sensing techniques combined with regression analysis were used for predicting the presence of heavy metals - arsenic (As), cadmium (Cd), lead (Pb), iron (Fe), Hg, and pH, amount of pH, reducing sugars, sweet disaccharide, and water content.
2. Materials and Methods
2.1. Honey Samples Collection and Spectral Data Acquisition
Honey samples from 14 regions of Bulgaria formed a set of 29 samples included in the study. The following regions of production took part in the study: Stara Zagora, Borovo, Pamukchii, Pustrene (Stara Zagora region), Ruse, Brestovica, Yuper, Modjereto, Novo selo, Ivanovo (Ruse region), Razgrad, Haskovo, Turgovishte, Sliven. Thirteen types of honey floral origin were selected: Rapeseed; Sunflower; Linden; Multiflower; Sunflower; Rapeseed & Amorpha; Acacia & Mana; Draka & Pustren; Acacia; Lavender; Mana; Multiflower; Acacia & Rapeseed.
Samples are preliminarily evaluated in the certificated laboratory by chemical analysis for the determination the content of the following metals: arsenic (As); cadmium (Cd); lead (Pb); iron (Fe), and components: amount of pH; reducing sugars; sweet disaccharide, and water content shown in Table 1.
The principal methodology for chemical analysis of honey probes includes burning samples in an analyzer furnace, separation of mercury vapor, transformation into the form of amalgam, heating and release of free mercury, and determination of components by measuring the absorption of radiation with a wavelength of 253.64 nm. AMA 254 Mercury Analyzer (Altec – Czech Republic) was used for the analysis, an oxygen cylinder, and nickel boats for burning samples. As a software tool, AMA/ama.exe analyzer program was used. Our preliminary analyses (Penchev et.al., 2024) include a detailed presentation of laboratory results for all listed chemical parameters.
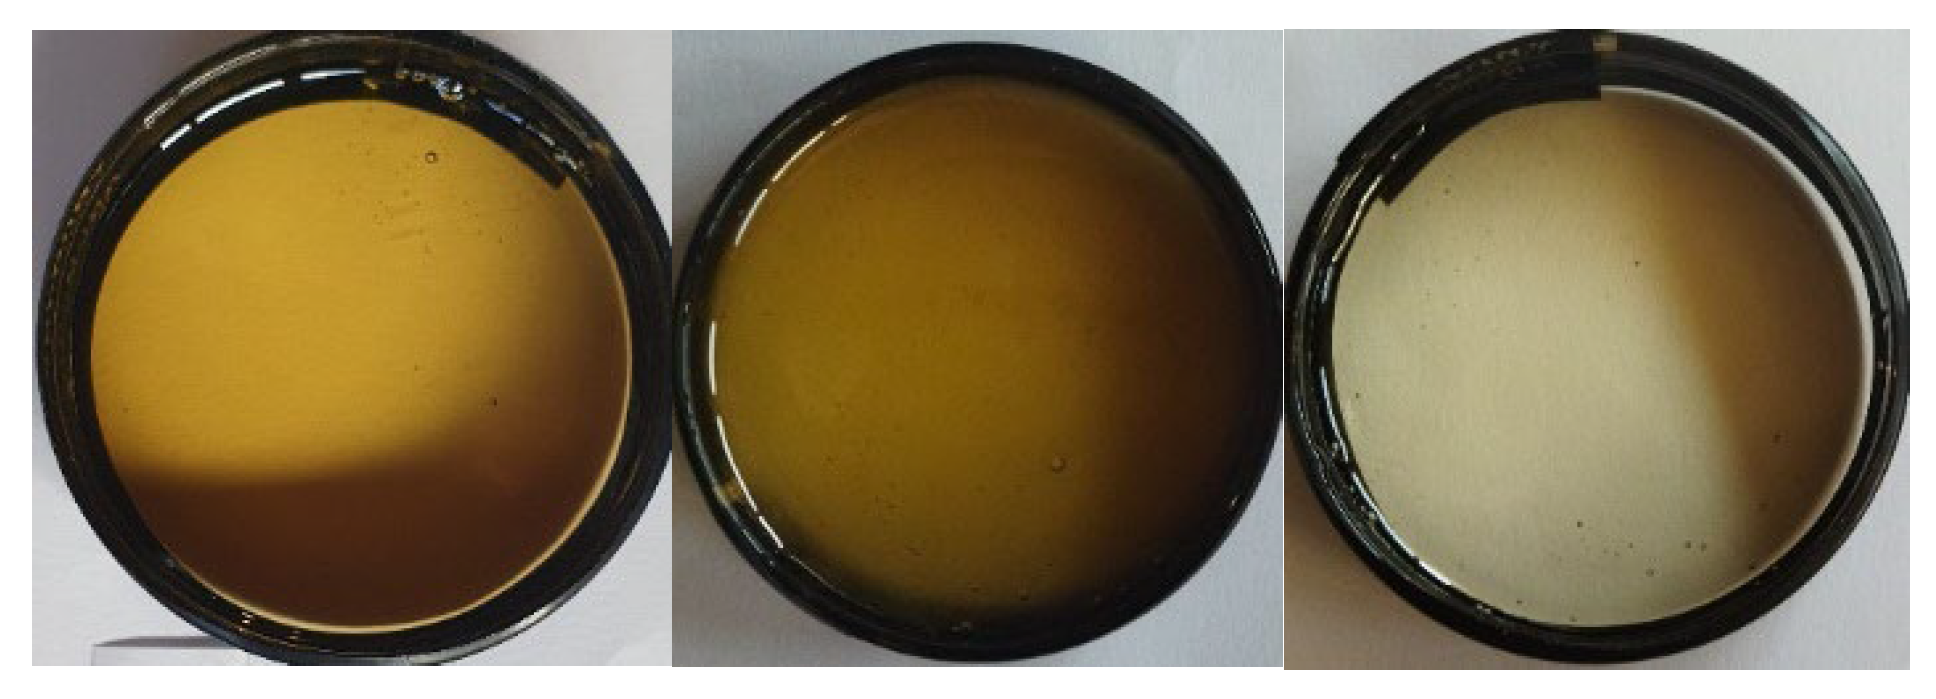
Preparation of samples for spectral data acquisition includes liquefying (decrystallization) in advance. To keep honey characteristics unaffected, melting at a temperature below 45ºC was carried out. Еach sample consisted of 10 ml decrystallized organic honey. A petri dish with a 60 mm diameter was used to collect the probes.
Figure 1.
Honey samples 7, 17, 29.
The spectral characteristics of the copper samples were obtained in daylight, placed in cuvettes, and using a special attachment for placing the probe on the spectrophotometer, as shown in Figure 2.
The spectral data of 29 honey samples are shown in Figure 3.
The obtained spectral data of the copper samples served as the basis for subsequent extraction of informative characteristics of the quality indicators. Data processing was performed using the MATLAB software.
2.2. Chemometric Regression Methods Used for Quality Evaluation of Honey Samples
In this study, two chemometric regression techniques, Partial Least Squares Regression (PLSR) and Principal Components Regression (PCR), were used in Matlab to determine the quality parameters of 29 honey samples. The selection of an appropriate regression analysis method was based on a review of studies conducted by other authors working on similar tasks [17,18,19].
PLSR and PCR are both methods to model a response variable when there are a large number of predictor variables, and those predictors are highly correlated or even collinear. Both methods construct new predictor variables, known as components, as linear combinations of the original predictor variables, but they construct those components in different ways.
PCR is a regression approach that first uses principal component analysis on the training data to reduce its dimensionality; then a regression (e.g., linear) is applied and trained on the resulting samples. In PCA, the transformation is completely unsupervised, meaning that no information about the targets is used. As a result, PCR may perform poorly on some data sets where the target is highly correlated with data with low variance. In effect, PCA dimensionality reduction projects the data into a lower-dimensional space where the variance of the projected data is highly maximized along each axis. Although they have the greatest predictive power on the target, the directions with lower variance will be discarded and the final regression will not be able to use them.
PLSP simultaneously performs data transformation and modeling. This method also applies dimensionality reduction to the samples before applying a linear regressor to the transformed data. The main difference with PCR is that in PLS, the transformation is supervised.
2.3. Evaluation Metrics
Currently, a wide range of metrics are used in classification tasks to evaluate the performance of regression models, which allow for numerical evaluation of the performance of the models. In this research coefficient of determination is used for models performance evaluation.
The coefficient of determination (R2) measures how well a statistical model predicts an outcome. The outcome is represented by the model’s dependent variable.
The lowest possible value of R2 is 0 and the highest possible value is 1. The better model has closer R2 to 1.
If the R2 is 0, the linear regression model doesn’t allow to predict exam scores any better than simply estimating that everyone has an average exam score. If the R2 is between 0 and 1, the model allows you to partially predict exam scores. If the R2 is 1, the model allows you to predict precise exam score.
The coefficient R2 is a measure of goodness of fit. It is the proportion of variance in the dependent variable that is explained by the model. It is calculate using the regression outputs, presented in Equation (1).
Where RSS is sum of squared residuals;
TSS – total sum of squares.
3. Results and Discussion
The results of the experimental study are divided into two parts: one concerns the assessment of the presence of heavy metals, and the other - of the physicochemical indicators.
3.1. Determination the Content of the Heavy Metals
To form a simpler model, a smaller number of components could be used. The percentage of variance explained in the response variable as a function of the number of components, presented in Figure 4 for the presence of heavy metals, is used to select the number of components.
It details the number of underlying dimensions on which most of the variance is observed. The first component makes up from 0 to 38% of the explained variance. This is relatively low as compared to other datasets, but no matter of concern. It simply indicates that a major share (100%–38%=62%) of observations distributes across more than one dimension.
In the study, we need to reduce the dimensionality of the data and retain at least 90% of the variance of the original data. Then, we need to include at least 3 components to reach at least 90% for arsenic, lead and iron; for cadmium - at least 5 components. From 7 components upwards, 100% variance is reached for all four types of metals.
A PCR model with two principal components was created. A principal component analysis of the spectral data was performed. In this case, PCR is a linear regression of the response variable on these two components.
The PCR results are plotted against the original spectral data, with the regression coefficients for the original, uncentered variables transformed.
Figure 5 shows the fit versus observed response for the PLSR and PCR fits.
The two PLS components are much better predictors of the observed y, but they explain slightly less variance in the observed X than the first two principal components used in the PCR.
Estimated mean square prediction error as a function of the number of components for arsenic (As) a), cadmium (Cd) – b), lead (Pb) – c), iron (Fe) – d) is shown in Figure 6.
The number of components can be chosen to minimize the expected error in predicting the response from future observations on the values of the quality parameters - the presence of heavy metals. When using a larger number of components, higher prediction accuracy is achieved, but this is often associated with greater computing power. Cross-validation is often used as a more statistically sound method for choosing the number of components in PLSR or PCR. It avoids overfitting of data by not reusing the same data for both model fitting and prediction error estimation. Thus, the prediction error estimate is not optimistically biased downward. In PLS and PCR, there is an option to estimate the mean squared prediction error (MSEP) through cross-validation.
The mean square error curve of the prediction of the As values for PLSR shows that two components do the best possible job, while PCR needs eight components to obtain similar prediction accuracy. When predicting the Cd values for PLSR and PCR, one component is sufficient to obtain good prediction accuracy. When predicting the lead values for PLSR shows that four components do the best possible job, while PCR needs six components to obtain good prediction accuracy. When predicting the iron values for PLSR and PCR, two components are sufficient to obtain good prediction accuracy.
The effectiveness of the two chemometric methods PLSR and PCR when two components are used for quantitative assessment of the values of heavy metals present in honey samples was assessed by the coefficient of determination indicator, the values of which are presented in Table 2.
The estimated mean squared error of prediction shows that PLSR has a better predictive ability for the presence of heavy metals in honey. The values from both regressions confirm this.
3.2. Determination the Content of the Physicochemical Indicators
For the remaining physicochemical indicators - pH value; reducing sugars; sweet disaccharide and water content, a similar analysis was performed as for the presence of heavy metals.
Estimated mean square prediction error as a function of the number of components for amount of pH - a), reducing sugars – b), sweet disaccharide – c), water content – d) is shown in Figure 7.
The effectiveness of the two chemometric methods PLSR and PCR when two components are used for quantitative assessment of the values of physicochemical indicators present in honey samples was assessed by the coefficient of determination indicator, the values of which are presented in Table 3.
The estimated root mean square error of prediction shows that PLSR has a similar predictive ability to PCR for the presence of physicochemical indicators in honey. The values from both regressions confirm this.
4. Conclusions
In this article, data from the near infrared spectrum are used to create regression models for assessing and predicting the main quality parameters of copper - the presence of heavy metals and basic physicochemical indicators. The proposed approach for determining the quality parameters of copper using spectral data and regression methods is suitable for the analysis of copper samples and could be easily implemented and used in industrial conditions for assessing the quality of copper. The achieved recognition accuracy meets the requirements in this area.
A comparative analysis of two main chemometric methods for refractometry analysis was made, and experiments were conducted with 29 samples of Bulgarian copper from different regions in the country.
The best results for predicting the main quality parameters of honey are shown by PLSR with values for the presence of heavy metals on from 0.4881 for cadmium to 0.7981 for lead; as well as for the evaluation of the main physicochemical parameters from 0.4061 for reducing sugar to 0.5693 for Sweet disaccharide.
The regression equations obtained from the relationship between the main quality parameters of honey and its spectral characteristics, together with the regression method, serve as the basis for the development of a compact tool for the evaluation of honey quality indicators.
Author Contributions
Conceptualization, Tsvetelina Georgieva; Project administration, Plamen Daskalov; Data curation, Ivaylo Hristakov and Eleonora Nedelcheva; Resources, Tsvetelina Georgieva, Magdalena Kachel and Stanislav Penchev; Software and Formal analysis, Tsvetelina Georgieva; Writing—original draft preparation, Tsvetelina Georgieva and Eleonora Nedelcheva, Visualization, Eleonora Nedelcheva, Writing – review & editing, Plamen Daskalov,
Funding
The research was financed by the European Union-NextGenerationEU through the National Recovery and Resilience Plan of the Republic of Bulgaria, project No, BG-RRP-2,013–0001-C01,
Data Availability Statement
The raw/processed data required to reproduce these findings cannot be shared at this time, as the data also forms part of an ongoing study. Yet the data can be provided to readers when kindly asked,
Acknowledgments
In this section, you can acknowledge any support given which is not covered by the author contribution or funding sections, This may include administrative and technical support, or donations in kind (e,g,, materials used for experiments),
Conflicts of Interest
The authors have no conflicts of interest to declare.
References
- Chen; L.; Wang; J.; Ye; Z.; Zhao; J.; Xue; X.; Heyden; Y. Vander; Sun; Q.; 2012.Classification of Chinese honeys according to their floral origin by near infrared spectroscopy. Food Chem. 135; 338–342. [CrossRef]
- Devi; A.; Jangir; J.; K.A.; A.-A.; 2018. Chemical characterization complemented with chemometrics for the botanical origin identification of unifloral and multifloral honeys from India. Food Res. Int. 107; 216–226. [CrossRef]
- Rochman; S.; & Mukhtar; M. N. A. (2019). Classification of the quality of honey using the spectrofotometer and machine learning system based on single board computer. Tibuana; 2(01); 45–49. [CrossRef]
- Truong T. D. H.; Reddy P.; Reis M.M.; Archer R.; (2022). Quality assessment of mānuka honeys using non-invasive Near Infrared systems; Journal of Food Composition and Analysis; Volume 114; 104780; ISSN 0889-1575. [CrossRef]
- Zhang X.; Yang J.; Lin T.; Ying Y. (2021). Food and agro-product quality evaluation based on spectroscopy and deep learning: A review; Trends in Food Science & Technology; Vol. 112; 431-441; ISSN 0924-2244.
- . [CrossRef]
- Maionea, C.; F Barbosa, Jr.; Barbosa, R.M. Predicting the botanical and geographical origin of honey with multivariate data analysis and machine learning techniques: A review. Computers and Electronics in Agriculture 157 (2019) 436–446. [CrossRef]
- Bogdanov, S.; ruoff, K.; Persano Oddo, L. (2004). Physico-chemical methods for the characterisation of unifloral honeys: a review; Apidologie 35 S4–S17; INRA/DIB-AGIB/ EDP Sciences. [CrossRef]
- Md Abdullah Al Noman; Anannya Barua Nijhum; Iqbal Hossain; Md Sakibul Islam; Istiaq Mahmud Sifat; Mohammad Gulzarul Aziz; Afzal Rahman; NON- ESTRUCTIVE adulterants detection in Various honey types in Bangladesh using UV–VIS–NIR spectroscopy coupled with machine learning algorithms; LWT; Volume 228; 2025; 118125; ISSN 0023-6438. [CrossRef]
- Silva A.; Maciel M.C.; Ferreira de Oliveira A.A.; Ferreira de Oliveira T.; Evaluation of the content of macro and trace elements and the geographic origin of honey in North Brazil through statistical and machine learning techniques; Journal of Food Composition and Analysis; Volume 128; 2024; 106050; ISSN 0889-1575. [CrossRef]
- Koraqi H.; Wawrzyniak J.; Aydar A. Y.; Pandiselvam R.; KhalideW.; Petkoska A. T.; Karabagias I.K.; Ramniwas S.; Rustagi S.;Application of multivariate analysis and Kohonen Neural Network to discriminate bioactive components and chemical composition of kosovan honey; Food Control; Volume 172; 2025; 111072. [CrossRef]
- Kassa A.; Ayalew M.Chemometric analysis of physicochemical properties and heavy metal content in honey: A case study from Saint Adijibar; South Wollo; Amhara; Ethiopia. Journal of Food Composition and Analysis 146 (2025) 107923. [CrossRef]
- HATEGAN A.R.; DEHELEAN A.; PUSCAS R.; CRISTEA G.; BELC N.; MUSTATEA G.; MAGDAS D.A.; The development of honey recognition models with broad applicability based on the association of isotope and elemental content with ANNs; Food Chemistry; Volume 458; 2024; 140209. [CrossRef]
- Nunes A.; Azevedo G.Z.; Rocha dos Santos B.; Melo de Liz M.S.; Schneider F.S.; Rodrigues E. R.; Moura S.; Maraschin M.; A guide for quality control of honey: Application of UV–vis scanning spectrophotometry and NIR spectroscopy for determination of chemical profiles of floral honey produced in southern Brazil; Food and Humanity; Volume 1; 2023; Pages 1423-1435. [CrossRef]
- Furong Huang; Han Song; Liu Guo; Peiwen Guang; Xinhao Yang; Liqun Li; Hongxia Zhao; Maoxun Yang; Detection of adulteration in Chinese honey using NIR and ATR-FTIR spectral data fusion; Spectrochimica Acta Part A: Molecular and Biomolecular Spectroscopy; Volume 235;2020;118297; ISSN 1386-1425. [CrossRef]
- Zhang Xiao-Hua; Gu Hui-Wen; Liu Ren-Jun; Qing Xiang-Dong; Nie Jin-Fang.(2023). A comprehensive review of the current trends and recent advancements on the authenticity of honey. Food Chemistry: X 19 (2023) 100850. [CrossRef]
- Davor Valinger, Lucija Longin, Franjo Grbeš, Maja Benković, Tamara Jurina, Jasenka Gajdoš Kljusurić, Ana Jurinjak Tušek, Detection of honey adulteration – The potential of UV-VIS and NIR spectroscopy coupled with multivariate analysis, LWT, Volume 145, 2021, 111316, ISSN 0023-6438. [CrossRef]
- Andrews A. Boateng, Salma Sumaila, Michael Lartey, Mahmood B. Oppong, Kwabena F.M. Opuni, Lawrence A. Adutwum, Evaluation of chemometric classification and regression models for the detection of syrup adulteration in honey, LWT, Volume 163, 2022, 113498, ISSN 0023-6438. [CrossRef]
- Yang Li, Yue Huang, Jingjing Xia, Yanmei Xiong, Shungeng Min, Quantitative analysis of honey adulteration by spectrum analysis combined with several high-level data fusion strategies, Vibrational Spectroscopy, Volume 108, 2020, 103060, ISSN 0924-2031. [CrossRef]
Figure 2.
Spectral data acquisition workstation for honey samples.
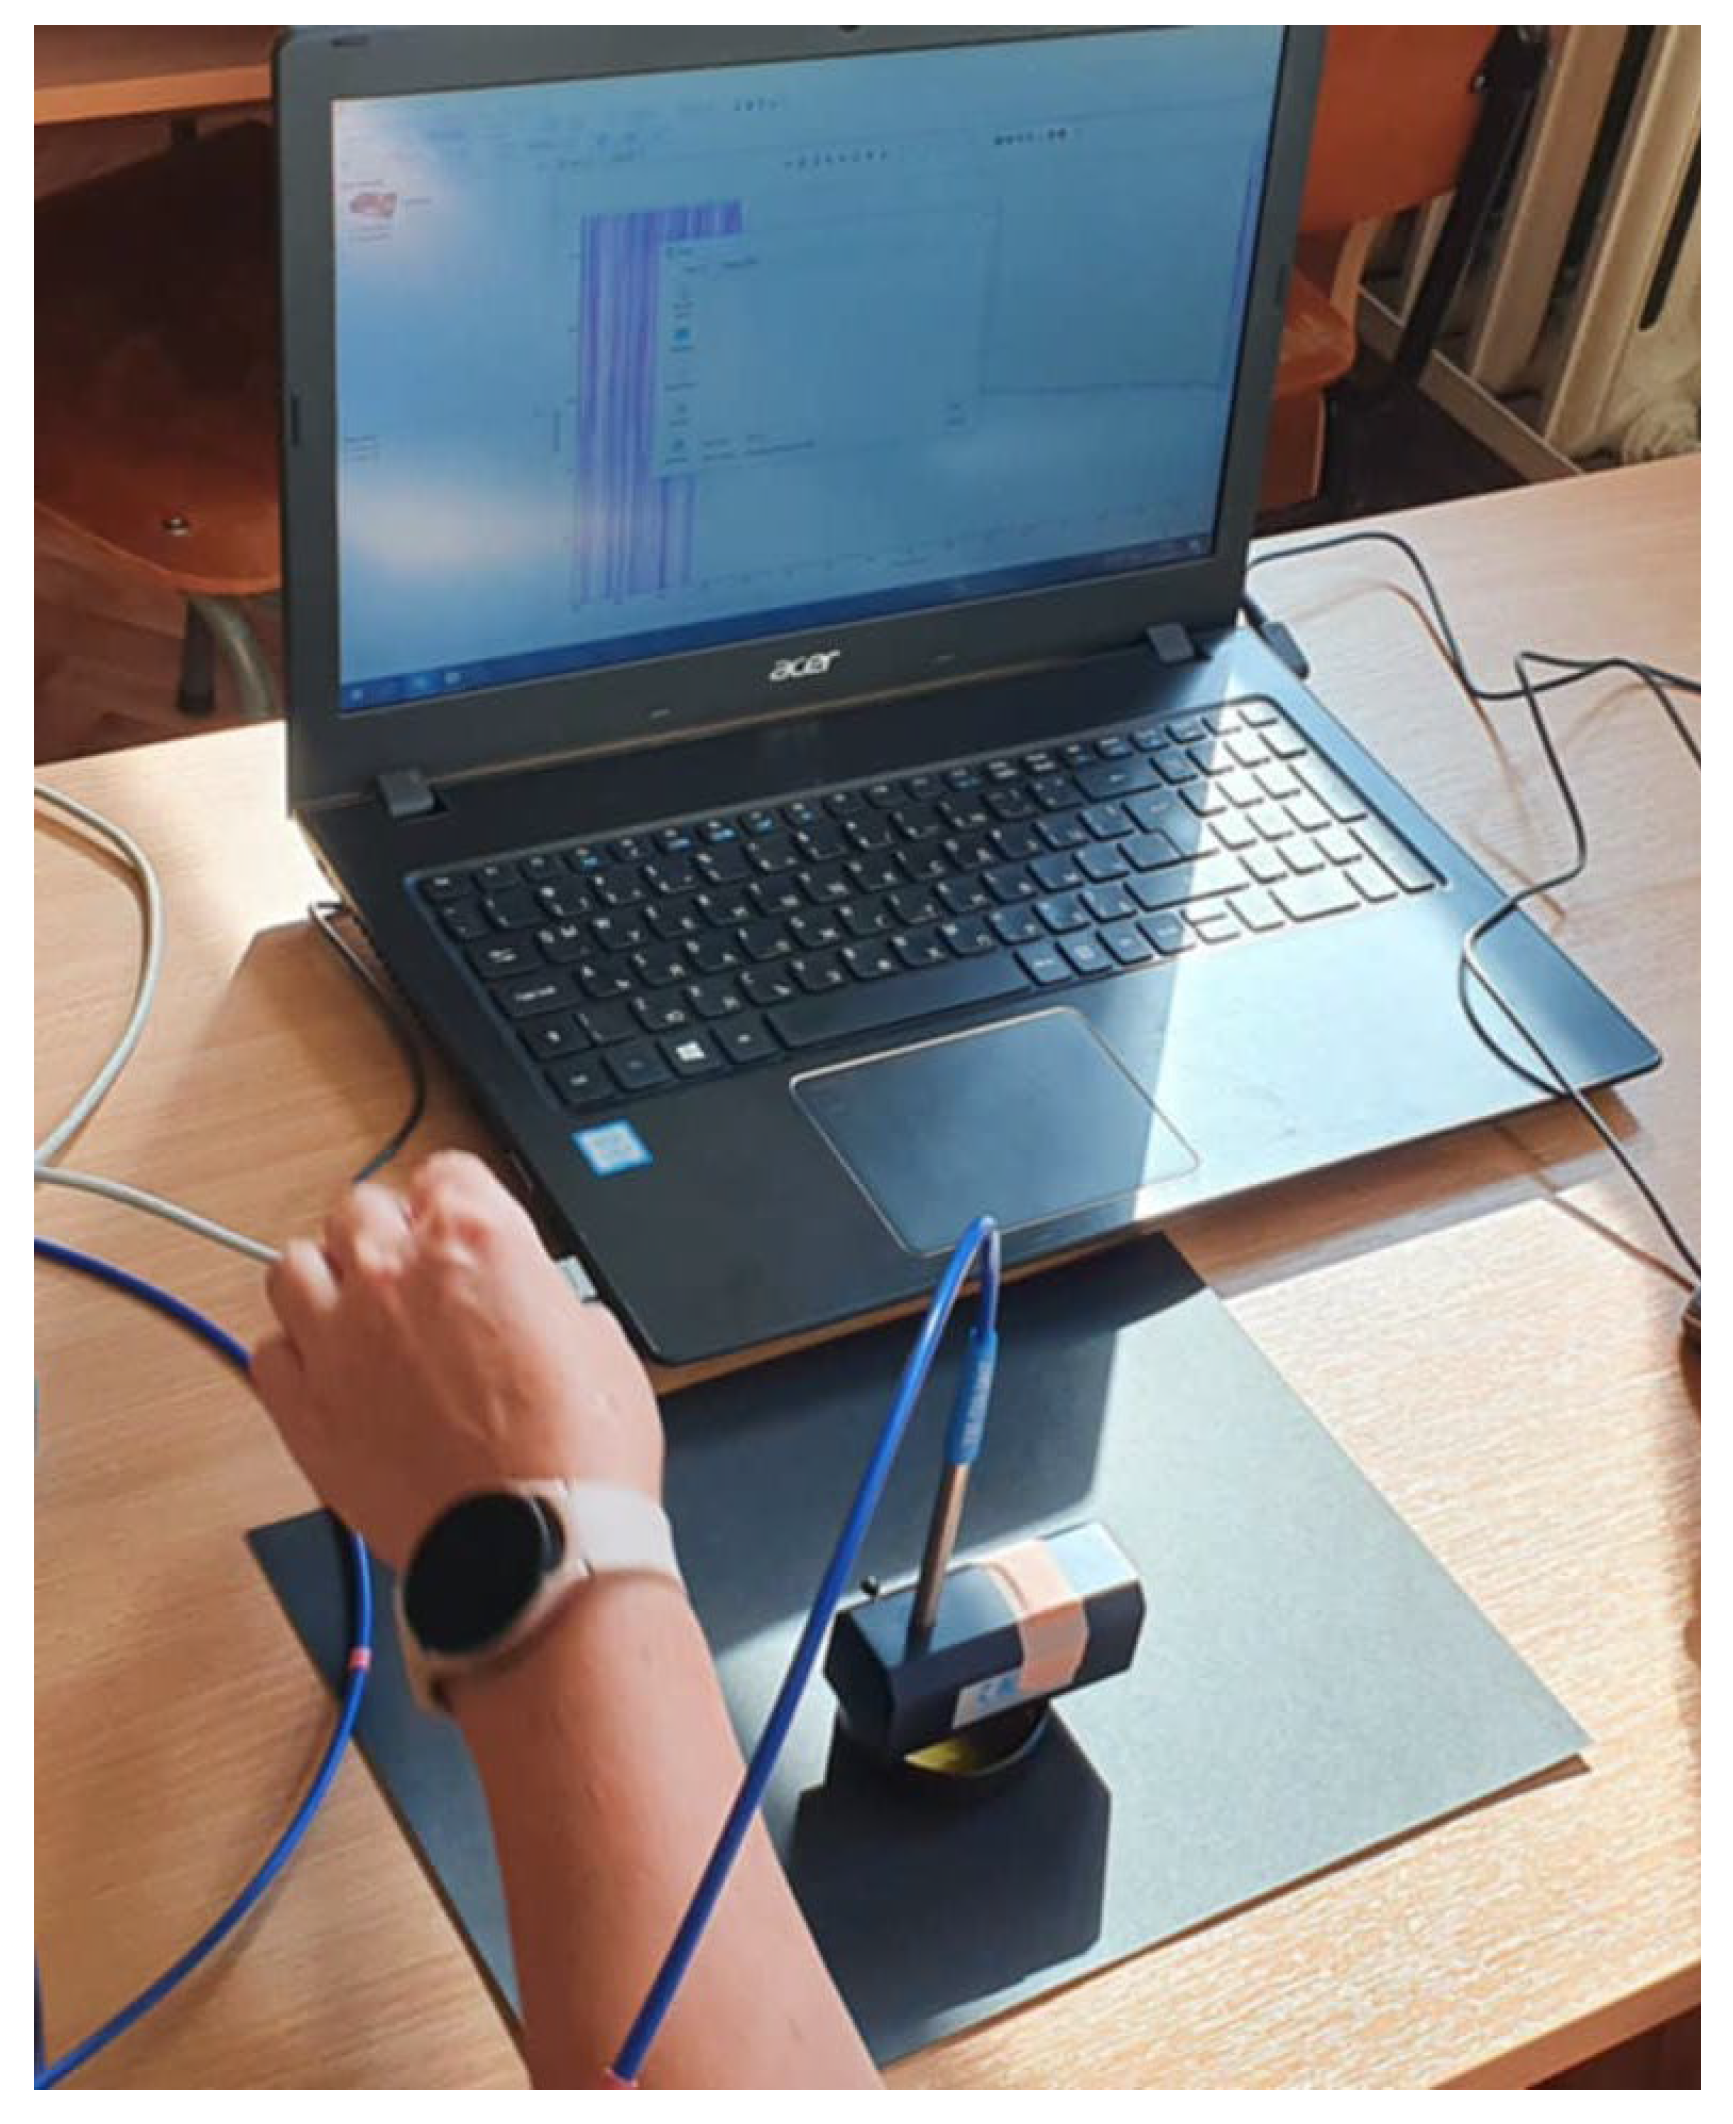
Figure 3.
Spectral data of 29 honey samples.
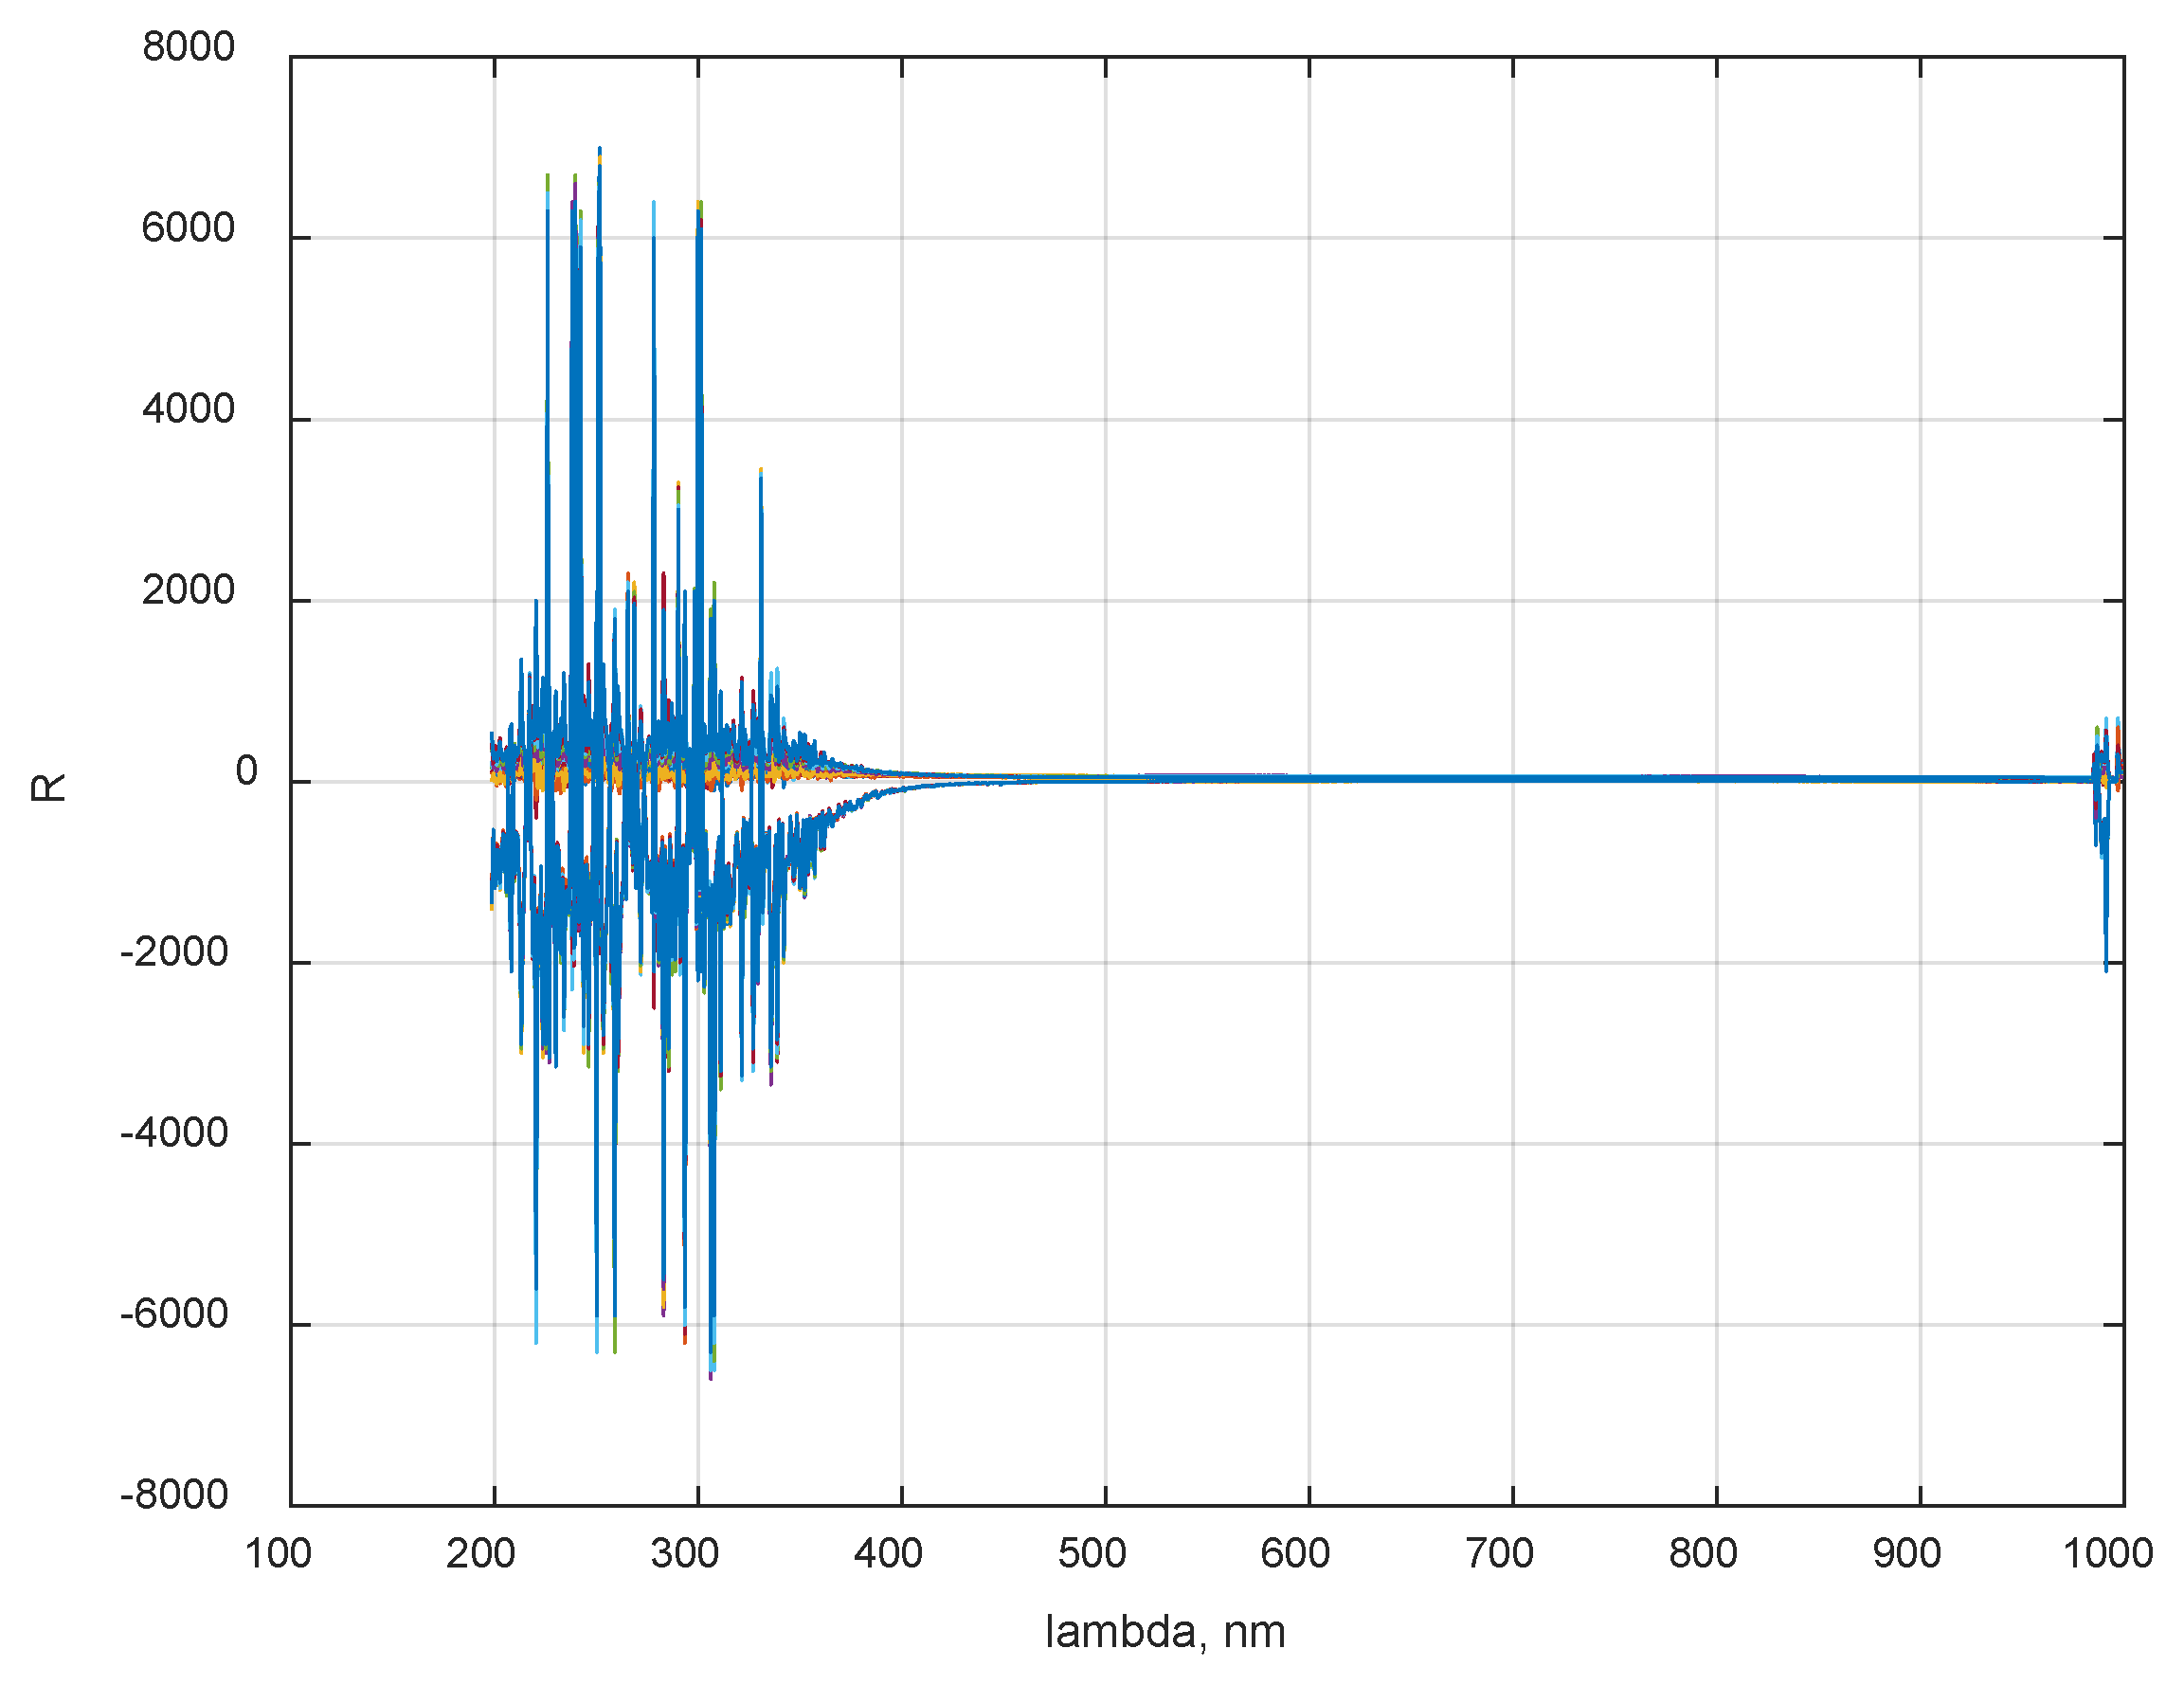
Figure 4.
The percentage of variance explained in the response variable as a function of the number of components for arsenic (As) a), cadmium (Cd) – b), lead (Pb) – c), iron (Fe) – d).
Figure 4.
The percentage of variance explained in the response variable as a function of the number of components for arsenic (As) a), cadmium (Cd) – b), lead (Pb) – c), iron (Fe) – d).
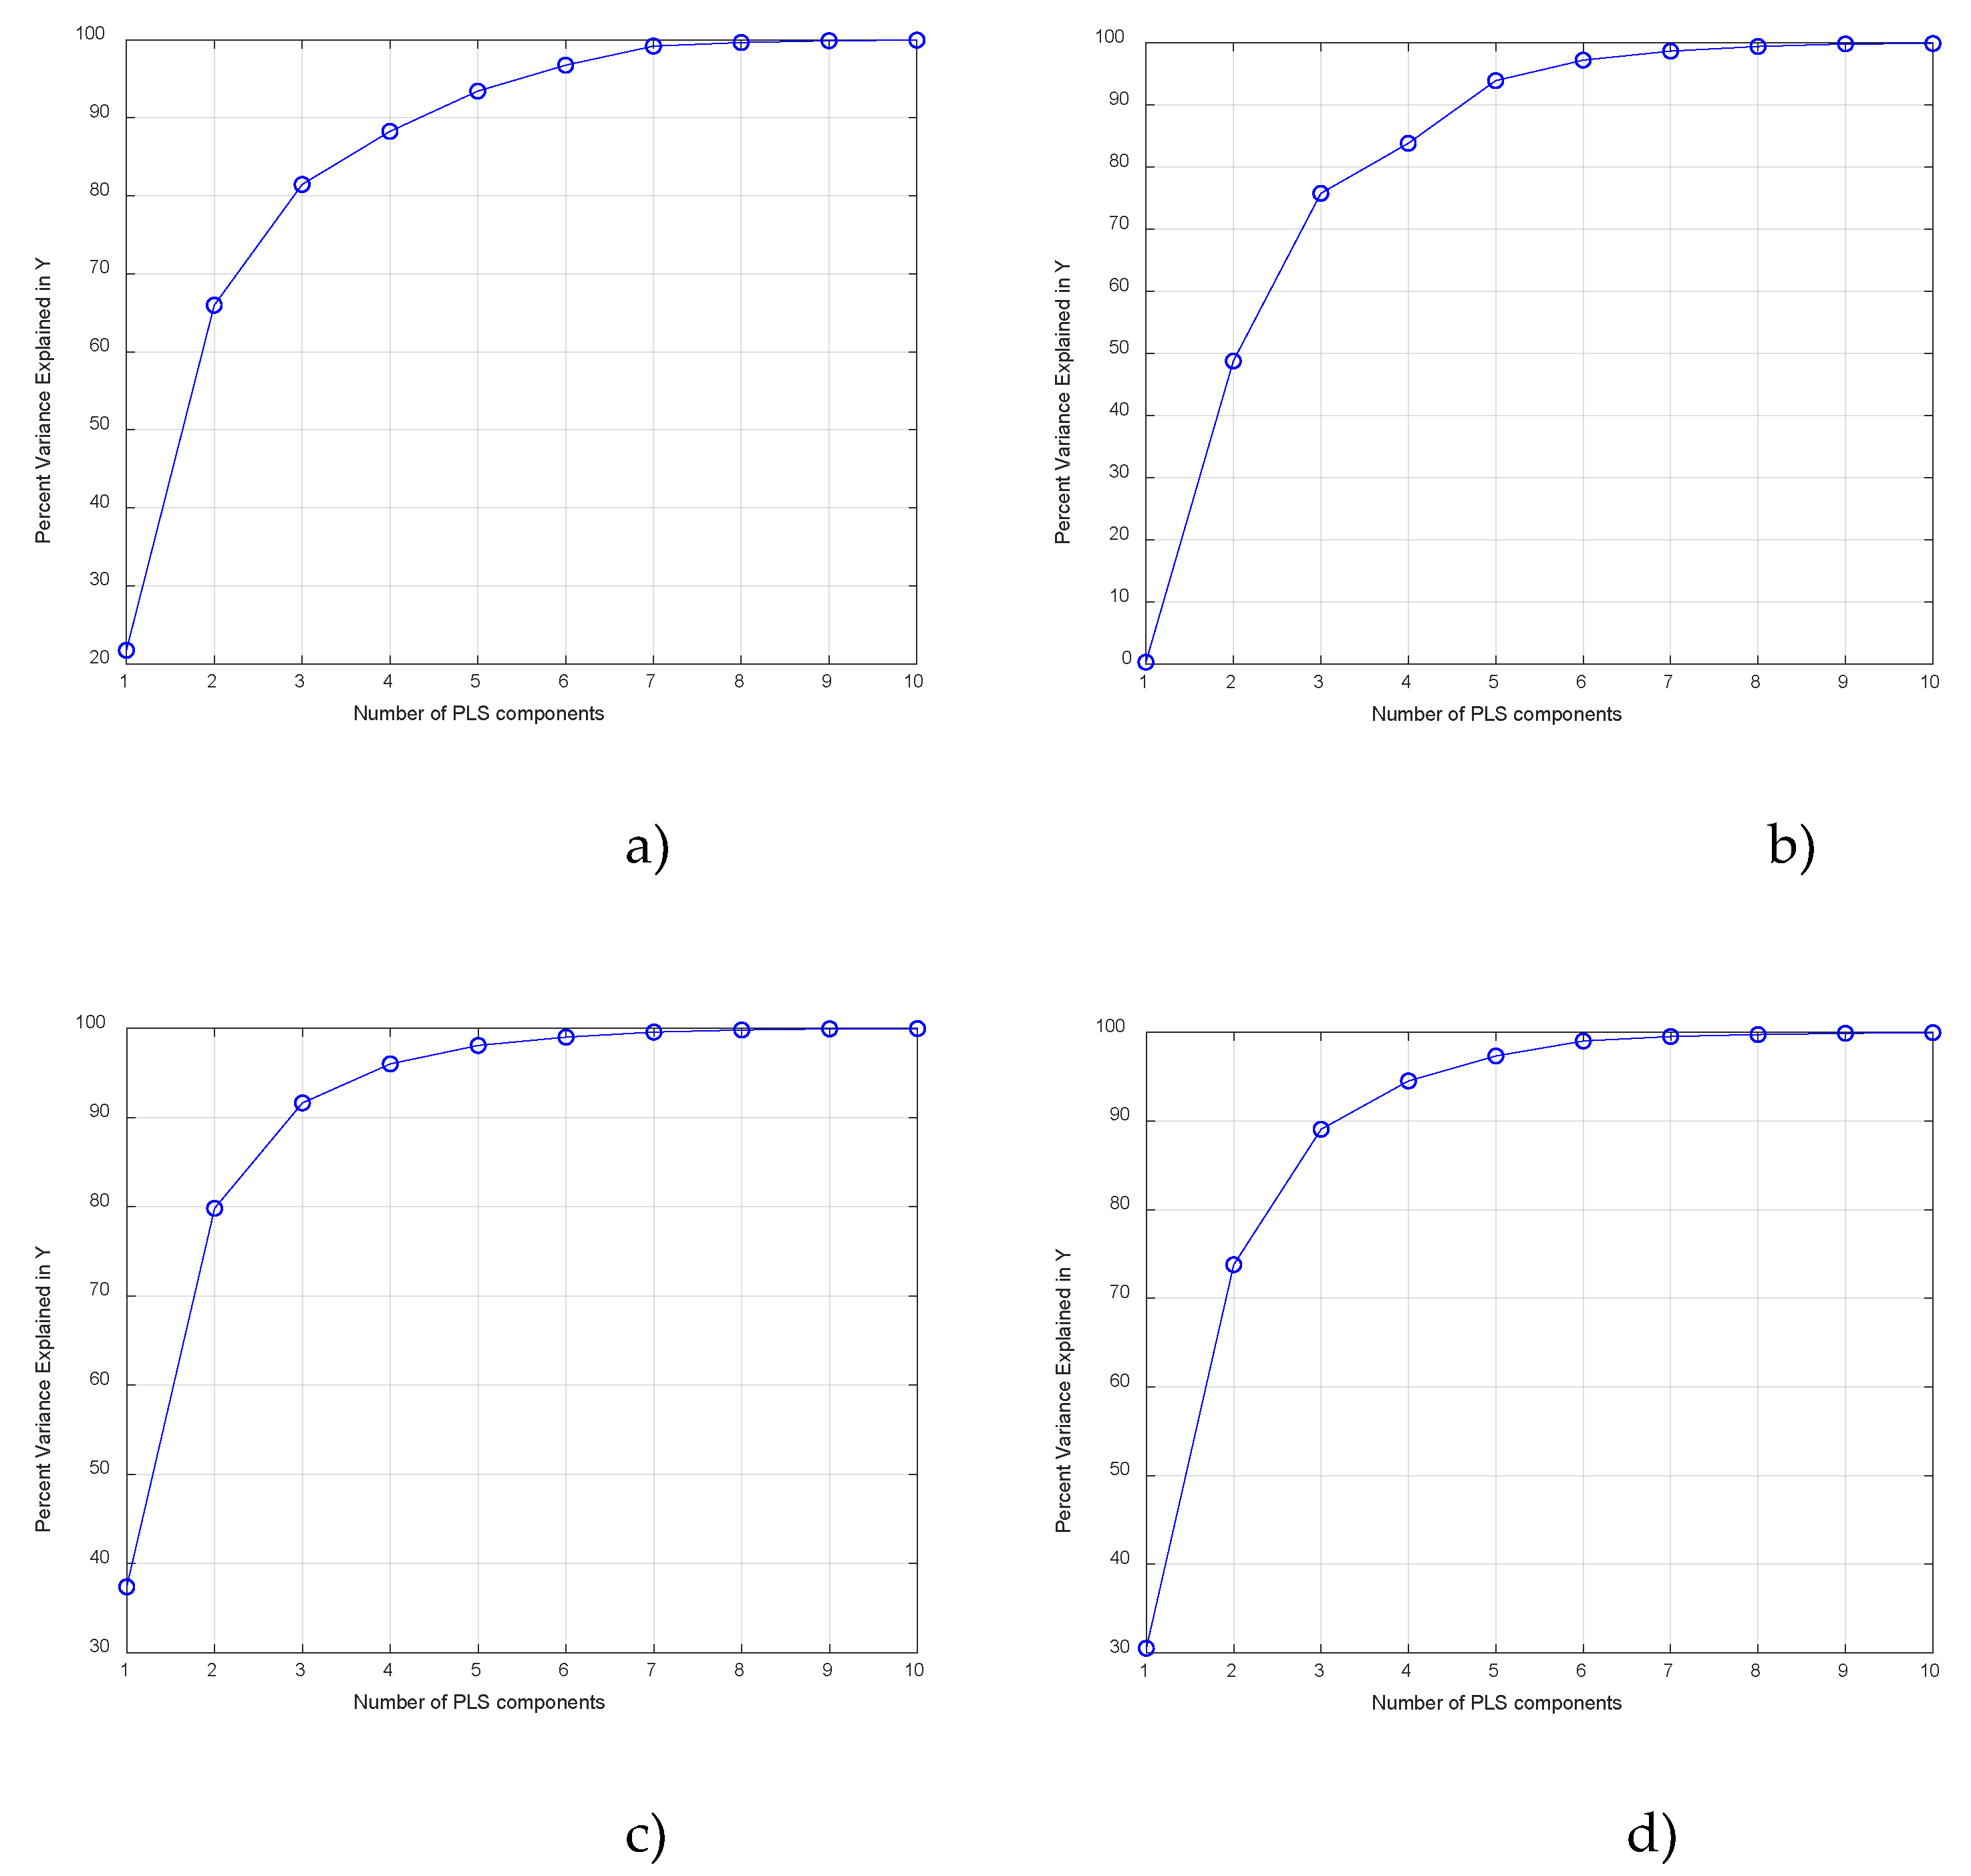
Figure 5.
The percentage of variance explained in the X variable as a function of the number of components for arsenic (As) a), cadmium (Cd) – b), lead (Pb) – c), iron (Fe) – d).
Figure 5.
The percentage of variance explained in the X variable as a function of the number of components for arsenic (As) a), cadmium (Cd) – b), lead (Pb) – c), iron (Fe) – d).
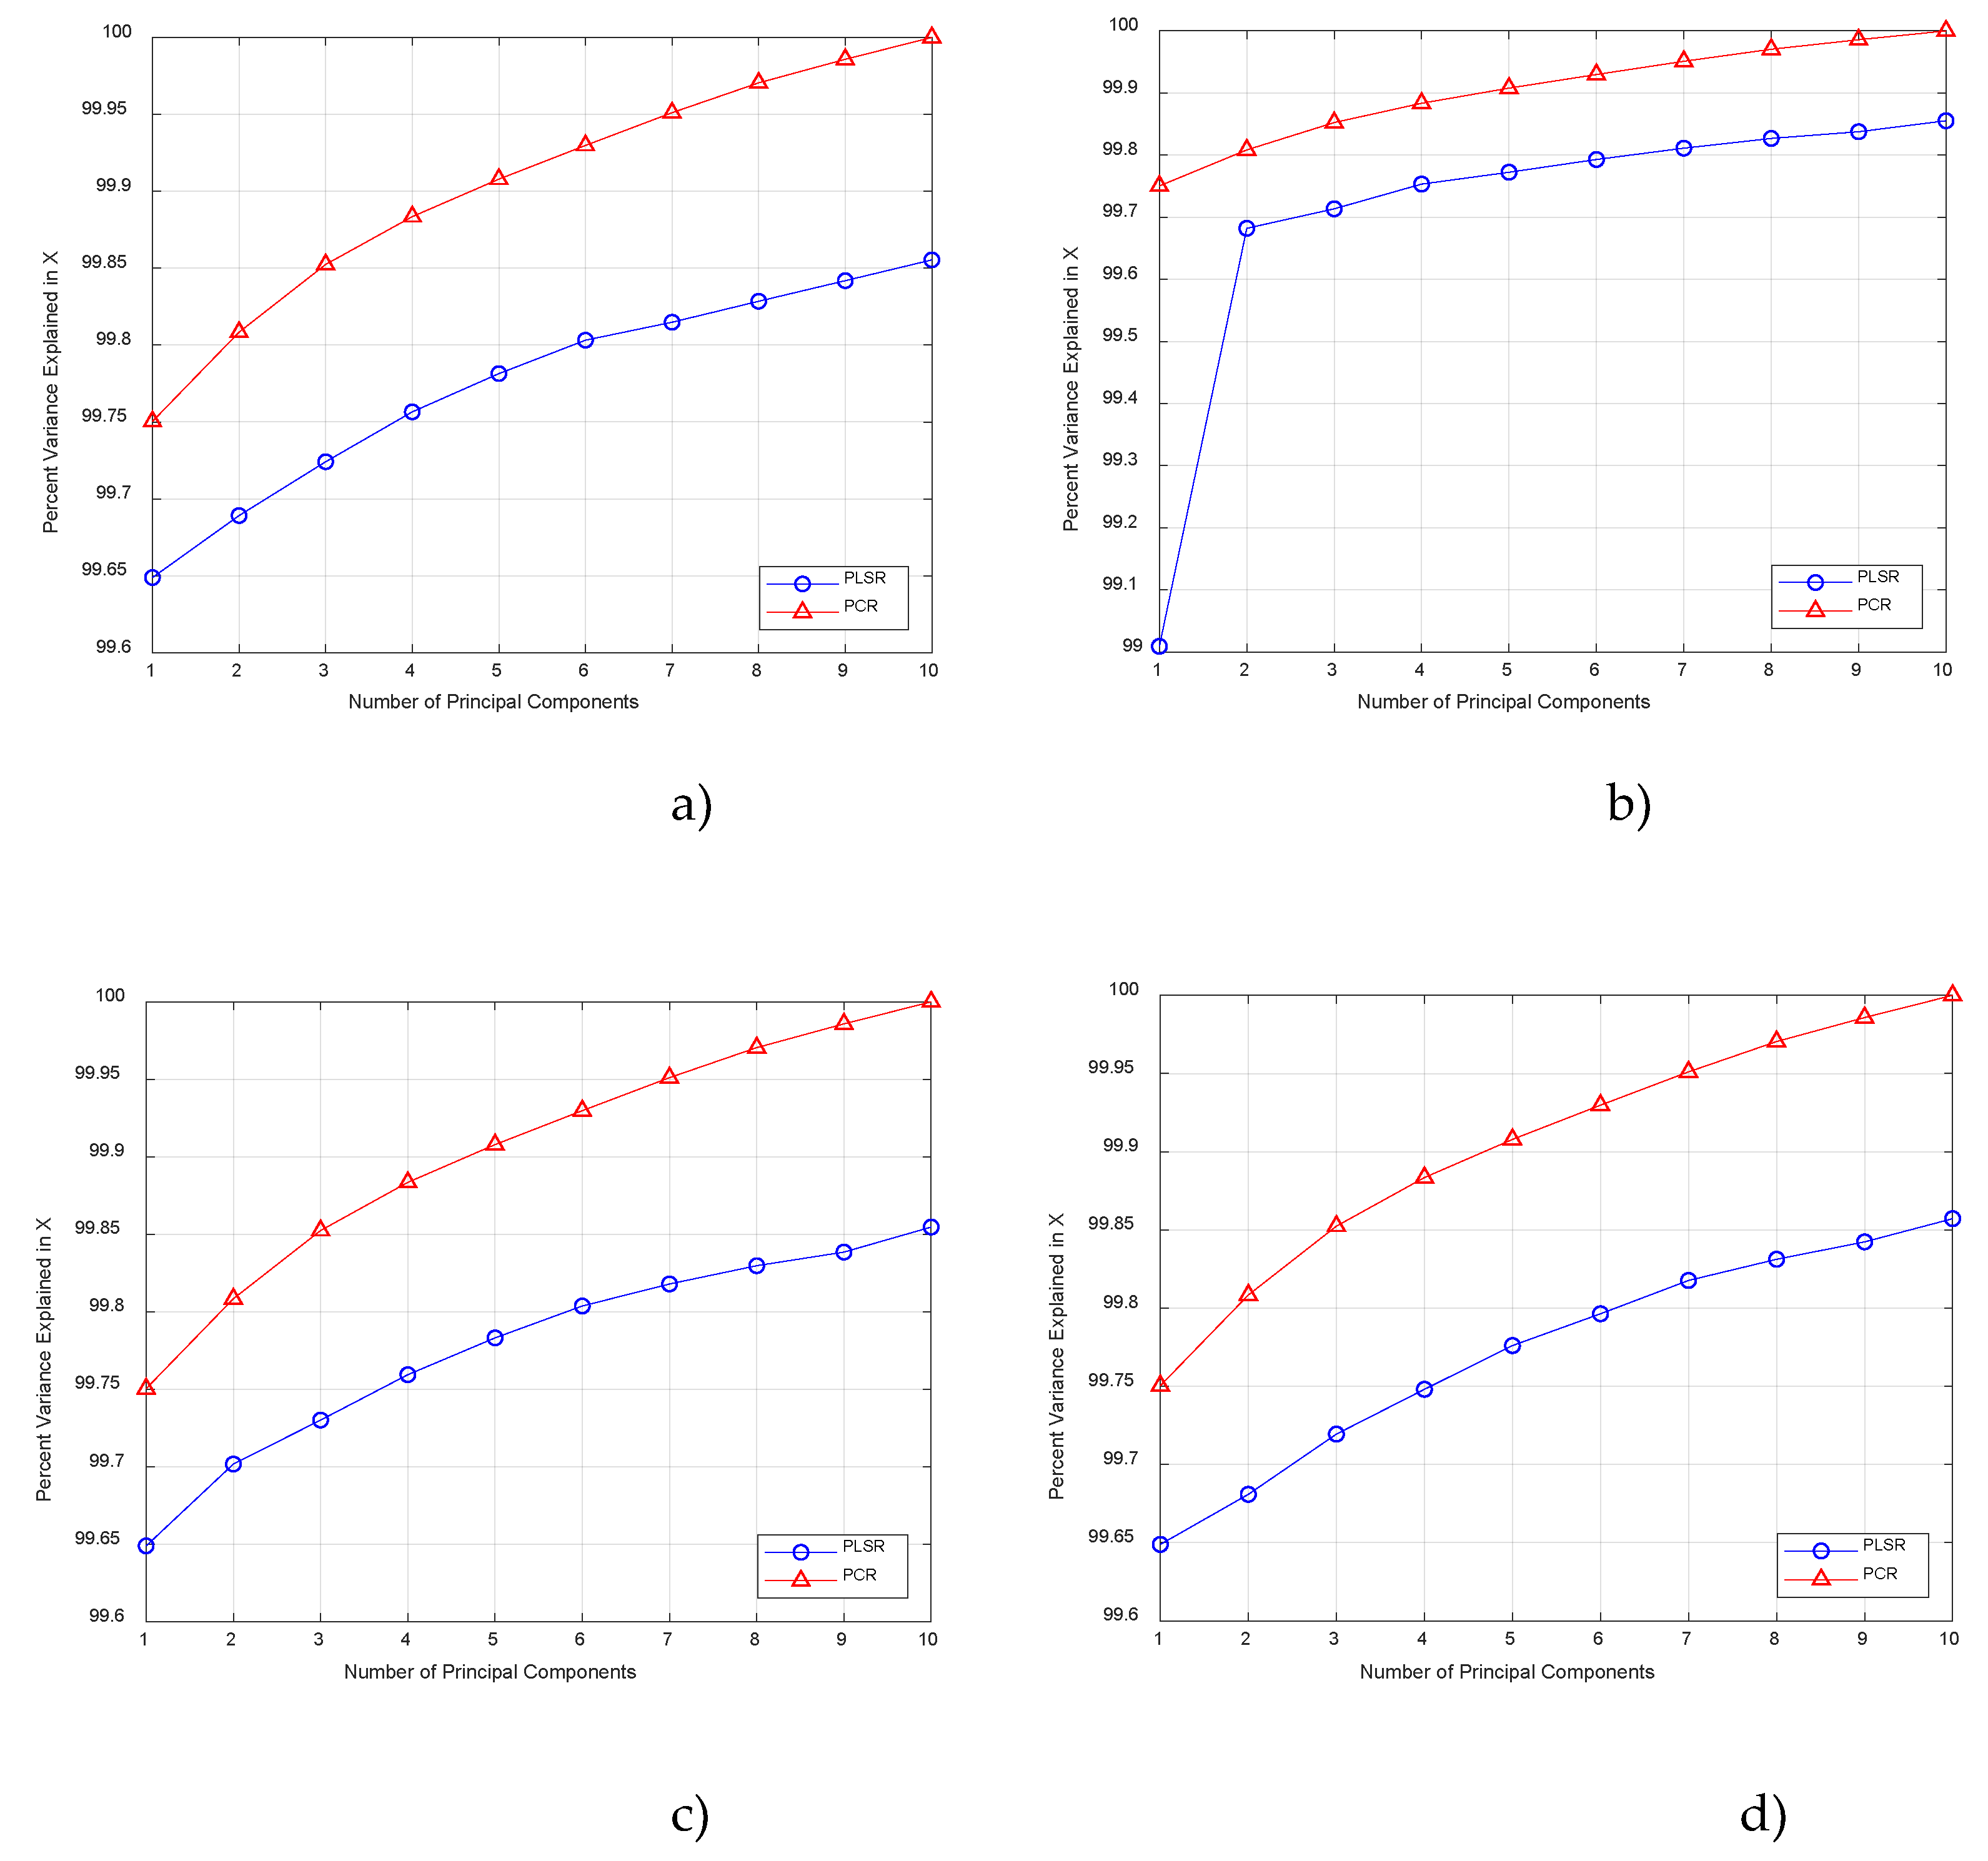
Figure 6.
Estimated mean square prediction error as a function of the number of components for arsenic (As) a), cadmium (Cd) – b), lead (Pb) – c), iron (Fe) – d).
Figure 6.
Estimated mean square prediction error as a function of the number of components for arsenic (As) a), cadmium (Cd) – b), lead (Pb) – c), iron (Fe) – d).
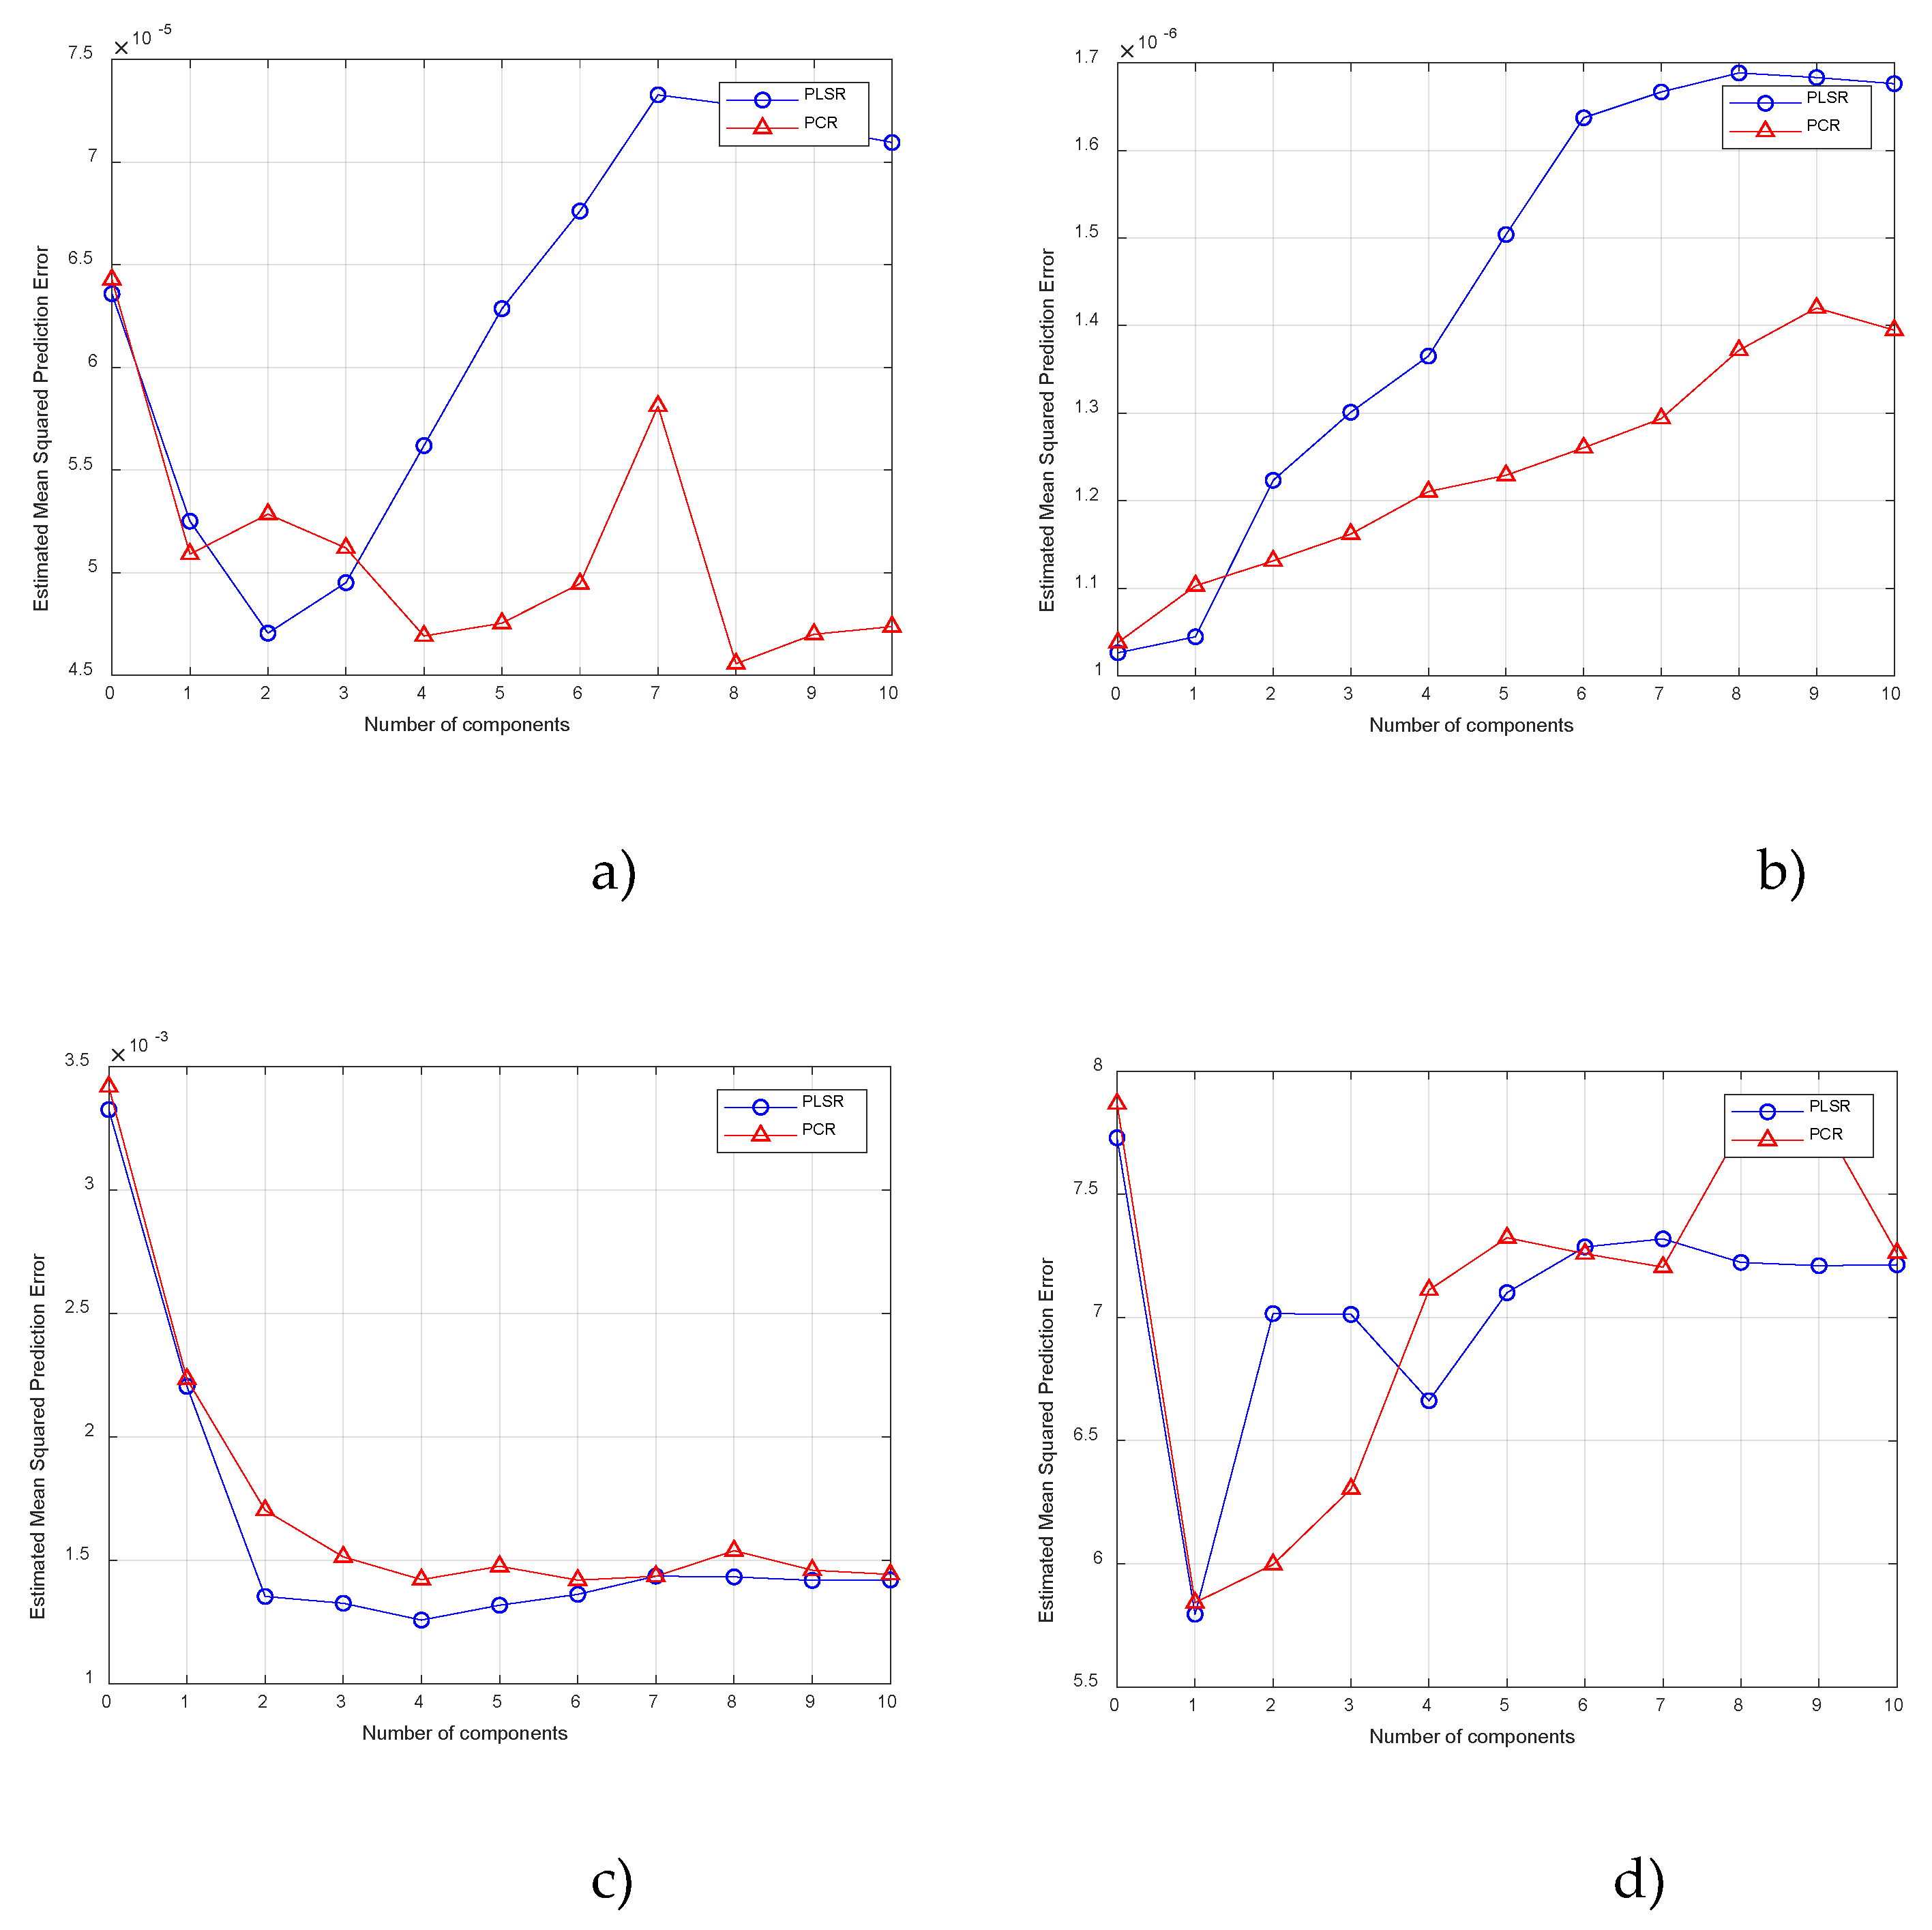
Figure 7.
Estimated mean square prediction error as a function of the number of components for amount of pH - a), reducing sugars – b), sweet disaccharide – c), water content – d).
Figure 7.
Estimated mean square prediction error as a function of the number of components for amount of pH - a), reducing sugars – b), sweet disaccharide – c), water content – d).
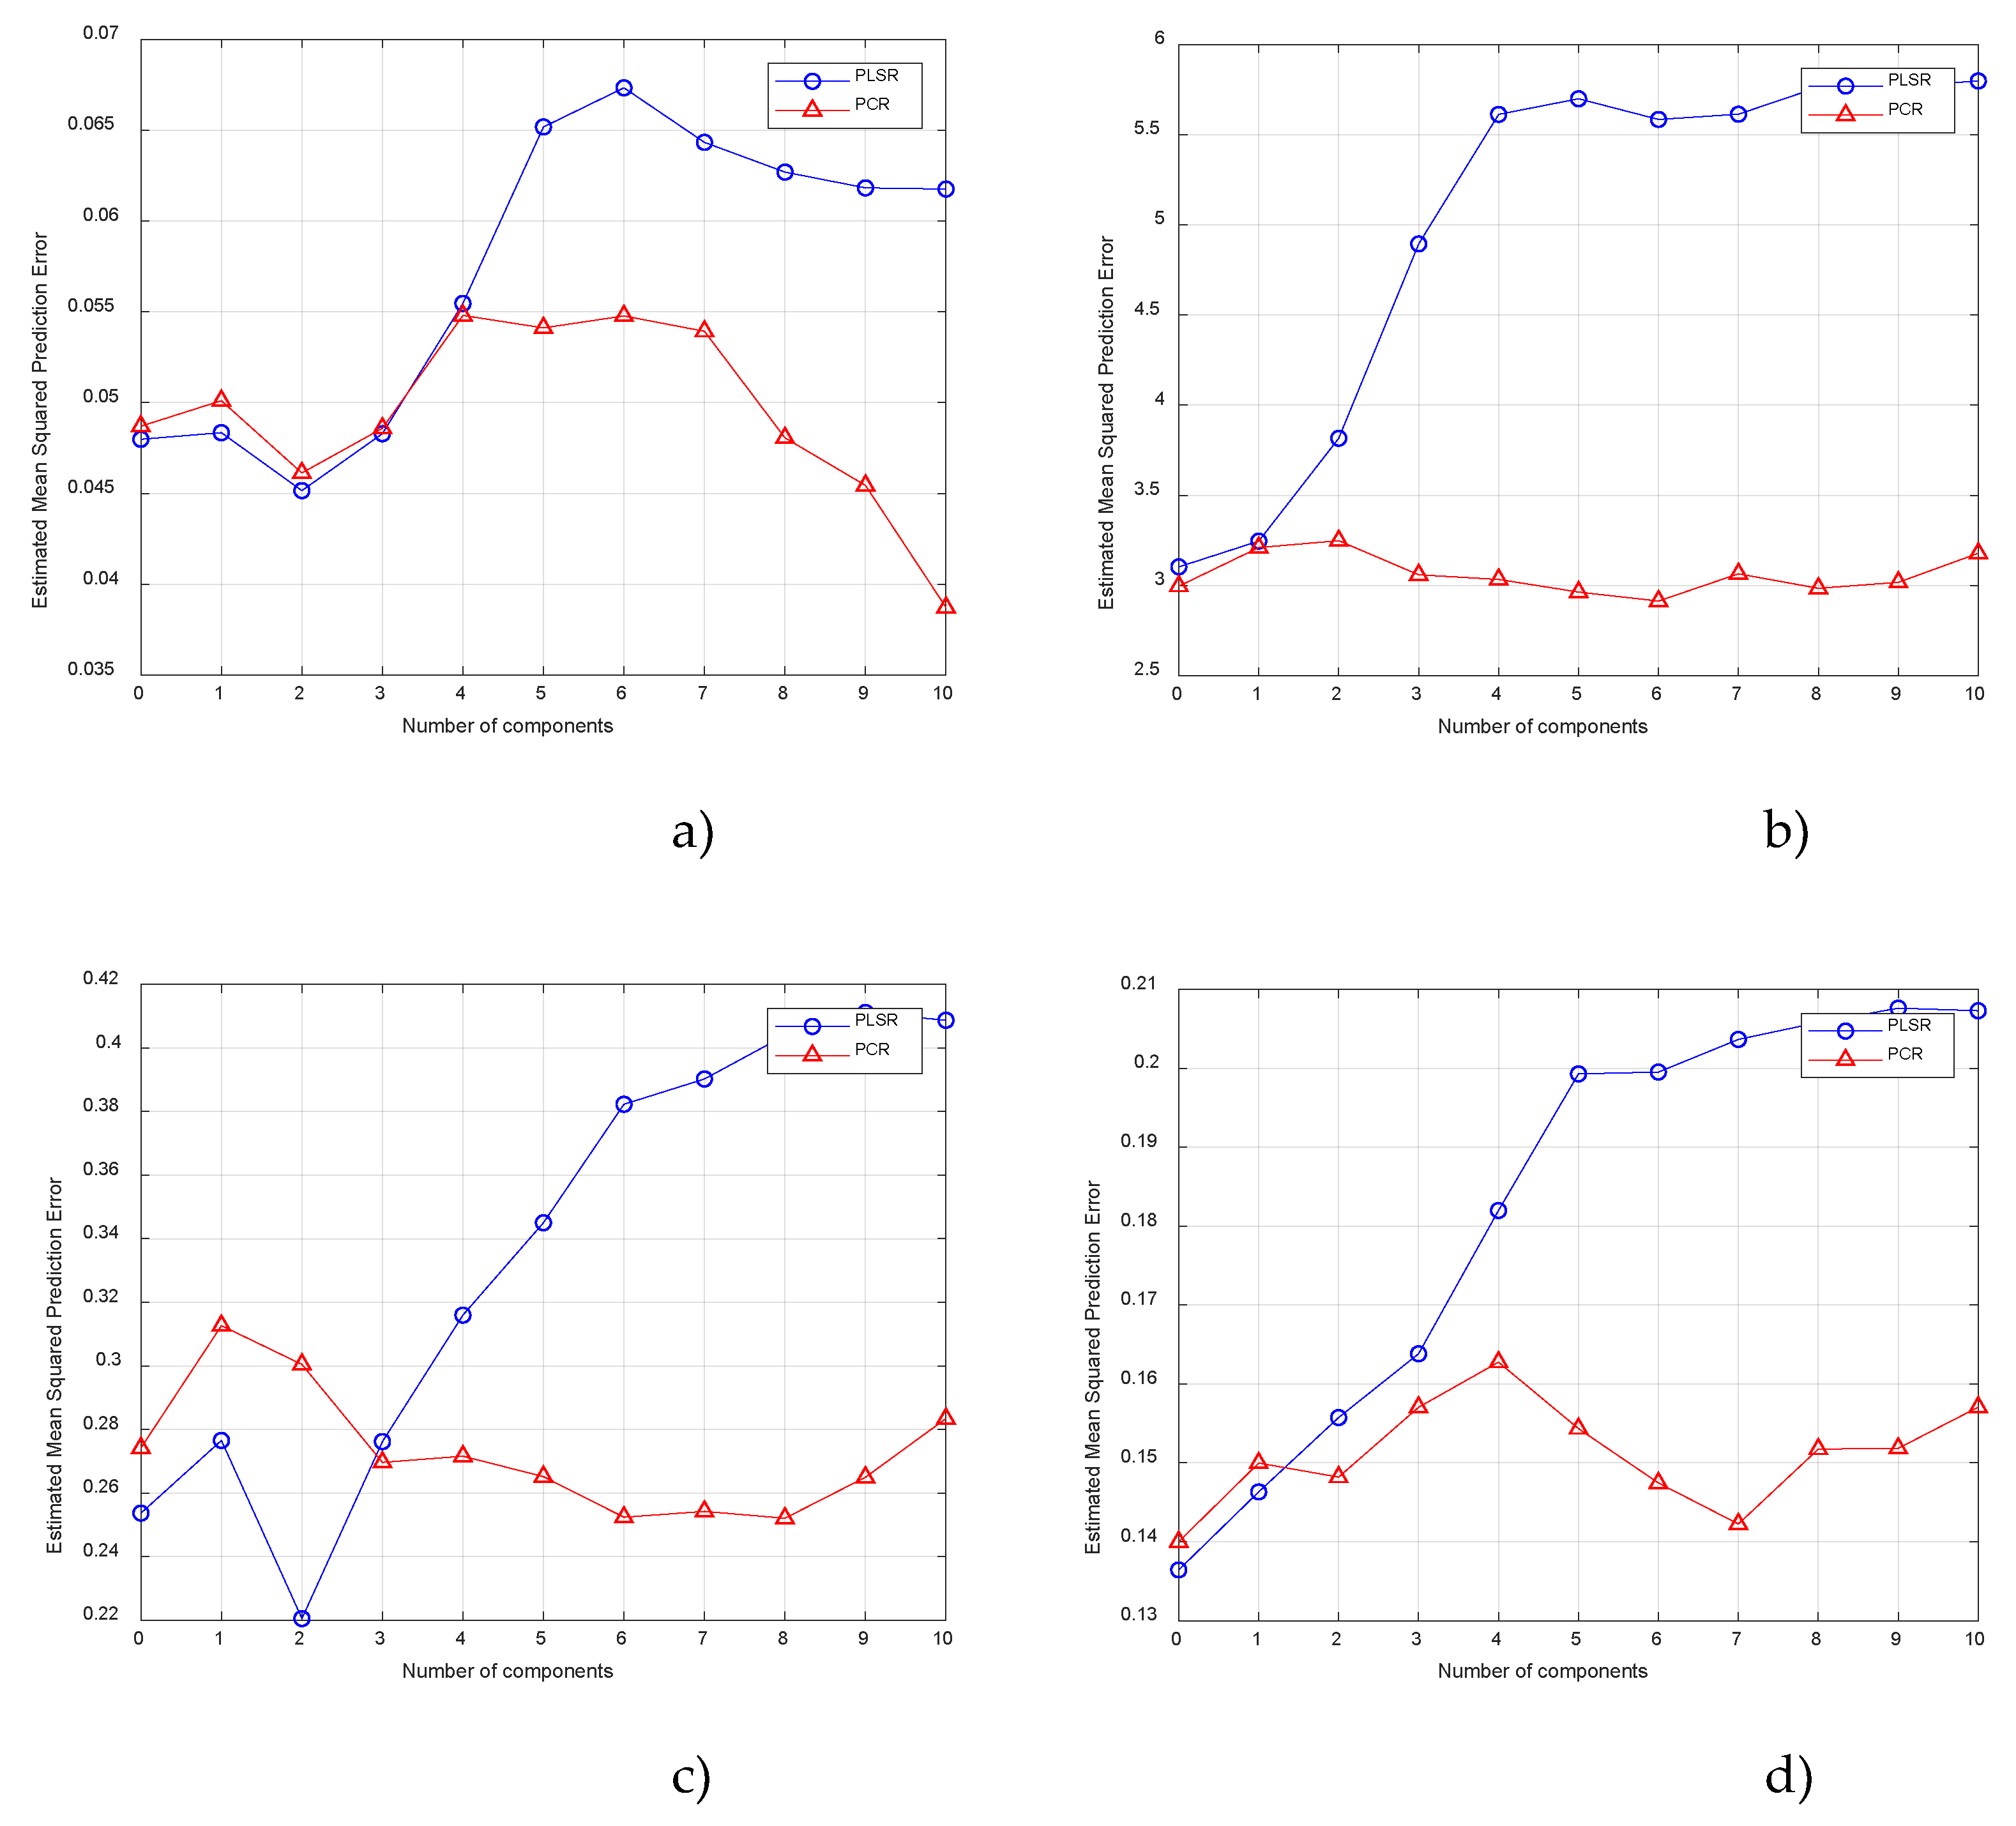

Table 1.
Honey sample reference values of metal content and chemical components.
| Name of Honey | № | Region of production | Year | As | Cd | Pb | Fe | pH | Reducing sugars | Saccharose | Water |
| [mg/kg] | [%] | ||||||||||
| Rapeseed | 1 | Brestovica | 2023 | 0.043 | 0.009 | 0.318 | 14.700 | 4.43±0.03 | 73.54±0.01 | 2.15±0.01 | 17.12±0.02 |
| Sunflower | 2 | Borovo - Stara Zagora | 2023 | 0.041 | 0.006 | 0.233 | 1.460 | 3.74±0.01 | 72.16±0.04 | 1.89±0.01 | 17.39±0.01 |
| Sunflower | 3 | Brestovica | 2023 | 0.041 | 0.006 | 0.264 | 8.690 | 3.79±0.01 | 72.36±0.03 | 1.83±0.03 | 17.38±0.02 |
| Linden | 4 | Yuper | 2023 | 0.034 | 0.006 | 0.255 | 6.571 | 4.23±0.03 | 73.68±0.02 | 2.11±0.01 | 17.33±0.02 |
| Multiflower | 5 | Borovo-Stara Zagora | 2023 | 0.033 | 0.005 | 0.282 | 7.570 | 3.83±0.01 | 74.19±0.03 | 2.09±0.03 | 17.85±0.03 |
| Sanflower | 6 | Modjereto | 2023 | 0.044 | 0.005 | 0.319 | 6.601 | 3.73±0.02 | 72.31±0.02 | 2.21±0.02 | 17.50±0.03 |
| Rapeseed & Amorpha | 7 | Stara Zagora- Pamukchii | 2024 | 0.049 | 0.006 | 0.304 | 7.190 | 3.66±0.03 | 71.15±0.04 | 1.31±0.02 | 17.13±0.02 |
| Acacia & Mana | 8 | Brestowica | 2023 | 0.044 | 0.006 | 0.339 | 4.191 | 3.92±0.02 | 73.15±0.01 | 1.31±0.01 | 17.09±0.03 |
| Draka & Pustren | 9 | Stara Zagora | 2023 | 0.062 | 0.006 | 0.331 | 4.591 | 3.86±0.03 | 75.43±0.03 | 1.73±0.01 | 17.02±0.02 |
| Acacia | 10 | Yuper | 2023 | 0.055 | 0.005 | 0.376 | 5.331 | 3.73±0.02 | 73.50±0.03 | 1.91±0.01 | 17.82±0.02 |
| Multiflower | 11 | Yuper | 2024 | 0.034 | 0.006 | 0.347 | 5.031 | 3.70±0.02 | 73.92±0.03 | 2.23±0.02 | 17.71±0.02 |
| Multiflower | 12 | Yuper | 2013 | 0.048 | 0.007 | 0.364 | 6.891 | 3.72±0.01 | 74.13±0.02 | 2.19±0.02 | 17.81±0.03 |
| Sunflower | 13 | Trakian University | 2023 | 0.041 | 0.006 | 0.395 | 6.010 | 3.82±0.03 | 72.32±0.03 | 1.79±0.01 | 17.40±0.02 |
| Lavender | 14 | Stara Zagora | 2022 | 0.042 | 0.006 | 0.398 | 7.003 | 3.48±0.03 | 74.47±0.04 | 3.25±0.026 | 17.52±0.03 |
| Lavender | 15 | Stara Zagora | 2023 | 0.041 | 0.006 | 0.397 | 5.551 | 3.54±0.01 | 74.35±0.02 | 3.30±0.01 | 17.64±0.02 |
| Mana | 16 | Stara Zagora | 2023 | 0.045 | 0.005 | 0.408 | 6.510 | 4.10±0.01 | 66.64±0.03 | 1.13±0.02 | 16.71±0.02 |
| Multiflower | 17 | Stara Zagora | 2023 | 0.048 | 0.008 | 0.385 | 3.550 | 3.75±0.01 | 74.43±0.03 | 2.07±0.05 | 17.64±0.01 |
| Multiflower - nr 9 | 18 | Razgrad | 2023 | 0.060 | 0.005 | 0.417 | 5.370 | 3.69±0.01 | 74.63±0.02 | 2.15±0.05 | 17.59±0.03 |
| Multoflower - nr 1 | 19 | Haskovo | 2023 | 0.043 | 0.005 | 0.448 | 1.541 | 3.67±0.02 | 74.52±0.03 | 2.11±0.01 | 17.45±0.01 |
| Multiflower -nr 10 | 20 | Ruse | 2023 | 0.051 | 0.005 | 0.368 | 3.880 | 3.79±0.02 | 74.79±0.02 | 2.23±0.04 | 17.50±0.01 |
| Multiflower - nr 8 | 21 | Razgrad | 2023 | 0.048 | 0.007 | 0.449 | 1.932 | 3.93±0.02 | 74.93±0.02 | 2.34±0.01 | 17.69±0.01 |
| Multiflower -nr 6 | 22 | Ruse | 2023 | 0.064 | 0.006 | 0.408 | 4.650 | 4.14±0.02 | 74.89±0.01 | 2.49±0.02 | 17.63±0.04 |
| Multiflower- nr 2 | 23 | Turgovishte | 2023 | 0.050 | 0.007 | 0.444 | 4.090 | 3.73±0.01 | 74.53±0.02 | 2.41±0.01 | 17.48±0.04 |
| Multiflower - nr 4 | 24 | Turgovishte | 2023 | 0.045 | 0.008 | 0.382 | 0.918 | 3.83±0.01 | 74.44±0.02 | 2.58±0.03 | 17.64±0.01 |
| Multiflower- nr 3 | 25 | Turgovishte | 2023 | 0.045 | 0.006 | 0.386 | 3.520 | 3.90±0.01 | 74.79±0.01 | 2.49±0.02 | 17.87±0.03 |
| Multiflower - nr 6 | 26 | Sliven | 2023 | 0.056 | 0.006 | 0.392 | 4.607 | 3.88±0.01 | 74.62±0.03 | 2.37±0.02 | 17.65±0.01 |
| Multiflower - nr 7 | 27 | Sliven | 2023 | 0.046 | 0.006 | 0.384 | 2.150 | 3.69±0.01 | 74.69±0.03 | 2.45±0.01 | 17.58±0.03 |
| Lindon | 28 | Novo Village | 2023 | 0.046 | 0.006 | 0.379 | 2.930 | 4.28±0.03 | 73.60±0.04 | 2.05±0.00 | 17.24±0.02 |
| Acacia & rapeseed | 29 | Ivanovo | 2024 | 0.056 | 0.005 | 0.408 | 2.330 | 3.68±0.02 | 72.23±0.03 | 1.24±0.02 | 16.14±0.03 |
Table 2.
Coefficient of determination for PLSR and PCR.
| Chemometric method | values | |||
| Arsenic (As) | Cadmium (Cd) | Lead (Pb) | Iron (Fe) | |
| PLSR | 0.6598 | 0.4881 | 0.7981 | 0.7378 |
| PCR | 0.2577 | 0.0106 | 0.5883 | 0.3210 |
Table 3.
Coefficient of determination for PLSR and PCR for physicochemical indicators.
| Chemometric method | values | |||
| pH |
Reducing sugars |
Sweet disaccharide |
Water content |
|
| PLSR | 0.5526 | 0.4061 | 0.5693 | 0.4384 |
| PCR | 0.1523 | 0.0414 | 0.2450 | 0.0413 |
Disclaimer/Publisher’s Note: The statements, opinions and data contained in all publications are solely those of the individual author(s) and contributor(s) and not of MDPI and/or the editor(s). MDPI and/or the editor(s) disclaim responsibility for any injury to people or property resulting from any ideas, methods, instructions or products referred to in the content. |
© 2025 by the authors. Licensee MDPI, Basel, Switzerland. This article is an open access article distributed under the terms and conditions of the Creative Commons Attribution (CC BY) license (http://creativecommons.org/licenses/by/4.0/).
Copyright: This open access article is published under a Creative Commons CC BY 4.0 license, which permit the free download, distribution, and reuse, provided that the author and preprint are cited in any reuse.


