Submitted:
01 October 2025
Posted:
02 October 2025
You are already at the latest version
Abstract
The design philosophy of a new smart gas meter is presented, based on an ultrasonic sensor, employing LoRa and/or NB-IoT protocols and block-chain technologies to overcome the data integrity and security issues with a completely modular design. The architecture is organized in two separate blocks, the former for measurement and the latter for communication, and it presents originality characteristics with respect to the state of the art. Accuracy of measured data is studied paying attention to fluid dynamic effects of the geometrical layout on the flow rate ultrasonic sensor and of the environmental temperature and pressure, for variable gas flowrate values. As for data security issues, the proposed solution is critically analyzed with reference to the data string organization and the procedure the data are stored and prepared for transmission into the blockchain. Finally, a local network of counters is designed and simulated in order to check the compliance of the provided hardware and software solutions with the predicted computational load.
Keywords:
smart gas meter
; blockchain
; accuracy assessment
; measuring block
; transmission block
; data security
1. Introduction
Integrity, transparency, and availability of data from gas flow meters are important requirements not only to avoid inaccurate billing and frauds, but also for a more efficient energy consumption management. New smart metering technologies could respond to this need, offering automatic, real-time data gathering and transmission, if combined with IT techniques for data security [1]. Smart metering allows the formulation of bills based on actual use rather than estimates, which is a fundamental aspect with legal implications.
Furthermore, from a sustainability perspective, implementing smart metering in natural gas distribution presents a number of benefits for both distribution companies and customers, allowing for a more thoughtful use of natural gas, reducing operational costs due to remote reading, enabling the identification of abnormal consumptions or device malfunctions and, subsequently, preventing unexpected breakouts and dangerous situations.
A smart meter must integrate the following components and functionality:
- The measuring system, together with pressure and temperature transmitters to convert the gas volume to reference conditions. All measured variables are communicated to the Central Processing Unit (CPU) via a digital signal.
- A Central Processing Unit (CPU), that processes, records, and prepares the data for transmission to the Central Data Acquisition System via a dedicated communication protocol.
- A communication device, required to transmit the measured parameters to the Central Data Acquisition System.
- Remote-controlled valve, required to remotely shut off the gas supply in the event of anomalous data (possible leaks) in residential applications.
- Power supply, since electronic components are used. For safety reasons, battery power should be used.
The reliability of the measurement information is a requirement that must be guaranteed at every point along the data path, especially the longer the distances to be covered, starting from the origin, where the sensor generates the raw data; this requirement involves many aspects and technologies, based on an integrated approach [2].
At a first stage of the measuring process, monitoring interfering quantities and parameters representative of the continuity and regularity of operation, can be a useful tool for ensuring quality and safety.
In particular, the automatic correction of influencing parameters for intrinsic conversion of measurement results to reference temperature and pressure conditions is a significant opportunity from the point of view of measurement accuracy.
Of course, the metrological characterization of new metering devices is a necessary preliminary step to optimize the measuring set up and to account for the effect of thermal and fluid dynamic parameters on the measurement accuracy.
In general, traditional mechanical bulk meters, based on diaphragms, turbines, or rotating pistons, are not appropriate for supporting modern metering because they are challenging to integrate with other transducers, and high noise levels and substantial pressure losses often characterize them.
Digital, miniaturized and low cost flowmeters are now commercially available, useful for this application, which are mainly based on thermal exchange principle due to the gas flow either on ultrasonic measurement of the velocity profile.
Thermal gas meter are very diffused, even though some critical aspects should be considered, with reference to the calibration procedure [3] and to the effect of operating with gas mixtures, including hydrogen, which is actually a possible way of improving the performances of the transportation networks [4,5].
- the absence of moving parts that makes this kind of device not subject to wear and tear, allowing it to operate in a wide variety of environmental conditions with minimal maintenance;
- the compact size, making them suitable for installation in confined spaces;
- a direct electrical output that does not require special devices for remote readings, significantly reducing data collection times;
- good accuracy;
- capability of detecting reverse flow;
- independence from the physical properties of the fluid (provided it is homogeneous),
Until now, the main obstacle to the widespread use of these meters was their high cost, but they are becoming cost-competitive with other technologies.
Moreover, if the aspects of data transmission, billing and transparency of the relationships between gas distributors and customers are taken into account, many other considerations can be highlighted.
The actual model of the energy market is based on a structure strongly centralized, with the presence of main operators having the duty of keeping the provision of energy resources stable, safe and balanced. The big energy producers generally do not directly supply energy to the network, being this service managed by network operators and energy brokers: this situation reduces remarkably the possibilities of direct negotiation. The local energy producers, even though economically compensated in some way, cannot access a competitive peer to peer market. Furthermore, the whole data validation, from the measurement phase to the billing phase, is based on actions whose traceability is guaranteed by the institutional organizations, which is a system pretty close.
The availability of technical tools allowing for distributed scenarios, like blockchain, promises many improvements with respects to the actual situation: validation of data is based on distributed and transparent ledgers, without the need of a central office, the energy could be “transformed” into digital token, certified quantity of energy, which are transferable and verified. This way, a peer to peer market is done easier, local and also little operators are enabled to participate, like local energy communities. This aspect seems important not only from a social point of view, but also from a sustainability and economic one. In fact, every quantity of energy could be taken into account, to avoid any energy losses; local balancing actions could be set improving the managing performances of the network, with respect to the load and overload conditions, accounting for transmission losses and related costs. These technical opportunities are also business opportunities, especially for little and local producers, promoting flexibility and autotuning capabilities into the energy market. Finally, the model could be extended to many sectors of energy, like power, gas and water.
Of course, the problem cannot be faced only from a technical point of view: implementing this peer to peer energy market requires significant modification of the existing laws, technical standards and rules, especially in Italy; nevertheless, studying the technical aspects connected to the suggested innovation could be useful to the whole debate.
Based on the above considerations, this paper introduces and develops a new smart gas meter, based on an ultrasonic sensor, and employing LoRa and/or NB-IoT protocols and block-chain technologies to overcome the data integrity and security issues with a completely modular design; a preliminary version has been described in [11]. The architecture is organized in two separate blocks, the former for measurement and the latter for communication, and it presents originality characteristics with respect to the state of the art. In fact, the measurement block includes the sensor and the hardware for data acquisition, and the communication one, which is interchangeable, keeps suitable measurement information in the measurement hardware; this strategy guarantees that no useful information is lost, independently on the communication module is installed. Therefore, this new strategy has the potential to contribute to the transformation of the gas metering sector, offering a reliable and secure energy management solution.
Obviously, the use of blockchain to guarantee energy and gas meter networks is not a fully original idea and many applications have been proposed, considering different possible scenarios [12,13,14,15,16].
Most of innovation is in the integration of hardware/software measurement and communication blocks and in the designed information infrastructure, which has to be carefully designed and tested, which is not a trivial task. In this project, the infrastructure will be designed and simulated by a suitable software package, in order to optimize the lay-out and the working characteristics. The simulation process and the adopted solutions will be described in the following sections, with the aim of also highlighting the main driving rules the design is based on.
The paper is organized in the following way: section 2 describes the methodology used to create an approach suitable to integrate validated measurement data and block-chain hints into the measurement and data transmission process, section 3 will give some information about preliminary lay-out and experimental results. Conclusions will end the paper.
2. Materials and Methods
This project aims at guaranteeing the accuracy and reliability of measured data to be used for billing, by both validating the measurement phase by means of checking the effect of environmental conditions (geometry of the installation, temperature, gas pressure) on the flow transducer and by keeping reliable the data by implementing blockchain procedures, in order to improve the process monitoring and reduce the probability of tampering of data.
2.1. Flow Measurement Validation
As for measurement validation by the ultrasonic flowmeter, some actions have been defined to check both the electronic and the environmental data. A reference circuit has been designed and realized in order to check the correctness of measured data of the ultrasonic meter, in term of flowrate, pressure and temperature of the flowing gas; furthermore a parallel track was available for the flowing gas to check that no significant pressure loss occurs in the flowmeter installed in the meter casing, due to the mechanical layout.
The scheme of the circuit is shown in Figure 1.
Thanks to a pressure regulator, a stable flow of air has been achieved, attenuating the oscillations produced upstream by the compressor. Three different flow conditions have been realized, 3.3 m3/h, 4.8 m3/h, 6.0 m3/h, all within the operating range of meters for domestic gas dispatching pipes (0.04 - 6 m3/h [17,18])
Two ultrasonic flow sensors have been inserted into the circuit (Ultrasonic gas metering module, model Spiro-L-Horiz, by Panasensing), class 1.5 [17,18], one installed in-line, with appropriate connectors (Figure 2.a), the other inserted in a classic meter casing (Figure 2.b).
Three MEMS Gauge Pressure Sensor 2SMPP, by Omron (Figure 3.a) have been connected to the circuit, so as to be upstream and downstream of the two ultrasonic flow meters, in positions “Pos1”, “Pos2” and “Pos3” indicated in Figure 1.a.
The straight pipes connected to the ultrasonic meter inlets are more than 10 times the diameter of the pipes (30 mm), as indicated by the standard [17].
Additionally, a reference pressure gauge (Bourdon Tube, Pressure Gauge 9061568, by Wika) has also been connected in Pos1, for comparison and calibration purposes (Figure 3.b).
2.2. LoRa-NB IoT Structure
As mentioned, the smart gas-metering system employs LoRa and NB IoT technologies. The former allows a long and wide range for the gas metering nodes to reach the local gateway, guaranteeing the system installation in both urban and rural environments; additionally, the use of NB-IoT enables the compliance of this system with the industry 5.0, due to the use of NB-IoT in Low Power Wide Area Networks (LPWANs), and allows the easy integration of this system with Long Term Evolution (LTE) ecosystem, an important factor for the internet connection of the device. The internal structure of the smart metering device communication part is reported in Figure 4.
Low cost, flexibility and low power operation motivated the choice of the nRF52 as a microcontroller unit (MCU) for this purpose, re-programmable through Universal Serial Bus (USB) by using a CP2102 UART-to-USB converter, characterised by remarkable efficiency in serial communication. Furthermore, its serial communication, through the UART protocol, with the BG77 modem enables the implementation of the NB-IoT feature.
The LoRa communication with local devices is empowered by the Semtech SX1272 LoRa transceiver, whose communication with the MCU is regulated by the Serial Peripheral Interface (SPI) protocol. Finally, the whole module has a specific power path for its supply; the communication part is supplied by a Lithium Polymer (LiPo) battery, whose voltage is both read by the microcontroller Analog-Digital Converter to assess the battery charge level, and regulated by the RP104 voltage regulator, that provides constant 3.3 V supply voltage to the whole module.
This configuration uses known components and modules and, at the same time, integrates the LoRa-NB-IoT functionality, which brings novelty in the domain of smart-metering applications.
2.3. Data Security and Transparency
As for data security and transparency, a parallel action of the procedure is inserting blockchain rules and realizing the management of the “energy tokens”, which are digital data fully representing the energy transaction. Energy tokens will be recorded and managed by the blockchain for automation traceability, transparency and safety purposes. Furthermore, the design and the integration of the measurement and of the transmission modules will be of big concern, being the maintenance and/or the substitution of the latter a possible occasion of data security warranty. The use of blockchain and the introduction of energy tokens are expected to create new market models able to realize direct and peer to peer interactions between suppliers and customers, overcoming centralized management logics.
2.3.1. The Proposed Infrastructure
A three level model is proposed and designed, to be optimized for use in devices having limited computational resources, in order to reduce costs and energy consumptions.
This model provides three node typologies:
- Authority nodes, responsible for system validation and supervision;
- Aggregating nodes, for acquisition, processing and transmission of data originating from edge nodes;
- Edge/gas meter nodes, corresponding to the in situ devices, operating local measurements.
For a reliable functioning of the whole chain, specific and clear operating tasks are given to each node, different depending on the operating level. Higher level nodes are located with a suitable geographical distribution, depending also on the commercial needs and interactions.
A synthetic scheme of the infrastructure is depicted in Figure 5.
With reference to the Edge/gas meter nodes, it is important to highlight that all these nodes are specifically configured to manage the energy consumption, with different characteristics:
- Only consumer: the domestic gas meters in basic configuration;
- Only producer: for meters installed at production sites;
- Prosumer: domestic sites having hybrid characteristics (local production and use of energy).
All these nodes allow bi-directional communication, even though with a limited capability.
2.3.2. Simulation of the Infrastructure
The virtual scenario simulating the infrastructure described in the previous section, constituted by many interconnected gas meters to a blockchain, has been studied in a main server. In this scenario a virtual machine operates as the Authority of the System with validation and supervision capability. The creation and the management of the infrastructure is operated by means of GNS3 (Graphical Network Simulator 3), a software package for machine, network and transmission protocol simulation.
The main server is able to operate with high computational load, with the following characteristics:
- 64 GB di RAM
- 2 CPU and 12 core, with nested virtualization enabled
- many Ethernet interfaces for configuration and simulation flexibility purposes
By means of this server all the needed network devices can be simulated, like routers, firewall and switches, the geographical layout, the different nodes and their different capabilities according to the operating level. Furthermore, the analysis and the balancing of the network can be carried out, to evaluate the efficiency and the resiliency of the simulated network.
2.3.3. Data Management
Most of the capabilities of the network to operate successfully depend on the way the data are managed, with particular reference to the data sequence of the communication string and to the choosing of the way the data are shared between the different blocks, in particular the measuring and the transmission one.
All data are transmitted as an alphanumeric sequence of fixed length. The payload is organized in four strings of fixed length, designed to represent a specific information category in a univocal way.
The list below summarizes the data of different packages, which have been shaped in order to fulfill as much as possible the requirements of transparency and reliability when the system works:
-
Metering package (gas meter):
- a.
- Data concerning the measuring sensor
- b.
- ID Sensor (microcontroller)
- c.
- ID measurement device (and reference to the calibration)
- d.
- Serial number of metering device
- e.
- Calibration data
-
Data of the Meter:
- a.
- ID Meter (serial number)
- b.
- Pool/Set data for meter configuration
- c.
- Timestamp
-
Data of the Firmware Measurement block:
- a.
- Pool/Set of progressive pre-charged serial numbers
- b.
- Sensor Status
- c.
- Measurement value
- d.
- Algorithm parameters concerning acknowledgement serial reception
-
Energy data:
- a.
- ID production Plant
- b.
- production certificate
- c.
- site of production
- d.
- Energy source type (Solar, hydroelectric…)
- e.
- Energy measurement data
- f.
- Measurement unit (kWh, m3, …)
Each string is composed by:
- Preamble: a fixed value representing the beginning of the string, without an associate value
- Corp: the data to be sent in this string
- CRC: standard control for data integrity check
- Termination characters: characters indicating the end of the segment

Table 1.
Representative table for the payload string structure.
| Segment | Data Type | Identifier | Bytes |
|---|---|---|---|
| 1 - Data concerning the measuring sensor | Preamble | AA01 | 4 |
| 1 - Data concerning the measuring sensor | ID Sensor | IDM01 | 10 |
| … | … | … | … |
| 1 - Data concerning the measuring sensor | CRC | CRC | 4 |
| 1 - Data concerning the measuring sensor | Escape Sequence | \n \r | 2 |
| 2 – Data of the Meter | Preamble | AA02 | 4 |
| 2 – Data of the Meter | ID Meter | IDM02 | 10 |
| … | … | … | … |
| 2 – Data of the Meter | Escape Sequence | \n \r | 2 |
| 3 – Data of the Firmware Measurement block | Preamble | AA03 | 4 |
| … | … | … | … |
| 3 – Data of the Firmware Measurement block | Escape Sequence | \n \r | 2 |
| 4 – Energy Data | Preamble | AA04 | 4 |
| … | … | … | … |
| 4 – Energy Data | Escape Sequence | \n \r | 2 |
| //END | //END | //END | //END |
It is to be noticed that it is a suitable choice to make a perfect correspondence between 1 token and energy unit, i.e.,1 token means 1 kWh or 1 m3.
Due to the higher computation capability of the transmission device, the token file will be managed by the transmission stage; even though the measuring microcontroller should operate at light computation load, it should be able to manage some relevant data, the raw measurements and the environmental corresponding ones, to allow for a possible data reconstruction and processing, in cases processed data should become unavailable for unpredicted events.
2.3.4. Blockchain System Authentication
To guarantee a high protection level of the system against potential unauthorized intrusions or accesses, it is mandatory to introduce a structured authentication procedure to access the blockchain network. To this aim, a Certification Authority is defined, having the specific duty to validate and certify the companies, producing the sensors and measuring systems suitable for the proposed infrastructure, and which are available to make their devices compatible with the blockchain validation process.
The accreditation process is based on different phases:
- the company, which is a sensor producer, ask to be qualified, based on an audit of the Certification Authority;
- after qualification, the company obtains a set of cryptographic keys and proprietary algorithms (for each sensor and/or measurement system) to generate and a pool of serial codes to be pre-charged into the firmware;
- the algorithm of generation will block the serial codes during the installation phase into the firmware; they will be needed for authentication of each measurement datum to be transmitted: in fact, their function is to univocally individuate the authorized single device; furthermore, these codes will be used to preserve the sequence of transactions; this way each transaction could be recovered also in case of transmission problems;
- Network validation during each communication; in fact, the message payload includes also one pre-charged code, to be validated by challenge–response techniques and cryptographic ones based on public/private keys; only after this step the blockchain will consider this communication, being authenticated.
This approach is expected to create a distributed trust chain, being each device accredited to be a part of a safe infrastructure, against frauds and tampering actions.
2.2.5. Communication Protocol
According to the above-mentioned requirements of reliability and security in the management of data with reference to the whole network, the communication protocol has been set according to the following:
-
Communication between nodes:
- a.
- Authority ↔ Data logger: MQTT with dedicated topic for sending batch and reception block confirmation
- b.
- Data logger ↔ Data logger: MQTT publish-subscribe for synchronization of the local status
- c.
- Authority ↔ Authority: MQTT with private topic for consensus communications
-
Communication Gas meter - Server:
- a.
- Protocol: MQTT over TLS to improve the energy efficiency at the edge devices
- b.
- Topic Structure: Different Topic between transactions and heartbeat
- c.
- Local buffer: Transaction queue in case of temporary disconnection with automatic retry
-
Communication Distributor - Server:
- a.
- Protocol: MQTT for architectural compliance
- b.
- Batch Processing: Topic for sending aggregate
- c.
- Real-time Alerts: MQTT retain messages for immediate notification of critical events
All the MQTT communications use TLS 1.3, authentication by certificate client and topic ACL for granular control of the accesses (Cross security).
3. Results
This section presents some preliminary results with reference to both the metering and communication sectors.
3.1. Metering Validation
Some tests have been carried out with the following purposes:
- as for the fluidynamic aspects, validation of the pressure behavior throughout the gas loop, upstream and downstream the meter;
- as for the gas metering, validation of the flowrate, cumulative volume, and environmental quantities measurement (temperature, pressure).
Preliminary tests have been carried out at different flow pressure, in the range of the admitted pressure for domestic gas dispatching pipes. The loop shown in Figure 1 has been used for testing.
First, the pressure sensors have been calibrated by comparison with the reference pressure gauge, and the calibration curve (Figure 6) has been obtained that allows the voltage output to be converted into pressure measurement. A calibration uncertainty of 0.005 bar has been also evaluated.
Therefore, tests have been carried out at constant flow rates of 3.3 m3/h, 4.8 m3/h, and 6.0 m3/h, as said in Section 2.1, in two different environmental conditions:
- Conditions (a): atmospheric pressure: 884 mbar; temperature: 27.0°C
- Conditions (b): atmospheric pressure: 889 mbar; temperature: 25.5°C.
In all the described test conditions the relative pressure at positions Pos1, Pos2, and Pos3 has been measured and plotted in Figure 7.a,b. In both atmospheric conditions, it can be noticed that the ultrasonic meter, at lower flows, does not introduce significant pressure drops, either connected inside the casing (see pressure variation between Pos1 and Pos2) or in-line (see pressure variation between Pos2 and Pos3). At the highest flow rate, instead, the pressure drop evidently becomes more significant in correspondence with the sensor in the casing, where the 2.0 mbar limit prescribed by the standard [17] is exceeded.
Some tests were carried out to check the behavior of the ultrasonic flow sensor: the maximum relative error with respect to the indication of the reference flow measuring device operating in series along the loop of Figure 1 was in the range 4 to 5 %; it is to be pointed out that, once the both measuring block and the transmission one and the blockchain infrastructure will be validated a high accuracy gas flow rate measurement device will be introduced for final gas meter calibration.
3.2. Communication and Blockchain Architecture
A general information flow has been hypothesized, according to the steps described in Table 2. It is to be pointed out that a generic token could be managed, including power, water and gas. Some examples show how the market, the distributed validation and transactions/token flows are implemented.
3.2.1. The Energy Market
Four steps, reported in Table 2, are implemented to realize a bidirectional energy-token market:
The system operates like an Automated Market Maker (AMM) for the energy:
- Cash flow and liquidity pool: all the available energy tokens are recorded in the ledger
- Deposit: All the producers deposit energy tokens
- Withdrawals: All the consumers withdraw tokens according to the energy use
- Arbitration: The distributor acquires tokens from a prosumer selling it to a final consumer
- Immediate settlement: all transactions are irreversible and immediately recorded
3.2.2. The Mechanism of Distributed Validation
An algorithm of Consensus as a Proof of Federated Authority has been set, according to the following parameters:
- Authority minimum number: 3 nodes (to avoid single failure points)
- Consensus threshold: ⅔ +0.01 (almost the 67% of the Authorities approve)
- Blockage time: 30 s, (trade-off between reaction time and stability)
The set threshold is able to keep the system working in case of troubles or attacks, even in case of failure of one node, on a total of 3 nodes, or of 2 nodes, on a total of 5 nodes.
The validation process is shown in Table 5:
Some practical safety mechanisms are created, and in particular:
-
Anti-Double Spending:
- a.
- Univocal cryptographic UUID for each token
- b.
- A distributed database tracks the status of each token (created/consumed/transferred)
- c.
- Atomic lock during concurrent transactions
-
Validation of Production
- a.
- Digital certification of the production plant
- b.
- Compliance with the allowed ranges
- c.
- Optional integration of other monitoring systems
3.2.3. Transactions and token flow
The main supported transactions are:
- Token creation
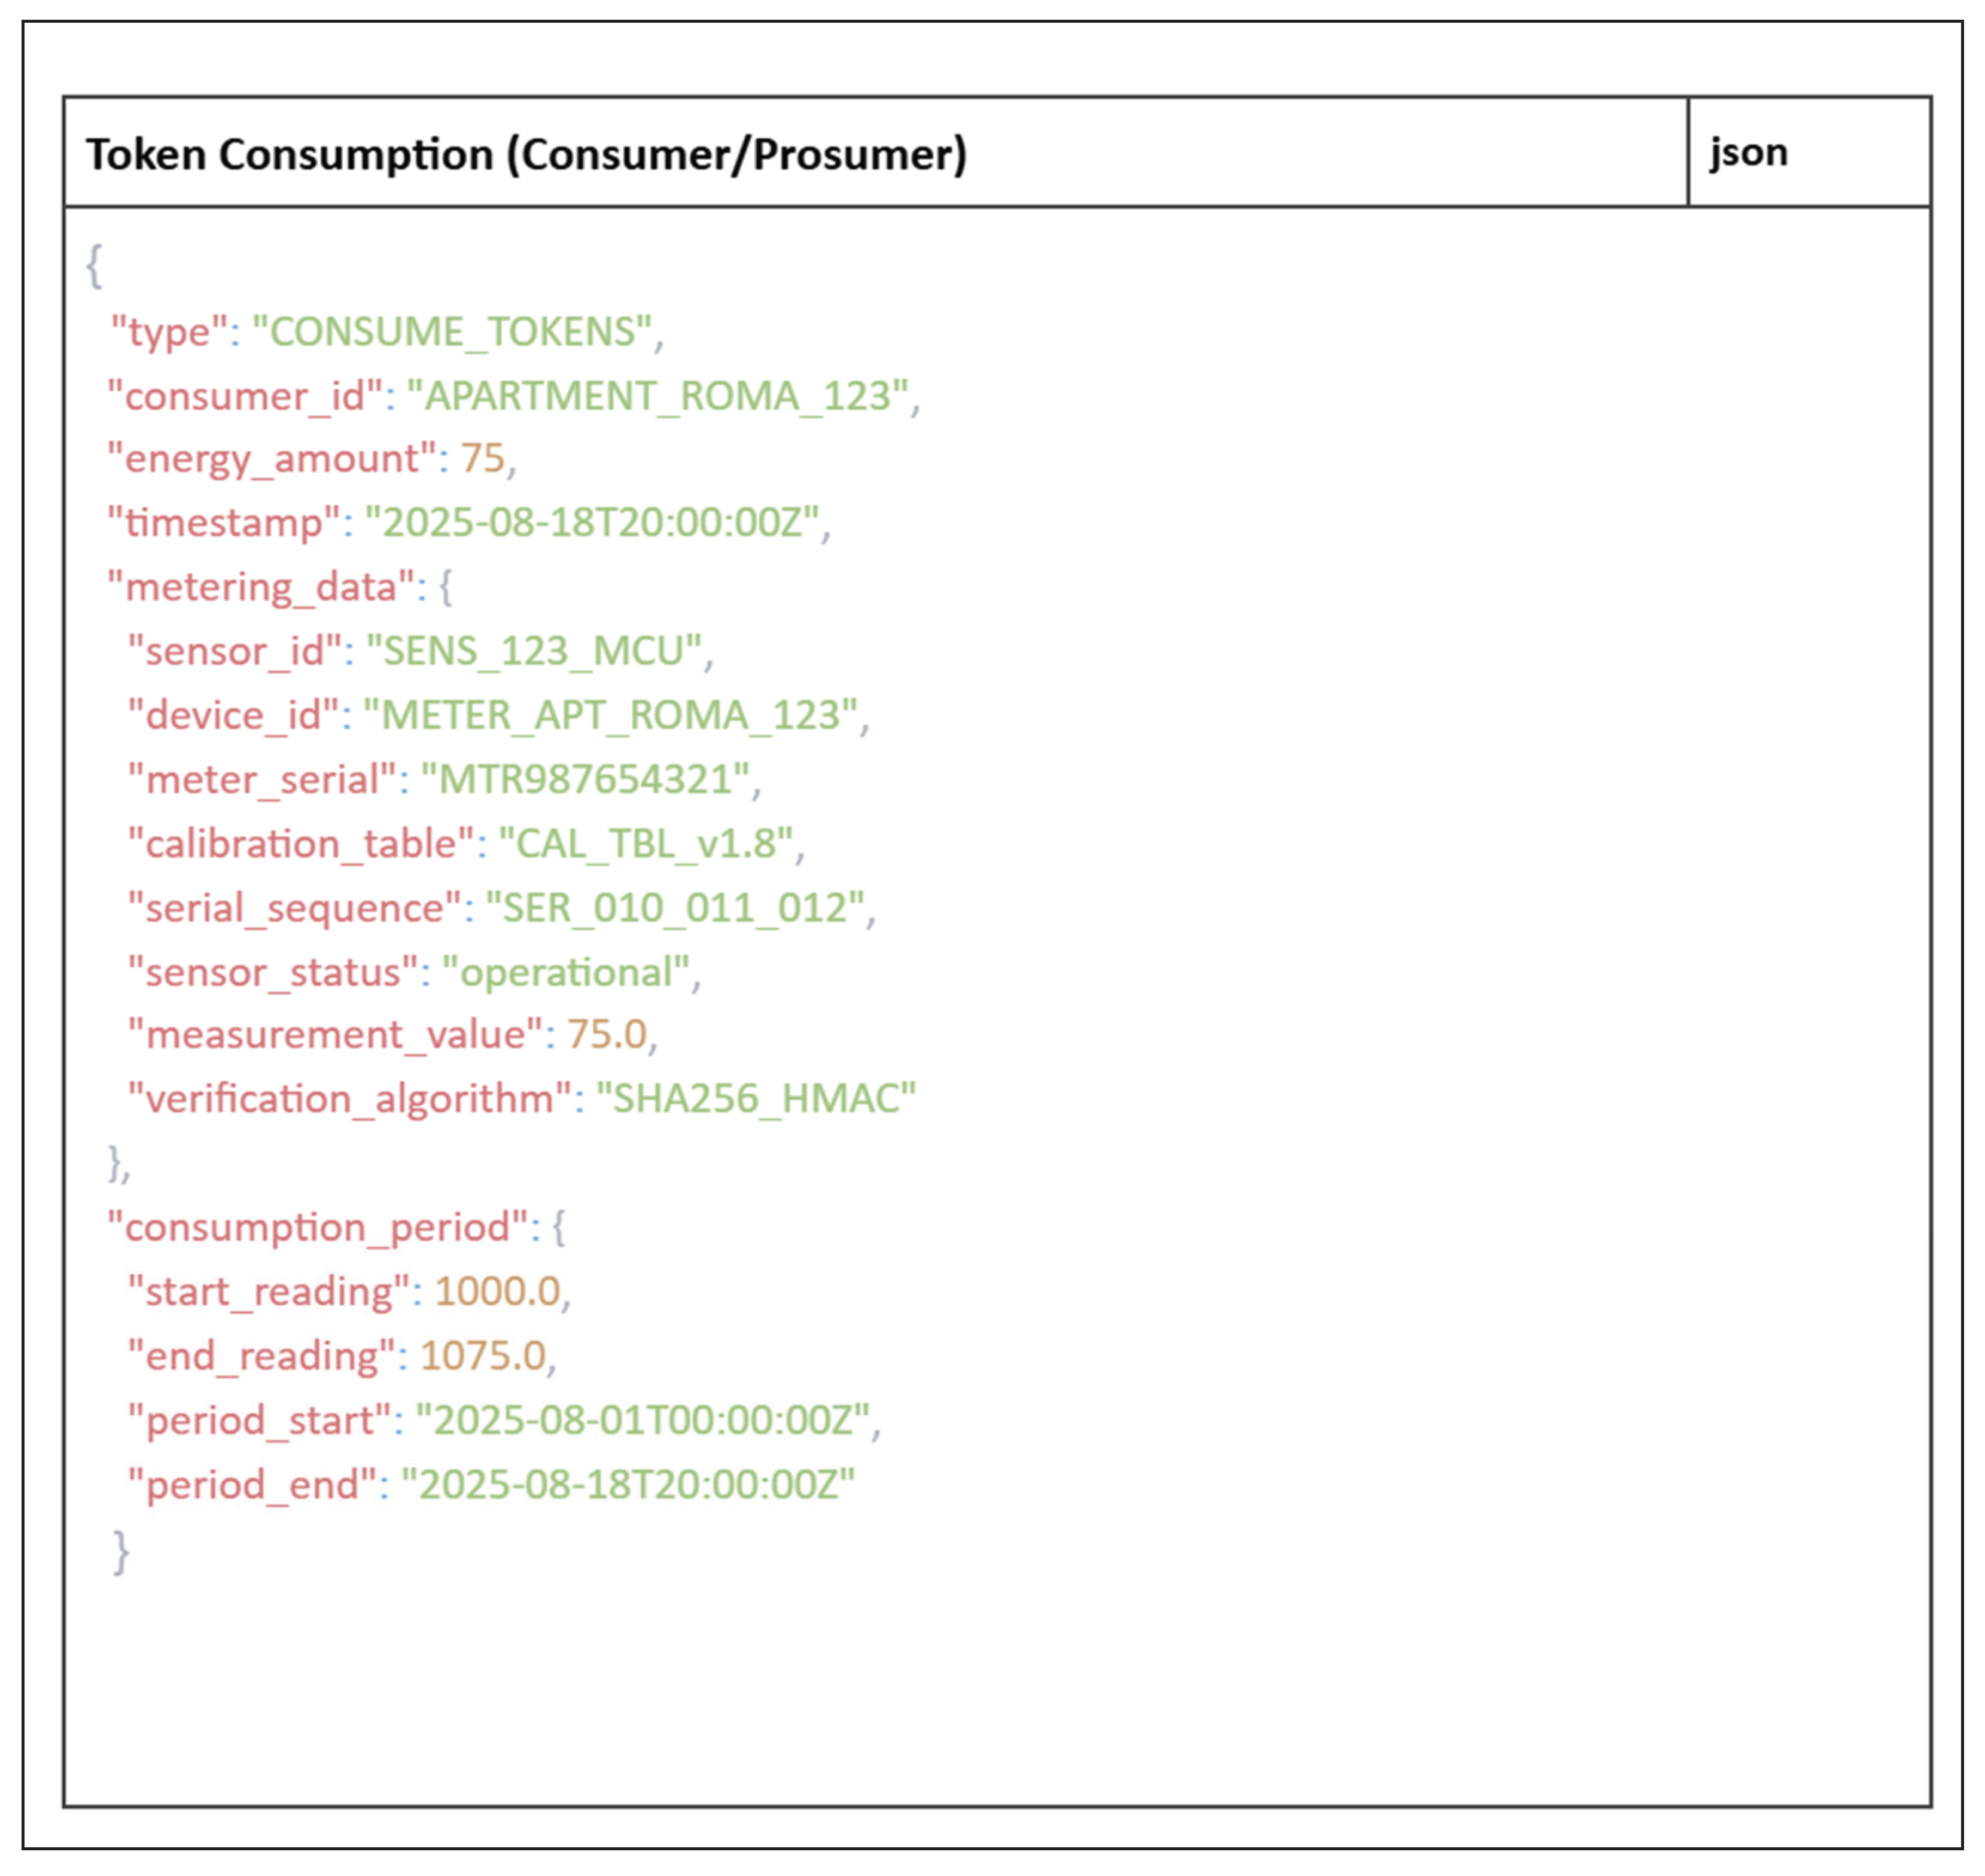
- Token consumption (Final consumer/Prosumer)
- Token transfer (between actors)
An example of the execution programs has been prepared, according to requirements of simplicity and of computational load reduction. The list of the programs accomplishing these tasks is given in Appendix A.
3.2.4. Token Life Cycle
As an example the graphs of Figure 8, show a practical life cycle of tokens, depending on the actors involved. It is to highlight the role of the final consumer, which is fully engaged.
3.2.5. Management of the Distributed Ledger
The basic idea is that the tokens exist only in the distributed ledger. Furthermore, the system manages the ownership and the status of each token by means of signed transactions using cryptography. Three token statuses are allowed:
- created: Token generated and available for use;
- transferred: Token transferred between actors (it is available)
- consumed: Token used to assess consumption (final status)
A preliminary simulation of the blockchain system has been realized with the infrastructure shown in Figure 9 and representing nodes of all the requested typology, by means of virtual machines.
The tests carried out confirm that this infrastructure allows for a right connection and communication between the Edge node and the Aggregator one and for a fully operating and bidirectional communication between Aggregator node and Authority one. Preliminar checks show that a few thousand edge nodes could be served by this infrastructure without requiring special computation resources.
4. Conclusions
In this paper the design and a preliminary validation of a smart gas meter is presented with the purpose of realizing a meter guaranteeing accuracy and security of data throughout the whole information way from the measurement to the billing. Accuracy issues have been faced in laboratory tests concerning the fluid dynamic behavior of the flow sensor in the gas meter, studying the eventual pressure losses introduced by the geometrical layout and the effect of environmental conditions. Preliminary tests demonstrated that the proposed geometrical layout allows for the possibility of easy data normalization with a simple set of sensors. Data security aspects have been analyzed by employing LoRa and/or NB-IoT protocols and block-chain technologies with a completely modular design; the architecture is divided in two separate blocks, the former for measurement and the latter for communication. Digital data management is able to share data between the two blocks in order to preserve the needed information in the measuring block even though the communication one is changed. The electronic solution provided for measurement and transmission blocks are designed for a low energy consumption, allowing long battery lifetime. Communication of energy consumption between network actors is managed on the basis of tokens traded in a blockchain network. Simulation software analysis shows that a network of up to a few thousand final users could be managed with an allowable computational load.
Of course, the aspects described in this paper are mainly devoted to discuss potential technical hardware/software solutions for accurate and secure energy consumption data management, creating a distributed infrastructure; implementing this peer to peer and distributed energy market requires significant modification of the existing laws, technical standards and rules and this aspect is valid especially in Italy. Nevertheless, studying the technical aspects connected to the suggested innovation could be useful to the whole debate.
Author Contributions
Conceptualization and methodology: G.D., G.F., P.S., E.N., V.S., Hardware/Software L.Chio., L. Chia., P.E., E.N, D.P., V.S., Validation G.D., E.N., P.S., V.S., Writing and editing: G.D., P.E., E.N, D.P., P.S., Funding: G.D, P.S., V.S.
Funding
This research was funded by the project “Gas metering”, POR FESR Abruzzo 2021/2027 – Intervento 1.1.1.1 “Avviso pubblico per il sostegno a progetti di ricerca e innovazione delle imprese afferenti ai domini tecnologici della Strategia Regionale di specializzazione Intelligente RIS3 Abruzzo 2021-2027” - CUP C49J24000100007.
Conflicts of Interest
The authors declare no conflicts of interest.
Appendix A
Figure A1.
Token creation program.
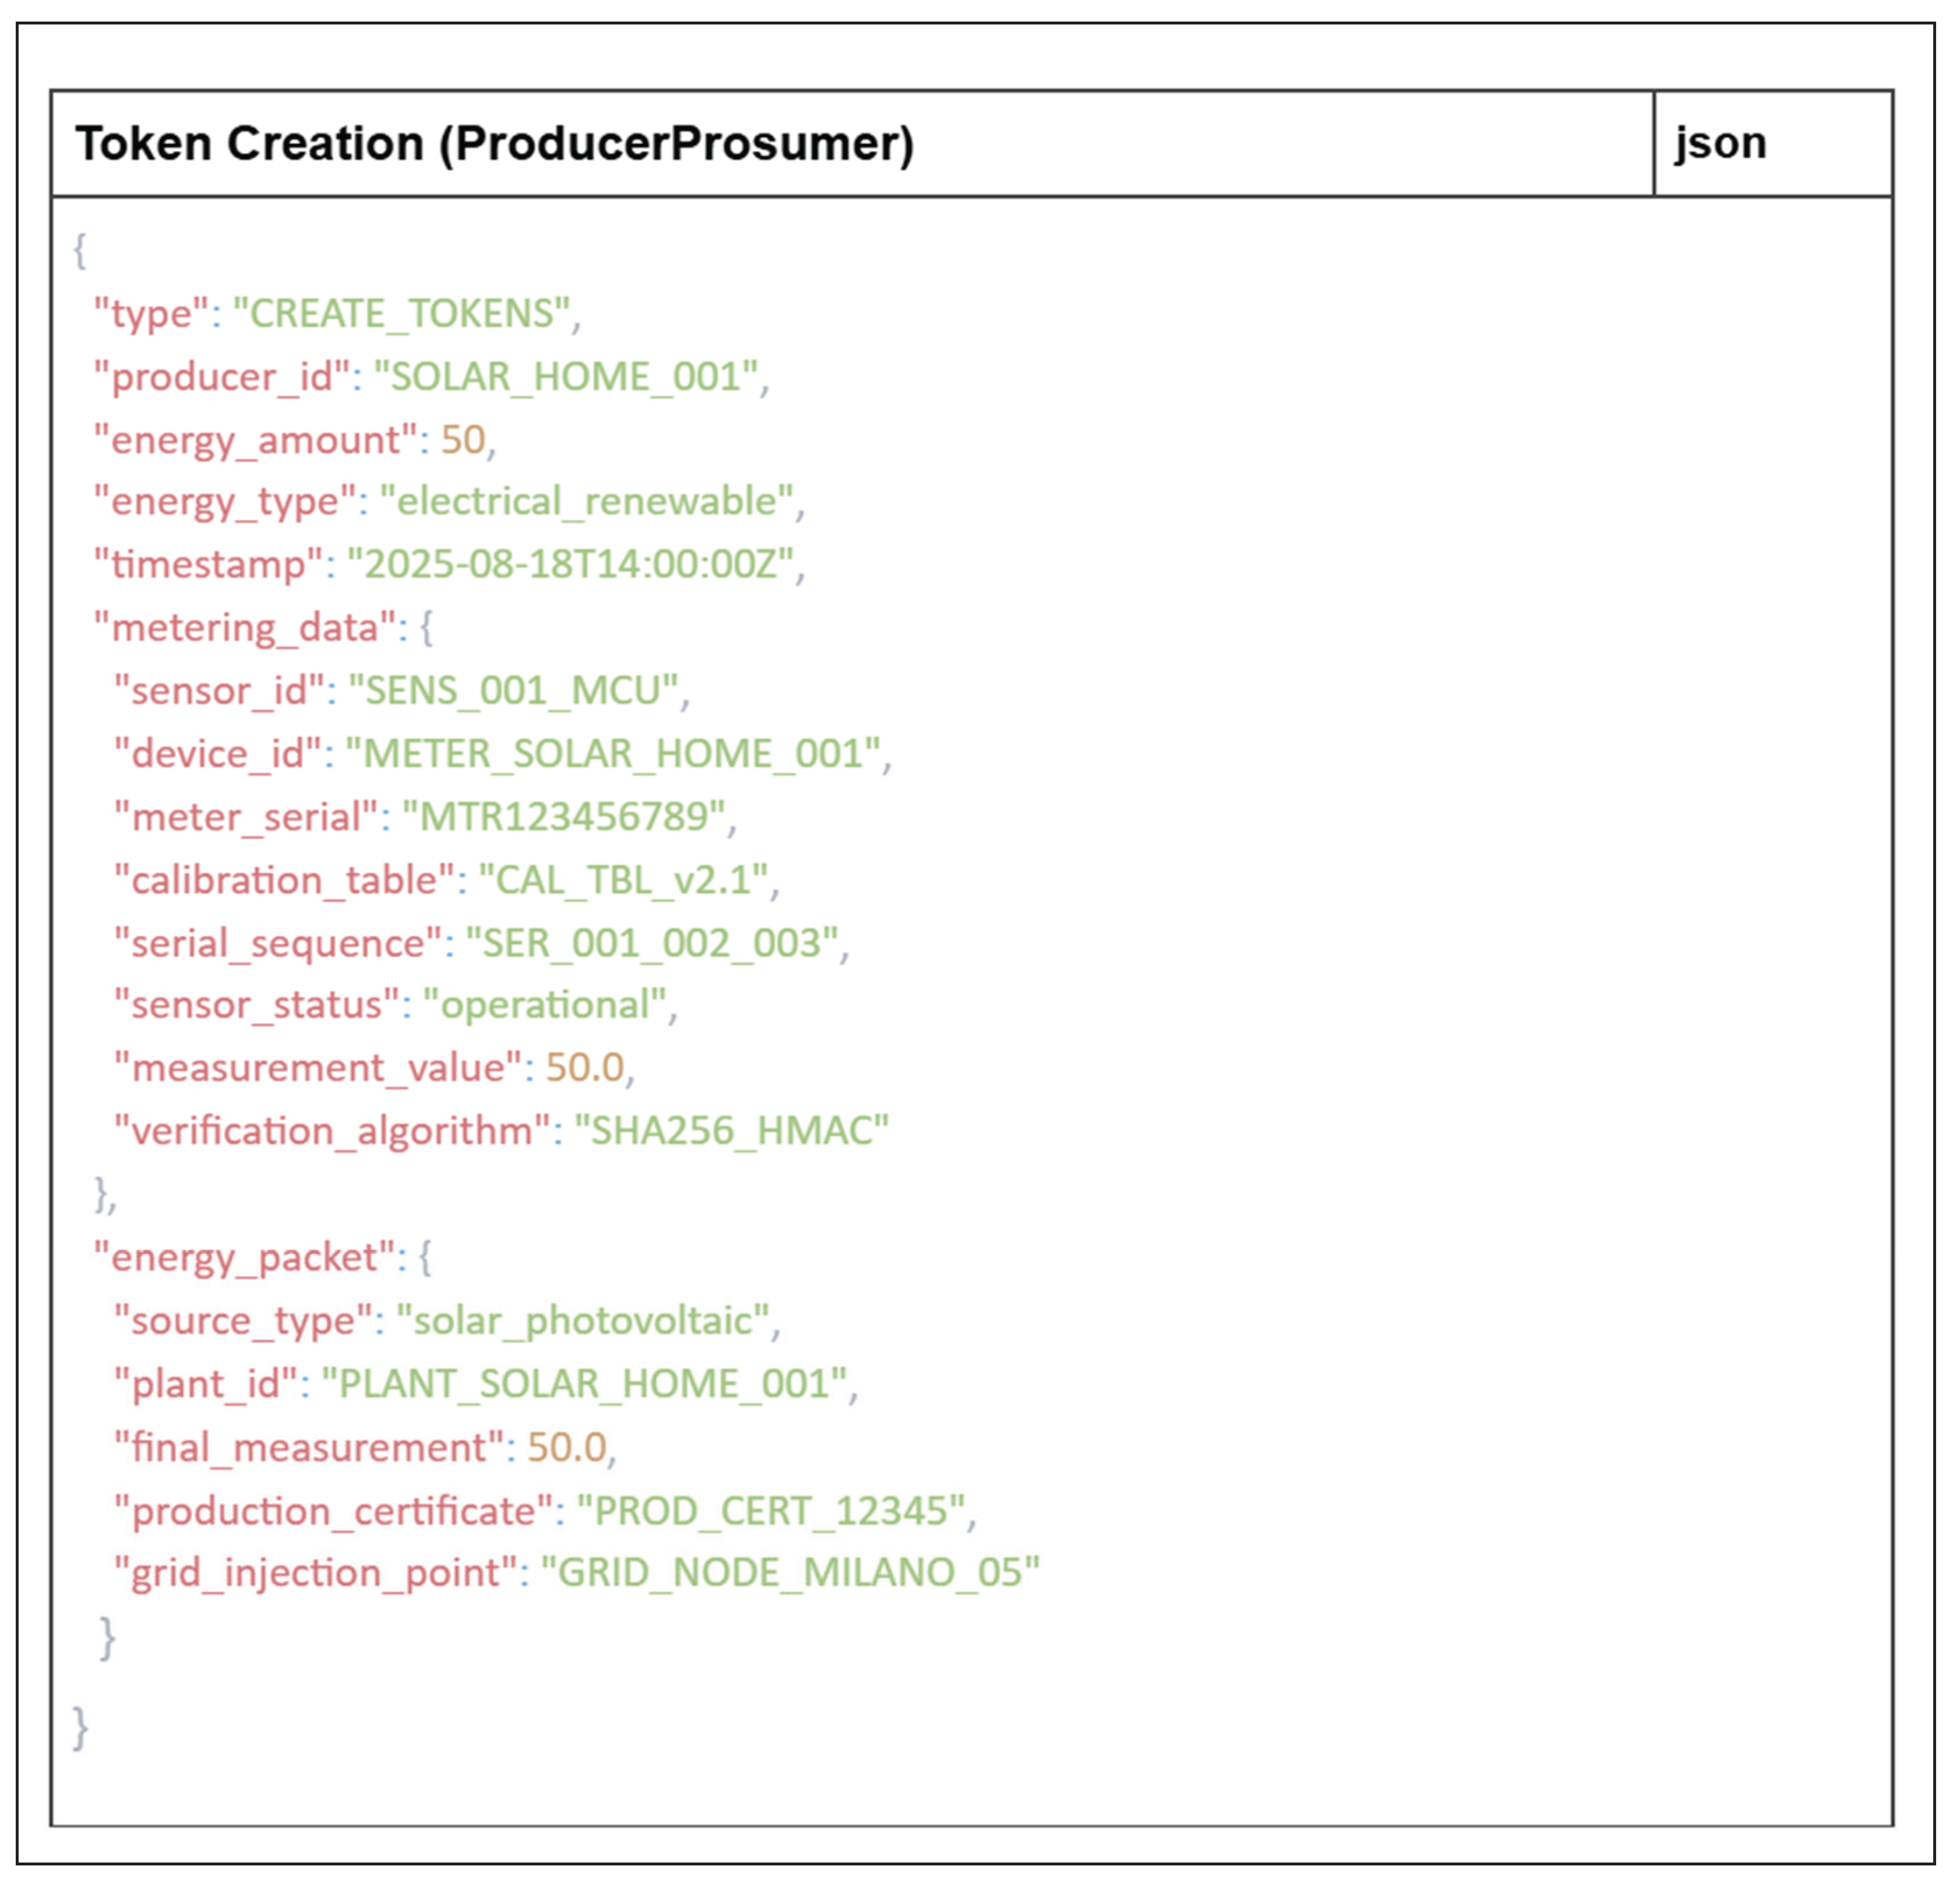
Figure A2.
Token consumption program.
References
- Montuori, L.; Alcázar-Ortega, M.; Vargas-Salgado, C.; Mansó-Borràs, I. Enabling the Natural Gas System as Smart Infrastructure: Metering Technologies for Customer Applications. In Proceedings of the 2020 Global Congress on Electrical Engineering (GC-ElecEng); 2020; pp. 96–100.
- D’Emilia, G.; Gaspari, A.; Natale, E.; Adduce, G.; Vecchiarelli, S. All-Around Approach for Reliability of Measurement Data in the Industry 4.0. IEEE Instrum Meas Mag 2021, 24, 30–37. [CrossRef]
- Cascetta, F.; Rotondo, G.; Piccato, A.; Spazzini, P.G. Calibration Procedures and Uncertainty Analysis for a Thermal Mass Gas Flowmeter of a New Generation. Measurement 2016, 89, 280–287. [CrossRef]
- Celenza, L.; Dell’Isola, M.; Ficco, G.; Vigo, P.; Bertoli, E.; Incerti, L.; Zocchi, T. Critical Aspects of New Domestic Static Gas Meter. In Proceedings of the 2015 XVIII AISEM Annual Conference; 2015; pp. 1–4.
- Ficco, G.; Dell’Isola, M.; Graditi, G.; Monteleone, G.; Gislon, P.; Kulaga, P.; Jaworski, J. Reliability of Domestic Gas Flow Sensors with Hydrogen Admixtures. Sensors 2024, 24. [CrossRef]
- Zhou, J.; Wang, P.; Wang, R.; Niu, Z.; Zhang, K. Signal Processing Method of Ultrasonic Gas Flowmeter Based on Transit-Time Mathematical Characteristics. Measurement 2025, 239, 115485. [CrossRef]
- Yang, Z.; Gan, Q.; He, M.; Huang, Y.; Zhang, L. Research on the Influence of Sensor Installation Arrangement on Online Measurement of External Clamp-on Ultrasonic Flowmeter. In Proceedings of the 2024 IEEE 6th Advanced Information Management, Communicates, Electronic and Automation Control Conference (IMCEC); 2024; Vol. 6, pp. 1547–1551.
- Bekraoui, A.; Hadjadj, A. Thermal Flow Sensor Used for Thermal Mass Flowmeter. Microelectronics J 2020, 103, 104871. [CrossRef]
- Jaworski, J.; Dudek, A. Study of the Effects of Changes in Gas Composition as Well as Ambient and Gas Temperature on Errors of Indications of Thermal Gas Meters. Energies (Basel) 2020, 13. [CrossRef]
- Ficco, G.; Frattolillo, A.; Malengo, A.; Puglisi, G.; Saba, F.; Zuena, F. Field Verification of Thermal Energy Meters through Ultrasonic Clamp-on Master Meters. Measurement 2020, 151, 107152. [CrossRef]
- Esposito, P., Spinozzi, P., Natale, E., D’Emilia, G., Ferri, G., & Stornelli, V. (2024). A LoRa-based Smart Gas Meter for Civil and Industrial Applications, In SIE 2024, LV Annual Meeting of the Italian Society of Electronics, 26-28 June, 2024, Genoa, Italy.
- Divya, G.; Supraja, P. Bids and Asks: Blockchain-Based Peer-to-Peer Trading Platform. Computers and Electrical Engineering 2024, 119, 109516. [CrossRef]
- Groza, J.M.; Sadat, S.A.; Hayibo, K.S.; Pearce, J.M. Using a Ledger to Facilitate Autonomous Peer-to-Peer Virtual Net Metering of Solar Photovoltaic Distributed Generation. Solar Energy Advances 2024, 4, 100064. [CrossRef]
- Mitrea, D.; Toderean, L.; Cioara, T.; Anghel, I.; Antal, M. Smart Contracts and Homomorphic Encryption for Private P2P Energy Trading and Demand Response on Blockchain. Heliyon 2023, 9, e22357. [CrossRef]
- Eickhoff, M.; Exner, A.; Busboom, A. Energy Consumption Tokens for Blockchain-Based End-to-End Trading of Green Energy Certificates. In Proceedings of the 2023 IEEE PES GTD International Conference and Exposition (GTD); 2023; pp. 1–5.
- Merrad, Y.; Habaebi, M.H.; Islam, Md.R.; Gunawan, T.S.; Elsheikh, E.A.A.; Suliman, F.M.; Mesri, M. Machine Learning-Blockchain Based Autonomic Peer-to-Peer Energy Trading System. Applied Sciences 2022, 12. [CrossRef]
- Ultrasonic Domestic Gas Meters. CEN EN 14236:2018 2018.
- 2014/32/EU - Directive 2014/32/EU of the European Parliament and of the Council of 26 February 2014 on the Harmonisation of the Laws of the Member States Relating to the Making Available on the Market of Measuring Instruments 2016.
Figure 1.
Test bench diagram (a) and picture (b).
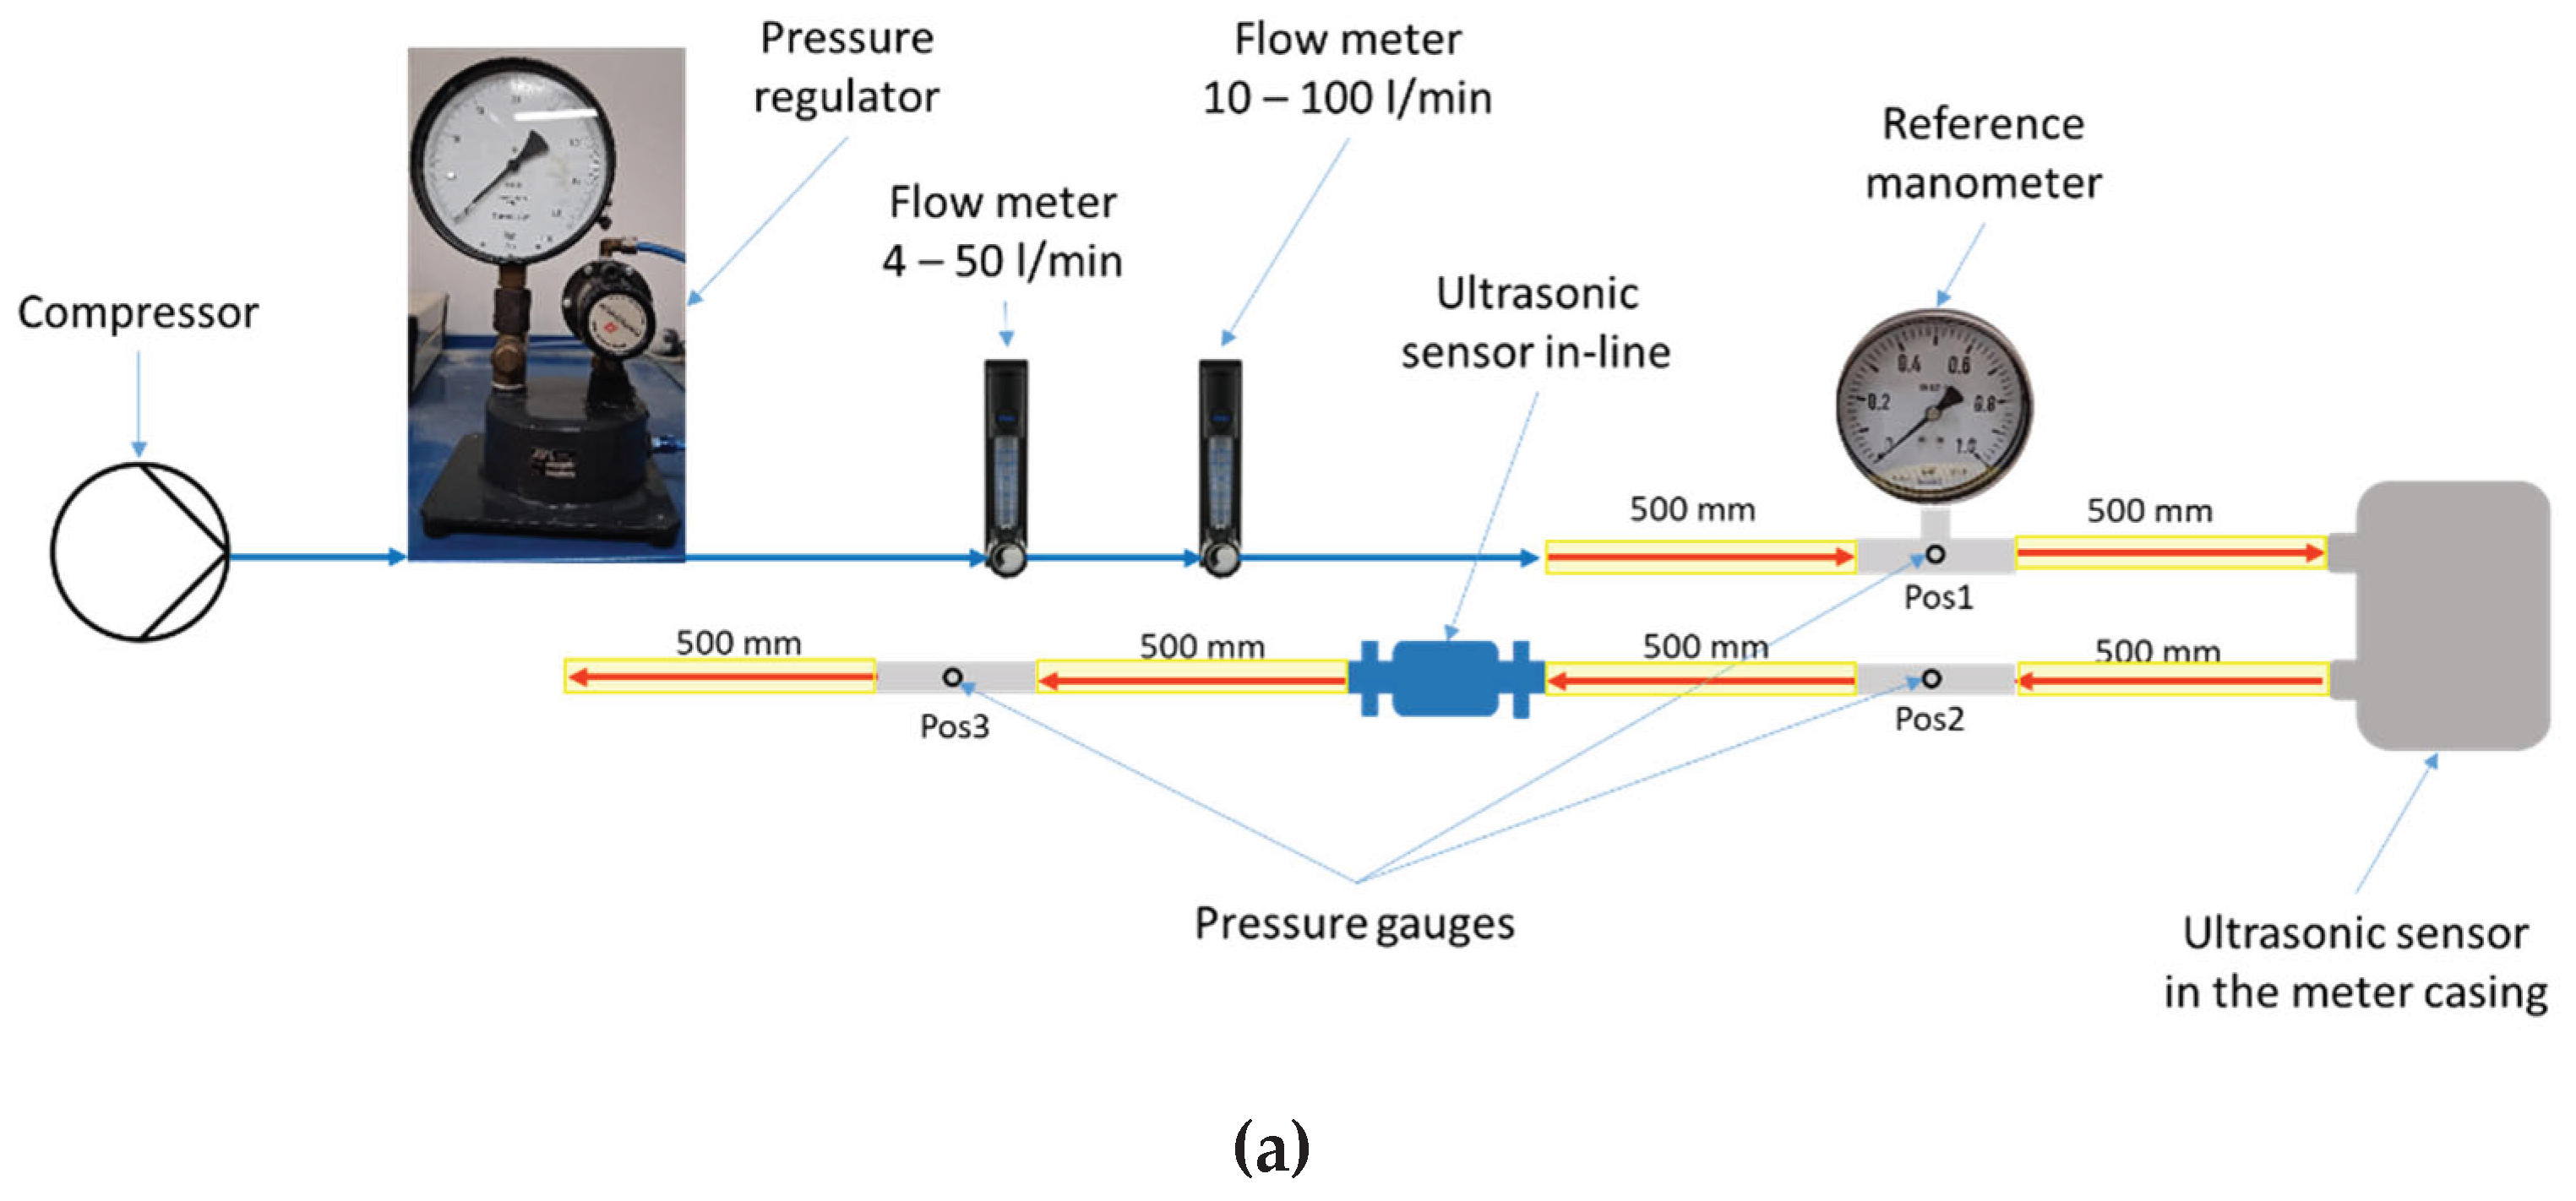
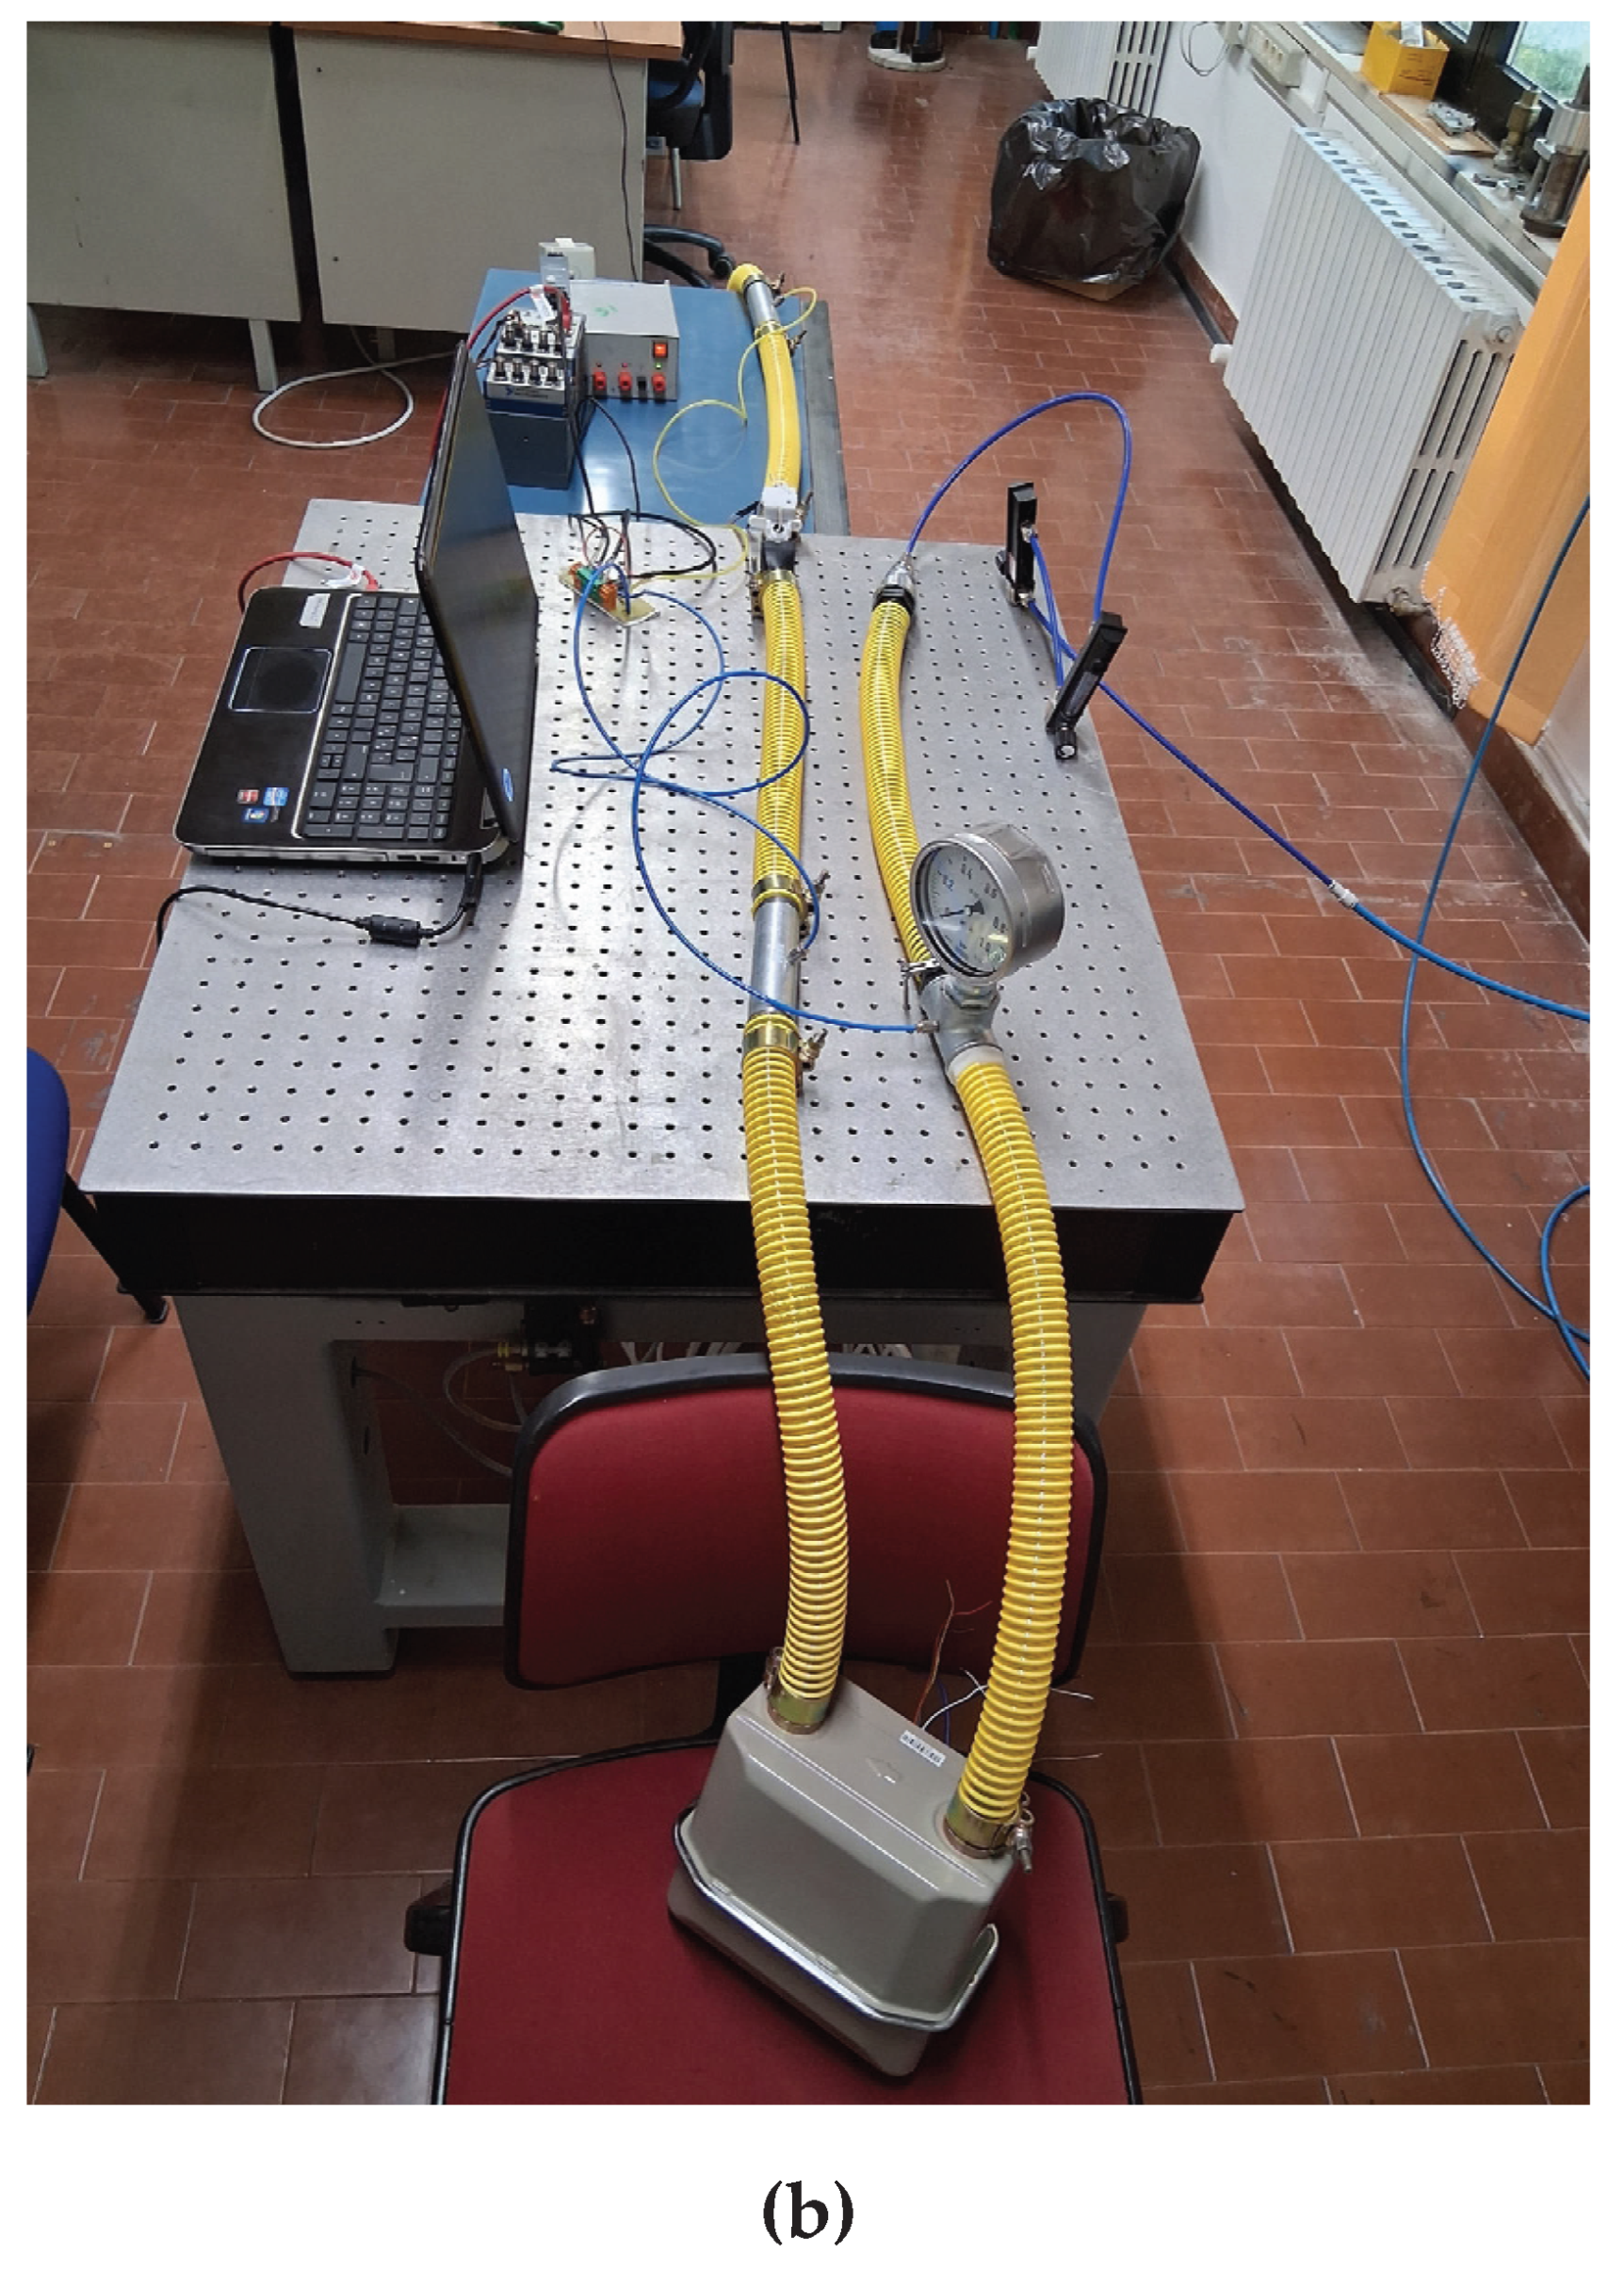
Figure 2.
Ultrasonic sensor in-line (a); ultrasonic sensor in the meter casing (b).
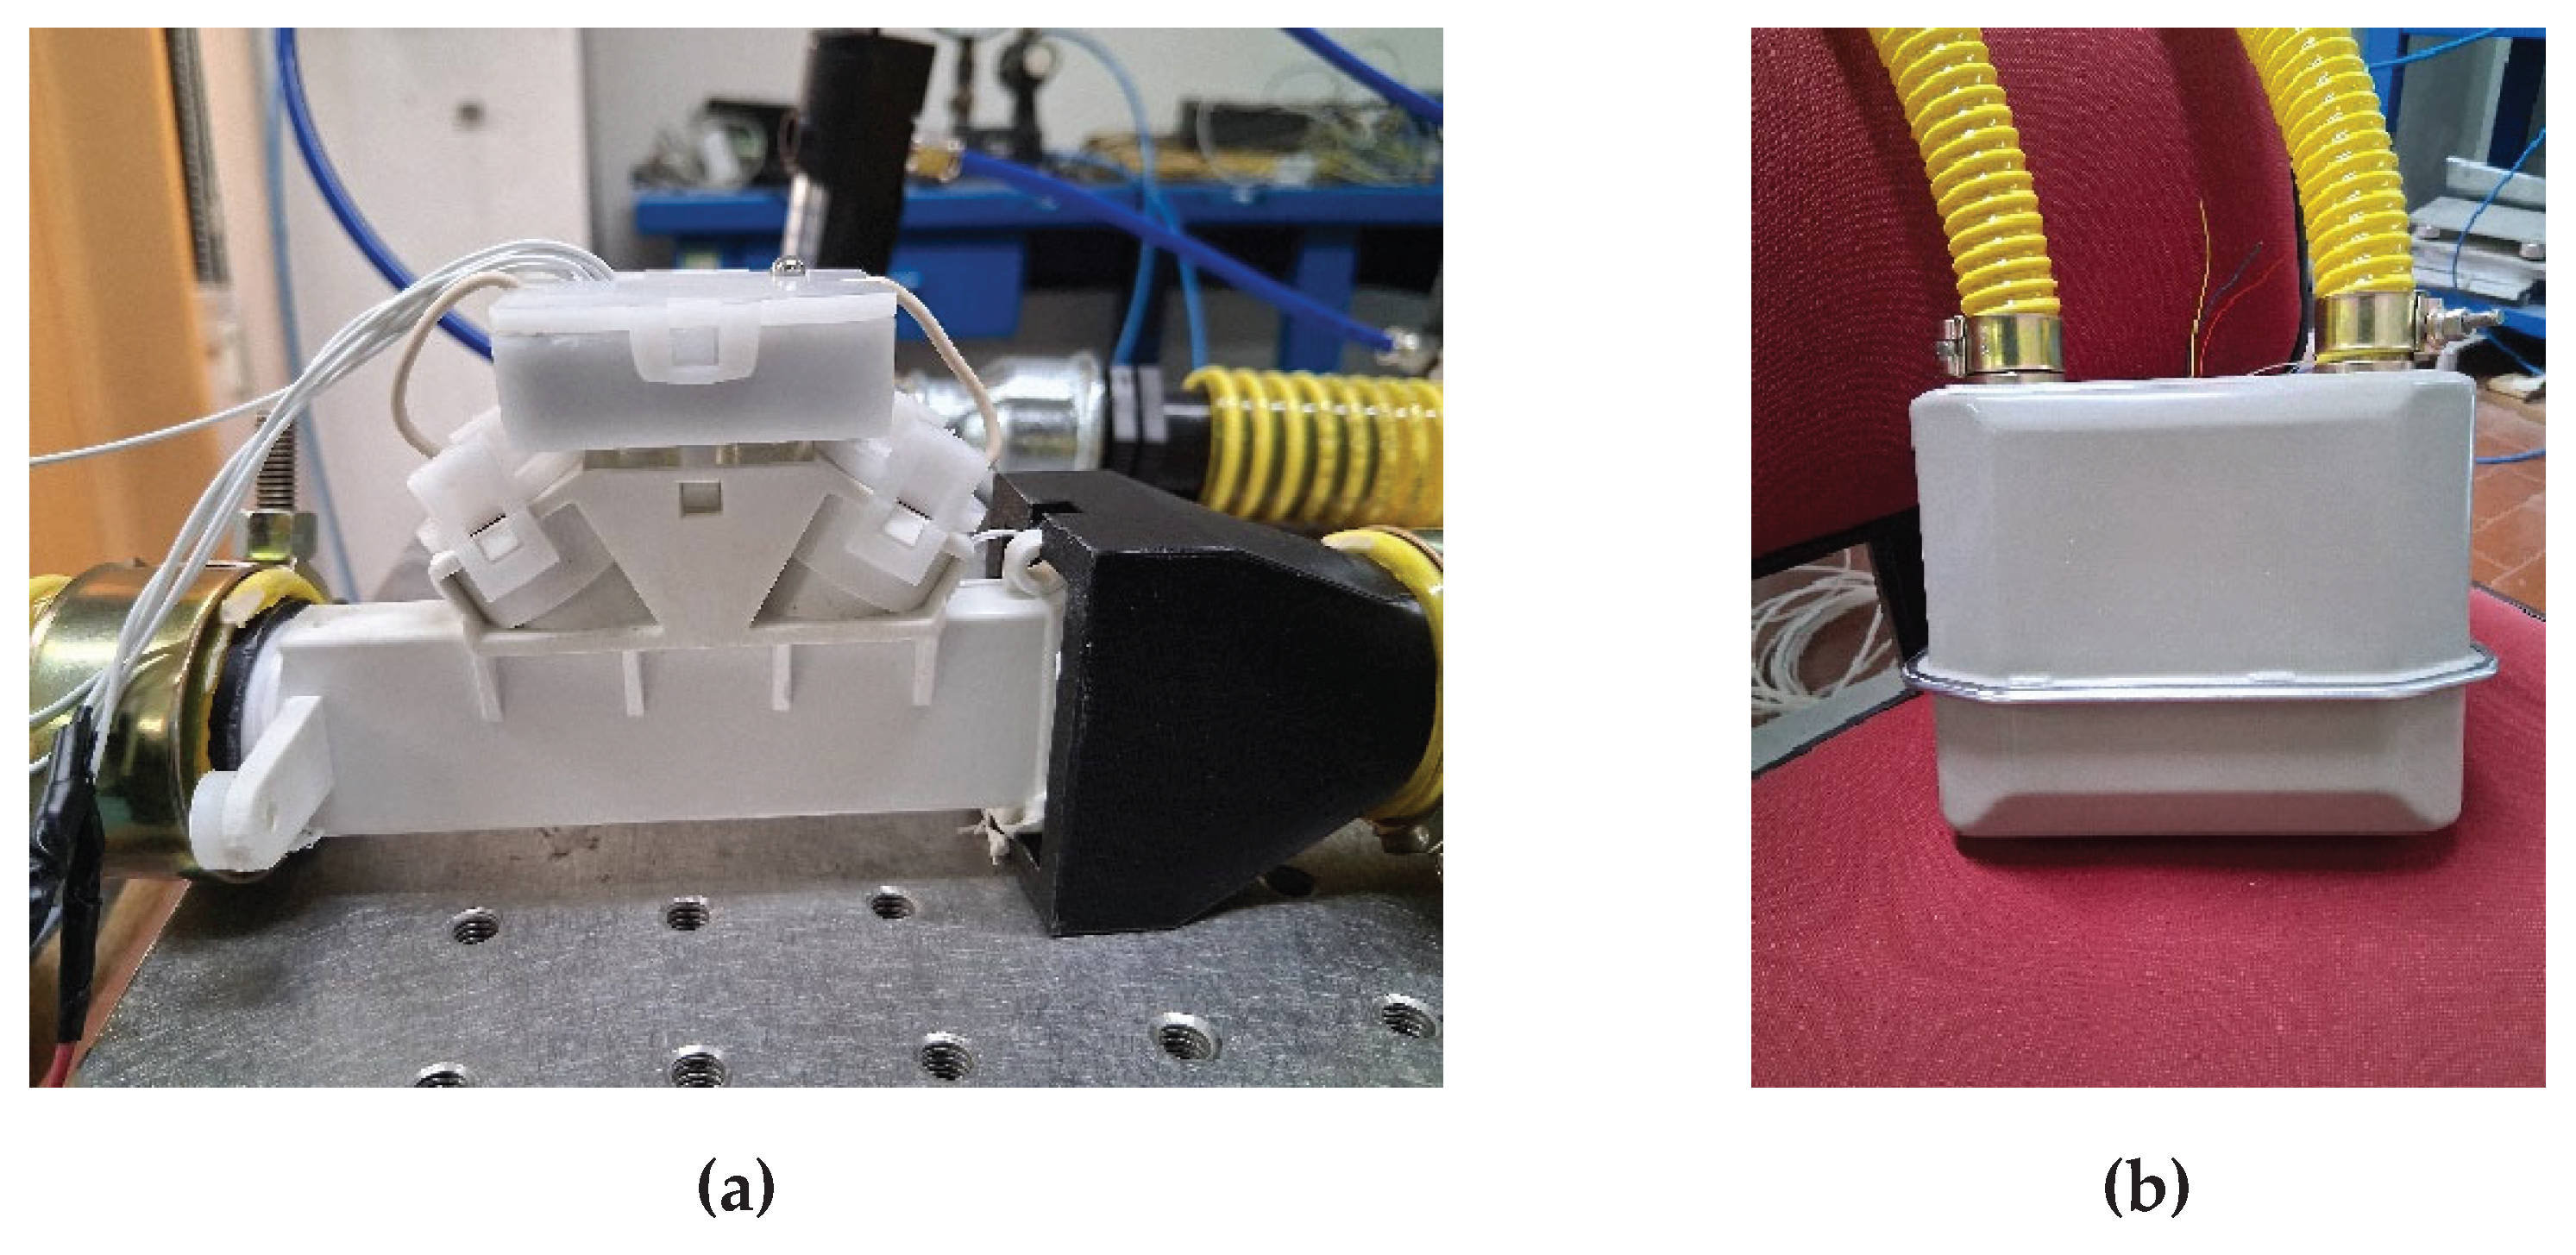
Figure 3.
MEMS pressure sensors (a); reference manometer (b).

Figure 4.
Structure of the smart gas metering LoRa-NB-IoT-based communication part.
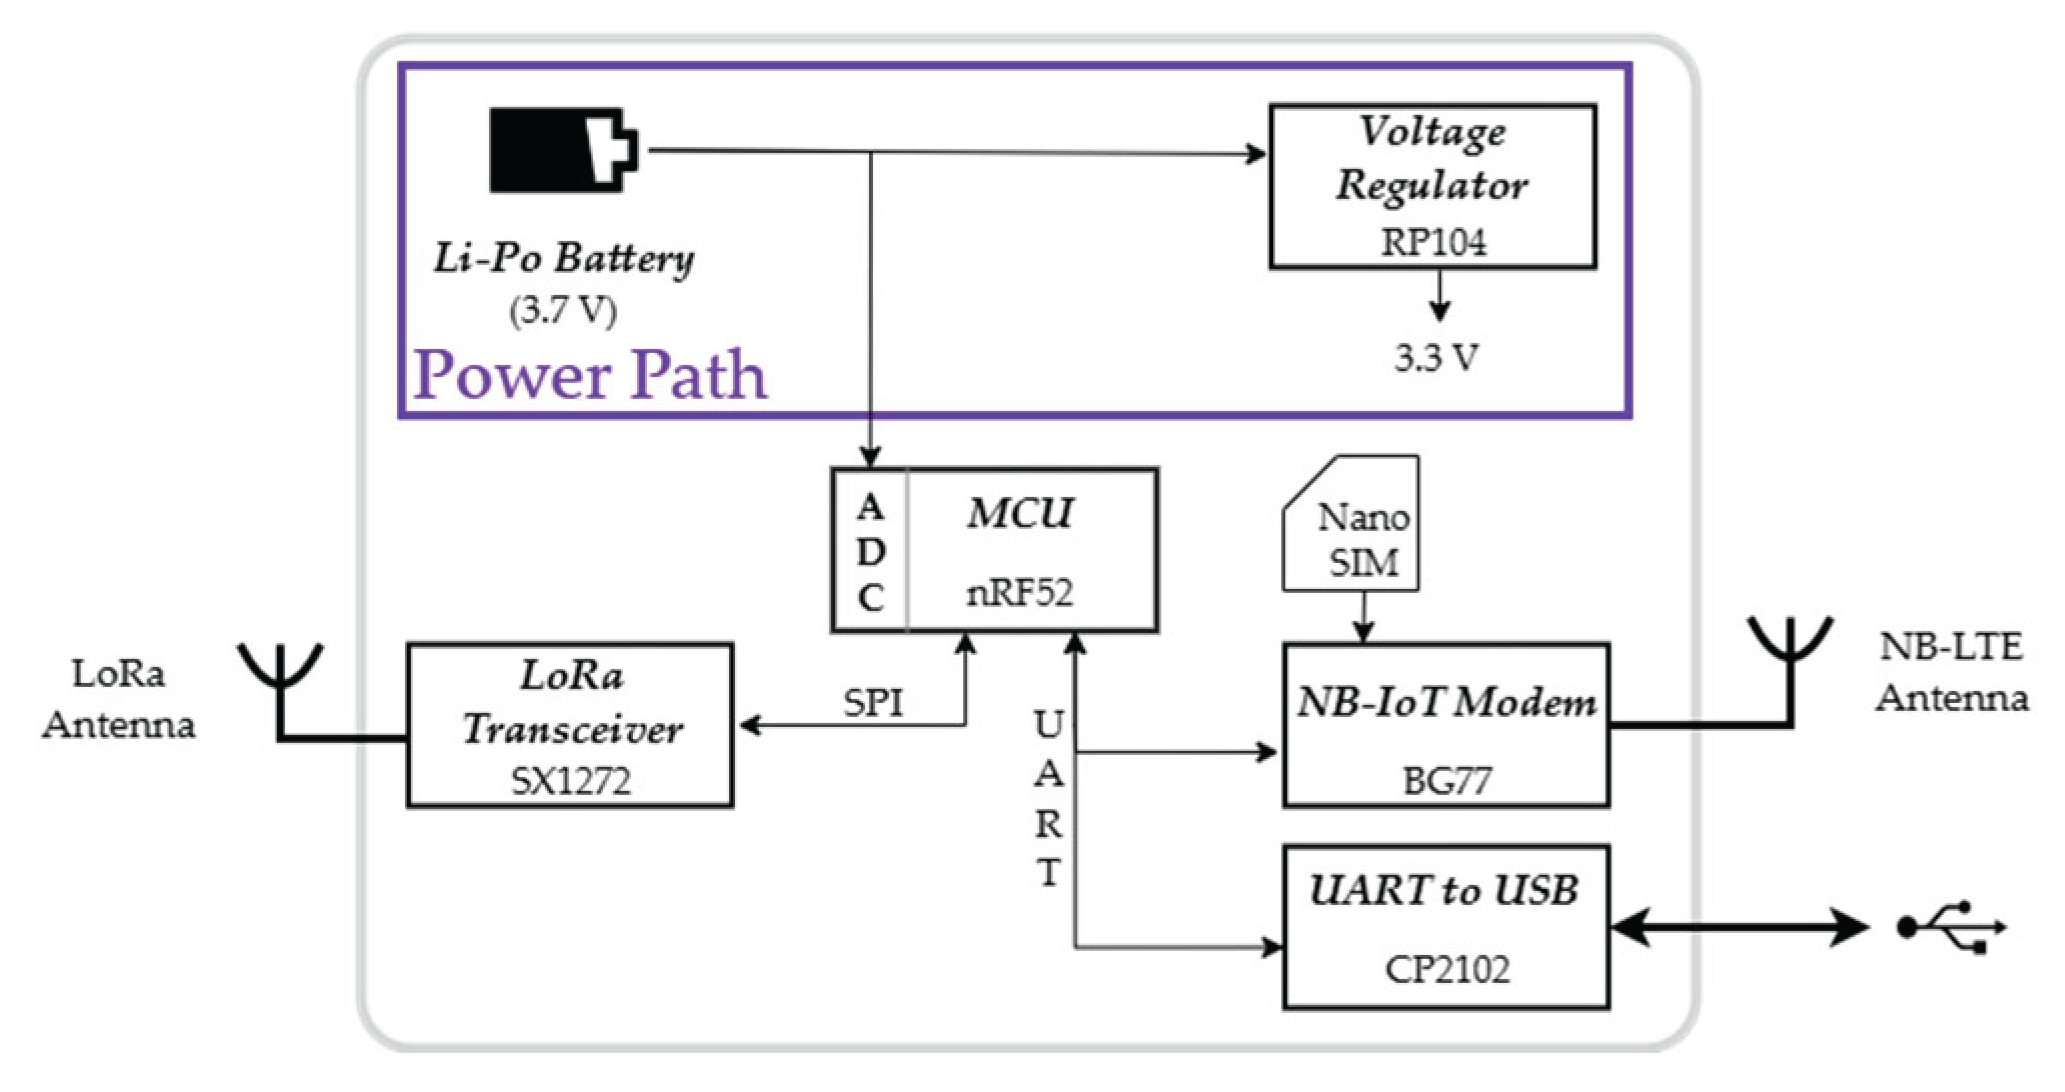
Figure 5.
A synthetic sketch of the proposed communication infrastructure.
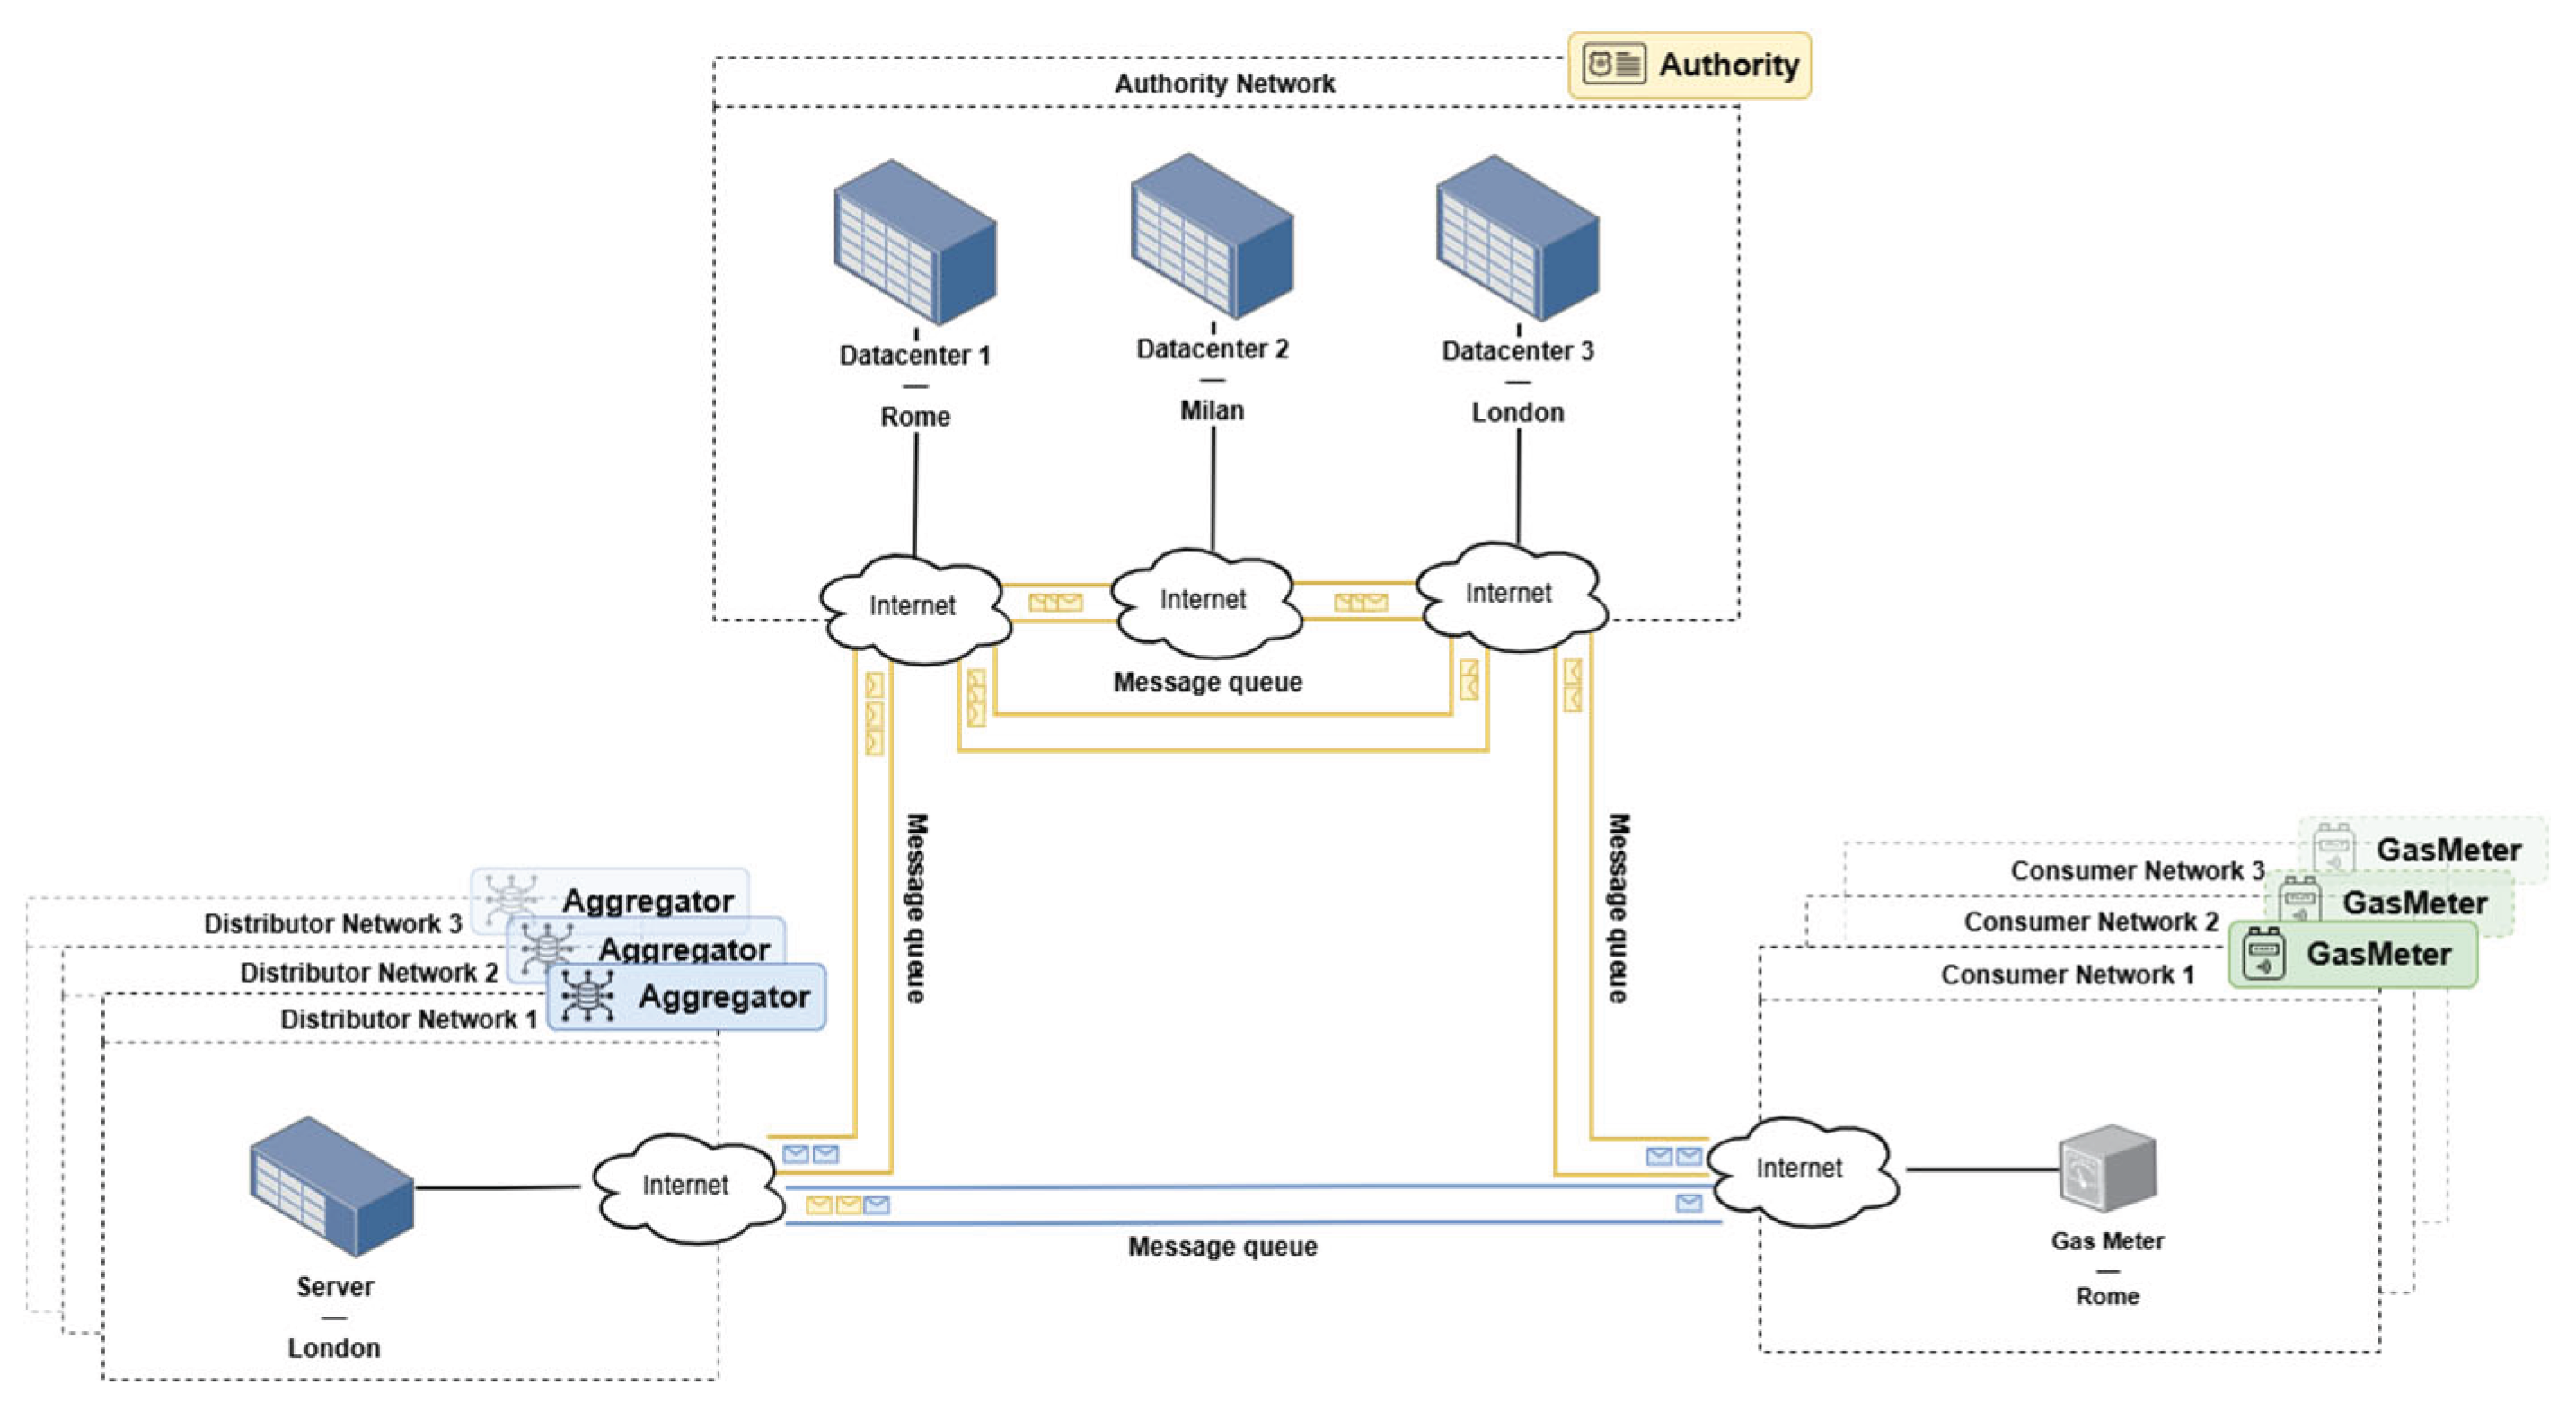
Figure 6.
Calibration diagram of the pressure sensors.
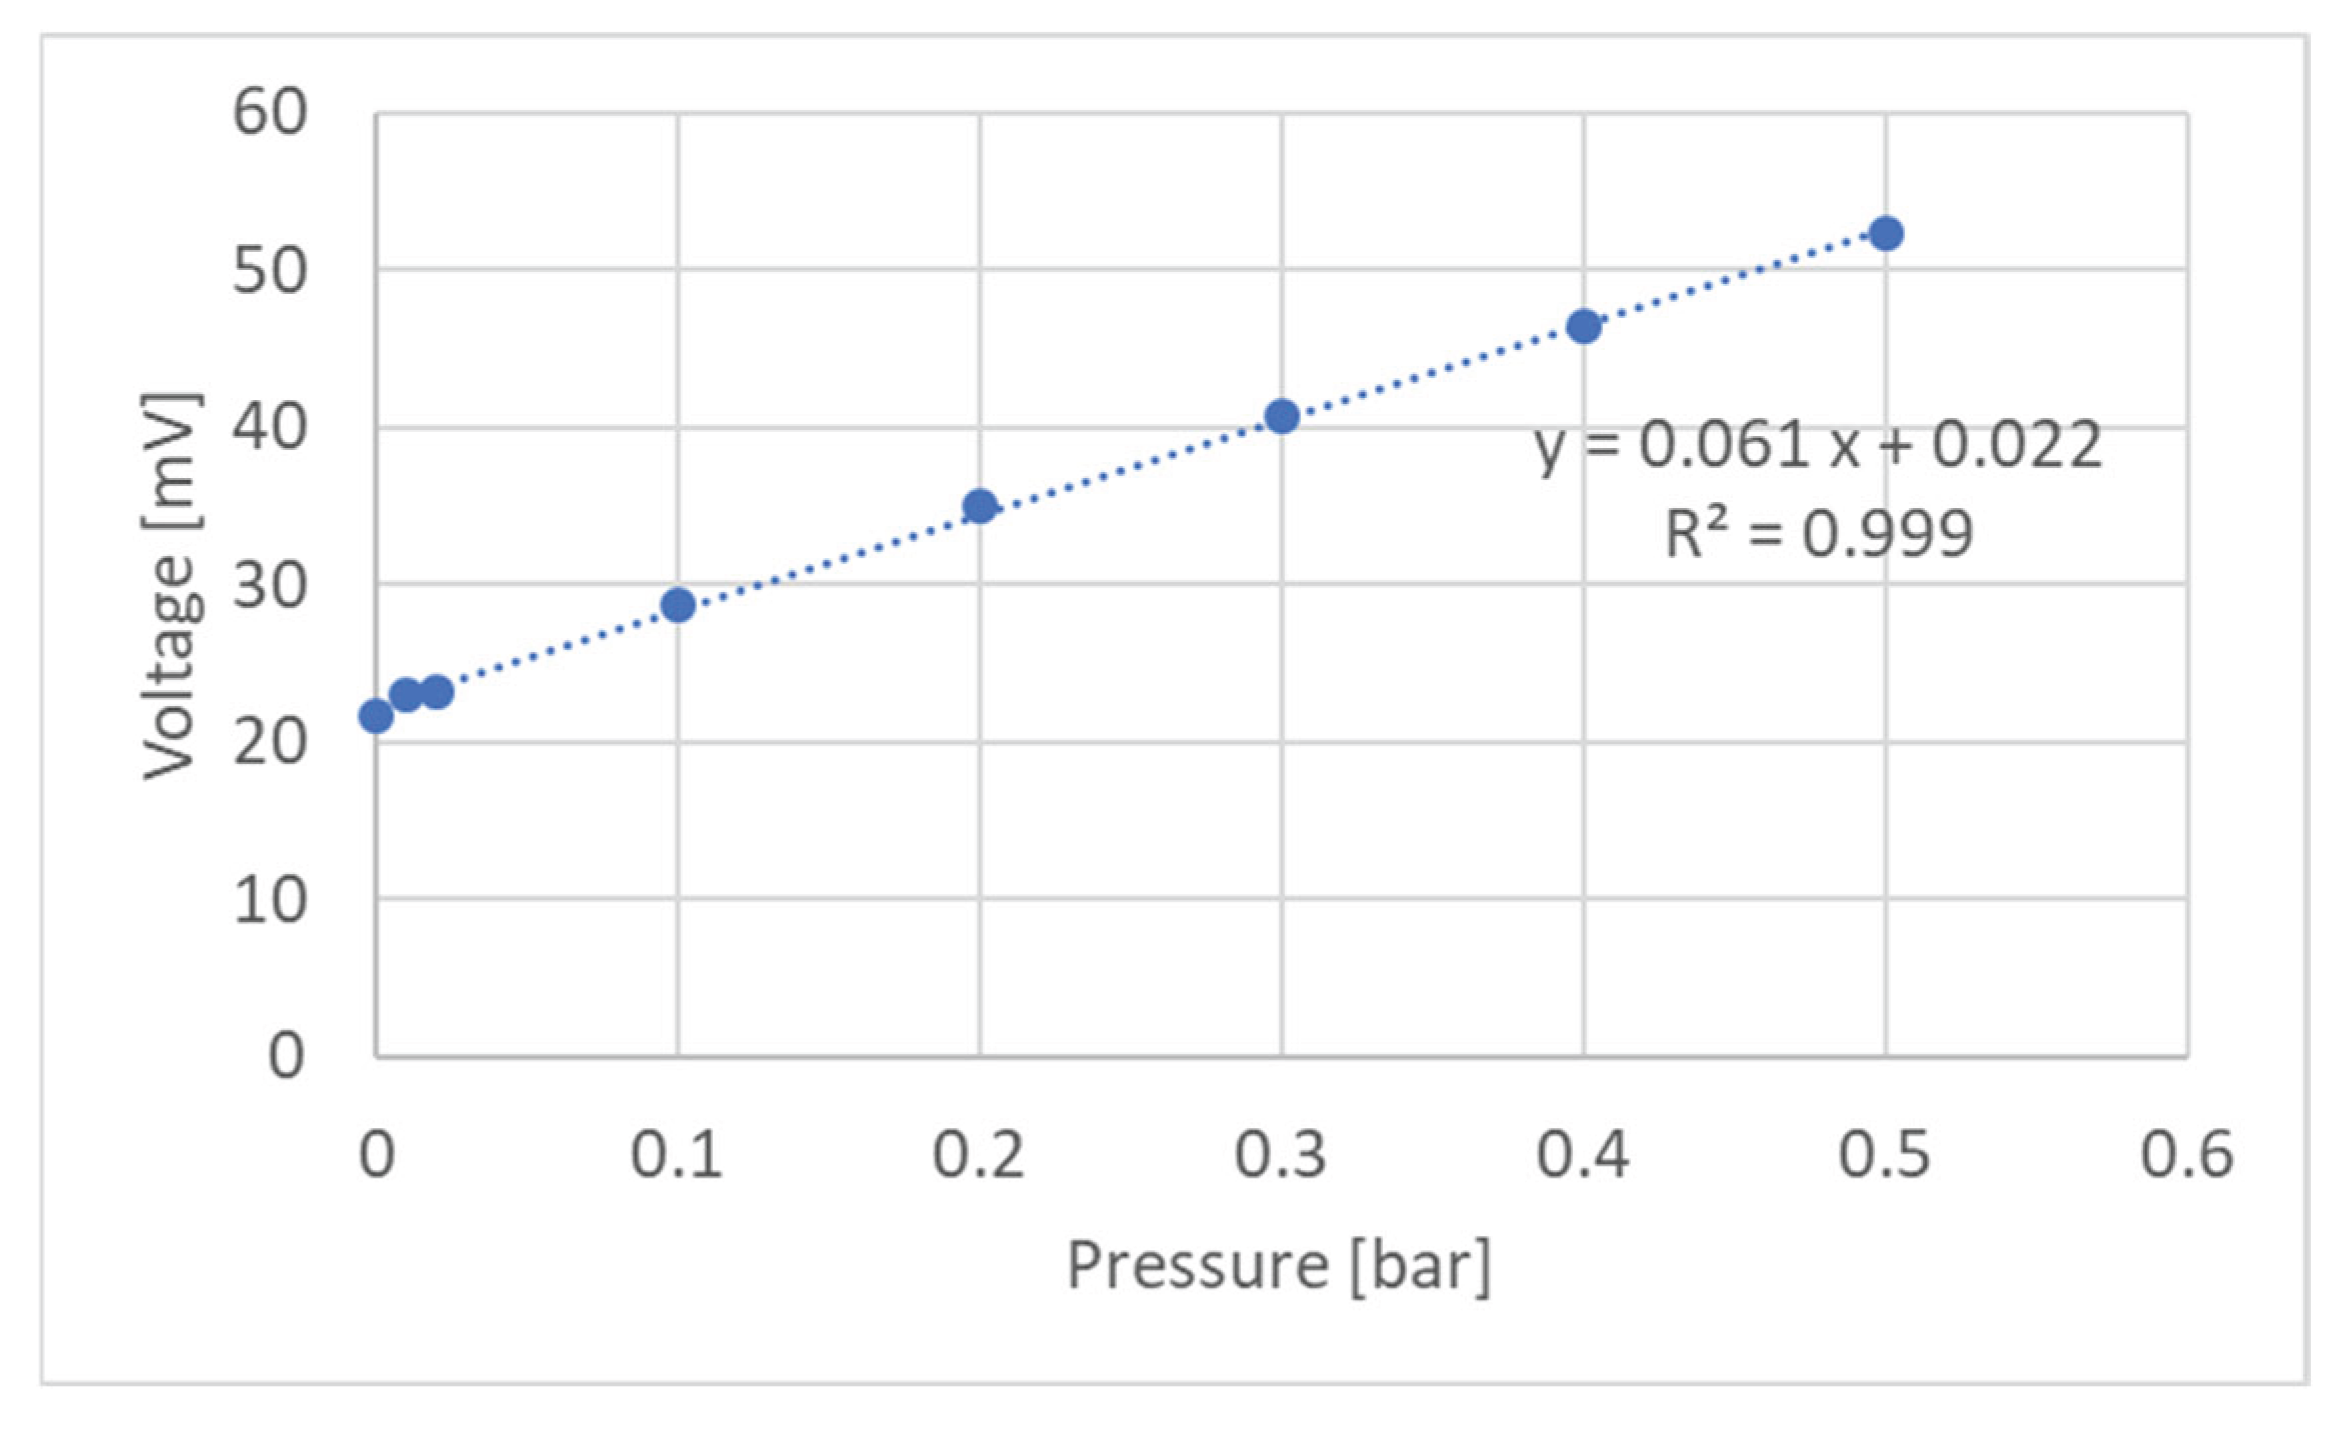
Figure 7.
Pressure measurements at the positions Pos1, Pos2, Pos2, in three different flow conditions: 3.3 m3/h, 4.8 m3/h, 6.0 m3/h, and in two different environmental conditions: atmospheric pressure of 884 mbar and temperature of 27.0°C (a); atmospheric pressure of 889 mbar and temperature of 25.5°C (b).
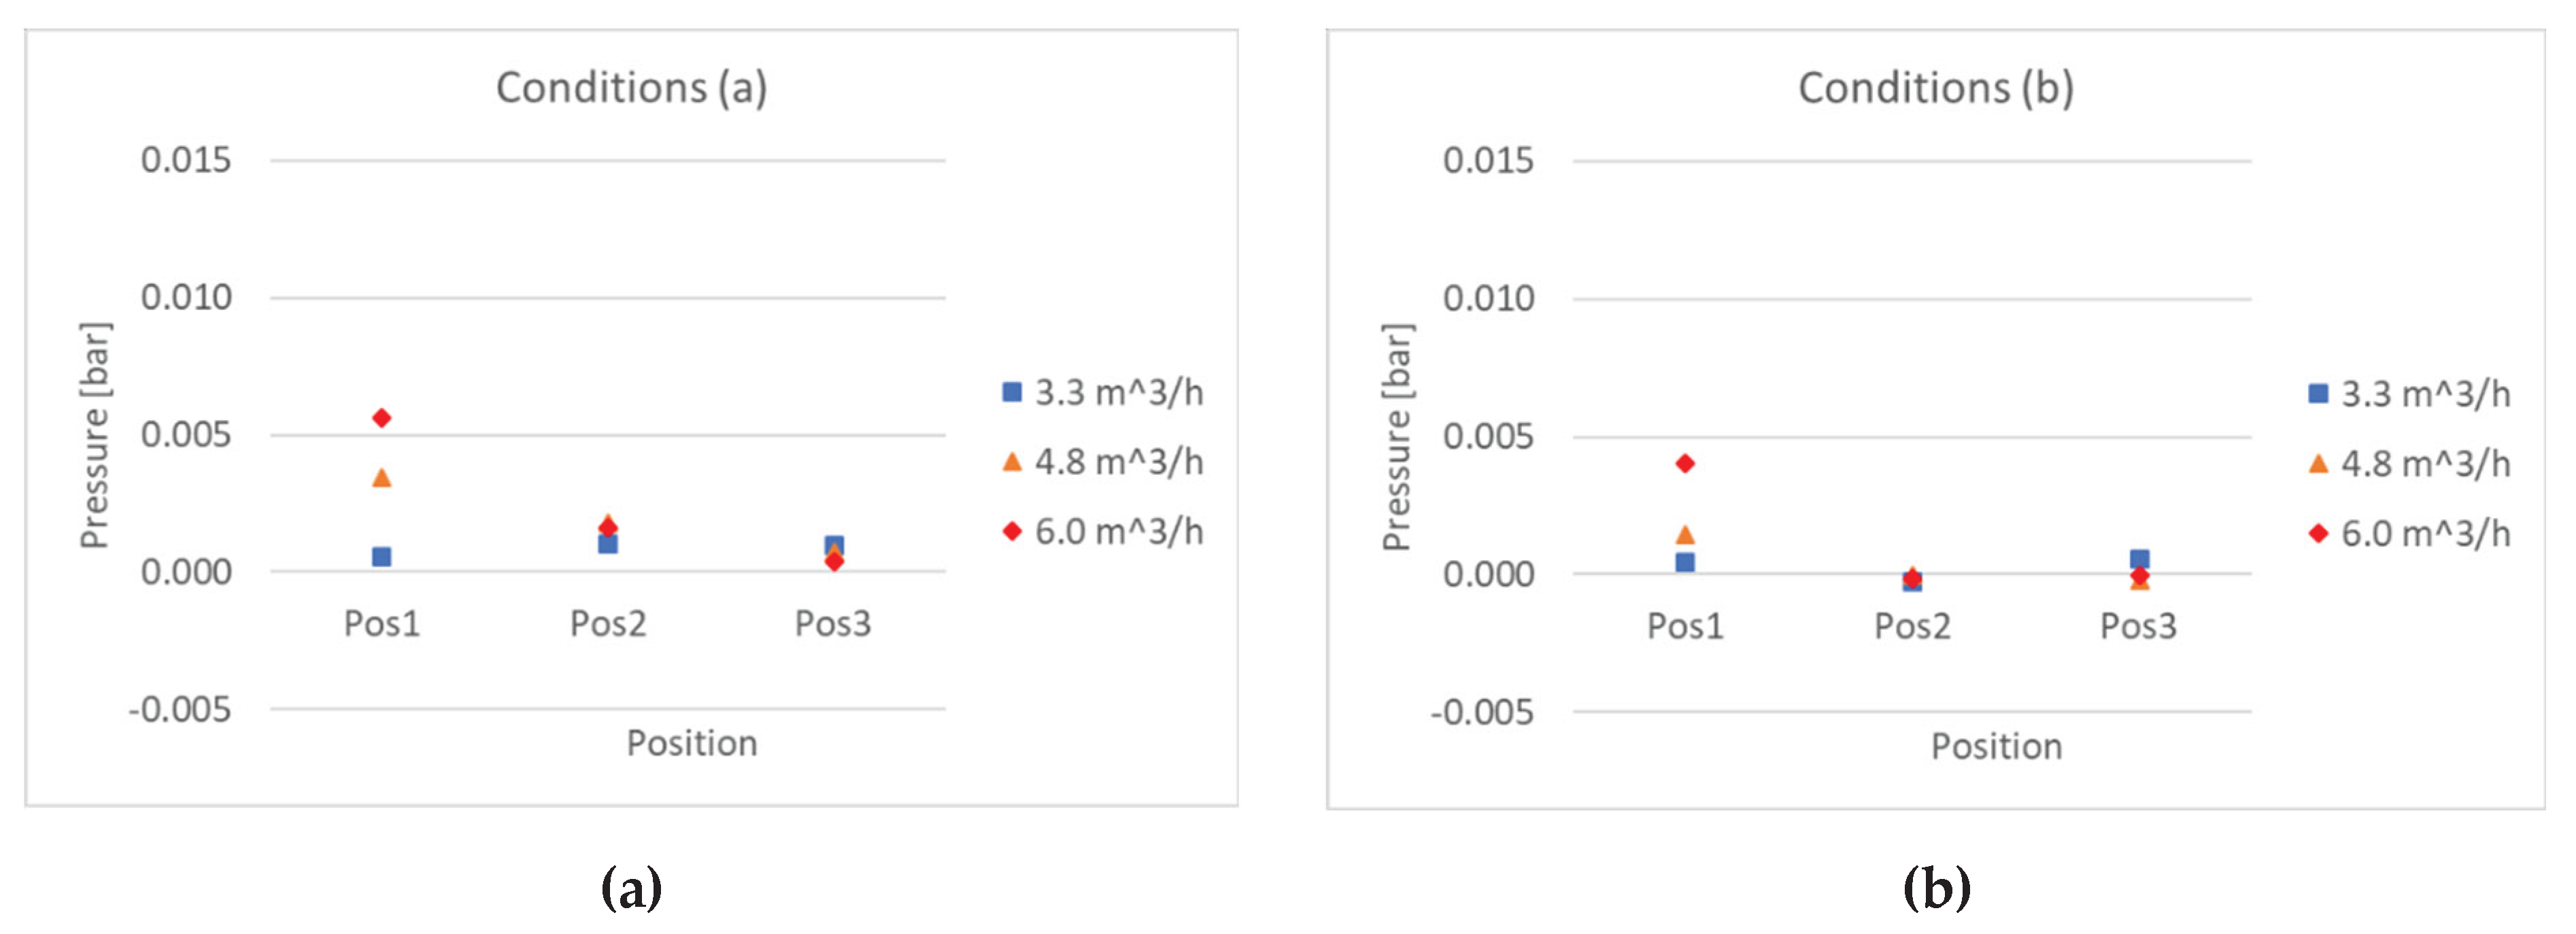
Figure 8.
Practical life cycle of tokens: (1) Distributor to final consumer - (2) Prosumer to consumer.
Figure 8.
Practical life cycle of tokens: (1) Distributor to final consumer - (2) Prosumer to consumer.
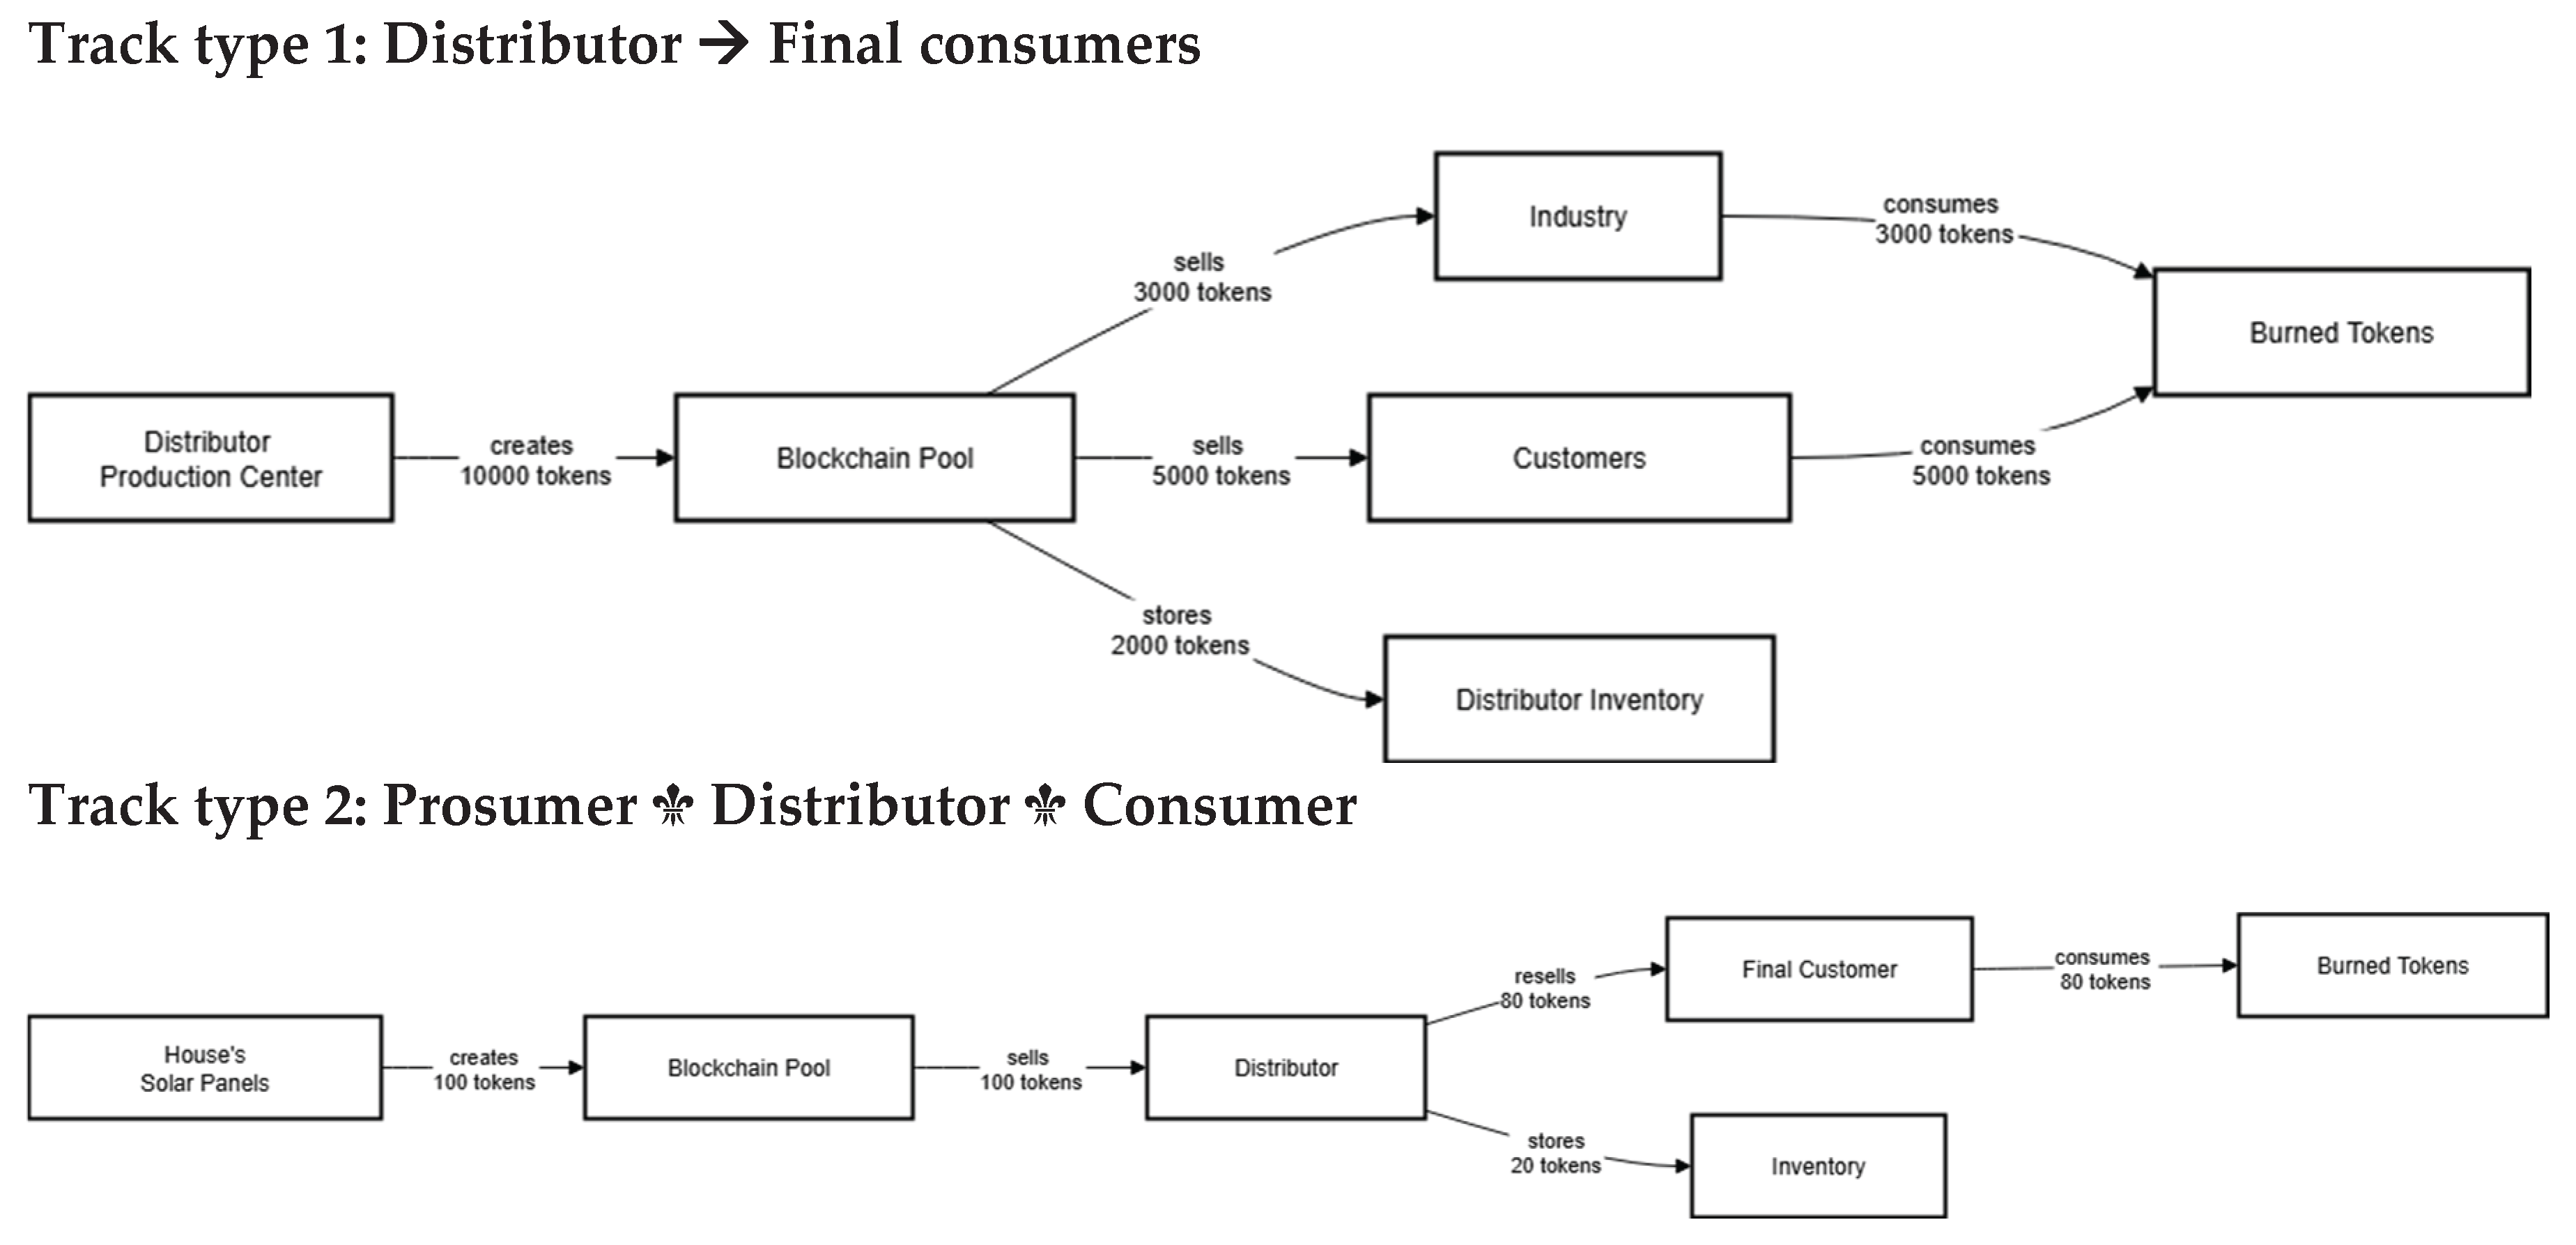
Figure 9.
Sketch of the infrastructure used for simulation.
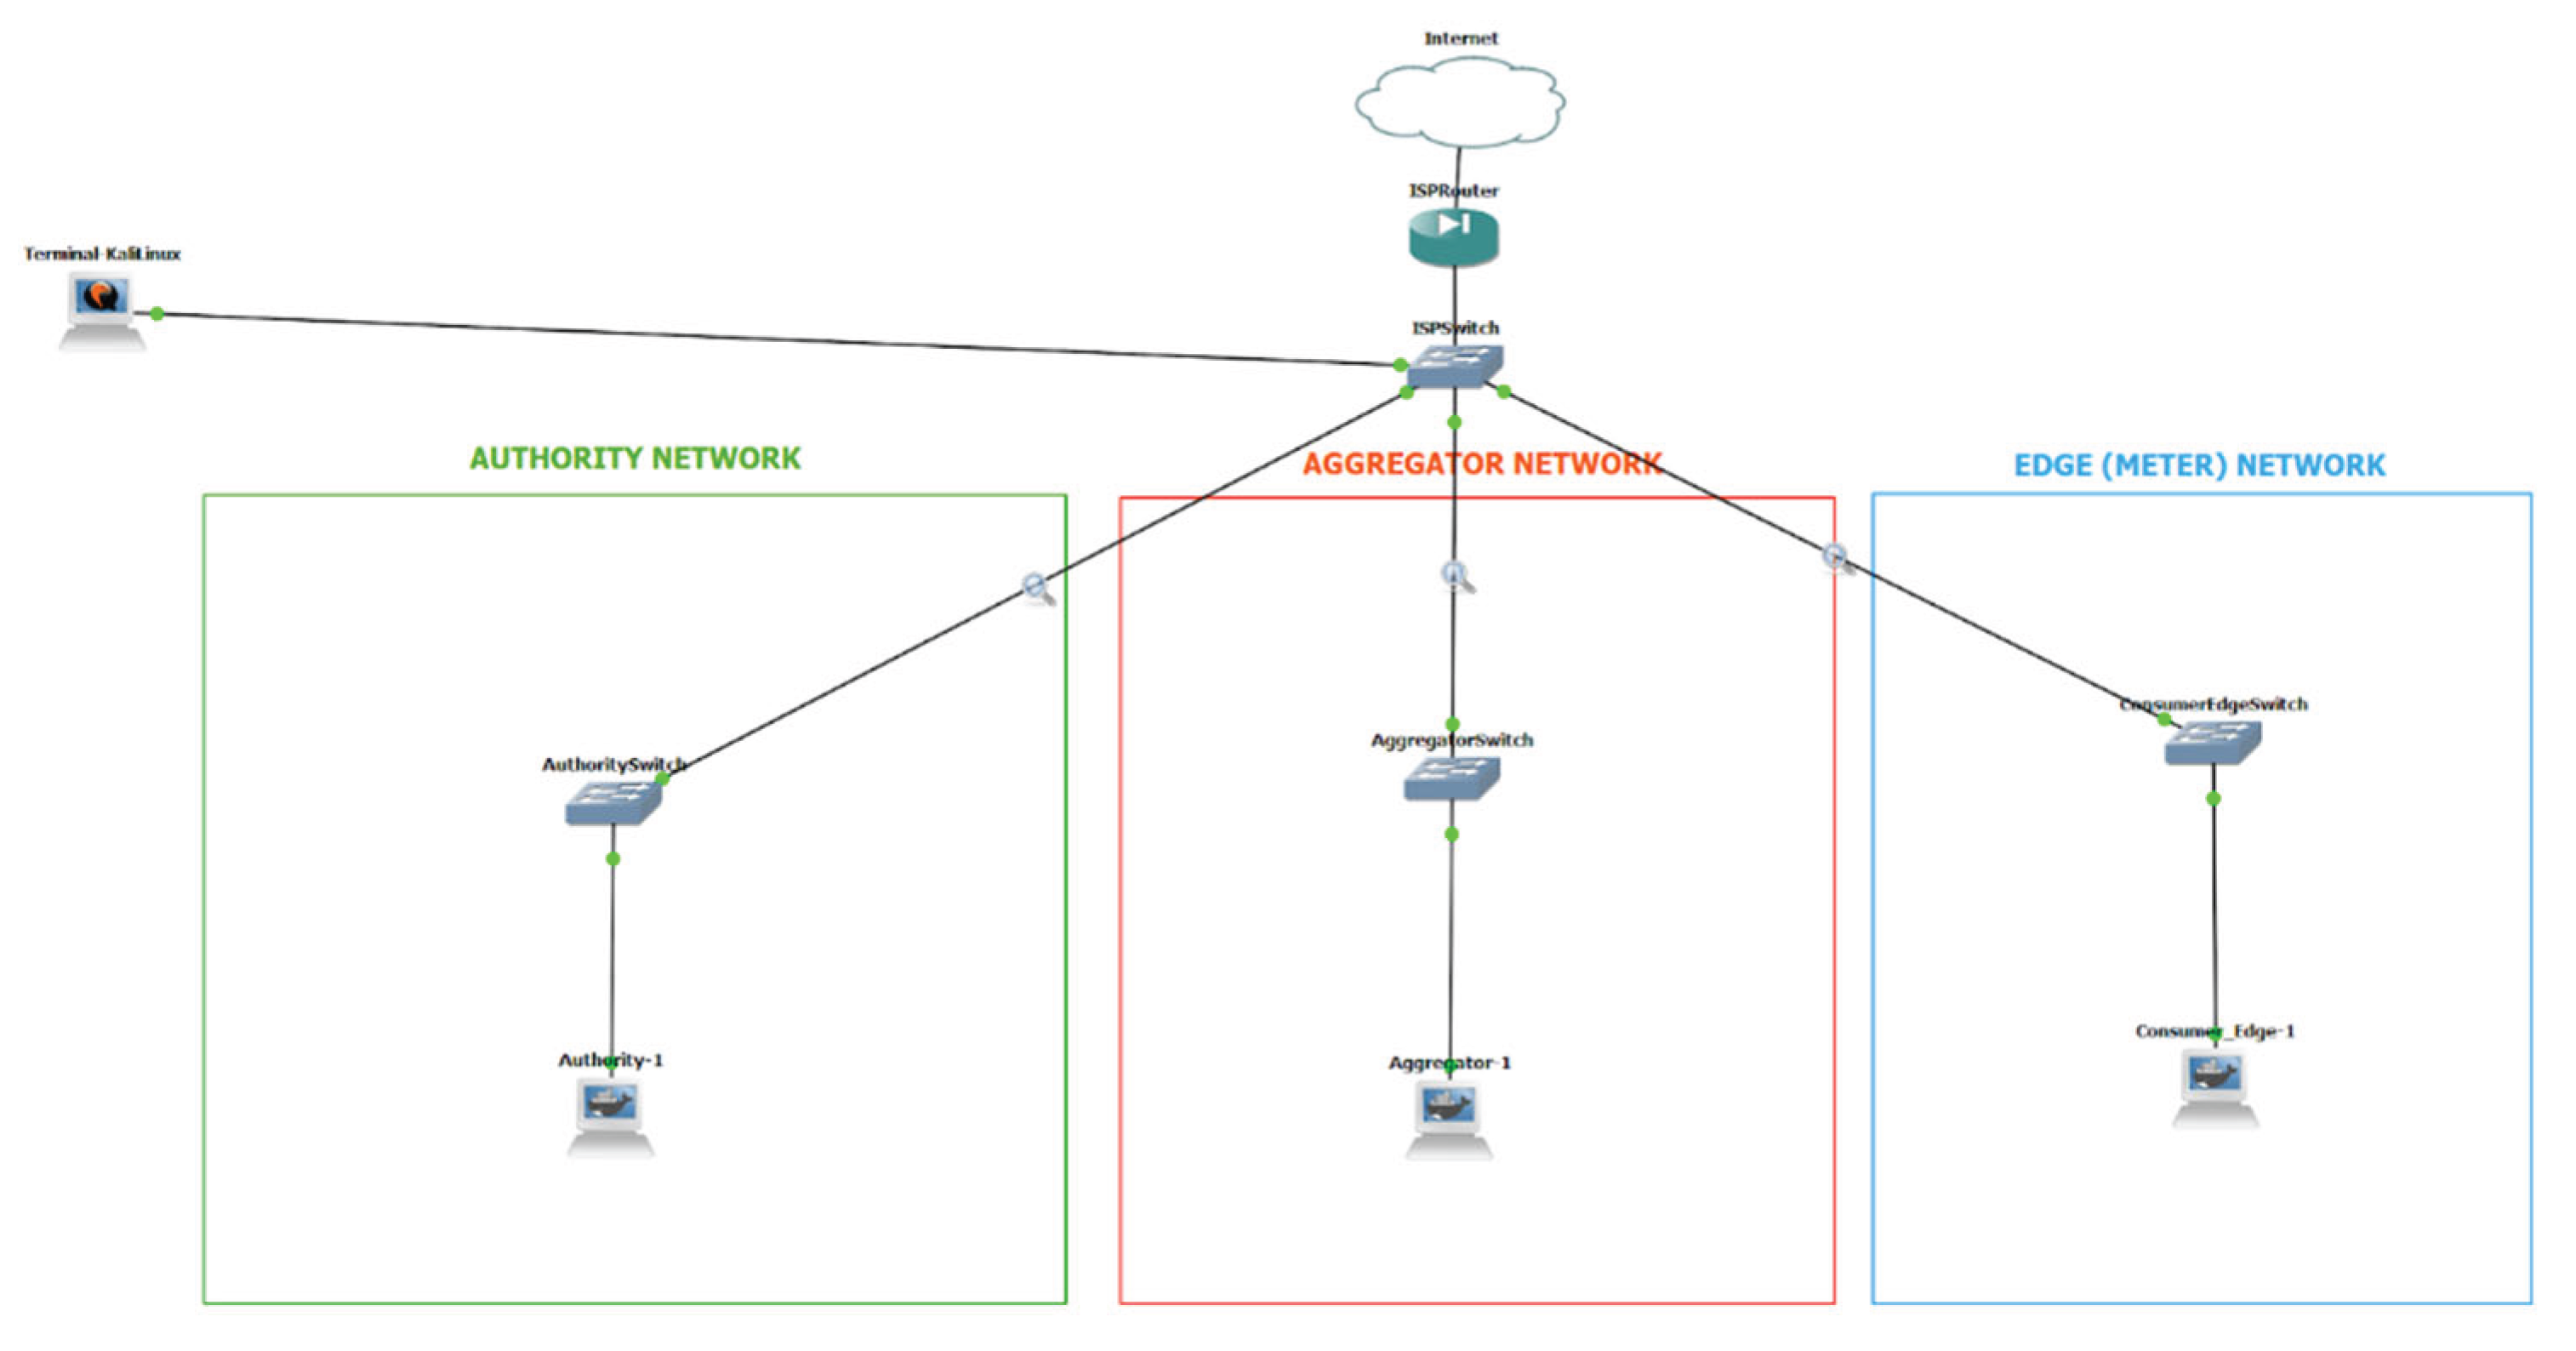
Table 2.
Bidirectional energy-token market.
| Step N# | Action | Description |
|---|---|---|
| STEP 1 | Token generation | All authorized actors (distributor, prosumer domestic user) assess energy production and require the token creation |
| STEP 2 | Validation and registration | A consensus is issued as the validation by the network, registering the relevant tokens in the ledger |
| STEP 3 | Trading/allocation | Tokens are exchanged between actors or allocated as a direct consumption |
| STEP 4 | Consumption and extinction | The final users “fire” token after their use |
Table 3.
Scenario 1 – Main Distributor
| N# | Role | Action |
|---|---|---|
| 1 | Distributor (photovoltaic plant) | Deposits 10,000 tokens |
| 2 | Industrial User | Buys 3,000 tokens from the Distributor |
| 3 | Domestic customer | Buy 5,000 tokens from Distributor |
| 4 | Distributor | Keeps 2,000 tokens in the ledger |
Table 4.
Scenario 2 – Domestic Prosumer
| N# | Role | Action |
|---|---|---|
| 1 | Domestic producer “DP” (with some solar panels) |
Deposits 100 tokens |
| 2 | Distributor | Buys 100 from “DP” |
| 3 | A group of consumers | Buys 80 tokens from Distributor as a unique consumer |
| 4 | Distributor | Keeps 20 tokens in the ledger |
Table 5.
Example of the validation process.
| N# | Role | Action |
|---|---|---|
| 1 | Edge Node | Sends transaction to an Aggregator |
| 2 | Aggregator | Pre-validates and aggregates in batch |
| 3 | Aggregator | Sends batch to 3+ nodes Authority |
| 4 | Authority 1/5 | Validates independently the batch given its outcome |
| 5 | Authority 2/5 | Validates independently the batch given its outcome |
| 6 | Authority 4/5 | Validates independently the batch given its outcome |
| 7 | Authority | If 67%+ Authority outcome is positive, creates and shares the batch |
| 8 | All nodes | Update their local site |
Disclaimer/Publisher’s Note: The statements, opinions and data contained in all publications are solely those of the individual author(s) and contributor(s) and not of MDPI and/or the editor(s). MDPI and/or the editor(s) disclaim responsibility for any injury to people or property resulting from any ideas, methods, instructions or products referred to in the content. |
© 2025 by the authors. Licensee MDPI, Basel, Switzerland. This article is an open access article distributed under the terms and conditions of the Creative Commons Attribution (CC BY) license (http://creativecommons.org/licenses/by/4.0/).
Copyright: This open access article is published under a Creative Commons CC BY 4.0 license, which permit the free download, distribution, and reuse, provided that the author and preprint are cited in any reuse.


