Submitted:
01 October 2025
Posted:
02 October 2025
You are already at the latest version
Abstract
Candling is a standard method for assessing egg fertility and embryonic development in poultry. Fertilisation success can be influenced by several factors, including semen quality. Poor semen parameters may necessitate more frequent inseminations or the removal of males with consistently low fertility.
This study evaluated turkey ejaculates (n=37) with good fertility (GF) and impaired fertility (IF). The analyses included sperm motility, plasma membrane integrity (PMI), mitochondrial membrane potential (MMP), and nitric oxide (NO) production, as well as enzymatic and biochemical assays of semen, such as superoxide dismutase (SOD), glutathione peroxidase (GPx), catalase (CAT) activities, glutathione (GSH) content, malondialdehyde (MDA) levels, and zinc (Zn²⁺) concentration. In parallel, the proteomes of seminal plasma and spermatozoa were separated using SDS- and Tricine-PAGE, and selected proteins were identified by nano LC-MS/MS.
The findings suggest that IF ejaculates exhibit insufficient extracellular antioxidant capacity to neutralise reactive oxygen species (ROS). Elevated antioxidant enzyme activity, reduced GSH levels, and increased MDA concentrations indicate the presence of oxidative stress in spermatozoa. A proteomic analysis revealed differences in fertility-associated proteins: PRDX6 was detected exclusively in GF semen, whereas ENO1, FABP7, GOT1, and LDHB were unique to IF semen.
Overall, the results demonstrate that both semen parameters and proteomic composition may contribute to fertilisation outcomes in turkeys.
Keywords:
turkey
; egg candling
; fertility
; antioxidants
; oxidative stress
; proteome composition
1. Introduction
Reproduction in turkeys is affected by factors related to egg fertility and hatchability. These two main parameters are influenced by genetic and environmental factors [1]. During production, farms aim to maximise the number of fertilised hatching eggs. Artificial insemination enhances the likelihood of achieving high fertilisation rates [2]. The fertility rate of turkey eggs ranges from 87% to 92% of live embryos, depending on the production stage. The new standard for hatchability in Hybrid turkeys is 86.8%, which determines the number of hatchlings offered for sale. Fertility at candling is approximately 92.9% [3]. Lower hatchability typically occurs in flocks with increased embryo mortality and reduced fertility. Egg fertilisation in the parent flock is estimated based on egg candling results. Candling is usually performed on around the tenth day of incubation, but it can be done as early as on the fourth or fifth day. Candling of eggs at 8-10 days of incubation is generally straightforward. Eggs without visible embryos (alive or dead) are classified as unfertilised (clear). Infertile eggs are rarely noted in turkeys but may reach 10% at the beginning and end of the laying season [4]. A decrease below the acceptable threshold results in significant economic losses and necessitates investigation into the cause. In poultry breeding practice, the key indicator of semen quality is the egg fertilisation index, which measures the proportion of eggs containing a viable embryo. It is calculated by dividing the number of fertile eggs by the total number of eggs laid or set, and multiplying the result by 100 [5]. The quality of avian ejaculates is assessed based on laboratory parameters such as semen volume, sperm concentration, and the percentages of live and normal gametes [6]. In turkeys, high-quality ejaculates have an adequate density and appear white. Semen with more than 80% motile sperm is generally regarded as being of excellent quality. Factors influencing turkey semen quality include light, humidity, nutrition, temperature, housing conditions, frequency of semen collection, the bird’s physiological state, age, sexual arousal during collection, and the collection technique itself. For artificial insemination to be effective, turkeys must produce semen of satisfactory quality [7]. Semen quality is a vital parameter that affects the breeding value of males, fertilisation rates, and reproductive success of offspring [8]. The importance of semen evaluation for selecting males or monitoring reproductive performance is well recognised in poultry breeding [9]. Lower fertilisation rates in turkey eggs (Meleagris gallopavo) may result from inferior ejaculate quality, which is usually associated with reduced biological and biochemical parameters, often with a specific proteome composition. This study aimed to analyse differences in the biological, biochemical, and protein profiles of ejaculates from turkeys with good fertility (GF) and impaired fertility (IF).
2. Results
2.1. Parameters of Sperm Functionality
Statistically significant and highly significant differences were noted in selected quality parameters of spermatozoa from GF and IF turkey ejaculates (Table 1). Sperm concentration was higher (p ≤ 0.001), but total motility was lower (p ≤ 0.001) in IF ejaculates. However, no differences in the progressive motility (PMOT) of spermatozoa were observed. The straight-line rectilinear velocity (VSL) and straightness (STR) were greater (p ≤ 0.001) in IF ejaculates, whereas VCL was higher (p ≤ 0.05) in GF ejaculates. Other sperm motility indices, including the average path velocity (VAP), the amplitude of lateral head displacement (ALH), and beat-cross frequency (BCF), did not differ significantly between the analysed groups. The IF group was characterised by lower (p ≤ 0.001) sperm plasma membrane integrity (PMI) and a higher (p ≤ 0.05) percentage of nitric oxide (NO)-generating sperm. No significant differences in sperm mitochondrial membrane potential (MMP) were observed between the examined groups (Table 1).
2.2. Antioxidant Status of Turkey Semen
The study revealed significant differences in the antioxidant status of seminal plasma from GF and IF ejaculates. In the seminal plasma of GF ejaculates, superoxide dismutase (SOD) and glutathione peroxidase (GPx) activities were higher (p ≤ 0.001), whereas catalase (CAT) activity was lower (p ≤ 0.05). In addition, glutathione (GSH) levels and malondialdehyde (MDA) content were reduced (p ≤ 0.05) in seminal plasma from GF ejaculates. Furthermore, zinc (Zn2+) levels were higher in seminal plasma from GF ejaculates (p ≤ 0.001) compared to IF ejaculates (Table 2).
Superoxide dismutase activity was enhanced (p ≤ 0.001), whereas GPx activity was reduced (p ≤ 0.001) in spermatozoa from IF ejaculates. In turn, higher CAT activity (p ≤ 0.05) was observed in GF ejaculates. Notably, spermatozoa from IF ejaculates exhibited lower GSH levels and higher MDA levels (p ≤ 0.001). Zinc content showed the opposite trend and was higher in spermatozoa from IF ejaculates (p ≤ 0.05) (Table 3).
2.3. Differences in the Proteomic Profiles of Seminal Plasma and Spermatozoa from Ejaculates with Good and Impaired Fertility
In the SDS-PAGE analysis, approximately 25 proteins, including three most abundant ones with prominent bands at 26, 25, and 18 kDa, were identified in the seminal plasma of GF semen (Figure 1A). In turn, polypeptides with prominent bands at 80, 49, 41, and 29 kDa were detected in the seminal plasma of IF ejaculates (Figure 1B). A three-layer gel with the addition of tricine supported the separation of protein fractions with a molecular weight below 70 kDa. Four polypeptide bands at around 26, 25, 18, and 16 kDa were observed in the seminal plasma from GF sperm (Figure 2A). Two prominent bands at 107 and 12 kDa were additionally identified in the seminal plasma of IF ejaculates (Figure 2B).
In spermatozoa, the separations were less accurate, and the isolated fractions were less defined. The amount of protein separated in the gels was significantly lower, producing poorer profiles with a maximum of 15 bands (Figure 3 and Figure 4). However, a 25-kDa polypeptide was identified in spermatozoa from GF turkey ejaculates (Figure 3A). At the same time, 107, 49, 41 and 29 kDa proteins were detected in IF ejaculates (Figure 3B). The Tricine-PAGE analysis revealed an 18-kDa protein in high-quality spermatozoa (Figure 4A) and four prominent protein bands at 52, 49, 16, and 12 kDa in low-quality semen (Figure 4B).
2.4. Protein Identification Results
Selected bands were excised based on differences in their optical density (OD) (Table 4 and Table 5).
A comprehensive list of the proteins identified in GF and IF semen is provided in Table 6, Table 7, Table 8 and Table 9. A total of 62 proteins were detected in seminal plasma associated with good fertility. Among these, ACT5, ACTB, ACTG1, ACTG2, AK1, CA2, CKMT2, CFAP20, FTH, HAGH, HPRT1, HSP70, PCMT1, PGAM1, PPIB, PRDX6, PSMB5, RAB10, RAB5B, RAB5C, RBP4, SDHB, SPATA18, TBA4, TBB1, TBB2, TBB3, TBB6, TBB7, TPI1, UQCRFS1, YWHAB, YWHAE, YWHAQ, and ZPBP1 were specifically identified in seminal plasma derived from GF ejaculates. In turn, a total of 65 proteins were identified in the seminal plasma of individuals with impaired fertility. The proteins encoded by the following genes: ACO1, ACTN4, ANPEP, ANXA2, ANXA5, ATP5F1B, B2M, BLMH, CYC, CYT, EEF1A, EEF2, EIF4A2, ENO1, ENO2, FABP7, FGB, GLG1, GOT1, HSP90B1, LAC, LAMB1, LAMP1, LDHA, LDHB, MDH1, NDK, NEGR1, NEL, NHERF1, PAFAH1B1, PSAP, PTPRG, RAB2A, SEC22B, SERPINI1, TBA5, and TGFB2 were identified in IF seminal plasma. The proteome shared by seminal plasma from GF and IF groups consisted of polypeptides encoded by the following genes: ACR, ALB, APOA1, ASTL, CCT8, CKB, CLU, COL12A1, GAPDH, GSN, HSP90AA1, HSPA8, LYZ, PLCZ1, QSOX1, RPS27A, SPARC, TBB4, TBB5, TF, TTR, TSN, TUBA1, UBB, VDAC2, YWHAG, and YWHAZ.
In turn, a total of 46 proteins were identified in GF spermatozoa. Some of these proteins were observed only in this type of sperm cells, including ACTG1, AK1, CA2, GST5, HSP70, HSP90AA1, NHERF1, PKM, PRDX6, QSOX1, RAB10, RAB5B, RAB5C, TBA5, TBB1, TPI1, TUBA1, UQCRFS1, and YWHAZ. In contrast, spermatozoa from IF ejaculates contained a total of 47 proteins, including ACTB, ACTG2, ANPEP, ATG4B, ATP13A4, CALM, CFAP20, EEHC2, ENO1, FABP7, FN1, GOT1, GOT2, GSN, HSPD1, LAC, LDHB, NEL, PGK, PPP1CB, and SDHB. The proteome shared by spermatozoa from GF and IF ejaculates included polypeptides encoded by the following genes: ACR, ATP5B, ALB, APOA1, ASTL, ATP5B, CKB, CKMT2, CLU, COL12A1, GAPDH, HSPA8, ODF2, PGAM1, RPS27A, SPATA18, TBA2, TBA4, TBB2, TBB3, TBB4, TBB5, TBB7, TF, UBB, and VDAC2.
The proteome (the complete set of individual proteins) shared between different components of GF and IF ejaculates is shown in Figure 5. Seminal plasma and spermatozoa from the GF group shared proteins encoded by ACR, ACT5, ACTG1, AK1, ALB, APOA1, ASTL, CA2, CKB, CKMT2, CLU, COL12A1, GAPDH, HAGH, HPRT1, HSP70, HSPA8, HSP90AA1, PCMT1, PGAM1, PRDX6, QSOX1, RAB10, RAB5B, RAB5C, RPS27A, SPATA18, TSN, TBA2, TBA4, TBB1, TBB2, TBB3, TBB4, TBB5, TBB6, TBB7, TF, TPI1, TUBA1, UBB, UQCRFS1, VDAC2 and YWHAZ. In turn, seminal plasma and spermatozoa from the IF group shared proteins encoded by ACR, ALB, ANPEP, APOA1, ASTL, CKB, CLU, COL12A1, ENO1, FABP7, GAPDH, GSN, GOT1, HSPA8, LAC, LDHB, NEL, RPS27A, TBB4, TBB5, TF, UBB, and VDAC2. Interestingly, the proteins identified in seminal plasma from GF ejaculates were present in IF sperm, whereas the proteins detected in IF plasma were found in GF sperm. Numerous proteins were shared between GF plasma and IF sperm, including ACR, ACT5, ACTB, ACTG2, ALB, APOA1, ASTL, CKB, CKMT2, CFAP20, CLU, COL12A1, GAPDH, GSN, HSPA8, HSP70, PGAM1, RPS27A, SDHB, SPATA18, TBA4, TBB2, TBB3, TBB4, TBB5, TBB7, TF, UBB, and VDAC2. In turn, the proteins shared between IF plasma and GF sperm included ACR, ALB, APOA1, ASTL, CKB, CLU, COL12A1, GAPDH, HSP90AA1, HSPA8, NHERF1, QSOX1, RPS27A, TBA5, TBB4, TBB5, TF, TUBA1, UBB, VDAC2, and YWHAZ. Therefore, the following proteins were shared between GF plasma, IF plasma, GF sperm, and IF sperm: ACR, ALB, APOA1, ASTL, CKB, CLU, COL12A1, GAPDH, HSPA8, RPS27A, TBB4, TBB5, TF, UBB, and VDAC2.
Some proteins were identified only in specific components of semen from the examined quality groups. For instance, FTH and HAGH were detected in several bands in seminal plasma from the GF group, whereas B2M was present in seminal plasma from the IF group. No proteins were consistently detected in GF sperm, whereas EFHC2 and GOT2 were identified in IF sperm. Furthermore, some proteins were identified in seminal plasma and spermatozoa from one group only. For example, PRDX6 was detected only in GF semen, whereas ENO1, FABP7, GOT1, and LDHB were present only in IF semen.
2.5. Gene Ontology Results
The gene ontology (GO) analysis revealed that the proteomes of seminal plasma and spermatozoa were very similar (Figure 6) and differed mainly in the content of individual protein fractions responsible for specific GO processes. Seminal plasma from both quality groups differed the presence or absence of a protein associated with growth (GO: 0040007), which was detected in seminal plasma from IF ejaculates. The GO analysis revealed that seminal plasma was predominantly composed of proteins associated with cellular and multicellular processes, metabolism, localisation, immunity, reproduction, and regulation (Figure 6). The list of seminal plasma proteins involved in various biological processes is presented in Table 4. The Molecular Function analysis of the proteins identified in GF seminal plasma demonstrated that most of them were involved in creatine kinase and phosphopyruvate hydratase activity and served as structural components of selected biomolecules. These proteins were also involved in binding various substances, in particular nucleotides and ions (Table 10). The proteins present in IF seminal plasma were generally involved in creatine kinase and phosphopyruvate hydratase activity, L-lactate dehydrogenase activity, and binding of unfolded proteins and anions (Table 11).
The proteins identified in the GO analysis of sperm proteomes were mainly involved in the same biological processes as seminal plasma proteins, but none were associated with reproductive functions. The analysis also showed a higher percentage of polypeptides involved in localisation and metabolic processes (Figure 6). In the Molecular Function analysis, some of these proteins had anion and ion binding capabilities. The proteins detected in GF sperm were involved in the same processes as those identified in GF seminal plasma (Table 12). In contrast, most proteins identified in IF sperm were unique to this quality group. In IF ejaculates, the proteins detected in seminal plasma and spermatozoa differed mainly in enzymatic activity (dehydrogenases in plasma and aminotransferases in sperm) and other protein functions with a high false discovery rate (FDR), such as binding of unfolded proteins in seminal plasma and serving as structural components of the cytoskeleton in spermatozoa (Table 13).
A complete list of proteins identified in seminal plasma and spermatozoa from GF and IF ejaculates and involved in various biological processes (GO) is provided in the Supplementary Materials (Tables S1 and S2).
3. Discussion
The main goal of turkey (Meleagris gallopavo) breeding is to increase the production of high-quality hatching eggs, thereby raising the number of poults obtained. Hatchability depends on the quality and fertility of eggs supplied by the breeder farm and the incubation environment at the hatchery; therefore, fertility and hatchability are essential to any hatchery operation. Factors affecting hatchability include stress, bird health, nutrition, age of the flock, egg size, weight, and quality, as well as storage time and conditions [1]. In commercial turkey hatcheries, quality control typically involves egg candling at around eight days of incubation (DOI) to assess fertility. Fertility is measured as the percentage of eggs with normally developing embryos, while eggs showing no signs of development are classified as “clear eggs” [10]. Accurate data support comparisons of hatchery performance and help identify hatchability issues by revealing abnormal patterns. Biochemical and biological analyses of turkey semen are essential for understanding poultry reproduction.
3.1. Potential Impact of Oxidative Stress on Low-Quality Semen
High accumulation of reactive oxygen species (ROS) in semen impacts sperm functionality and, consequently, the fertilising potential of the ejaculate. Increased ROS production and insufficient antioxidant defence mechanisms lead to a redox imbalance and intracellular oxidative stress. This process involves lipid peroxidation, loss of plasma membrane integrity, greater membrane permeability, reduced sperm motility, and structural damage to sperm DNA, which ultimately leads to sperm apoptosis [11,12]. Spermatozoa are particularly vulnerable to the harmful effects of ROS because their cell membranes contain high levels of unsaturated fatty acids. Thus, the balance between ROS generation and ROS scavenging affects plasma membrane integrity, sperm viability, and the fertilising capacity of spermatozoa [13].
The fertilising potential of spermatozoa is assessed based on sperm motility, concentration, viability, and morphology [9]. Sperm motility is a crucial parameter for evaluating semen quality, as it directly influences the gametes’ ability to traverse the female reproductive tract and fertilise an egg. Sperm viability and motility are assessed using methods such as fluorochrome staining and Computer-Assisted Sperm Analysis (CASA) [14]. In the present study, sperm viability parameters were compromised in the ejaculates of IF individuals. These ejaculates were characterised by lower total motility and PMI, and a higher percentage of NO-producing sperm. The above could point to a decline in gamete function and, possibly, intensified oxidative processes in semen. In poultry, sperm motility decreases in response to semen oxidation [15]. Higher sperm concentration in IF turkey ejaculates may have reduced motility by causing excessive accumulation of gametes per unit volume, impairing cell viability, and increasing oxidative stress in semen. Superoxide dismutase, CAT, and GPx constitute the primary antioxidant system in semen. These metalloenzymes are found in both intracellular and extracellular spaces [16]. In seminal plasma, the highest SOD activity was observed in turkeys and male guinea fowl, while the lowest activity was recorded in ducks. Additionally, research has shown that turkey spermatozoa exhibit lower SOD activity than cockerel spermatozoa [17]. In seminal plasma, total GPx activity (both selenium-dependent and selenium-independent) was highest in turkeys and lowest in ducks and ganders [18]. Catalase activity was lower in spermatozoa from fresh cockerel semen than gander semen, whereas gander seminal plasma showed higher CAT activity compared to cock seminal plasma [13]. Higher (p ≤ 0.05) SOD and GPx activities were observed in the seminal plasma and spermatozoa of GF ejaculates, which may suggest that spermatozoa received additional antioxidant protection from the external environment. At the same time, CAT was prevalent in IF ejaculates. Research has confirmed that SOD offers protection against heat stress, refrigeration, induced toxic agents, and other conditions associated with oxidative stress in poultry production [19]. Thus, higher SOD activity in the seminal plasma of fertile turkeys may indicate better antioxidant protection within the system. It can be assumed that higher Zn2+ levels in seminal plasma from GF ejaculates enhanced SOD activity, as this trace element is a cofactor of copper/zinc superoxide dismutase (Cu/Zn SOD) [20]. Thus, low Zn2+ levels in the seminal plasma of IF turkeys could decrease extracellular Cu/Zn-specific SOD activity, thereby increasing ROS generation. In another study, GPx activity remained relatively constant during prolonged exposure to stress [21]. However, the present work indicates that GPx activity varies and can be influenced by the action of other enzymes. Some studies have shown a correlation between H2O2 and male infertility, as exposure to hydrogen peroxide was found to compromise both DNA integrity and plasma membrane stability in human spermatozoa [22]. In the current study, higher CAT activity in IF ejaculates could suggest that this enzyme compensates for a deficiency in GPx activity. Furthermore, it has been suggested that elevated CAT activity in semen may partially restore male fertility [23]. Crisol et al. [24] proposed that seminal plasma GPx is associated with semen quality since its activity is positively correlated with sperm concentration, motility, and morphology, and negatively with abnormal sperm. Therefore, the present findings may indicate that sperm cells from GF ejaculates receive better antioxidant protection from external sources, which increases their viability. Interestingly, a somewhat different relationship between antioxidant enzyme activities was noted in spermatozoa derived from GF and IF ejaculates. In mitochondria, SOD serves as the primary enzyme catalysing the removal of anions, and it cannot be substituted by other antioxidant enzymes [19]. Superoxide dismutase activity was higher in spermatozoa from IF ejaculates than in the extracellular environment, which could indicate that more superoxide anion radicals are generated inside cells and that SOD acts as a primary antioxidant enzyme. This assumption may be supported by the significantly higher Zn2+ content of spermatozoa from IF ejaculates, which enhanced the bioavailability of this microelement. Conversely, lower GPx and CAT activities in IF sperm cells may result in insufficient defence of spermatozoa integrity and functionality. The activity of SOD leads to the formation of hydrogen peroxide (H2O2), which impairs sperm motility by inducing lipid peroxidation in membranes rich in polyunsaturated fatty acids (PUFAs), generating lipid aldehydes that damage mitochondrial proteins essential for adenosine triphosphate (ATP) production, ultimately leading to motility loss and cell death. H2O2 also disrupts sperm membrane integrity [25], impairing membrane transport and signal transduction necessary for capacitation. Therefore, lower GPx and CAT activities could have contributed to the accumulation of hydrogen peroxide and, consequently, impaired sperm viability in IF ejaculates. The authors’ previous study revealed the presence of GSH in turkey semen [26]. The current study confirmed that GSH was present in both components of the ejaculate. Furthermore, GSH content differed significantly between GF and IF semen. The difference in GSH content between seminal plasma (higher) and spermatozoa (lower) in IF ejaculates is difficult to explain. Some authors observed a positive correlation between the GSH content of seminal plasma and an improvement in sperm parameters [27]. In turn, other researchers reported higher GSH concentrations in azoospermic individuals than in oligozoospermic and normozoospermic males [28]. As demonstrated by Atig et al. [27], while asthenozoospermic men had lower seminal levels of reduced GSH (GSHr), the content of seminal GSHr was elevated and glutathione disulfide (GSSG) levels declined significantly in the oligoasthenoteratozoospermic (OAT) group relative to the controls. The increase in GSHr in the OAT group may be attributed to excessive ROS production by abnormal spermatozoa, leading to the up-regulation of thiol synthesis to protect sperm from oxidative damage. A similar process may have occurred in seminal plasma from IF ejaculates to better protect sperm against harmful factors, including oxidative stress. This assumption is consistent with previous reports on the lower GSH content of spermatozoa from infertile men [28,29]. In the authors’ previous study on preserved turkey semen [26], GSH content was higher in low-quality sperm cells than in high-quality cells. It appears that GSH levels could be higher in low-quality semen to protect sperm cells against heightened oxidative stress, and this observation was confirmed by the values of other analysed indices. Different results were obtained in fresh semen. It can be hypothesised that the lower GSH content of spermatozoa from IF ejaculates was compensated for by higher GSH levels in the seminal plasma, as the opposite trend was observed in GF semen. The proteome of GF semen contained HAGH and GST5 enzymes, which could suggest that GSH, a compound that protects sperm cells against free radicals, was utilised and transported more efficiently. In the present study, GSH compensation may have only just begun, whereas in the authors’ previous work, this process was likely already underway, as semen had been predefined as poor quality based on low sperm concentration and abnormal colour [26]. The variations in GSH content could also be attributed to differences in sperm concentrations between various turkey breeding lines, which affected calculation results. Despite the above, lower GSH levels in spermatozoa from IF ejaculates may reflect the need for enhanced antioxidant protection, as a higher percentage of NO-generating spermatozoa and elevated MDA levels were also observed. In general, excessive production of ROS, including H2O2, superoxide radicals (O2.-), NO, and lipid peroxidation products such as MDA or thiobarbituric acid reactive substances (TBARS), is associated with an increased risk of male infertility [30]. According to Bucak et al. [31], elevated MDA levels in semen are a major factor contributing to the deterioration of sperm quality, including reduced sperm motility. Malondialdehyde content was lower in GF ejaculates (p ≤ 0.05), which provides indirect evidence for the lower intensity of oxidative processes in semen and/or greater antioxidant capacity of the reproductive system.
3.2. Potential Impact of Proteome Composition on IF Semen
Several internal and external factors have been linked to increased oxidative stress in the male reproductive system. Numerous proteins in the ejaculate have been associated with male infertility or impaired fertility. These polypeptides may not only explain recurrent fertilisation failures, but may also serve as future diagnostic tools for enriching conventional semen analyses [32]. This study revealed differences in the proteomes of seminal plasma and spermatozoa derived from GF and IF ejaculates. The proteins identified in both seminal plasma and spermatozoa are particularly noteworthy as they may reflect different metabolic pathways in semen that contribute to or impair fertility. Some of these proteins may be indirectly responsible for excessive ROS production, whereas others contribute to ROS removal. According to O’Flaherty [33], peroxiredoxins (PRDXs), especially PRDX6, play a key role in safeguarding spermatozoa against oxidative stress by regulating ROS generation. By acting as both a peroxidase and a calcium-independent phospholipase A2, PRDX6 is crucial for maintaining sperm viability and motility. Peroxidase activity is essential for eliminating H2O2, other hydroperoxides, and peroxynitrite (ONOO−), while calcium-independent phospholipase A2 (iPLA2) repairs oxidatively damaged membranes [34]. Enzymes involved in energy production, as well as tubulin, the structural protein of the sperm flagellum, are susceptible to direct oxidation by ROS and modifications resulting from ROS-driven protein oxidation and lipid peroxidation. Spermatozoa lacking PRDX6 exhibit reduced viability and significantly lower motility compared to controls [35]. The impaired motility of Prdx6−/− sperm may result from oxidative inhibition of energy-generating enzymes and thiol oxidation of tubulin [36]. In mammals, this enzyme helps regulate ROS levels during the complex process of capacitation, thereby enabling the sperm to acquire fertilising capability [33]. Although capacitation is not required for successful fertilisation in birds, PRDX6 has been identified in chickens [37] and turkeys [38,39]. The presence of PRDX6 in several protein bands derived from seminal plasma and spermatozoa in GF turkey ejaculates may indicate higher antioxidant potential and an enhanced capacity to counteract the effects of ROS. In most animals, ferritin consists of two subunits: the ferritin heavy chain (FHC or FTH) and the ferritin light chain (FLC). These two subunits differ significantly in their amino acid sequences, with approximately 55% divergence between them [40]. Ferritin contains numerous polypeptide subunits and can store as many as 4,500 iron atoms within its hollow spherical structure. In chickens, ferritin consists solely of the FHC subunit, which exhibits ferrous oxidase activity comparable to that of mammalian FHC [41]. The ferrous oxidase activity of FHC can prevent Fe2+ from producing ROS through the Haber-Weiss and Fenton reactions. Knockdown of the FHC in K562 cells disrupts the formation of protein disulphide bonds, leading to protein misfolding and elevated intracellular ROS levels [42]. Orino et al. [43] reported that transfection-induced ferritin expression attenuated ROS formation in HeLa cells exposed to H2O2. However, ferritin overexpression did not completely prevent ROS generation. The presence of ferritin in GF turkey seminal plasma may help limit ROS accumulation. However, ferritin may constitute only one element of the broader antioxidant response in turkey semen, and its effectiveness may be limited. Glyoxalase 2, encoded by the hydroxyacylglutathione hydrolase (HAGH) gene, is a member of the metallo-β-lactamase family and is found in both the mitochondria and cytoplasm. Hydroxyacylglutathione hydrolase helps detoxify methylglyoxal (MG) and may contribute to cell survival under metabolic stress. Recent research has shown that HAGH also plays other roles, especially in oxidative stress responses. During oxidative stress, Glo2 activation is essential; however, during redox homeostasis, it may be silenced without jeopardising cell viability. Glo2 may either release or utilise GSH to induce S-glutathionylation of target proteins, which indicates that the enzyme’s regulatory role can be enhanced under specific pathological conditions. Mitochondrial Glo2 contributes to the regulation of multiple processes, including apoptosis [44]. The activity of this enzyme depends on two divalent Zn2+ ions. Thus, their presence among the proteins identified in seminal plasma from GF ejaculates could be linked to its enhanced antioxidant capacity. It can be assumed that a higher Zn2+ content in GF seminal plasma could help sustain Glo2 activity.
Enolases (2-phospho-D-glycerate hydrolases; EC 4.2.1.11) are essential glycolytic enzymes that facilitate the transformation of 2-phosphoglycerate into phosphoenolpyruvate. In eukaryotic organisms, enolase exists in three isoforms: enolase 1 (α), enolase 2 (γ), and enolase 3 (β), which are encoded by the Eno1, Eno2, and Eno3 genes, respectively [45]. Alpha-enolase is a multifunctional glycolytic enzyme that participates in processes other than energy metabolism, including cellular stress responses, bacterial and fungal infections, autoantigen activity, cancer development and metastasis, parasitic infections, as well as the growth, development, and reproduction of various organisms [46]. The expression of ENO1 is altered during cell growth and in response to pathological conditions. Furthermore, changes in protein expression are influenced by both the duration of exposure and oxygen concentration. ENO1 has been reported to enhance anaerobic metabolism under hypoxic conditions, thereby contributing to cellular protection during oxygen deprivation [47]. Under anaerobic conditions, turkey sperm exhibit reduced glycolytic capacity, rapid ATP depletion, and decreased motility relative to aerobic conditions, which significantly impairs their fertilising potential. The limited glycolytic ability of turkey sperm leads to a pronounced decline in ATP levels, ultimately compromising overall fertility [48]. These results could point to low oxygen availability in IF ejaculates. Given the higher concentration of sperm, it can be assumed that not all spermatozoa had adequate access to oxygen as highly motile sperm might have contributed to local oxygen depletion. Thus, the presence of enolase in IF semen may reflect the absence of oxygen in the environment. Interestingly, an acute hypoxic event can trigger a burst of superoxide production [49], and higher SOD activity in spermatozoa from IF ejaculates could be indicative of such an event. Research has demonstrated that cells exposed to elevated temperatures and glucose scarcity commonly upregulate specific proteins, including heat shock proteins (HSPs) and glucose-regulated proteins such as ENO1, to support cellular adaptation [50]. Ucker et al. [51] showed that nearly all glycolytic enzymes are enriched at the membranes of apoptotic cells. In the group of membrane-associated enzymes, alpha-enolase is most abundant and is regarded as the most representative example of a SUPER protein (surface-exposed, ubiquitously expressed, protease-sensitive, evolutionarily conserved, resident typically in viable cells). Thus, the presence of alpha-enolase among the proteomes of ejaculates from IF individuals could be indicative of the presence of immature or abnormal cells directed towards apoptosis. Alpha-enolase is known to be bound to neutrophils and participate in immune responses; therefore, external stressors or inflammatory processes in the immediate vicinity could also be responsible for an increase in its expression. The enzyme appears to be highly conserved, and metal ions, such as manganese or zinc, may trigger its activity in different species [46]. Thus, higher amounts of Zn2+ in spermatozoa from IF ejaculates may have contributed to its activation. According to Brazdova et al. [52], immunodominant sperm proteins (HSP 701A/1B, HSP cognate 71 kDa, alpha-enolase) appear to trigger pathological antibody responses due to isoimmunisation. However, Sumarsono et al. [53] found that alpha-enolase activity in the plasma membrane of Bali cattle sperm was affected by sperm concentration but was not related to sperm quality. Therefore, it appears that the presence of alpha-enolase in spermatozoa derived from low-quality semen may also be associated with their higher concentration. In many species, beta-2-microglobulin (B2M) is a component of the MHC1 molecule, and it may play an important role in inter-species infertility and speciation [54]. Since B2M is bound non-covalently to the MHC-I α-chain and not the membrane itself, it may detach and generate free B2M. Soluble B2M is ubiquitous in bodily fluids, including the serum, and is generally stable under physiological conditions. In turn, elevated B2M levels have been linked to several diseases as indicators of increased immune cell activity [55]. Beta-2-microglobulin is a normal constituent of seminal plasma. It is produced in equal amounts in the prostate and seminal vesicles. A fraction of B2M is bound to spermatozoa, but the free form is not readily incorporated [56]. Previous studies have suggested that the presence of B2M in the ejaculate is related to sperm counts [57]; however, other researchers reported that its quantity decreases with a rise in sperm counts [58]. Therefore, it cannot be ruled out that the presence of B2M in low-quality ejaculates could result from inflammatory processes in the avian reproductive system or oxidative stress in semen. This assumption is supported by the presence of GOT1, GOT2, LDHA and LDHB in some protein bands derived from impaired semen. GOT2 plays an important role in chicken sperm, potentially contributing to the regulation of mitochondrial function and sperm metabolism. The release of the intracellular enzyme aspartate aminotransferase (GOT, also known as AST) into the extracellular space is indicative of sperm cell damage. This transaminase is predominantly localised in the midpiece of spermatozoa, whereas lactate dehydrogenase (LDH) is distributed in both the mitochondria and cytosol [59]. By reflecting plasma membrane stability, these enzymes are valuable indicators of semen quality. Their presence in IF semen may be indicative of a deterioration in its parameters. Fatty acid–binding proteins (FABPs) are a family of intracellular proteins that are essential for the metabolism and transport of fatty acids and other hydrophobic ligands. These hydrophobic ligands include saturated fatty acids, monounsaturated fatty acids (MUFAs), PUFAs, eicosanoids, and other lipids. FABPs play a critical role in modulating lipid metabolism, gene regulation, and signal transduction, and are considered key mediators of metabolic and inflammatory processes [60]. Ten isoforms of FABPs with a low molecular weight (14–15 kDa) have been identified in humans [61]. B-FABP exhibits strong affinity for n-3 PUFAs and is primarily present in astrocytes and oligodendrocytes. Despite the fact that FABP7 is abundantly expressed in the embryonic brain [60] and is not typically found in the reproductive system, this protein was identified in turkey semen by Rafalska et al. [39]. At the molecular level, FABP7 promotes fatty acid uptake and lipid droplet formation [62]. According to the cited authors, FABP7 protects astrocytes from ROS toxicity through lipid droplet formation. In turkeys, the presence of these lipid droplets and disruptions in lipid metabolism potentially contribute to the overall pathology and reduced fertilising capacity of sperm, as reported by Hess et al. [63]. Therefore, the presence of this isoform in the semen of individuals with reduced fertility could be indicative of an inflammatory process, possibly caused by excessive ROS production.
Atikuzzaman et al. [64] demonstrated that higher fertility in domestic chickens is reflected in the seminal fluid proteome, and conserved proteins such as serum albumin and ovotransferrin were also detected in turkey semen. Certain proteins, including aspartate aminotransferase, annexin A5, and glutathione S-transferase 2, were associated with low-fertility ejaculates, whereas glyceraldehyde-3-phosphate dehydrogenase was unique to high-fertility samples. Overall, seminal fluid from low-fertility ejaculates contained fewer immune-related proteins and lower levels of the anti-inflammatory factor TGF-β2. Similarly, Carvalho et al. [65] reported an abundance of cilia- and flagella-associated protein 100, alpha-enolase, and tubulin beta-7 chain in subfertile roosters. Proteins differentially expressed in fertile and subfertile chickens included metabolic enzymes, stress-related proteins, and structural proteins, several of which were also detected in turkeys. The results of the current study are partly consistent with these findings, suggesting that the presence and activity of specific proteins may vary among individuals and, ultimately, influence turkey hatchability.
3.3. Potential Impact of Other Factors on the Parameters of IF Semen
In the present study, the influence of sanitary, nutritional, and health factors has been ruled out; however, these are only some of the factors that could have contributed to a deterioration in ejaculate quality. Some researchers have reported that the age of the parent flock significantly affects reproductive performance [66]. Older flocks are generally characterised by lower fertility and hatchability than younger ones. Breeder age is thus a key factor influencing hatchability and should be considered when collecting eggs for incubation. However, the male turkeys examined in the present study had only recently reached maturity, therefore the semen may not yet have reached its maximum fertilising capacity. In turkeys, fertility is influenced by age, and both young and older males potentially exhibit lower virility than mature, healthy toms. The age at which male turkeys reach maturity, as indicated by the onset of semen production, varies significantly [67]. Ejaculates were collected from turkeys at the onset of their reproductive life, and this factor could have contributed to the observed variation in ejaculate quality. Therefore, the influence of age on hatchability cannot be completely ruled out. Adhikari et al. [68] found that egg production and hatchability were higher in April, May, and June, and these months represent the peak egg laying season in turkeys. In the present experiment, ejaculates were collected at the turn of March and April; therefore, it can be assumed that not all individuals had entered the period of increased egg production.
However, it should also be noted that eggs classified as clear during candling are not necessarily infertile, but may instead reflect very early embryo mortality. Candling cannot reliably distinguish infertile eggs from those in which embryos die within the first two to three days of incubation. Typically, in a healthy hatching flock, one-third of clear eggs can in fact contain embryos that died in a very early stage. The proportion of clear eggs rises with infertility but declines when early embryonic mortality is the main issue [69].
These observations suggest that both the analysed semen parameters and semen proteome composition may have influenced fertilisation rates. During cyclic decreases in fertilisation rates, the semen factor should be considered once other factors have been excluded.
4. Materials and Methods
4.1. Material Collection
The experimental material comprised 37 ejaculates collected from white turkeys of the Hybrid Converter NOVO line. The birds were aged between 35 and 37 weeks and were housed on the GRELAVI farm (Hendrix Genetics Ltd. and Hybrid Turkeys LLC, Kitchener, ON, Canada) in Komorowo (Warmian-Masurian Voivodeship, Poland). Semen was collected in March 2023. The ejaculates were obtained after two egg-laying cycles, spaced two weeks apart, during which low egg fertilisation rates (80% to 84%) were observed. However, a fertilisation rate above 88% was considered satisfactory on the farm. The sanitary conditions on the farm, the birds’ diet, and the health status of breeding males and females were assessed and compared, and a decision was made to analyse the semen of individuals with lower fertilisation rates. The collected ejaculates were divided into two groups: impaired fertility (IF; n=27) and good fertility (GF; n=10). GF ejaculates were obtained from individuals that were housed in nearby buildings and consistently achieved fertilisation rates above 90% after egg laying, while the IF group included ejaculates with fertilisation rates below the 84% threshold.
Ejaculates were collected by experienced farm workers using the manual massage method [70]. All ejaculates were collected into separate syringes and immediately transported in a thermobox to the laboratory. Upon arrival, the samples were assessed for sperm concentration, motility, and viability. Next, they were centrifuged at 10000 x g for 10 minutes. The obtained seminal plasma was transferred to clean tubes, and the remaining spermatozoa precipitates were washed twice with 0.85% NaCl solution and centrifuged twice to remove any debris. Finally, TBS with 1% SDS (50 mM TRIS, 150 mM NaCl, 1% SDS; pH 7.5) was added to the resulting pellets, and sperm extracts were prepared. Samples were stored at -80°C until subsequent analysis.
4.2. Assessment of Sperm Concentration
Total sperm counts in each ejaculate were determined using a light microscope and a Bürker counting chamber (Equimed-Medical Instruments, Cracow, Poland). Before analysis, each sample was diluted with 0.85% NaCl solution to a final ratio of 1:800. The total sperm count was determined by counting cells in twenty squares of the Bürker chamber grid, and the average number of sperm cells per square was calculated.
4.3. Assessment of Sperm Motility
Sperm motility was evaluated using a computer-assisted semen analysis system (CASA; Hamilton Thorne IVOS, version 12.3, USA). A sperm motility buffer (50 mM TRIS, 120 mM NaCl, 10 mM glucose, 2 mM CaCl2, 0.5% BSA (pH=7.4)) was added to 30-μL sperm suspensions at a 1:1 ratio, and the mixtures were placed in a thermoblock (Thermo Block TDB-120, Biosan, Poland) set to 38°C for 10 minutes. Following incubation, 10-μL samples were placed in a Makler chamber (pre-warmed to 38°C). According to the manual, special settings are required to analyse turkey semen: 60 frames were acquired at a frame rate of 60 Hz, with a minimum cell contrast of 35% and a minimum cell size of 5 pixels. The VAP threshold was set to 50 μm/s, the STR threshold to 80.0%, the VAP cutoff to 30.0 μm/s, and the VSL cutoff to 15.0 μm/s.
4.4. Assessment of Sperm Plasma Membrane Integrity (SYBR-14/PI)
The integrity of sperm plasma membranes in the head region was evaluated using the method developed by Garner and Johnson [71]. First, spermatozoa were diluted to a concentration of 30 x 106 spermatozoa/mL using a HEPES/BSA buffer with the following composition: 10 mM HEPES, 130 mM NaCl, 4 mM KCl, 14 mM fructose, 1 mM CaCl2, 0.5 mM MgCl2, and 0.1% BSA (pH 7.4). Then, 1 μL of SYBR-14 dye was added to each diluted sample of 100 μL. The samples were incubated at 38°C for 10 minutes. After incubation, 1 μL of propidium iodide (PI) was added to each sample, and the samples were incubated under the same conditions for an additional 10 minutes. Stained 10-μL samples were mounted on a standard slide and examined microscopically. Spermatozoa were assessed under a fluorescence microscope (Olympus BX 41, Tokyo, Japan) at 600x magnification. The heads of spermatozoa with intact plasma membranes fluoresced green after staining with SYBR-14, whereas those with damaged membranes fluoresced red after staining with PI. Spermatozoa were counted in at least 10 random fields of view. The results were expressed as the percentage of spermatozoa with intact plasma membranes (%).
4.5. Assessment of Sperm Mitochondrial Membrane Potential (JC-1/PI)
Two fluorescent dyes, JC-1 (iodide-5,5‘, 6,6′-tetrachloro-1,1 ‘,3,3′-tetraethylbenzimidazole-carbocanine) and PI (propidium iodide), were used to assess sperm MMP. In the first step, semen samples were diluted to a concentration of 30 x 106 sperm/mL in HEPES/BSA buffer. Then, 0.33 μL of JC-1 solution was added to each sample and incubated for 10 minutes at 38°C. After incubation, 1 μL of PI solution was added to each sample, and the samples were observed under a fluorescence microscope. Spermatozoa were evaluated under a fluorescence microscope (Olympus BX 41, Tokyo, Japan) at 600x magnification. At least 200 spermatozoa were evaluated in random fields of view in each sample. Spermatozoa exhibiting orange fluorescence in the midpiece were considered to have high MMP (active mitochondria, JC-1+/PI-). Conversely, spermatozoa with green fluorescence in the midpiece region and/or red fluorescence in the head region were classified as non-viable cells with low MMP (JC-1-/PI+). The results were presented as the percentage of spermatozoa with high MMP (%).
4.6. Assessment of Nitric Oxide (NO)-Generating Spermatozoa (DAF-2DA)
Nitric oxide production was evaluated using the DAF-2DA staining method described by Lampiao et al. [72]. Nitric oxide-producing sperm were assessed using the DAF-2DA (4,5-diaminofluorescein diacetate) fluorescent dye. Each sample was first diluted with HEPES/BSA buffer to a final concentration of 30 x 106 spermatozoa/mL. Then, 100 μL of a 10 μM DAF-2DA solution in PBS was added to each sample. The samples were incubated for 120 minutes in a thermoblock (Thermo Block TDB-120, Biosan, Poland) at 39°C in the dark. Nitric oxide-generating spermatozoa were counted under a fluorescence microscope (Olympus BX 41, Tokyo, Japan) equipped with a DMB filter (blue light). The results were presented as the percentage of spermatozoa (%) showing green-blue fluorescence relative to the total number of spermatozoa previously counted in the same fields of view under bright light.
4.7. Antioxidant Enzyme Triad
Antioxidant enzyme activity was measured in both seminal plasma and spermatozoa. Enzyme activity in seminal plasma was expressed in international units per millilitre (U/mL) or micromoles per millilitre per minute (µM/mL/min). Enzyme activity in spermatozoa was adjusted based on sperm concentrations (U/109 sperm).
4.8. Determination of Superoxide Dismutase (SOD) Activity
Superoxide dismutase activity was determined using the RANSOD kit (Randox Laboratories, Crumlin, UK) according to the manufacturer’s instructions, and it was measured at 505 nm. One unit of SOD activity was defined as the amount of the enzyme causing 50% inhibition of iodonitrotetrazolium chloride (INT) reduction at 37°C and pH 7.0.
4.9. Determination of Glutathione Peroxidase (GPx) Activity
Glutathione peroxidase activity was determined using the RANSEL kit (Randox Laboratories, Crumlin, UK) according to the manufacturer’s protocol, and it was measured at 340 nm. One unit of GPx catalyses the oxidation of 1.0 µM GSH to GSSG per minute at 25ºC, pH 7.0, in the presence of H2O2, leading to a simultaneous oxidation of NADPH to NADP+ and a corresponding decrease in absorbance.
4.10. Determination of Catalase (CAT) Activity
Catalase activity was measured using a commercial Catalase Assay Kit (Sigma-Aldrich, Merck, Burlington, MA, USA) based on the manufacturer’s instructions, and it was assessed at 520 nm. One unit of CAT decomposes 1 M H2O2 per minute at a substrate concentration of 50 mM H2O2 at 25°C (pH 7.0).
4.11. Determination of Glutathione (GSH) Content
Glutathione content was determined using the OXIS-GSH kit from Oxis Research (Oxis International Inc., Portland, OR, USA) according to the manufacturer’s manual. The concentration of GSH (reduced glutathione) + GSSG (oxidised glutathione) was determined by measuring the change in absorbance at 400 nm at 25°C.
4.12. Determination of Malondialdehyde (MDA) Content
Malondialdehyde content was determined using the OXIS-MDA test from OxisResearch (Oxis International Inc., Portland, USA) according to the manufacturer’s instructions. In the MDA-586 assay, the MDA content of a sample is calculated based on probe absorbance at 586 nm and a standard curve.
4.13. Determination of Zinc Content
The zinc (Zn2+) content of turkey semen was determined colourimetrically based on the formation of a coloured complex between Zn2+ and 4-(2-pyridylazo)resorcinol (PAR), measured spectrophotometrically at 490 nm. Several chemical reagents were prepared to facilitate the analysis. The zinc standard solution was prepared by dissolving 1.2448 g of zinc oxide (ZnO), previously dried overnight at 110°C, in 3 mL of concentrated hydrochloric acid (HCl). After complete dissolution, the solution was diluted with deionised water to a final volume of 1000 mL. A neutralisation buffer was also prepared by dissolving 38.137 g of sodium tetraborate decahydrate (Na2B4O7·10H2O) and 50.4 g of sodium hydroxide (NaOH) in approximately 500 mL of deionised water and adjusting the total volume to 1000 mL. The colourimetric reagent was prepared by dissolving 0.1 g of 4-(2-pyridylazo)resorcinol (PAR) in 100 mL of deionised water. Three 100 mL volumetric flasks were prepared for each sample, i.e., one for a blank, one for a test sample, and one for a test sample spiked with the zinc standard. The flasks were washed with 10% nitric acid (HNO3), thoroughly rinsed with deionised water, and dried at 37°C in a mechanical dryer. 200 μL of the semen sample was placed in each flask. Then, 1 mL of 70% perchloric acid (HClO4) was added to digest organic components and release Zn2+. The flasks were left at room temperature for 10 minutes with occasional stirring. Then, 16 μL of the prepared Zn2+ standard solution was added to the standard (spiked) sample. Next, 10 μL of the neutralisation buffer and 1 mL of the PAR reagent were added to each flask. The volume of each flask was adjusted to 100 mL with deionised water.
The absorbance of each prepared solution was measured at a wavelength of 490 nm. Zinc concentration was calculated using the below formula:
Zn2+ content (mg%) = 0,1 x x 100, where:
Ab - absorbance of the blank with reagents,
Asa - absorbance of the test sample,
Ast - absorbance of the test sample with the standard mixture.
The results were converted to µg/mL for seminal plasma and to µg/x109 sperm mL-1 for spermatozoa.
4.14. Analysis of Turkey Semen Protein Profiles by Two Separation Methods
4.14.1. SDS-PAGE Electrophoresis
Proteins of turkey seminal plasma and spermatozoa were separated in 12% polyacrylamide gels using a buffer composed of 50 mM Tris, 250 mM glycine, and 0.5% SDS (pH 8.3). The separation was done in a Mini-Protean II Cell apparatus (Bio-Rad, USA) based on the method proposed by Laemmli [73]. Next, 5 μL of concentrated lysis buffer (1 M Tris-HCl, 20% SDS, 2% glycerol, 2% β-mercaptoethanol, 2% bromophenol blue; pH=6.8) was added to samples with a standardised protein concentration (1.5 mg/mL). The samples were then heated at 95°C for 5 minutes in a Thermo Block TDB-120 thermostat (Biosan, Poland). From each prepared sample, 15 μL was loaded into individual wells of a polyacrylamide gel and separated electrophoretically under constant current. The separation was performed at 80 V for the initial 20 minutes, then at 130 V for the remainder. Precision Plus Protein Standards (Bio-Rad, USA) were used in the procedure (molecular weight range: 250-10 kDa).
4.14.2. TRICINE-PAGE Electrophoresis
This method allowed for more precise separation of proteins with a molecular weight below 70 kDa. A three-layer polyacrylamide gel with different densities was used, consisting of a stacking layer (4%), an intermediate layer (10%), and a separating layer (15%). Successive layers were poured into the gel wells at roughly 15-minute intervals and overlaid with 100 μL of distilled water to thoroughly polymerise each layer. After polymerisation, the water was removed with a syringe, and another gel layer was applied. Two buffers were used during separation: a cathodic buffer (0.1 M Tris, 0.1 M Tricine, 0.1% SDS) and an anodic buffer (0.2 M Tris). The separation was carried out at 80 V for the initial 20 minutes and at 130 V for the remainder of the process. Precision Plus Protein Standards (Bio-Rad, USA) were used as the reference standards (molecular weight range: 250-10 kDa).
4.15. Identification of Selected Proteins by Nano LC-MS/MS Mass Spectrometry
Gel sections were excised and subjected to decolourisation, reduction, alkylation, and digestion procedures. Bands were first incubated in 50 μL of 100 mM ammonium carbonate solution for 10 minutes with shaking in a thermoblock. Acetonitrile (50 μL) was then added, and the mixture was shaken at 600 rpm for 10 minutes. The supernatant was removed, and gel fragments were dehydrated with 100% acetonitrile, followed by shaking under the same conditions. Next, gel fragments were treated with 50 μL of aqueous dithiothreitol (DTT) solution and reduced at 90ºC for 10 minutes. Then, 50 μL of 5 mM iodoacetamide in 100 mM ammonium carbonate buffer was added for alkylation, carried out at 90ºC for 10 minutes, with shaking at 600 rpm. After alkylation, the iodoacetamide solution was removed, and the gel was dehydrated again with acetonitrile. Subsequently, 1.5 pmol of trypsin (Promega, Madison, WI, USA) was added, and the mixture was rehydrated for 5 minutes. The material was incubated overnight in carbonate buffer at 37ºC in a thermoblock. The following day, peptides were extracted using 50 mM carbonate buffer, followed by two extractions with 5% formic acid solution in 50% acetonitrile. Each extraction step lasted 15 minutes at 37ºC. Peptides eluted from all fractions were combined, lyophilised, and dissolved in 30 μL of a 4% acetonitrile solution with 0.1% formic acid. Nano LC-MS/MS analysis was conducted using an Ultimate 3000 HPLC/UPLC system (Thermo Fisher Scientific, Waltham, MA, USA) connected to an Exploris 240 mass spectrometer (Thermo Fisher Scientific, Waltham, MA, USA) in positive ion mode. A sample of 5 μL was injected into the system, comprising an RP C18 precolumn (0.3x5 mm, 5 μm particle size) and an RP C18 column (15 cm, 3 μm, 75 μm particle size) (Thermo Fisher Scientific, Waltham, MA, USA). The mobile phase flow rate was 300 nL/min, and samples were eluted using a 33-minute gradient of solutions A (0.1% fluoroacetic acid in water) and B (0.1% fluoroacetic acid in acetonitrile). The gradient was as follows: 8% solution B at 0 and 4 minutes, 35% at 30 minutes, 90% at 30 minutes 30 seconds, then 31 minutes 30 seconds, and back to 8% at 32 and 33 minutes. Raw data were processed with Data Analysis software (version 4.0, Bruker-Daltonics, Germany) to generate mgf files for protein identification using Mascot software (Matrix Science, London, UK). All mgf files were searched against the UniProtKB database for the animal taxonomic group, with emphasis on the following poultry species: Meleagris gallopavo, Gallus gallus, Coturnix japonica, Phasianus colchicus, and Numida meleagris. Only protein identifications with Mascot scores ≥ 90 were included in the results.
4.16. Functional Analysis of Identified Proteins
The proteome composition of seminal plasma and spermatozoa obtained from GF and IF turkey semen was compared using a free web tool for creating Venn diagrams (https://www.biotools.fr/misc/venny, accessed on 5 August 2025).
Functional enrichment of proteins from GF and IF turkey semen was analysed based on the associated biological processes using the PANTHER Classification System v. 19.0 (Gene Ontology (GO) online tool, http://pantherdb.org, accessed on 25 August 2025). Molecular function was estimated by applying Fisher’s exact test with the false discovery rate (FDR) correction on the PAN-GO Human Functionome platform. Only statistically significant terms (FDR ≤ 0.05) were included in the manuscript. All data were retrieved from the reference database that included the targeted poultry species. When protein sequences for the targeted species were unavailable, the Homo sapiens database was searched as a comprehensive and regularly updated reference.
4.17. Statistical Analysis
The results were processed in the Statistica programme (version 13.1, StatSoft Inc., Tulsa, OK, USA) and were presented as arithmetic means and standard deviations (SD). All parameters were analysed by one-way analysis of variance (ANOVA) and Tukey’s post hoc test. The magnitude of differences was assessed at two significance levels: p ≤ 0.001 and p ≤ 0.05. Differences in the optical density (OD) of individual fractions were calculated from all electropherograms corresponding to each ejaculate component and semen type. A non-parametric analysis and the Mann-Whitney U test were used for this purpose.
5. Conclusion
Impaired male fertility is often linked to oxidative stress in semen. Oxidative stress arises from an imbalance between ROS production and the body’s antioxidant defences. Excess ROS generation in semen can damage sperm, leading to lower sperm counts, reduced motility, and diminished fertilising capacity. Additionally, inadequate antioxidant protection may affect overall semen quality. Proteins differentially expressed in GF and IF ejaculates have been identified in the present study, and they can be used as potential indicators of hatchability in turkeys. The results of the study provide indirect evidence that semen parameter analysis in turkeys is essential for optimising industrial breeding practices.
Supplementary Materials
The following supporting information can be downloaded at the website of this paper posted on Preprints.org.
Author Contributions
Conceptualisation – A.O. data curation – A.O. and P.S.; formal analysis – A.O.; funding acquisition - A.O.; investigation – A.O., A.Dz., P.S., and J.N.K.; methodology – A.O. and J.N.K.; project administration – A.O.; resources – A.O. and A.Dz.; supervision – A.O.; visualisation – A.O.; writing–original draft – A.O.; writing–review and editing – A.O. and A.Dz. All authors have read and agreed to the published version of the manuscript.
Funding
The study was funded by the University of Warmia and Mazury in Poland as part of its statutory activities (Project No. 11.610.003-110). The manuscript was translated into English and financially supported by the Minister of Science under the Regional Initiative of Excellence Programme.
Institutional Review Board Statement
Not applicable.
Informed Consent Statement
Not applicable.
Data availability statement
The original contributions presented in this study are included in the article and the supplementary materials. Further inquiries can be directed to the corresponding author.
Acknowledgments
The authors would like to thank the management and staff of GRELAVI (Hendrix Genetics Ltd. Group) for providing turkey semen samples for the study.
Conflicts of Interest
The authors declare no conflict of interest.
References
- King’ori, A.M. Review of the factors that influence egg fertility and hatchability in poultry. Int. J Poult. Sci. 2011, 10, 483–492. [Google Scholar] [CrossRef]
- Hu, J.; Chen, J.L.; Wen, J.; Zhao, G.P.; Zheng, M.Q.; Liu, R.R.; Liu, W.P.; Zhao, L.H.; Liu, G.F.; Wang, Z.W. Estimation of the genetic parameters of semen quality in Beijing-You chickens. Poult. Sci. 2013, 92(10), 2606–2612. [Google Scholar] [CrossRef]
- https://www.hybridturkeys.com/en/news/new-laying-standards-released-for-the-hybrid-converternovo/.
- Grimes, J.L.; Noll, S.; Brannon, J.; Godwin, J.L.; Smith, J.C.; Rowland, R.D. Effect of a chelated calcium proteinate dietary supplement on the reproductive performance of Large White Turkey breeder hens. J Appl. Poult. Res. 2004, 13, 639–649. [Google Scholar] [CrossRef]
- Ansari, M.S.; Rakha, B.A.; Akhter, S.; Akhter, A.; Blesbois, E.; Santiago-Moreno, J. Effect of glutathione on pre- and post-freezing sperm quality of Indian red jungle fowl (Gallus gallus murghi). Theriogenology 2021, 172, 73–79. [Google Scholar] [CrossRef]
- Mussa, N.J.; Boonkum, W.; Chankitisakul, V. Semen Quality Traits of Two Thai Native Chickens Producing a High and a Low of Semen Volumes. Vet. Sci. 2023, 10(2), 73. [Google Scholar] [CrossRef]
- Łukaszewicz, E. Artificial insemination - the method assisting reproduction of birds. Rocz. Nauk. Pol. Tow. Zootech. 2006, 2(1), 115–128. [Google Scholar]
- McGary, S.; Estevez, I.; Bakst, M.R.; Pollock, D.L. Phenotypic traits as reliable indicators of fertility in male broiler breeders. Poult. Sci. 2002, 81(1), 102–11. [Google Scholar] [CrossRef] [PubMed]
- Feyisa, S.G.; Park, Y.H.; Kim, Y.M.; Lee, B.R.; Jung, K.M.; Choi, S.B.; Cho, C.Y.; Han, J.Y. Morphological defects of sperm and their association with motility, fertility, and hatchability in four Korean native chicken breeds. Asian-Australas. J Anim. Sci. 2018 31(8), 1160-1168. [CrossRef]
- Bakst, M.R.; Welch, G.R.; Camp, M.J. Observations of turkey eggs stored up to 27 days and incubated for 8 days: embryo developmental stage and weight differences and the differentiation of fertilized from unfertilized germinal discs. Poult Sci, 2016, 95(5), 1165-1172. [CrossRef]
- Alvarez, J.G.; Storey, B.T. Differential incorporation of fatty acids into and peroxidative loss of fatty acids from phospholipids of human spermatozoa. Mol. Reprod. Dev. 1995, 42(3), 334–346. [Google Scholar] [CrossRef]
- Agarwal, A.; Virk, G.; Ong, C.; du Plessis, S.S. Effect of oxidative stress on male reproduction. World J. Mens Health. 2014, 32(1), 1-17. [CrossRef]
- Partyka, A.; Lukaszewicz, E.; Niżański, W. Lipid peroxidation and antioxidant enzymes activity in avian semen. Anim. Reprod. Sci. 2012, 134(3-4), 184-90. [CrossRef]
- Donoghue, A.M.; Sonstegard, T.S.; King, L.M.; Smith, E.J.; Burt, D.W. Turkey sperm mobility influences paternity in the context of competitive fertilization. Biol. Reprod. 1999, 61(2), 422–427. [Google Scholar] [CrossRef] [PubMed]
- Sun, Y.; Xue, F.; Li, Y.; Fu, L.; Bai, H.; Ma, H.; Xu, S.; Chen, J. Differences in semen quality, testicular histomorphology, fertility, reproductive hormone levels, and expression of candidate genes according to sperm motility in Beijing-You chickens. Poult. Sci. 2019, 98(9), 4182–4189. [Google Scholar] [CrossRef]
- Frączek, M.; Kurpisz, M. The redox system in human semen and peroxidative damage of spermatozoa. Postepy Hig. Med. Dosw. (Online) 2005, 59, 523–34. [Google Scholar]
- Froman, D.P.; Thurston, R.J. Chicken and turkey spermatozoal superoxide dismutase: a comparative study. Biol. Reprod. 1981, 24(1), 193–200. [Google Scholar] [CrossRef]
- Partyka, A.; Niżański, W. Supplementation of Avian Semen Extenders with Antioxidants to Improve Semen Quality-Is It an Effective Strategy? Antioxidants (Basel) 2021, 10(12), 1927. [Google Scholar] [CrossRef] [PubMed]
- Surai, P.F. Antioxidant Systems in Poultry Biology: Superoxide Dismutase. J Anim. Physiol. Anim. Nutr. 2016, 1, 8. [Google Scholar] [CrossRef]
- Lee, S.R. Critical Role of Zinc as Either an Antioxidant or a Prooxidant in Cellular Systems. Oxid. Med. Cell Longev. 2018, 20, 9156285. [Google Scholar] [CrossRef]
- Azad, M.A.; Kikusato, M.; Maekawa, T.; Shirakawa, H.; Toyomizu, M. Metabolic characteristics and oxidative damage to skeletal muscle in broiler chickens exposed to chronic heat stress. Comp. Biochem. Physiol. A Mol. Integr. Physiol. 2010, 155(3), 401–406. [Google Scholar] [CrossRef]
- Duru, N.K.; Morshedi, M.; Oehninger, S. Effects of hydrogen peroxide on DNA and plasma membrane integrity of human spermatozoa. Fertil. Steril. 2000, 74(6), 1200–1207. [Google Scholar] [CrossRef]
- Rubio-Riquelme, N.; Huerta-Retamal, N.; Gómez-Torres, M.J.; Martínez-Espinosa, R.M. Catalase as a Molecular Target for Male Infertility Diagnosis and Monitoring: An Overview. Antioxidants 2020, 9, 78. [Google Scholar] [CrossRef]
- Crisol, L.; Matorras, R.; Aspichueta, F.; Expósito, A.; Hernández, M.L.; Ruiz-Larrea, M.B.; Mendoza, R.; Ruiz-Sanz, J.I. Glutathione peroxidase activity in seminal plasma and its relationship to classical sperm parameters and in vitro fertilization-intracytoplasmic sperm injection outcome. Fertil. Steril. 2012, 97(4), 852–857. [Google Scholar] [CrossRef]
- Pujianto D.A.; Oktarina M.; Sharma Sharaswati I.A.; Yulhasri. Hydrogen Peroxide Has Adverse Effects on Human Sperm Quality Parameters, Induces Apoptosis, and Reduces Survival. J Hum. Reprod. Sci. 2021, 14(2), 121-128. [CrossRef]
- Orzołek, A.; Rafalska, K.T.; Dziekońska, A.; Rafalska, A.; Zawadzka, M. How Do Taurine and Ergothioneine Additives Improve the Parameters of High- And Low-Quality Turkey Semen During Liquid Preservation? Ann. Anim. Sci. 2025, 25(2), 597–609. [Google Scholar] [CrossRef]
- Atig, F.; Raffa, M.; Habib, B.A; Kerkeni, A.; Saad, A.; Ajina, M. Impact of seminal trace element and glutathione levels on semen quality of Tunisian infertile men. BMC Urol 2012, 12, 6. [Google Scholar] [CrossRef] [PubMed]
- Ochsendorf, F.R.; Buhl, R.; Bästlein, A.; Beschmann, H. Glutathione in spermatozoa and seminal plasma of infertile men. Hum. Reprod. 1998, 13, 353–359. [Google Scholar] [CrossRef]
- Fafula, R.V.; Onufrovych, O.K.; Iefremova, U.P.; Melnyk, O.V.; Nakonechnyi, I.A.; Vorobets, D.Z.; Vorobets, Z.D. Glutathione content in sperm cells of infertile men. Regul. Mech. Biosyst. 2017, 8(2), 157–161. [Google Scholar] [CrossRef]
- Barati, E.; Nikzad, H.; Karimian, M. Oxidative stress and male infertility: Current knowledge of pathophysiology and role of antioxidant therapy in disease management. Cell Mol Life Sci 2020, 77(1), 93–113. [Google Scholar] [CrossRef]
- Bucak, M.N.; Sarıözkan, S.; Tuncer, P.B.; Sakin, F.; Ateşşahin, A.; Kulaksız, R.; Çevik, M. The effect of antioxidants on post-thawed Angora goat (Capra hircus ancryrensis) sperm parameters, lipid peroxidation and antioxidant activities. Small. Rumin. Res. 2010, 89, 24–30. [Google Scholar] [CrossRef]
- Bustamante-Filho, I.C.; Pasini, M.; Moura, A.A. Spermatozoa and seminal plasma proteomics: Too many molecules, too few markers. The case of bovine and porcine semen. Anim. Reprod. Sci. 2022, 247, 107075. [Google Scholar] [CrossRef]
- O’Flaherty, C. Peroxiredoxin 6: The Protector of Male Fertility. Antioxidants (Basel) 2018, 7(12), 173. [Google Scholar] [CrossRef]
- Fisher, A.B. Peroxiredoxin 6 in the repair of peroxidized cell membranes and cell signalling. Arch. Biochem. Biophys. 2017, 617, 68–83. [Google Scholar] [CrossRef]
- Moawad, A.R.; Fernandez, M.C.; Scarlata, E.; Dodia, C.; Feinstein, S.I.; Fisher, A.B.; O’Flaherty, C. Deficiency of peroxiredoxin 6 or inhibition of its phospholipase A2 activity impair the in vitro sperm fertilizing competence in mice. Sci. Rep. 2017, 7, 12994. [Google Scholar] [CrossRef]
- De Lamirande, E.; Gagnon, C. Reactive oxygen species and human spermatozoa. II. Depletion of adenosine triphosphate plays an important role in the inhibition of sperm motility. J. Androl. 1992, 13, 379–386. [Google Scholar] [CrossRef]
- Zhang, J.J.; Do, H.L.; Chandimali, N.; Lee, S.B.; Mok, Y.S.; Kim, N.; Kim, S.B.; Kwon, T.; Jeong, D.K. Non-thermal plasma treatment improves chicken sperm motility via the regulation of demethylation levels. Sci. Rep. 2018, 8(1), 7576. [Google Scholar] [CrossRef]
- Rafalska, K.T.; Orzołek, A.; Ner-Kluza, J.; Wysocki, P. A Comparison of White and Yellow Seminal Plasma Phosphoproteomes Obtained from Turkey (Meleagris gallopavo) Semen. Int. J Mol. Sci. 2024, 25, 9941. [Google Scholar] [CrossRef]
- Rafalska, K.T.; Orzołek, A.; Ner-Kluza, J.; Wysocki, P. Does the Type of Semen Affect the Phosphoproteome of Turkey (Meleagris gallopavo) Spermatozoa? Int. J Mol. Sci. 2025, 26(8), 3467. [Google Scholar] [CrossRef]
- Muhoberac, B.B.; Vidal, R. Iron, ferritin, hereditary ferritinopathy, and neurodegeneration. Front. Neurosci. 2019, 13, 1195. [Google Scholar] [CrossRef]
- Watanabe, M.; Yuge, M.; Uda, A.; Yoshikawa, Y.; Watanabe, K.; Orino, K. Structural and functional analyses of chicken liver ferritin. Poult. Sci. 2011, 90, 1489–1495. [Google Scholar] [CrossRef]
- Zolea, F.; Biamonte, F.; Candeloro, P.; Di Sanzo, M.; Cozzi, A.; Di Vito, A.; Quaresima, B.; Lobello, N.; Trecroci, F.; Di Fabrizio, E. H ferritin silencing induces protein misfolding in K562 cells: a Raman analysis. Free Radic. Biol. Med. 2015, 89, 614–623. [Google Scholar] [CrossRef]
- Orino, K.; Lehman, L.; Tsuji, Y.; Ayaki, H.; Torti, S.V.; Torti, F.M. Ferritin and the response to oxidative stress. Biochem. J 2001, 357, 241–247. [Google Scholar] [CrossRef] [PubMed]
- Scirè, A.; Cianfruglia, L.; Minnelli, C.; Romaldi, B.; Laudadio, E.; Galeazzi, R.; Antognelli, C.; Armeni, T. Glyoxalase 2: Towards a Broader View of the Second Player of the Glyoxalase System. Antioxidants 2022, 11, 2131. [Google Scholar] [CrossRef] [PubMed]
- Tracy, M.R.; Hedges, S.B. Evolutionary history of the enolase gene family. Gene 2000, 259, 129–138. [Google Scholar] [CrossRef]
- Ji, H.; Wang, J.; Guo, L.; Li, Y.; Lian, S.; Guo, W.; Yang, H.; Kong, F.; Zhen, L.; Guo, L.; Liu, Y. Progress in the biological function of alpha-enolase. Anim. Nutr. 2016, 2(1), 12–17. [Google Scholar] [CrossRef] [PubMed]
- Graven, K.K.; Zimmerman, L.H.; Dickson, E.W.; Weinhouse, G.L.; Farber, H.W. Endothelial cell hypoxia associated proteins are cell and stress specific. J Cell Physiol. 1993, 157, 544–554. [Google Scholar] [CrossRef]
- Wishart, GJ. Maintenance of ATP concentrations in and of fertilizing ability of fowl and turkey spermatozoa in vitro. J Reprod. Fertil. 1982, 66(2), 457–62. [Google Scholar] [CrossRef]
- Hernansanz-Agustín, P.; Izquierdo-Álvarez, A.; Sánchez-Gómez, F.J.; Ramos, E.; Villa-Piña, T.; Lamas, S.; Bogdanova, A.; Martínez-Ruiz, A. Acute hypoxia produces a superoxide burst in cells. Free Radic. Biol. Med. 2014, 71, 146–156. [Google Scholar] [CrossRef] [PubMed]
- Young, R.A.; Elliott, T.J. Stress proteins, infection, and immune surveillance. Cell 1989, 59, 5–8. [Google Scholar] [CrossRef] [PubMed]
- Ucker, D.S.; Jain, M.R.; Pattabiraman, G.; Palasiewicz, K.; Birge, R.B.; Li, H. Externalized glycolytic enzymes are novel, conserved, and early biomarkers of apoptosis. J Biol. Chem. 2012, 287, 10625–10343. [Google Scholar] [CrossRef]
- Brazdova, A.; Vermachova, M.; Zidkova, J.; Ulcova-Gallova, Z.; Peltre, G. Immunodominant semen proteins I: New patterns of sperm proteins related to female immune infertility. Cent. Eur. J. Biol. 2013, 8, 813–818. [Google Scholar] [CrossRef]
- Sumarsono, T;, Supriatna, I.; Setiadi, M. A.; Agil, M.; Purwantara B. Detection of Plasma Membrane Alpha Enolase (ENO1) and Its Relationship with Sperm Quality of Bali Cattle. Trop. Anim. Sci. J, 2023, 46(1), 36-42. [CrossRef]
- Sanderson, A.R. Role for Beta 2 Microglobulin in Speciation, Editor(s): H. PEETERS, Protides of the Biological Fluids, Elsevier 1985, 32, 277–280. [Google Scholar] [CrossRef]
- Liu, Z.Y.; Tang, F.; Wang, J.; Yang, J.Z.; Chen, X.; Wang, Z.F.; Li, Z.Q. Serum beta2-microglobulin acts as a biomarker for severity and prognosis in glioma patients: a preliminary clinical study. BMC Cancer 2024, 24(1), 692. [Google Scholar] [CrossRef]
- Lizana, J.; Eneroth, P.; Byström, B.; Bygdeman, B. Seminal Plasma Levels of Beta2-Microglobulin and Cea-Like Protein in Infertility, Editor(s): H. PEETERS, Protides of the Biological Fluids, Elsevier 1982, 29, 195–200. [Google Scholar] [CrossRef]
- Chard, T.; Parslow, J.; Rehmann, T.; Dawnay, A. The concentrations of transferrin, β2-microglobulin, and albumin in seminal plasma in relation to sperm count. Fertil. Steril. 1991, 55(1), 211–213. [Google Scholar] [CrossRef]
- Zamponi, V.; Mazzilli, R.; Olana, S.; Russo, F.; Mancini, C.; Faggiano, A.; Salerno, G. The impact of pharmacological treatments on oxidative stress, inflammatory parameters and semen characteristics. Endocr. Abstr. 2023, 90, 726. [Google Scholar] [CrossRef]
- Zong, Y.; Li, Y.; Sun, Y.; Han, X.; Yuan, J.; Ma, L.; Ma, H.; Chen, J. Mitochondrial aspartate aminotransferase (GOT2) protein as a potential cryodamage biomarker in rooster spermatozoa cryopreservation. Poult. Sci. 2025, 104(2), 104690. [Google Scholar] [CrossRef] [PubMed]
- Furuhashi, M.; Hotamisligil, G.S. Fatty Acid-Binding Proteins: Role in Metabolic Diseases and Potential as Drug Targets. Nat. Rev. Drug Discov. 2008, 7, 489–503. [Google Scholar] [CrossRef] [PubMed]
- Benkoe, T.M.; Mechtler, T.P.; Weninger, M.; Pones, M.; Rebhandl, W.; Kasper, D.C. Serum Levels of Interleukin-8 and Gut-Associated Biomarkers in Diagnosing Necrotizing Enterocolitis in Preterm Infants. J. Pediatr. Surg. 2014, 49, 1446–1451. [Google Scholar] [CrossRef]
- Islam, A.; Kagawa, Y.; Miyazaki, H.; Shil, S.K.; Umaru, B.A.; Yasumoto, Y.; Yamamoto, Y.; Owada, Y. FABP7 Protects Astrocytes Against ROS Toxicity via Lipid Droplet Formation. Mol. Neurobiol. 2019, 56, 5763–5779. [Google Scholar] [CrossRef] [PubMed]
- Hess, R.A.; Thurston, R.J., Biellier, H.V. Morphology of the epididymal region of turkeys producing abnormal yellow semen. Poult. Sci. 1982, 61(3), 531-539. [CrossRef]
- Atikuzzaman, M.; Sanz, L.; Pla, D.; Alvarez-Rodriguez, M.; Rubér, M.; Wright, D.; Calvete, J.J.; Rodriguez-Martinez, H. Selection for higher fertility reflects in the seminal fluid proteome of modern domestic chicken. Comp. Biochem. Physiol. Part D Genomics Proteomics 2017, 21, 27–40. [Google Scholar] [CrossRef]
- Carvalho, A.V.; Soler, L.; Thélie, A.; Grasseau, I.; Cordeiro, L.; Tomas, D.; Teixeira-Gomes, A.P.; Labas, V.; Blesblois, E. Proteomic Changes Associated With Sperm Fertilizing Ability in Meat-Type Roosters. Front. Cell Dev. Biol. 2021, 9, 655866. [Google Scholar] [CrossRef]
- Koppenol, A.; Delezie, E.; Wang, Y.; Franssens, L.; Willems, E.; Ampe, B.; Everaert, N. Effects of maternal dietary EPA and DHA supplementation and breeder age on embryonic and post-hatch performance of broiler offspring. J Anim. Physiol. An. N. 2015, 99(1), 36–47. [Google Scholar] [CrossRef]
- Carson, J.D.; Lorenz, F.W.; Asmundson, V.S. Semen production in the turkey male. Semen Production in the Turkey Male: 2. Age at Sexual Maturity. Poult. Sci. 1955, 34(2), 344-347. [CrossRef]
- Adhikari, D.; Paudel, S.; Sapkota, S.; Shrestha, S.; Poudel, N.; Bhattari, N. Performance of egg production, fertility and hatchability of turkey in different production systems. J. Nep. Agric. Res. Counc. 2024, 10(1), 112–117. [Google Scholar] [CrossRef]
- https://www.aviagen.com/assets/Tech_Center/BB_Resources_Tools/Hatchery_How_Tos/04HowTo4-IdentifyInfertileEggsandEarlyDeads.pdf.
- Burrows, W.H.; Quinn, J.P. The collection of spermatozoa from the domestic fowl and turkey. Poult. Sci. 1937, 16, 19–24. [Google Scholar] [CrossRef]
- Garner, D.L.; Johnson, L.A. Viability assessment of mammalian sperm using SYBR-14 and propidium iodide. Biol. Reprod. 1995, 53(2), 276–284. [Google Scholar] [CrossRef] [PubMed]
- Lampiao, F.; Strijdom, H.; du Plessis, S.S. Direct nitric oxide measurement in human spermatozoa: flow cytometric analysis using the fluorescent probe, diaminofluorescein. Int. J Androl. 2006, 29(5), 564–7. [Google Scholar] [CrossRef] [PubMed]
- Laemmli, U.K. Cleavage of structural proteins during the assembly of the head of bacteriophage T4. Nature 1970, 227, 680–685. [Google Scholar] [CrossRef]
Figure 1.
Proteomes of seminal plasma derived from turkey ejaculates with good (A) and impaired (B) fertility, separated by SDS-PAGE electrophoresis.
Figure 1.
Proteomes of seminal plasma derived from turkey ejaculates with good (A) and impaired (B) fertility, separated by SDS-PAGE electrophoresis.
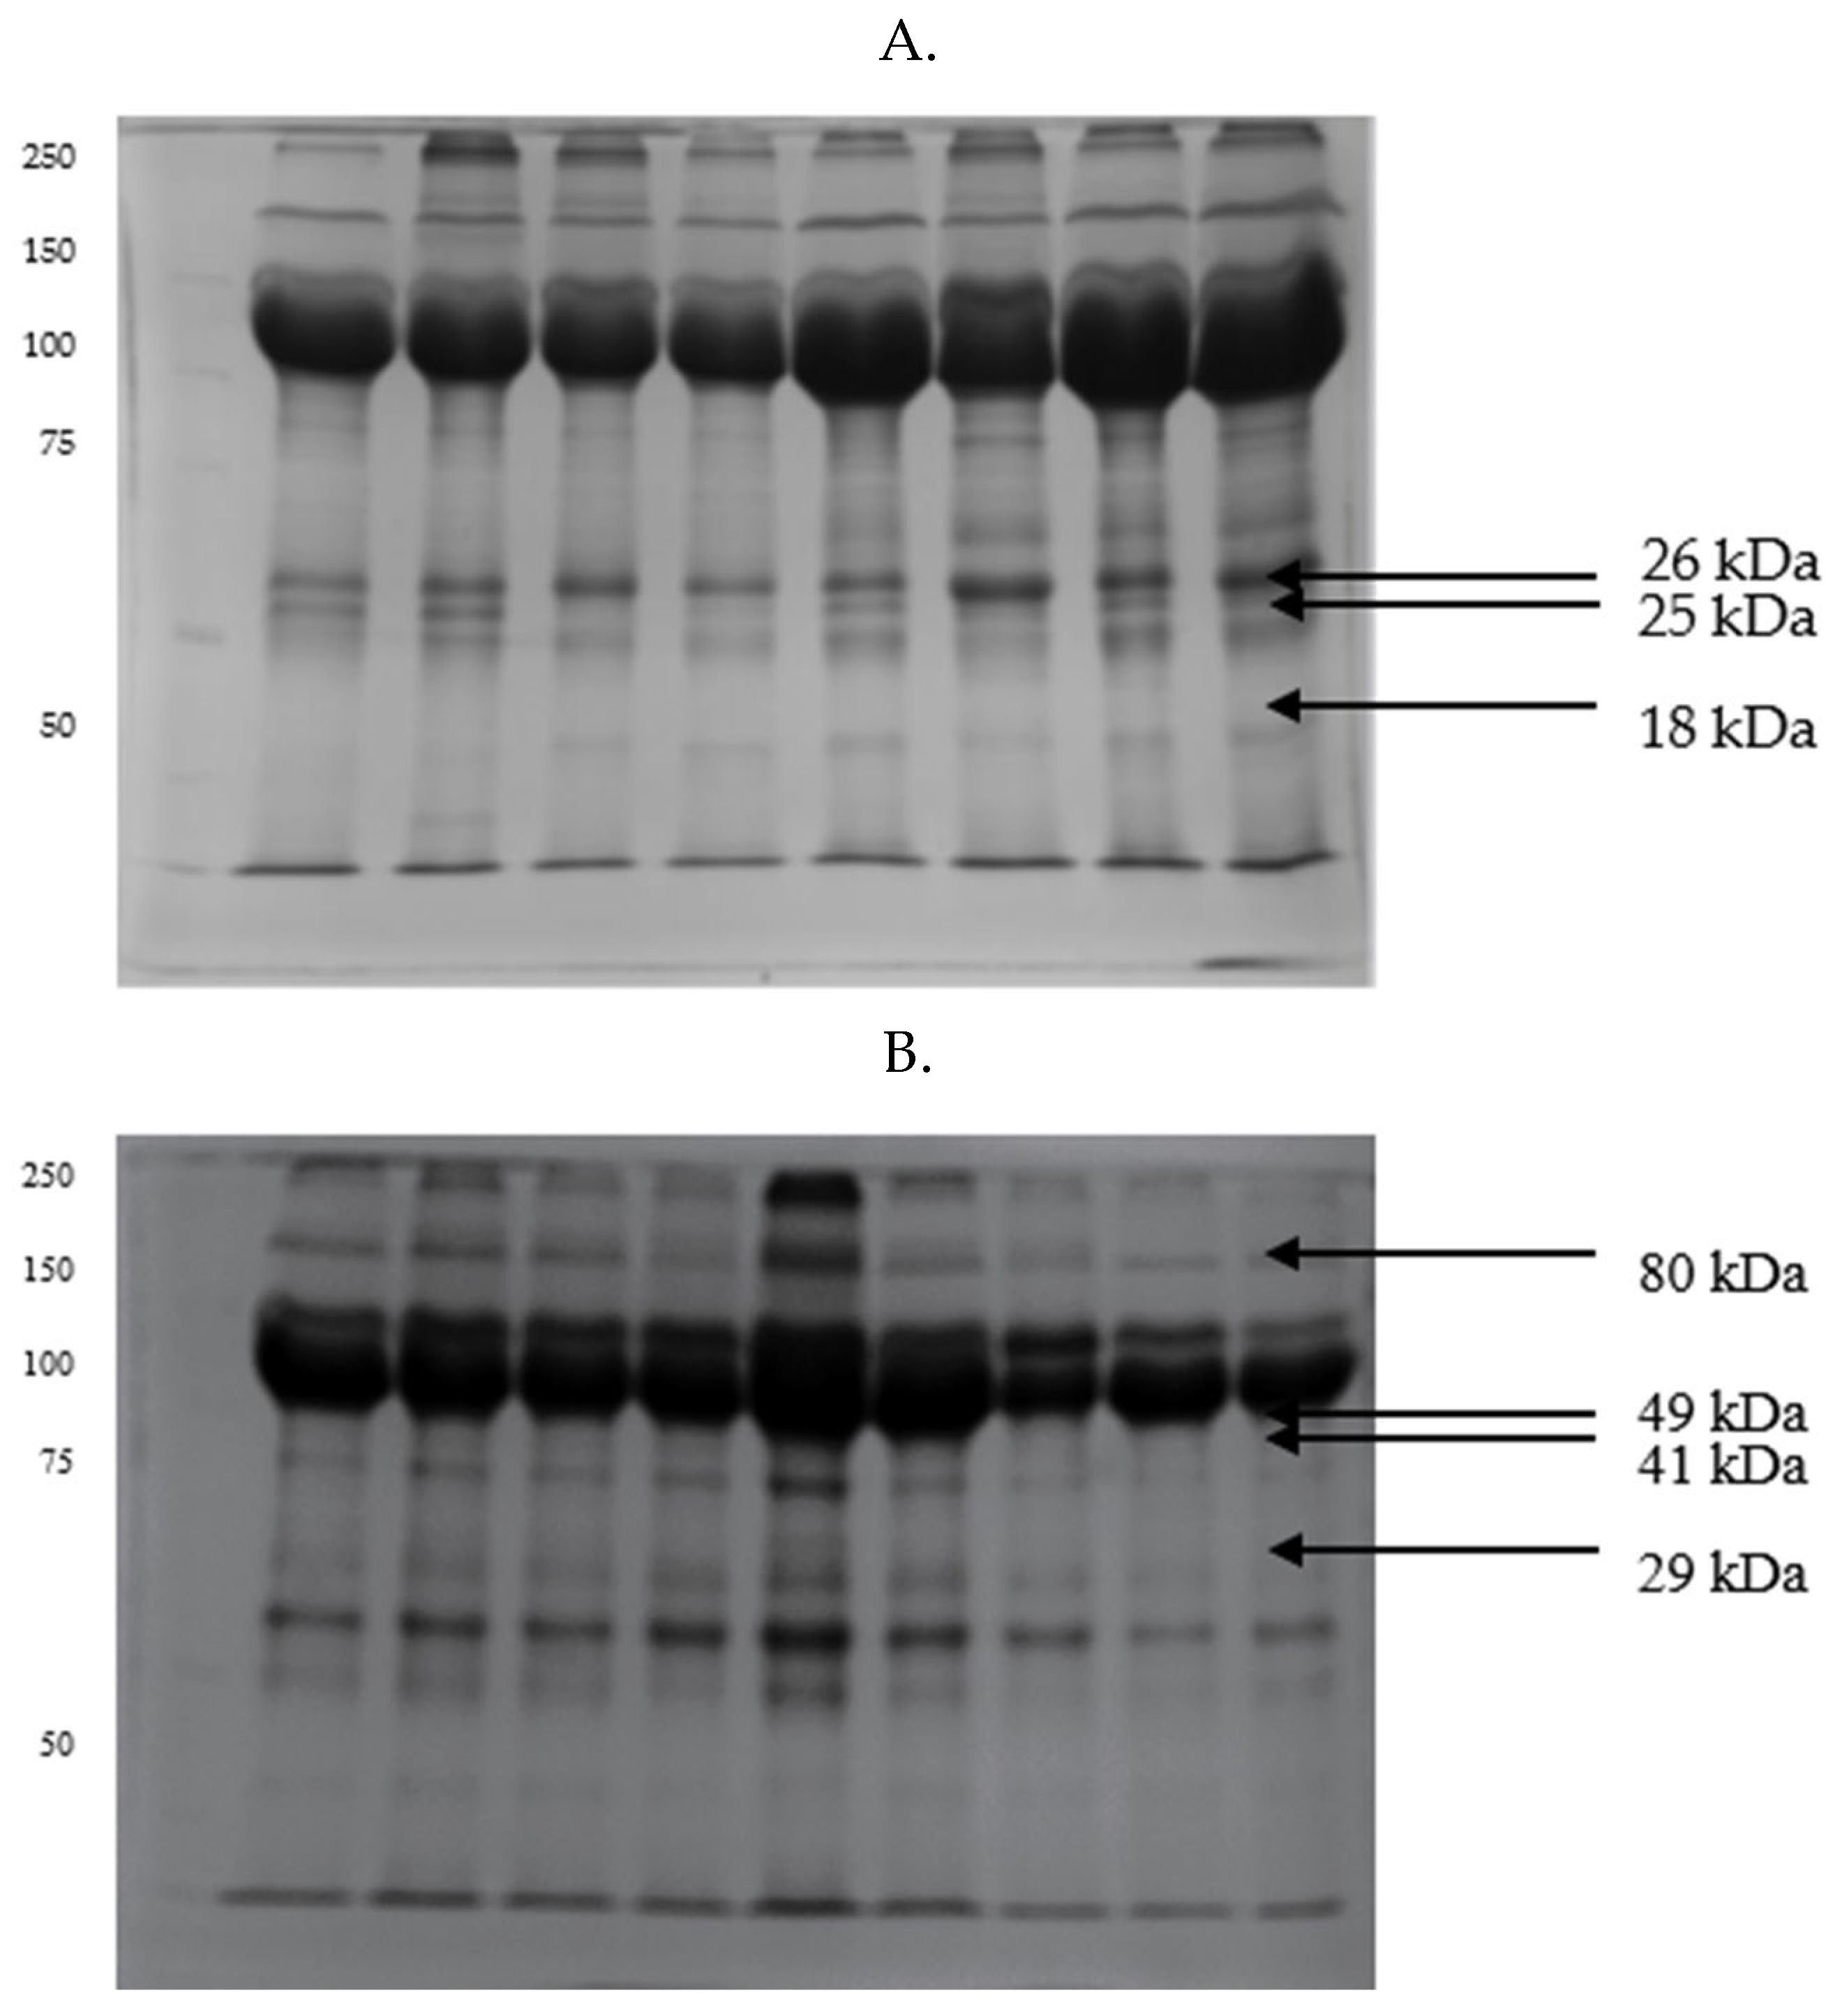
Figure 2.
Proteomes of seminal plasma derived from turkey ejaculates with good (A) and impaired (B) fertility, separated by Tricine-PAGE electrophoresis.
Figure 2.
Proteomes of seminal plasma derived from turkey ejaculates with good (A) and impaired (B) fertility, separated by Tricine-PAGE electrophoresis.
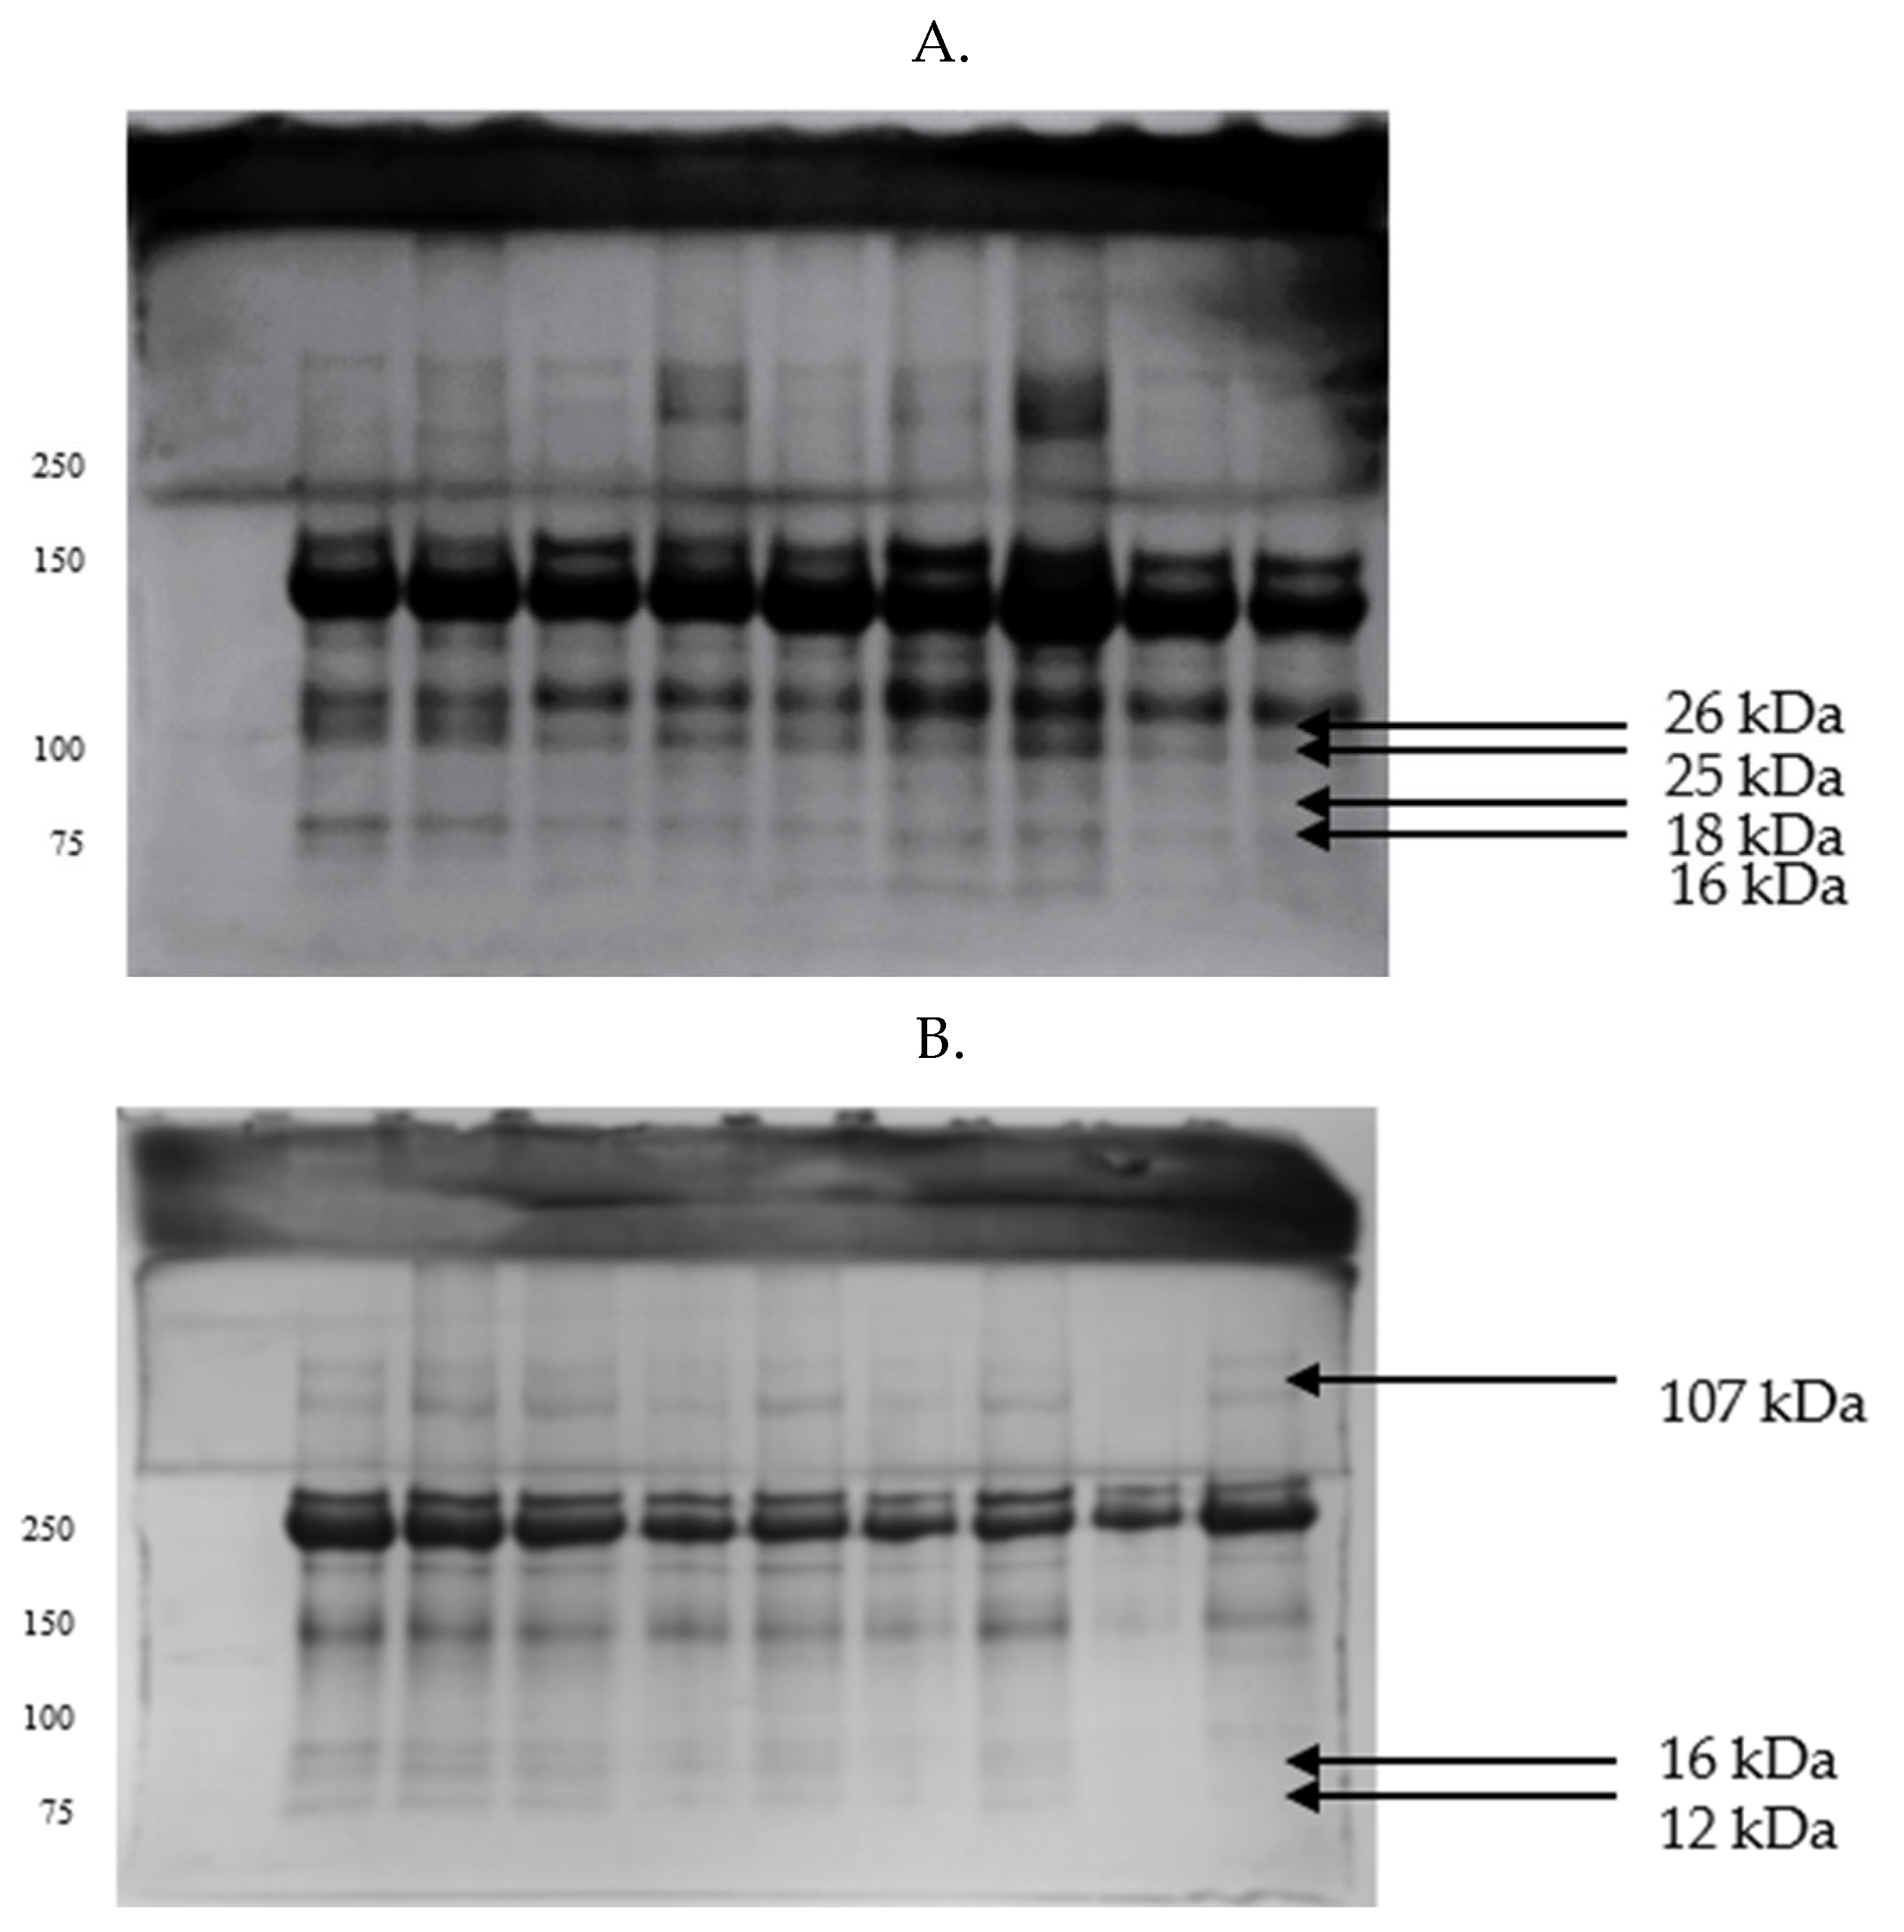
Figure 3.
Proteomes of spermatozoa derived from turkey ejaculates with good (A) and impaired (B) fertility, separated by SDS-PAGE electrophoresis.
Figure 3.
Proteomes of spermatozoa derived from turkey ejaculates with good (A) and impaired (B) fertility, separated by SDS-PAGE electrophoresis.
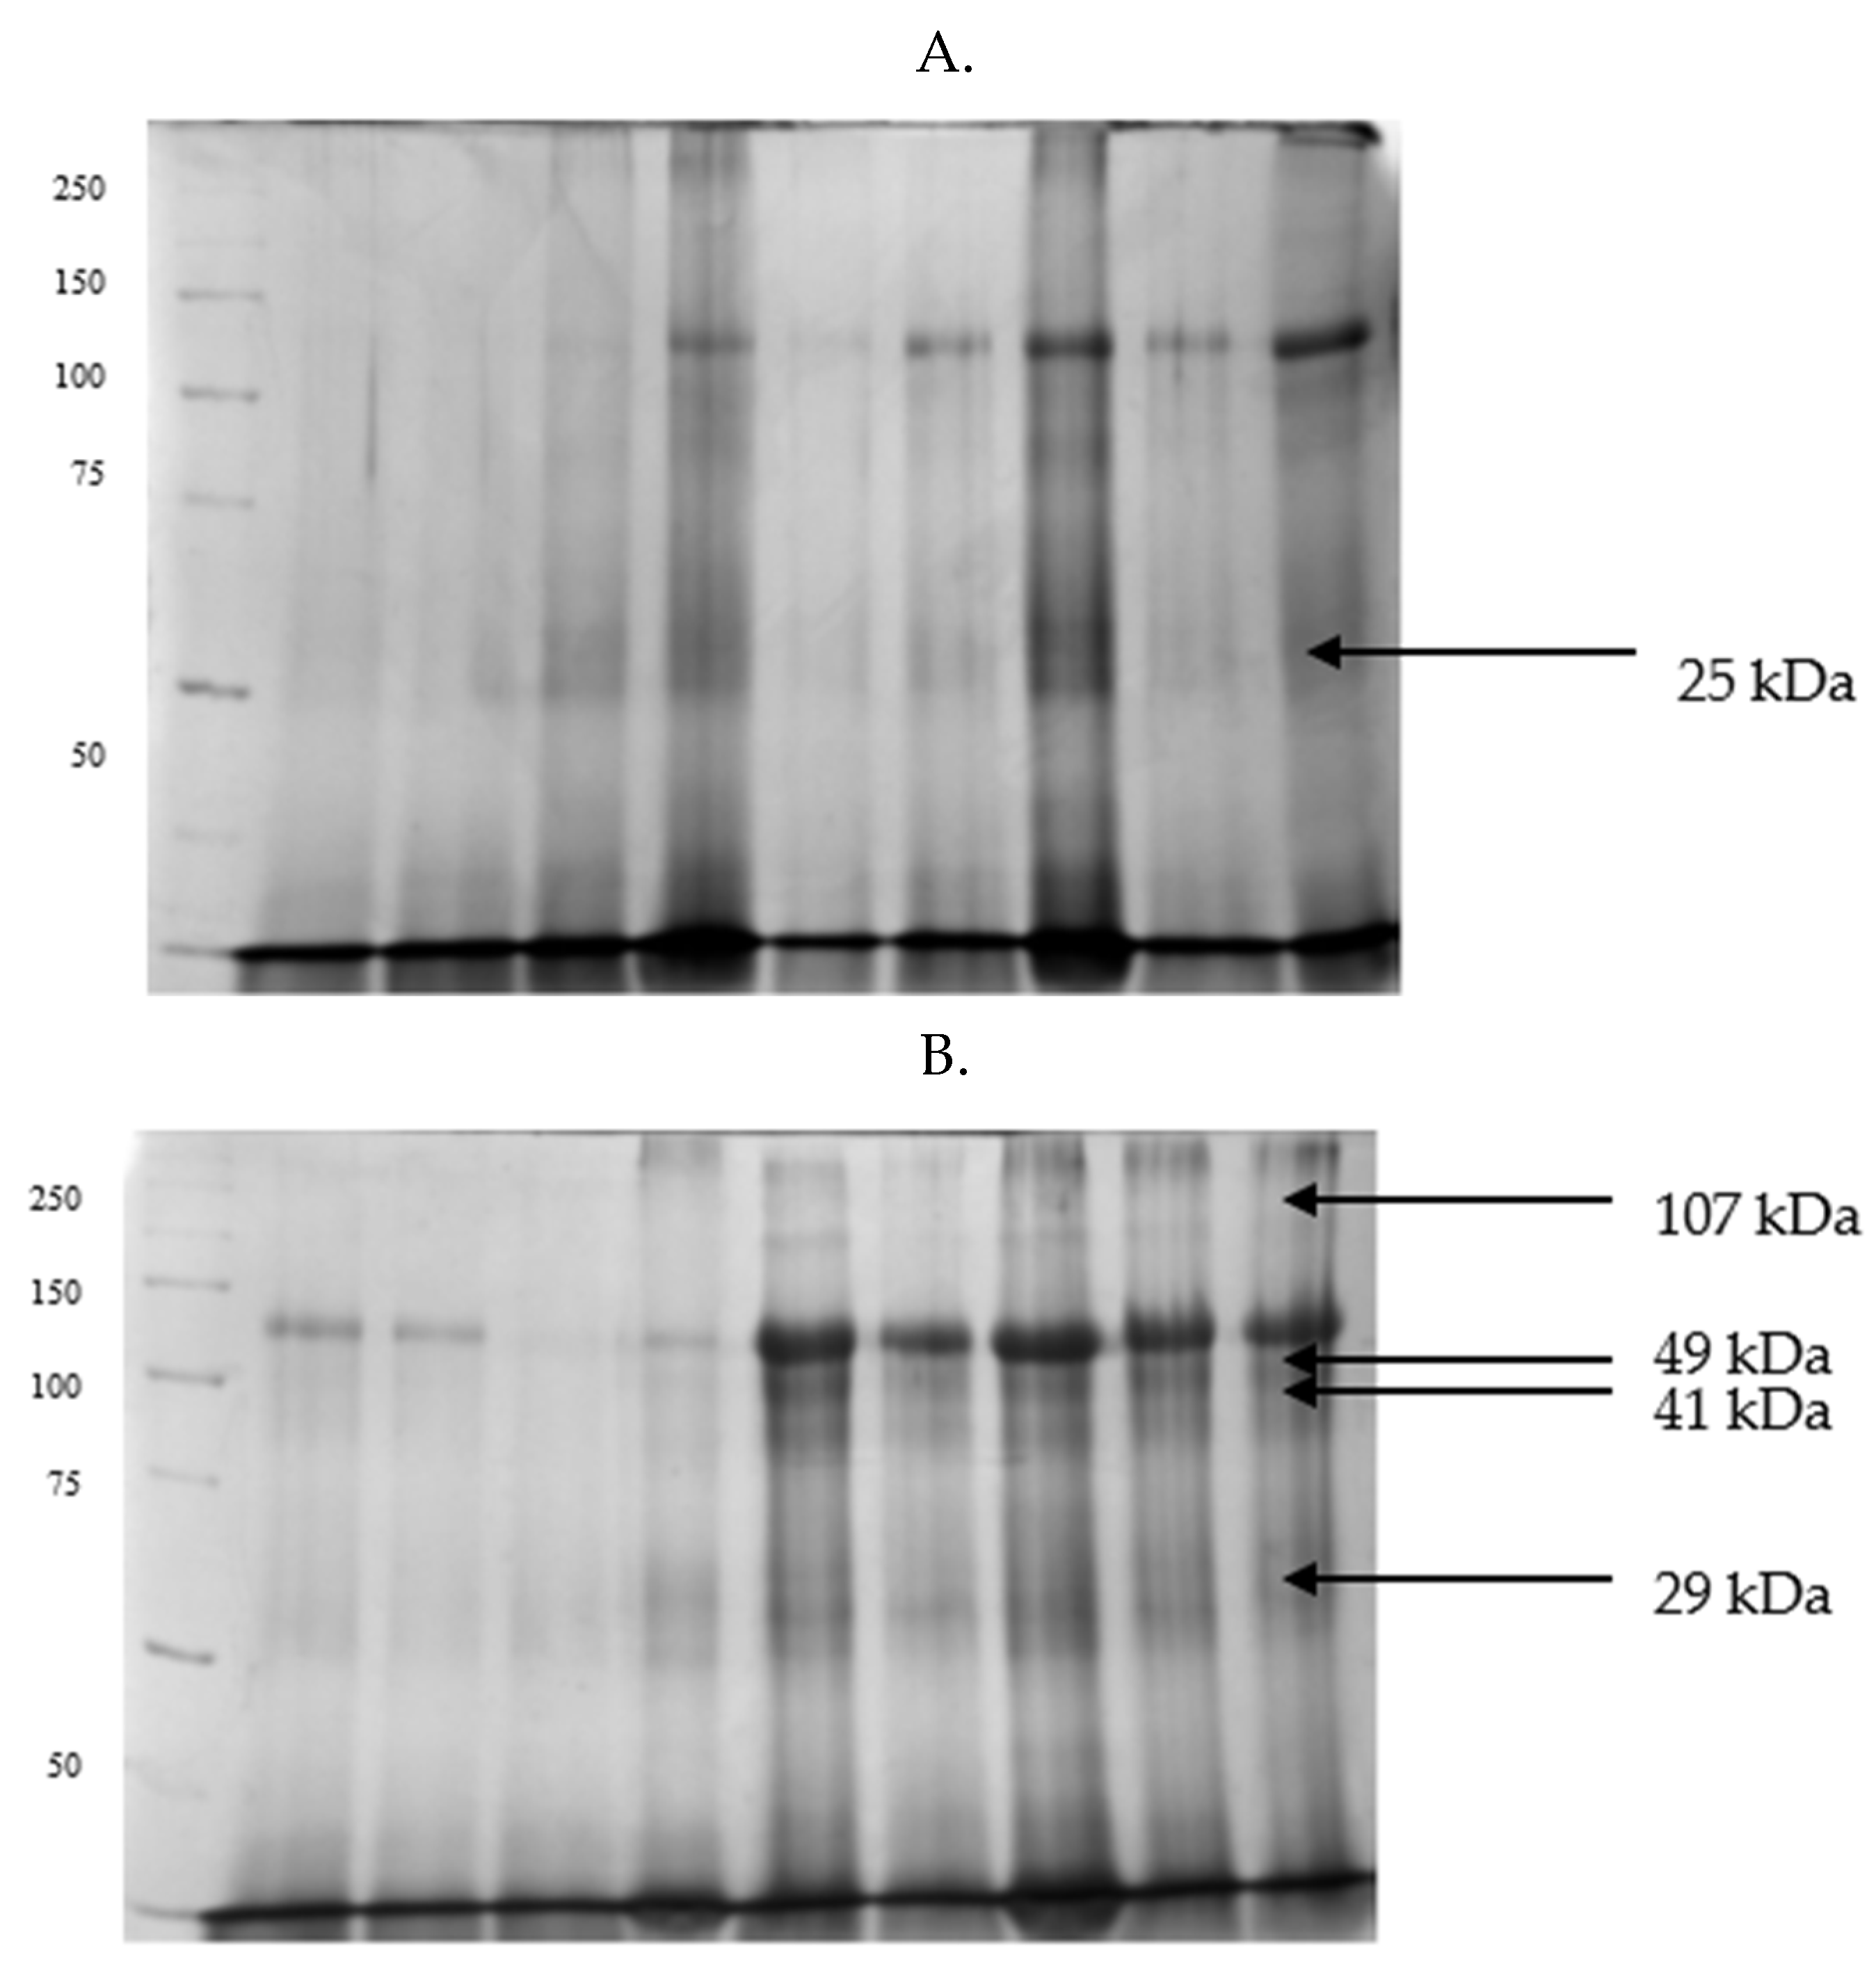
Figure 4.
Proteomes of spermatozoa derived from turkey ejaculates with good (A) and impaired (B) fertility, separated by Tricine-PAGE electrophoresis.
Figure 4.
Proteomes of spermatozoa derived from turkey ejaculates with good (A) and impaired (B) fertility, separated by Tricine-PAGE electrophoresis.
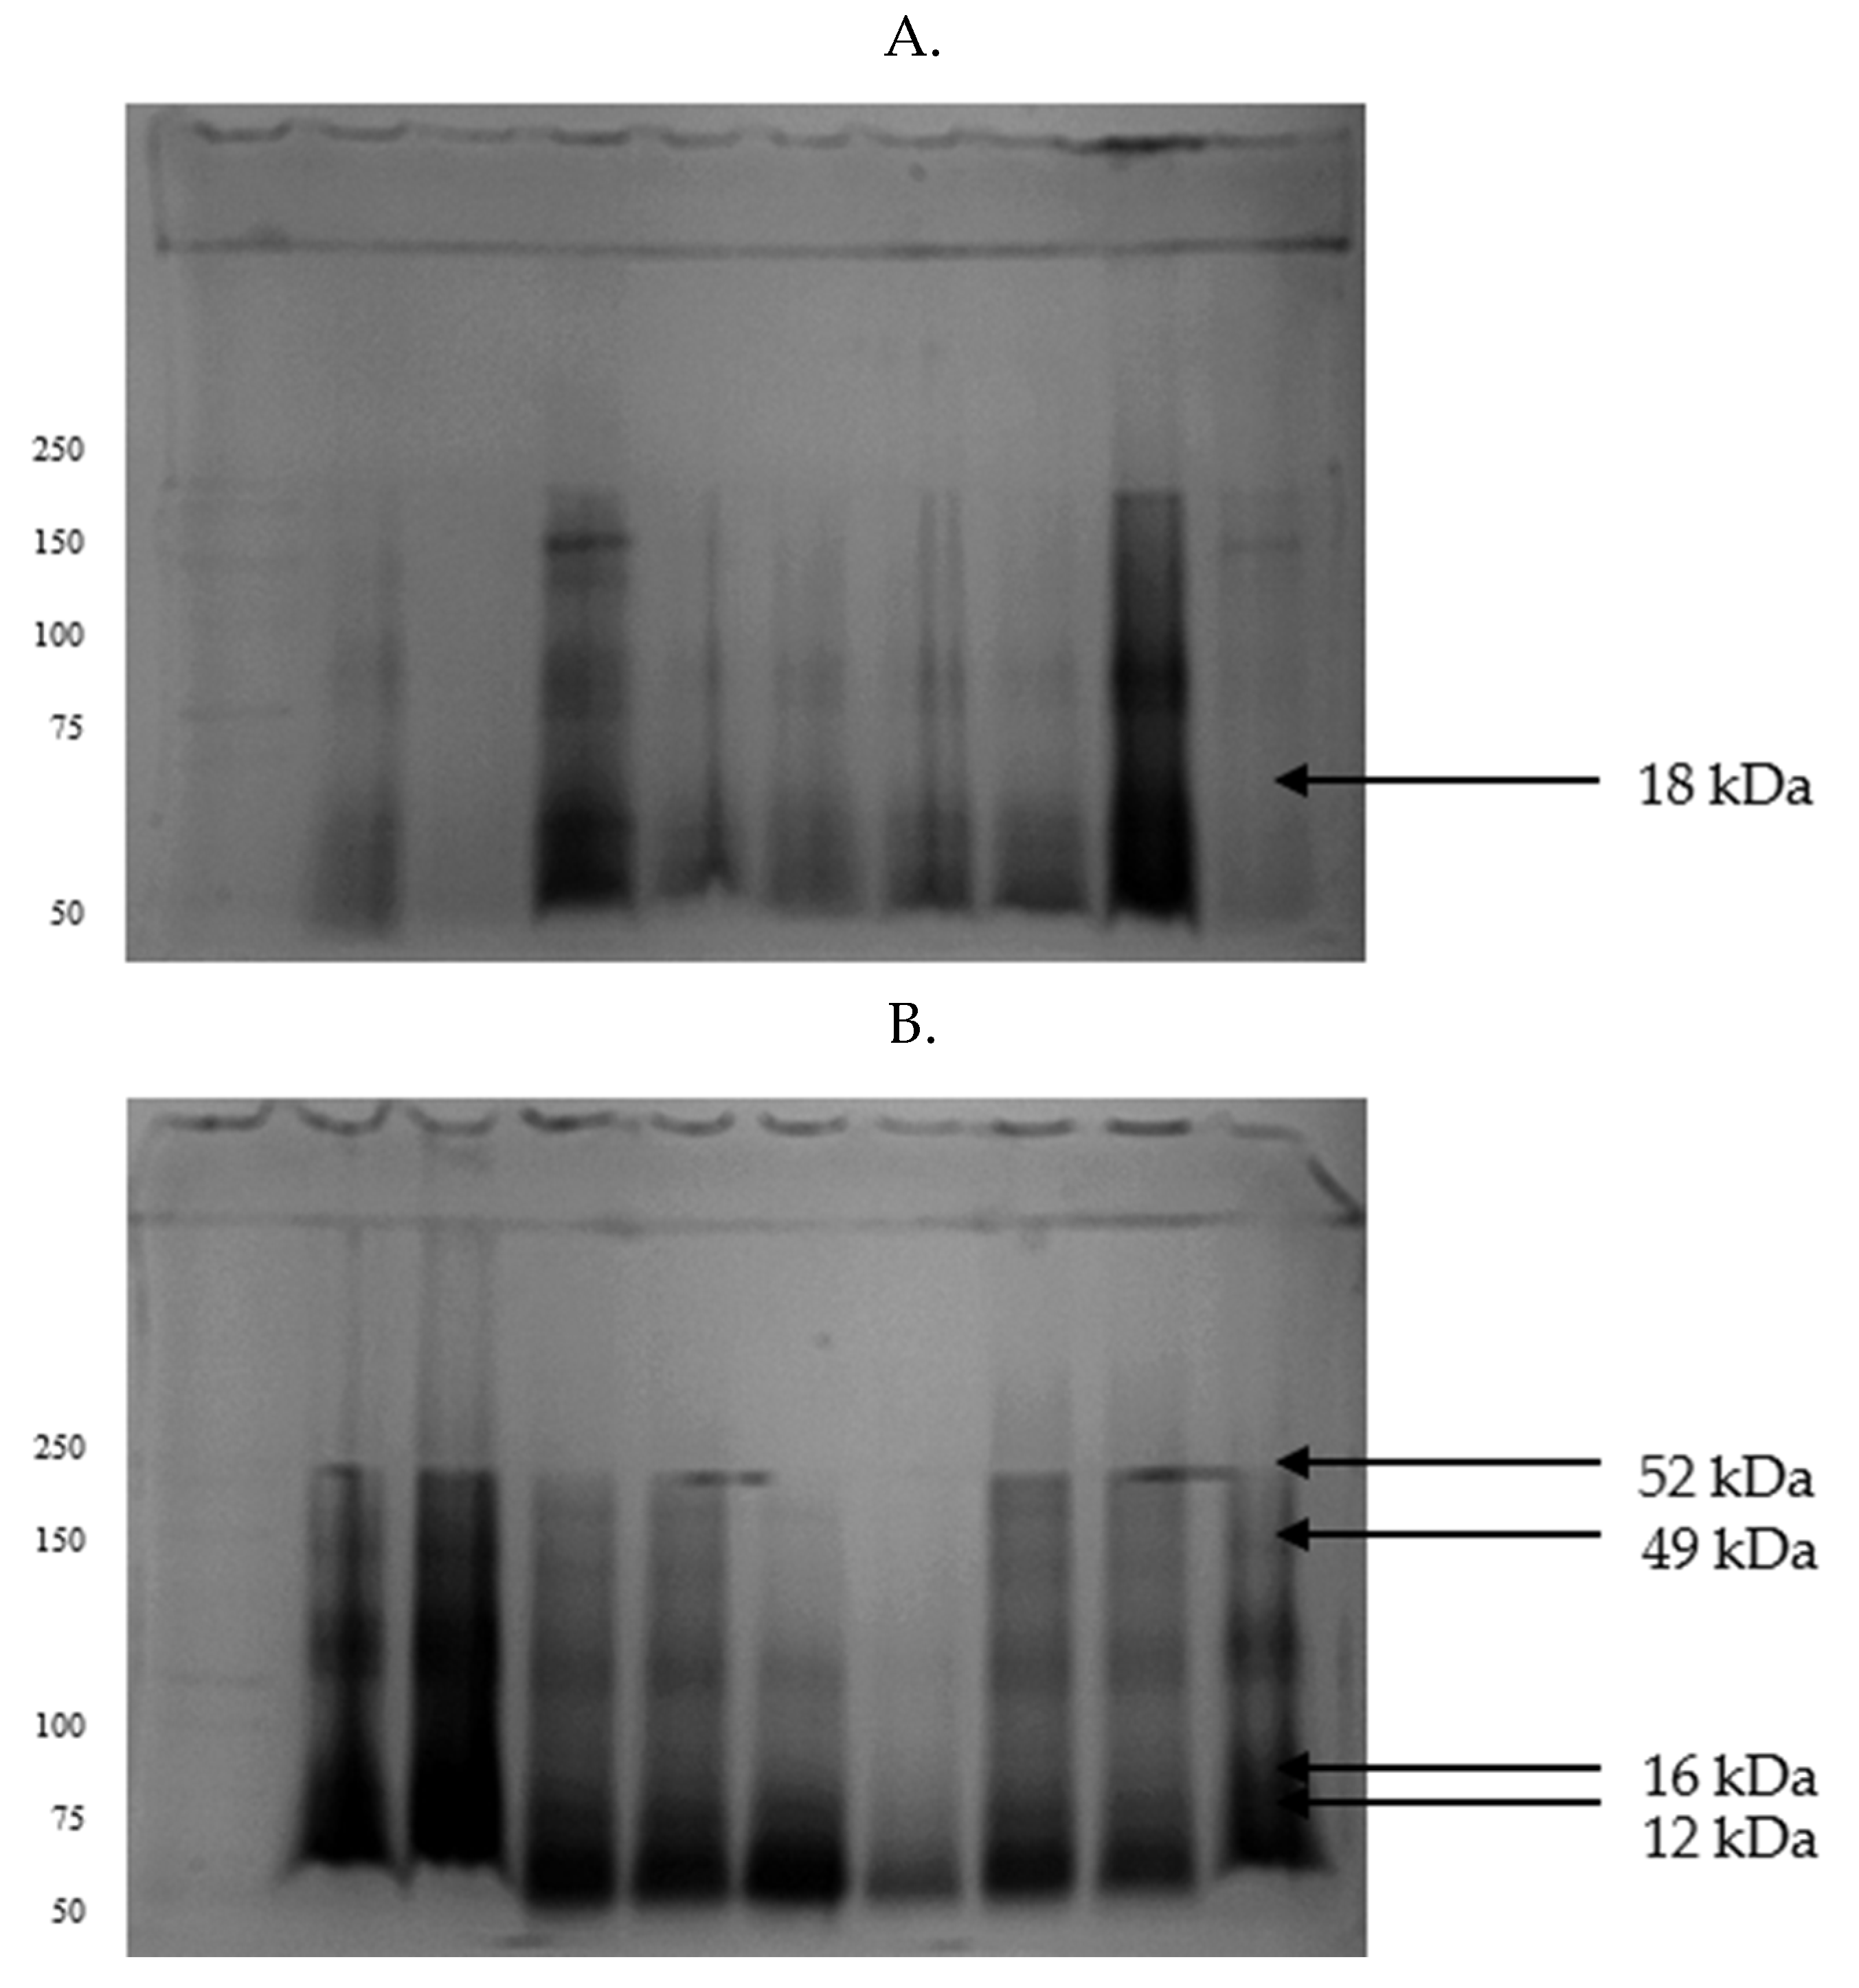
Figure 5.
Diagram presenting the number of proteins shared between seminal plasma and spermatozoa from turkey ejaculates with good fertility (GF) and impaired fertility (IF).
Figure 5.
Diagram presenting the number of proteins shared between seminal plasma and spermatozoa from turkey ejaculates with good fertility (GF) and impaired fertility (IF).
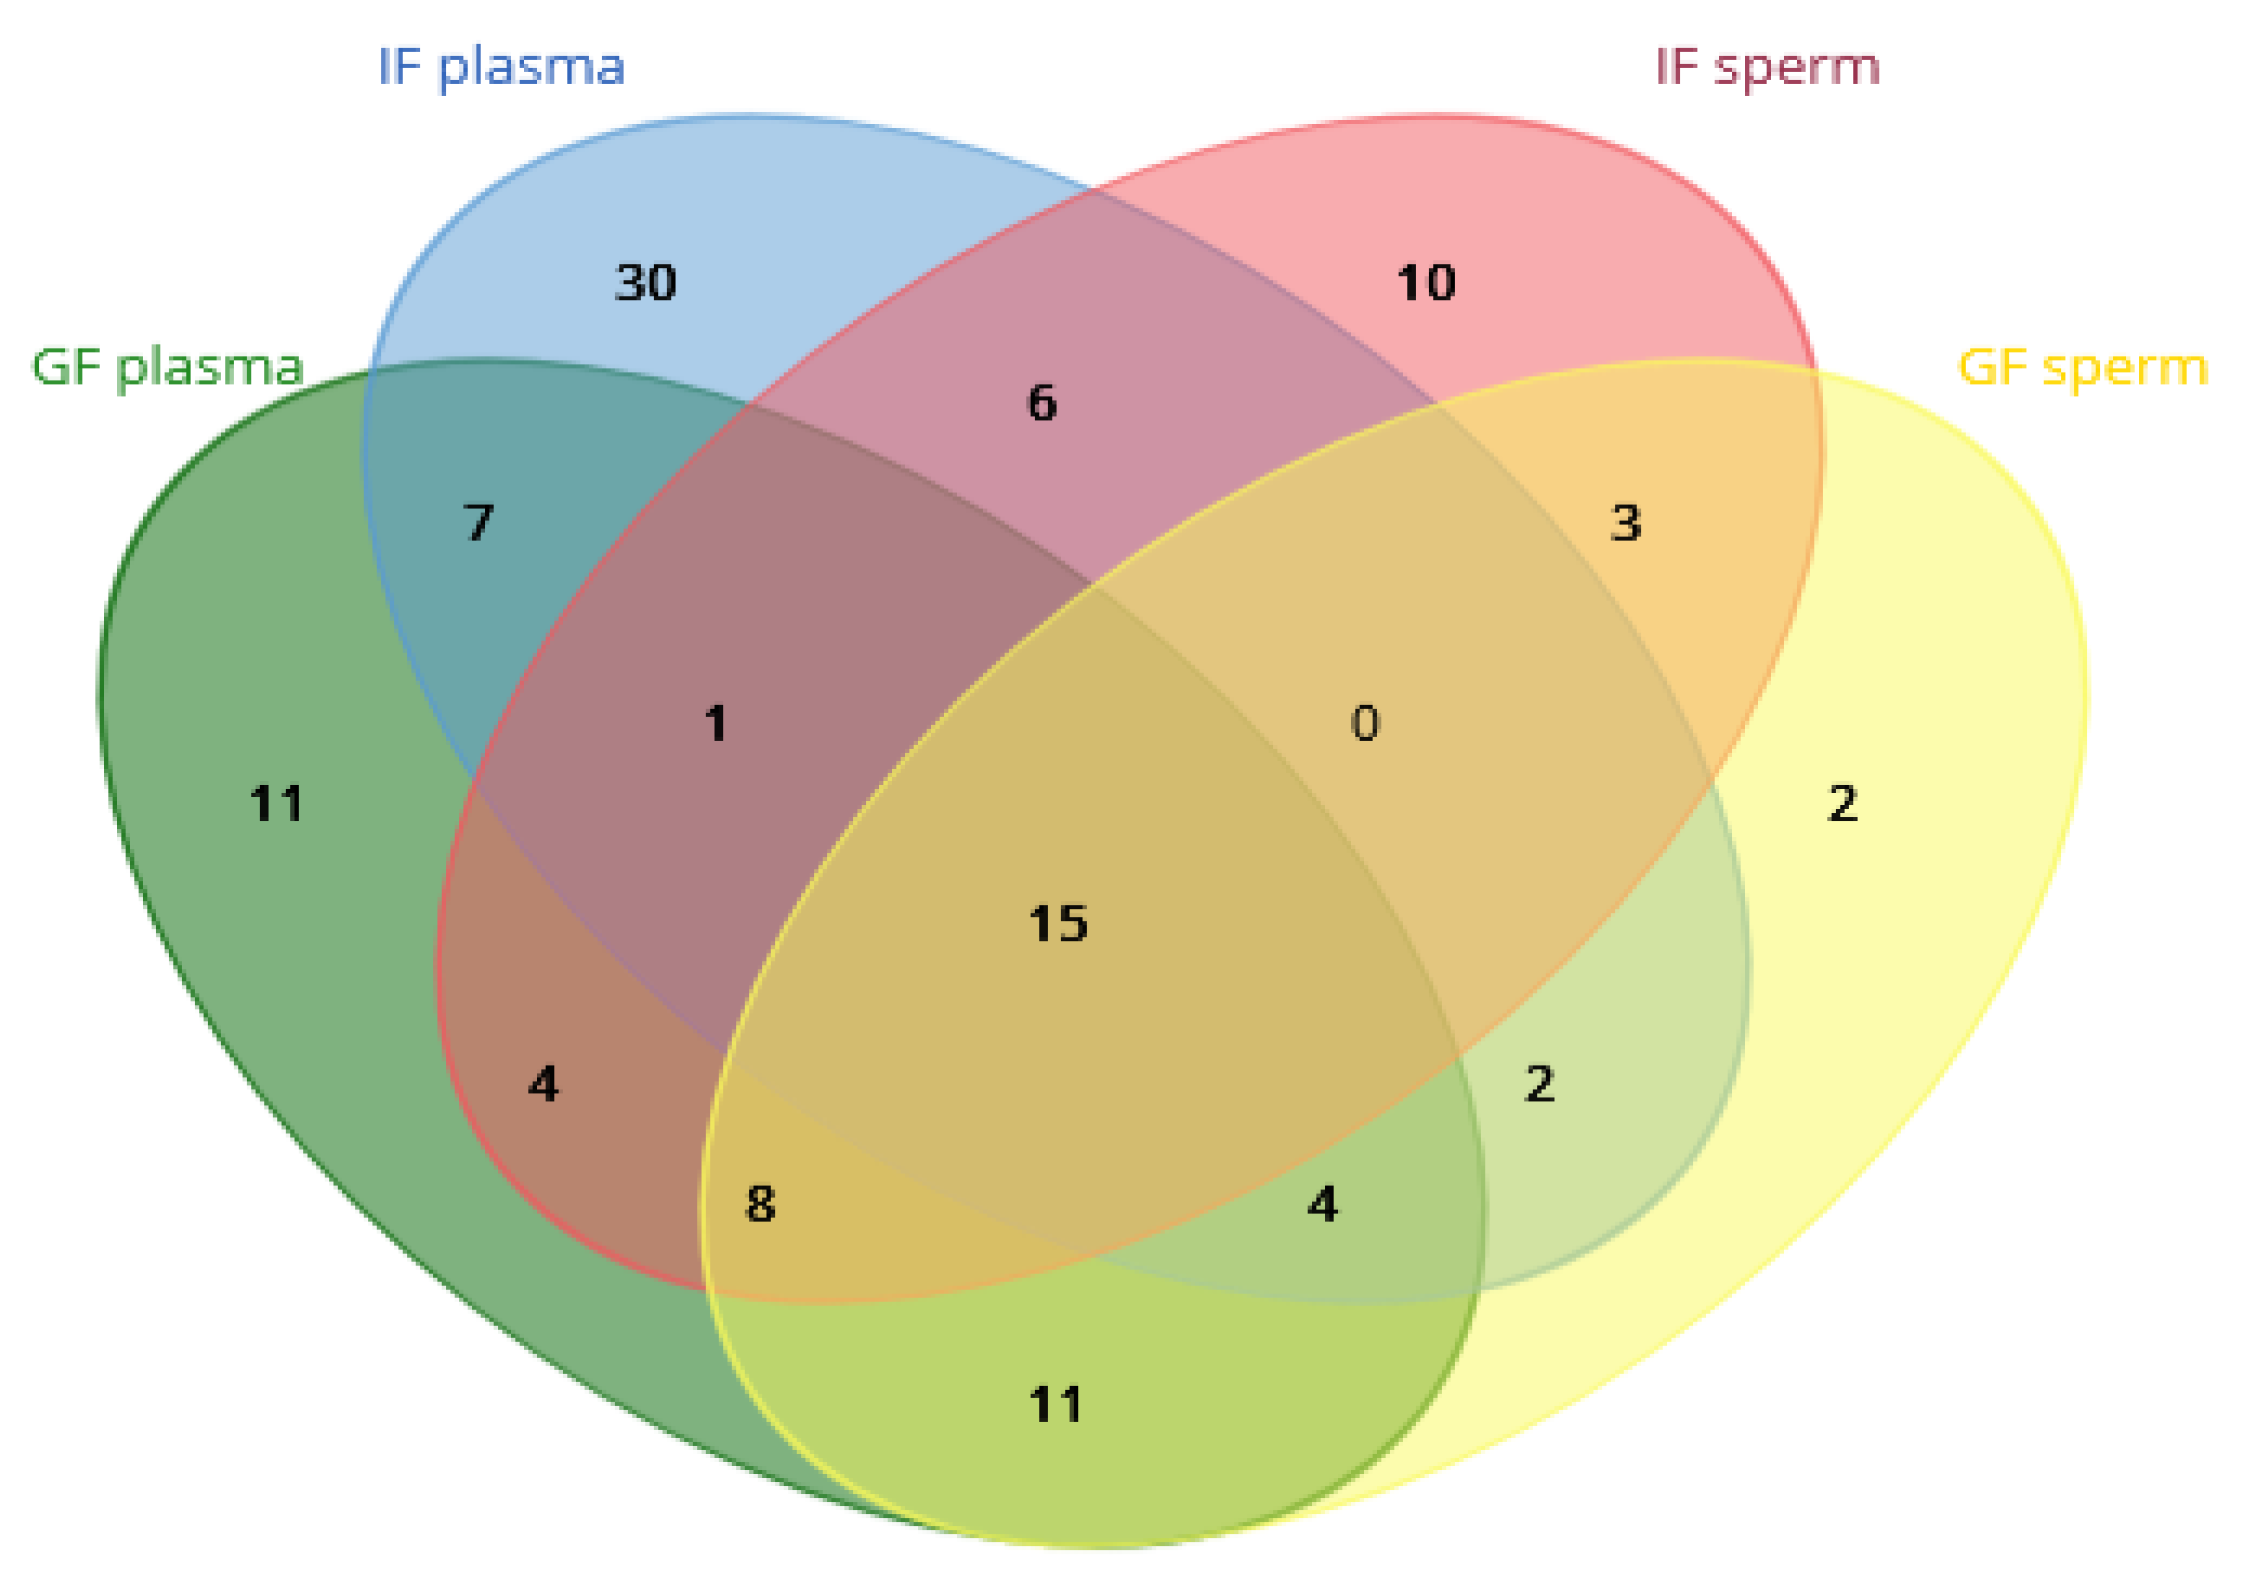
Figure 6.
Classification and comparison of semen proteins from turkey ejaculates with good fertility (GF) and impaired fertility (IF) according to the Gene Ontology term “biological process”.
Figure 6.
Classification and comparison of semen proteins from turkey ejaculates with good fertility (GF) and impaired fertility (IF) according to the Gene Ontology term “biological process”.
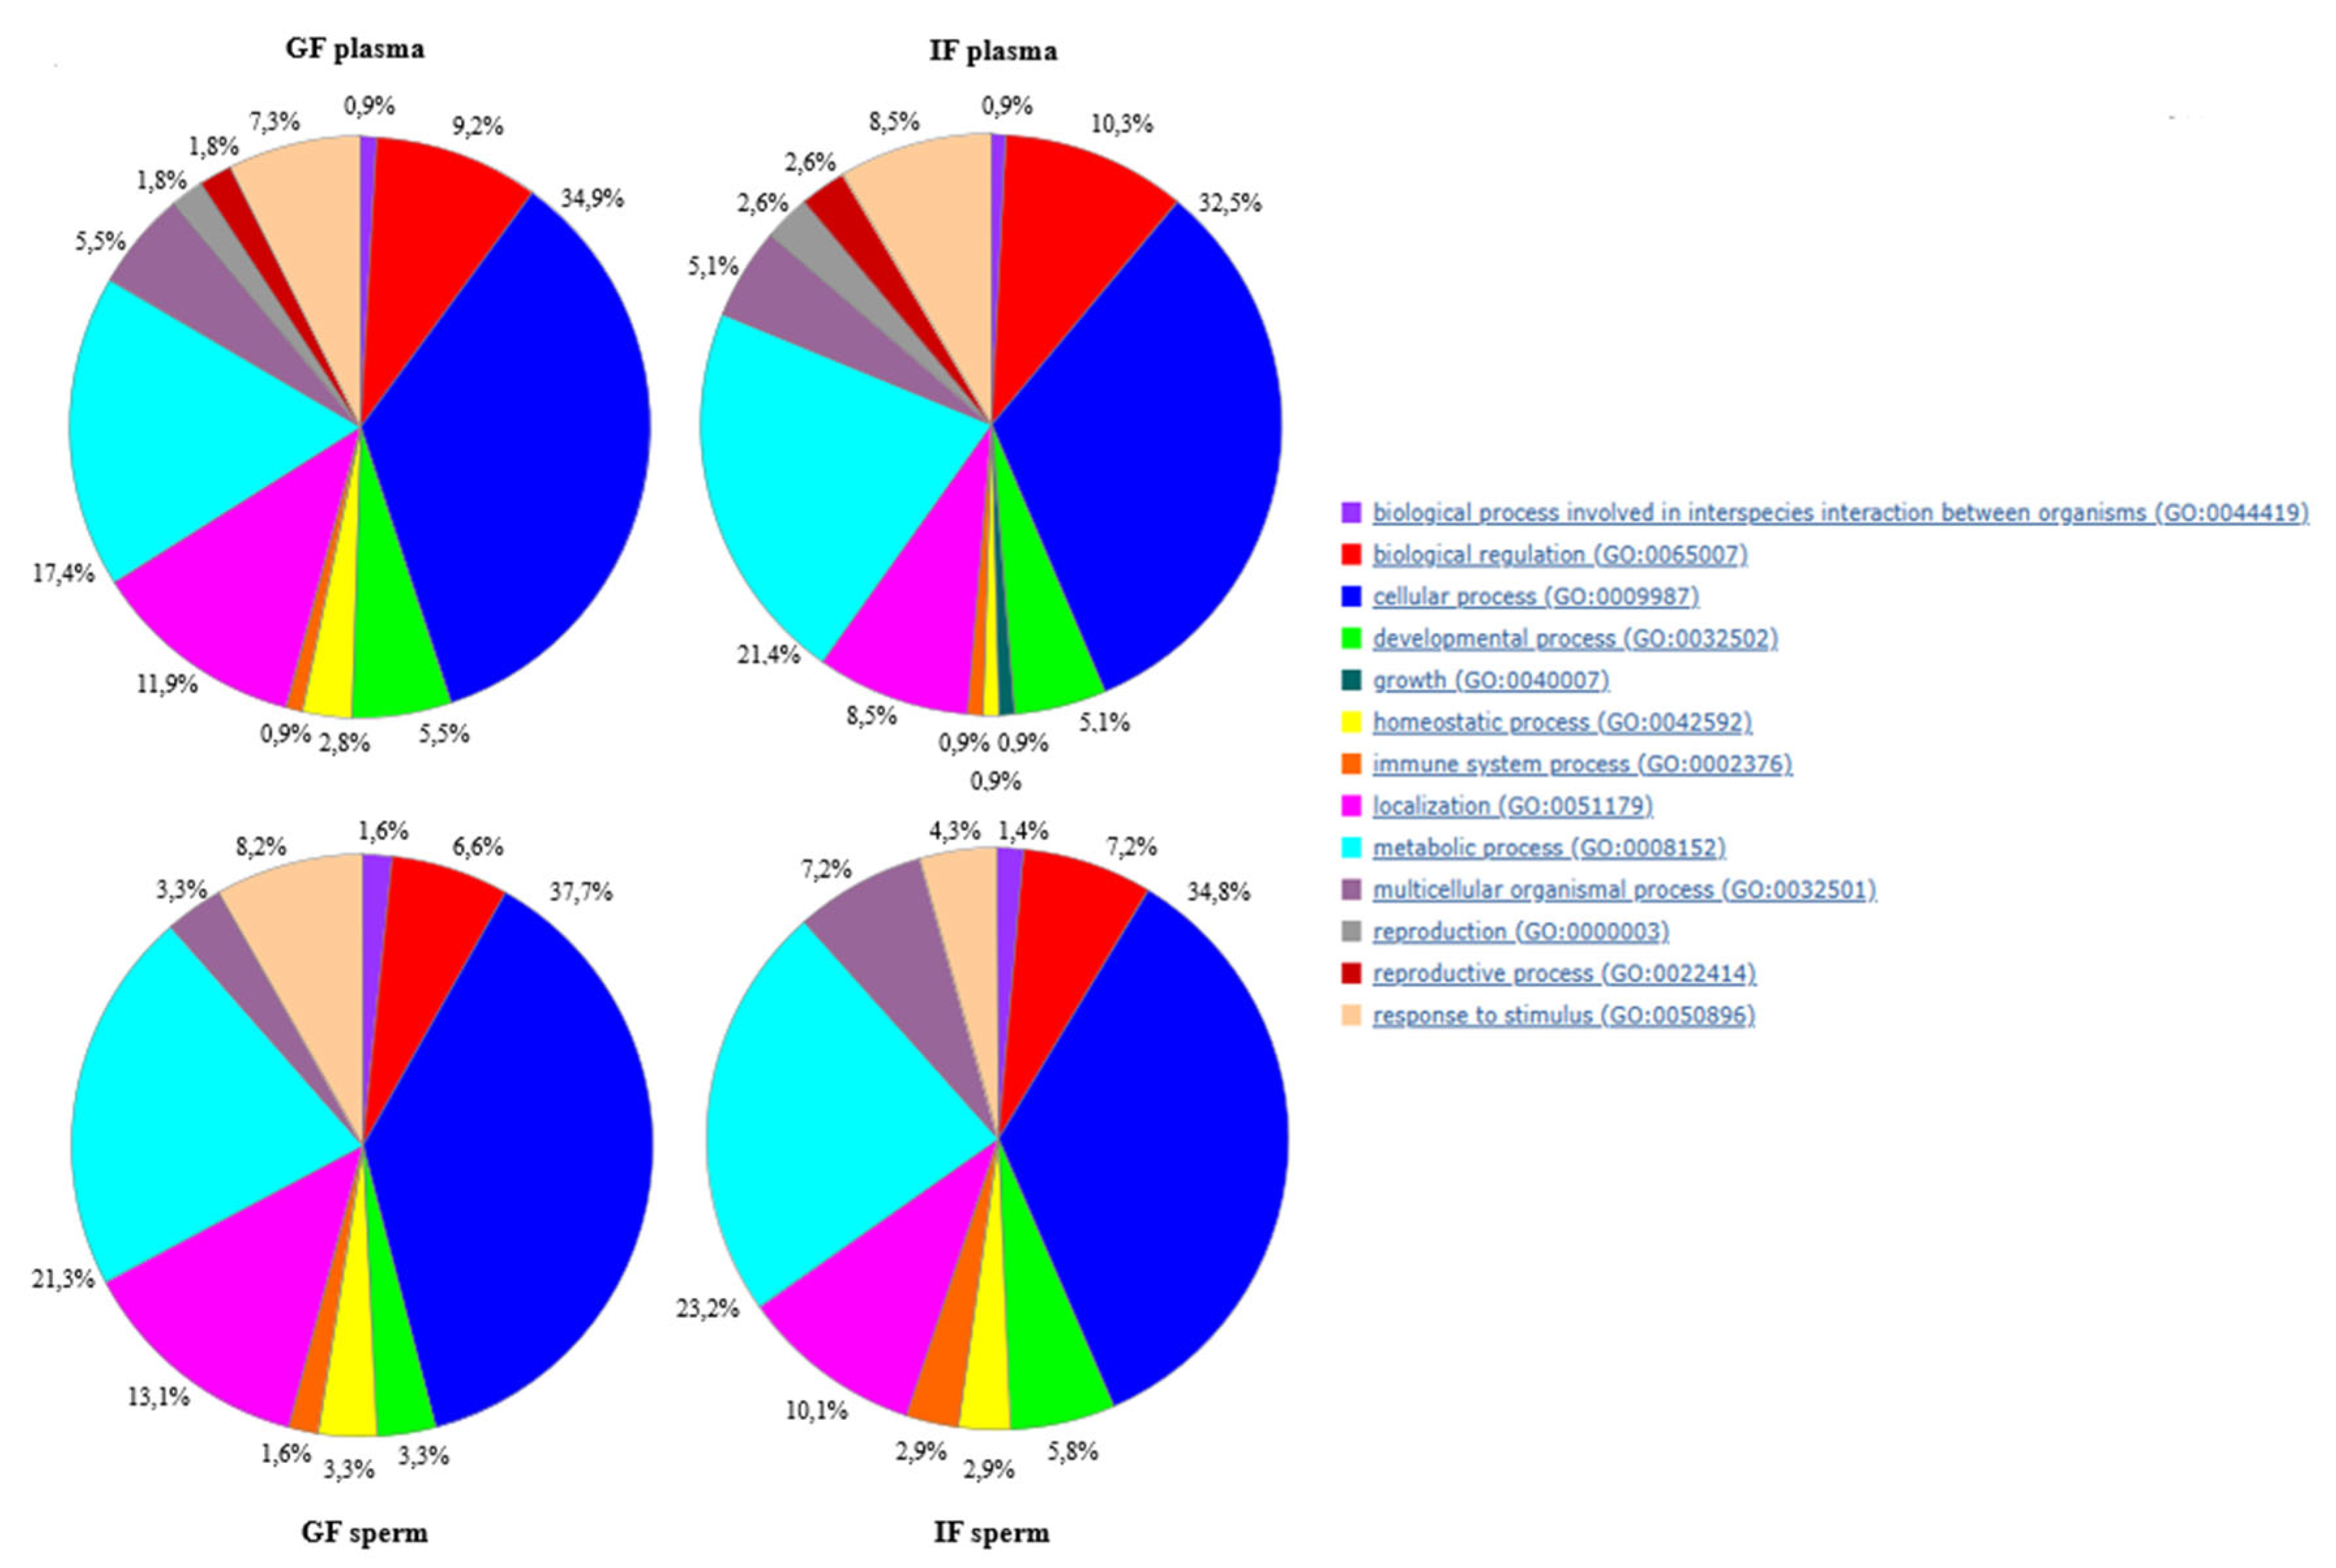

Table 1.
The quality parameters of spermatozoa from turkey ejaculates with good fertility (GF) and impaired fertility (IF).
Table 1.
The quality parameters of spermatozoa from turkey ejaculates with good fertility (GF) and impaired fertility (IF).
| Parameters | GF | IF |
|---|---|---|
| Sperm concentration (x109) | 4.7 ± 1.0* | 5.6 ± 1.7* |
| PMI (%) | 88.4 ± 4.6** | 78.4 ± 6.8** |
| MMP (%) | 79.7 ± 6.2 | 79.9 ± 7.9 |
| NO (%) | 29.3 ± 11.2* | 42.4 ± 19.0* |
| TMOT (%) | 81.2 ± 6.6** | 71.7 ± 8.5** |
| PMOT (%) | 49.7 ± 13.2 | 46.3 ± 24.6 |
| VAP (µm/s) | 74.0 ± 3.7 | 80.3 ± 13.3 |
| VSL (µm/s) | 70.7 ± 5.4 | 73.9 ± 15.0 |
| VCL (µm/s) | 116.8 ± 8.9* | 105.9 ± 14.4* |
| ALH (µm) | 3.59 ± 0.5 | 3.29 ± 0.6 |
| BCF (Hz) | 22.4 ±8.3 | 18.7 ± 6.8 |
| STR (%) | 81.6 ± 6.0** | 90.3 ± 5.3** |
| LIN (%) | 66.7 ± 6.3 | 71.7 ± 8.5 |
Values marked with ** are highly statistically significant (p ≤0.001) and values marked with * are significant (p ≤ 0.05).PMI – plasma membrane integrity, MMP – mitochondrial membrane potential, NO – percentage of sperm generating nitric oxide, TMOT – total motility, PMOT – progressive motility, VAP – average path velocity, VSL – straight line rectilinear velocity, VCL – curvilinear velocity, ALH – amplitude of lateral head displacement, BCF – beat-cross frequency, STR – straightness, LIN – linearity coefficient.
Table 2.
The antioxidant potential of seminal plasma in turkey ejaculates with good fertility (GF) and impaired fertility (IF).
Table 2.
The antioxidant potential of seminal plasma in turkey ejaculates with good fertility (GF) and impaired fertility (IF).
| Parameters | GF | IF |
|---|---|---|
| Total protein (mg/mL) | 7.9 ± 2.0** | 5.6 ± 1.4** |
| SOD activity (U/mL) | 2.4 ± 0.6** | 1.1 ± 0.4** |
| GPx activity (U/mL) | 0.4 ± 0.1** | 0.2 ± 0.1** |
| CAT activity (µM/min/mL) | 14.4 ± 10.3* | 39.2 ± 29.9* |
| GSH (M/mL) | 0.5 ± 0.02** | 0.9 ± 0.03** |
| MDA (µM/mL) | 11.5 ± 11.7** | 28.4 ± 12.2** |
| Zn2+ (mg %) | 151.9 ± 58.9** | 49.7 ± 24.6** |
Values marked with ** are highly statistically significant (p ≤0.001) and values marked with * are significant (p ≤ 0.05). SOD - superoxide dismutase, GPx - glutathione peroxidase, CAT – catalase, GSH – glutathione, MDA – malondialdehyde, Zn2+ - zinc.
Table 3.
The antioxidant potential of spermatozoa from turkey ejaculates with good fertility (GF) and impaired fertility (IF).
Table 3.
The antioxidant potential of spermatozoa from turkey ejaculates with good fertility (GF) and impaired fertility (IF).
| Parameters | GF | IF |
|---|---|---|
| SOD activity (U/mL) | 0.6 ± 0.2** | 1.2 ± 0.5** |
| GPx activity (U/mL) | 0.4 ± 0.1** | 0.2 ± 0.2** |
| CAT activity (µM/min/mL) | 114.3 ± 59.4* | 70.1 ± 44.5* |
| GSH (M/mL) | 0.2 ± 0.08** | 0.1 ± 0.07** |
| MDA (µM/mL) | 6.1 ± 4.3** | 14.8 ± 6.1** |
| Zn2+ (mg %) | 43.6 ± 12.1* | 92.2 ± 64.3* |
Values marked with ** are highly statistically significant (p ≤0.001) and values marked with * are significant (p ≤ 0.05). SOD - superoxide dismutase, GPx - glutathione peroxidase, CAT – catalase, GSH – glutathione, MDA – malondialdehyde, Zn2+ - zinc.
Table 4.
Mean optical density (OD) of turkey seminal plasma fractions selected for protein identification.
Table 4.
Mean optical density (OD) of turkey seminal plasma fractions selected for protein identification.
| Protein [kDa] |
GF | IF |
|---|---|---|
| 107 | 0.28 ± 0.02 | 0.37 ± 0.03 |
| 80 | 0.21 ± 0.01 | 0.23 ± 0.01 |
| 49 | 0.30 ± 0.02 | 0.35 ± 0.01 |
| 41 | 0.45 ± 0.01 | 0.49 ± 0.01 |
| 29 | 0.30 ± 0.03 | 0.41 ± 0.02 |
| 26 | 0.28 ± 0.01 | 0.19 ± 0.02 |
| 25 | 0.39 ± 0.01 | 0.33 ± 0.01 |
| 18 | 0.35 ± 0.03 | 0.29 ± 0.04 |
| 16 | 0.27 ± 0.02 | 0.25 ± 0.02 |
| 12 | 0.17 ± 0.01 | 0.20 ± 0.01 |
GF – good fertility, IF – impaired fertility.
Table 5.
Mean optical density (OD) of turkey spermatozoa fractions selected for protein identification.
Table 5.
Mean optical density (OD) of turkey spermatozoa fractions selected for protein identification.
| Protein [kDa] |
GF | IF |
|---|---|---|
| 107 | 0.17 ± 0.03 | 0.24 ± 0.01 |
| 52 | 0.16 ± 0.01 | 0.19 ± 0.01 |
| 49 | 0.45 ± 0.03 | 0.68 ± 0.01 |
| 41 | 0.33 ± 0.02 | 0.59 ± 0.01 |
| 29 | 0.17 ± 0.01 | 0.29 ± 0.03 |
| 25 | 0.22 ± 0.01 | 0.19 ± 0.01 |
| 18 | 0.18 ± 0.02 | 0.16 ± 0.02 |
| 16 | 0.20 ± 0.01 | 0.26 ± 0.02 |
GF – good fertility, IF – impaired fertility.
Table 6.
Proteins identified by SDS-PAGE and nano LC-MS/MS in seminal plasma derived from good fertility (GF) ejaculates.
Table 6.
Proteins identified by SDS-PAGE and nano LC-MS/MS in seminal plasma derived from good fertility (GF) ejaculates.
| Molecular weight [kDa] |
Identified protein | Gene | Species | Molecular weight (Mascot) [Da] |
No. of matched peptides | Sequence coverage [%] |
Score |
| 26 | Albumin | ALB | Gallus gallus | 71868 | 20 | 31 | 974 |
| Phosphoglycerate mutase 1 | PGAM1 | Gallus gallus | 29051 | 16 | 24 | 807 | |
| Creatine kinase B-type | CKB | Gallus gallus | 43129 | 13 | 17 | 681 | |
| Acrosin | ACR | Meleagris gallopavo | 38724 | 12 | 16 | 589 | |
| 14-3-3 protein zeta | YWHAZ | Gallus gallus | 27929 | 13 | 13 | 561 | |
| 14-3-3 protein theta | YWHAQ | Gallus gallus | 28050 | 10 | 10 | 436 | |
| Astacin-like metalloendopeptidase | ASTL | Gallus gallus | 46929 | 12 | 9 | 404 | |
| 14-3-3 protein epsilon | YWHAE | Gallus gallus | 29326 | 8 | 9 | 400 | |
| Gelsolin | GSN | Gallus gallus | 86120 | 8 | 8 | 369 | |
| Peroxiredoxin-6 | PRDX6 | Gallus gallus | 25075 | 12 | 7 | 351 | |
| Sulfhydryl oxidase 1 | QSOX1 | Gallus gallus | 83939 | 8 | 11 | 312 | |
| Clusterin | CLU | Coturnix japonica | 52395 | 3 | 8 | 266 | |
| Hydroxyacylglutathione hydrolase, mitochondrial | HAGH | Gallus gallus | 34545 | 5 | 6 | 235 | |
| 14-3-3 protein gamma | YWHAG | Gallus gallus | 28384 | 4 | 6 | 209 | |
| SPARC protein | SPARC | Gallus gallus | 34894 | 3 | 5 | 164 | |
| Ovotransferrin | TF | Gallus gallus | 79551 | 3 | 5 | 161 | |
| 14-3-3 protein beta/alpha | YWHAB | Gallus gallus | 28004 | 3 | 4 | 131 | |
| Collagen alpha-1(XII) chain | COL12A1 | Gallus gallus | 341740 | 3 | 3 | 121 | |
| Tubulin beta-3 chain | TBB3 | Gallus gallus | 50285 | 5 | 2 | 120 | |
| Tubulin beta-7 chain | TBB7 | Gallus gallus | 50095 | 5 | 2 | 120 | |
| Glyceraldehyde-3-phosphate dehydrogenase | GAPDH | Gallus gallus | 35909 | 2 | 1 | 96 | |
| 1-phosphatidylinositol 4,5-bisphosphate phosphodiesterase zeta-1 | PLCZ1 | Gallus gallus | 73285 | 2 | 1 | 94 | |
|
25 25 |
Albumin | ALB | Gallus gallus | 71868 | 24 | 38 | 1123 |
| Acrosin | ACR | Meleagris gallopavo | 38724 | 12 | 27 | 748 | |
| Creatine kinase B-type | CKB | Gallus gallus | 43129 | 14 | 21 | 670 | |
| Triosephosphate isomerase | TPI1 | Gallus gallus | 26832 | 11 | 18 | 499 | |
| Actin, cytoplasmic 2 | ACTG1 | Gallus gallus | 42108 | 9 | 13 | 394 | |
| Actin, cytoplasmic type 5 | ACT5 | Gallus gallus | 42151 | 9 | 13 | 394 | |
| Ras-related protein Rab-5B | RAB5B | Gallus gallus | 23828 | 8 | 10 | 323 | |
| Ras-related protein Rab-5C | RAB5C | Gallus gallus | 23767 | 8 | 9 | 304 | |
| Clusterin | CLU | Coturnix japonica | 52395 | 4 | 9 | 300 | |
| Peroxiredoxin-6 | PRDX6 | Gallus gallus | 25075 | 9 | 12 | 272 | |
| Ras-related protein Rab-10 | RAB10 | Gallus gallus | 22763 | 6 | 11 | 257 | |
| Phosphoglycerate mutase 1 | PGAM1 | Gallus gallus | 29051 | 5 | 8 | 252 | |
| Sulfhydryl oxidase 1 | QSOX1 | Gallus gallus | 83939 | 4 | 9 | 202 | |
| Collagen alpha-1(XII) chain | COL12A1 | Gallus gallus | 341740 | 5 | 9 | 200 | |
| Apolipoprotein A-I | APOA1 | Gallus gallus | 30661 | 9 | 6 | 196 | |
| Tubulin alpha-1 chain | TUBA1 | Gallus gallus | 46385 | 5 | 5 | 194 | |
| 14-3-3 protein zeta | YWHAZ | Gallus gallus | 27929 | 4 | 8 | 168 | |
| Mitochondria-eating protein | SPATA18 | Gallus gallus | 54997 | 2 | 9 | 166 | |
| Astacin-like metalloendopeptidase | ASTL | Gallus gallus | 46929 | 4 | 9 | 160 | |
| Ferritin heavy chain | FTH | Gallus gallus | 21249 | 5 | 8 | 159 | |
| Hypoxanthine-guanine phosphoribosyltransferase | HPRT1 | Gallus gallus | 24878 | 3 | 7 | 146 | |
| Carbonic anhydrase 2 | CA2 | Gallus gallus | 29388 | 3 | 6 | 134 | |
| Translin | TSN | Gallus gallus | 26002 | 2 | 11 | 132 | |
| Hydroxyacylglutathione hydrolase, mitochondrial | HAGH | Gallus gallus | 34545 | 2 | 5 | 123 | |
| Glyceraldehyde-3-phosphate dehydrogenase | GAPDH | Gallus gallus | 35909 | 2 | 4 | 122 | |
| Adenylate kinase isoenzyme 1 | AK1 | Gallus gallus | 21783 | 2 | 4 | 106 | |
| Tubulin beta-1 chain | TBB1 | Gallus gallus | 50333 | 3 | 3 | 102 | |
| Tubulin beta-2 chain | TBB2 | Gallus gallus | 50377 | 3 | 3 | 102 | |
| Tubulin beta-3 chain | TBB3 | Gallus gallus | 50285 | 3 | 3 | 102 | |
| Tubulin beta-4 chain | TBB4 | Gallus gallus | 50844 | 3 | 3 | 102 | |
| Tubulin beta-5 chain | TBB5 | Gallus gallus | 50395 | 3 | 3 | 102 | |
| Tubulin beta-6 chain | TBB6 | Gallus gallus | 50692 | 3 | 3 | 102 | |
| Tubulin beta-7 chain | TBB7 | Gallus gallus | 50095 | 3 | 3 | 102 | |
| Protein-L-isoaspartate(D-aspartate) O-methyltransferase | PCMT1 | Gallus gallus | 24790 | 1 | 1 | 100 | |
|
18
18 |
Albumin | ALB | Gallus gallus | 71868 | 20 | 45 | 1810 |
| Tubulin beta-3 chain | TBB3 | Gallus gallus | 50285 | 21 | 37 | 1507 | |
| Creatine kinase B-type | CKB | Gallus gallus | 43129 | 19 | 32 | 1321 | |
| Tubulin beta-5 chain | TBB5 | Gallus gallus | 50395 | 15 | 23 | 1232 | |
| Acrosin | ACR | Meleagris gallopavo | 38724 | 12 | 19 | 917 | |
| Tubulin beta-4 chain | TBB4 | Gallus gallus | 50844 | 10 | 17 | 799 | |
| Creatine kinase S-type, mitochondrial | CKMT2 | Gallus gallus | 47510 | 9 | 15 | 687 | |
| Voltage-dependent anion-selective channel protein 2 | VDAC2 | Meleagris gallopavo | 30162 | 9 | 14 | 545 | |
| Tubulin alpha-4 chain | TBA4 | Gallus gallus | 36483 | 9 | 12 | 465 | |
| Cytochrome b-c1 complex subunit Rieske, mitochondrial | UQCRFS1 | Gallus gallus | 29710 | 7 | 11 | 395 | |
| Cilia- and flagella-associated protein 20 | CFAP20 | Gallus gallus | 22891 | 6 | 11 | 298 | |
| Ubiquitin-ribosomal protein eS31 fusion protein | RPS27A | Gallus gallus | 18310 | 6 | 9 | 237 | |
| Polyubiquitin-B | UBB | Gallus gallus | 34348 | 6 | 9 | 237 | |
| Ferritin heavy chain | FTH | Gallus gallus | 21249 | 5 | 8 | 199 | |
| Succinate dehydrogenase [ubiquinone] iron-sulphur subunit | SDHB | Gallus gallus | 33374 | 5 | 5 | 194 | |
| Retinol-binding protein 4 | RBP4 | Gallus gallus | 22843 | 4 | 4 | 162 | |
| Lysozyme g | LYZ | Gallus gallus | 23565 | 3 | 4 | 132 | |
| Ovotransferrin | TF | Gallus gallus | 79551 | 3 | 3 | 101 | |
| Zona pellucida-binding protein 1 | ZPBP1 | Gallus gallus | 36910 | 4 | 2 | 99 | |
| T-complex protein 1 subunit theta | CCT8 | Gallus gallus | 60017 | 2 | 1 | 94 | |
|
16 16 |
Albumin | ALB | Gallus gallus | 71868 | 52 | 60 | 1967 |
| Ovotransferrin | TF | Gallus gallus | 79551 | 21 | 45 | 891 | |
| Creatine kinase B-type | CKB | Gallus gallus | 43129 | 18 | 44 | 881 | |
| Acrosin | ACR | Meleagris gallopavo | 38724 | 15 | 43 | 594 | |
| Astacin-like metalloendopeptidase | ASTL | Gallus gallus | 46929 | 15 | 41 | 519 | |
| Gelsolin | GSN | Gallus gallus | 86120 | 10 | 39 | 431 | |
| Sulfhydryl oxidase 1 | QSOX1 | Gallus gallus | 83939 | 12 | 34 | 405 | |
| Ferritin heavy chain | FTH | Gallus gallus | 21249 | 16 | 27 | 397 | |
| Tubulin beta-4 chain | TBB4 | Gallus gallus | 50844 | 15 | 24 | 382 | |
| Apolipoprotein A-I | APOA1 | Gallus gallus | 30661 | 14 | 18 | 358 | |
| Tubulin beta-5 chain | TBB5 | Gallus gallus | 50395 | 12 | 15 | 308 | |
| 1-phosphatidylinositol 4,5-bisphosphate phosphodiesterase zeta-1 | PLCZ1 | Gallus gallus | 73285 | 7 | 14 | 252 | |
| Peptidyl-prolyl cis-trans isomerase B | PPIB | Gallus gallus | 22456 | 7 | 11 | 232 | |
| Transthyretin | TTR | Gallus gallus | 16356 | 7 | 13 | 204 | |
| Heat shock protein HSP 90-alpha | HSP90AA1 | Gallus gallus | 84406 | 6 | 10 | 192 | |
| Heat shock cognate 71 kDa protein | HSPA8 | Gallus gallus | 71011 | 6 | 9 | 187 | |
| Proteasome subunit beta type-5 | PSMB5 | Gallus gallus | 27256 | 4 | 7 | 159 | |
| Collagen alpha-1(XII) chain | COL12A1 | Gallus gallus | 341740 | 3 | 7 | 156 | |
| Heat shock 70 kDa protein | HSP70 | Gallus gallus | 69936 | 6 | 5 | 172 | |
| Actin, cytoplasmic 1 | ACTB | Gallus gallus | 42052 | 2 | 2 | 116 | |
| Actin, cytoplasmic 2 | ACTG2 | Gallus gallus | 42108 | 2 | 2 | 116 | |
| Actin, cytoplasmic type 5 | ACT5 | Gallus gallus | 42151 | 2 | 2 | 116 | |
| Glyceraldehyde-3-phosphate dehydrogenase | GAPDH | Gallus gallus | 35909 | 2 | 3 | 104 | |
| Peroxiredoxin-6 | PRDX6 | Gallus gallus | 25075 | 4 | 2 | 100 |
Table 7.
Proteins identified by SDS-PAGE and nano LC-MS/MS in seminal plasma derived from impaired fertility (IF) ejaculates.
Table 7.
Proteins identified by SDS-PAGE and nano LC-MS/MS in seminal plasma derived from impaired fertility (IF) ejaculates.
| Molecular weight [kDa] |
Identified protein | Gene | Species | Molecular weight (Mascot) [Da] |
No. of matched peptides | Sequence coverage [%] |
Score |
| 107 | Albumin | ALB | Gallus gallus | 71868 | 39 | 41 | 1575 |
| Aminopeptidase Ey | ANPEP | Gallus gallus | 109406 | 38 | 35 | 1555 | |
| Collagen alpha-1(XII) chain | COL12A1 | Gallus gallus | 341740 | 27 | 32 | 1057 | |
| Alpha-enolase | ENO1 | Gallus gallus | 47617 | 23 | 31 | 870 | |
| Aspartate aminotransferase, cytoplasmic | GOT1 | Gallus gallus | 46134 | 12 | 19 | 556 | |
| Creatine kinase B-type | CKB | Gallus gallus | 43129 | 8 | 12 | 440 | |
| Clusterin | CLU | Coturnix japonica | 52395 | 4 | 9 | 275 | |
| L-lactate dehydrogenase B | LDHB | Gallus gallus | 36694 | 8 | 4 | 265 | |
| Ovotransferrin | TF | Gallus gallus | 79551 | 5 | 6 | 259 | |
| NEL protein | NEL | Gallus gallus | 96096 | 5 | 5 | 246 | |
| Ovotransferrin | TF | Gallus gallus | 79551 | 6 | 4 | 236 | |
| Gelsolin | GSN | Gallus gallus | 86120 | 5 | 4 | 234 | |
| Heat shock cognate 71 kDa protein | HSPA8 | Gallus gallus | 71011 | 6 | 3 | 224 | |
| Astacin-like metalloendopeptidase | ASTL | Gallus gallus | 46929 | 5 | 3 | 217 | |
| Fibrinogen beta chain | FGB | Gallus gallus | 53272 | 4 | 3 | 194 | |
| Transforming growth factor beta-2 proprotein | TGFB2 | Gallus gallus | 48431 | 3 | 8 | 182 | |
| Neuronal growth regulator 1 | NEGR1 | Gallus gallus | 38434 | 4 | 2 | 179 | |
| Nucleoside diphosphate kinase | NDK | Gallus gallus | 17448 | 2 | 2 | 137 | |
| Translin | TSN | Gallus gallus | 26002 | 7 | 1 | 131 | |
| Acrosin | ACR | Meleagris gallopavo | 38724 | 2 | 2 | 91 | |
| Lysosome-associated membrane glycoprotein 1 | LAMP1 | Gallus gallus | 45097 | 2 | 2 | 91 | |
|
80 80 |
Albumin | ALB | Gallus gallus | 71868 | 32 | 39 | 1384 |
| Collagen alpha-1(XII) chain | COL12A1 | Gallus gallus | 341740 | 17 | 22 | 677 | |
| Cytoplasmic aconitate hydratase | ACO1 | Gallus gallus | 98639 | 11 | 18 | 551 | |
| Heat shock protein HSP 90-alpha | HSP90AA1 | Gallus gallus | 84406 | 13 | 17 | 455 | |
| Creatine kinase B-type | CKB | Gallus gallus | 43129 | 8 | 12 | 387 | |
| Elongation factor 2 | EEF2 | Gallus gallus | 96343 | 10 | 9 | 358 | |
| Alpha-actinin-4 | ACTN4 | Gallus gallus | 104712 | 8 | 8 | 323 | |
| Endoplasmin | HSP90B1 | Gallus gallus | 91726 | 9 | 8 | 305 | |
| Sulfhydryl oxidase 1 | QSOX1 | Gallus gallus | 83939 | 8 | 6 | 299 | |
| Ovotransferrin | TF | Gallus gallus | 79551 | 7 | 5 | 271 | |
| Acrosin | ACR | Meleagris gallopavo | 38724 | 3 | 5 | 226 | |
| Ubiquitin-ribosomal protein eS31 fusion protein | RPS27A | Gallus gallus | 18310 | 2 | 3 | 128 | |
| Polyubiquitin-B | UBB | Gallus gallus | 34348 | 2 | 3 | 128 | |
| Laminin subunit beta-1 | LAMB1 | Gallus gallus | 35775 | 1 | 1 | 95 | |
| 49 | Alpha-enolase | ENO1 | Gallus gallus | 47617 | 68 | 42 | 2660 |
| Albumin | ALB | Gallus gallus | 71868 | 32 | 31 | 1497 | |
| Creatine kinase B-type | CKB | Gallus gallus | 43129 | 27 | 28 | 1082 | |
| Gamma-enolase | ENO2 | Gallus gallus | 47621 | 17 | 23 | 777 | |
| Tubulin alpha-1 chain | TUBA1 | Gallus gallus | 46385 | 18 | 17 | 674 | |
| Tubulin beta-4 chain | TBB4 | Gallus gallus | 50844 | 15 | 16 | 563 | |
| Tubulin beta-5 chain | TBB5 | Gallus gallus | 50395 | 15 | 16 | 494 | |
| ATP synthase subunit beta, mitochondrial | ATP5B | Gallus gallus | 56650 | 15 | 10 | 488 | |
| Tubulin alpha-5 chain | TBA5 | Gallus gallus | 50715 | 10 | 12 | 446 | |
| Ovotransferrin | TF | Gallus gallus | 79551 | 8 | 11 | 404 | |
| Elongation factor 1-alpha | EEF1A | Gallus gallus | 50467 | 10 | 9 | 285 | |
| Eukaryotic initiation factor 4A-II | EIF4A2 | Gallus gallus | 46570 | 6 | 8 | 225 | |
| Bleomycin hydrolase | BLMH | Gallus gallus | 53397 | 5 | 7 | 221 | |
| Na(+)/H(+) exchange regulatory cofactor NHE-RF1 | NHERF1 | Gallus gallus | 36011 | 6 | 4 | 201 | |
| Ubiquitin-ribosomal protein eS31 fusion protein | RPS27A | Gallus gallus | 18310 | 2 | 3 | 139 | |
| Polyubiquitin-B | UBB | Gallus gallus | 34348 | 2 | 3 | 139 | |
| Sulfhydryl oxidase 1 | QSOX1 | Gallus gallus | 83939 | 2 | 2 | 117 | |
| Lissencephaly-1 homolog | PAFAH1B1 | Gallus gallus | 47204 | 2 | 2 | 114 | |
| Neuroserpin | SERPINI1 | Gallus gallus | 46556 | 3 | 1 | 109 | |
| 41 | Transthyretin | TTR | Gallus gallus | 16356 | 24 | 32 | 878 |
| Albumin | ALB | Gallus gallus | 71868 | 7 | 23 | 327 | |
| Acrosin | ACR | Meleagris gallopavo | 38724 | 3 | 15 | 279 | |
| Beta-2-microglobulin | B2M | Meleagris gallopavo | 11225 | 5 | 13 | 268 | |
| Fatty acid-binding protein, brain | FABP7 | Gallus gallus | 15031 | 6 | 11 | 255 | |
| Sulfhydryl oxidase 1 | QSOX1 | Gallus gallus | 83939 | 3 | 9 | 140 | |
|
29 29 |
Albumin | ALB | Gallus gallus | 71868 | 22 | 29 | 1009 |
| Sulfhydryl oxidase 1 | QSOX1 | Gallus gallus | 83939 | 22 | 25 | 844 | |
| Astacin-like metalloendopeptidase | ASTL | Gallus gallus | 46929 | 17 | 22 | 575 | |
| Creatine kinase B-type | CKB | Gallus gallus | 43129 | 11 | 18 | 566 | |
| Albumin | ALB | Gallus gallus | 71868 | 13 | 16 | 543 | |
| Acrosin | ACR | Meleagris gallopavo | 38724 | 12 | 15 | 434 | |
| Transthyretin | TTR | Gallus gallus | 16356 | 10 | 15 | 406 | |
| Ovotransferrin | TF | Gallus gallus | 79551 | 7 | 14 | 343 | |
| Heat shock protein HSP 90-alpha | HSP90AA1 | Gallus gallus | 84406 | 9 | 13 | 331 | |
| Acrosin | ACR | Meleagris gallopavo | 38724 | 5 | 13 | 324 | |
| L-lactate dehydrogenase B chain | LDHB | Gallus gallus | 36694 | 8 | 11 | 323 | |
| Clusterin | CLU | Coturnix japonica | 52395 | 5 | 11 | 301 | |
| Voltage-dependent anion-selective channel protein 2 | VDAC2 | Meleagris gallopavo | 30162 | 5 | 10 | 288 | |
| Annexin A2 | ANXA2 | Gallus gallus | 38901 | 5 | 9 | 263 | |
| Annexin A5 | ANXA5 | Gallus gallus | 36290 | 7 | 8 | 248 | |
| SPARC protein | SPARC | Gallus gallus | 34894 | 4 | 7 | 192 | |
| Golgi apparatus protein 1 | GLG1 | Gallus gallus | 133560 | 4 | 6 | 189 | |
| Glyceraldehyde-3-phosphate dehydrogenase | GAPDH | Gallus gallus | 35909 | 3 | 6 | 177 | |
| Transthyretin | TTR | Gallus gallus | 16356 | 3 | 6 | 173 | |
| Malate dehydrogenase, cytoplasmic | MDH1 | Gallus gallus | 36748 | 4 | 5 | 169 | |
| T-complex protein 1 subunit theta | CCT8 | Gallus gallus | 60017 | 2 | 5 | 157 | |
| 14-3-3 protein zeta | YWHAZ | Gallus gallus | 27929 | 3 | 4 | 129 | |
| L-lactate dehydrogenase A chain | LDHA | Gallus gallus | 36776 | 2 | 4 | 126 | |
| 1-phosphatidylinositol 4,5-bisphosphate phosphodiesterase zeta-1 | PLCZ1 | Gallus gallus | 73285 | 2 | 3 | 110 | |
| 14-3-3 protein gamma | YWHAG | Gallus gallus | 28384 | 2 | 3 | 101 | |
| Receptor-type tyrosine-protein phosphatase gamma | PTPRG | Gallus gallus | 160750 | 2 | 3 | 98 | |
|
12 12 |
Albumin | ALB | Gallus gallus | 71868 | 14 | 21 | 799 |
| Acrosin | ACR | Meleagris gallopavo | 38724 | 11 | 22 | 608 | |
| Creatine kinase B-type | CKB | Gallus gallus | 43129 | 10 | 18 | 425 | |
| Tubulin beta-4 chain | TBB4 | Gallus gallus | 50844 | 10 | 16 | 296 | |
| Beta-2-microglobulin | B2M | Meleagris gallopavo | 11225 | 6 | 13 | 282 | |
| Fatty acid-binding protein, brain | FABP7 | Gallus gallus | 15031 | 5 | 11 | 280 | |
| Cystatin | CYT | Gallus gallus | 15562 | 8 | 16 | 268 | |
| Ras-related protein Rab-2A | RAB2A | Gallus gallus | 23678 | 4 | 12 | 240 | |
| Tubulin beta-5 chain | TBB5 | Gallus gallus | 50395 | 8 | 12 | 236 | |
| Lysozyme C | LYZ | Gallus gallus | 16741 | 2 | 11 | 226 | |
| Astacin-like metalloendopeptidase | ASTL | Gallus gallus | 46929 | 6 | 10 | 222 | |
| Vesicle-trafficking protein SEC22b | SEC22B | Gallus gallus | 24873 | 4 | 8 | 188 | |
| Ovotransferrin | TF | Gallus gallus | 79551 | 3 | 6 | 165 | |
| Transthyretin | TTR | Gallus gallus | 16356 | 3 | 5 | 145 | |
| Gelsolin | GSN | Gallus gallus | 86120 | 3 | 4 | 145 | |
| Cytochrome c | CYC | Gallus gallus | 11817 | 4 | 3 | 142 | |
| Apolipoprotein A-I | APOA1 | Gallus gallus | 30661 | 5 | 3 | 130 | |
| Ig lambda chain C region | LAC | Gallus gallus | 11525 | 2 | 2 | 115 | |
| Prosaposin | PSAP | Gallus gallus | 59444 | 2 | 1 | 106 | |
| Glyceraldehyde-3-phosphate dehydrogenase | GAPDH | Gallus gallus | 35909 | 2 | 1 | 98 |
Table 8.
Proteins identified by SDS-PAGE and nano LC-MS/MS in spermatozoa derived from good fertility (GF) ejaculates.
Table 8.
Proteins identified by SDS-PAGE and nano LC-MS/MS in spermatozoa derived from good fertility (GF) ejaculates.
| Molecular weight [kDa] |
Identified protein | Gene | Species | Molecular weight (Mascot) [Da] |
No. of matched peptides | Sequence coverage [%] |
Score |
| 25 | Albumin | ALB | Gallus gallus | 71868 | 21 | 41 | 1067 |
| Peroxiredoxin-6 | PRDX6 | Gallus gallus | 25075 | 19 | 32 | 1024 | |
| Acrosin | ACR | Meleagris gallopavo | 38724 | 17 | 26 | 950 | |
| Creatine kinase B-type | CKB | Gallus gallus | 43129 | 16 | 24 | 913 | |
| Astacin-like metalloendopeptidase | ASTL | Gallus gallus | 46929 | 14 | 27 | 888 | |
| Triosephosphate isomerase | TPI1 | Gallus gallus | 26832 | 17 | 18 | 807 | |
| Phosphoglycerate mutase 1 | PGAM1 | Gallus gallus | 29051 | 15 | 18 | 767 | |
| Sulfhydryl oxidase 1 | QSOX1 | Gallus gallus | 83939 | 14 | 19 | 702 | |
| Carbonic anhydrase 2 | CA2 | Gallus gallus | 29388 | 13 | 16 | 634 | |
| Clusterin | CLU | Coturnix japonica | 52395 | 13 | 19 | 600 | |
| Glyceraldehyde-3-phosphate dehydrogenase | GAPDH | Gallus gallus | 35909 | 12 | 14 | 548 | |
| Adenylate kinase isoenzyme 1 | AK1 | Gallus gallus | 21783 | 12 | 14 | 534 | |
| Tubulin beta-1 chain | TBB1 | Gallus gallus | 50333 | 12 | 13 | 509 | |
| Tubulin beta-2 chain | TBB2 | Gallus gallus | 50377 | 11 | 13 | 499 | |
| Collagen alpha-1(XII) chain | COL12A1 | Gallus gallus | 341740 | 10 | 9 | 380 | |
| Apolipoprotein A-I | APOA1 | Gallus gallus | 30661 | 9 | 6 | 305 | |
| Glutathione S-transferase 5 | GST5 | Gallus gallus | 25282 | 9 | 10 | 287 | |
| Tubulin alpha-1 chain | TUBA1 | Gallus gallus | 46385 | 9 | 9 | 284 | |
| 14-3-3 protein zeta | YWHAZ | Gallus gallus | 27929 | 9 | 8 | 278 | |
| Mitochondria-eating protein | SPATA18 | Gallus gallus | 54997 | 7 | 9 | 276 | |
| Ovotransferrin | TF | Gallus gallus | 79551 | 8 | 8 | 269 | |
| Actin, cytoplasmic 2 | ACTG1 | Gallus gallus | 42108 | 7 | 11 | 264 | |
| Actin, cytoplasmic type 5 | ACT5 | Gallus gallus | 42151 | 7 | 11 | 264 | |
| Ras-related protein Rab-5B | RAB5B | Gallus gallus | 23828 | 3 | 10 | 206 | |
| Ras-related protein Rab-5C | RAB5C | Gallus gallus | 23767 | 3 | 9 | 198 | |
| Ras-related protein Rab-10 | RAB10 | Gallus gallus | 22763 | 2 | 11 | 158 | |
| Cytochrome b-c1 complex subunit Rieske, mitochondrial | UQCRFS1 | Gallus gallus | 29710 | 1 | 4 | 102 | |
| Heat shock protein HSP 90-alpha | HSP90AA1 | Gallus gallus | 84406 | 1 | 3 | 99 | |
| 18 | Tubulin beta-3 chain | TBB3 | Gallus gallus | 50285 | 24 | 40 | 1850 |
| Tubulin beta-2 chain | TBB2 | Gallus gallus | 50377 | 26 | 22 | 1608 | |
| Tubulin beta-7 chain | TBB7 | Gallus gallus | 50095 | 26 | 21 | 1513 | |
| Tubulin beta-4 chain | TBB4 | Gallus gallus | 50844 | 18 | 17 | 1254 | |
| Tubulin beta- 5 chain |
TBB5 | Gallus gallus | 50395 | 12 | 16 | 1028 | |
| Tubulin alpha-5 chain | TBA5 | Gallus gallus | 50715 | 13 | 10 | 877 | |
| Tubulin alpha-4 chain | TBA4 | Gallus gallus | 36483 | 9 | 9 | 465 | |
| ATP synthase subunit beta, mitochondrial | ATP5B | Gallus gallus | 56650 | 10 | 11 | 368 | |
| Creatine kinase B-type | CKB | Gallus gallus | 43129 | 8 | 9 | 281 | |
| Tubulin alpha-2 chain | TBA2 | Gallus gallus | 50715 | 7 | 9 | 277 | |
| Heat shock cognate 71 kDa protein | HSPA8 | Gallus gallus | 71011 | 6 | 8 | 203 | |
| Creatine kinase S-type, mitochondrial | CKMT2 | Gallus gallus | 47510 | 5 | 7 | 188 | |
| Heat shock 70 kDa protein | HSP70 | Gallus gallus | 69936 | 6 | 5 | 172 | |
| Acrosin | ACR | Meleagris gallopavo | 38724 | 5 | 4 | 126 | |
| Voltage-dependent anion-selective channel protein 2 | VDAC2 | Meleagris gallopavo | 30162 | 5 | 3 | 115 | |
| Outer dense fibre protein 2 | ODF2 | Gallus gallus | 96467 | 4 | 3 | 106 | |
| Ubiquitin-ribosomal protein eS31 fusion protein | RPS27A | Gallus gallus | 18310 | 4 | 2 | 101 | |
| Polyubiquitin-B | UBB | Gallus gallus | 34348 | 4 | 2 | 101 | |
| Pyruvate kinase | PKM | Gallus gallus | 58434 | 3 | 1 | 98 | |
| Na(+)/H(+) exchange regulatory cofactor NHE-RF1 | NHERF1 | Gallus gallus | 36011 | 2 | 1 | 95 |
Table 9.
Proteins identified by SDS-PAGE and nano LC-MS/MS in spermatozoa derived from impaired fertility (IF) ejaculates.
Table 9.
Proteins identified by SDS-PAGE and nano LC-MS/MS in spermatozoa derived from impaired fertility (IF) ejaculates.
| Molecular weight [kDa] |
Identified protein | Gene | Species | Molecular weight (Mascot) [Da] |
No. of matched peptides | Sequence coverage [%] |
Score |
| 107 | Albumin | ALB | Gallus gallus | 71868 | 39 | 41 | 1389 |
| Cysteine protease ATG4B | ATG4B | Gallus gallus | 45007 | 36 | 38 | 1219 | |
| Fibronectin | FN1 | Gallus gallus | 276669 | 38 | 36 | 1203 | |
| Aminopeptidase Ey | ANPEP | Gallus gallus | 109406 | 28 | 35 | 1145 | |
| Acrosin | ACR | Meleagris gallopavo | 38724 | 27 | 23 | 1026 | |
| Collagen alpha-1(XII) chain | COL12A1 | Gallus gallus | 341740 | 27 | 22 | 957 | |
| Probable cation-transporting ATPase 13A4 | ATP13A4 | Gallus gallus | 135682 | 27 | 20 | 857 | |
| Ovotransferrin | TF | Gallus gallus | 79551 | 25 | 16 | 819 | |
| Alpha-enolase | ENO1 | Gallus gallus | 47617 | 23 | 21 | 770 | |
| Aspartate aminotransferase, cytoplasmic | GOT1 | Gallus gallus | 46134 | 12 | 19 | 532 | |
| Creatine kinase B-type | CKB | Gallus gallus | 43129 | 8 | 12 | 390 | |
| Astacin-like metalloendopeptidase | ASTL | Gallus gallus | 46929 | 10 | 9 | 371 | |
| Clusterin | CLU | Coturnix japonica | 52395 | 4 | 9 | 295 | |
| L-lactate dehydrogenase B | LDHB | Gallus gallus | 36694 | 8 | 4 | 265 | |
| NEL protein | NEL | Gallus gallus | 96096 | 5 | 5 | 202 | |
| Gelsolin | GSN | Gallus gallus | 86120 | 5 | 4 | 136 | |
| Heat shock cognate 71 kDa protein | HSPA8 | Gallus gallus | 71011 | 6 | 3 | 104 | |
|
52 52 |
Tubulin beta-3 chain | TBB3 | Gallus gallus | 50285 | 60 | 21 | 2146 |
| Tubulin beta-7 chain | TBB7 | Gallus gallus | 50095 | 42 | 16 | 1394 | |
| Tubulin beta-2 chain | TBB2 | Gallus gallus | 50377 | 40 | 16 | 1336 | |
| Tubulin beta-5 chain | TBB5 | Gallus gallus | 50395 | 35 | 11 | 1133 | |
| Tubulin beta-4 chain | TBB4 | Gallus gallus | 50844 | 35 | 13 | 1130 | |
| Creatine kinase B-type | CKB | Gallus gallus | 43129 | 16 | 17 | 836 | |
| Creatine kinase S-type, mitochondrial | CKMT2 | Gallus gallus | 47510 | 12 | 16 | 573 | |
| Voltage-dependent anion-selective channel protein 2 | VDAC2 | Meleagris gallopavo | 30162 | 9 | 10 | 493 | |
| Succinate dehydrogenase [ubiquinone] iron-sulphur subunit | SDHB | Gallus gallus | 33374 | 4 | 8 | 278 | |
| Albumin | ALB | Gallus gallus | 71868 | 6 | 6 | 236 | |
| Serine/threonine-protein phosphatase PP1-beta catalytic subunit | PPP1CB | Gallus gallus | 37961 | 3 | 5 | 181 | |
| 60 kDa heat shock protein, mitochondrial | HSPD1 | Gallus gallus | 61105 | 2 | 4 | 153 | |
| EF-hand domain-containing family member C2 | EFHC2 | Gallus gallus | 87461 | 3 | 3 | 142 | |
| Actin, cytoplasmic 1 | ACTB | Gallus gallus | 42052 | 2 | 2 | 102 | |
| Actin, cytoplasmic 2 | ACTG2 | Gallus gallus | 42108 | 2 | 2 | 102 | |
| Actin, cytoplasmic type 5 | ACT5 | Gallus gallus | 42151 | 2 | 2 | 102 | |
| 49 | Creatine kinase B-type | CKB | Gallus gallus | 43129 | 55 | 35 | 2758 |
| Albumin | ALB | Gallus gallus | 71868 | 42 | 28 | 1592 | |
| Creatine kinase S-type, mitochondrial | CKMT2 | Gallus gallus | 47510 | 29 | 25 | 1333 | |
| Tubulin beta-3 chain | TBB3 | Gallus gallus | 50285 | 36 | 19 | 1005 | |
| Tubulin beta-5 chain | TBB5 | Gallus gallus | 50395 | 25 | 21 | 693 | |
| Tubulin beta-4 chain | TBB4 | Gallus gallus | 50844 | 24 | 17 | 631 | |
| Alpha-enolase | ENOA | Gallus gallus | 47617 | 8 | 9 | 481 | |
| Aspartate aminotransferase, cytoplasmic | GOT1 | Gallus gallus | 46134 | 9 | 6 | 442 | |
| Acrosin | ACR | Meleagris gallopavo | 38724 | 5 | 4 | 328 | |
| Voltage-dependent anion-selective channel protein 2 | VDAC2 | Meleagris gallopavo | 30162 | 4 | 5 | 204 | |
| Aspartate aminotransferase, mitochondrial | GOT2 | Gallus gallus | 47496 | 7 | 3 | 177 | |
| Actin, cytoplasmic 1 | ACTB | Gallus gallus | 42052 | 2 | 2 | 110 | |
| Actin, cytoplasmic 2 | ACTG2 | Gallus gallus | 42108 | 2 | 2 | 110 | |
| Actin, cytoplasmic type 5 | ACT5 | Gallus gallus | 42151 | 2 | 2 | 110 | |
|
41 41 |
Voltage-dependent anion-selective channel protein 2 | VDAC2 | Meleagris gallopavo | 30162 | 16 | 32 | 818 |
| Tubulin beta-3 chain | TBB3 | Gallus gallus | 50285 | 19 | 28 | 630 | |
| Acrosin | ACR | Meleagris gallopavo | 38724 | 11 | 16 | 626 | |
| Tubulin alpha-4 chain | TBA4 | Gallus gallus | 36483 | 11 | 15 | 606 | |
| Creatine kinase S-type, mitochondrial | CKMT2 | Gallus gallus | 47510 | 8 | 19 | 484 | |
| Tubulin beta-7 chain | TBB7 | Gallus gallus | 50095 | 11 | 14 | 315 | |
| Tubulin beta-5 chain | TBB5 | Gallus gallus | 50395 | 8 | 12 | 243 | |
| Tubulin beta-4 chain | TBB4 | Gallus gallus | 50844 | 8 | 10 | 202 | |
| Ubiquitin-ribosomal protein eS31 fusion protein | RPS27A | Gallus gallus | 18310 | 3 | 8 | 143 | |
| Polyubiquitin-B | UBB | Gallus gallus | 34348 | 3 | 8 | 143 | |
| Creatine kinase B-type | CKB | Gallus gallus | 43129 | 3 | 7 | 127 | |
| Aspartate aminotransferase, mitochondrial | GOT2 | Gallus gallus | 47496 | 3 | 5 | 119 | |
| Actin, cytoplasmic 1 | ACTB | Gallus gallus | 42052 | 2 | 2 | 112 | |
| Actin, cytoplasmic 2 | ACTG2 | Gallus gallus | 42108 | 2 | 2 | 112 | |
| Actin, cytoplasmic type 5 | ACT5 | Gallus gallus | 42151 | 2 | 2 | 112 | |
| Albumin | ALB | Gallus gallus | 71868 | 2 | 1 | 93 | |
| 29 | Albumin | ALB | Gallus gallus | 71868 | 72 | 51 | 2853 |
| Voltage-dependent anion-selective channel protein 2 | VDAC2 | Meleagris gallopavo | 30162 | 21 | 37 | 1052 | |
| Creatine kinase B-type | CKB | Gallus gallus | 43129 | 18 | 22 | 1038 | |
| Tubulin beta-3 chain | TBB3 | Gallus gallus | 50285 | 33 | 19 | 848 | |
| Acrosin | ACR | Meleagris gallopavo | 38724 | 12 | 18 | 722 | |
| Tubulin beta-4 chain | TBB4 | Gallus gallus | 50844 | 22 | 16 | 523 | |
| Tubulin beta-5 chain | TBB5 | Gallus gallus | 50395 | 18 | 13 | 503 | |
| Creatine kinase S-type, mitochondrial | CKMT2 | Gallus gallus | 47510 | 7 | 10 | 412 | |
| Ig lambda chain C region | LAC | Gallus gallus | 11525 | 8 | 9 | 330 | |
| Apolipoprotein A-I | APOA1 | Gallus gallus | 30661 | 10 | 8 | 301 | |
| Tubulin alpha-4 chain | TBA4 | Gallus gallus | 36483 | 6 | 14 | 301 | |
| Phosphoglycerate kinase | PGK | Gallus gallus | 45087 | 5 | 7 | 180 | |
| ATP synthase subunit beta, mitochondrial | ATP5B | Gallus gallus | 56650 | 6 | 6 | 171 | |
| Phosphoglycerate mutase 1 | PGAM1 | Gallus gallus | 29051 | 3 | 5 | 154 | |
| Succinate dehydrogenase [ubiquinone] iron-sulphur subunit | SDHB | Gallus gallus | 33374 | 4 | 5 | 146 | |
| Astacin-like metalloendopeptidase | ASTL | Gallus gallus | 46929 | 3 | 4 | 132 | |
| Tubulin alpha-2 chain | TBA2 | Gallus gallus | 50715 | 4 | 3 | 127 | |
| Glyceraldehyde-3-phosphate dehydrogenase | GAPDH | Gallus gallus | 35909 | 3 | 2 | 111 | |
| EF-hand domain-containing family member C2 | EFHC2 | Gallus gallus | 87461 | 2 | 1 | 105 | |
| Mitochondria-eating protein | SPATA18 | Gallus gallus | 54997 | 1 | 1 | 99 | |
|
16 16 |
Voltage-dependent anion-selective channel protein 2 | VDAC2 | Meleagris gallopavo | 30162 | 26 | 35 | 1473 |
| Tubulin beta-7 chain | TBB7 | Gallus gallus | 50095 | 50 | 33 | 1350 | |
| Tubulin beta-5 chain | TBB5 | Gallus gallus | 50395 | 26 | 29 | 1216 | |
| Tubulin beta-4 chain | TBB4 | Gallus gallus | 50844 | 39 | 19 | 1102 | |
| Creatine kinase B-type | CKB | Gallus gallus | 43129 | 16 | 15 | 758 | |
| Tubulin alpha-4 chain | TBA4 | Gallus gallus | 36483 | 15 | 13 | 613 | |
| Acrosin | ACR | Meleagris gallopavo | 38724 | 10 | 12 | 566 | |
| ATP synthase subunit beta, mitochondrial | ATP5B | Gallus gallus | 56650 | 11 | 10 | 478 | |
| Creatine kinase S-type, mitochondrial | CKMT2 | Gallus gallus | 47510 | 10 | 11 | 459 | |
| Glyceraldehyde-3-phosphate dehydrogenase | GAPDH | Gallus gallus | 35909 | 4 | 10 | 254 | |
| Calmodulin | CALM | Gallus gallus | 16827 | 4 | 8 | 224 | |
| EF-hand domain-containing family member C2 | EFHC2 | Gallus gallus | 87461 | 4 | 8 | 220 | |
| Fatty acid-binding protein, brain | FABP7 | Gallus gallus | 15031 | 4 | 6 | 199 | |
| Succinate dehydrogenase [ubiquinone] iron-sulphur subunit | SDHB | Gallus gallus | 33374 | 2 | 7 | 188 | |
| Outer dense fibre protein 2 | ODF2 | Gallus gallus | 96467 | 4 | 5 | 168 | |
| Mitochondria-eating protein | SPATA18 | Gallus gallus | 54997 | 2 | 5 | 127 | |
| Ubiquitin-ribosomal protein eS31 fusion protein | RPS27A | Gallus gallus | 18310 | 2 | 4 | 124 | |
| Polyubiquitin-B | UBB | Gallus gallus | 34348 | 2 | 3 | 124 | |
| Cilia- and flagella-associated protein 20 | CFAP20 | Gallus gallus | 22891 | 3 | 3 | 122 | |
| Actin, cytoplasmic 1 | ACTB | Gallus gallus | 42052 | 2 | 2 | 102 | |
| Actin, cytoplasmic 2 | ACTG2 | Gallus gallus | 42108 | 2 | 2 | 102 | |
| Actin, cytoplasmic type 5 | ACT5 | Gallus gallus | 42151 | 2 | 2 | 102 |
Table 10.
Main Molecular Functions attributed to seminal plasma proteins in good fertility (GF) ejaculates.
Table 10.
Main Molecular Functions attributed to seminal plasma proteins in good fertility (GF) ejaculates.
| Molecular Function | #Proteins | Expected | Fold Enrichment | Raw P-Value | FDR |
| Creatine kinase activity | 2 | .01 | >100 | 4.87E-05 | 1.04E-02 |
| Phosphopyruvate hydratase activity | 2 | .01 | >100 | 4.87E-05 | 1.12E-02 |
| Structural constituent of postsynaptic actin cytoskeleton | 2 | .01 | >100 | 4.87E-05 | 9.79E-03 |
| Structural constituent of postsynapse | 2 | .02 | 99.29 | 1.69E-04 | 2.87E-02 |
| Structural molecule activity | 8 | .92 | 8.66 | 3.69E-06 | 1.70E-03 |
| Structural constituent of the cytoskeleton | 7 | .12 | 57.92 | 2.84E-11 | 9.13E-08 |
| GTP binding | 5 | .39 | 12.68 | 4.65E-05 | 1.15E-02 |
| Purine ribonucleoside triphosphate binding | 7 | .53 | 13.22 | 9.67E-07 | 1.04E-03 |
| Nucleoside phosphate binding | 7 | .82 | 8.57 | 1.68E-05 | 4.92E-03 |
| Anion binding | 9 | 1.12 | 8.04 | 1.59E-06 | 1.28E-03 |
| Ion binding | 13 | 2.13 | 6.10 | 1.44E-07 | 2.31E-04 |
| Guanyl ribonucleotide binding | 5 | .41 | 12.07 | 5.90E-05 | 1.12E-02 |
| Purine ribonucleotide binding | 7 | .63 | 11.11 | 3.08E-06 | 1.65E-03 |
| Purine nucleotide binding | 7 | .66 | 10.67 | 4.02E-06 | 1.44E-03 |
| Nucleotide binding | 7 | .82 | 8.57 | 1.68E-05 | 5.41E-03 |
| Small molecule binding | 9 | 1.13 | 7.96 | 1.73E-06 | 1.11E-03 |
| Ribonucleotide binding | 7 | .65 | 10.76 | 3.80E-06 | 1.53E-03 |
| Carbohydrate derivative binding | 7 | .92 | 7.60 | 3.61E-05 | 9.68E-03 |
| Guanyl nucleotide binding | 5 | .41 | 12.07 | 5.90E-05 | 1.05E-02 |
Table 11.
Main Molecular Functions attributed to seminal plasma proteins in impaired fertility (IF) ejaculates.
Table 11.
Main Molecular Functions attributed to seminal plasma proteins in impaired fertility (IF) ejaculates.
| Molecular Function | #Proteins | Expected | Fold Enrichment | Raw P-Value | FDR |
| Creatine kinase activity | 2 | .01 | >100 | 5.54E-05 | 3.57E-02 |
| Phosphopyruvate hydratase activity | 2 | .01 | >100 | 5.72E-05 | 3.68E-02 |
| L-lactate dehydrogenase activity | 2 | .02 | >100 | 9.22E-05 | 4.24E-02 |
| Unfolded protein binding | 4 | .21 | 18.89 | 6.01E-05 | 3.22E-02 |
| Anion binding | 9 | 1.19 | 7.54 | 2.78E-06 | 2.23E-03 |
| Ion binding | 13 | 2.27 | 5.72 | 3.20E-07 | 1.03E-03 |
Table 12.
Main Molecular Functions attributed to spermatozoa proteins in good fertility (GF) ejaculates.
Table 12.
Main Molecular Functions attributed to spermatozoa proteins in good fertility (GF) ejaculates.
| Molecular Function | #Proteins | Expected | Fold Enrichment | Raw P-Value | FDR |
| Creatine kinase activity | 2 | .01 | >100 | 2.15E-05 | 6.28E-03 |
| Phosphopyruvate hydratase activity | 2 | .01 | >100 | 2.15E-05 | 6.91E-03 |
| Structural molecule activity | 6 | .62 | 9.74 | 3.14E-05 | 7.76E-03 |
| Structural constituent of the cytoskeleton | 5 | .08 | 62.06 | 1.62E-08 | 5.21E-05 |
| GTP binding | 4 | .26 | 15.22 | 1.36E-04 | 2.91E-02 |
| Purine ribonucleoside triphosphate binding | 6 | .35 | 17.00 | 1.30E-06 | 2.09E-03 |
| Nucleoside phosphate binding | 6 | .54 | 11.01 | 1.58E-05 | 5.63E-03 |
| Anion binding | 7 | .75 | 9.38 | 8.17E-06 | 4.38E-03 |
| Ion binding | 8 | 1.42 | 5.63 | 6.87E-05 | 1.58E-02 |
| Guanyl ribonucleotide binding | 4 | .28 | 14.48 | 1.64E-04 | 3.30E-02 |
| Purine ribonucleotide binding | 6 | .42 | 14.28 | 3.57E-06 | 3.83E-03 |
| Purine nucleotide binding | 6 | .44 | 13.72 | 4.50E-06 | 2.90E-03 |
| Nucleotide binding | 6 | .54 | 11.01 | 1.58E-05 | 6.33E-03 |
| Small molecule binding | 7 | .75 | 9.28 | 8.73E-06 | 4.01E-03 |
| Ribonucleotide binding | 6 | .43 | 13.84 | 4.28E-06 | 3.44E-03 |
| Carbohydrate derivative binding | 6 | .61 | 9.77 | 3.08E-05 | 8.27E-03 |
| Guanyl nucleotide binding | 4 | .28 | 14.48 | 1.64E-04 | 3.11E-02 |
Table 13.
The main Molecular Functions attributed to spermatozoa proteins in impaired fertility (IF) ejaculates.
Table 13.
The main Molecular Functions attributed to spermatozoa proteins in impaired fertility (IF) ejaculates.
| Molecular Function | #Proteins | Expected | Fold Enrichment | Raw P-Value | FDR |
| L-aspartate:2-oxoglutarate aminotransferase activity | 2 | .01 | >100 | 1.13E-05 | 1.21E-02 |
| Creatine kinase activity | 2 | .01 | >100 | 2.26E-05 | 1.45E-02 |
| Phosphopyruvate hydratase activity | 2 | .01 | >100 | 2.26E-05 | 1.82E-02 |
| Structural constituent of the cytoskeleton | 3 | .08 | 36.33 | 7.68E-05 | 4.12E-02 |
| Anion binding | 7 | .76 | 9.15 | 9.70E-06 | 3.12E-02 |
| Ion binding | 9 | 1.46 | 6.18 | 1.09E-05 | 1.75E-02 |
Disclaimer/Publisher’s Note: The statements, opinions and data contained in all publications are solely those of the individual author(s) and contributor(s) and not of MDPI and/or the editor(s). MDPI and/or the editor(s) disclaim responsibility for any injury to people or property resulting from any ideas, methods, instructions or products referred to in the content. |
© 2025 by the authors. Licensee MDPI, Basel, Switzerland. This article is an open access article distributed under the terms and conditions of the Creative Commons Attribution (CC BY) license (http://creativecommons.org/licenses/by/4.0/).
Copyright: This open access article is published under a Creative Commons CC BY 4.0 license, which permit the free download, distribution, and reuse, provided that the author and preprint are cited in any reuse.


