
Submitted:
30 September 2025
Posted:
01 October 2025
You are already at the latest version
Abstract
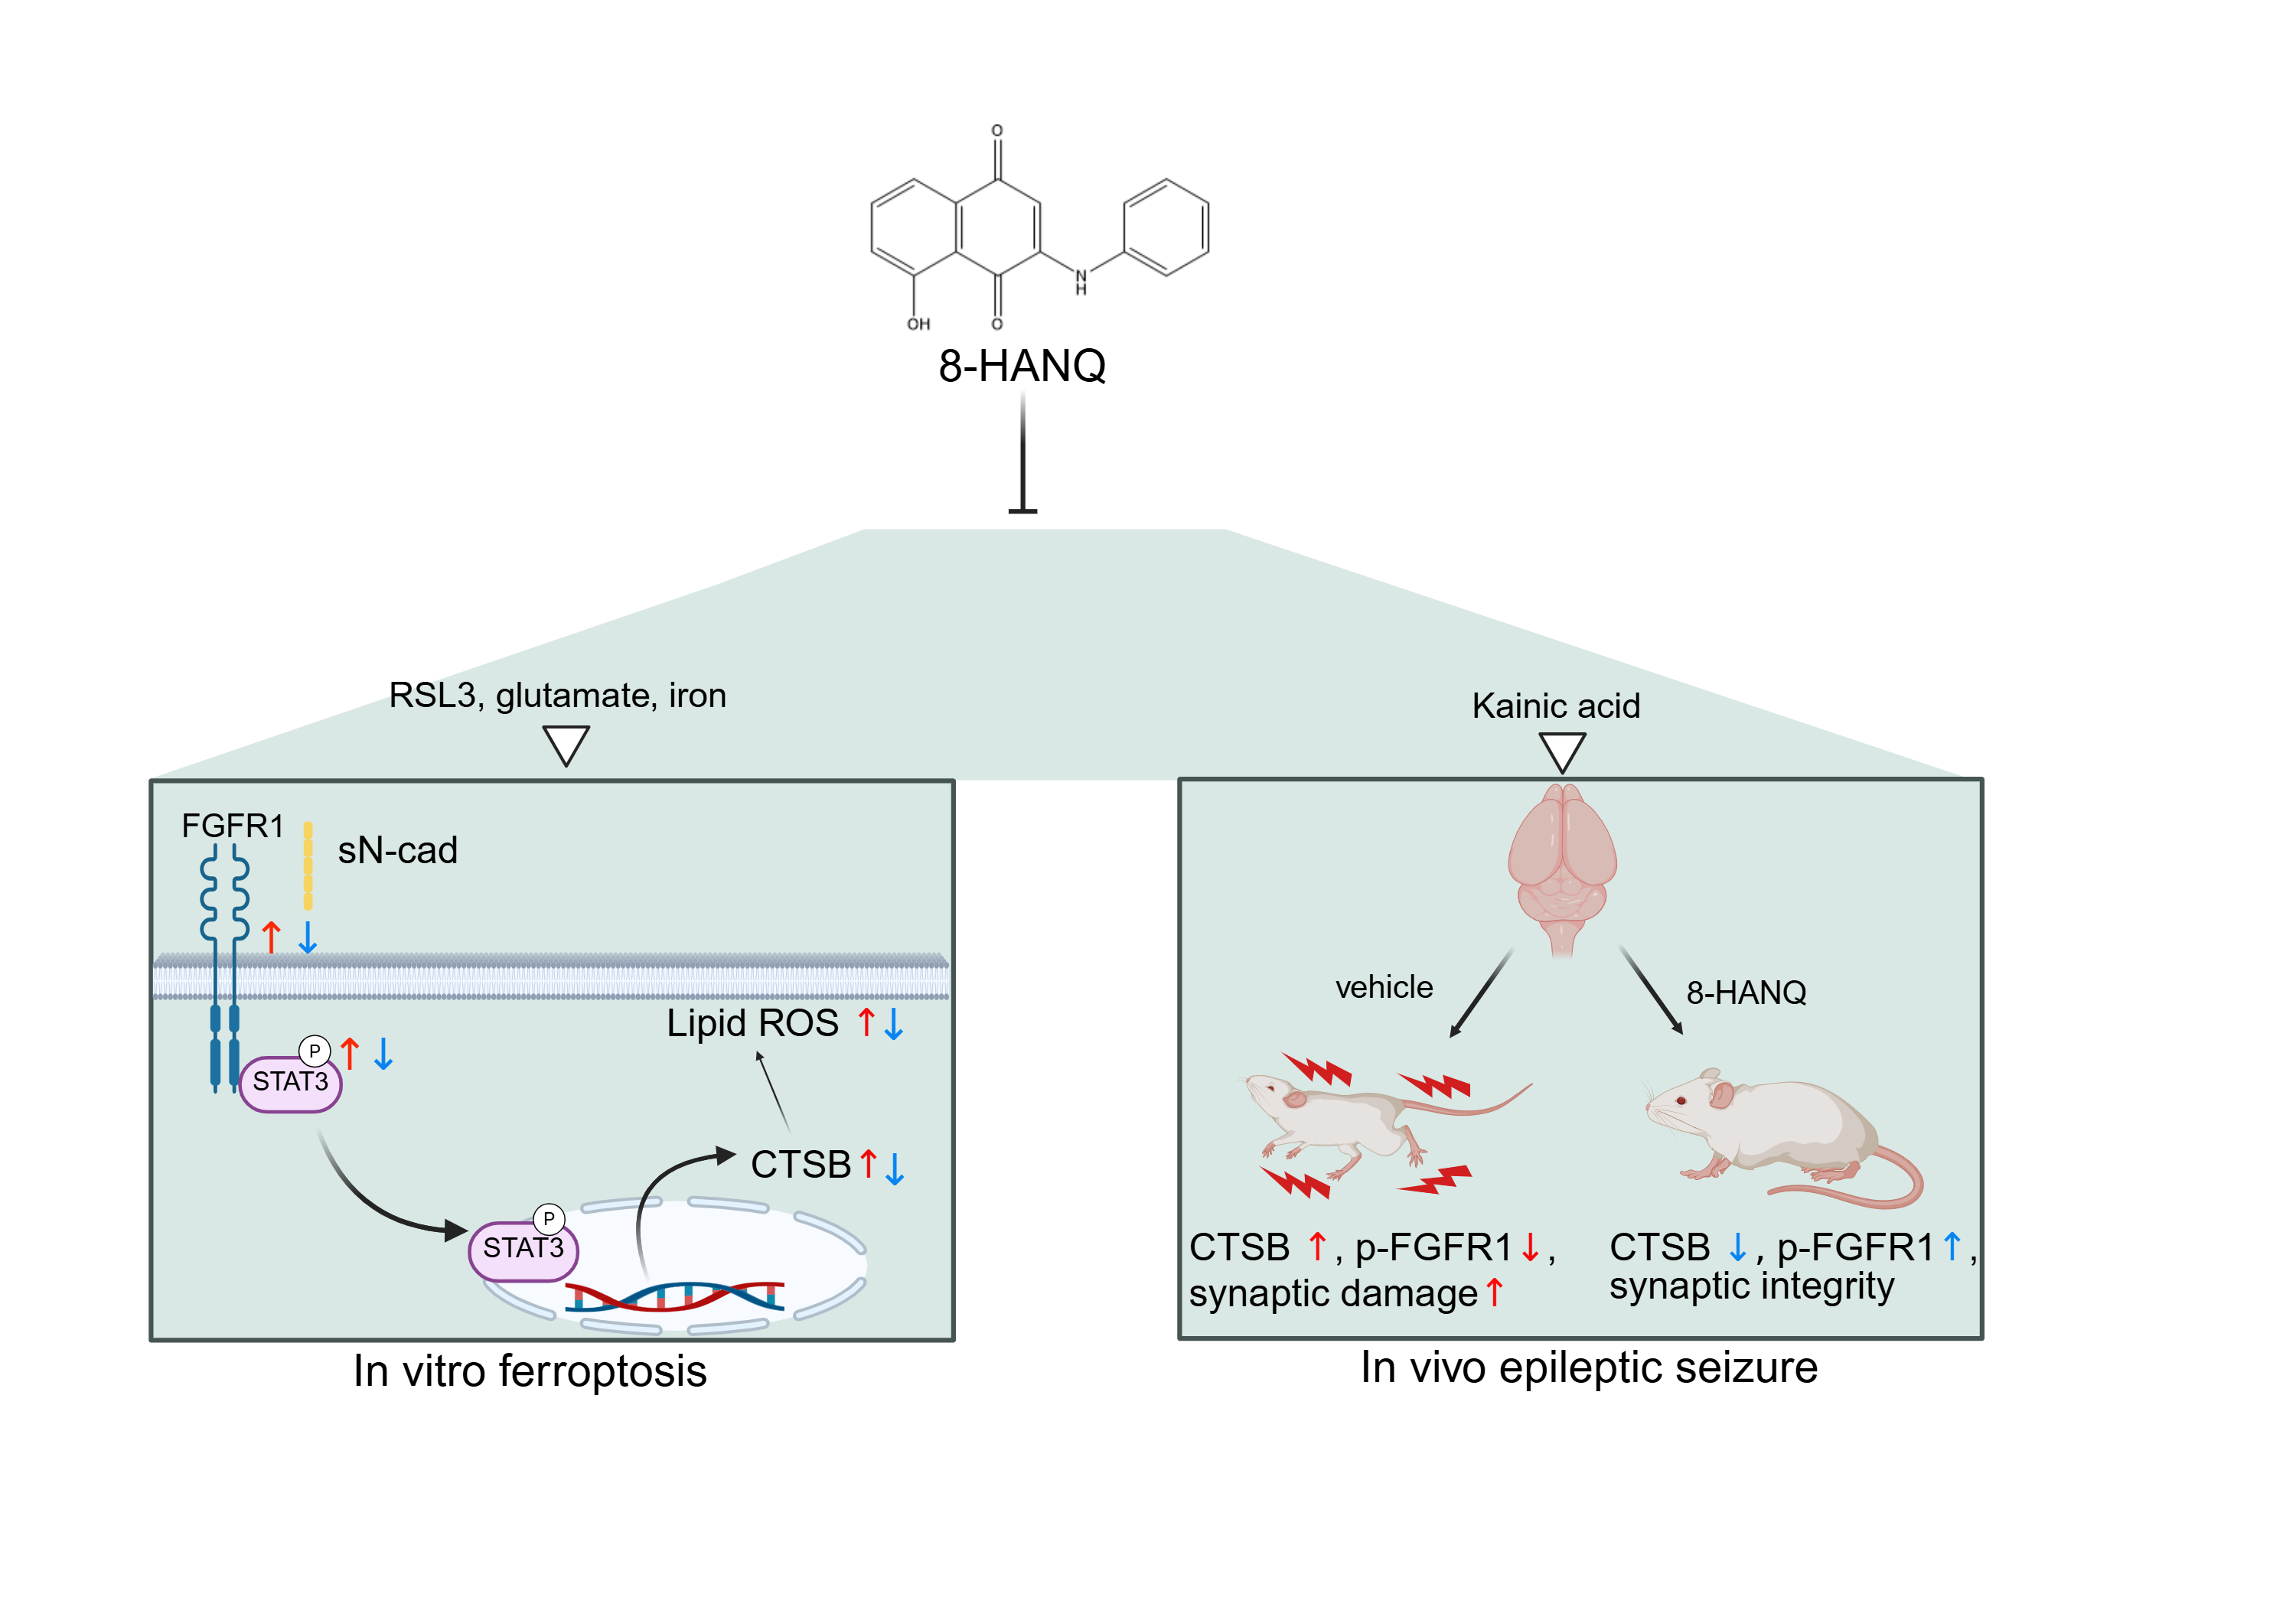
Background/Objectives: Ferroptosis, an iron-dependent form of regulated cell death characterized by the excessive lipid peroxidation, has been implicated in various acute and chronic brain disorders, including epilepsy. Although 1,4- naphthoquinone derivatives have been reported to regulate ferroptosis, their mechanistic roles in the nervous system remain underexplored. Here, we investigated the protective effects of 8-hydroxy-2-anilino-1,4-naphthoquinone (8-HANQ) on ferroptotic neuronal death in vitro and seizure behaviors in vivo. Methods: HT22 hippocampal cells were exposed to ferroptosis inducers including glutamate, glutamate plus iron or RSL3. Lipid reactive oxygen species (ROS), ferroptosis markers, and its related molecules were assessed by flow cytometry and Western blotting. In a kainate (KA)-induced seizure model, 8-HANQ was delivered intracerebroventricularly, followed by behavioral seizure scoring and analysis of hippocampal levels of PSD95, cathepsin-B, and FGFR1 at 72 hours post-seizure. Results: 8-HANQ attenuated ferroptotic death in HT22 cells, reducing lipid ROS accumulation and abnormal acyl-coA synthetase long chain family member 4 (ACSL4), suggesting 8-HANQ’s anti-ferroptotic action. Moreover, 8-HANQ also prevented aberrant STAT3-dependent cathepsin-B overexpression while modulating soluble N-cadherin-mediated FGFR1 activation. In vivo, 8-HANQ decreased KA-induced seizure behavior, restored hippocampal cathepsin-B and PSD95 expression, and partially alleviated dysregulation of FGFR1 activation. Conclusions: 8-HANQ prevents ferroptotic neuronal death and synaptic deficits involving the FGFR1/STAT3/cathepsin-B-driven ferroptosis while lowering seizure severity, suggesting that 8-HANQ may serve as a potential anti-ferroptotic and anti-seizure agent.
Keywords:
8-hydroxy-2-anilino-1
; 4-naphthoquinone (8-HANQ)
; ferroptosis
; cathepsin-B
; neuroprotection
; kainate (KA)-induced epileptic seizures
; lipid ROS
1. Introduction
Naphthoquinones (NQs) are bioactive compounds structurally derived from naphthalene, and their numerous natural and synthetic derivatives have been extensively investigated for diverse biological effects and therapeutic potential. Among them, 1,4-NQs have attracted particular attention for their neuroprotective properties across various models of neurological disorders. Recently, a previous study has demonstrated that certain 1,4-NQ derivatives prevent Amyloid β (Aβ) aggregation, with their anti-Aβ activities being highly dependent on structural modifications [1]. In addition, structural analogues of 1,4-NQs have been shown to alleviate motor deficits and inhibit apoptosis reducing oxidative stress in rotenone-induced Parkinsonism models [2]. Moreover, synthetic vitamin K analogues, which are also 1,4-NQs, have been reported to reduce seizure activity in pentylenetetrazole-induced seizure models [3]. Extending their pharmacological scope to ferroptosis regulation, fully reduced forms of vitamin K have been identified as potent ferroptosis inhibitors by scavenging lipid radicals in a glutathione peroxidase 4 (GPX4)-independent manner in mouse hippocampal HT22 cells and brain tissues [4].
Ferroptosis is a distinct, non-apoptotic form of regulated cell death characterized by the excessive accumulation of intracellular iron and lipid reactive oxygen species (ROS). It has been implicated in various acute and chronic central nervous system (CNS) disorders [5]. During ferroptosis, iron overload amplifies lipid ROS generation, triggering extensive lipid peroxidation and cell death [6,7]. GPX4 plays a central antioxidant role by using glutathione (GSH) to detoxify lipid ROS, thereby protecting cells from ferroptotic damage [8]. In addition, acyl-CoA synthetase long-chain family member 4 (ACSL4) promotes the oxidation of polyunsaturated fatty acids (PUFAs), a key step in ferroptosis progression [9]. GPX4-independent pathways also contribute to ferroptosis regulation; for example, ferroptosis suppressor protein 1 (FSP1) uses coenzyme Q10 to neutralize lipid radicals [10,11].
Recent transcriptomic and functional studies have identified the lysosomal cysteine protease cathepsin-B as an executive mediator of ferroptosis in the CNS. Elevated expression and activity of cathepsin-B have been observed under ferroptotic conditions both in vitro and in vivo [12]. In HT22 neuronal cells, cathepsin-B promotes ferroptotic cell death by inducing lysosomal membrane permeabilization and enhancing lipid peroxidation, independently of GPX4 [13]. In non-neuronal systems, cathepsin-B expression is regulated by signal transducer and activator of transcription 3 (STAT3); the ferroptosis inducer erastin has been shown to cause lysosomal dysfunction and cathepsin-B upregulation via aberrant STAT3 activation in pancreatic cancer cells [14].
Additionally, N-cadherin, a classical cadherin and calcium-dependent adhesion molecule, has emerged as another modulator of ferroptosis. Under ferroptotic stress, N-cadherin degradation via autophagy reduces intercellular adhesion and increases susceptibility to cell death [15]. Ke et al. [16] also demonstrated that increased extracellular matrix stiffness decreases N-cadherin expression in nucleus pulposus cells, thereby enhancing lipid ROS, subsequent ferroptosis through upregulation of ACSL4.
Although several 1,4-NQ derivatives have been reported to regulate ferroptosis, 8-hydroxy-2-anilino-1,4-naphthoquinone (8-HANQ), which contains an aniline group on the 1,4-NQ backbone, has not been studied for its anti-ferroptotic neuroprotective effects or its underlying mechanisms. To address this, the present study aims to elucidate the neuroprotective role of 8-HANQ against ferroptosis in vitro and evaluate its potential anti-seizure effects in vivo.
2. Materials and Methods
2.1. Chemicals and Reagents
Glutamate, RAS-selective lethal 3 (RSL3), dimethyl sulfoxide (DMSO), Iron(II) sulfate heptahydrate (FeSO4), 3-(2-Pyridyl)-5,6-diphenyl-1,2,4-triazine-4′,4′′-disulfonic acid sodium salt (Ferrozine), Iron(III) sulfate (iron (III)), deferoxamine (DFO), ethylenediaminetetraacetic acid (EDTA), ferrostatin-1, valproate, BGJ398 and C11-BODIPY581/591 were purchased from Sigma-Aldrich (USA). Antibodies against pSTAT3(Y705), STAT3, cathepsin-B, heme oxygenease-1 (HO-1), synapsin-1, N-cadherin, fibroblast growth factor receptor 1 (FGFR1), microtubule-associated protein 1 light chain 3 (LC3) and β-actin were purchased from Cell Signaling Technology (USA), pFGFR1(Y653/654) from Thermo Scientific (USA), postsynaptic density protein 95 (PSD95) from SantaCruz (USA), FSP1 from Proteintech (USA), GPX4 from Abcam (USA) and ACSL4, PSD95 for HT22 cells from ABclonal Technology (USA). Kainate (KA) was purchased from MedChemExpress (USA).
2.2. NQ-Derived Compounds
All chemical structures of 6 compounds are shown in Supplementary Figure 1.
2.2.1. 8-HANQ and 5-HANQ
2.2.1.1. General Chemistry
The reagents and solvents were purchased from commercial suppliers (Sigma-Aldrich, USA; Thermo Fisher, USA; TCI, Japan) and used as provided, unless otherwise indicated. Reactions were monitored via analytical thin-layer chromatography (TLC) using glass sheets pre-coated with silica gel 60 F254 (Merck, Darmstadt, Germany) and visualized under ultraviolet (UV) light (254 nm). Proton nuclear magnetic resonance (¹H NMR) spectra of the compounds dissolved in CDCl₃ and deuterated dimethyl sulfoxide (DMSO-d₆) were recorded on a Bruker Avance 400 MHz spectrometer (Bruker Corporation, Billerica, USA). Chemical shifts were expressed as δ-values in parts per million (ppm) using residual solvent peaks (CDCl₃: ¹H, 7.26 ppm; DMSO: ¹H, 2.50 ppm) as a reference. Coupling constants are given in hertz (Hz). Peak patterns are indicated by the following abbreviations: s, singlet; d, doublet; t, triplet; q, quadruplet; m, multiplet. HRMS was performed on a system consisting of an electrospray ionization (ESI) source in an Agilent 6230B time-of-flight (TOF) liquid chromatography–mass spectrometer equipped at the Ewha Drug Development Research Core Center (Agilent Technologies, USA; NFEC-2021-08-272459). Column chromatography was performed using silica gel 60 (230–400 mesh). The purity of the final compounds was determined by HPLC on an Agilent 1260 system (Agilent Technologies) using an Agilent Eclipse XDB-C18 column (4.6 × 150 mm, 5 µm) with UV absorbance detection at 254 nm. HPLC conditions were as follows: mobile phase, ACN/Water (60:40); flow rate, 1.0 mL/min; column temperature, ambient; injection volume, 10 μL. All compounds were >95% pure by HPLC analysis.
2.2.1.2. Synthesis
A solution of Juglone (200 mg, 1.1 mmol, 1 equiv.) and AlCl₃(0.1 mmol, 0.1 equiv.) in ethanol (11 mL) was stirred at room temperature under dark conditions. Aniline (1.1 mmol, 1.0 equiv.) was then added, and the resulting mixture was stirred for 2 h. After the reaction was complete, the mixture was extracted with ethyl acetate and washed with brine. The organic phase was collected, dried over anhydrous MgSO₄, filtered, and concentrated under reduced pressure. The crude product was purified by silica gel column chromatography using a gradient elution of hexane and ethyl acetate (30:1 to 20:1), yielding an orange-red compound (8-HANQ; 42 mg, 11% yield) and a dark red compound (5-Hydroxy-2-(phenylamino)naphthalene-1,4-dione, 5-HANQ; 5 mg, 2% yield) [17].
8-HANQ (compound #1) : Orange red solid; 1H NMR (400 MHz, DMSO-d6) δ 11.53 (s, 1H), 9.27 (s, 1H), 7.74 (q, J = 5.3 Hz, 1H), 7.45 (t, J = 4.0 Hz, 3H), 7.38 (d, J = 4.3 Hz, 2H), 7.27-7.21 (m, 2H), 6.04 (s, 1H); 1H NMR (400 MHz, CDCl3) δ 11.56 (s, 1H), 7.65-7.62 (m, 2 H), 7.52 (s, 1H), 7.43 (t, J = 3.2 Hz, 2H), 7.27 (d, J = 7.7 Hz, 2H), 7.24-7.17 (m, 2H), 6.38 (s, 1H); The NMR data are identical to the previously reported data [17] ; 13C NMR (100 MHz, DMSO-d6) δ 185.57, 181.89, 160.48, 146.27, 137.95, 137.55, 132.95, 129.32, 125.41, 123.89, 122.26, 117.60, 114.33, 102.14); HRMS (ES+) m/z calculated for C16H12NO3 [M+H]+ : 266.0812; found : 266.0812. HPLC purity : 99.8%.
5-HANQ (compound #2) : Dark red solid; 1H NMR (400 MHz, DMSO-d6) δ 13.06 (s, 1H), 9.60 (s, 1H), 7.66 (t, J = 7.8 Hz, 1H), 7.61 (d, J = 6.4 Hz, 1H), 7.48 (t, J = 7.8 Hz, 2H), 7.40 (d, J = 7.4 Hz, 2H), 7.33 (d, J = 7.2 Hz, 1H), 7.27 (t, J = 7.3 Hz, 1H), 6.00 (s, 1H); The NMR data are identical to the previously reported data [18]; 13C NMR (100 MHz, DMSO-d6) δ 189.05, 180.84, 160.00, 147.49, 137.62, 134.72, 130.57, 129.37, 125.84, 125.10, 124.06, 118.77, 114.27, 100.58; HRMS (ES+) m/z calculated for C16H12NO3 [M+H]+ : 266.0812; found : 266.0811. HPLC purity : 96.4%.
2.2.2. Other NQ-Derived Compounds
NQ-derived analogs, 6-anilino-5,8-quinolinedione (compound #3; [19]), 2,3-dimethyl-6-(3,5-difluoroanilino)-5,8-quinoxalinedione (compound #4), 2,3-dimethyl-6-(3-fluoroanilino)-5,8-quinoxalinedione (compound #5), and 2,3-dimethyl-6-(4-ethoxyanilino)-5,8-quinoxalinedione (compound #6) [20], were included in the initial compound screening and these 4 compounds were provided by Prof. Chung-Kyu Ryu.
2.3. HT22 Mouse Hippocampal Cell Culture
Cells were cultured in Dulbecco’s Modified Eagle’s medium containing 10% fetal bovine serum, 100 U/ml penicillin, and 100 mg/ml streptomycin. Cells were maintained at 37°C in a humidified incubator under 5% CO₂ and subcultured every 2-3 days using trypsin/EDTA solution.
2.4. Cell Viability Assay
Cell viability was assessed using the Quanti-Max™ WST-8 Cell Viability Assay Kit (Biomax, Korea), following the manufacturer's protocol. HT22 cells were placed in 96-well plates and pre-treated with varying concentrations of each test compound including 8-HANQ (0.01-10 μM), 5-HANQ (10 μM), BGJ398 (1-5 nM) or ferrostatin-1 (1 μM) for 30 minutes and subsequently exposed to cytotoxic agents such as a combination of 5 mM glutamate and 100 μM iron (III), 50 nM RSL3 or 20 mM glutamate at 37 °C for 24 hours. To test toxicity of 8-HANQ and 5-HANQ, both compounds (10-100 μM) were treated to HT22 cells and incubated for 24 hours. WST-8 reagent was added and incubated for 1 hour in the dark and the absorbance at 450 nm was measured using a Tecan Infinite 200 PRO microplate reader (Tecan, Switzerland; NFEC-2024-09-299675) at the Ewha Drug Development Research Core Center.
2.5. Lipid ROS Detection with C11-BODIPY581/591
HT22 cells were seeded in 6-well plates and pretreated with 8-HANQ or 5-HANQ (5-10 μM) for 30 minutes, followed by stimulation with either 30 mM glutamate or 200 nM RSL3 for 24 hours. Cells were then fixed in 1% paraformaldehyde for 10 minutes at room temperature and stained with 1.5 μM C11-BODIPY581/591 at 37 °C for 30 minutes in the dark. After washing, cells were resuspended in phosphate-buffered saline (PBS, pH 7.4) and analyzed by flow cytometry NovoCyte 2060R system (ACEA Biosciences, USA; NFEC-2019-03-254735). Fluorescence data from 100,000 events were recorded per sample. For fluorescence imaging, cells stained with 1.5 μM C11-BODIPY581/591 for 30 minutes were washed thoroughly with PBS and visualized using an Axio Observer 7 inverted fluorescence microscope (Carl Zeiss, Germany; NFEC-2021-08-272462). All flow cytometric and fluorescence imaging analyses were conducted at the Ewha Drug Development Research Core Center.
2.6. Ferrous Iron Chelation Assay
Ferrous iron binding capacity of 8-HANQ was measured by the ferrozine-based colorimetric assay, as described by Soriano-Castell et al. [21]. Briefly, 8-HANQ (1-200 μM) was incubated with 5 μM FeSO4 in 50 mM HEPES buffer (pH 7.5) for 2 minutes at room temperature in a 96-well plate, followed by the addition of 2.5 mM ferrozine. Absorbance at 562 nm was measured using a microplate reader. Each dose was tested in duplicate and iron binding capacities are presented as vehicle controls with or without iron.
2.7. Measurement of Soluble N-cadherin Release
soluble N-cadherin was quantified as previously described by Nitsch et al. [22], with slight modifications. Briefly, cells were incubated in 6-well plates overnight, followed by treatment with 8-HANQ (2.5-10 μM) for 30 minutes prior to the addition of 200 nM RSL3. After 24 hours, culture media were collected, centrifuged at 13,000 × g for 10 minutes with 1% protease inhibitor cocktail and subsequently the supernatants were desalted using PD-10 desalting columns (Cytiva, USA). The desalted solution from the columns was dried using a speed vacuum evaporator ScanSpeed 40 (Alex Red Ltd, Israel) and resuspended in 20 μl of loading buffer. Equal volumes of each sample were separated with sodium dodecyl sulfate-polyacrylamide gel electrophoresis (SDS-PAGE), transferred to polyvinylidene difluoride (PVDF) membranes (Millipore, USA). Membranes were blocked with 5% non-fat dry milk in Tris-buffered saline with 0.1% Tween 20 (TBST) and probed with anti-N-cadherin primary antibody overnight. After incubation with horseradish peroxidase-conjugated secondary antibodies for 2 hours, immunoactive bands were developed using enhanced chemiluminescence reagents and detected with a ChemiDoc MP imaging system (Bio-Rad, USA). Band intensities were analyzed using ImageJ software (NIH, USA).
2.8. Animal Experiments
2.8.1. Animals
Male ICR mice (25-30 g) were obtained from Orient Bio (Korea) and housed under a 12/12-hour light/dark cycle with free access to standard chow and water. All animal procedures were approved by the Institutional Animal Care and Use Committee (IACUC) of Ewha Womans University (approval number: Ewha-IACUC 23-061-4) and conducted in accordance with institutional guidelines for the care and use of laboratory animals.
2.8.2. Stereotaxic Drug Administration and KA-Induced Seizure Induction
For intracerebroventricular (i.c.v.) administration, mice were anesthetized with tiletamine-zolazepam (Zoletil, 20 mg/kg) and xylazine (9.5 mg/kg) and positioned in a stereotaxic frame. Injections were performed using a Hamilton microsyringe at the following stereotaxic coordinates relative to bregma: anteroposterior -1.0 mm, mediolateral ±1.0 mm, and dorsoventral -2.0 mm. Animals received a 1 μl injection of either 8-HANQ (0.5 or 1 μg), valproate (150 μg), or vehicle (40 or 80% DMSO in saline) with/without KA (0.2 μg).
Mice were intraperitoneally or intracerebroventricularly administered KA, as previously described by Rusina et al. [23]. In the intraperitoneal (i.p.) KA administration experiment, animals were randomly divided into four groups. The vehicle control group received an i.c.v. injection of vehicle 2 hours prior to an i.p. injection of saline. The KA group received vehicle i.c.v., followed 2 hours later by KA (40 mg/kg, i.p.). The KA + 8-HANQ group was administered 8-HANQ (0.5 or 1 μg, i.c.v.), and the KA + valproate group received valproate (150 μg, i.c.v.), both 2 hours before KA injection.
In the i.c.v. KA administration experiment, a separate cohort of animals was randomly assigned into three groups. In this scheme, KA was co-administered with 8-HANQ via i.c.v. injection. The vehicle control group received an i.c.v. injection of vehicle (40% DMSO in 1 μl saline). The KA group received a mixture of KA (0.2 μg) and vehicle (in 1 μl total volume). The KA + 8-HANQ group was administered a combination of KA (0.2 μg) and 8-HANQ (1 μg) in a total volume of 1 μl. All animals were sacrificed 72 hours after KA administration.
2.8.3. Behavioral Seizure Assessment
To evaluate the anti-seizure effects of 8-HANQ in a KA-induced seizure model, mice were monitored every 10 minutes for 150 minutes by observers blinded to the treatment conditions. Behavioral seizure severity was scored between 30 and 180 minutes following systemic administration of KA. In the i.c.v. KA administration model, seizure behavior was evaluated from 60 to 210 minutes after i.c.v. injection of 8-HANQ and KA, as mice recovered from anesthesia approximately 60 minutes post-injection. Seizure severity was assessed using a modified Racine scale [24], as follows: Stage 0, no behavioral changes; Stage 1, facial muscle clonus; Stage 2, head nodding; Stage 3, forelimb clonus; Stage 4, rearing and falling with fore-limb clonus; Stage 5, generalized tonic-clonic seizures.
2.9. Sample Preparation and Western Blot Analysis
HT22 cells were seeded in 6-well plates and treated with 8-HANQ (2.5-20 μM) or BGJ398 (10-100 nM) for 30 minutes and then co-treated with 30 mM glutamate, 200 nM RSL3, or combinations of 10/20 mM glutamate or 100 μM arachidonate and 25/100 μM iron (III) for designated times. For in vivo analysis, mice were sacrificed 72 hours after KA administration. Cells and brain hippocampal tissues were lysed in cold RIPA buffer containing 1% protease inhibitor cocktail. After centrifugation at 13,000 × g for 20 minutes at 4 °C, protein concentrations were determined using a protein quantification kit - BCA (Biomax, Korea). Equal protein amounts were separated by SDS-PAGE and transferred to PVDF membranes. Membranes were blocked with 5% non-fat dry milk in 0.1% TBST and incubated overnight with primary antibodies and visualized using enhanced chemiluminescence. Band intensity was quantified using ImageJ software.
2.10. Statistical Analysis
All data are expressed as mean ± standard error of the mean (SEM). Statistical analysis were performed using unpaired t-tests, one-way ANOVA followed by Tukey’s Honest Significant Difference test, or two-way ANOVA with Bonferroni post-hoc correction, as appropriate. A p-value < 0.05 was considered statistically significant.
2.11. Generative AI Assistance in Manuscript Preparation
Generative AI tools, specifically OpenAI’s ChatGPT (USA), were partially used to assist in the literature review and revision of the original manuscript. All AI-assisted content was carefully reviewed and edited by the authors to ensure accuracy.
3. Results
3.1. Selection of Novel NQ Derivatives Preventing Ferroptotic Neuronal Death
To identify novel NQ compounds inhibiting ferroptotic cell death, six synthetic NQ derivatives (compounds #1-6) were tested for their neuroprotective effects against ferroptotic cell death in mouse hippocampal HT22 cells. The tested compounds included two 1,4-NQs, 8-HANQ (compound #1) and 5-HANQ (compound #2), a quinolinedione (compound #3), and three quinoxalinediones (compound #4-6).
Excessive glutamate is known to trigger multiple forms of cell death, including ferroptosis. At toxic concentration, glutamate induces ferroptosis by inhibiting system Xc−, thereby depleting GSH, and is therefore widely used as a ferroptosis inducer. Another hallmark of ferroptosis is the intracellular accumulation of iron [6]. To establish a more refined ferroptotic condition, we treated cells with a subtoxic concentration of glutamate in combination with iron. Among the six compounds, only #1 (8-HANQ) and #2 (5-HANQ) significantly prevented ferroptotic cell death induced either by glutamate alone (Figure 1A) or by glutamate plus iron (III) (Figure 1B). The two compounds also significantly attenuated neuronal death caused by RSL3, a selective GPX4 inhibitor and established ferroptosis inducer (Figure 1C). Treatment with 8-HANQ or 5-HANQ at 10 μM almost fully restored neuronal viability to the level achieved by ferrostatin-1, a well-characterized anti-ferroptotic agent [6].
8-HANQ and 5-HANQ are structural isomers that differ in the position of the aniline group on the 1,4-NQ scaffold (Figure 1D). Both compounds were synthesized as described in the Materials and Methods, and their intrinsic cytotoxicity was assessed under normal conditions. When HT22 cells were treated with concentrations ranging from 10 to 100 μM, 8-HANQ showed no detectable toxicity (Figure 1E), whereas 5-HANQ caused dose-dependent toxicity beginning at 50 μM (Figure 1F). Therefore, 8-HANQ inhibits ferroptotic neuronal death with a more favorable toxicity profile than 5-HANQ, and thus was selected for further mechanistic studies.
3.2. 8-HANQ Exhibits Dose-Dependent Neuroprotection Against Ferroptotic Neuronal Death and Synaptic Dysregulation in HT22 Cells
We confirmed the anti-ferroptotic neuroprotective effects of 8-HANQ across different concentrations in HT22 cells. 8-HANQ protected against glutamate-induced ferroptosis in a dose-dependent manner, showing significant effects even at a low concentration of 2 μM (Figure 2A). Comparable protective effects were also observed under ferroptotic conditions induced either by the combination of subtoxic glutamate with iron (III) (Figure 2B) or by RSL3 (Figure 2C), with significant effect beginning at 1-2 μM.
We next examined whether 8-HANQ could preserve synapse marker expression, namely presynaptic synapsin-1 and postsynaptic PSD95, which reflect synaptic strength [25], during ferroptosis. Consistent with its protective effects, 8-HANQ restored the levels of both proteins (Figure 2D-G), which had been reduced by glutamate plus iron (III) or RSL3. These findings suggest that 8-HANQ provides neuroprotection while maintaining synaptic strength under ferroptotic stress.
3.3. 8-HANQ Suppresses Lipid ROS Accumulation to Inhibit Ferroptosis
Given the involvement of lipid ROS in ferroptosis, we assessed the ability of 8-HANQ to suppress ROS accumulation in glutamate- or RSL3-treated HT22 cells. Indeed, 8-HANQ significantly reduced lipid ROS levels under both conditions, as measured by flow cytometry using C11-BODIPY581/591 (Figure 3A-D). This lipid ROS-lowering effect of 8-HANQ was further confirmed in glutamate-treated cells by fluorescence microscopy analysis (Figure 3E).
ACSL4 promotes the oxidation of PUFAs, a critical step in ferroptosis progression [9]. To assess whether the reduction in lipid ROS was linked to alterations in lipid metabolism, we evaluated ACSL4 expression. The increase in ACSL4 induced by the combination of glutamate with iron (III) was markedly suppressed by 8-HANQ (Figure 3F, G). These findings suggest that 8-HANQ may exert anti-ferroptotic effects by modulating lipid metabolism through the inhibition of aberrant ACSL4-mediated lipid peroxidation.
3.4. 8-HANQ Inhibits the STAT3/cathepsin-B Axis Mediated by Soluble N-cadherin/FGFR1 Signaling to Attenuate Ferroptosis
To further delineate the mechanism underlying 8-HANQ’s anti-ferroptotic action, we first examined the involvement of GPX4. 8-HANQ did not restore the RSL3-induced reduction in GPX4 protein levels, which is associated with diminished enzymatic activity [8], whereas ferrostatin-1 effectively rescued GPX4 expression (Figure 4A, B). These results indicate that the anti-ferroptotic effect of 8-HANQ is not mediated through direct regulation of GPX4.
Since STAT3-mediated regulation of cathepsin-B has been implicated in ferroptosis of cancer cells [14], we next investigated their roles in HT22 neuronal ferroptosis and the action of 8-HANQ. Previous studies reported that cathepsin-B contributes to autophagy-dependent ferroptosis in HT22 cells [13]. Consistent with this, we found that LC3-II accumulation induced by RSL3 was markedly reduced by 8-HANQ (Figure 4C, D). Likewise, the abnormal increase in cathepsin-B expression caused by glutamate or RSL3 was significantly attenuated by 8-HANQ (Figure 4E-G). STAT3 activation paralleled cathepsin-B upregulation in ferroptotic conditions, and both were suppressed by 8-HANQ (Figure 4H-J). Together, these findings suggest that 8-HANQ exerts its anti-ferroptotic effect, at least in part, by inhibiting the STAT3/cathepsin-B axis, independently of GPX4 modulation. Meanwhile, N-cadherin has recently been identified as a mechanosensitive regulator of ferroptosis [15,16]. We therefore assessed its expression in HT22 cells under ferroptotic stress. Although the full-length 140-kDa form remained unchanged following RSL3 treatment (Supplementary Figure 2A, B), the ~90-kDa soluble N-cadherin fragment in the cell pellet was consistently reduced, and this effect was reversed by 8-HANQ (Figure 5A, B). Because soluble N-cadherin is released extracellularly [26], this reduction likely reflected increased secretion, which was confirmed by elevated extracellular levels in RSL3-treated cells and restored to baseline by 8-HANQ (Figure 5C, D).
FGFR1, a known receptor for soluble N-cadherin, promotes neurite outgrowth through FGFR1-dependent signaling [27] and has been shown to activate STAT3 signaling pathways that govern cell fate decisions [28,29]. We hypothesized that FGFR1 serves as a mechanistic link between soluble N-cadherin release and activation of the STAT3/cathepsin-B axis during ferroptosis. Supporting this, pharmacological inhibition of FGFR1 with BGJ398 [28] suppressed RSL3-induced STAT3 and cathepsin-B upregulation in HT22 cells (Figure 5E-H). Moreover, BGJ398 protected neurons from ferroptosis triggered by either glutamate plus iron (III) or by RSL3 (Figure 5I). Both total and phosphorylated FGFR1 levels were elevated under glutamate-induced ferroptotic stress, and this upregulation was attenuated by 8-HANQ (Figure 5J-L). Collectively, these findings suggest that soluble N-cadherin-mediated activation of FGFR1 contributes to neuronal ferroptosis via the STAT3/cathepsin-B axis and that 8-HANQ protects neurons by disrupting this signaling cascade.
3.5. 8-HANQ Mitigates Seizure Severity and Restores Hippocampal cathepsin-B, FGFR1, and PSD95 Dysregulation in KA-Induced Epileptic Mice
Recent studies have increasingly implicated ferroptosis in the pathogenesis of epilepsy [30]. In KA-induced seizure models, alterations in ferroptosis-related proteins such as GPX4 and ACSL4 have been reported [31,32,33]. In addition, hippocampal cathepsin-B expression is elevated after KA-induced seizures, and its pharmacological inhibition has been shown to alleviate seizure-associated neuronal injury [34].
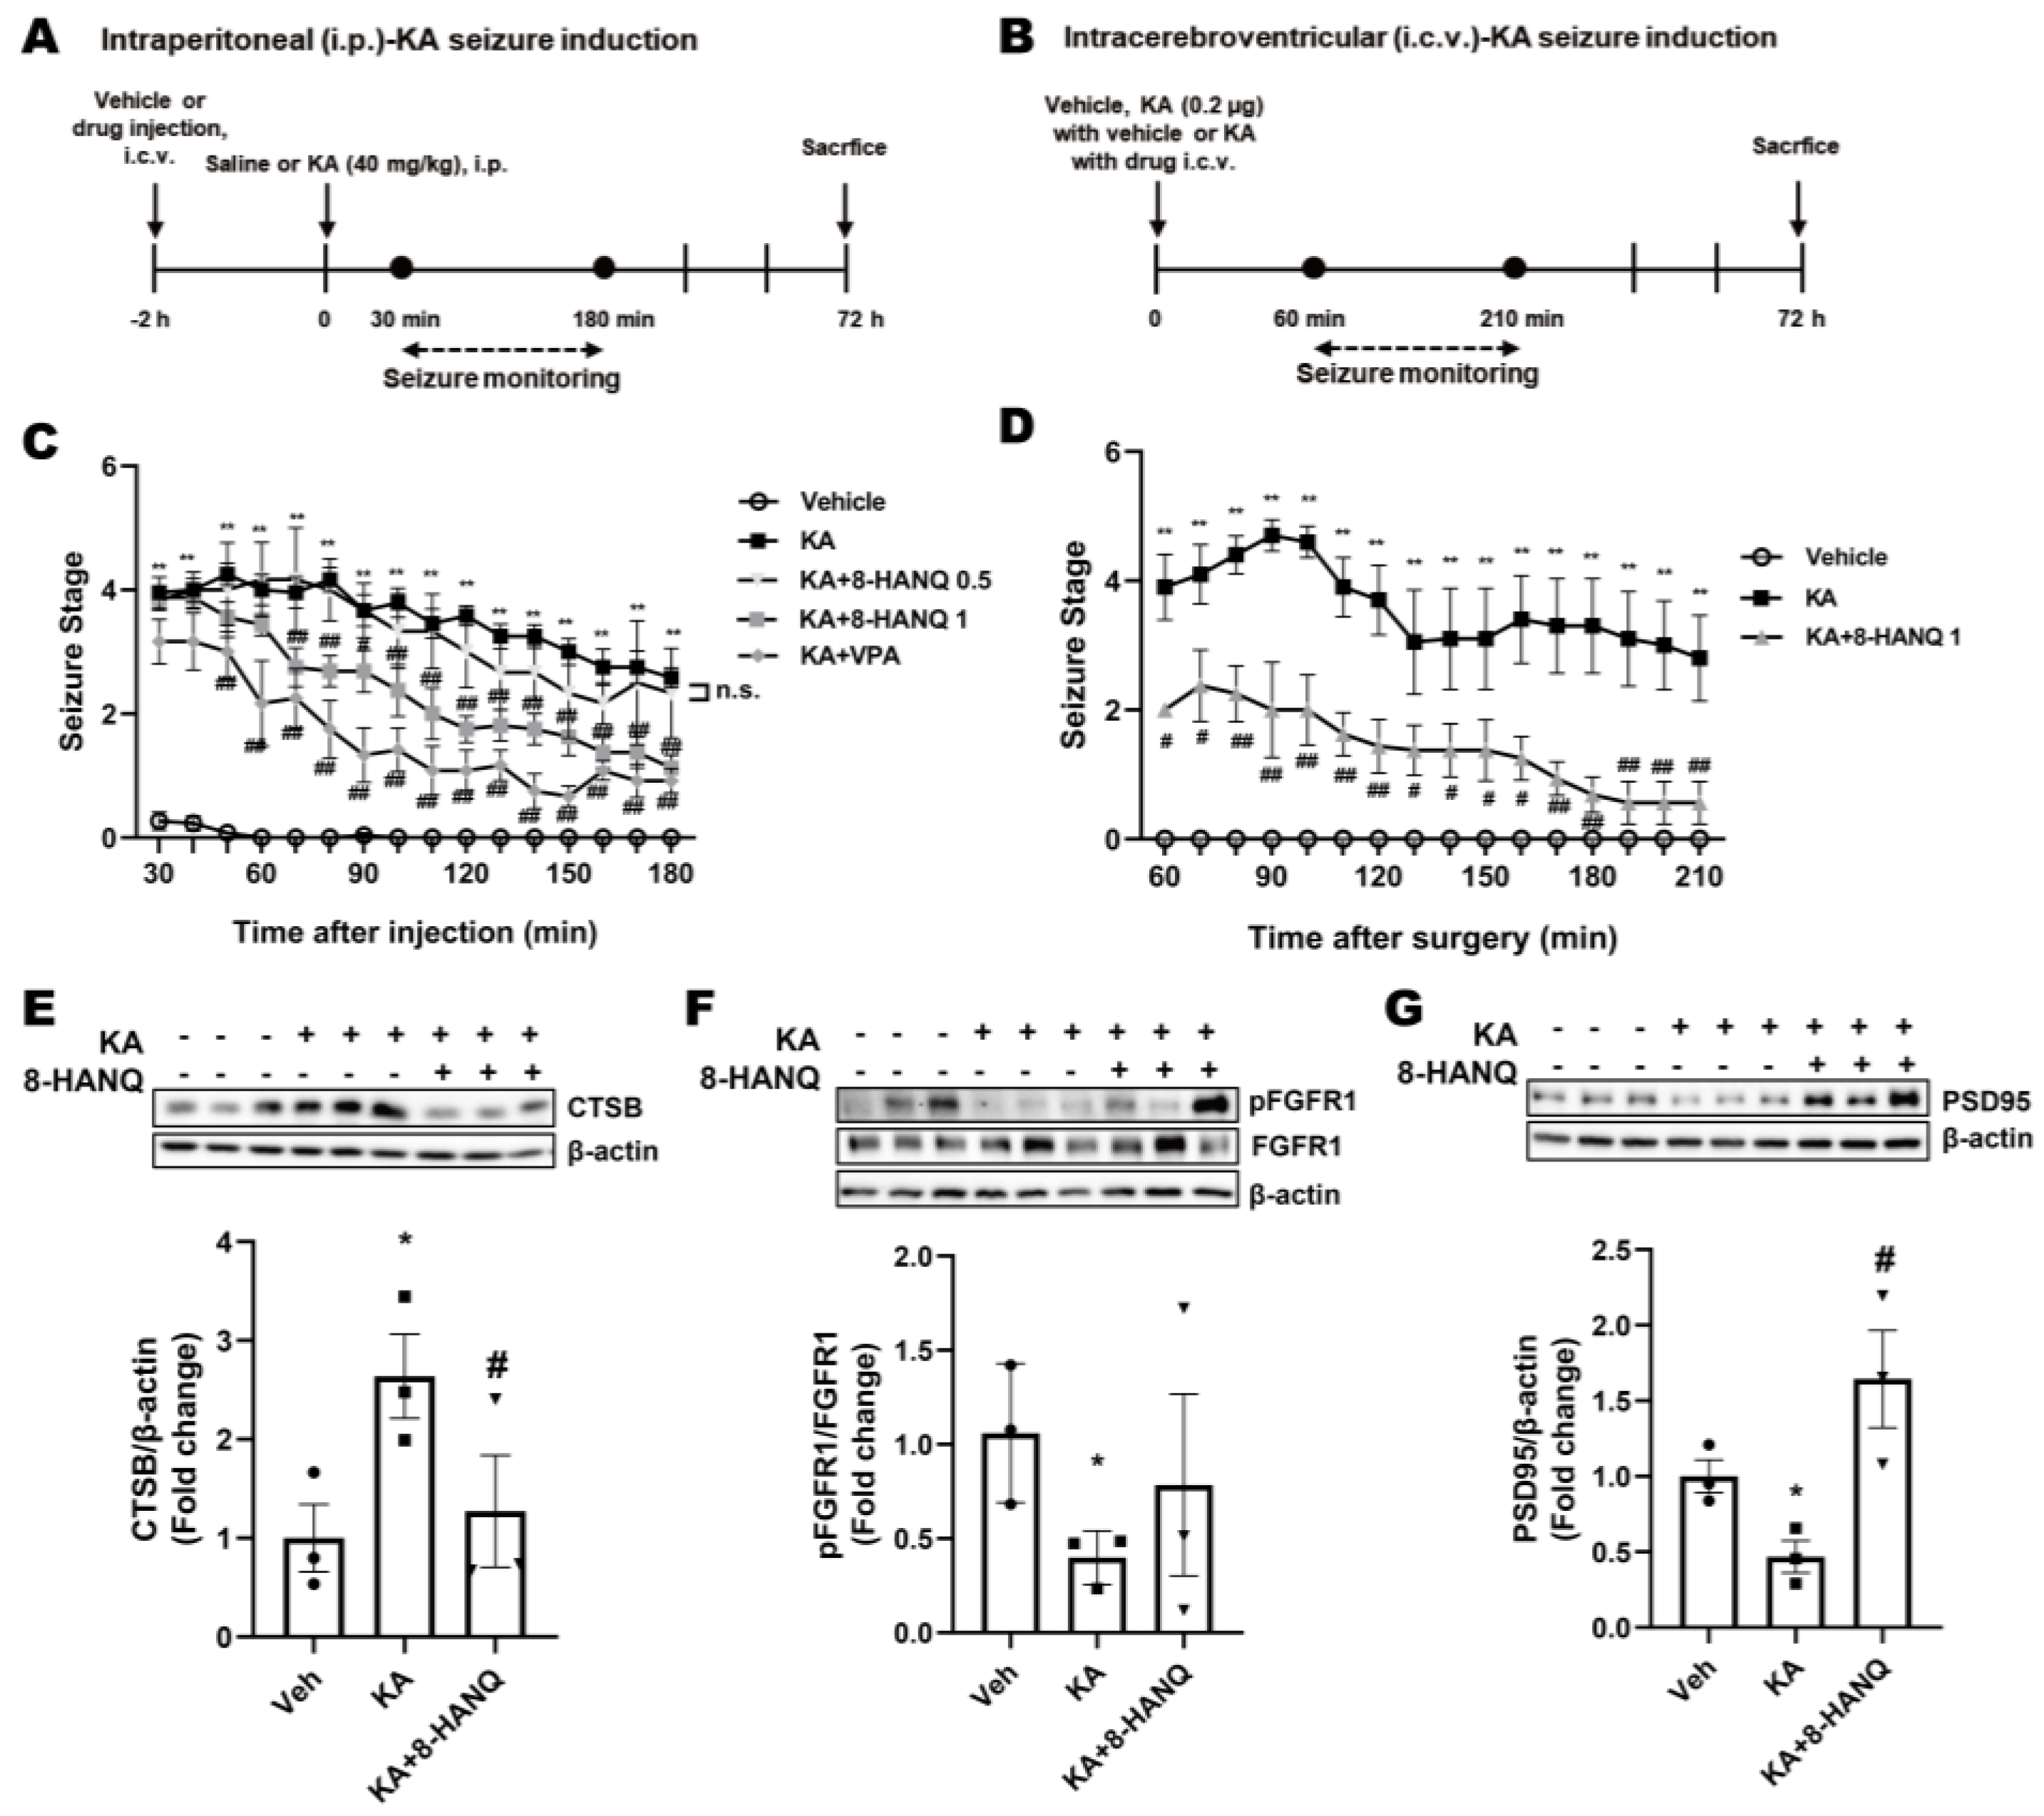
To investigate whether 8-HANQ exerts protective effects against KA-induced seizures, we employed two experimental models in which KA was administered either intraperitoneally or intracerebroventricularly, following methods similar to those described by Rusina et al. [23]. The effect of intracerebroventricularly delivered 8-HANQ was evaluated by behavioral seizure scoring, with valproate, a broad-spectrum anticonvulsant, included as a reference control. In the systemic KA model, mice received 8-HANQ or valproate two hours before intraperitoneal KA injection, and seizure behaviors were subsequently monitored (Figure 6A). The antiseizure effect of 8-HANQ was further confirmed in the intracerebroventricular KA model, where 8-HANQ (1 µg) was co-administered with KA (Figure 6B).
Systemic KA injection induced robust seizures (scores 4.3-2.6), which were significantly reduced by pretreatment with 8-HANQ (1 µg; scores 2.8-1.1) during the 70–150 min post-induction period, comparable to the reduction observed in valproate-treated mice (scores 2.3-0.9; Figure 6C). Similarly, intracerebroventricular KA injection produced seizure severity scores (4.7–2.8) consistent with systemic administration, and co-administration of 8-HANQ significantly attenuated seizure severity (scores 2.4-0.6) throughout the 60-210 min monitoring window (Figure 6D).
Given our in vitro findings that 8-HANQ normalizes ferroptosis-associated changes in ACSL4, cathepsin-B, and FGFR1, we next examined whether these effects were reproduced in hippocampal tissue from KA-induced epileptic mice. Under our experimental conditions involving intracerebroventricular KA administration with anesthesia, we did not detect alterations in GPX4 or ACSL4, limiting assessment of 8-HANQ effects on these proteins (Supplementary Figure 3A, B). However, 8-HANQ significantly suppressed KA-induced hippocampal cathepsin-B upregulation (Figure 6E) and partially restored the reduction in pFGFR1/FGFR1 ratio (Figure 6F). Moreover, 8-HANQ preserved synaptic proteins, as evidenced by enhanced expression of the postsynaptic marker PSD95, which was reduced by intracerebroventricular injection of KA in vivo (Figure 6G). These results are consistent with the protective actions of 8-HANQ observed under in vitro ferroptotic stress conditions. Taken together, these findings indicate that 8-HANQ not only reduces seizure severity but also counteracts hippocampal dysregulation of cathepsin-B, FGFR1, and PSD95, which may underlie its antiseizure effects in vivo.
4. Discussion
Due to their structural versatility, 1,4-NQ derivatives exert diverse biological effects on ferroptosis in both cancer and neuronal systems [1,4,35,36]. However, the role of 8-HANQ in ferroptosis has not been investigated, and no notable function has been described in the neuronal system. To date, only one prior study reported a negligible anti-Aβ aggregation effect of 8-HANQ in a cell-free assay [17], without subsequent evaluation in disease-relevant models.
In the present study, we demonstrated that 8-HANQ attenuates neuronal ferroptosis in vitro, potentially by suppressing aberrant STAT3/cathepsin-B activation downstream of soluble N-cadherin/FGFR1 signaling in hippocampal neurons. Furthermore, in a KA-induced seizure model, 8-HANQ reduced seizure severity in vivo, underscoring the translational relevance of this mechanism.
We first evaluated the anti-ferroptotic effects of 8-HANQ under ferroptotic conditions induced by glutamate alone, glutamate combined with iron, and GPX4 inhibition by RSL3. Given the multifactorial nature of ferroptosis [37], we newly established a combined subtoxic glutamate and iron model, which synergistically elicited ferroptotic stress by simultaneously inhibiting system Xc⁻ and promoting iron-dependent lipid peroxidation. 8-HANQ dose-dependently prevented HT22 neuronal death across all conditions, in association with reduced lipid ROS accumulation. Moreover, 8-HANQ markedly suppressed aberrant ACSL4 upregulation, which facilitates PUFA oxidation and subsequent lipid peroxidation [9].
Despite these robust protective effects, 8-HANQ did not restore GPX4 protein levels under RSL3-induced stress. Because vitamin K derivatives, which also share a 1,4-NQ core, suppress ferroptosis via the GPX4-independent FSP1 pathway in HT22 cells [4], we next examined FSP1 involvement. However, 8-HANQ failed to restore FSP1 levels suppressed by arachidonate plus iron (III), another ferroptosis-inducing condition [38]. In addition, HO-1, whose overexpression aggravates ferroptosis through iron dysregulation [37], remained unaffected by 8-HANQ, and the compound exhibited no iron-chelating activity (Supplementary Figure 4). Together, these findings suggest that 8-HANQ exerts its protective effects through mechanisms distinct from canonical ferroptosis regulators such as GPX4, FSP1, or iron-handling pathways.
Instead, 8-HANQ suppressed pSTAT3 and cathepsin-B overactivation under both glutamate- and RSL3-induced ferroptosis. cathepsin-B upregulation has been consistently observed during ferroptosis across diverse cell types [12,13,39]. Concomitant induction of pSTAT3 and cathepsin-B has also been reported in pancreatic cancer cells undergoing ferroptosis [14], consistent with our findings in neuronal HT22 cells. Although STAT3 signaling in ferroptosis is context-dependent [40], growing evidence suggests a pro-ferroptotic role of pSTAT3 in CNS disorders. For example, activation of the STAT3/HIF1α axis promoted α-synuclein-induced ferroptosis, with GPX4 suppression and iron dyshomeostasis in a Parkinson’s disease model, whereas pharmacological STAT3 inhibition reduced lipid ROS and iron accumulation in microglia [41]. Likewise, traumatic brain injury-induced IL-23 upregulation enhanced neuronal ferroptosis through STAT3 activation, while IL-23 neutralization attenuated ferroptosis, restored GPX4 and ACSL4 expression, and normalized STAT3 overactivation [42]. Compared with these reports, our results indicate that 8-HANQ normalizes STAT3/cathepsin-B overactivation while restoring ACSL4 and reducing lipid ROS, but without altering GPX4 levels or iron homeostasis in ferroptosis-induced HT22 neuronal cells.
The autophagic degradation of N-cadherin has recently been identified in cancer cell lines as a mechanism of ferroptosis, mediated by the selective cargo protein hippocalcin-like 1 (HPCAL1) and operating independently of GPX4 regulation or iron metabolism [15]. Given that 8-HANQ attenuated LC3-II accumulation under ferroptotic stress, its anti-ferroptotic actions may be associated with suppression of autophagy-dependent ferroptosis, which led us to investigate N-cadherin protein level. However, intracellular levels of full-length N-cadherin and HPCAL1 remained unchanged (Supplementary Figure 2), despite decreased GPX4 level and dysregulated iron metabolism (Figure 4 and Supplementary Figure 4) under our ferroptotic conditions. These results indicated that HPCAL1-mediated N-cadherin degradation is not involved in neuronal ferroptosis. Instead, we observed a robust secretion of soluble N-cadherin, which has been reported to activate FGFR1 signaling and promote neurite outgrowth in cerebellar neurons [27]. Consistent with this interaction, our data demonstrated FGFR1 activation concomitant with elevated soluble N-cadherin under ferroptotic stress, an effect that was significantly inhibited by 8-HANQ. Based on these findings, we hypothesized that soluble N-cadherin may act as an upstream modulator of FGFR1/STAT3/cathepsin-B axis, thereby driving pathological STAT3/cathepsin-B activation during neuronal ferroptosis. Likewise, although arising from distinct cellular contexts, aberrant FGFR1/STAT3 activation has been shown to trigger cell death in breast cancer cells [43]. Importantly, we newly found that 8-HANQ inhibits ferroptosis-induced soluble N-cadherin secretion and STAT3/cathepsin-B activation, together with its anti-ferroptotic neuroprotective effect, in a manner similar to BGJ398, an FGFR1 inhibitor. Collectively, our findings suggest that prevention of the soluble N-cadherin-mediated FGFR1 activation, and the subsequent STAT3/cathepsin-B overactivation may represent a possible mechanism underlying the anti-ferroptotic neuroprotective effects of 8-HANQ in vitro.
Previous reports have demonstrated anti-seizure effect of certain 1,4-NQ derivatives in pentylenetetrazole-induced [3] and electroshock-induced seizures [44]. In addition, although there have been no reports in epilepsy or seizure models, the 1,4-NQ derivative, plumbagin, was recently shown to exert its neuroprotective effects in the hippocampus of autism models, ameliorating cognitive dysfunction [45].
To date, the potential effects of 1,4-NQ derivatives on seizure behavior in the context of neuroprotection against ferroptosis have not been investigated in vivo seizure models. In our in vitro neuronal ferroptosis model, synaptic dysfunction, as indicated by PSD95 reduction, was recovered by 8-HANQ. Consistent with this observation, 8-HANQ attenuated hippocampal PSD95 loss in parallel with its antiseizure effect in KA-induced epileptic mice. PSD95 has been reported to decline progressively as epilepsy advances. Previous studies indicated that no significant changes were detected 24 hours after KA exposure [46], whereas a marked reduction was observed at one week in electrically induced seizures [47] and at six weeks after KA injection [48], indicating chronic synaptic impairment in epilepsy. In line with these reports, we observed PSD95 reduction at 72 hours after KA injection, which was mitigated by 8-HANQ treatment.
In the KA models, 8-HANQ also attenuated seizure severity while modulating cathepsin-B levels, suggesting a potential relationship with ferroptotic processes. HO-1, a ferroptosis marker protein, was upregulated in hippocampal tissues from both intraperitoneal and intracerebroventricular KA-induced epileptic mice, which were anesthetized prior to vehicle or drug injection. In contrast, significant changes in GPX4 and ACSL4 were not detected in the same epileptic mice (unpublished data and Supplementary Figure 3). This absence of alteration suggests incomplete ferroptotic activation, possibly due to anesthetic interference, as ketamine, mechanistically related to tiletamine, has been reported to suppress neuronal ferroptosis [49]. Nonetheless, 8-HANQ reduced epileptic behavior while attenuating KA-induced cathepsin-B upregulation in the hippocampus, consistent with its anti-ferroptotic actions observed in vitro. Previous studies have shown that cathepsin-B is elevated following KA-induced seizures [34] and that it promotes ferroptosis in HT22 cells, where its inhibition alleviates ferroptotic death independently of GPX4 [13]. By integrating these observations, the present study provides an evidence for a potential link between cathepsin-B and ferroptosis in the context of epileptic seizures.
Previously, it has been demonstrated that KA-induced seizures activate STAT3 in association with glutamate excitotoxicity and neuroinflammation three days post-injection, and that a traditional herbal formula restored these pathological changes [50]. Based on these findings, we assessed STAT3 signaling in the KA-exposed hippocampus. However, significant alterations in pSTAT3 were not observed in the KA-induced hippocampus (Supplementary Figure 3), limiting interpretation of its contribution to the in vivo effects of 8-HANQ.
In parallel, hippocampal FGFR1 signaling was also affected by seizure induction. At 72 hours after KA injection, pFGFR1/FGFR1 ratios declined and were partially restored by 8-HANQ. These findings contrast with our in vitro data and earlier reports showing FGFR1 upregulation within 24 hours of KA-induced seizures [51]. To date, FGFR1 signaling has not yet been examined in chronic epilepsy. Our results suggest that FGFR1 signaling downregulation may be indicative of progressive synaptic deterioration, whereas partial recovery by 8-HANQ treatment may contribute to neuroprotection.
In conclusion, our findings suggest that 8-HANQ mitigates neuronal ferroptosis, likely involving the FGFR1/STAT3/cathepsin-B axis rather than the canonical GPX4 or FSP1 defense systems. The reduction of lipid ROS and aberrant FGFR1/STAT3/cathepsin-B activation in vitro, together with the alleviation of synaptic deficits and seizure behaviors in vivo, provides preliminary support for a previously underexplored regulatory mechanism of ferroptosis associated with 8-HANQ. Taken together, these results raise the possibility that 8-HANQ may help control ferroptosis-related neuronal death and seizures.
Supplementary Materials
The following supporting information can be downloaded at the website of this paper posted on Preprints.org, Figure S1: Structures of tested NQ-derived compounds, Figure S2 : Unchanged expression of full-length N-cadherin and hippocalcin-like 1 during neuronal ferroptosis, Figure S3 : Unaffected expression of GPX4, ACSL4, and pSTAT3, with induction of HO-1 after KA administration, Figure S4 : Lack of involvement of FSP1, iron metabolism, and iron chelation in the neuroprotective anti-ferroptotic action of 8-HANQ.
Author Contributions
“Conceptualization, D.L., E.J.N., Y.H., J.Y. and H.J-.K. ; methodology, D.L., E.J.N., and Y.H.; validation, D.L., and E.J.N; formal analysis, D.L.; investigation, D.L., E.J.N., and Y.H. ; resources, Y.H. and J.Y. ; data curation, D.L. and H.J-.K. ; writing—original draft preparation, D.L. and H.J-.K. ; writing—review and editing, D.L., J.Y. and H.J-.K. ; visualization, D.L. ; supervision, J.Y. and H.J-.K. ; project administration, H.J-.K.; funding acquisition, H.J-.K. All authors have read and agreed to the published version of the manuscript.
Funding
This research was funded by the National Research Foundation of Korea (NRF), Ministry of Education (grant number RS-2023-00251870) to H.-J. Kim.
Institutional Review Board Statement
This study was approved by the Institutional Animal Care and Use Committee (IACUC) of Ewha Womans University (approval number: Ewha-IACUC 23-061-4).
Informed Consent Statement
Not applicable
Data Availability Statement
The datasets generated during the current study are available from the corresponding author upon reasonable request.
Acknowledgments
We sincerely thank Prof. Ikyon Kim (Department of Pharmacy and Yonsei Institute of Pharmaceutical Sciences, Yonsei University) and Prof. Chung-Kyu Ryu (formerly affiliated with Ewha Womans University) for kindly providing NQ compounds used in the initial screening to select active compounds.
Conflicts of Interest
The authors declare no conflicts of interest.
Abbreviations
The following abbreviations are used in this manuscript:
| 5-HANQ | 5-Hydroxy-2-anilino-1,4-naphthoquinone |
| 8-HANQ | 8-Hydroxy-2-anilino-1,4-naphthoquinone |
| ACSL4 | Acyl-CoA Synthetase Long-chain Family Member 4 |
| Aβ | Amyloid β |
| CNS | Central Nervous System |
| DFO | Deferoxamine |
| EDTA | Ethylenediaminetetraacetic Acid |
| FGFR1 | Fibroblast Growth Factor Receptor 1 |
| FSP1 | Ferroptosis Suppressor Protein 1 |
| GPX4 | Glutathione Peroxidase 4 |
| GSH | Glutathione |
| HO-1 | Heme Oxygenase-1 |
| HPCAL1 | Hippocalcin-like 1 |
| iron (III) | Iron(III) Sulfate |
| KA | Kainic Acid |
| LC3 | Microtubule-associated protein 1 light chain 3 |
| NQ | Naphthoquinone |
| PSD95 | Postsynaptic Density Protein 95 |
| PUFA | Polyunsaturated Fatty Acid |
| ROS | Reactive Oxygen Species |
| RSL3 | RAS-selective lethal 3 |
| STAT3 | Signal Transducer and Activator of Transcription 3 |
References
- Bermejo-Bescos, P.; Martin-Aragon, S.; Jimenez-Aliaga, K.L.; Ortega, A.; Molina, M.T.; Buxaderas, E.; Orellana, G.; Csaky, A.G. In vitro antiamyloidogenic properties of 1,4-naphthoquinones. Biochem Biophys Res Commun 2010, 400, 169–174. [CrossRef]
- Agafonova, I.; Chingizova, E.; Chaikina, E.; Menchinskaya, E.; Kozlovskiy, S.; Likhatskaya, G.; Sabutski, Y.; Polonik, S.; Aminin, D.; Pislyagin, E. Protection Activity of 1,4-Naphthoquinones in Rotenone-Induced Models of Neurotoxicity. Mar Drugs 2024, 22. [CrossRef]
- Li, X.; Himes, R.A.; Prosser, L.C.; Christie, C.F.; Watt, E.; Edwards, S.F.; Metcalf, C.S.; West, P.J.; Wilcox, K.S.; Chan, S.S.L.; et al. Discovery of the First Vitamin K Analogue as a Potential Treatment of Pharmacoresistant Seizures. J Med Chem 2020, 63, 5865–5878. [CrossRef]
- Mishima, E.; Ito, J.; Wu, Z.; Nakamura, T.; Wahida, A.; Doll, S.; Tonnus, W.; Nepachalovich, P.; Eggenhofer, E.; Aldrovandi, M.; et al. A non-canonical vitamin K cycle is a potent ferroptosis suppressor. Nature 2022, 608, 778–783. [CrossRef]
- Ou, M.; Jiang, Y.; Ji, Y.; Zhou, Q.; Du, Z.; Zhu, H.; Zhou, Z. Role and mechanism of ferroptosis in neurological diseases. Mol Metab 2022, 61, 101502. [CrossRef]
- Dixon, S.J.; Lemberg, K.M.; Lamprecht, M.R.; Skouta, R.; Zaitsev, E.M.; Gleason, C.E.; Patel, D.N.; Bauer, A.J.; Cantley, A.M.; Yang, W.S.; et al. Ferroptosis: an iron-dependent form of nonapoptotic cell death. Cell 2012, 149, 1060–1072. [CrossRef]
- Yang, W.S.; Kim, K.J.; Gaschler, M.M.; Patel, M.; Shchepinov, M.S.; Stockwell, B.R. Peroxidation of polyunsaturated fatty acids by lipoxygenases drives ferroptosis. Proc Natl Acad Sci U S A 2016, 113, E4966–4975. [CrossRef]
- Yang, W.S.; SriRamaratnam, R.; Welsch, M.E.; Shimada, K.; Skouta, R.; Viswanathan, V.S.; Cheah, J.H.; Clemons, P.A.; Shamji, A.F.; Clish, C.B.; et al. Regulation of ferroptotic cancer cell death by GPX4. Cell 2014, 156, 317–331. [CrossRef]
- Doll, S.; Proneth, B.; Tyurina, Y.Y.; Panzilius, E.; Kobayashi, S.; Ingold, I.; Irmler, M.; Beckers, J.; Aichler, M.; Walch, A.; et al. ACSL4 dictates ferroptosis sensitivity by shaping cellular lipid composition. Nat Chem Biol 2017, 13, 91–98. [CrossRef]
- Bersuker, K.; Hendricks, J.M.; Li, Z.; Magtanong, L.; Ford, B.; Tang, P.H.; Roberts, M.A.; Tong, B.; Maimone, T.J.; Zoncu, R.; et al. The CoQ oxidoreductase FSP1 acts parallel to GPX4 to inhibit ferroptosis. Nature 2019, 575, 688–692. [CrossRef]
- Doll, S.; Freitas, F.P.; Shah, R.; Aldrovandi, M.; da Silva, M.C.; Ingold, I.; Goya Grocin, A.; Xavier da Silva, T.N.; Panzilius, E.; Scheel, C.H.; et al. FSP1 is a glutathione-independent ferroptosis suppressor. Nature 2019, 575, 693–698. [CrossRef]
- Lu, J.; Li, H.; Yu, Z.; Cao, C.; Xu, Z.; Peng, L.; Zhang, J.H.; Chen, G. Cathepsin B as a key regulator of ferroptosis in microglia following intracerebral hemorrhage. Neurobiol Dis 2024, 194, 106468. [CrossRef]
- Nagakannan, P.; Islam, M.I.; Conrad, M.; Eftekharpour, E. Cathepsin B is an executioner of ferroptosis. Biochim Biophys Acta Mol Cell Res 2021, 1868, 118928. [CrossRef]
- Gao, H.; Bai, Y.; Jia, Y.; Zhao, Y.; Kang, R.; Tang, D.; Dai, E. Ferroptosis is a lysosomal cell death process. Biochem Biophys Res Commun 2018, 503, 1550–1556. [CrossRef]
- Chen, X.; Song, X.; Li, J.; Zhang, R.; Yu, C.; Zhou, Z.; Liu, J.; Liao, S.; Klionsky, D.J.; Kroemer, G.; et al. Identification of HPCAL1 as a specific autophagy receptor involved in ferroptosis. Autophagy 2023, 19, 54–74. [CrossRef]
- Ke, W.; Liao, Z.; Liang, H.; Tong, B.; Song, Y.; Li, G.; Ma, L.; Wang, K.; Feng, X.; Li, S.; et al. Stiff Substrate Induces Nucleus Pulposus Cell Ferroptosis via YAP and N-Cadherin Mediated Mechanotransduction. Adv Healthc Mater 2023, 12, e2300458. [CrossRef]
- Neo Shin, N.; Jeon, H.; Jung, Y.; Baek, S.; Lee, S.; Yoo, H.C.; Bae, G.H.; Park, K.; Yang, S.H.; Han, J.M.; et al. Fluorescent 1,4-Naphthoquinones To Visualize Diffuse and Dense-Core Amyloid Plaques in APP/PS1 Transgenic Mouse Brains. ACS Chem Neurosci 2019, 10, 3031–3044. [CrossRef]
- Ryu, C.-K.; Chae, M.J. Synthesis and antifungal activity of naphthalene-1, 4-diones modified at positions 2, 3, and 5. Archives of pharmacal research 2005, 28, 750–755.
- Lee, J.-A.; Jung, S.-H.; Bae, M.K.; Ryu, C.-K.; Lee, J.-Y.; Chung, J.-H.; Kim, H.-J. Pharmacological effects of novel quinone compounds, 6-(fluorinated-phenyl) amino-5, 8-quinolinediones, on inhibition of drug-induced relaxation of rat aorta and their putative action mechanism. General Pharmacology: The Vascular System 2000, 34, 33–42.
- Ryu, C.K.; Lee, Y.; Park, S.G.; You, H.J.; Lee, R.Y.; Lee, S.Y.; Choi, S. 3D-QSAR studies of heterocyclic quinones with inhibitory activity on vascular smooth muscle cell proliferation using pharmacophore-based alignment. Bioorg Med Chem 2008, 16, 9772–9779. [CrossRef]
- Soriano-Castell, D.; Currais, A.; Maher, P. Defining a pharmacological inhibitor fingerprint for oxytosis/ferroptosis. Free Radic Biol Med 2021, 171, 219–231. [CrossRef]
- Nitsch, R.M.; Wurtman, R.J.; Growdon, J.H. Regulation of APP processing. Potential for the therapeutical reduction of brain amyloid burden. Ann N Y Acad Sci 1996, 777, 175–182. [CrossRef]
- Rusina, E.; Bernard, C.; Williamson, A. The Kainic Acid Models of Temporal Lobe Epilepsy. eNeuro 2021, 8. [CrossRef]
- Racine, R.J. Modification of seizure activity by electrical stimulation: II. Motor seizure. Electroencephalography and clinical neurophysiology 1972, 32, 281–294.
- Chen, X.; Nelson, C.D.; Li, X.; Winters, C.A.; Azzam, R.; Sousa, A.A.; Leapman, R.D.; Gainer, H.; Sheng, M.; Reese, T.S. PSD-95 is required to sustain the molecular organization of the postsynaptic density. J Neurosci 2011, 31, 6329–6338. [CrossRef]
- Derycke, L.; De Wever, O.; Stove, V.; Vanhoecke, B.; Delanghe, J.; Depypere, H.; Bracke, M. Soluble N-cadherin in human biological fluids. Int J Cancer 2006, 119, 2895–2900. [CrossRef]
- Utton, M.A.; Eickholt, B.; Howell, F.V.; Wallis, J.; Doherty, P. Soluble N-cadherin stimulates fibroblast growth factor receptor dependent neurite outgrowth and N-cadherin and the fibroblast growth factor receptor co-cluster in cells. J Neurochem 2001, 76, 1421–1430. [CrossRef]
- Cha, H.J.; Choi, J.H.; Park, I.C.; Kim, C.H.; An, S.K.; Kim, T.J.; Lee, J.H. Selective FGFR inhibitor BGJ398 inhibits phosphorylation of AKT and STAT3 and induces cytotoxicity in sphere-cultured ovarian cancer cells. Int J Oncol 2017, 50, 1279–1288. [CrossRef]
- Hart, K.C.; Robertson, S.C.; Kanemitsu, M.Y.; Meyer, A.N.; Tynan, J.A.; Donoghue, D.J. Transformation and Stat activation by derivatives of FGFR1, FGFR3, and FGFR4. Oncogene 2000, 19, 3309–3320.
- Jin, Y.; Ren, L.; Jing, X.; Wang, H. Targeting ferroptosis as novel therapeutic approaches for epilepsy. Front Pharmacol 2023, 14, 1185071. [CrossRef]
- Xie, R.; Zhao, W.; Lowe, S.; Bentley, R.; Hu, G.; Mei, H.; Jiang, X.; Sun, C.; Wu, Y.; Yueying, L. Quercetin alleviates kainic acid-induced seizure by inhibiting the Nrf2-mediated ferroptosis pathway. Free Radic Biol Med 2022, 191, 212–226. [CrossRef]
- Yang, N.; Zhang, K.; Guan, Q.W.; Wang, Z.J.; Chen, K.N.; Mao, X.Y. D-Penicillamine Reveals the Amelioration of Seizure-Induced Neuronal Injury via Inhibiting Aqp11-Dependent Ferroptosis. Antioxidants (Basel) 2022, 11. [CrossRef]
- Ye, Q.; Zeng, C.; Dong, L.; Wu, Y.; Huang, Q.; Wu, Y. Inhibition of ferroptosis processes ameliorates cognitive impairment in kainic acid-induced temporal lobe epilepsy in rats. American journal of translational research 2019, 11, 875.
- Banerjee, M.; Sasse, V.A.; Wang, Y.; Maulik, M.; Kar, S. Increased levels and activity of cathepsins B and D in kainate-induced toxicity. Neuroscience 2015, 284, 360–373. [CrossRef]
- Guo, F.; Ling, G.; Qiu, J.; Li, J.; Gan, Y.; Yu, Y.; Tang, J.; Mo, L.; Piao, H. Juglone induces ferroptosis in glioblastoma cells by inhibiting the Nrf2-GPX4 axis through the phosphorylation of p38MAPK. Chin Med 2024, 19, 52. [CrossRef]
- Zhan, S.; Lu, L.; Pan, S.S.; Wei, X.Q.; Miao, R.R.; Liu, X.H.; Xue, M.; Lin, X.K.; Xu, H.L. Targeting NQO1/GPX4-mediated ferroptosis by plumbagin suppresses in vitro and in vivo glioma growth. Br J Cancer 2022, 127, 364–376. [CrossRef]
- Alves, F.; Lane, D.; Nguyen, T.P.M.; Bush, A.I.; Ayton, S. In defence of ferroptosis. Signal Transduct Target Ther 2025, 10, 2. [CrossRef]
- Bouchaoui, H.; Mahoney-Sanchez, L.; Garcon, G.; Berdeaux, O.; Alleman, L.Y.; Devos, D.; Duce, J.A.; Devedjian, J.C. ACSL4 and the lipoxygenases 15/15B are pivotal for ferroptosis induced by iron and PUFA dyshomeostasis in dopaminergic neurons. Free Radic Biol Med 2023, 195, 145–157. [CrossRef]
- Kuang, F.; Liu, J.; Li, C.; Kang, R.; Tang, D. Cathepsin B is a mediator of organelle-specific initiation of ferroptosis. Biochem Biophys Res Commun 2020, 533, 1464–1469. [CrossRef]
- Xie, J.; Luo, D.; Xing, P.; Ding, W. The Dual Roles of STAT3 in Ferroptosis: Mechanism, Regulation and Therapeutic Potential. J Inflamm Res 2025, 18, 4251–4266. [CrossRef]
- Zhang, H.; Zhang, J.; Jing, X.; Huang, K.; Chen, Y.; Shen, Q.; Tao, E.; Lin, D. Involvement of the STAT3/HIF-1alpha signaling pathway in alpha-synuclein-induced ferroptosis. Biochem Biophys Res Commun 2025, 752, 151419. [CrossRef]
- Chen, B.; Shi, G.; Xu, J.; Zhang, X.; Zhu, Y.; Li, L.; Wang, C.; Gheyret, D.; Wang, J.; Liu, X.; et al. IL-23 promotes neuronal ferroptosis via IL-23R/STAT3 signaling after traumatic brain injury. Cell Commun Signal 2025, 23, 317. [CrossRef]
- Chi, F.; Griffiths, J.I.; Nath, A.; Bild, A.H. Paradoxical cancer cell proliferation after FGFR inhibition through decreased p21 signaling in FGFR1-amplified breast cancer cells. Breast Cancer Res 2024, 26, 54. [CrossRef]
- Polish, N.V.; Nesterkina, M.V.; Protunkevych, M.S.; Karkhut, A.I.; Marintsova, N.G.; Polovkovych, S.V.; Ikravchenko, I.A.; Voskoboinik, O.Y.; Kovalenko, S.I.; Karpenko, O.V. Synthesis and pharmacological evaluation of novel naphthoquinone derivatives containing 1,2,4-triazine and 1,2,4-triazole moieties of methylene blue on the surface of a "core–shell" type catalyst for the Fenton system. Voprosy Khimii i Khimicheskoi Tekhnologii 2021, 97–104. [CrossRef]
- Nosratiyan, N.; Ghasemi-Kasman, M.; Pourghasem, M.; Feizi, F.; Sadeghi, F. Plumbagin Improves Cognitive Function via Attenuating Hippocampal Inflammation in Valproic Acid-Induced Autism Model. Brain Sci 2025, 15. [CrossRef]
- Putra, M.; Rao, N.S.; Gardner, C.; Liu, G.; Trommater, J.; Bunney, M.; Gage, M.; Bassuk, A.G.; Hefti, M.; Lee, G.; et al. Enhanced Fyn-tau and NR2B-PSD95 interactions in epileptic foci in experimental models and human epilepsy. Brain Commun 2024, 6, fcae327. [CrossRef]
- Avdic, U.; Ahl, M.; Chugh, D.; Ali, I.; Chary, K.; Sierra, A.; Ekdahl, C.T. Nonconvulsive status epilepticus in rats leads to brain pathology. Epilepsia 2018, 59, 945–958. [CrossRef]
- Ye, Q.; Zeng, C.; Luo, C.; Wu, Y. Ferrostatin-1 mitigates cognitive impairment of epileptic rats by inhibiting P38 MAPK activation. Epilepsy Behav 2020, 103, 106670. [CrossRef]
- Zhang, M.; Lyu, D.; Wang, F.; Shi, S.; Wang, M.; Yang, W.; Huang, H.; Wei, Z.; Chen, S.; Xu, Y.; et al. Ketamine May Exert Rapid Antidepressant Effects Through Modulation of Neuroplasticity, Autophagy, and Ferroptosis in the Habenular Nucleus. Neuroscience 2022, 506, 29–37. [CrossRef]
- Hung, C.F.; Chiu, W.C.; Chen, J.C.; Chuang, W.C.; Wang, S.J. NRICM101 prevents kainic acid-induced seizures in rats by modulating neuroinflammation and the glutamatergic system. Int Immunopharmacol 2024, 140, 112842. [CrossRef]
- Bugra, K.; Pollard, H.; Charton, G.; Moreau, J.; Ben-Ari, Y.; Khrestchatisky, M. aFGF, bFGF and flg mRNAs show distinct patterns of induction in the hippocampus following kainate-induced seizures. Eur J Neurosci 1994, 6, 58–66. [CrossRef]
Figure 1.
Selection of novel NQ derivatives preventing ferroptotic neuronal death (A-C) Cell viability was assessed using the WST-8 assay to identify candidate for ferroptosis inhibitors. HT22 cells were pretreated with 10 μM of various NQ derivatives (compound #1-6) or 1 μM ferrostatin-1 (Fer-1) for 30 min, followed by co-treatment with 20 mM glutamate (Glu; A, n=4), 5 mM Glu and 100 μM iron (III) sulfate (Fe₂(SO₄)₃) (B, n=4) or 50 nM RSL3 (C, n=6) for 24 h. Fer-1 was used as positive control. (D) Chemical structures of 8-HANQ (compound #1) and 5-HANQ (compound #2). (E-F) Cytotoxicity of 8-HANQ (E, n=6) and 5-HANQ (F, n=4) was evaluated in the absence of ferroptosis inducers. HT22 cells were treated with increasing concentrations (10-100 μM) of each compound for 24 h, and viability was measured using the WST-8 assay. Statistical significance was determined by one-way ANOVA. Data are presented as means ± SEM. (**p < 0.01 vs. Control (Ctrl, 0) ; #p < 0.05 and ##p < 0.01 vs. Glu, Glu+Fe₂(SO₄)₃, RSL3). n indicates independent experiments.
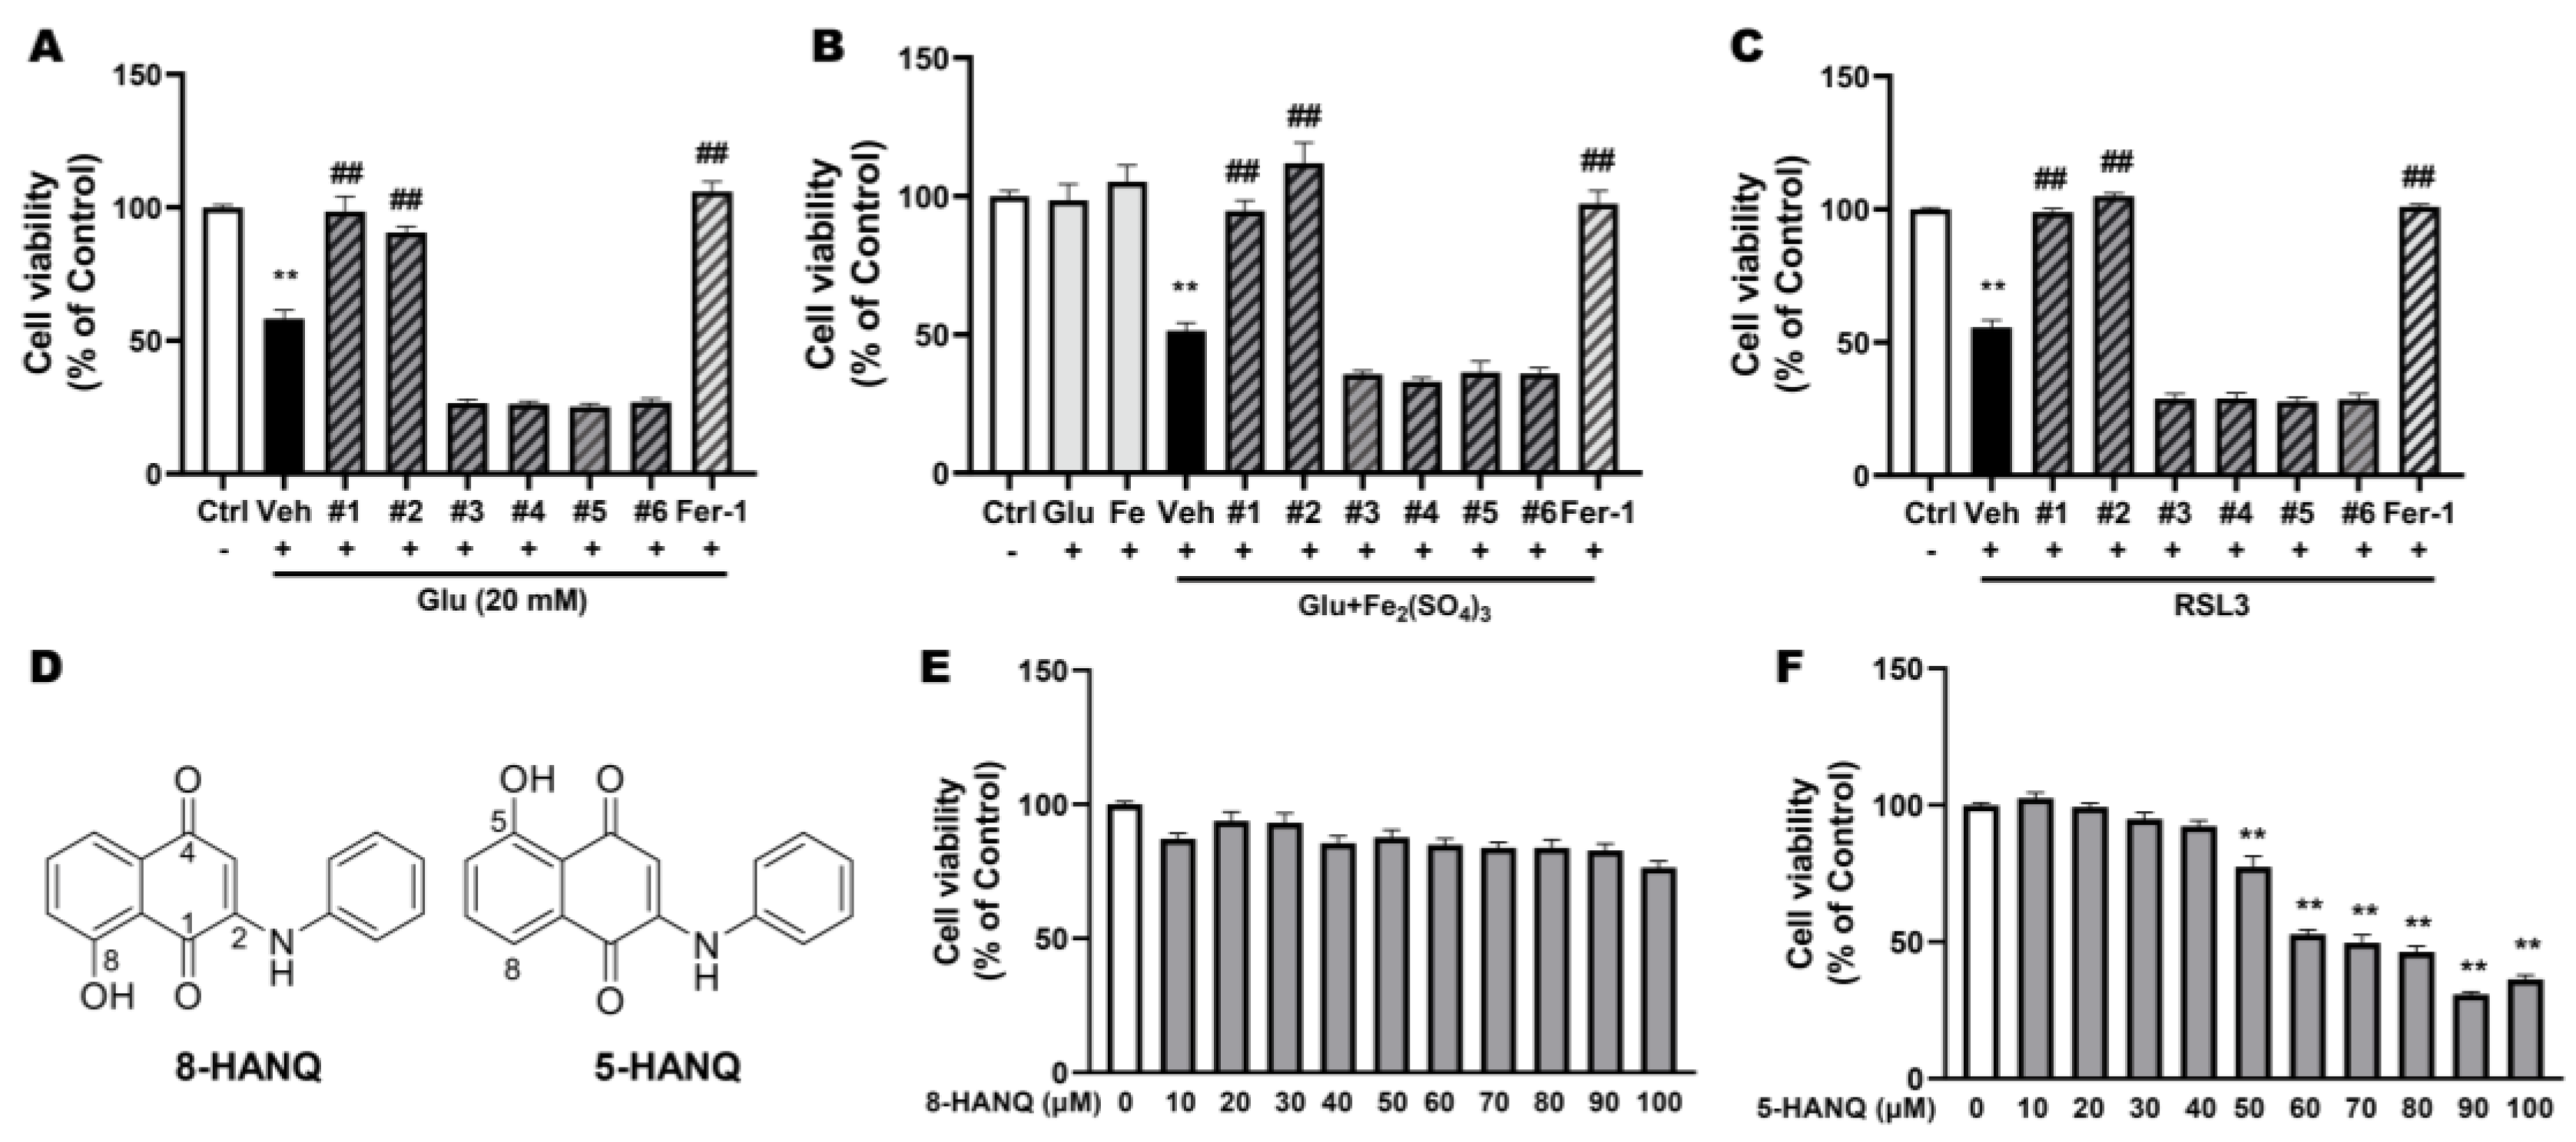
Figure 2.
Protection against ferroptosis and preservation of synaptic proteins by 8-HANQ (A-C) Dose-dependent neuroprotective effects of 8-HANQ were assessed in toxic concentration of glutamate- (Glu; A, n=5), subtoxic combination of Glu and iron (III) sulfate (Fe₂(SO₄)₃)- (B, n=6), and RSL3- (C, n=4) induced ferroptosis models. 8-HANQ (0.01-10 μM) was applied 30 min prior to treatment with 20 mM Glu, 5 mM Glu and 100 μM Fe₂(SO₄)₃ or 50 nM RSL3 and incubated for 24 h. Statistical significance was determined by one-way ANOVA. (D-G) Western blot analysis and quantification of synaptic markers including synapsin-1 (Syn-1; D-E, n=4) and PSD95 (F-G, n=6) expression. Cells were pretreated with 8-HANQ (5-10 μM) or for 30 min following co-treatment with 200 nM RSL3 or 20 mM Glu and 25 μM Fe₂(SO₄)₃ for 24 h. Data are presented as means ± SEM. Statistical significance was assessed using Student’s t-test. (**p < 0.01 vs. Control (0) ; #p < 0.05 and ##p < 0.01 vs. Glu, RSL3, Glu+Fe₂(SO₄)₃). n indicates independent experiments.
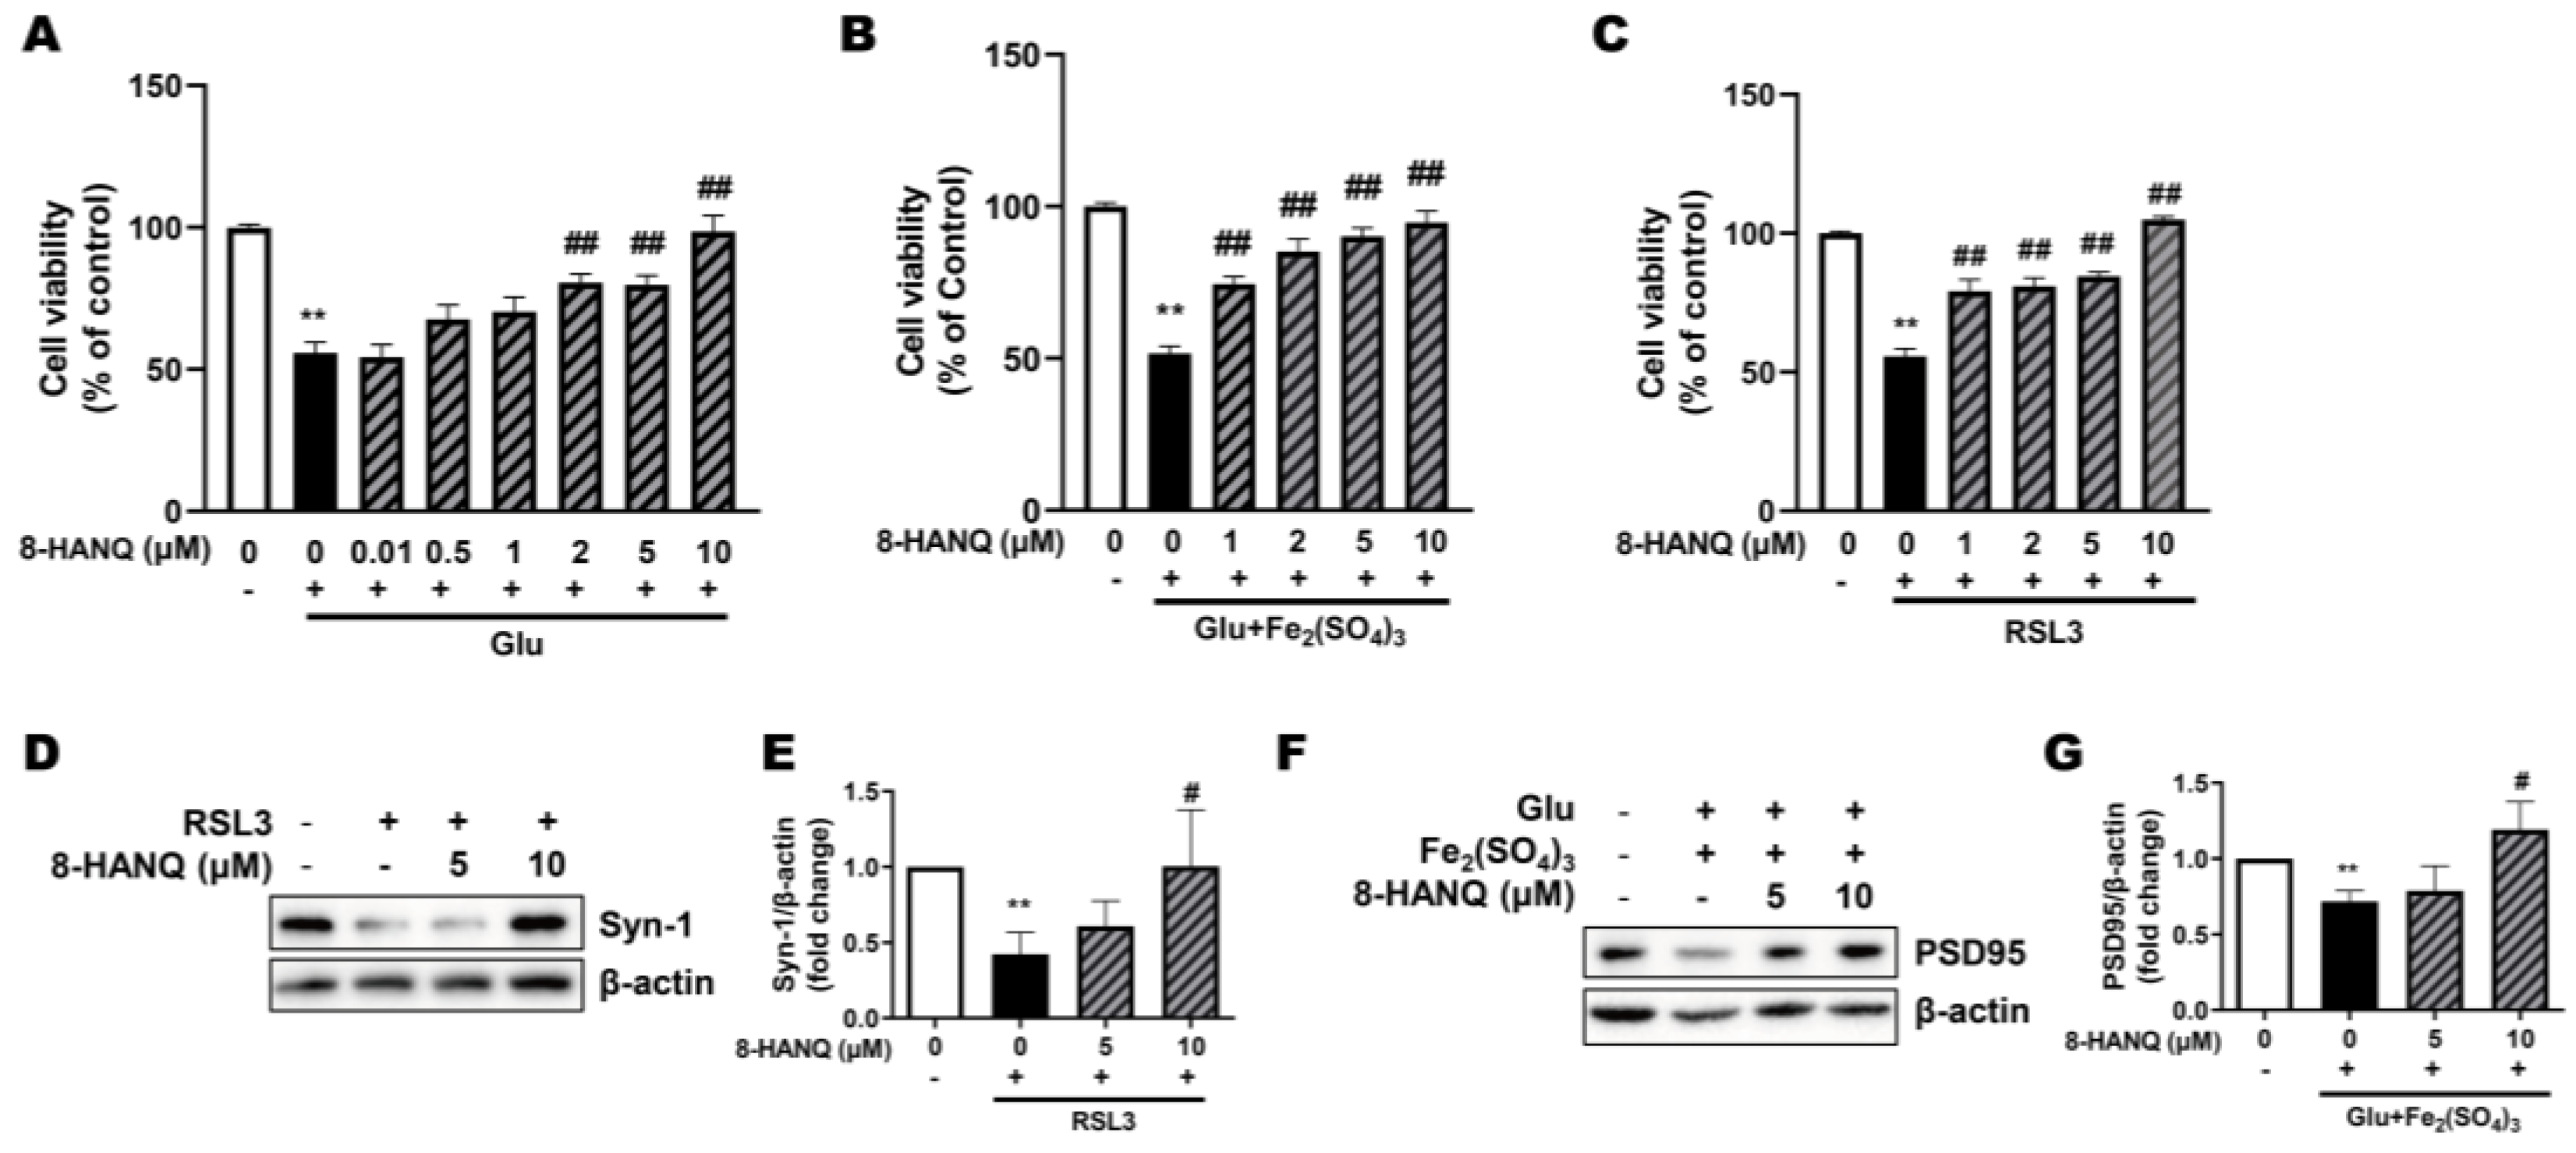
Figure 3.
Suppression of increased ferroptosis-associated lipid ROS and ACSL4 levels by 8-HANQ. (A-D) Lipid ROS levels were measured using C11-BODIPY581/591 fluorescence with flow cytometry. 8-HANQ (5-10 μM) was applied 30 min prior to treatment with 30 mM glutamate (Glu; A-B, n=7) or 200 nM RSL3 (C-D, n=8) for 24 h. Statistical significance was determined by one-way ANOVA. (E) Representative fluorescence images of C11-BODIPY581/591 staining obtained after 24 h of Glu (30 mM) exposure with or without 8-HANQ pretreatment (5-10 μM). Scale bar: 50 μm (n = 4). (F-G) Western blot analysis and quantification of ACSL4. HT22 cells were pretreated with 8-HANQ (5-20 μM) 30 min, followed by exposure to 20 mM Glu and 25 μM iron (III) sulfate (Fe₂(SO₄)₃) for 24 h (n=4). Data are presented as means ± SEM. Statistical significance was assessed using Student’s t-test. (**p < 0.01 vs. Control (Ctrl, 0) ; ##p < 0.01 vs. Glu, RSL3, Glu+Fe₂(SO₄)₃). n indicates independent experiments.
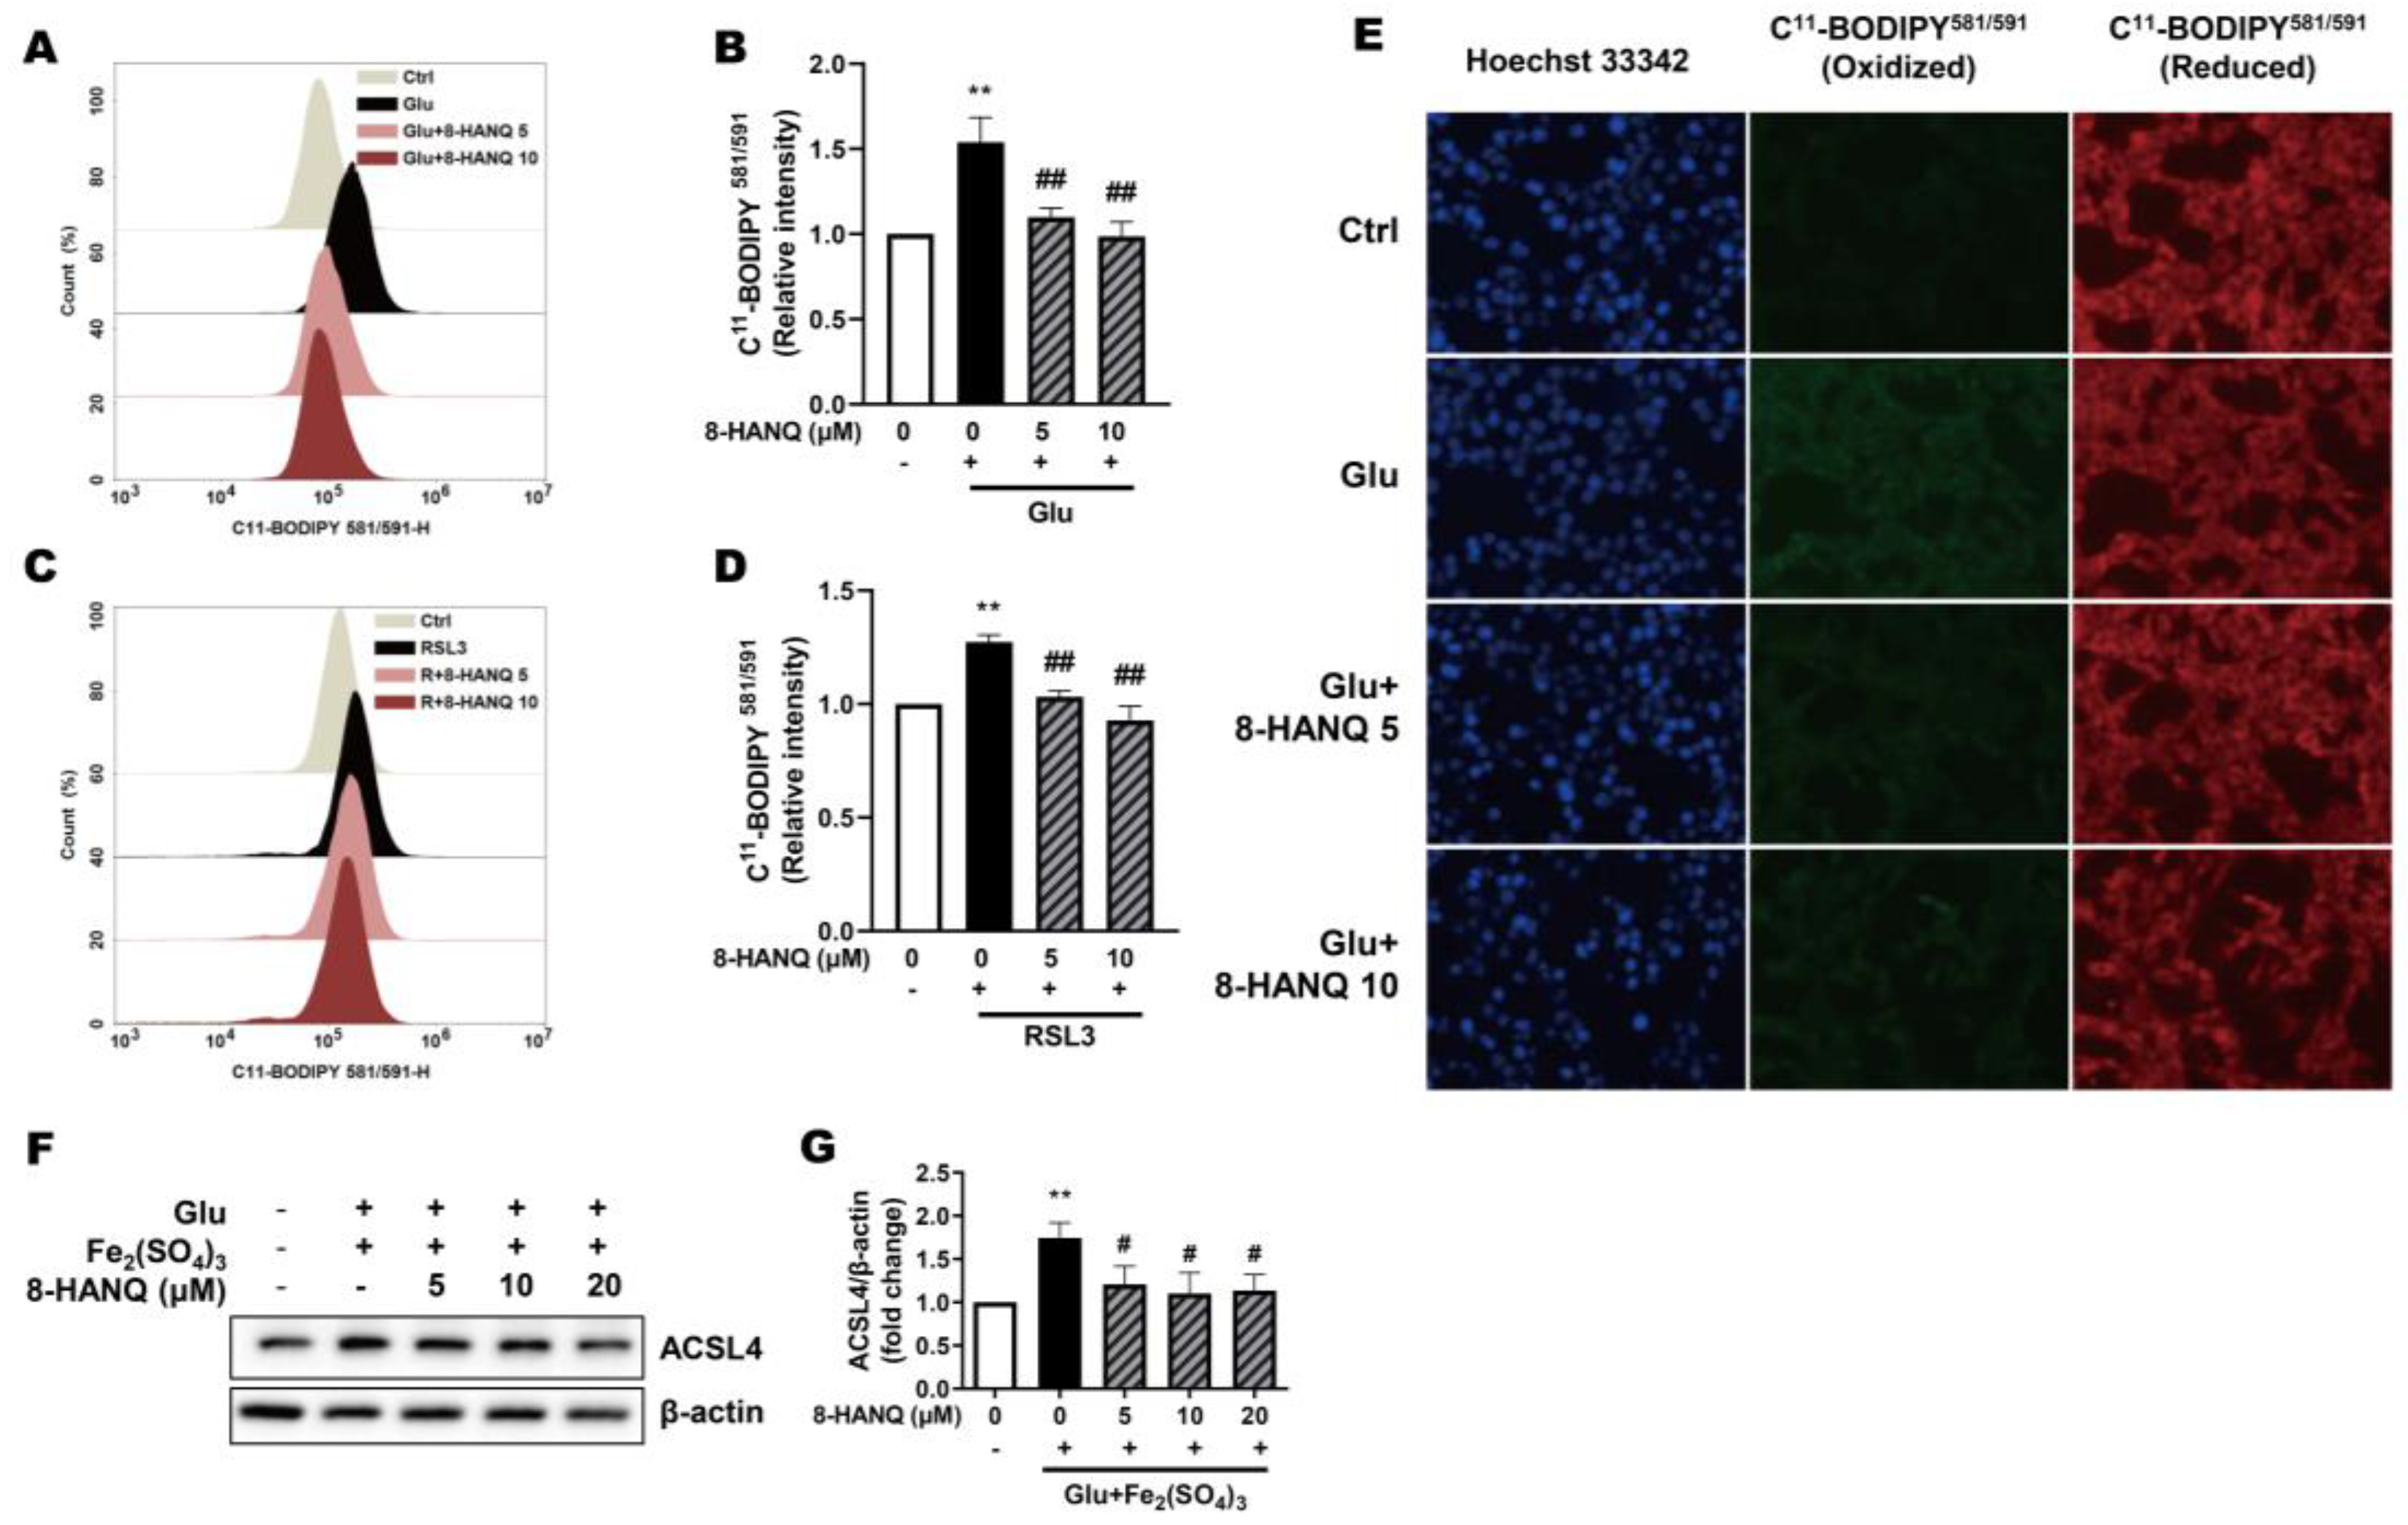
Figure 4.
Modulation of STAT3-dependent cathepsin-B overexpression by 8-HANQ independently of GPX4 regulation. (A-D) Western blot analysis of GPX4 (A-B, n=3) and LC3-II (C-D, n=5) expression in RSL3-induced ferroptotic HT22 cells. Cells were pretreated with 8-HANQ (2.5-20 μM) or 10 μM ferrostatin-1 (Fer-1) for 30 min, followed by co-treatment with 200 nM RSL3 for 24 h. (E-J) Western blot images and quantification of cathepsin-B (CTSB) levels (E-G; F, n=4; G, n=5) and pSTAT3/STAT3 (H-J; I, n=5; J, n=6). Cells were pretreated with 8-HANQ (2.5-20 μM) for 30 min, followed by co-incubation with either 30 mM glutamate (Glu) or 200 nM RSL3 for 24 h. Data represent means ± SEM. Statistical significance was assessed using one-way ANOVA (A-B) or Student’s t-test (C-J). (*p < 0.05 and **p < 0.01 vs. Control (0) ; #p < 0.05 and ##p < 0.01 vs. Glu, RSL3). n indicates independent experiments.
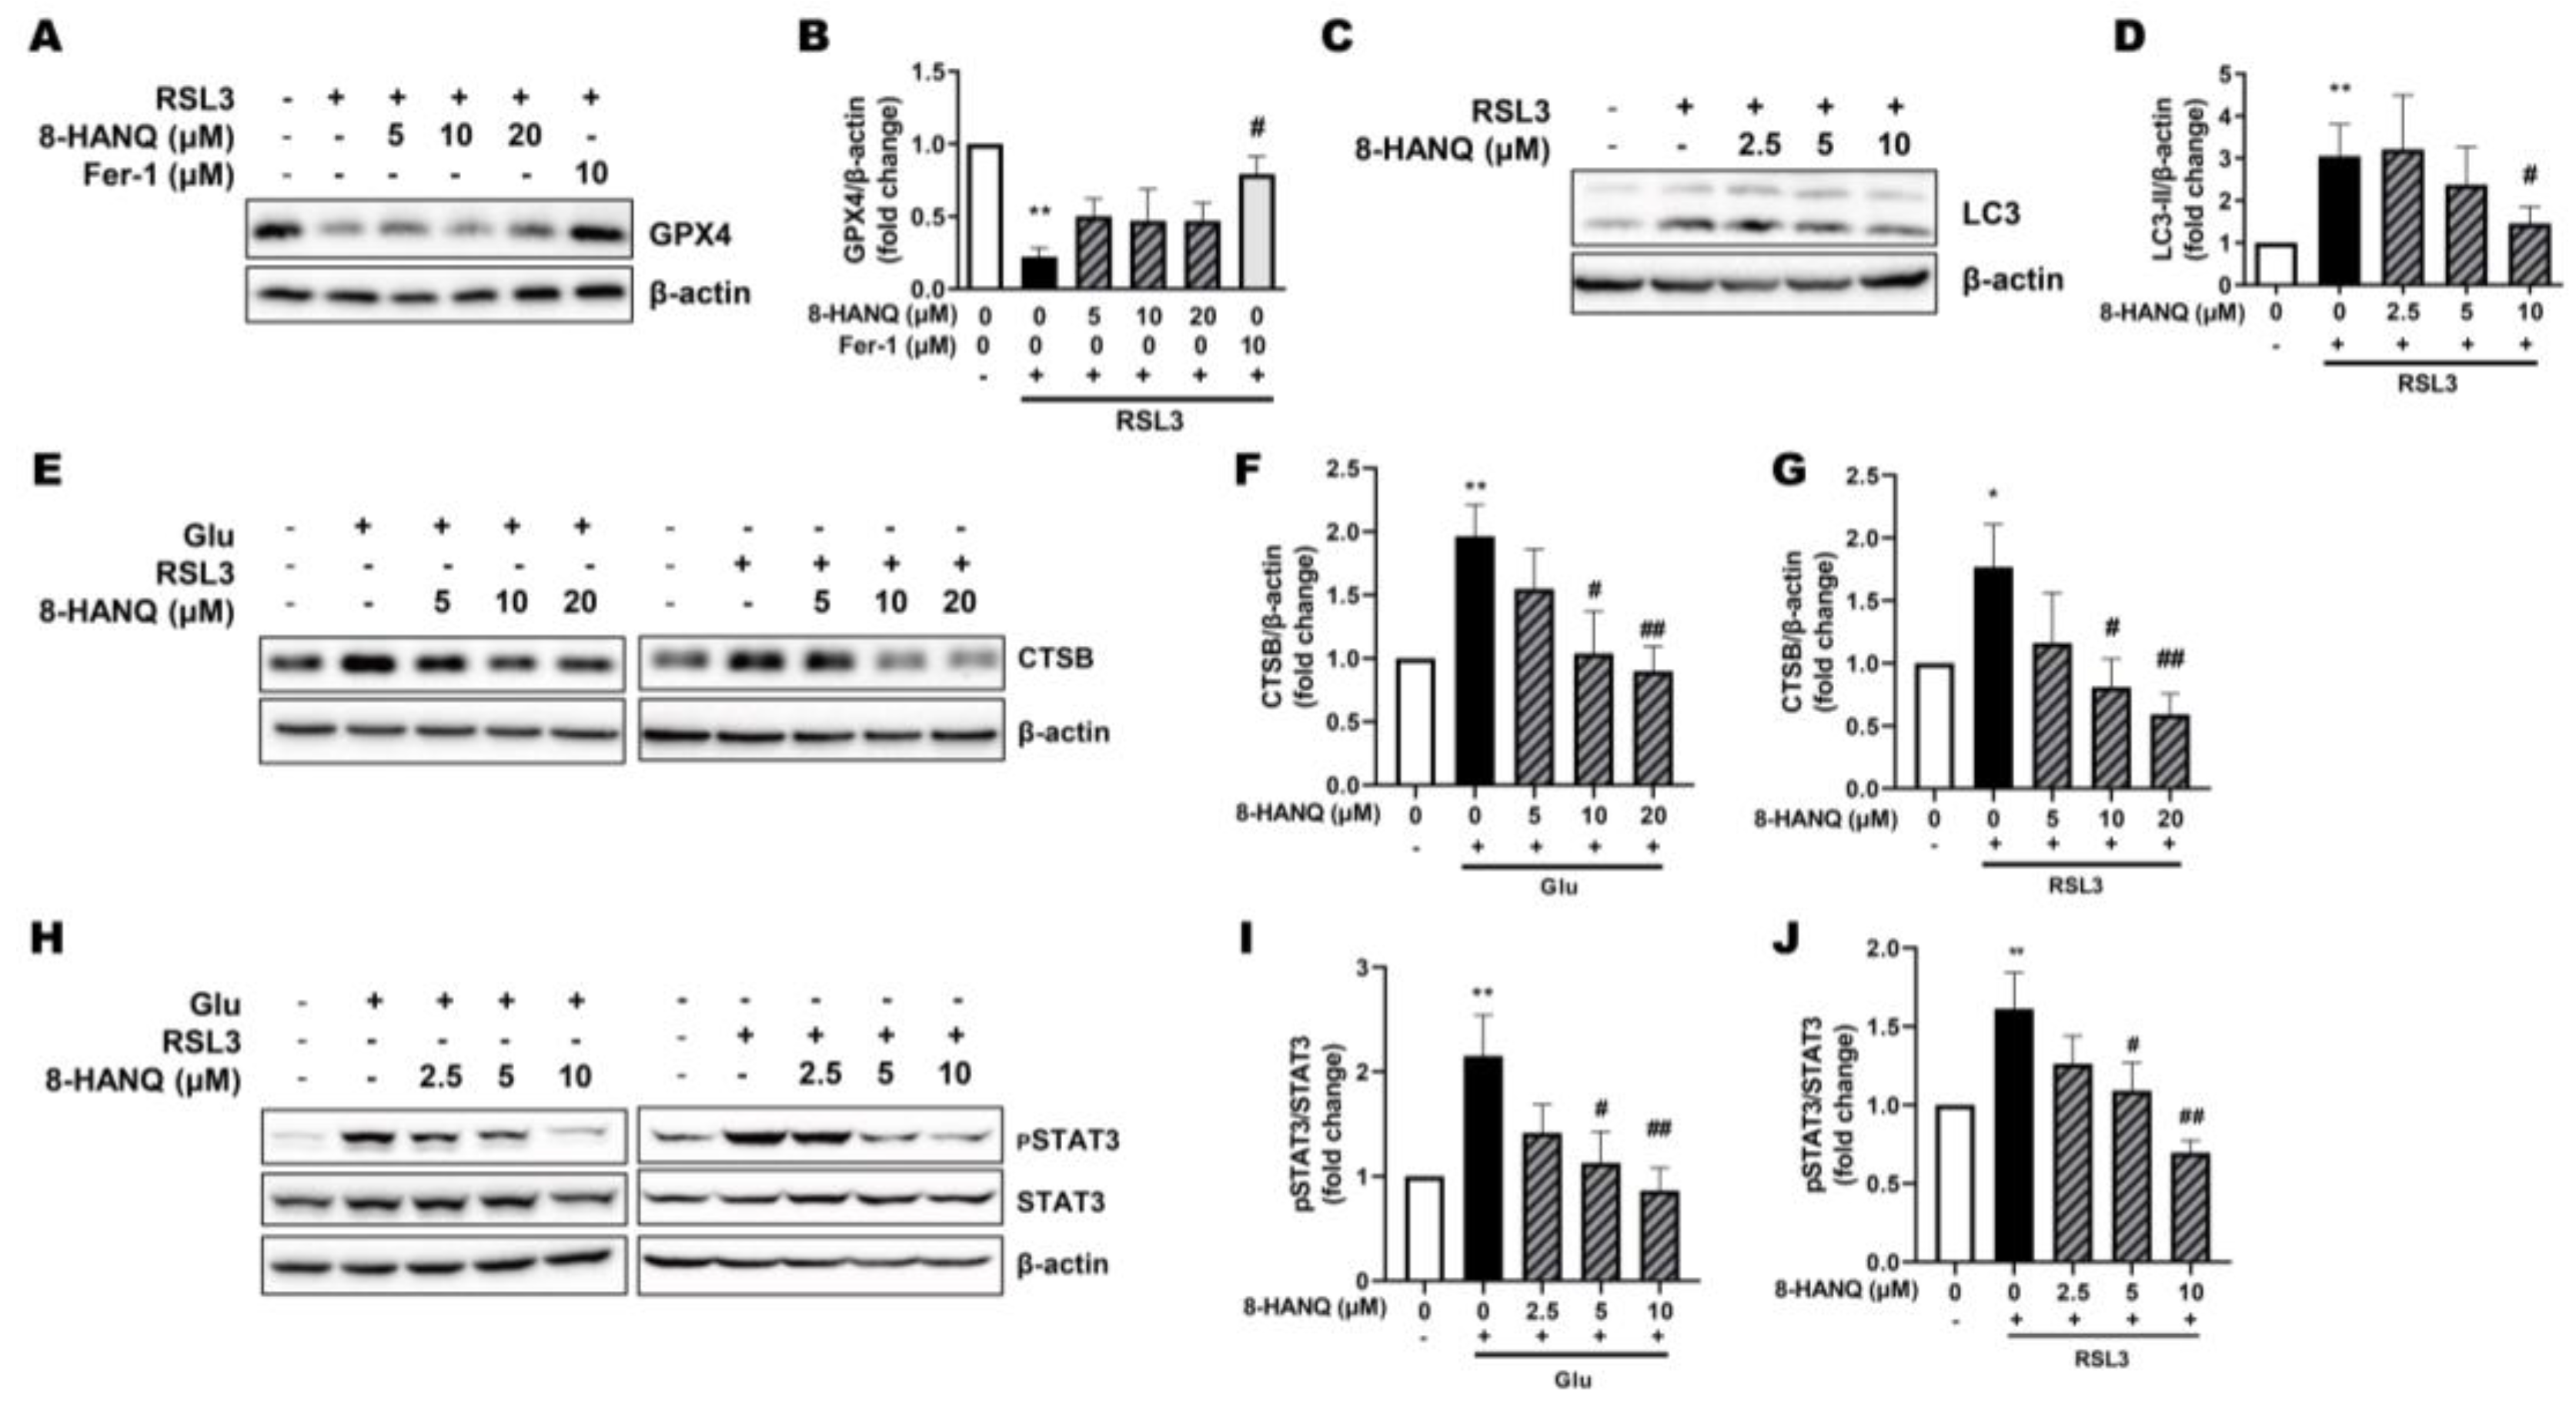
Figure 5.
Suppressive effect of 8-HANQ on increased levels of FGFR1, pSTAT3/STAT3, cathepsin-B and soluble N-cadherin release during ferroptosis. (A-D) Western blot analysis and quantification of soluble N-cadherin in cell lysates (A-B, n=7) and culture supernatants (C-D, n=7). Cells were pretreated with 8-HANQ (2.5-10 μM) for 30 min, followed by exposure to 200 nM RSL3 for 24 h. Supernatants were concentrated from cell culture media using desalting columns prior to analysis. (E-H) Western blot analysis and quantification of CTSB expression (E-F, n=3) and pSTAT3/STAT3 (G-H, n=4) following BGJ398 treatment during ferroptosis. Cells were pretreated with BGJ398 (10-100 nM) for 30 min before exposure to 200 nM RSL3 for 4 h (pSTAT3/STAT3) or 24 h (CTSB). (I) Measurement of cell protection of BGJ398 using the WST-8 assay. BGJ398 (1-5 nM) or 8-HANQ (5 μM) was added 30 min before exposure to 5 mM glutamate (Glu) and 100 μM iron (III) sulfate (Fe₂(SO₄)₃) or 50 nM RSL3 (n=6). (J-L) Western blot analysis and quantification of pFGFR1 and total FGFR1 following 8-HANQ (5-20 μM) treatment for 2 h and 30 mM Glu exposure for 6 h (n=4). Data represent means ± SEM. Statistical significance was assessed using one-way ANOVA (I) or Student’s t-test (A-H, J-L). (*p < 0.05 and **p < 0.01 vs. Control (0) ; #p < 0.05 and ##p < 0.01 vs. RSL3, Glu+Fe₂(SO₄)₃, Glu). n indicates independent experiments.
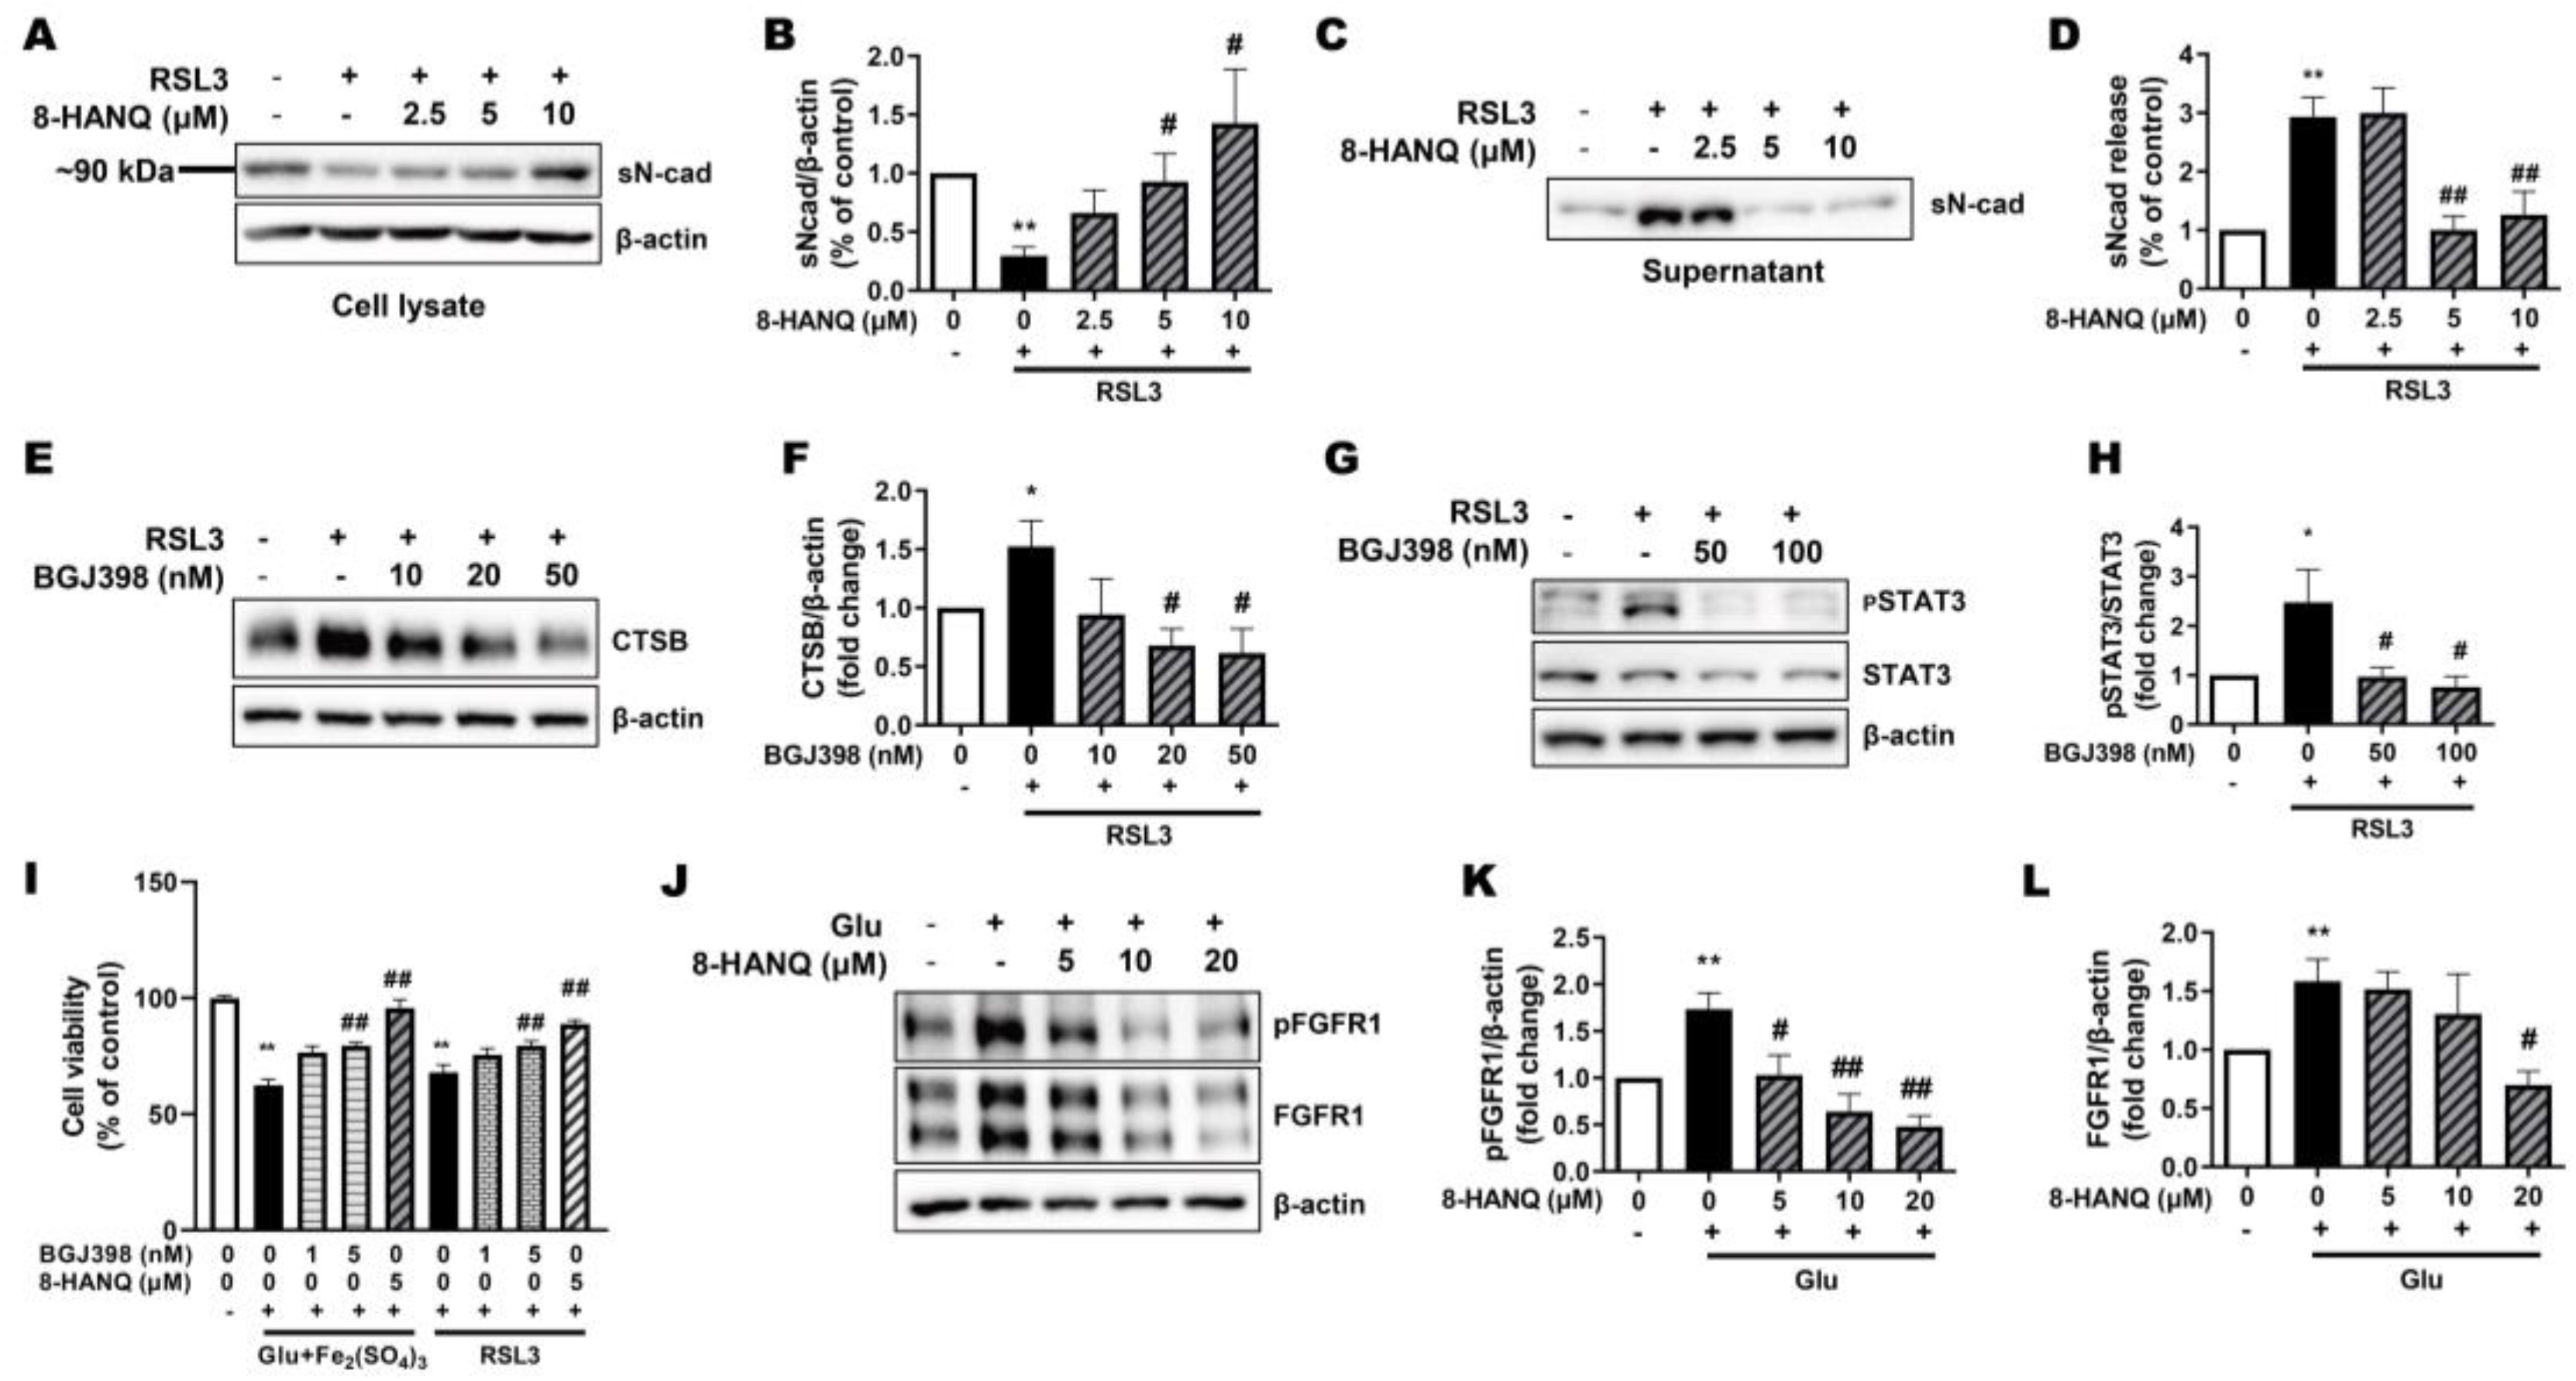
Figure 6.
Anti-seizure and neuroprotective effects of 8-HANQ in KA-induced mice. (A) Schematic illustration of the experimental design for assessing the protective effect of 8-HANQ in intraperitoneal (i.p.) kainate (KA)-induced seizure model. (B) Schematic illustration of the experimental design for evaluating the protective effect of 8-HANQ in intracerebroventricular (i.c.v.) injection of KA-induced seizure model. (C) Mice received i.c.v. injections of vehicle (Veh; 80% DMSO in saline, 1 μl; n=13), 8-HANQ (0.5 μg, n=3; 1 μg, n=8), or valproate (VPA; 150 μg, n=6) 2 h prior to i.p. administration of KA (40 mg/kg; n=12). Seizure behavior was monitored every 10 min for 150 min (from 30 min to 180 min after KA injection). Valproate was used as a positive control. (D) Mice were administered Veh (40% DMSO in saline, 1 μl; n=3) or 8-HANQ (1 μg, n=4) together with 0.2 μg KA (n=4) via i.c.v. injection. Seizure scores were recorded every 10 min for 150 min (from 60 to 210 min after surgery). Data are presented as means ± SEM. Statistical significance was determined by two-way ANOVA. (E-G) Western blot analysis and quantification of cathepsin-B (CTSB; E), pFGFR1/FGFR1 ratio (F), and PSD95 (G) in hippocampal tissues collected 72 h after intracerebroventricular KA administration. Data are presented as means ± SEM from 3 mice per group. Statistical significance was assessed using Student’s t-test. (*p < 0.05, and **p < 0.01 vs. Veh; #p < 0.05, and ##p < 0.01 vs. KA).
Disclaimer/Publisher’s Note: The statements, opinions and data contained in all publications are solely those of the individual author(s) and contributor(s) and not of MDPI and/or the editor(s). MDPI and/or the editor(s) disclaim responsibility for any injury to people or property resulting from any ideas, methods, instructions or products referred to in the content. |
© 2025 by the authors. Licensee MDPI, Basel, Switzerland. This article is an open access article distributed under the terms and conditions of the Creative Commons Attribution (CC BY) license (http://creativecommons.org/licenses/by/4.0/).
Copyright: This open access article is published under a Creative Commons CC BY 4.0 license, which permit the free download, distribution, and reuse, provided that the author and preprint are cited in any reuse.


