
Submitted:
30 September 2025
Posted:
30 September 2025
You are already at the latest version
Abstract
Peakedness is an important characteristic of probability distributions, and an effective method for quantifying peakedness is crucial for statistical modeling and comparing different probability distributions in many practical applications. However, there has long been a misconception that kurtosis (or excess kurtosis) serves as a measure of peakedness. In this paper, we propose a new measure for quantifying peakedness, named the “peakedness index”. The proposed index is defined as the ratio of the maximum density (or peak density) of the distribution to its continuous informity, where “continuous informity” is a concept from the newly developed theory of informity. The peakedness indices for nine well-known distributions are presented and compared to the traditional kurtosis measure.
Keywords:
informity
; peakedness
; probability density
; probability distribution
s as a measure of peakedness. In this paper, we propose a new measure for quantifying peakedness, named the “peakedness index”. The proposed index is defined as the ratio of the maximum density (or peak density) of the distribution to its continuous informity, where “continuous informity” is a concept from the newly developed theory of informity. The peakedness indices for nine well-known distributions are presented and compared to the traditional kurtosis measure.
1. Introduction
Peakedness is an important characteristic of probability distributions. An effective measure of peakedness can provide insights into the concentration of probability mass. It is useful to analysts and researchers when building statistical models and comparing different probability distributions in many practical applications.
There has been a long-standing misconception that kurtosis (or excess kurtosis) serves as a measure of the peakedness of a probability distribution. This misconception appears in many statistics textbooks, ranging from those used in introductory courses to those used in advanced graduate courses (DeCarlo, 1997). Westfall (2014) examined this misconception and provided insights through examples of distributions with the same kurtosis but different peaks. He concluded,
As I have shown, kurtosis tells you very little about the peak or center of a distribution. Thus, kurtosis should never be defined in terms of peakedness. To do so is counterproductive to the aim of fostering statistical literacy. The relationship of peakedness with kurtosis is now officially over.
If kurtosis is ruled out as a measure of peakedness, then the next question is: “What is the appropriate measure of the peakedness of a probability distribution?” This motivates consideration of alternative approaches.
Several quartile-based measures of peakedness have been proposed, including those by Hogg (1974), Ruppert (1987), Groeneveld and Meeden (1984), and Horn (1983). However, because these measures depend on the specific quartile chosen, they do not provide a unique numerical assessment of a distribution's peakedness. Moreover, some quartile-based measures, such as the one proposed by Horn (1983), are limited to symmetric distributions, which further restricts their general applicability as universal measures of peakedness.
In this paper, we propose a new measure for quantifying the peakedness of a probability distribution, named the “peakedness index”. The proposed index is defined as the ratio of the maximum density (or peak density) of the distribution to its continuous informity, where “continuous informity” is a concept in informity theory, recently proposed by Huang (2025). In the following sections, Section 2 describes the proposed peakedness index in detail. Section 3 explains the meaning of the proposed peakedness index. Section 4 compares the peakedness indices for the standard normal distribution and t-distribution. Section 5 presents conclusion.
2. The Proposed Peakedness Index
Definition. Consider a continuous random variable Y with probability density function (PDF) p(Y). The proposed peakedness index, denoted by ρ, is defined as
where is the maximum value of the PDF , is the continuous informity of the distribution, given by (Huang, 2025)
where represents the mathematical expectation.
The continuous informity is the mean density of the distribution, serving as a baseline against which the peak is compared. Therefore, the proposed peakedness index measures how pronounced the maximum density (or peak density) is relative to the mean density of the distribution.
In principle, the definition of the proposed peakedness index given by Eq. (1) is valid for any types of distributions: symmetric, asymmetric, and even multimodal. In the case of a unimodal distribution, the maximum density is attained at the mode, denoted as . Then, the proposed peakedness index becomes
Table 1 presents the PDFs, maximum densities, peakedness indices, and kurtoses for eight well-known distributions. The calculation of the peakedness indices utilizes the continuous informities for these distributions as reported by Huang (2025). This table allows for a direct comparison between the proposed peakedness index and the traditional kurtosis measure.
As can be seen from Table 1, the proposed peakedness index is well defined for all eight distributions, including the Cauchy distribution. In contrast, the kurtosis of the Cauchy distribution is undefined because its moments are undefined. In fact, the proposed peakedness index is applicable to any distribution, regardless of whether its moments exist. This is because both the maximum density (or peak density) and the continuous informity of a distribution always exist and can be determined numerically. Therefore, the peakedness index is a robust and universally applicable measure.
3. Meaning of the Proposed Peakedness Index
Note that the continuous informity is the mean density of the PDF p(Y). It can be interpreted as the density of an equivalent uniform distribution with the same continuous informity on an interval of length , where is referred to as the uncertainty length and is defined by the inverse of (Huang, 2025)
If the original distribution is symmetric about zero, then the support of its equivalent uniform distribution is . If the original distribution is defined on the support , where q>0, the support of its equivalent uniform distribution becomes .
Therefore, the proposed peakedness index quantifies the degree of peakedness of a probability distribution relative to its equivalent uniform distribution with the same continuous informity. As shown in Table 1, the peakedness index for the uniform distribution is 1, while the peakedness index for any other distribution is greater than 1. The higher the peakedness index, the more pronounced the peak, while the lower the peakedness index, the flatter the distribution. This interpretation aligns with common sense expectations regarding the shape of distributions.
Figure 1.
The standard normal distribution N(0,1) (dashed line) and its equivalent uniform distribution (solid line).
Figure 1.
The standard normal distribution N(0,1) (dashed line) and its equivalent uniform distribution (solid line).
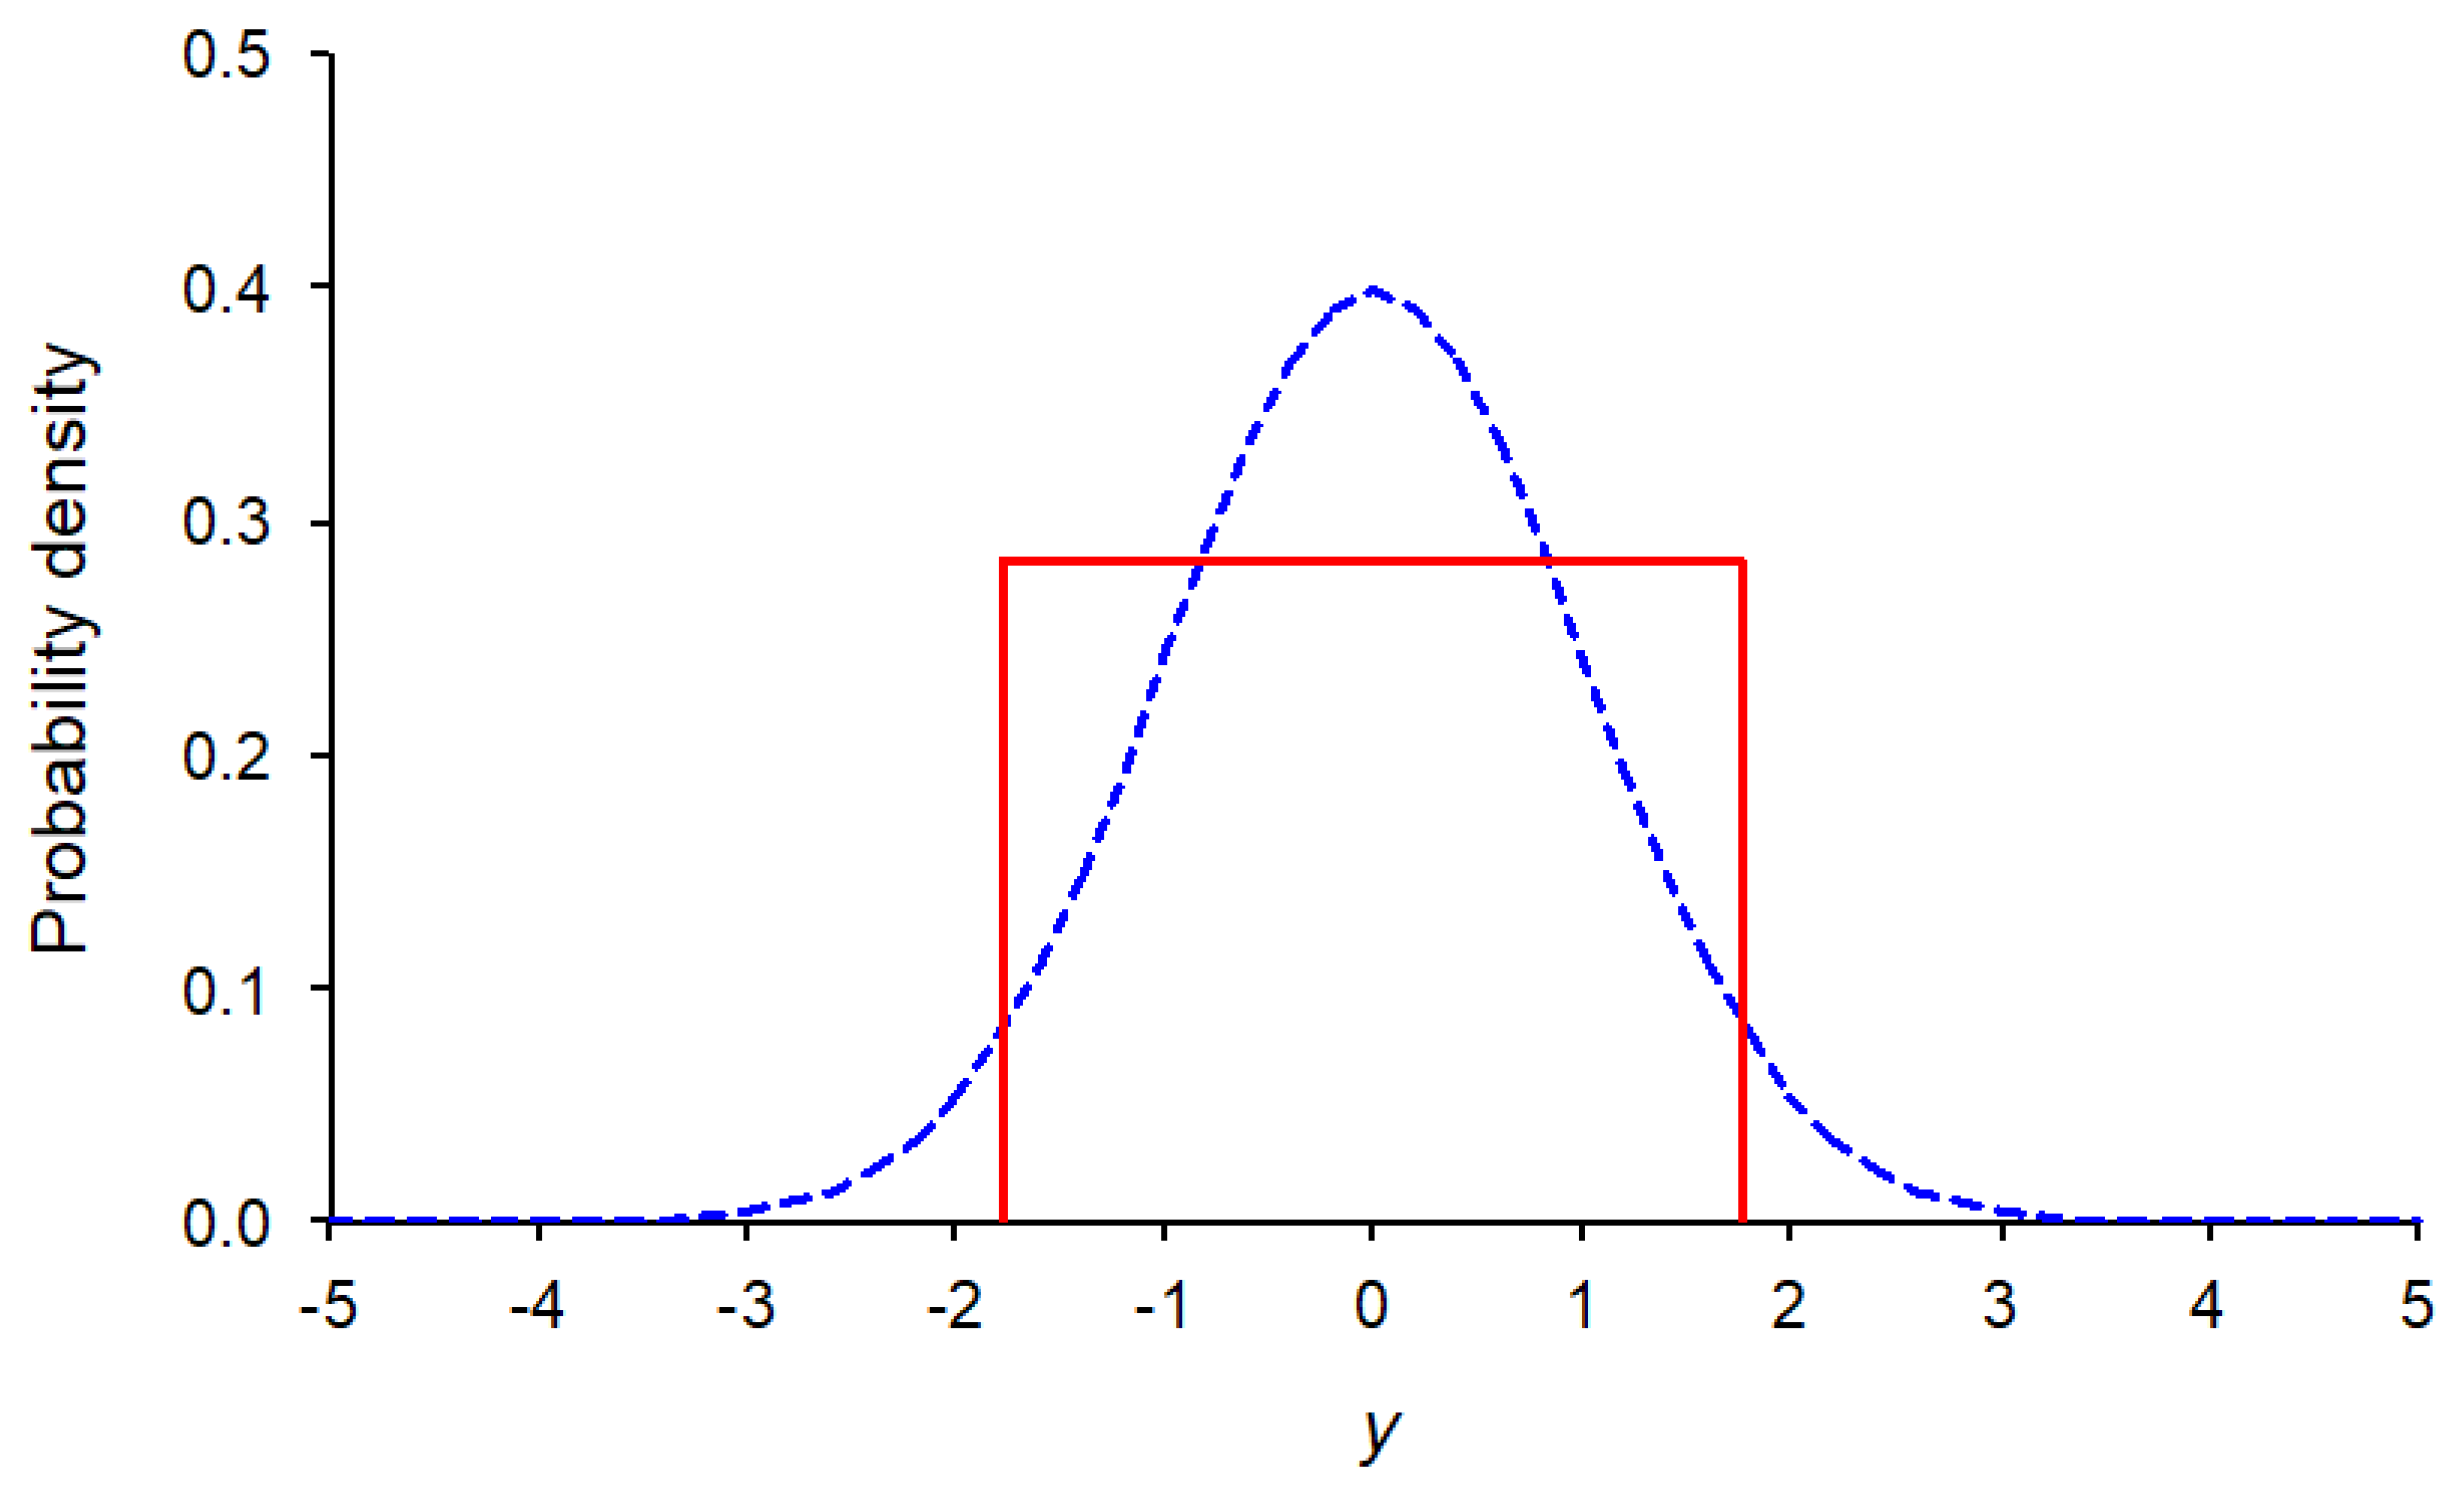
Figure 2.
The Cauchy distribution with y0=0 and γ=1 (dashed line) and its equivalent uniform distribution (solid line).
Figure 2.
The Cauchy distribution with y0=0 and γ=1 (dashed line) and its equivalent uniform distribution (solid line).
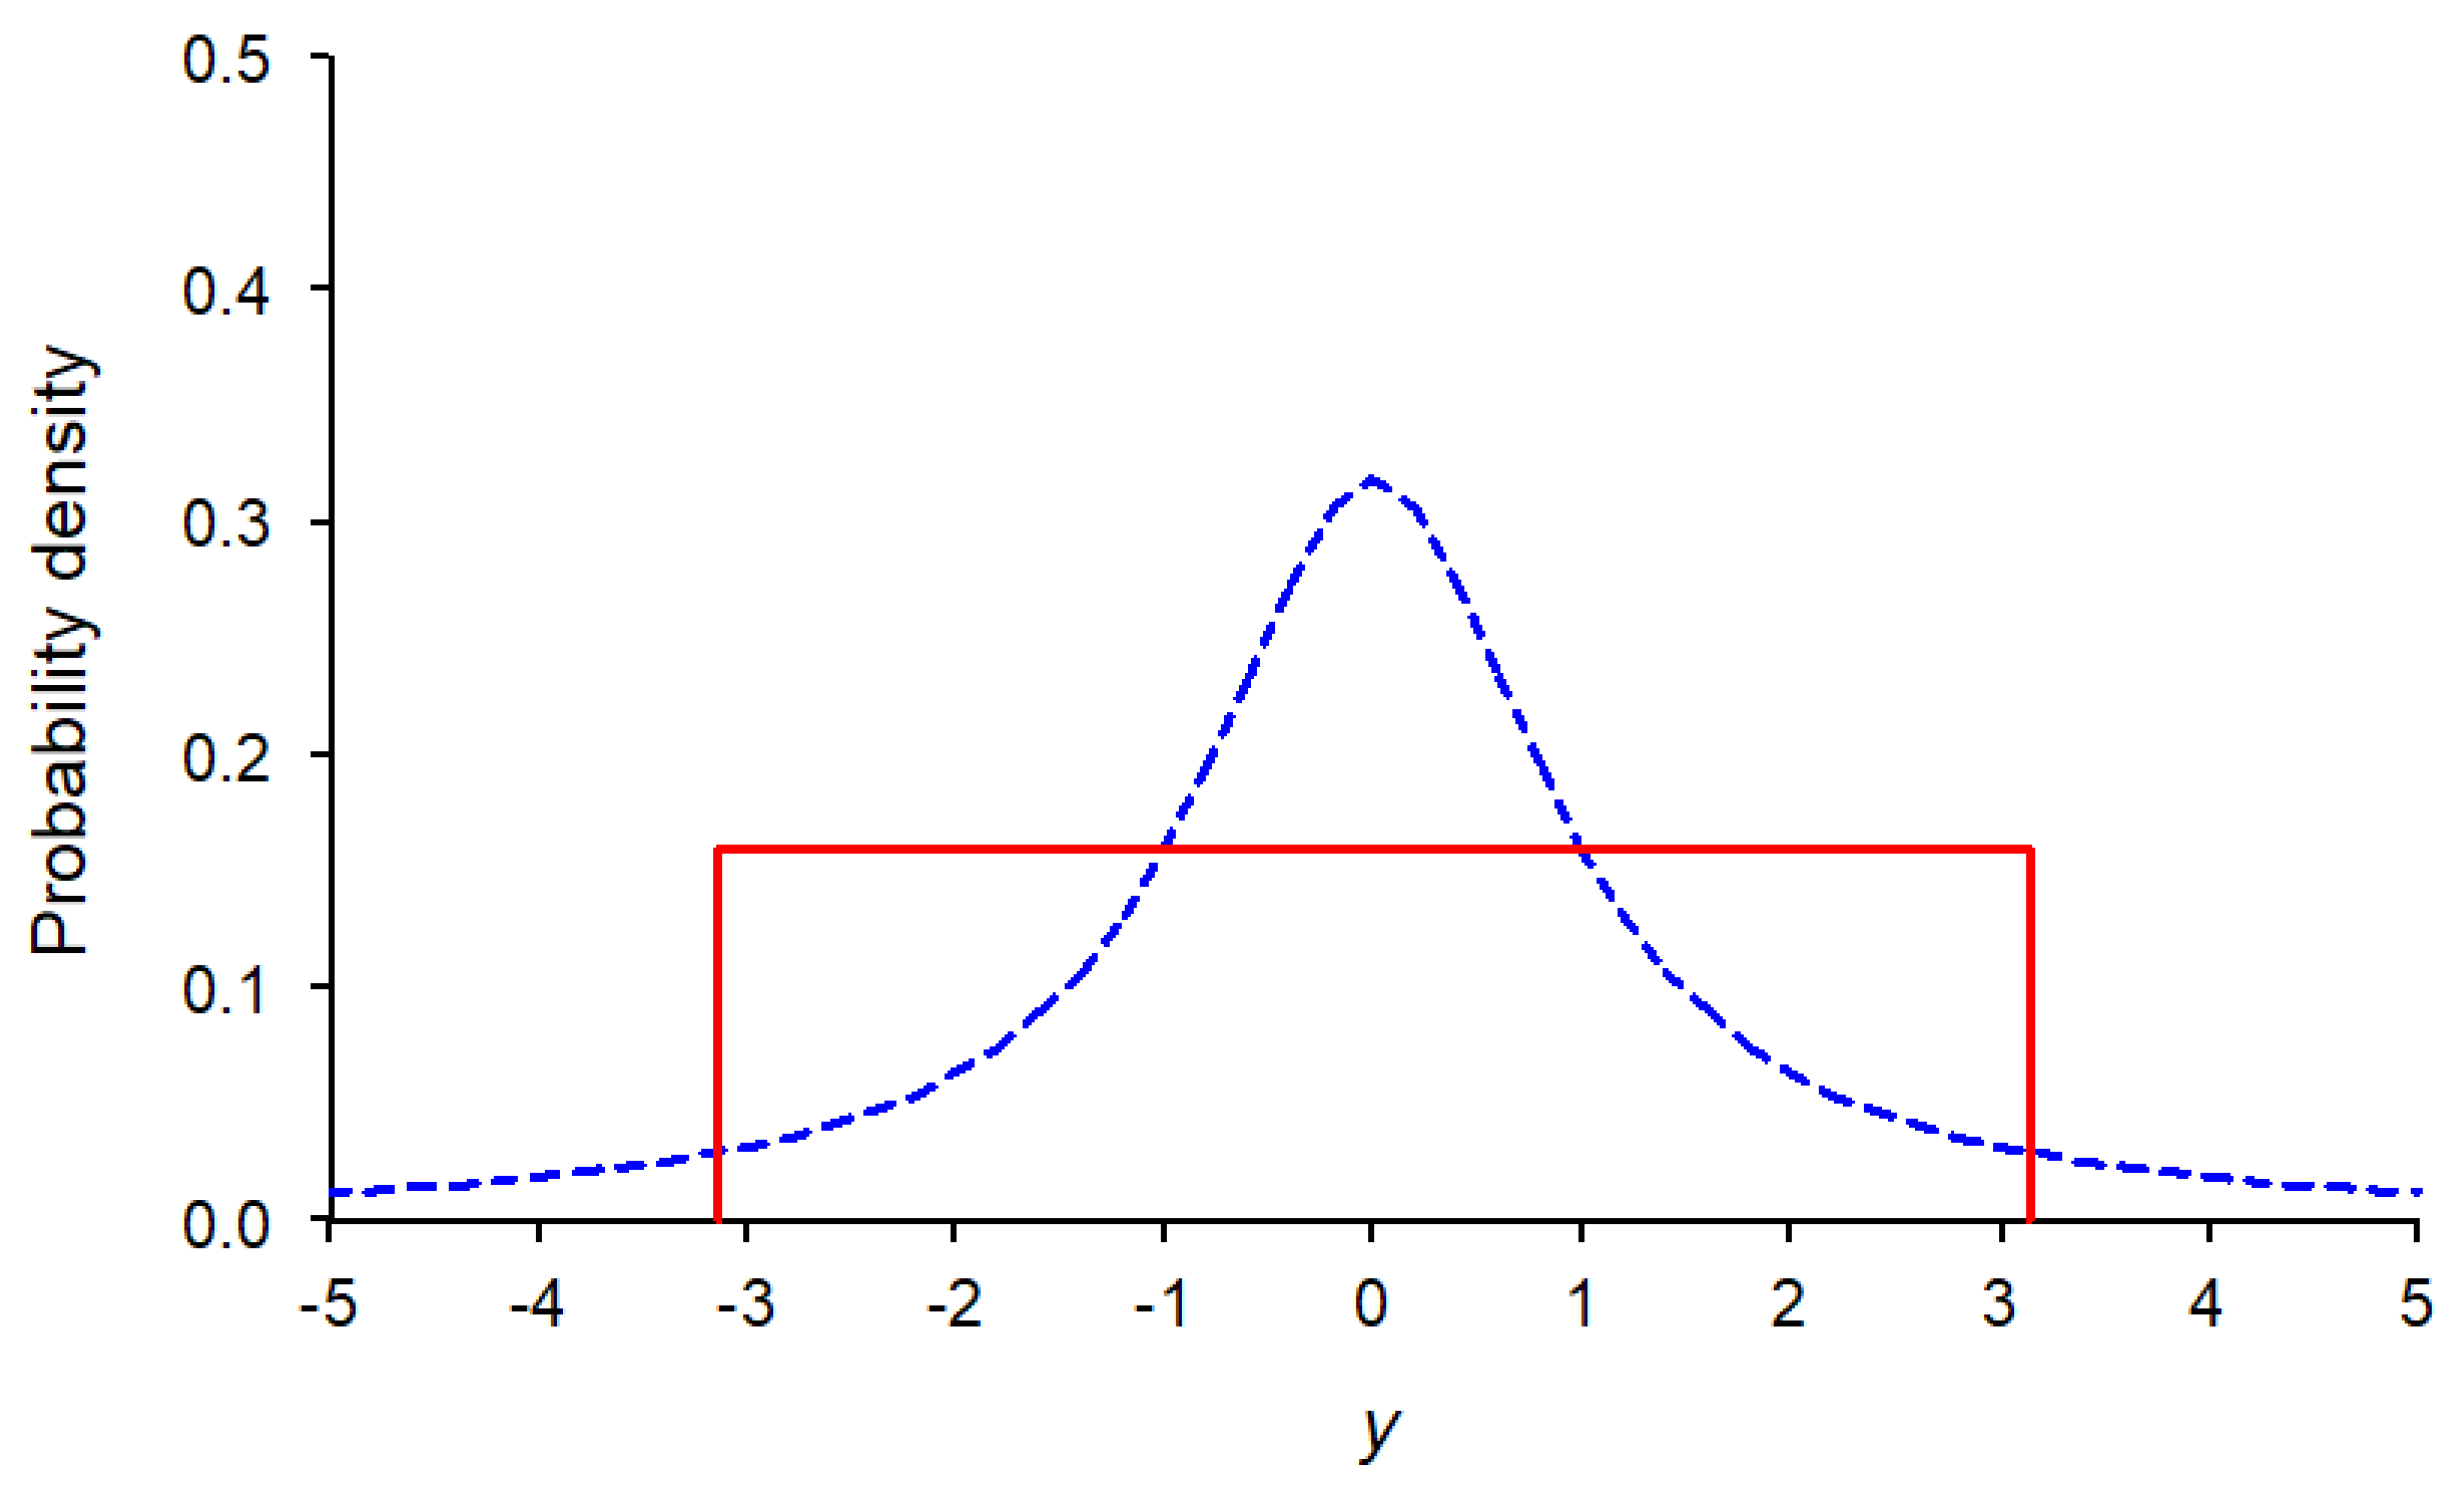
Figure 3.
The Rayleigh distribution with σ=1 (dashed line) and its equivalent uniform distribution (solid line).
Figure 3.
The Rayleigh distribution with σ=1 (dashed line) and its equivalent uniform distribution (solid line).

To further illustrate the meaning of the peakedness index, we consider three distributions: the standard normal distribution N(0,1), the Cauchy distribution with y0=0 and γ=1, and the Rayleigh distribution with σ=1. Table 2 shows the numerical values of the continuous informity, t uncertainty length, and support of the equivalent uniform distribution for these three distributions. Figures 1, 2, and 3 display the standard normal, Cauchy, and Rayleigh distributions alongside their corresponding equivalent uniform distributions. This visualization helps to better understand the meaning of the proposed peakedness index by comparing the shape of the original distribution with the shape of its equivalent uniform distribution.
4. Comparing the Peakedness Indices for the Standard Normal Distribution and t-Distribution
The peakedness index for the standard normal distribution is a constant: . The peakedness index for the t-distribution is a function of its degrees of freedom and is derived as follows.
The PDF of the t-distribution is written as
where is the degrees of freedom.
The continuous informity of the t-distribution is given by
The maximum density of the t-distribution is at y=0. Thus, the maximum density is given by
Then, the peakedness index for the t-distribution is given by
The solution for can be obtained by using the following integrals
where and .
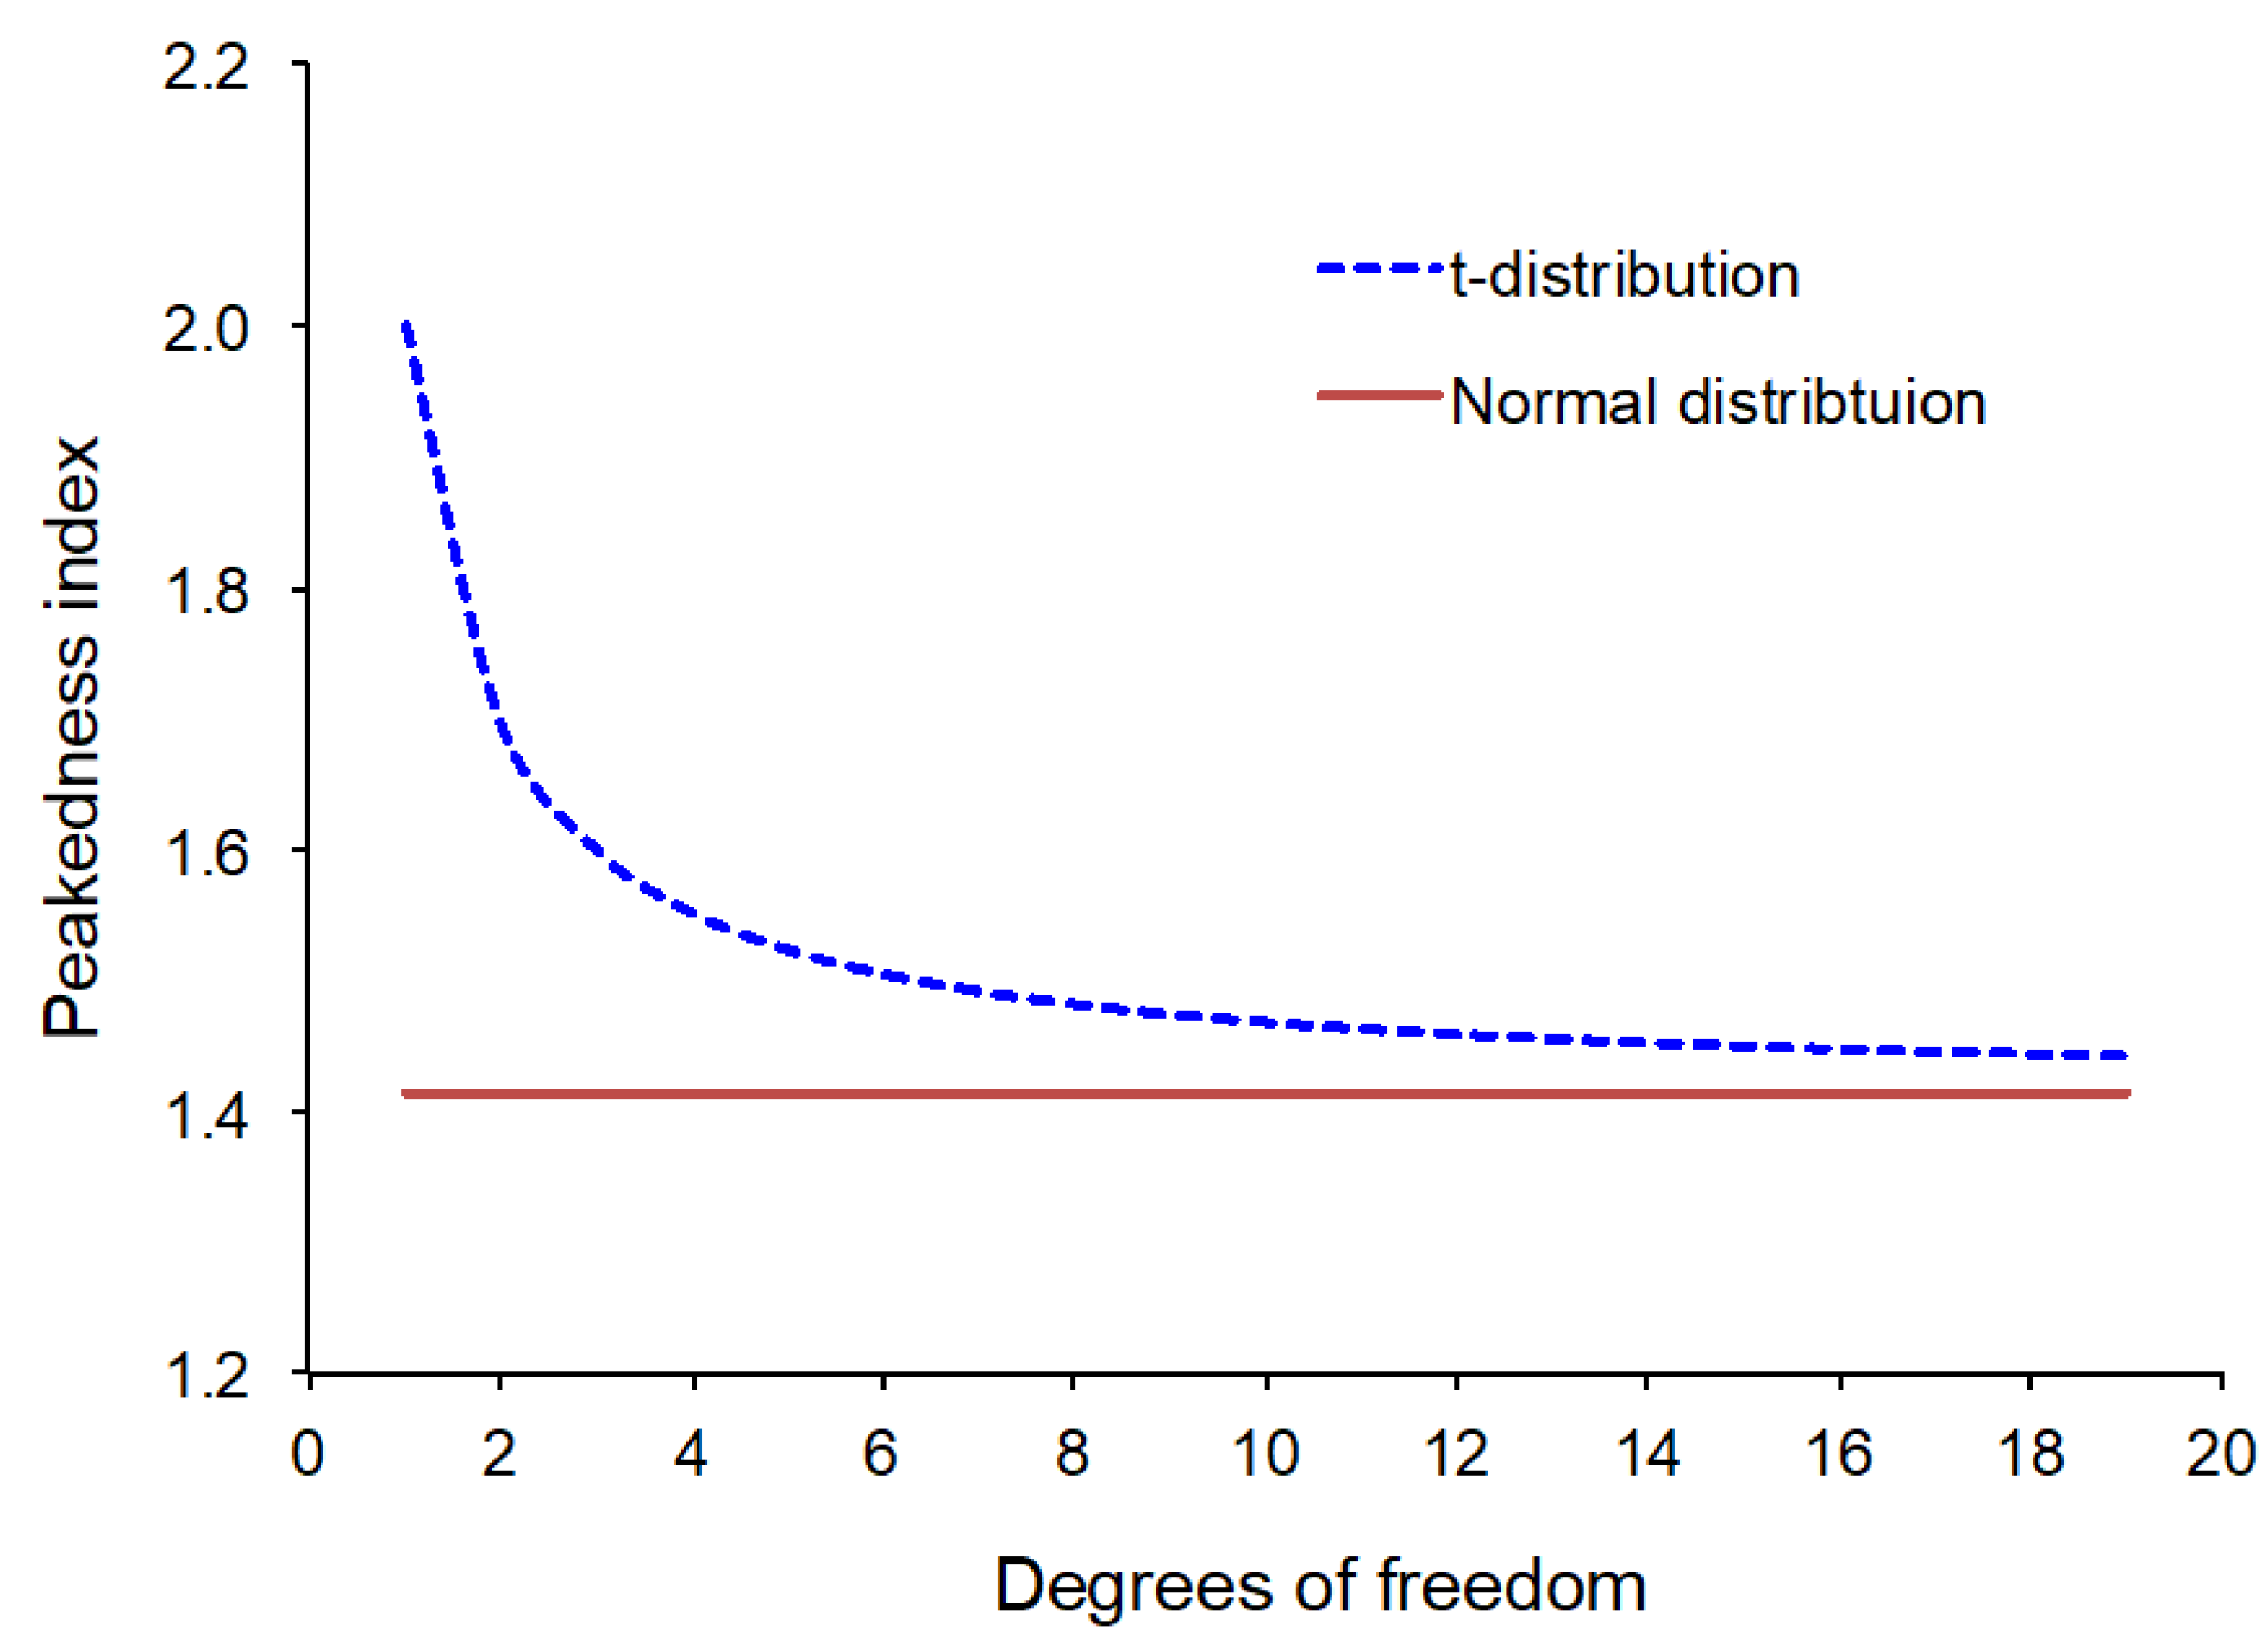
Figure 4 shows the peakedness index for the t-distribution as a function of the degrees of freedom. At ν = 1, which corresponds to the Cauchy distribution, the peakedness index is 2. As the degrees of freedom increase, the peakedness index decreases. In the limit, as the degrees of freedom approach infinity, the t-distribution converges to the standard normal distribution, and the peakedness index approaches . This trend reflects the fact that t-distributions become less peaked and more similar to the standard normal distribution as the degrees of freedom increase.
Figure 4.
Peakedness indices for the t-distribution and the standard normal distribution.
It is important to note that the peakedness index for the t-distribution is always defined, regardless of the degrees of freedom. In contrast, the kurtosis of the t-distribution is undefined for .
5. Conclusions
The proposed peakedness index quantifies the relative height of the peak density of a probability distribution compared to its mean density, providing an intuitive and effective measure of peakedness. The peakedness index for the uniform distribution is 1, while the peakedness index for any other distribution is greater than 1. A higher peakedness index indicates a more pronounced peak, and a lower peakedness index suggests a flatter distribution. This interpretation aligns with common sense expectations regarding the shape of distributions.
In principle, the proposed peakedness index is applicable to any types of distributions: symmetric, asymmetric, and even multimodal. It is always defined because both the maximum density (or peak density) and the continuous informity always exist for any distribution. The peakedness indices for nine different distributions have been derived. Further work is needed to extend the derivations to additional distributions.
Conflict of Interest
The author declares no conflicts of interest.
References
- DeCarlo, L. T. On the meaning and use of kurtosis. Psychological Methods 1997, 2(3), 292–307. [Google Scholar] [CrossRef]
- Groeneveld, R. A.; Meeden, G. Measuring Skewness and Kurtosis. Journal of the Royal Statistical Society Series D (The Statistician) 1984, 33(4), 391–399. [Google Scholar] [CrossRef]
- Hogg, R. V. Adaptive Robust Procedures: A Partial Review and Some Suggestions for Future Applications and Theory. Journal of the American Statistical Association 1974, 69(348), 909–923. [Google Scholar] [CrossRef]
- Horn, P. S. A Measure for Peakedness. The American Statistician 1983, 37(1), 55–56. [Google Scholar] [CrossRef]
- Huang, H. The theory of informity: a novel probability framework. Bulletin of Taras Shevchenko National University of Kyiv, Physics and Mathematics 2025, 80(1), 53–59. [Google Scholar] [CrossRef] [PubMed]
- Ruppert, D. What Is Kurtosis?: An Influence Function Approach. The American Statistician 1987, 41(1), 1–5. [Google Scholar] [CrossRef] [PubMed]
- Westfall, P. H. Kurtosis as Peakedness, 1905 - 2014. R.I.P. Am Stat. 2014, 68(3), 191–195. [Google Scholar] [CrossRef] [PubMed] [PubMed Central]

Table 1.
PDFs, maximum densities, peakedness indices, and kurtoses for eight well-known distributions.
Table 1.
PDFs, maximum densities, peakedness indices, and kurtoses for eight well-known distributions.
| Distribution | Kurtosis | |||
|---|---|---|---|---|
| Uniform | 1 | 1.8 | ||
| Triangular | 1.5 | 2.4 | ||
| Raised cosine | 1.333 | 2.406 | ||
| Normal | 1.414 | 3 | ||
| Exponential | 2 | 9 | ||
| Cauchy | 2 | Undefined | ||
| Rayleigh | 1.369 | 3.245 | ||
| Laplace | 2 | 9 |
Table 2.
Values of the continuous informity, uncertainty length, and support of the equivalent uniform distribution for three distributions.
Table 2.
Values of the continuous informity, uncertainty length, and support of the equivalent uniform distribution for three distributions.
| Distribution | Support of equivalent uniform distribution | ||
|---|---|---|---|
| Standard normal: N(0,1) | 0.282 | 3.545 | (-1.772, 1.772) |
| Cauchy: y0=0 and γ=1 | 0.159 | 6.283 | (-3.145, 3.145) |
| Rayleigh: σ=1 | 0.443 | 2.257 | (0, 2.257) |
Disclaimer/Publisher’s Note: The statements, opinions and data contained in all publications are solely those of the individual author(s) and contributor(s) and not of MDPI and/or the editor(s). MDPI and/or the editor(s) disclaim responsibility for any injury to people or property resulting from any ideas, methods, instructions or products referred to in the content. |
© 2025 by the authors. Licensee MDPI, Basel, Switzerland. This article is an open access article distributed under the terms and conditions of the Creative Commons Attribution (CC BY) license (http://creativecommons.org/licenses/by/4.0/).
Copyright: This open access article is published under a Creative Commons CC BY 4.0 license, which permit the free download, distribution, and reuse, provided that the author and preprint are cited in any reuse.


