
Submitted:
28 September 2025
Posted:
02 October 2025
You are already at the latest version
Abstract
Subtype isolation of cells with low surface protein expression remains a longstanding bottleneck in various biological and biomedical investigations. Herein, we present MagSculptor, a novel bio-magnetic separator that leverages passive magnetic field shaping through engineered soft magnetic strip arrays embedded within a microfluidic platform. By integrating high-permeability amorphous soft magnetic materials with a tunable background magnetic field, the system creates a series of localized high-flux density zones with magnetic field gradients exceeding 2,000 T/m at a distance of 50 μm. Both numerical simulations and experimental results demonstrate that MagSculptor enables dynamic and highly resolute separation of magnetically labeled cells by precisely modulating the external magnetic field intensity and the spatial arrangement of soft magnetic elements. Consequently, cells can be classified into four distinct subtypes: High (H), Medium (M), Low (L), and Negative (N), based on magnetic labeling, which correlates linearly with the target protein expression level. The system exhibited superior resolution in sorting cancer cell lines such as MDA-MB-231 and A549 based on EpCAM expression, with cell viability exceeding 95%, making it a powerful and versatile tool for downstream applications in single-cell transcriptomics, genomics, and mechanistic biological investigations.
Keywords:
magnetic field shaping
; microfluidics
; magnetic cell sorting
1. Introduction
Heterogeneity in the expression of cell surface proteins constitutes one of the most critical regulatory elements governing cellular functions, including differentiation, migration, signal transduction, and immune response [1,2]. Particularly in the contexts of immunotherapy, tumor microenvironment analysis, and early disease diagnostics, the ability to identify and isolate subpopulations of cells exhibiting low-expression biomarker expression holds both profound scientific significance and substantial clinical value [3]. For instance, the differential expression of Cluster of Differentiation (CD) molecules on CD4+/CD8+ T cells directly influence antigen recognition sensitivity and the duration of immune activity, serving as a crucial predictor of CAR-T therapeutic efficacy and cellular functional heterogeneity [4,5]. Similarly, epithelial cell adhesion molecule (EpCAM) expression in solid tumors such as breast cancer is strongly associated with metastatic potential and stem-like properties, thus emerging as a widely recognized target in liquid biopsy technologies [6,7,8,9,10,11]. However, when the transcriptional expression of target biomarkers falls below 100 nTPM, conventional cell sorting methods often lack the sensitivity and resolution required for accurate subtype differentiation [12].
Magnetic-activated cell sorting (MACS) systems, owing to their inherent specificity and high-throughput capabilities, have become a mainstay in the field of cellular isolation [13,14]. These systems operate by conjugating magnetic microbeads to target cells via antibody-mediated recognition, followed by magnetic separation. Nevertheless, traditional MACS platforms rely predominantly on static and spatially homogeneous magnetic field gradients, which offer limited magnetic force resolution. This limitation severely impedes their capacity to distinguish cellular subpopulations with marginal differences in magnetic labelling, typically less than 5%, resulting in a binary classification that merely discriminates between 'positive' and 'negative' populations [15,16,17,18]. As a consequence, MACS systems fall short in supporting advanced biological analyses, such as probing the correlation between CAR surface expression and cytotoxicity in T-cell subsets [19].
To address these limitations, recent engineering strategies have attempted to adapt field shaping concepts derived from ferromagnetic particle separation technologies in tribology [20]. By constructing spatially varying magnetic gradients, these systems can effectively segregate metallic particles (e.g., Fe, Ni) based on size or magnetism. However, such approaches remain inadequate when applied to biological systems where the magnetic differentials are minuscule, such as in the case of bead-labelled cell complexes [21,22,23]. For cellular subtype sorting, Kelley et al. developed capture traps using micro-magnet arrays combined with flow control unit arrays to modulate fluid velocity, achieving gradient capture of cellular subtypes [24]. This method elegantly exploited magnetic field differences for cell subtype discrimination. However, collecting captured samples through group elution often requires extremely simplified channel structures. Flow field designs that favor capture may become obstacles to sample elution and collection, presenting certain challenges for microfluidic design. Di Carlo et al. achieved particle magnetization in channels through alternating magnetic fields and implemented gradient control of movement distance based on surface magnetic bead quantity differences, thereby improving the precision of magnetic manipulation capabilities [25]. Using magnetic force differences for subtype sorting is ingenious, but relying on magnetic force as the sole driving source for cell movement poses challenges to sorting efficiency. Similarly, Mao et al. successfully accomplished multi-group subtype separation of cells through quantitative design of flow and magnetic fields, but they also raised concerns about chip throughput and other aspects[26]. Related research could continue to innovate in design by implementing more refined coupling analysis of magnetic and flow fields to accommodate higher-throughput sorting.
In response to these challenges, we introduce MagSculptor, an innovative microfluidic-based magnetic cell sorting platform that integrates arrays of soft magnetic strips with an externally adjustable background magnetic field. The system employs a streamlined flow field structure to enable cell elution, and the coupling of microfluidic driving forces with magnetic sorting forces provides dynamically describable, modularizable, and parallelizable cellular subtype sorting with system compatibility that adapts to the developmental potential of clinical testing. The system harnesses the superior magnetic permeability and field-shaping capabilities of amorphous ferromagnetic alloys to sculpt spatial magnetic landscapes within the microchannel [27]. This design enables the formation of multi-stage magnetic capture zones, wherein cells are subjected to progressively increasing magnetic forces as they traverse the device. By exploiting the linear relationship between magnetic bead load and target protein expression, MagSculptor enables high-resolution mechanical fractionation of labeled cells into biologically relevant subtypes. Furthermore, this platform not only surpasses the sensitivity limitations of conventional MACS systems but also provides a versatile interface for integrated studies spanning magnetism, fluid dynamics, and single-cell omics.
Here, we detail the physical principles, microfluidic design, and numerical modelling underlying the MagSculptor system. We further validate its performance through experimental separation of low-EpCAM-expressing cancer cells, demonstrating the device's potential as a next-generation solution for precision cell sorting and advanced biological interrogation.
2. Materials and Methods
2.1. Cell Culture
The MDA-MB-231, MCF-7, A549, and Caco-2 cell lines were purchased from the National Infrastructure of Cell Line Resource (China). MDA-MB-231 and A549 cells were cultured in RPMI-1640 medium supplemented with 10% fetal bovine serum (FBS, Thermo Fisher) and 1% penicillin-streptomycin (Penicillin-Streptomycin, Thermo Fisher). MCF-7 and Caco-2 cells were cultured in DMEM high-glucose medium with 10% FBS and 1% penicillin-streptomycin. All cells were maintained in a humidified incubator at 37°C with 5% CO₂ and 95% humidity.
2.2. Magnetic Immune Labeling
The MDA-MB-231, MCF-7, A549, and Caco-2 cells in good condition were collected and incubated with Calcein-AM(MCE,HY-D0041) at 37°C for 10 minutes. After incubation, the cells were washed three times with PBS. Finally, the cells were resuspended in PBS to a concentration of 2 × 10⁵ cells/mL, and 15 µL of anti-EpCAM magnetic beads (Thermo Fisher DynabeadsTM 10618D) were added. The mixture was incubated at room temperature with gentle rotation for 30 minutes.
2.3. Fabrication of Soft Magnetic Array
The spatial distribution of magnetic fields within the MagSculptor system is governed by Maxwell's equations and the constitutive relations of the magnetic medium. To orchestrate magnetic field configurations in space, the key manipulable parameter is the magnetic permeability of the surrounding medium, which can be significantly altered by introducing soft magnetic materials with exceptionally high permeability in precisely defined geometries [28]. In particular, amorphous iron-cobalt-nickel alloys with relative permeabilities exceeding 80,000 are ideally suited for this purpose, offering exceptional field manipulation capabilities. Here we employed 1J85 Nickel-Iron soft magnetic alloy as the magnetic field shaping material.
To achieve the requisite morphological characteristics of the soft magnetic array through precision etching, we first adhered a 35 μm thick layer of 1J85 soft magnetic strip material onto glass substrates using epoxy resin as the bonding agent. Subsequently, S1813 photoresist was spin-coated uniformly across the surface to establish the lithographic foundation. Following pattern-specific exposure and development processes, we employed peroxide-enhanced hydrochloric acid solution delivered through uniform spray application to selectively etch the exposed soft magnetic material.
The photoresist remaining on the soft magnetic strips possessed precisely defined patterns and functioned as a protective masking layer, safeguarding the underlying 1J85 material within the designated pattern regions from chemical etching. Through this methodical photolithographic approach, we successfully fabricated patterned 1J85 soft magnetic array with exceptional geometric fidelity on glass substrates, enabling the precise spatial control of magnetic field topography essential for the MagSculptor platform's operational efficacy.
2.4. Assembling of MagSculptor
The MagSculptor device consisted of three core components: a glass substrate patterned with soft magnetic strips, a thermoplastic microfluidic layer, and top/bottom acrylic clamping plates.
Parallel strip arrays (500 μm wide, 500 μm pitch) were precisely defined on the surface of soft magnetic strips through photolithographic patterning, with strip photoresists obtained through sequential deposition and development processes. The formation of the soft magnetic strip array was accomplished through immersion etching using hydrochloric acid containing hydrogen peroxide, operating under the protective action of the photoresist masking layer. The soft magnetic strips exhibited a thickness of 35 μm, and during the acid etching process, the isotropic etching characteristics of amorphous soft magnetic materials-imposed constraints on achievable linewidth dimensions. Through systematic process optimization, we determined that the narrowest etchable soft magnetic strips could achieve 100 μm linewidth; however, these narrow-linewidth strips demonstrated disappointing performance in experimental validation, as their magnetic capture forces proved insufficient for reliable cell capture under requisite operating conditions. Following comprehensive experimental parameter optimization, we ultimately selected a 500 μm linewidth configuration, which achieved optimal cell capture performance while maximizing inter-group differentiation capabilities. Each individual soft magnetic strip possessed a width of 6 mm with y-axis coordinates spanning (-3, 3) mm, thereby encompassing the full width of the microfluidic channel (4 mm) and ensuring complete magnetic field coverage across the flow path.
The microfluidic channel was constructed from multi-layered polycarbonate (PC) sheets. A central PC film (thickness = 50 ± 3 μm) was laser-cut to define the fluid path. The sheets were then thermally bonded via hot-press lamination to form a leak-tight microchannel structure. This layer was manually aligned and compressed against the soft magnetic substrate during final assembly.
The assembled chip was housed between two 3-mm thick CNC-milled polymethyl methacrylate (PMMA) plates, with screws and nuts providing uniform clamping force. Inlets and outlets were connected via standard Luer-lock ports to external syringe pumps for controlled fluid delivery. A neodymium-core electromagnets was positioned laterally to provide adjustable magnetic excitation.
2.5. Theoretical Model
Finite element simulations were performed using the COMSOL Multiphysics® platform to model the magneto-hydrodynamic environment within the MagSculptor device. A two-dimensional simplification of the cross-sectional geometry was constructed to capture the essential magnetic and flow interactions with sufficient computational efficiency.
The magnetic force exerted on a single superparamagnetic bead was modelled in Equation (1) based on the classical expression:
where B represents the magnetic flux density field, M denotes the magnetization of the magnetic bead, and Vb corresponds to the bead volume. Since both magnetization and magnetic flux density can be related through the relative magnetic susceptibility χb of the bead material in a fluid environment with magnetic susceptibility χf, the magnetization M can be decomposed into expressions containing B. Considering that cellular magnetic susceptibility χc approximates the fluid environment susceptibility χf, and accounting for n magnetic beads bound to a single cell, the total magnetic force experienced by the cell in the flow field can be approximated as Equation (2) [29]:
where μ₀ = 4π×10-7 T·m/A represents the permeability of free space. Any magnetically labeled cell experiences forces within the magnetic field that are directly proportional to both the intrinsic properties of the cell-bead conjugate and the magnetic field characteristics, mathematically expressed as (H·∇)H。The analysis of (H·∇)H presented in this work characterizes the inherent field properties while delineating the spatial distribution of relative magnetic force magnitudes experienced by identical target objects within the engineered magnetic landscape. Within the microchannel, cells also experience hydrodynamic drag forces that promote cellular motion, which can be expressed as Equation (3) [30]:
where Rc represents the cell radius, η denotes the dynamic viscosity of the fluid, and vf and vc represent the fluid velocity and cellular motion velocity, respectively. Both velocities are position-dependent functions requiring iterative calculations incorporating physical field conditions and specific boundary conditions.
2.6. Operating Parameters of MagSculptor
Prior to each experimental session, the chip underwent comprehensive surface conditioning through flushing with 1% Pluronic F-127 solution to minimize nonspecific cellular adhesion and ensure reproducible performance. All experiments were conducted at ambient temperature under rigorously maintained sterile conditions to preserve sample integrity.
Sample preparation involved maintaining cell densities of 2 × 10⁵ cells/mL, with magnetic bead conjugation achieved through incubation periods under optimized binding conditions. During subtype gradient separation procedures, the sample was introduced into the microchannel at a flow rate of 3,000 μL/h using precision syringe pump control, while 1×PBS buffer was simultaneously infused at 1,000 μL/h to regulate the phase interface distribution and maintain optimal separation conditions. Each individual flow channel was capable of completing this separation process independently, and the modular parallel channel architecture enabled substantial enhancement of sample processing throughput and experimental efficiency.
The effluent was collected at the outlet under standard atmospheric pressure conditions, ensuring gentle sample handling throughout the separation process. During sample collection phases, the flow rate within the channel was gradually increased in a controlled manner, allowing bead-labelled cells to be sequentially separated and collected into distinct subgroups based on quantitative differences in magnetic bead content—a process that achieved remarkable resolution between closely related cell populations.
2.7. Cell Survival Rate Detection Method
The MCF-7 cells were collected at a concentration of 2 × 10⁵ cells/mL and incubated with Calcein-AM and PI at 37°C for 10 minutes. Subsequently, 15 µL of anti-EpCAM magnetic beads were added, and the mixture was incubated at room temperature with gentle rotation for 30 minutes. After sorting through the chip, the samples from each group were collected. Representative images were captured using a fluorescence microscope, and the ratio of red fluorescence to green fluorescence was analyzed.
2.8. Flow Cytometry Test
The MDA-MB-231 and MCF-7 cells were collected and resuspended in PBS at a concentration of 1 × 10⁶ cells/100 µL. Then, 2 µL of EpCAM-FITC antibody(Thermo Fisher,MA1-10197) was added, and the mixture was incubated in the dark with gentle rotation for 30 minutes. Flow cytometry was subsequently used to assess the proportion of EpCAM-positive populations in both MDA-MB-231 and MCF-7 cells.
3. Results and Discussion
3.1. Magnetic Field Shaping
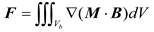
When a soft magnetic element is strategically positioned within an external magnetic field, it becomes magnetized and dramatically distorts the field lines in its immediate vicinity. This magnetization phenomenon results in a pronounced intensification of the magnetic flux density near the material's boundaries, as elegantly visualized in Figure 1a, where field lines become focused and compressed near the strip edges. In our comprehensive simulations and experimental investigations, we employed 1J85 Nickel-Iron soft magnetic alloy as the magnetic field sculpting module, characterized by an initial permeability of 80,000 and a maximum permeability of 200,000. On a macroscopic level, this behavior effectively channels magnetic flux through the soft magnetic domains, producing magnetic field convergence and establishing localized regions of sharply elevated magnetic field gradients, often surpassing 2,000 T/m at a distance of 50 μm (Figure 1b). We define this phenomenon as magnetic field sculpting, a cornerstone principle underlying the MagSculptor platform. Through meticulous engineering of the geometry and spatial arrangement of soft magnetic strips, the magnetic field topology within the microchannel can be precisely orchestrated and tailored to specific applications.
Similar to conventional permanent magnets, the field-shaping efficacy of soft magnetic elements diminishes progressively with distance. Both magnetic flux density (|B|) and its gradient (|∇·B|) exhibit rapid attenuation as one moves away from the magnetic source (Figure 1c). While the magnetic flux density gradient can reach an impressive 18,000 T/m at a distance of 10 μm from the soft magnetic strip, the imperative to ensure manufacturing stability and process reliability between the flow channel and soft magnetic materials necessitates the adoption of a 50 μm spacing in this study, corresponding to a magnetic flux density gradient of 2,000 T/m. In the sophisticated realm of magnetic particle manipulation, the induced dipole moments experience translational forces within gradient fields, the magnitude and directionality of which are intricate functions of both field strength and spatial gradient. Consequently, achieving precise control over magnetic forces within the microchannel environment demands rigorous field shaping protocols, establishing a critical design constraint that fundamentally governs the MagSculptor system architecture.
3.2. Microfluidic Design and Magnetic Field Coupling
In conventional magnetic cell sorting workflows, bead-labelled cells become magnetically responsive through antibody-mediated attachment of superparamagnetic Dynabeads, with the degree of labelling correlating quantitatively with the expression level of target surface proteins [31]. For subtypes with low biomarker expression, the magnetic response is inherently weak; thus, local amplification of magnetic forces within the microchannel is essential to achieve differential sorting.
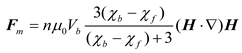
To address this, we designed an array of soft magnetic strips that are magnetized by a side-mounted, tunable electromagnet (Figure 1d). The spatial gradient between each strip and the external magnetic source results in a non-uniform magnetic landscape along the channel axis, where each strip locally generates a distinct magnetic force well (Figure 1e). When integrated with the microfluidic flow environment, this magnetic architecture enables the stepwise deflection and capture of magnetically labelled cells based on bead load, functioning akin to a graded hurdle race: cells with higher magnetic content are captured earlier, while lightly labelled or unlabeled cells transit further downstream.
Within a planar Cartesian coordinate system, the primary cell transit direction was designated as the x-axis, with 27 parallel strips spanning x ∈ [0,27] mm. We adjusted the electromagnet current to achieve a magnetization intensity of 1.44 T (approximating the magnetic performance of N52 permanent magnets), positioning the strongest soft magnetic strip at 18 mm from the electromagnet as the starting point (with the magnet surface located at x = 45 mm). In the vertical dimension, the electromagnet central axis was aligned coplanarly with the soft magnetic strip array. Finite element simulations confirm that the field amplification effect of the soft magnetic strips reaches desired efficacy within 50 μm above the strip surface, corresponding precisely to the vertical center of the microchannel (Figure 1f). In this critical region, sharp magnetic flux peaks emerge near strip boundaries, forming localized high-gradient capture zones. These gradients are indispensable for achieving subtype resolution among cells differing by only a few magnetic beads—a capability that distinguishes this approach from conventional magnetic separation techniques.
The effectiveness of this design is further validated through comprehensive spatial mapping of the magnetic flux density and gradient profiles under operational field strengths (Figure 1g). From x = 27 mm to x = 0 mm, the background magnetic field, which would otherwise decay gradually from 35 mT to 9 mT, undergoes dramatic field sculpting that introduces significant oscillations, creating localized magnetic flux density peaks with corresponding boundary-localized high gradients. This engineered magnetic architecture facilitates enhanced magnetization and capture of magnetic beads through precisely controlled field topology. We designated this device "MagSculptor" to emphasize its core functionality: the precise "sculpting" of magnetic fields through engineered soft magnetic strip arrays—a paradigm that transforms conventional uniform field approaches into spatially sophisticated magnetic landscapes.
During magnetic field modulation, the adsorption force experienced by magnetic beads is jointly determined by both magnetic flux density and its gradient. Therefore, in channel design, the boundary regions of each enhancement peak should serve as the primary adsorption sites for cellular capture.
To accurately characterize the forces acting on bead-labelled cells within the MagSculptor system, we performed finite element simulations coupling the magnetic and hydrodynamic fields. In a gradient magnetic field, superparamagnetic particles are first magnetized and then subjected to a net translational force, described as proportional to the field-dependent quantity (H·∇)H as shown in Equation (2). This scalar-vector product in Figure 2a captures the spatial variation of the magnetic field and reflects the relative force landscape experienced by a particle of fixed magnetic susceptibility.
Within individual flow channels, under identical magnetic field conditions, we systematically performed independent sequential runs of four different cell lines for gradient capture and elution procedures (n=3 for each condition). This experimental design enabled comprehensive characterization while preserving in situ photographic scanning profiles for spatial analysis, and simultaneously retained fractionated cell populations for subsequent quantitative statistical analysis and validation studies.
3.3. Magneto-Hydrodynamic Simulation and Cell Capture Dynamics
Heatmap visualizations of (H·∇)H reveal that each soft magnetic strip generates a pair of localized force maxima near its lateral edges, aligning with the high-gradient zones predicted by analytical modelling. In this framework, the vertical component of the magnetic force is particularly critical, as it draws magnetically labelled cells downward toward the strip surface, enabling effective capture. The strength of this vertical force component varies with both bead load and local field topology, and thus governs the onset of physical interaction between cells and the substrate.
To assess the capture reliability under worst-case conditions, we modelled the trajectory of a 20 µm-diameter cell conjugated with a single 2.8 µm magnetic bead as shown in Figure 2b. Even along the minimal-force detection line, identified as the least favorable streamline in the magnetic force field, simulations showed that the cell is consistently deflected toward the bottom of the channel before reaching the capture threshold. Figure 2c observation confirms that even weakly labelled cells are physically drawn toward capture sites under realistic flow and field conditions.
We further evaluated the hydrodynamic behavior of the flow field within the microchannel. Simulations confirmed the establishment of a laminar Poiseuille flow profile, with parabolic velocity distribution along the channel height and uniform axial flow along its length (Figure 2d). To suppress boundary-induced velocity variability and ensure that cells remain within the optimal capture zone, sheath flows were introduced, hydrodynamically focusing all cells into the central 50 µm zone above the strip array (Figure 2e,f).
Furthermore, we incorporated dynamic mechanical interactions into the simulation to evaluate the interplay of magnetic forces, hydrodynamic drag, and substrate friction. Time-dependent Eulerian analysis showed that while magnetic and frictional forces remain stable across spatial positions, drag force varies as a function of both velocity and z-position. This highlights the necessity of optimizing flow confinement to minimize vertical variability.
To deepen our understanding of cell sorting dynamics within MagSculptor, we performed parametric analyses of both magnetic field conditions and cell–bead interactions. Our experimental design incorporated a microchannel with a width of 4 mm, height of 100 μm, and a total sorting zone length of 27 mm. The horizontal and vertical components of the magnetic force, derived from the spatial gradient of the field, were analyzed separately to elucidate their respective roles in capture dynamics (Figure 3a).
The vertical component determines the contact stability between a bead-labelled cell and the substrate. Once a sufficient downward magnetic force is exerted, frictional interaction dominates and regulates axial migration. The coefficient of dynamic friction in aqueous environments, assumed between 0.05–0.15, is sufficient to ensure that captured cells are gradually slowed and immobilized near the strip surface. In contrast, the horizontal force component exhibits oscillatory behavior across the strip boundary, which can induce micro-accelerations or decelerations of partially captured cells.
To enable robust system calibration, we systematically varied the strength of the electromagnet and recorded corresponding field profiles at defined channel heights. Simulation results indicate that increasing the magnetic field compensates for larger vertical distances between the soft magnetic strips and the microchannel (Figure 3b). This tunability allows for precise alignment between magnetic peaks and the capture zone, even in the presence of fabrication-induced channel height deviations. When cells and their bonded magnetic beads are considered as integrated entities, the magnetic characteristics of these conjugates vary with magnetic bead content. Comparatively, larger cell volumes result in reduced magnetic errors caused by cellular volume variations. From a statistical perspective, cancer cells possess larger average dimensions than normal cells, potentially yielding superior results in gradient capture chips.
Multiple studies have reported significant variations in cell size measurements for identical cell types; however, MDA-MB-231, MCF-7, and A549 cells consistently demonstrate dimensions within the 15 ± 3 μm range [32,33,34], while Caco-2 cells exhibit larger sizes with broader size distributions [35,36,37]. Although Caco-2 cells present substantial size variability around 20 μm, for these larger cells, the influence of magnetic bead content on the magnetic properties of the cell-bead conjugate becomes attenuated (Figure 3c). This phenomenon serendipitously enables predictable trajectory modeling for Caco-2 cells despite their heterogeneous size distribution. Kinematic simulations must encompass the full spectrum of cell sizes ranging from 15 μm to 20 μm to ensure comprehensive predictive accuracy.
The terminal state of cells within the microchannel involves stationary positioning at specific locations, with forces determined by fluid drag, magnetic forces, and friction. The resultant force components along the direction of motion at various positions within the fluid can be represented as line diagrams (Figure 3d), with positions where horizontal net force equals zero indicating stable stationary cell positions. Capture trajectories for cells with nominal 20 μm dimensions were also modeled computationally, specifically accommodating larger cells such as Caco-2 (Figure S1a). The ultimate objective of mechanical analysis is to dynamically describe the motion behavior of various cell subtypes within the MagSculptor. We integrated spatial flow field and magnetic field parameters, combined with inlet and outlet boundary conditions of the channel, and employed the forward Euler method to complete time-stepping calculations (dt=1E-5 s) with state variable updates, ultimately obtaining the motion processes of various cell subtypes within the channel. We selected velocity-displacement variation data for different cell types to generate plots (Figure 3e). When cells reach magnetic capture potential barriers, they experience velocity changes under the influence of magnetic and frictional forces, leading to increased velocity differences between cells and fluid, with alternating acceleration and deceleration creating oscillatory velocity effects that intensify with progressively stronger barriers, resulting in increasingly larger amplitudes until velocity reaches zero, marking the cell capture position.
For Caco-2 cells, which possess characteristically larger average volumes, we employed 20 μm diameter parameters to simulate the anticipated sorting dynamics for this cellular population. Given that the increased cellular volume effectively dilutes the magnetic influence of individual beads, these larger cells consistently demonstrate capture sites with a pronounced lag of 2-3 strip positions relative to their smaller counterparts (Figure S1b). This size-dependent capture behavior reflects the fundamental relationship between cellular volume and magnetic susceptibility, where larger cells require proportionally higher magnetic bead densities to achieve equivalent capture efficiency within the engineered magnetic gradient landscape.
By correlating magnetic bead conjugation levels with capture positions, cell subtype grouping can be achieved, with phenotypic classification from high to low designated as H (High), M (Medium), L (Low), and uncaptured N (Negative) groups. Dynamic capture positions correspond closely to static equilibrium positions but exhibit slight discrepancies; specifically, dynamic capture position analysis accounts for cellular motion inertia, resulting in predictable positional lag. However, analysis reveals that the inertial influence on capture positions does not extend across the entire strip, thereby preserving predictive accuracy.
From simulation results, the combined magnetic–hydrodynamic field structure in MagSculptor ensures robust separation performance with subpopulation-level resolution. We can theoretically predict the expected capture locations for cell-bead conjugates of varying sizes and different magnetic bead loadings, providing invaluable theoretical guidance and design support for experimental implementation and optimization strategies.
3.4. Subtype Isolation of Cells
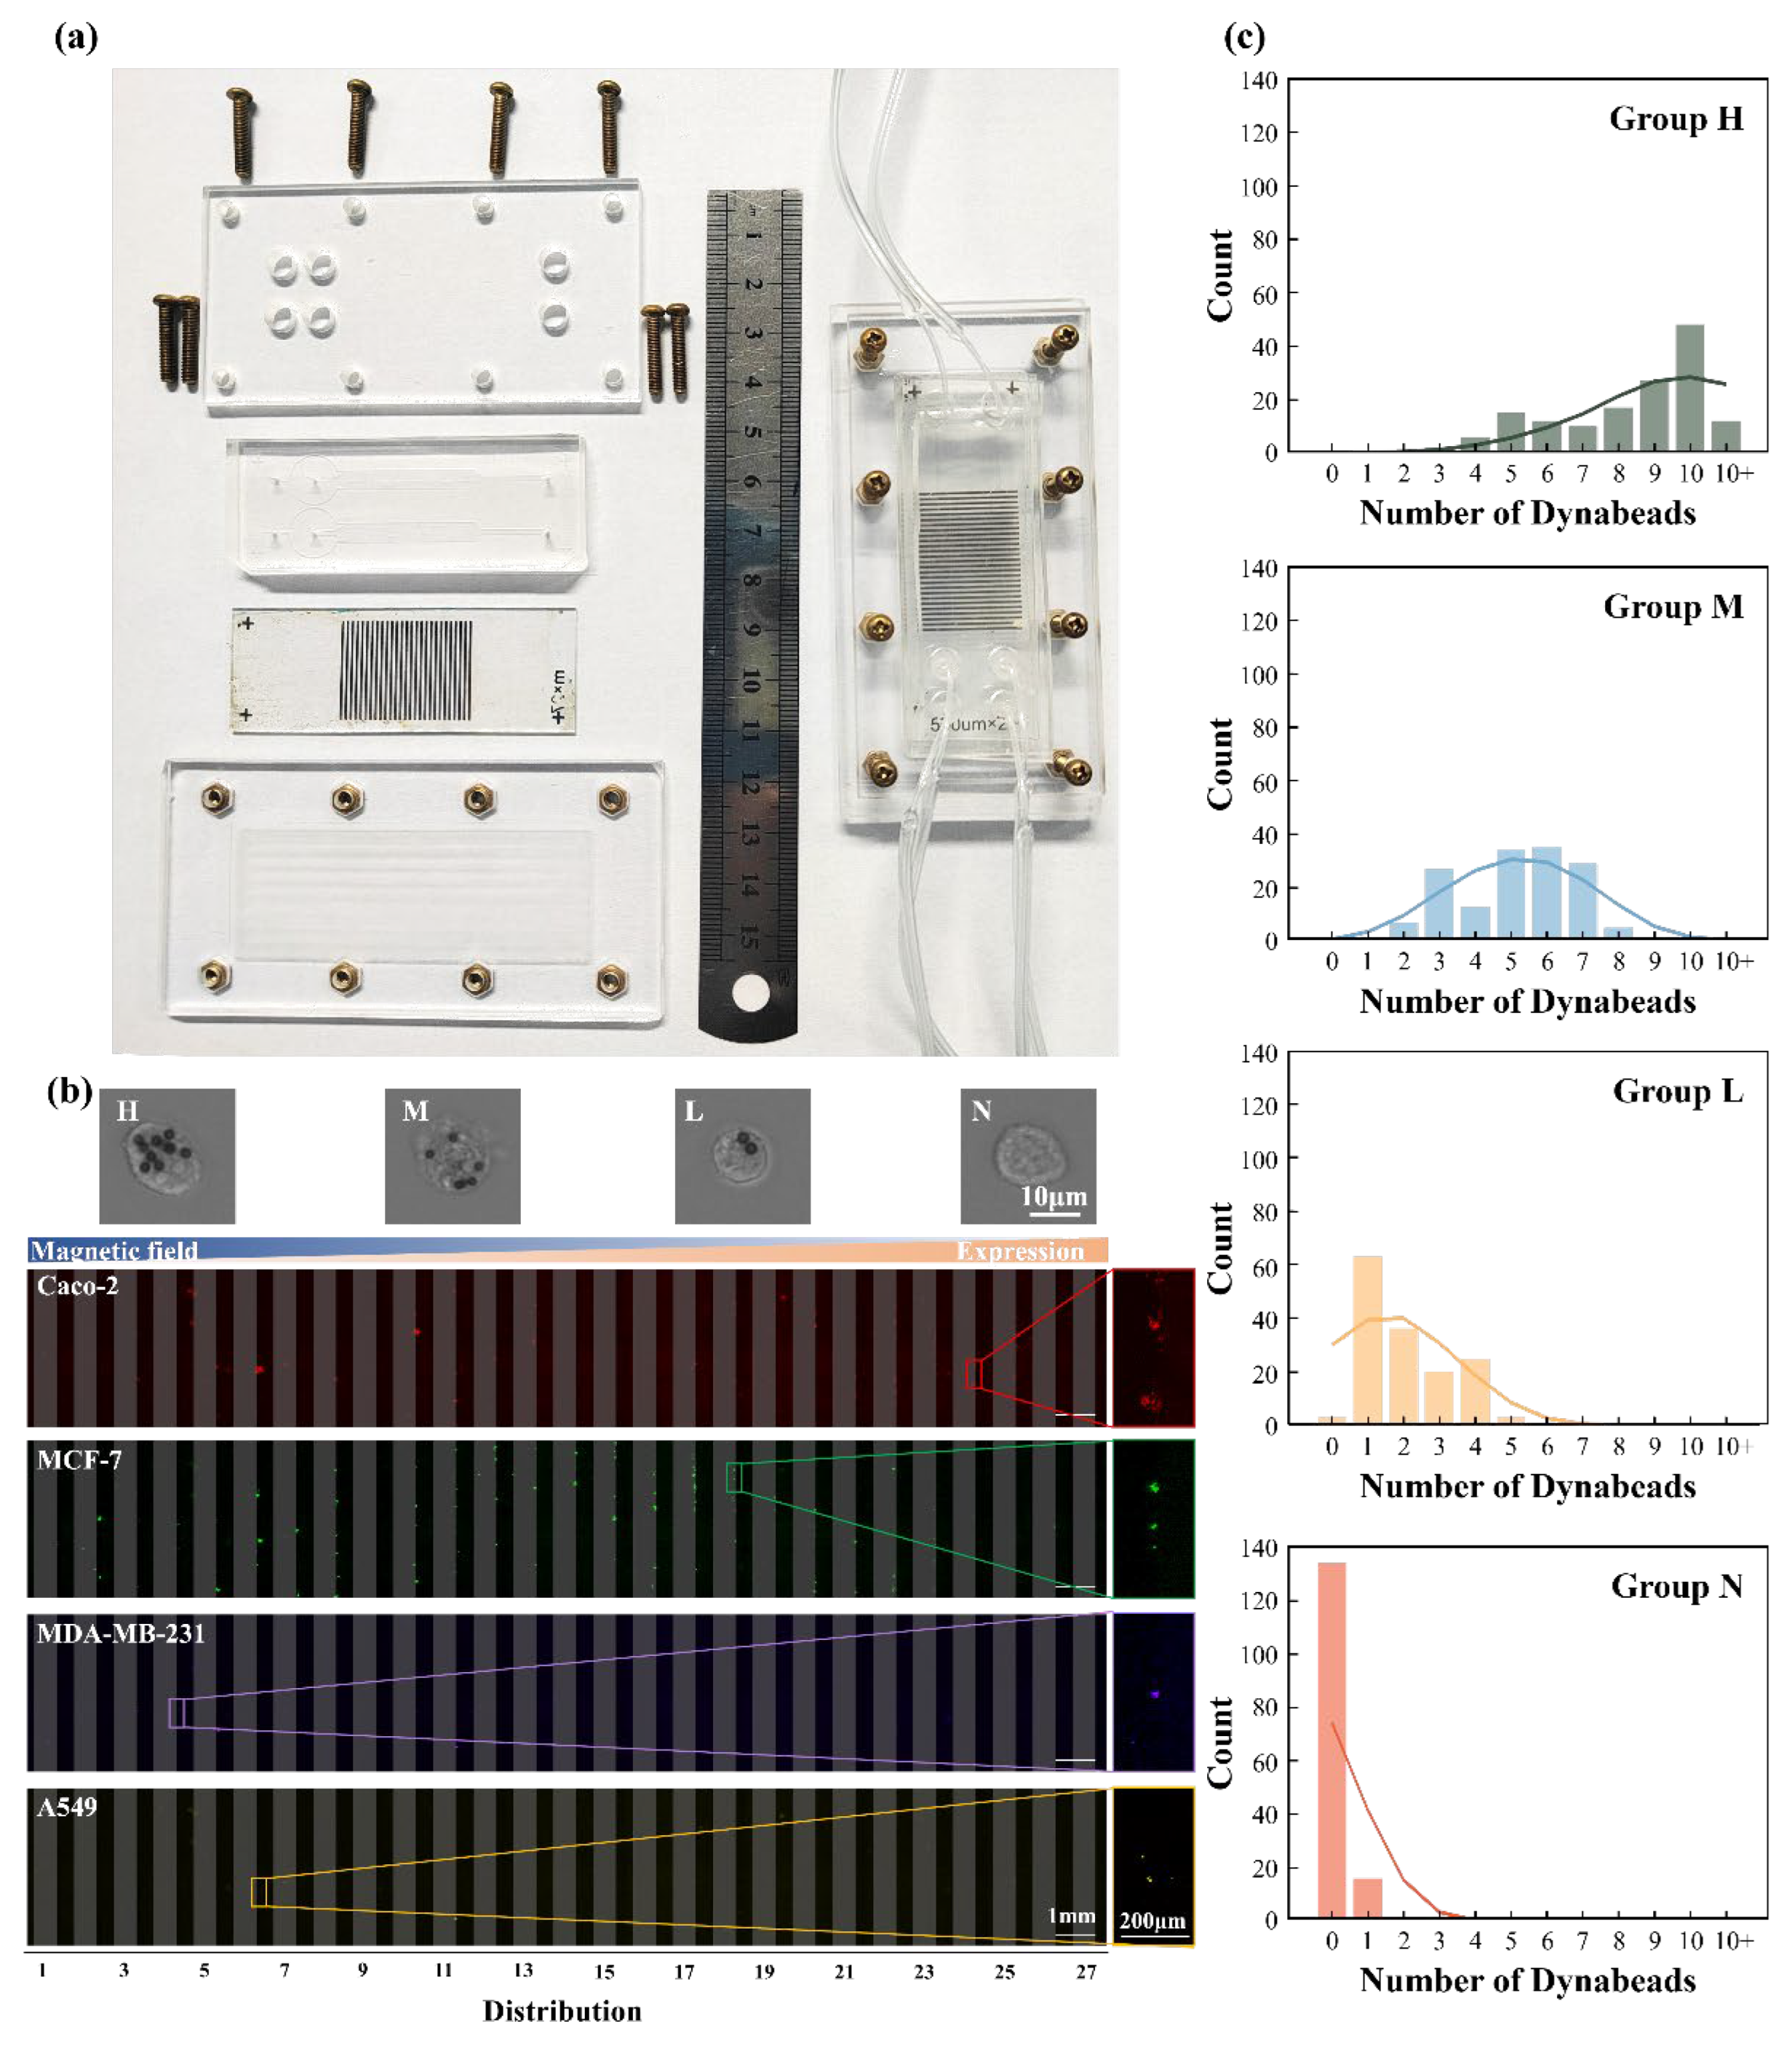
To physically realize the MagSculptor platform, we constructed a modular device composed of three primary components: (i) an etched glass substrate patterned with an array of amorphous soft magnetic strips, (ii) a multilayer polycarbonate-based microchannel bonded atop the magnetic array, and (iii) top and bottom acrylic support plates for compression sealing. The device was assembled using a bolt-and-nut fixture system to ensure robust structural alignment and leak-free fluidic operation (Figure 4a). We incorporated two identical parallel channels to demonstrate the high-efficiency operational capabilities of the parallel flow architecture.
To evaluate the functional performance of the system, we performed subtype separation experiments using four commonly studied epithelial cancer cell lines: Caco-2, MCF-7, MDA-MB-231, and A549, with a total cell population of approximately 1,000 cells per experimental run. During the separation process, magnetically labeled cells were differentiated based on their bead loading and displayed in capture profiles, ultimately being sorted into H, M, and L groups, while uncaptured cells were collected in the N group. The surface-bound magnetic bead numbers transitioned from approximately 10 beads per cell in the H group to zero beads in the N group (Figure 4b). Magnetic microbeads functionalized with anti-EpCAM antibodies were incubated with each cell type, enabling selective labelling via antigen–antibody recognition. The labelled cells were then introduced into the MagSculptor system under continuous flow conditions, each exhibiting distinct levels of EpCAM membrane expression. The subtype distribution results revealed statistically significant differences in EpCAM expression levels among the cell lines, which aligned with established understanding of these cellular phenotypes. Caco-2 cells demonstrated the highest phenotypic expression, followed sequentially by MCF-7 cells, MDA-MB-231 cells, and A549 cells, which exhibited the lowest expression levels (Figure S2) [38,39,40].
Following separation, cell positions within the microchannel were visualized using fluorescence microscopy, with each cell line labelled using a distinct fluorescent dye for identification. A pseudo-color mapping scheme was employed to distinguish the four populations, allowing precise positional analysis of cells relative to the magnetic strip array. The progressive magnetic gradient from strip 1 to strip 27 effectively partitioned cells based on their bead load, with strongly labelled cells retained in earlier regions and weakly labelled cells appearing near the outlet.
By partitioning the populations into H, M, and L groups based on strips 1-9, 10-18, and 19-27 respectively, we achieved distribution patterns corresponding to the expected magnetic bead conjugation levels of 10-6, 5-3, and 1-2 beads per cell as predicted in Figure 3e. Even unlabeled cells were successfully collected in the negative collection group (N group), with the four sorted populations accounting for 96.4 ± 1.1% (n=3) of the initial cell input. This slight reduction in collection efficiency was attributed to unavoidable cellular aggregation and mortality issues that inherently limit separation operational recovery rates.
Due to antigen site occupancy following magnetic bead conjugation, subsequent flow cytometric validation presented technical challenges. To characterize separation efficacy, we performed quantitative analysis of bead occupancy on each sorted subpopulation: H, M, L, and N, by imaging captured cells and systematically counting bead numbers on their surfaces. We randomly selected 150 cells from each group and analyzed the magnetic bead content within these cellular populations. Statistical comparisons confirmed significant differences in bead load between subtypes (Figure 4c). Macroscopic statistical patterns demonstrated progressively decreasing magnetic bead conjugation from H to N groups; however, due to cellular size variations affecting hydrodynamic drag forces and consequently influencing cellular distribution, experimental capture results exhibited significantly broader bead content distribution ranges compared to simulation predictions. This discrepancy represents a potential area for future optimization in related research endeavors.
Furthermore, we conducted parallel experiments targeting low-phenotype cell subtype sorting to benchmark against flow cytometry performance. Results demonstrated that for high EpCAM-expressing MCF-7 cells, flow cytometry, which employs fluorescence-activated cell sorting (FACS) technology, could effectively identify significant differences between positive cells and negative control groups. However, for MDA-MB-231 cells with lower EpCAM phenotypic expression, the intrinsic cellular autofluorescence exhibited excessive similarity to fluorescent antibody-labeled cell populations, making positive-negative discrimination challenging and rendering effective cell sorting nearly impossible (Figure S3). In contrast, our magnetic separation approach for identical batches of MDA-MB-231 cells not only distinguished between negative and positive control groups but also achieved further subpopulation separation within positive cohorts. In reproducibility experiments, we observed cell viability rates (n=3) exceeding 95% across all groups (Figure S4). Notably, no statistically significant difference in cell viability was observed between pre-sorted and post-sorted groups (p > 0.05), suggesting that the sorting process did not adversely affect cell viability—thereby providing enhanced potential for downstream biological research applications.
To evaluate the clinical detection potential of MagSculptor under complex backgrounds, we prepared four independent 4 mL aliquots of whole blood, each spiked with approximately 100, 1,000, 10,000, or 100,000 MDA-MB-231 cells. All samples were incubated with anti-EpCAM magnetic beads at a concentration of 1.2–1.4 × 10⁶ beads/mL for 30 min at room temperature. Given the viscosity differences between whole blood and cell culture medium, as well as the influence of high-density erythrocytes on hydrodynamic drag forces, we ultimately maintained sample throughput at 2,500 μL/h with buffer flow at 800 μL/h, successfully achieving subtype gradient capture of cancer cells from whole blood (Figure S5). Since the spiked MDA-MB-231 cells were not entirely positive, negative cells that failed to conjugate with magnetic beads remained within the whole blood matrix. According to capture enumeration results, approximately 22.4-35.6% (n=4) of the MDA-MB-231 cells spiked into whole blood demonstrated EpCAM positivity. Captured cells in the separation profiles existed as individual entities, and even under low-concentration conditions (<25 cells/mL), single-cell-scale capture and observation were achievable within whole blood samples. More comprehensive clinical validation and applications surrounding this platform warrant further investigation and development.
4. Conclusions
In this study, we introduced MagSculptor, a novel microfluidic-based magnetic cell sorting platform that leverages passive magnetic field sculpting through embedded soft magnetic strips and an externally adjustable field. By integrating field-responsive materials and microscale fluid dynamics, the device achieves multi-stage magnetic force landscapes capable of mechanically fractionating bead-labelled cells based on subtle differences in magnetic content. The system demonstrated high resolution in separating epithelial cancer cells by EpCAM expression, particularly in regimes where protein expression was insufficient for traditional MACS or FACS platforms to resolve.
The magnetic field gradients achieved in MagSculptor—exceeding 2,000 T/m, and the dynamic programmability of field strength via external electromagnets ensures operational flexibility without altering device geometry. Moreover, the device structure is fully modular and reconfigurable, enabling adaptation to various target markers, bead sizes, and flow conditions. Through finite element modelling, coupled force simulations, and biological validation, we demonstrated that cells differing by only a few magnetic beads can be dynamically captured and stratified into biologically meaningful subtypes.
Importantly, the MagSculptor platform transcends the binary classification framework prevalent in standard magnetic cell sorting systems. By enabling continuous and quantitative resolution of cell populations based on molecular expression levels, it opens new avenues for precision diagnostics, functional phenotyping, and pre-enrichment in single-cell omics workflows. Such high-fidelity stratification is especially relevant in immunotherapy, where cellular heterogeneity dictates therapeutic outcomes, and in circulating tumor cell (CTC) analysis, where rare subpopulations hold prognostic and therapeutic significance.
In the future, the MagSculptor architecture will offer fertile ground for interdisciplinary integration. Further developments may include real-time optical tracking and closed-loop magnetic control for adaptive capture, incorporation with droplet microfluidics for downstream single-cell encapsulation, and interfacing with on-chip RNA extraction or sequencing modules for fully integrated “sample-to-answer” platforms. Additionally, scaling the magnetic strip architecture into multiplexed arrays may facilitate high-throughput processing of heterogeneous cell suspensions—an essential capability for clinical translation.
Collectively, this work demonstrates that precise magnetic field engineering within microfluidic systems can unlock new paradigms for label-based cell phenotyping. The MagSculptor concept stands not only as a technical advance in magnetic separation but also as a conceptual bridge between physical field control and biological complexity.
Author Contributions
Conceptualization, methodology, simulation, validation, and writing-original draft preparation, Z.L. and Y.W.; preparing consumables and revising, X.Z.; visualization and biological experiments, Y.C., G.Y. and X.G.; project administration, and funding acquisition, Y.M., J.W.
Funding
This research was funded by the National Natural Science Foundation of China (grant/award nos. 52205312 and 52275200) and the Key Project of Innovation Fund of National Clinical Research Center for Orthopedics, Sports Medicine and Rehabilitation (23-NCRC-CXJJ-ZD1-4).
Data Availability Statement
The original contributions presented in this study are included in the article. Further inquiries can be directed to the corresponding authors.
Conflicts of Interest
The authors declare no conflicts of interest.
Abbreviations
The following abbreviations are used in this manuscript:
| EpCAM | Epithelial cell adhesion molecule |
| MACS | Magnetic-activated cell sorting |
| FACS | Fluorescence-activated cell sorting |
| CTC | Circulating tumor cell |
| PMMA | Polymethyl methacrylate |
| PC | Polycarbonate |
| CAR-T | Chimeric Antigen Receptor T-Cell Immunotherapy |
References
- Friedman, A.A.; Letai, A.; Fisher, D.E.; Flaherty, K.T. Precision medicine for cancer with next-generation functional diagnostics. Nature Reviews Cancer 2015, 15, 747–756. [Google Scholar] [CrossRef]
- Satija, R.; Shalek, A.K. Heterogeneity in immune responses: from populations to single cells. Trends in Immunology 2014, 35, 219–229. [Google Scholar] [CrossRef]
- Arffman, M.; Meriranta, L.; Autio, M.; Holte, H.; Jørgensen, J.; Brown, P.; Jyrkkiö, S.; Jerkeman, M.; Drott, K.; Fluge, Ø. Inflammatory and subtype-dependent serum protein signatures predict survival beyond the ctDNA in aggressive B cell lymphomas. Med 2024, 5, 583–602. [Google Scholar] [CrossRef]
- Smirnov, S.; Mateikovich, P.; Samochernykh, K.; Shlyakhto, E. Recent advances on CAR-T signaling pave the way for prolonged persistence and new modalities in clinic. Frontiers in Immunology 2024, 15, 1335424. [Google Scholar] [CrossRef]
- Turtle, C.J.; Hanafi, L.l.-A.c.; Berger, C.; Hudecek, M.; Pender, B.; Robinson, E.; Hawkins, R.; Chaney, C.; Cherian, S.; Chen, X.; Soma, L.; Wood, B.; Li, D.; Heimfeld, S.; Riddell, S.R.; Maloney, D.G. Immunotherapy of non-Hodgkin lymphoma with a defined ratio of CD8+ and CD4+ CD19-specific chimeric antigen receptor-modified T cells. Science Translational Medicine 2016, 8, 355ra116–355ra116. [Google Scholar] [CrossRef]
- Keller, L.; Werner, S.; Pantel, K. Biology and clinical relevance of EpCAM. Cell stress 2019, 3, 165. [Google Scholar] [CrossRef]
- Yang, J.; Isaji, T.; Zhang, G.; Qi, F.; Duan, C.; Fukuda, T.; Gu, J. EpCAM associates with integrin and regulates cell adhesion in cancer cells. Biochemical and Biophysical Research Communications 2020, 522, 903–909. [Google Scholar] [CrossRef]
- Poudineh, M.; Sargent, E.H.; Pantel, K.; Kelley, S.O. Profiling circulating tumour cells and other biomarkers of invasive cancers. Nature Biomedical Engineering 2018, 2, 72–84. [Google Scholar] [CrossRef]
- Bergmann, L.; Greimeier, S.; Riethdorf, S.; Rohlfing, T.; Kaune, M.; Busenbender, T.; Strewinsky, N.; Dyshlovoy, S.; Joosse, S.; Peine, S. Transcriptional profiles of circulating tumor cells reflect heterogeneity and treatment resistance in advanced prostate cancer. Journal of Experimental & Clinical Cancer Research 2025, 44, 111. [Google Scholar] [CrossRef]
- Gaston, C.; De Beco, S.; Doss, B.; Pan, M.; Gauquelin, E.; D’Alessandro, J.; Lim, C.T.; Ladoux, B.; Delacour, D. EpCAM promotes endosomal modulation of the cortical RhoA zone for epithelial organization. Nature Communications 2021, 12, 2226. [Google Scholar] [CrossRef]
- Li, F.; Xu, H.; Zhao, Y. Magnetic particles as promising circulating tumor cell catchers assisting liquid biopsy in cancer diagnosis: A review. TrAC Trends in Analytical Chemistry 2021, 145, 116453. [Google Scholar] [CrossRef]
- Pike, K.A.; Hui, C.; Krawczyk, C.M. Detecting secreted analytes from immune cells: An overview of technologies. The Tumor Microenvironment: Methods and Protocols 2016, 111–124. [Google Scholar]
- Shen, M.-J.; Olsthoorn, R.C.; Zeng, Y.; Bakkum, T.; Kros, A.; Boyle, A.L. Magnetic-activated cell sorting using coiled-coil peptides: an alternative strategy for isolating cells with high efficiency and specificity. ACS applied materials & interfaces 2021, 13, 11621–11630. [Google Scholar]
- Frenea-Robin, M.; Marchalot, J. Basic Principles and Recent Advances in Magnetic Cell Separation. Magnetochemistry 2022, 8, 11. [Google Scholar] [CrossRef]
- Miglietta, F.; Griguolo, G.; Bottosso, M.; Giarratano, T.; Lo Mele, M.; Fassan, M.; Cacciatore, M.; Genovesi, E.; De Bartolo, D.; Vernaci, G. Evolution of HER2-low expression from primary to recurrent breast cancer. NPJ breast cancer 2021, 7, 137. [Google Scholar] [CrossRef]
- Aldridge, P.M.; Mukhopadhyay, M.; Ahmed, S.U.; Zhou, W.; Christinck, E.; Makonnen, R.; Sargent, E.H.; Kelley, S.O. Prismatic Deflection of Live Tumor Cells and Cell Clusters. ACS Nano 2018, 12, 12692–12700. [Google Scholar] [CrossRef]
- Sun, Y.; Li, H.; Cui, G.; Wu, X.; Yang, M.; Piao, Y.; Bai, Z.; Wang, L.; Kraft, M.; Zhao, W. A magnetic nanoparticle assisted microfluidic system for low abundance cell sorting with high recovery. Micro and Nano Engineering 2022, 15, 100136. [Google Scholar] [CrossRef]
- Polyakova, N.; Kandarakov, O.; Belyavsky, A. Selection of cell populations with high or low surface marker expression using magnetic sorting. Cells 2023, 12, 1286. [Google Scholar] [CrossRef]
- Sadelain, M.; Rivière, I.; Riddell, S. Therapeutic T cell engineering. Nature 2017, 545, 423–431. [Google Scholar] [CrossRef]
- Podoynitsyn, S.N.; Sorokina, O.N.; Kovarski, A.L.; Levin, I.I.; Simakin, S.B. High-Gradient Magnetic Separation of Nanoparticles With Ferromagnetic Track-Etched Membrane. IEEE Transactions on Magnetics 2018, 54, 1–8. [Google Scholar] [CrossRef]
- Myklatun, A.; Cappetta, M.; Winklhofer, M.; Ntziachristos, V.; Westmeyer, G.G. Microfluidic sorting of intrinsically magnetic cells under visual control. Scientific Reports 2017, 7, 6942. [Google Scholar] [CrossRef]
- Civelekoglu, O.; Frazier, A.B.; Sarioglu, A.F. The origins and the current applications of microfluidics-based magnetic cell separation technologies. Magnetochemistry 2022, 8, 10. [Google Scholar] [CrossRef]
- Khashan, S.; Odhah, A.A.; Taha, M.; Alazzam, A.; Al-Fandi, M. Enhanced microfluidic multi-target separation by positive and negative magnetophoresis. Scientific Reports 2024, 14, 13293. [Google Scholar] [CrossRef]
- Wang, Z.; Ahmed, S.; Labib, M.; Wang, H.; Hu, X.; Wei, J.; Yao, Y.; Moffat, J.; Sargent, E.H.; Kelley, S.O. Efficient recovery of potent tumour-infiltrating lymphocytes through quantitative immunomagnetic cell sorting. Nature Biomedical Engineering 2022, 6, 108–117. [Google Scholar] [CrossRef]
- Murray, C.; Miwa, H.; Dhar, M.; Park, D.E.; Pao, E.; Martinez, J.; Kaanumale, S.; Loghin, E.; Graf, J.; Rhaddassi, K. Unsupervised capture and profiling of rare immune cells using multi-directional magnetic ratcheting. Lab on a Chip 2018, 18, 2396–2409. [Google Scholar]
- Liu, Y.; Vieira, R.M.S.; Mao, L. Simultaneous and multimodal antigen-binding profiling and isolation of rare cells via quantitative ferrohydrodynamic cell separation. ACS nano 2022, 17, 94–110. [Google Scholar] [CrossRef]
- Shen, F.; Yu, Y.; Li, Y.; Feng, H.; Wu, T.; Chen, Y. Microscale magnetic field modulation using rapidly patterned soft magnetic microstructures. RSC advances 2021, 11, 34660–34668. [Google Scholar] [CrossRef]
- Sun, F.; He, S. Static magnetic field concentration and enhancement using magnetic materials with positive permeability. Progress In Electromagnetics Research 2013, 142, 579–590. [Google Scholar] [CrossRef]
- Furlani, E.P.; Ng, K.C. Analytical model of magnetic nanoparticle transport and capture in the microvasculature. Phys Rev E Stat Nonlin Soft Matter Phys 2006, 73, 061919. [Google Scholar] [CrossRef]
- Furlani, E.P. Analysis of particle transport in a magnetophoretic microsystem. Journal of Applied Physics 2006, 99. [Google Scholar] [CrossRef]
- Schneider, T.; Moore, L.R.; Jing, Y.; Haam, S.; Williams, P.S.; Fleischman, A.J.; Roy, S.; Chalmers, J.J.; Zborowski, M. Continuous flow magnetic cell fractionation based on antigen expression level. Journal of biochemical and biophysical methods 2006, 68, 1–21. [Google Scholar] [CrossRef]
- Evani, S.J.; Prabhu, R.G.; Gnanaruban, V.; Finol, E.A.; Ramasubramanian, A.K. Monocytes mediate metastatic breast tumor cell adhesion to endothelium under flow. The FASEB Journal 2013, 27, 3017. [Google Scholar] [CrossRef]
- Wu, Y.; Stewart, A.G.; Lee, P.V. On-chip cell mechanophenotyping using phase modulated surface acoustic wave. Biomicrofluidics 2019, 13. [Google Scholar] [CrossRef]
- Fu, Q.; Zhang, Y.; Huang, T.; Liang, Y.; Liu, Y. Measurement of cell compressibility changes during epithelial–mesenchymal transition based on acoustofluidic microdevice. Biomicrofluidics 2021, 15. [Google Scholar] [CrossRef]
- Carneiro, A.; Piairo, P.; Teixeira, A.; Ferreira, D.; Cotton, S.; Rodrigues, C.; Chà charo, A.; Abalde-Cela, S.; Santos, L.c.L.; Lima, L.s. Discriminating epithelial to mesenchymal transition phenotypes in circulating tumor cells isolated from advanced gastrointestinal cancer patients. Cells 2022, 11, 376. [Google Scholar] [CrossRef]
- Cassano, D.; Bogni, A.; La Spina, R.; Gilliland, D.; Ponti, J. Investigating the cellular uptake of model nanoplastics by single-cell ICP-MS. Nanomaterials 2023, 13, 594. [Google Scholar] [CrossRef]
- Dogan, A.A.; Dufva, M. Heterogenous morphogenesis of Caco-2 cells reveals that flow induces three-dimensional growth and maturation at high initial seeding cell densities. Biotechnology and Bioengineering 2023, 120, 1667–1677. [Google Scholar] [CrossRef]
- Shigdar, S.; Qian, C.; Lv, L.; Pu, C.; Li, Y.; Li, L.; Marappan, M.; Lin, J.; Wang, L.; Duan, W. The use of sensitive chemical antibodies for diagnosis: detection of low levels of EpCAM in breast cancer. PLoS One 2013, 8, e57613. [Google Scholar] [CrossRef]
- Cui, Y.; Li, J.; Liu, X.; Gu, L.; Lyu, M.; Zhou, J.; Zhang, X.; Liu, Y.; Zhu, H.; Zhang, T. Dynamic expression of EpCAM in primary and metastatic lung cancer is controlled by both genetic and epigenetic mechanisms. Cancers 2022, 14, 4121. [Google Scholar] [CrossRef]
- Martowicz, A.; Spizzo, G.; Gastl, G.; Untergasser, G. Phenotype-dependent effects of EpCAM expression on growth and invasion of human breast cancer cell lines. BMC cancer 2012, 12, 1–16. [Google Scholar] [CrossRef]
Figure 1.
Figure 1. Structural and magnetic field characteristics of the MagSculptor system. (a) Magnetic field enhancement near soft magnetic materials. The upper panel illustrates the magnetic field distribution along the detection line depicted in the lower panel. (b) Magnetic flux lines and corresponding gradient fields show strong convergence near strip edges. The upper panel delineates the magnetic field gradient along the detection line presented in the lower panel. (c) Magnetic flux density and gradient decay as a function of increasing distance from the soft magnetic element. (d) Schematic of the MagSculptor. (e) Cross-sectional side view of the MagSculptor microfluidic chip. (f) Simulated spatial distribution of the magnetic field along the channel. (g) Magnetic field profile at a height of 50 μm above the strip array.
Figure 2.
Figure 2. Coupled magneto-hydrodynamic simulation of the MagSculptor system. (a) Spatial distribution of the magnetic force factor (H·∇)H across the microchannel. (b) Simulated magnetic force profile for a 2.8 µm magnetic bead near the distal strip. (c) The vertical force component (z-direction) acting on a 2.8 μm magnetic bead along the yellow detection line in (b). (d) Flow velocity profile in the channel follows. (e) Phase-field simulation of sample and buffer interface distribution. (f) Axial view of combined flow and magnetic field simulation.
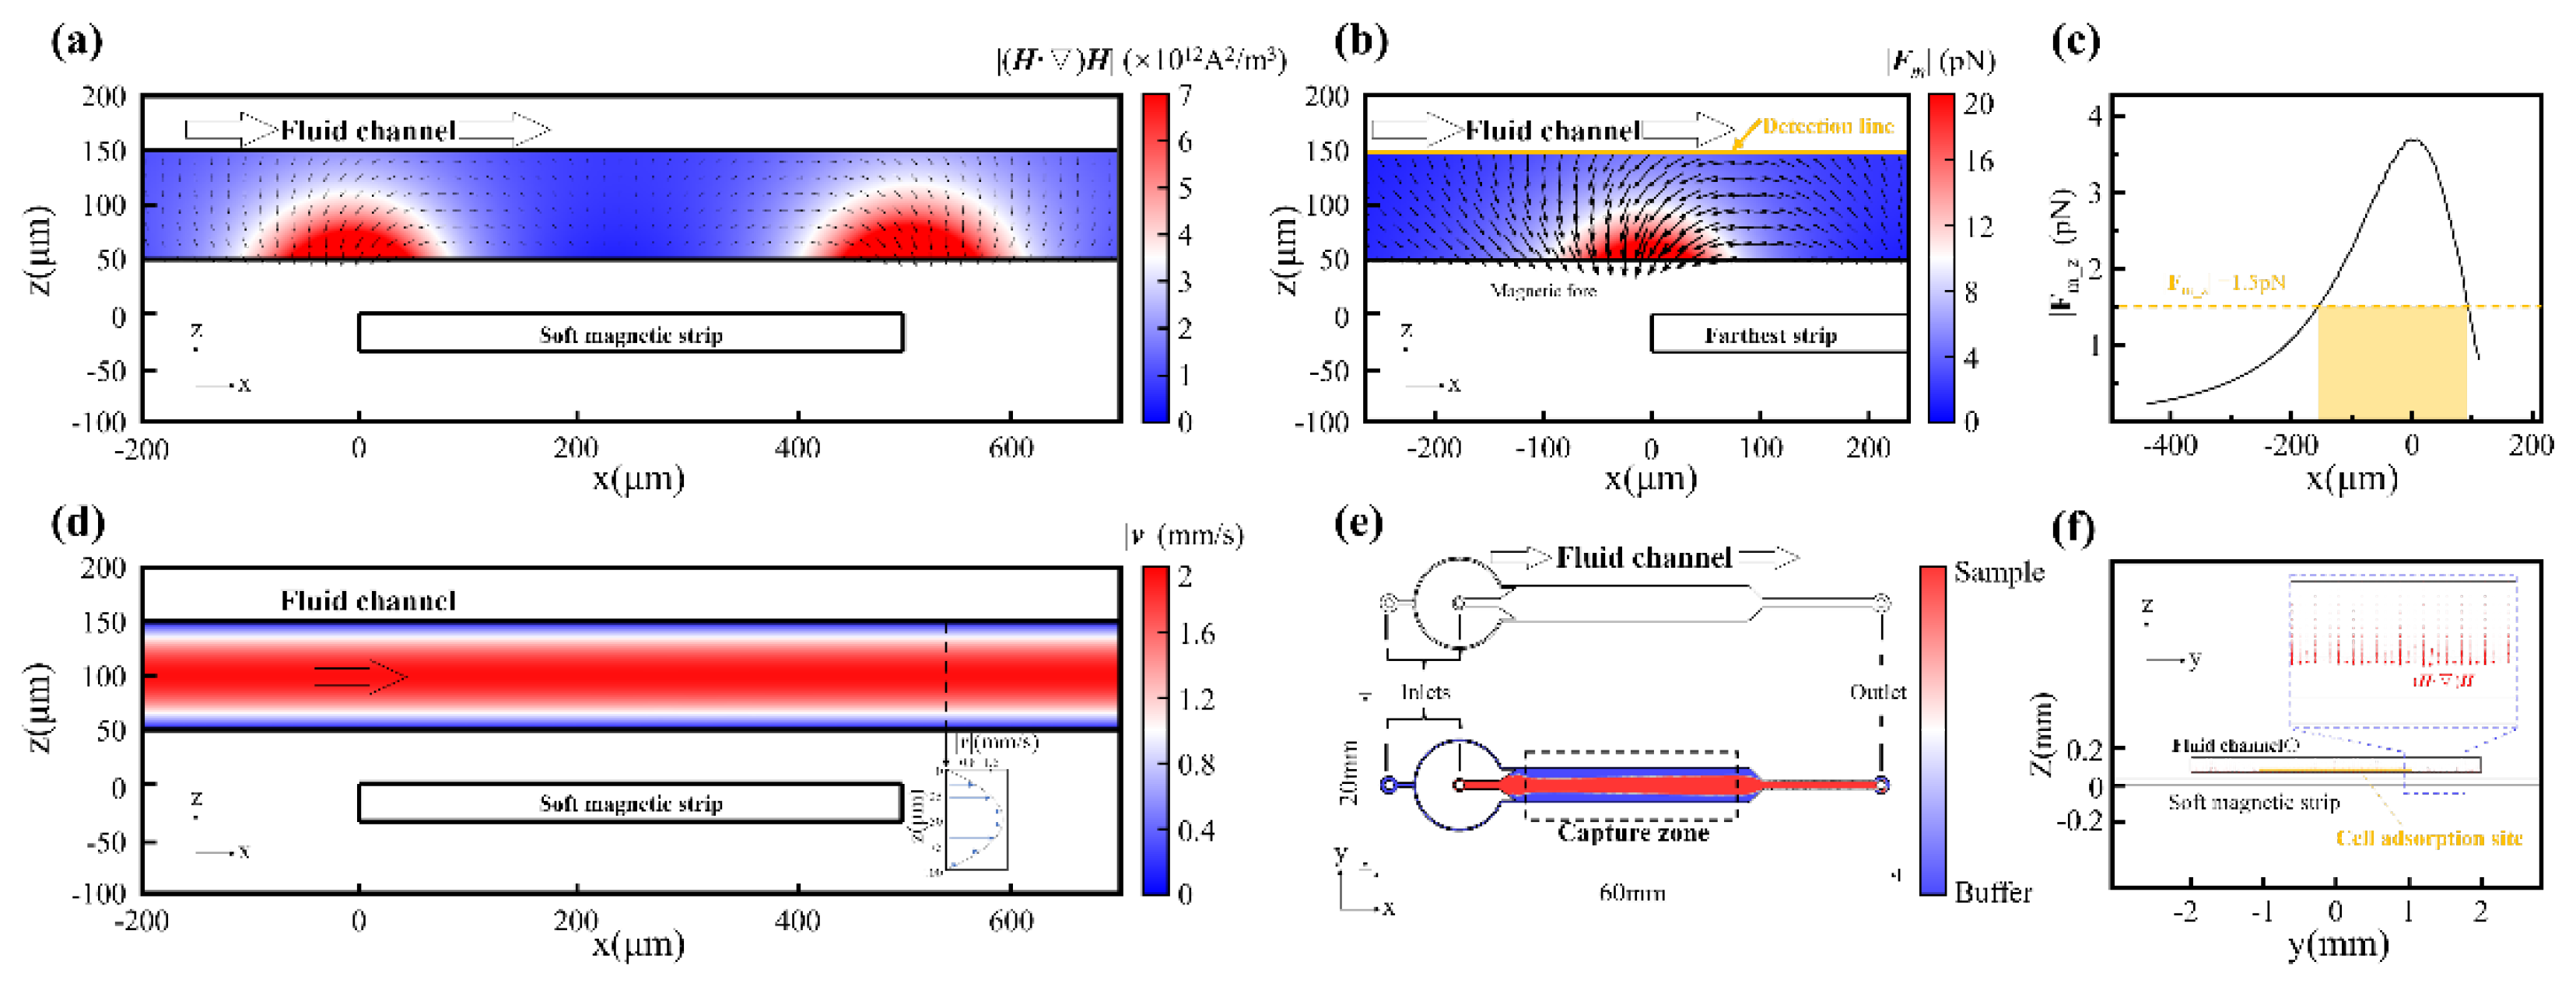
Figure 3.
Figure 3. Parametric analysis and dynamic simulation of cell subtype sorting in the MagSculptor system. (a) The distribution of the horizontal magnetic force and frictional force brought by a single magnetic bead (2.8 μm) to the cell. (b) Magnetic field profiles above the soft magnetic strip as a function of varying electromagnet current and strip-to-channel distance. (c) Parametric analysis of effective magnetic susceptibility of bead–cell conjugates. The dashed circular regions delineate the modeling range encompassing the cellular dimensions investigated in this study. (d) Force distribution profiles for different cell types within the microchannel. Modeling parameters: cell diameter = 15 μm, magnetic bead diameter = 2.8 μm. (e) Simulated velocity and position trajectories for cells with different magnetic labelling densities. Modeling parameters: cell diameter = 15 μm, magnetic bead diameter = 2.8 μm.
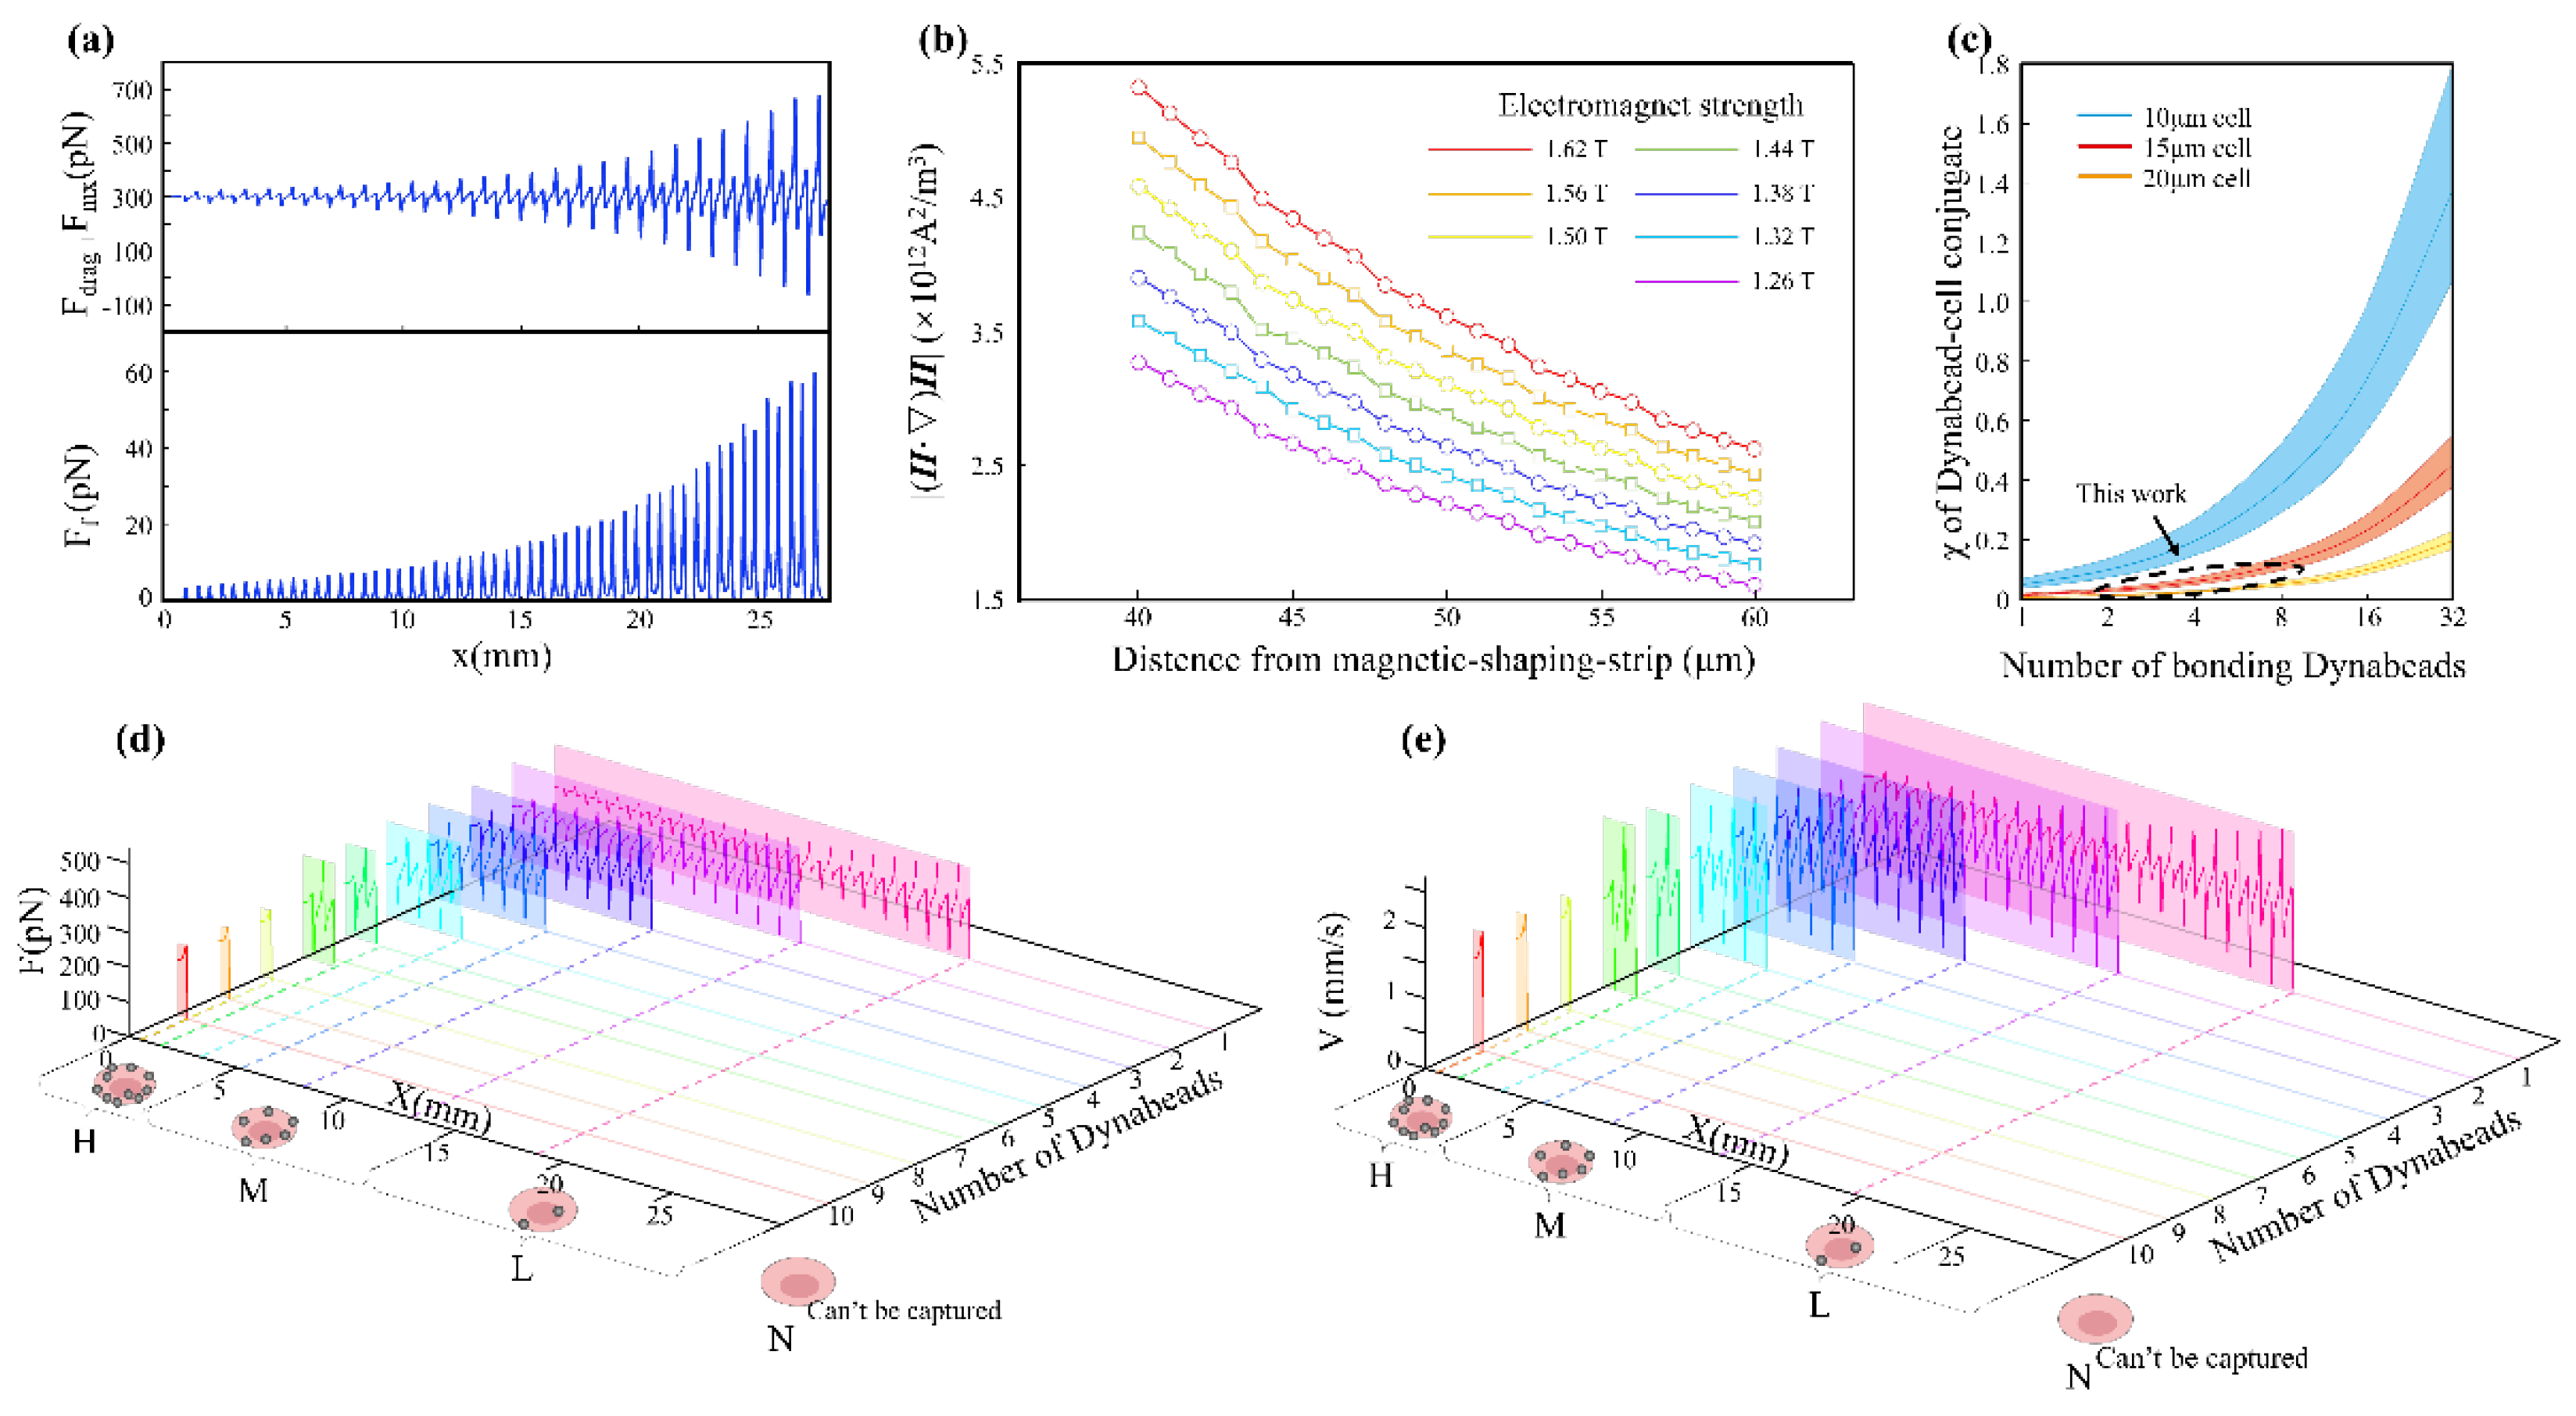
Figure 4.
Figure 4. Experimental implementation and validation of MagSculptor in cell subtype sorting. (a) Photograph of the MagSculptor assembly. A dual-channel configuration is shown as an example, demonstrating that the platform can be extended to parallel channels for increased overall throughput. (b) Fluorescence microscopy images of separated cancer cell lines (Caco-2, MCF-7, MDA-MB-231, and A549). Each sample initially contained approximately 1000 cells; only those captured within the device are shown, whereas the negative fraction (N group) collected downstream is not displayed. (c) Bar graph depicting the average magnetic bead occupancy per cell across the four sorted groups (H, M, L, and N). For each subtype, bead attachment was quantified from a cohort of 150 individual cells.
Disclaimer/Publisher’s Note: The statements, opinions and data contained in all publications are solely those of the individual author(s) and contributor(s) and not of MDPI and/or the editor(s). MDPI and/or the editor(s) disclaim responsibility for any injury to people or property resulting from any ideas, methods, instructions or products referred to in the content. |
© 2025 by the authors. Licensee MDPI, Basel, Switzerland. This article is an open access article distributed under the terms and conditions of the Creative Commons Attribution (CC BY) license (http://creativecommons.org/licenses/by/4.0/).
Copyright: This open access article is published under a Creative Commons CC BY 4.0 license, which permit the free download, distribution, and reuse, provided that the author and preprint are cited in any reuse.


