Submitted:
30 September 2025
Posted:
30 September 2025
You are already at the latest version
Abstract
This study examines the impact of technological capabilities across industries on venture capital (VC) inflows. Technological capabilities were proxied by industry-level patent applications and R&D expenditures. VC inflows were derived from annual investment statistics published by the Ministry of SMEs and Startups and the Korea Venture Capital Association. Multiple regression analysis shows that industries with more patent appli-cations are more likely to attract venture investments. Moreover, the relationships among patents, R&D, and venture inflows vary significantly across industries. In the biomedical industry, VC inflows show strong positive correlations with patent applications (r = 0.762, p < 0.001) and R&D investment (r = 0.900, p < 0.001). In contrast, in the information and communication technology manufacturing sector, the association between patent appli-cations and VC inflows is not statistically significant (R² = 0.002, p > 0.05), implying that the conversion efficiency of technological outputs into investment differs according to the industrial structure. This study provides evidence of how technological development translates into commercialization and private investment. The findings contribute to a nuanced understanding of success factors in technology-based startups by industry and may serve as a foundation for the formulation of effective policy measures and investment strategies to promote private capital inflows.
Keywords:
technological development
; patent applications
; venture capital
; industry analysis
; technology-based entrepreneurship
; R&D investment
1. Introduction
Technology, along with capital and labor, functions as a core production factor that underpins the competitiveness of modern industries. Firm growth is highly dependent on the level of technological development and the extent to which firm outputs are connected to market applications. In today’s knowledge-based industrial structure, technological capabilities are closely tied to the possibility of attracting external capital, particularly venture investment (VI) [1]. Technological outputs not only reflect the intrinsic value of a firm but also serve as substantive decision criteria for investors.
Technological performance is commonly measured using two representative indicators: the number of patent applications and R&D expenditures. These measures are widely used to evaluate a firm’s innovation activities. Patents serve as formal output indicators of innovation, signaling legal protection and potential market exclusivity. In the context of venture capital (VC), patents provide indirect information on income potential [2]. In contrast, R&D expenditure functions as an input indicator that reflects the amount of resources a firm commits to building its technological capabilities, demonstrating its level of technological intensity and growth orientation. Taken together, patenting and R&D play complementary roles in assessing technological development, and their combination allows for a more multidimensional understanding of industry-level technological capabilities.
Over the past decade, Korea’s VC market has undergone a structural transformation from a government-led investment environment to one marked by increased participation from private limited partners, diversification of investable industries, and a rise in technology intensity. Both the volume of venture fund formations and new investment amounts have shown steady growth, with artificial intelligence, biotech, and cleantech emerging as major investment sectors [3,14]. These structural shifts suggest that the influence of technological performance on VC inflows may vary across industries. Particularly, in sectors characterized by high technological intensity, patents and R&D outputs may play a more prominent role in shaping investor decisions [3].
Prior research has primarily focused on the firm-level impact of technological performance on aspects such as firm value or stock price, IPO outcomes [4,5], market value of patents [6], and assessments of technological risk from an investor’s perspective [7]. However, empirical studies that explore the structural relationship between technological performance and capital inflows at the industry level remain limited. Moreover, many existing studies rely on either patents or R&D as a single indicator and lack analyses that account for their interaction or complementarity.
To address this gap, this study quantitatively measures the level of technological development across industries using two indicators, patent applications and R&D expenditures, and empirically investigates their relationship with the amount of VI attracted by each industry. In particular, this study aims to determine whether technological performance has a statistically significant impact on VC inflows and whether such effects differ across industries. In doing so, it seeks to reveal the structural link between technological development and private capital attraction.
To achieve this objective, a quantitative analysis is conducted using secondary panel data organized by industry and year. This study empirically examines the relationship between technological performance and VC through three analytical dimensions: time-lag effects, impact strength, and inter-industry conversion efficiency. Specifically, lagged regression models are applied to the patent and R&D variables to determine the timing and magnitude of their effects on private investment. Furthermore, interaction terms with industry dummies are introduced to identify how the same level of technological performance induces different investment responses across industries.
The remainder of this paper is structured as follows. Section 2 reviews the theoretical linkage between technological performance and private investment and derives research hypotheses based on prior literature. Section 3 presents the methodology, including the variable definitions, data collection procedures, and research models. Section 4 provides an empirical analysis that focuses on lag structures and industry-specific investment responses. Finally, Section 5 and Section 6 offer a comprehensive discussion of the findings, policy and managerial implications, and suggestions for future research.
2. Theoretical Background and Hypothesis Setting
2.1. Time-Lag Effects of Technology Development
A temporal delay often exists between the development of new technologies and their eventual commercialization or attraction of private investment. Typically, novel technologies and products require substantial progress, from research and development to market readiness. Venture capitalists, in turn, take into account the probability of technological success and the level of commercialization preparedness before determining the timing of their investment. As a result, the outcomes of current technological activities may not be immediately reflected in VC inflows within the same year but instead appear after a certain time lag.
For example, in the pharmaceutical industry, the development of new drugs requires extensive clinical trials and regulatory approval. Thus, current R&D investments may only lead to visible business outcomes or investments several years later. Previous studies have reported that the economic return on R&D investment typically emerges with an average lag of two to five years, depending on the industry [8]. Specifically, the effect appears after approximately two years in the electronics and metal industries, approximately five years in the pharmaceutical sector, and approximately three years, on average, in other industries. This reflects the cumulative nature of innovation, whereby technological outcomes materialize through accumulated efforts over time, and VIs are often made based on the expectation of these delayed returns.
In the VC decision-making process, the maturity level of the technology and the degree of market validation serve as key evaluation criteria. Rather than investing fully in nascent technologies, investors tend to wait until certain milestones, such as prototype development or initial market validation, are achieved. This suggests that VC is more likely to be attracted once a sufficient level of technological output has accumulated and become visible. For example, follow-on investments often occur after a startup secures a core patent or successfully launches a prototype in the market.
Conti et al. [9] note that while patent filings serve as a strong investment signal in the early stages, their signaling power tends to diminish in later rounds of financing. As time progresses, information asymmetry is reduced and investors gain a clearer understanding of the firm’s technological competence and growth potential, which in turn lowers the relative importance of early-stage signals.
Thus, the causal relationship between technological development and VI should be viewed not as linear but as a dynamic process that evolves over time. VC, therefore, is not solely a response to present technological outputs but is more likely a reaction to the accumulation of technological capabilities built over preceding periods. Based on this theoretical and empirical foundation, the following hypothesis is proposed:
Hypothesis 1.
Technological capabilities at the industry level will have a significant impact on venture investment, albeit with a time lag.
2.2. Correlation Between Industry-Level Technological Development and Venture Investment
Technological innovation and VC are widely recognized, both theoretically and empirically, as complementary drivers of economic growth [10,11]. In general, technological development creates new business opportunities that attract VC, whereas VI accelerates the growth of innovative firms and enables further technological advancement. This mutually reinforcing relationship forms a virtuous cycle within the broader innovation ecosystem and plays a critical role in enhancing the competitiveness of industries and national economies.
Previous studies have examined the interactive structure between technological development and VC from various perspectives. For example, Kortum and Lerner [10] conducted an empirical analysis of U.S. industries and found that industries with active VC investment showed a significant increase in patent applications, demonstrating the catalytic role of VC in stimulating innovation. Similarly, Samila and Sorenson [11] found that higher levels of regional VI are associated with increased patenting activity and entrepreneurial ventures.
A reverse causal direction is also notable. Industries or firms with high levels of technological innovation tend to be perceived by external investors as having strong growth potential, which makes them more attractive to venture capitalists. In particular, patents serve as strong external signals of a startup’s technological capability, playing a critical role in early-stage investment decisions where information asymmetry is significant [9,12]. Multiple studies show that firms that hold patents are evaluated at higher valuations and enjoy greater access to capital than their non-patenting counterparts.
Park and Shin’s [13] analysis of Korean venture-backed companies revealed that those receiving VC tended to hold more patents prior to their initial public offerings (IPOs). This finding suggests that investors place considerable emphasis on patent ownership when making investments.
At the industry level, there is evidence that VC tends to concentrate in sectors with strong technological capabilities. For instance, more than 70% of VC in Korea is directed toward technology-intensive sectors such as information and communication technology (ICT), biotechnology, and clean technology [14]. This implies that technological development indicators, such as patenting activity and R&D investment, are closely linked to VC inflows. A similar pattern is observed in the United States, where industries backed by VC tend to exhibit higher levels of innovation output, including patent and technology transfer activities [11,15].
In summary, it is reasonable to expect a positive correlation between the level of technological development and the volume of VIs at the industry level. Patent applications and R&D expenditures serve as observable indicators of technological capability and are likely to play a substantive role in shaping VC decisions. Based on this theoretical and empirical background, the following hypotheses are proposed:
Hypothesis 2.
Technological capabilities at the industry level will significantly influence venture investment in that industry.
Hypothesis 2-1.
The number of patent applications by industry will have a positive effect on venture investment.
Hypothesis 2-2.
The amount of R&D investment by industry will have a positive effect on venture investment.
2.3. Conversion Effect of Technological Performance and Structural Differences Across Industries
The process by which technological performance translates into private VI is characterized by structural heterogeneity across industries. The effectiveness of this conversion cannot be fully explained by the quantity or quality of technology alone. Instead, it is shaped by a complex interplay of factors, including each industry’s commercialization pathway, capital requirements, market entry barriers, regulatory environment, and startup entry hurdles [16].
For example, the ICT industry features short development cycles, lower capital intensity for commercialization, and relatively low barriers to market entry. As a result, it tends to exhibit faster and more efficient conversion of technological outcomes into VC inflows, reflecting a high level of conversion effectiveness [17]. In contrast, the biotechnology industry requires lengthy and complex validation processes such as clinical trials and regulatory approvals. These characteristics, along with high capital requirements and stringent regulations, result in significant time delays and constraints before technological performance can be transformed into investment [18]. Such structural differences explain why similar levels of technological output can lead to vastly different VC levels across industries.
Differences in the modes of technological validation also contribute to variations in conversion effectiveness. In ICT, marketability can be easily verified through user testing and prototype development. By contrast, the biotechnology industry requires more resource-intensive procedures, such as clinical trials and governmental approvals, which increase both the time and cost required to translate technological outputs into capital [17].
One way to examine these differences across industries empirically is to compare the actual amount of VI attracted per unit of technological performance, such as per patent application or per unit of R&D spending. For instance, if Industry A attracts KRW 300 million per patent on average, whereas Industry B attracts only KRW 50 million, it can be inferred that Industry A has a conversion effect six times greater than that of Industry B. In this sense, what matters is not merely the absolute level of technological performance but how efficiently it is transformed into private capital, an effect that is quantifiable by industry.
Previous studies support this view. Farre-Mensa et al. [19], using the U.S. patent “lottery” system, found that patent approval increased a startup’s likelihood of receiving VC by approximately 59%. Häussler et al. [20,21], analyzing the biotechnology sectors in Germany and the UK, showed that patent ownership and the status of opposition procedures had a significant impact on both the timing and magnitude of VI, highlighting industry-specific structural differences in the conversion effect. In Korea, Lee et al. [22] analyzed the interaction effects between technological performance and industry dummies for SMEs, providing empirical evidence of heterogeneous spillover effects by sector.
However, most previous studies have treated industry type merely as a categorical control variable or limited analysis to comparing regression coefficients without directly testing whether the impact of technological performance on investment significantly differs across industries. To address this gap, this study incorporates the interaction terms between technological indicators and industry dummies into regression models, thereby empirically testing whether the same level of technological performance leads to statistically different levels of VI depending on the industry. Accordingly, the following hypotheses are proposed:
Hypothesis 3.
The conversion effect of technological performance into VC will differ significantly across industries.
Hypothesis 3-1.
The conversion effect of patent applications on venture investment will differ significantly across industries.
Hypothesis 3-2.
The conversion effect of R&D investment on venture investment will differ significantly across industries.
3. Methods
3.1. Research Procedure
To examine the relationship between technological performance and private VC investment empirically, this study conducted a quantitative analysis using industry-level, year-based secondary data. The core variables included the number of patent applications, R&D investment, and VC investment by industry. To investigate the relationships between these variables, a three-stage analytical procedure was established, as detailed below.
First, the study examined whether a time lag exists between technological performance and its impact on VC inflows. For this purpose, lagged regression analysis was employed. Regression models were constructed by applying lags from the current year (t) to four years prior (t–4) for both patent applications and R&D investments. Lagged regression is a quantitative technique that identifies the effect of past values of independent variables on current dependent variables, making it particularly suitable for analyzing the cumulative nature of innovation and the delayed response of investment. This step aimed to identify the time lag with the highest statistical significance and corresponds to Hypothesis 1, which seeks to quantify the temporal structure between technological performance and investment inflows.
Second, with the optimal lag structure fixed, this study assessed the static influence of technological performance, measured by the number of patent applications and R&D investment, on VC inflows. A panel dataset structured by industry and year was analyzed using Pooled Ordinary Least Squares (OLS), a fixed-effects model (FEM), and general panel regression methods. Pooled OLS estimates coefficients by treating all observations as a single pool and ignoring heterogeneity across units, while FEM controls for unobserved industry-specific characteristics, thereby isolating the pure effect of technological performance. A panel regression integrates both cross-sectional and time-series dimensions, offering a more comprehensive analysis that captures variability across industries and over time. In the second stage, both overall and industry-specific regressions were conducted to compare capital inflow responses according to technological intensity. This stage corresponds to Hypothesis 2, which focuses on the general tendency of technological performance to induce private investment.
Third, this study investigated whether the conversion effect of technological performance into VC differs significantly across industries, even when the level of technological output is the same. To test this hypothesis, an interaction-term model was constructed by incorporating cross-products between the technological and industry dummy variables. This allowed for the statistical verification of whether conversion effectiveness varied by industry. This procedure aligns with Hypothesis 3 and offers a more refined analysis that reflects structural heterogeneity across industries.
The overall analytical procedure is illustrated in Figure 1. Using this multilayered empirical approach, this study explores the relationship between technological performance and VC investment along three dimensions: time-lag structure, impact magnitude, and inter-industry variation in conversion effectiveness.
3.2. Defining and Measuring Variables
To empirically analyze the impact of industry-level technological capabilities on VC investment, this study defined the dependent, independent, and control variables. Each variable was selected and operationalized based on theoretical and empirical foundations drawn from prior studies on technology commercialization and venture funding [2,9,13].
The dependent variable is defined as the annual amount of VC inflow by industry. This variable serves as a representative indicator of commercialization, reflecting the extent to which technological developments are converted into private investment [23]. Specifically, industry-level annual VC investment amounts (in million USD) were collected from the statistical databases of the Ministry of SMEs and Startups and the Korea Venture Capital Association (KVCA). Industries were classified using the major sectoral taxonomy established by the ministry, including ICT, bio/medical, manufacturing, and distribution/services. All monetary values were converted from Korean won (KRW) to U.S. dollars (USD) using the average annual exchange rate for 2020 (1 USD ≈ 1,180 KRW) and then adjusted to constant 2020 prices. To correct for skewness in the distribution and ensure regression stability, all monetary variables were natural log-transformed before the analysis [26].
The independent variables represented industry-level technological capabilities and consisted of two indicators. First, the number of patent applications was treated as a representative output indicator of technological development and functioned as a signal of innovation performance in each industry [9,24]. Patents are especially important in early-stage investments characterized by high information asymmetry, serving as a basis for investor evaluation and enhancing the perceived credibility of technology-based startups. Data on annual patent applications were obtained from the Korea Intellectual Property Office (KIPO) and the Korea Institute of Patent Information. Industry-level mapping was conducted using International Patent Classification (IPC) codes. The dataset includes both domestic and Patent Cooperation Treaty (PCT) international applications and is structured according to the year of application. This variable was also log-transformed prior to the regression analysis.
Second, the amount of R&D investment represented the total expenditure (in million USD) of private firms on R&D activities within each industry and served as an input indicator of technological development. This reflects the intensity of a firm’s innovation commitment and strategic technological efforts, and is widely used in techno-economics to assess technological capability [2,25]. Data were collected from the “Survey on R&D Activities by Enterprises” by the Ministry of Science and ICT and the “Survey on Business Activities” by Statistics Korea (10th and 11th revised editions). All values were converted from KRW to USD using the 2020 average exchange rate and adjusted to 2020 constant prices. Natural log transformation was applied prior to the analysis [30,31].
To enhance the accuracy of the analysis, the following control variables were included in the regression models: First, Gross Value Added (GVA) by industry was incorporated to control for differences in investment volume due to industry size. Since larger industries tend to attract greater absolute investment, controlling for GVA helps isolate the net effect of the technological variables. Second, macroeconomic indicators such as the base interest rate, monetary liquidity (M2), and the KOSDAQ index were included. Additionally, year fixed effects were introduced to control for temporal shocks throughout the study period. Finally, multicollinearity diagnostics were conducted using the Variance Inflation Factor (VIF), owing to the high correlation between patent applications and R&D investment. Where necessary, Principal Component Analysis or standardized composite indices were used to consolidate the indicators into single variables.
The above variable construction was designed to align with the study’s objective of empirically identifying the structural linkage between technological development and VC inflow while also enabling the analysis of conversion efficiency and time-lag effects across industries. A summary of all variables is provided in Table 1.
3.3. Data Collection
To empirically analyze the impact of technological capabilities on VC investment across Korean industries, this study constructed a panel dataset spanning 2006 to 2023. The industry classification was primarily based on the taxonomy provided by the Ministry of SMEs and Startups in its official VI statistics. To ensure compatibility with technological performance indicators, namely R&D investment and patent application data, certain industries were reclassified or excluded to improve consistency and data integrity.
Although the initial dataset included a wide range of industries, sectors with ambiguous classification schemes or insufficient technological indicator data were excluded from the analysis. Specifically, the category “Others” was excluded due to heterogeneous elements that made it difficult to assess technological intensity. Similarly, the “Distribution/Services” sector was omitted, as consistent mapping between patent applications and industries was infeasible under the IPC system administered by the World Intellectual Property Organization (WIPO). Consequently, the final dataset was restricted to seven key industries: games, bio/medical, media, content (including film, performance, and music), electronics/machinery/equipment, chemicals/materials, ICT services, and ICT manufacturing. These industries were selected based on the robustness and consistency of the available data, as well as their active participation in both technological development and VC markets.
All data were obtained from public statistical sources. VC investment amounts by year and industry were compiled using the Annual Venture Investment Trend Report published by the Ministry of SMEs and Startups and the KVCA [3,14]. The R&D investment data, used as a proxy for technological input, were collected from Statistics Korea’s Survey on Business Activities and Input-Output Tables [31,32]. These data were originally provided under the Korea Standard Industry Classification (KSIC) at the medium classification level and were reorganized to fit the eight-sector framework used in this study.
Patent application data were based on WIPO patent statistics. Each application was classified by IPC codes, converted to KSIC industry codes, and reorganized to match the eight industry categories [33]. The dataset included both domestic applications and international filings under the PCT and was structured according to application year.
Additional data used for control variables were collected from public sources. The GVA by industry was obtained from Statistics Korea’s Economic Census and Input-Output Tables [32]. Macroeconomic variables, including the base interest rate, M2 liquidity, and the KOSDAQ index, were sourced from the Bank of Korea, the Financial Statistics Information System, and the Korea Exchange [34].
3.4. Analysis Method
This study employed multiple linear regression analysis to empirically examine the impact of industry-level technological capabilities on VC inflow. The analysis was conducted using IBM SPSS Statistics version 28.0. Both the dependent and main independent variables were natural log-transformed to correct for distributional skewness and to improve the stability of the regression estimates.
The analysis involved a four-step procedure. First, a baseline regression model was constructed to examine the overall relationship between technological performance (measured by the number of patent applications and R&D investment) and VC inflows. Second, to test Hypothesis 1, lagged regression models were developed by introducing time lags of 0 to 4 years, reflecting previous findings that technological performance may exhibit a delayed effect over time [8]. Third, to evaluate Hypothesis 2, the independent effects of patents and R&D investment were analyzed separately to assess their respective contributions to VI. Fourth, to test Hypothesis 3, interaction-term models were constructed by incorporating cross-product terms between technological indicators and industry dummy variables. This allowed for determining whether the conversion effect of technological performance into VC differed significantly across industries.
4. The Results of a Study
4.1. Technical Statistics and Correlation Analysis Results
This section presents the basic characteristics of the panel dataset used in this study, organized by industry and year, and examines the relationships among the variables using descriptive statistics and correlation analysis.
Table 2 summarizes the descriptive statistics of the variables used in this study. For each variable, the number of observations (N), mean, standard deviation, and minimum and maximum values are reported. This table provides a preliminary overview of the distribution of technological performance indicators (i.e., patent applications and R&D investment) and investment outcomes (i.e., VC inflow). The results show substantial variations across industries and years for all variables. In particular, the standard deviation and maximum values for VC inflows indicate a high degree of concentration, suggesting that investments are unevenly distributed across industries and over time.
Table 3 presents a comparison of the average values of patent applications, R&D investments, and VC inflows across industries. The analysis reveals that technology-intensive sectors such as ICT, bio/healthcare, and clean energy exhibit high levels of technological performance and VC inflow. By contrast, traditional manufacturing and consumer goods industries show relatively low levels of VI despite moderate technological output.
These findings suggest that the linkage between technology development and capital inflow varies by industry and that the pathway by which technological outputs are converted into investment is influenced by the structural characteristics of each sector. This result provides preliminary evidence in support of Hypothesis 2.
Table 4 presents the Pearson correlation coefficients among the main variables based on the log-transformed data. This analysis was conducted to examine the linear relationships between variables prior to the regression analysis. The results show a significant positive correlation between patent applications and R&D investment, representing the input and output dimensions of technological development. The correlation coefficient between these two variables was 0.661, which was statistically significant at the 0.1% level (p < 0.001). This finding suggests a consistent structural linkage across industries wherein R&D expenditure is systematically translated into patentable technological outputs.
Regarding the relationship between technological indicators and VC inflows, the analysis finds a positive and statistically significant correlation of 0.247 between patent applications and VC investment (p < 0.01) and 0.291 between R&D investment and VC investment (p < 0.001). These results indicate that industries with more active technological developments tend to attract higher levels of VC. However, the moderate strength of these correlations suggests structural heterogeneity across industries over time.
Although the correlation between patent applications and R&D investment was relatively high (r = 0.661), the VIF for both variables was approximately 1.78. This value is well below the conventional threshold of 10, indicating that multicollinearity was not a concern in the subsequent regression models. Therefore, the statistical robustness of the panel regression analysis is considered secure.
Table 5 presents the results of the correlation analysis between technological performance indicators (i.e., the number of patent applications and R&D investment) and VC inflows disaggregated by industry. The findings indicate that both the direction and statistical significance of the correlation coefficients vary across industries, suggesting that the conversion of technological output into VC is structurally dependent on industry-specific characteristics.
In the bio/medical industry, a strong positive correlation was observed between patent applications and VC inflow (r = 0.762, p < 0.001), and an even stronger correlation was found between R&D investment and VC inflow (r = 0.900, p < 0.001). These results imply that technological output is effectively linked to private investment inflows in this sector.
In contrast, the media/performance/music, ICT manufacturing, and chemicals/materials sectors show significant negative correlations between patent applications and VC inflows (r = –0.679, p < 0.01; r = –0.516, p < 0.05; and r = –0.455, p < 0.05, respectively). This suggests that despite technological activity, the connection to private capital is either weak or inversely related, possibly reflecting structural constraints that hinder the commercialization of technology in these industries.
In the game industry, both patent applications (r = 0.491, p < 0.05) and R&D investment (r = 0.647, p < 0.001) were positively and significantly correlated with VC inflow. Similarly, in ICT services, electronics/machinery/equipment, and chemicals/materials industries, R&D investment shows significant positive correlations with VC inflow (r = 0.726, r = 0.754, and r = 0.572, respectively; all p < 0.01 or higher).
Additionally, the relationship between the two technological indicators is industry-dependent. For instance, the bio/medical industry shows a strong positive correlation between patent applications and R&D investment (r = 0.731, p < 0.001), whereas a significant negative correlation is observed in the media/performance/music industry (r = –0.863, p < 0.001). This divergence indicates that, in certain industries, the relationship between input (R&D investment) and output (patent filings) may not be linear or consistent.
In summary, the correlation between technological performance and VC inflow varies substantially across industries in terms of both magnitude and direction. These findings quantitatively support Hypothesis 3, which posits that the conversion effect of technological output to private investment differs significantly by industry.
4.2. Verification of Hypothesis 1: Time-Lag Effects of Technology Development
This section empirically investigates whether the impact of technological performance on VC inflows exhibits a time lag. To test for lagged effects, single-lag regression analyses were conducted separately for two indicators of technological performance: the number of patent applications and R&D investment. The results of these analyses are presented in Table 6 and Table 8, respectively.
The results presented in Table 6 indicate that patent applications have a statistically significant positive impact on VC inflows with time lags of two, three, and four years (t–2, t–3, and t–4) when analyzed across all industries. Among these, the three-year lag (t–3) exhibited the strongest explanatory power, with a regression coefficient of B = 6.748, R2 = 0.847, and p < 0.001. This finding suggests the existence of a medium-term conversion structure, wherein technological outputs begin to influence VC decisions approximately three years after their initial disclosure or registration.
By contrast, patent applications at the current time (t) and with a one-year lag (t–1) did not show statistically significant effects. This implies that technological achievements are not immediately reflected in investment flows but rather tend to be subject to a period of evaluation and verification before attracting capital. Overall, these findings empirically support the notion that the relationship between technological performance and VC inflow operates through a medium-term lag structure rather than an immediate market response.
Table 7 presents the lagged regression results by industry, illustrating how the effect of patent applications on the number of VC deals varies depending on industry-specific characteristics. The results reveal three distinct patterns in the time-lag structure of technology-to-capital conversion. First, industries such as ICT services (t–1), games (t–2), and bio/medical (t–2) exhibit statistically significant positive effects of patent applications on VC inflows. This finding suggests the presence of a structured time lag between technological output and investment inflows. Among these, the biomedical industry has the highest regression coefficient and R2 value, indicating the strongest conversion effect from technological performance to capital inflow. In contrast, the ICT services and game industries responded within a shorter lag period, reflecting their relatively faster market validation and monetization cycles.
Second, for industries such as ICT manufacturing (t) and media/performance/music (t–4), the results show a statistically significant negative relationship between patent applications and VC inflows. This implies that in these sectors, technological performance may not serve as a strong signal for investors, potentially due to market saturation, commercialization inefficiencies, or misalignment between innovation and investment incentives.
Third, for the electronics/machinery/equipment and chemicals/materials industries, no statistically significant effects are observed across the lag periods. This indicates an inconsistent or weak linkage between technological outputs and investment inflows, potentially driven by external factors such as policy support, demand volatility, or the inherently limited role of VC in these sectors.
These findings underscore the importance of industry-specific analyses when examining the conversion of technological performance into private investment. A uniform model may not adequately capture the heterogeneous time structures and commercialization pathways observed across sectors. Therefore, tailored approaches that reflect sectoral characteristics and technology market dynamics are required for precise evaluation.
Table 8 presents the results of the lagged regression analysis for R&D investment, assessing its effect on VC inflow from time t to t–4 across all industries. The analysis demonstrates that R&D investment has a statistically significant positive effect on VC inflows at all lag intervals, with all models reaching significance at the p < 0.001 level.

Table 8.
Regression results of R&D investment parallax effect.
| Independent Variable | B | S.E. | β | R2 | t |
|---|---|---|---|---|---|
| R&D_t | 1.236 | 0.202 | 6.120 | 0.757 | 6.12** |
| R&D_t-1 | 1.169 | 0.245 | 4.774 | 0.655 | 4.77*** |
| R&D_t-2 | 1.193 | 0.193 | 5.673 | 0.728 | 5.67*** |
| R&D_t-3 | 0.210 | 0.210 | 5.517 | 0.717 | 5.52*** |
| R&D_t-4 | 0.196 | 0.196 | 5.196 | 0.692 | 5.20*** |
*p<.05, **p<.01, ***p<.001.
The strongest effect was observed in the current year (t), where the regression coefficient was B = 1.236 and the corresponding t-statistic was t = 6.12. This indicates that venture firms are highly responsive to recent technological inputs, suggesting that investors are sensitive to real-time innovation. Notably, the influence of R&D investment remains statistically significant across all lag periods (t–1 through t–4), implying that R&D spending contributes not only to short-term but also to medium- and long-term VC inflows.
The coefficient of determination (R2) exceeded 0.65 in all models, further supporting the robustness of R&D investment as a key explanatory variable for variations in VC inflow [27,28]. These results underscore the central role of R&D in signaling investors’ technological potential and facilitating sustained capital attraction over time.
Table 9 presents the regression results of the lagged effects of R&D investment by industry. The biomedical sector exhibits the strongest effect at a four-year lag (t–4), with high explanatory power (R2 = 0.824), indicating that long-term R&D investments are crucial in this industry. The ICT services sector showed a significant positive effect at the one-year lag (t–1, R2 = 0.784), suggesting a shorter feedback loop between R&D efforts and capital inflows.
The media/performance/music sector demonstrates a statistically significant coefficient in the concurrent year (t = 0), whereas ICT manufacturing and games show no significant results across all lag periods. These findings suggest that the time-lag structure between technological performance and VC inflows differs by industry, generally clustering within a one- to two-year window.
4.3. Verification of Hypotheses 2: Industry-Level Impact of Technological Performance on Venture Investment
This section presents the empirical results of an industry-level analysis of the effect of technological performance on VC inflows. Linear regression analyses were conducted, accounting for the identified lag effects, to examine the relationships between the variables.
Table 10 presents the regression analysis results examining the effect of patent applications on VC inflows by industry, using a fixed lag structure. For the ICT services (t–1), biomedical (t–2), and gaming (t–2) industries, lags were applied based on the most statistically significant values identified in the prior lag analysis. For the remaining industries, a fixed lag of t–3, representing the average lag structure derived from the overall model, was applied uniformly.
The regression results show statistically significant positive coefficients for ICT services (B = 13.135, p < 0.01), bio/medical (B = 4.313, p < 0.001), and games (B = 2.555, p < 0.001), indicating that patent activity in these sectors effectively translates into VC inflows. The bio/medical sector exhibits the highest explanatory power (R2 = 0.927), suggesting a particularly strong conversion effect.
By contrast, ICT manufacturing (B = 0.318, p > 0.05), electronics/machinery/equipment (B = 0.684, p > 0.05), and chemicals/materials (B = 1.341, p > 0.05) had positive but statistically insignificant coefficients. Notably, the media/performance/music industry exhibited a statistically significant negative effect (B = –1.906, p < 0.01), implying a potential mismatch between technological output and capital attraction in this sector.
Table 11 presents the regression analysis results of the effects of R&D investment on VC inflows. At the aggregate level, R&D investment has a statistically significant positive effect on VC inflows (B = 1.208, p < 0.001), confirming its relevance as a key predictor of capital attraction. This trend is largely consistent across industries. Significant positive coefficients were observed for the bio/medical (B = 2.509, p < 0.001), ICT services (B = 3.756, p < 0.01), media/performance/music (B = 1.437, p < 0.001), chemicals/materials (B = 0.995, p < 0.01), electronics/machinery/equipment (B = 0.972, p < 0.01), and games (B = 0.170, p < 0.05) sectors. These results indicate that R&D investment generally functions as a strong and consistent driver of VC inflows across a wide range of technology-intensive industries. In contrast, the ICT manufacturing sector did not exhibit a statistically significant relationship between R&D investment and VC inflows (B = 0.325, p > 0.05), suggesting that factors other than technological input, such as market maturity or structural inefficiencies, may play a greater role in attracting capital in this industry.
Based on these findings, Hypothesis 2—that technological development capabilities influence VC inflows—is partially supported by the heterogeneous results across its sub-components. Specifically, Hypothesis 2-1, which posits that the number of patent applications by industry has a positive effect on VC inflows, was rejected, as most industries did not show statistically significant results, and some even exhibited negative effects. Conversely, Hypothesis 2-2, which posits that R&D investment by industry has a positive effect on VC inflows, was fully supported, given the strong and statistically significant positive effects observed both at the aggregate level and across multiple industries.
4.4. Verification of Hypotheses 3: Differences in Conversion Efficiency by Industry
The process by which technological performance translates into VC inflows exhibits varying degrees of efficiency across industries. This finding suggests that the absolute level of technological output alone may be insufficient to explain capital attraction. Therefore, this section aims to empirically test Hypothesis 3: “The efficiency of converting technological performance into VC inflow differs by industry.”
Table 12 compares conversion efficiency across industries by examining the relationship between technological performance and VI. The analysis revealed that industries such as ICT services and games achieved relatively high levels of VC inflow despite lower levels of technological input, indicating higher conversion efficiency. By contrast, industries such as ICT manufacturing, electronics/machinery/equipment, and chemicals/materials showed strong technological performance but limited capital inflow.
Notably, sectors with large R&D investments tend to exhibit lower investment efficiency, suggesting that factors beyond technological performance, such as commercialization environment, exit potential, and market accessibility, may play a more critical role in determining capital inflows. These structural disparities provide empirical evidence that the capital–technology conversion path operates differently depending on industry-specific characteristics.
To quantitatively verify the differences in conversion efficiency, regression models incorporating the interaction terms between technological performance variables (i.e., number of patent applications and R&D investment) and industry dummy variables were estimated. In this analysis, the biomedical industry was set as the reference group, as it represents a typical high-technology sector characterized by substantial capital requirements and long-term validation processes in technology commercialization. This makes it a suitable benchmark for comparing conversion efficiency across industries [17]. Table 13 presents the regression results based on patent applications, and Table 14 shows the corresponding results using R&D investment as the key independent variable.
According to the regression results, the interaction terms for ICT manufacturing (B = –5.336), media/performance/music (B = –5.862), and chemicals/materials (B = –4.557) are statistically significant and negative compared with the reference industry (bio/medical). The coefficient for media/performance/music was significant at the p < 0.01 level. This implies that, even at similar levels of patent activity, the effectiveness of converting technological outputs into VC inflows is significantly lower or more constrained in these industries compared to ICT services.
By contrast, the interaction terms for games, bio/medical, and electronics/machinery/equipment were not statistically significant. This finding suggests that the impact of patent activity on VC inflow in these sectors does not differ significantly from that observed in ICT services.
The control variables include the base interest rate, M2 (broad money supply), and the KOSDAQ index—factors that directly influence the VI environment. These variables reflect the availability of capital and the vibrancy of capital markets, and are introduced to account for macroeconomic investment conditions and mitigate external distortions.
The results indicate that the base interest rate has a statistically significant negative effect (B = –3.653, p < 0.05), implying that higher borrowing costs may suppress VI. By contrast, both M2 (B = 0.142, p < 0.05) and the KOSDAQ index (B = 0.008, p < 0.05) show statistically significant positive coefficients, confirming that increased market liquidity and a bullish capital market contribute positively to VI expansion.
Table 14 presents the results of a regression model that includes the interaction terms between R&D investment and industry, using the biomedical industry as a reference group. The explanatory power of the model is R2 = 0.785, which is slightly higher than that of the patent-based model in Table 13 (R2 = 0.764). This suggests that the R&D investment indicator has stronger explanatory power in accounting for the conversion of technological performance into private capital. The regression coefficient for the reference group (bio/medical) is B = 2.319 (p < 0.001), indicating that this industry exhibits the strongest conversion effect from R&D investment to private investment among all industries. By contrast, the ICT manufacturing (B = –1.993, p < 0.001), game (B = –2.113, p < 0.001), electronics/machinery/equipment (B = –1.378, p < 0.001), chemical/material (B = –1.557, p < 0.001), and media/performance/music (B = –0.881, p < 0.01) industries all showed statistically significant negative interaction coefficients, suggesting that the conversion effect from R&D investment to private capital inflows was relatively lower than that of the reference industry. On the one hand, the ICT service industry showed a statistically significant positive interaction effect (B = 1.755, p < 0.05), indicating that R&D investment in this industry has a more favorable influence on attracting private VC than in the reference industry.
These results demonstrate that the conversion efficiency of technological performance varies across industries depending on the type of performance indicators used. In summary, Hypothesis 3, which posits structural differences in the conversion of technological performance into VC across industries, was tested using two sub-hypotheses: Hypothesis 3-1, based on patent applications, and Hypothesis 3-2, based on R&D investment. The analysis using patent applications (Table 13) shows that technological performance has statistically significant effects across the board, and significant interaction terms are found in five industries: ICT manufacturing, game, electronics/machinery/equipment, chemical/material, and media/performance/music. These findings suggest that the conversion of technological performance to capital varies structurally by industry, and Hypothesis 3-1 can be interpreted as partially supported. In contrast, the R&D-based analysis (Table 14) revealed statistically significant negative interaction terms in the ICT manufacturing, game, electronics/machinery/equipment, chemical/material, and media/performance/music industries, whereas the ICT service industry showed a statistically significant positive response. Statistically significant differences are confirmed in six industries, strongly supporting Hypothesis 3-2.
Taken together, Hypothesis 3, which asserts structural differences in conversion efficiency by industry, yields differentiated results depending on the type of performance indicator, and can be summarized as partially supported. This implies that even with the same level of technological performance, the efficiency of capital conversion may vary significantly depending on commercialization pathways, capital requirements, and market entry barriers across industries [29].
5. Discussion and Implications
This study empirically analyzed the relationship between technological performance and VI using industry-level data from South Korea to identify the structural link between technology development outcomes and capital inflows at the industrial level. The key findings and their academic, practical, and policy implications are summarized as follows:
First, the analysis confirmed the existence of industry-specific time lags in the conversion of technological performance into private investment. Regression models incorporating lag structures (t–4) revealed that ICT services showed significant effects at a one-year lag (t–1), whereas the game and bio/medical industries exhibited significant results over mid- to long-term lags (t–2 to t–4). Conversely, the ICT manufacturing and media industries demonstrated statistically significant negative coefficients. These results empirically validate that the conversion of technology into capital does not follow a uniform path and is heavily influenced by each industry’s commercialization structure and market recognition speed. These findings support Hypothesis 1 and suggest that technology and capital policies must be aligned along a synchronized time horizon.
Second, the absolute technological performance level was found to be a significant determinant of VC inflows. Both patent applications and R&D investment exhibited statistically significant positive correlations with VI, and the R&D-based regression model (R2 = 0.785) outperformed the patent-based model (R2 = 0.764) in terms of explanatory power. This indicates that the quantitative accumulation of technological capability functions as a strategic asset for attracting external capital, thereby supporting Hypothesis 2. The results underscore the need for structurally integrated approaches to link innovation and capital policies.
Third, the conversion effect of technological performance on investment varied significantly across industries. In the interaction-term analysis between industry dummies and technology variables, the R&D-based model revealed significant negative interaction coefficients in ICT manufacturing, game, electronics/machinery, and chemical/material industries. In contrast, the patent-based model showed statistically significant results only for media and chemical/material industries, with most other sectors showing no significant differences. While the bio/medical industry was used as the reference group and thus had no coefficient estimated in the interaction models, its high R2 values and consistent significance across lag structures in the univariate models suggest a structured conversion pathway from technology to capital. These results partially support Hypothesis 3 and imply that the efficiency of capital conversion is influenced by structural factors such as capital intensity, regulatory complexity, and commercialization routes. Therefore, instead of applying a one-size-fits-all approach to technology-financing policies, differentiated strategies tailored to industry-specific characteristics are necessary.
Academically, this study contributes to the literature by going beyond static analysis and modeling the conversion process of technological performance as a function of time. The use of lagged regression and interaction terms provides a more refined explanation of how technology is converted into capital in temporal and industrial contexts. Furthermore, by using both patents (output indicator) and R&D (input indicator), it was possible to compare capital response structures according to the types of technological performance, suggesting that the definition and measurement of technology in empirical analyses may vary depending on the purpose.
Practically, this study provides strategic insights for technology-based startups and investors. Startups can understand how technology is evaluated and converted into capital in their respective industries, enabling them to adopt short-term performance-oriented strategies in fast technology cycle industries such as ICT, as well as long-term verification and market trust-building strategies in industries such as biotechnology. For investors such as venture capitalists, technological performance should not be regarded merely as a quantitative indicator. Rather, the evaluation requires a multidimensional perspective that considers temporal structures, commercialization dynamics, and industry-specific characteristics Additionally, practical organizations such as startup incubators and technology transfer centers can establish customized support strategies that consider industry-specific conversion potential.
Policy-wise, this study emphasizes the need for industry-specific technology policies. In the bioindustry, policy finance and regulatory easing reflecting the long-term return structure may be more effective, whereas in the ICT industry, early investment bridging systems that support initial capital procurement may be more suitable. Temporal synchronization between R&D and investment policies is required, and a system should be designed in which capital is supplied when technological performance is realized. Furthermore, it is necessary to build an integrated evaluation system that reflects both the conversion potential of technological performance and the structural acceptability of industries. Thus, public R&D resources can be linked more effectively to private capital markets.
6. Conclusions
This study empirically analyzed the relationship between technological performance and private VIs at the industry level, offering both policy and theoretical implications. However, this study has the following four limitations, which provide directions for future research.
First, there were inconsistencies in the classification standards. This study integrated data on technological performance and VI, each collected based on distinct classification systems. Specifically, VI statistics followed the “eight major industries” classification defined by the Ministry of SMEs and Startups; R&D investment was based on the KSIC medium-category classification by Statistics Korea and the Ministry of Science and ICT; and patent statistics were organized according to WIPO’s technology classification provided by KIPO and the Korea Institute of Patent Information. Although each dataset adhered to consistent internal standards, there was no unified mapping system across variables, making it difficult to ensure complete alignment for the same industry group. In particular, in multi-sector convergence industries such as ICT and biology, even slight differences in classification criteria may affect the results, imposing certain constraints on the reliability of regression coefficients and the precision of policy interpretation. Future research should improve variable consistency by constructing cross-industry classification tables or using firm-level panel data.
Second, there was a quantitative bias in the indicators of technological performance. This study measured technological performance using the number of patent applications and R&D investment amounts as representative quantitative indicators. Although such indicators are useful for demonstrating the scale or frequency of R&D activities, they fail to reflect the qualitative level of technology, economic feasibility, or social impact. For instance, even if many patents are filed, only a few may possess high technological originality or commercialization potential. Similarly, R&D spending cannot always be regarded as a reliable indicator of innovation, and whether executed funds are successfully converted into technological assets requires separate analysis. Future studies could incorporate complementary qualitative indicators, such as citation counts, technology transfer records, and commercialization success rates, to better reflect the intrinsic value of technological performance.
Third, this study lacked an international comparative analysis. This research was designed with a focus solely on Korean industries. While these findings are useful for understanding the structure of the domestic technology ecosystem, they are limited in assessing its relative position or structural differences from a global perspective. Since the mechanism for converting technological performance into VC may differ depending on factors such as industry structure, capital market maturity, government policy, and technological intensity in each country, it is difficult to derive generalizable interpretations from a single-country analysis. Future studies could conduct comparative analyses with major countries such as the United States, the EU, and China to examine the structural characteristics and pathways of Korea’s technology-to-capital conversion, thereby identifying policy benchmarking points.
Despite these limitations, this study is meaningful because it empirically analyzed the structural link between technological performance and private VIs at the industry level. Future research could expand upon this study using more granular data and qualitative indicators.
Author Contributions
Conceptualization, D.P. and K.C.; methodology, D.P.; software, D.P.; validation, K.C.; formal analysis, D.P.; writing—original draft preparation, D.P.; writing—review and editing, D.P. and K.C.; supervision, K.C. All authors have read and agreed to the published version of the manuscript.
Funding
This research received no external funding.
Institutional Review Board Statement
Not applicable.
Informed Consent Statement
Not applicable.
Data Availability Statement
The data used to support the findings of this study are included in the article.
Conflicts of Interest
The authors declare no conflict of interest.
Abbreviations
The following abbreviations are used in this manuscript:
| GVA | Gross value added |
| VI | Venture investment |
| VC | Venture capital |
| IPO | Initial public offering |
| ICT | Information and communication technology |
| FEM | Fixed-effects model |
| OLS | Ordinary least squares |
| KVCA | Korea Venture Capital Association |
| KIPO | Korea Intellectual Property Office |
| IPC | International Patent Classification |
| PCT | Patent Cooperation Treaty |
| VIF | Variance Inflation Factor |
| WIPO | World Intellectual Property Organization |
| KSIC | Korea Standard Industry Classification |
References
- Klepper, S. Entry, exit, growth, and innovation over the product life cycle. Am. Econ. Rev. 1996, 86, 562–583. [Google Scholar]
- Hall, B.H.; Harhoff, D. Recent research on the economics of patents. Annu. Rev. Econ. 2012, 4, 541–565. [Google Scholar] [CrossRef]
- Korea Venture Capital Association (KVCA). Venture Capital Statistics; KVCA: Seoul, Korea, 2023. [Google Scholar]
- Gompers, P.; Lerner, J. The Money of Invention: How Venture Capital Creates New Wealth; Harvard Business School Press: Boston, MA, USA, 2001. [Google Scholar]
- Deeds, D.L.; DeCarolis, D.; Coombs, J.E. The impact of firm-specific capabilities on the amount of capital raised in an initial public offering: Evidence from the biotechnology industry. J. Bus. Ventur. 1997, 12, 31–46. [Google Scholar] [CrossRef]
- Bryan, K.A.; Hovenkamp, E. Startup Acquisitions, Error Costs, and Antitrust Policy. Univ. Chic. Law Rev. 2020, 87, 331–359. Available online: https://lawreview.uchicago.edu/ (accessed on 10 August 2025).
- Lee, S. Technology risk and venture investment decisions. J. Technol. Innov. 2019, 27, 17–34. [Google Scholar]
- Su, C.Y.; Guo, Y.N.; Chai, K.C.; Kong, W.W. Industry differences in the time lag of R&D investment and economic return: Evidence from China. J. Bus. Res. 2021, 137, 398–407. [Google Scholar] [CrossRef]
- Conti, A.; Thursby, J.; Thursby, M. Patents as signals for startup financing. J. Ind. Econ. 2013, 61, 592–622. [Google Scholar] [CrossRef]
- Kortum, S.; Lerner, J. Assessing the Contribution of Venture Capital to Innovation. RAND J. Econ. 2000, 31, 674–692. Available online: https://www.jstor.org/stable/2696354 (accessed on 10 August 2025). [CrossRef]
- Samila, S.; Sorenson, O. Venture capital, entrepreneurship, and economic growth. Rev. Econ. Stat. 2011, 93, 338–349. [Google Scholar] [CrossRef]
- Hsu, D.H.; Ziedonis, R.H. Resources as dual sources of advantage: Implications for valuing entrepreneurial-firm patents. Strateg. Manag. J. 2013, 34, 761–781. [Google Scholar] [CrossRef]
- Park, J.; Shin, H. The effect of venture capital on innovation: Evidence from Korean startups. Korean J. Bus. Adm. 2020, 33, 45–68. [Google Scholar]
- Ministry of SMEs and Startups (MSS). 2023 Venture Investment Statistics Report; MSS: Sejong, Republic of Korea, 2023. [Google Scholar]
- Gompers, P.; Lerner, J. The Venture Capital Cycle, 2nd ed.; MIT Press: Cambridge, MA, USA, 2004. [Google Scholar]
- Teece, D.J. Profiting from technological innovation: Implications for integration, collaboration, licensing and public policy. Res. Policy 1986, 15, 285–305. [Google Scholar] [CrossRef]
- Gbadegeshin, S.A. Lean commercialization: A framework for commercializing innovations. Technol. Innov. Manag. Rev. 2019, 9, 36–43. [Google Scholar] [CrossRef]
- McKinsey & Company. Fast to First-in-Human: Getting New Medicines to Patients More Quickly; McKinsey & Company: New York, NY, USA, 2023; Available online: https://www.mckinsey.com/industries/life-sciences/our-insights/fast-to-first-in-human-getting-new-medicines-to-patients-more-quickly (accessed on 10 August 2025).
- Farre-Mensa, J.; Hegde, D.; Ljungqvist, A. What is a patent worth? Evidence from the U.S. patent “lottery”. J. Finance 2017, 72, 337–370. [Google Scholar] [CrossRef]
- Häussler, C.; Harhoff, D.; Mueller, E. To be financed or not…–The role of patents for venture capital financing. ZEW Discuss. Pap. 2008, No. 08-003.
- Häussler, C.; Harhoff, D.; Mueller, E. How patenting informs VC investors—The case of biotechnology. Res. Policy 2014, 43, 1286–1298. [Google Scholar] [CrossRef]
- Lee, J.; Jung, J.; Chang, S. Industry-specific spillover effects of technological innovation: Evidence from Korean SMEs. Asian J. Technol. Innov. 2024, 32. in press. [Google Scholar]
- Hall, B.H.; Lerner, J. The Financing of R&D and Innovation. In Handbook of the Economics of Innovation; Hall, B.H., Rosenberg, N., Eds.; Elsevier: Amsterdam, The Netherlands, 2010; Volume 1, pp. 609–639. [Google Scholar] [CrossRef]
- Griliches, Z. Patent statistics as economic indicators: A survey. J. Econ. Lit. 1990, 28, 1661–1707. [Google Scholar]
- Arora, A.; Ceccagnoli, M.; Cohen, W.M. R&D and the patent premium. Int. J. Ind. Organ. 2008, 26, 1153–1179. [Google Scholar] [CrossRef]
- Shane, S.; Stuart, T. Organizational endowments and the performance of university start-ups. Manag. Sci. 2002, 48, 154–170. [Google Scholar] [CrossRef]
- Kim, Y.; Lee, H. R&D investment and venture capital: Empirical evidence from Korea. J. Entrep. Innov. 2021, 16, 85–104. [Google Scholar]
- Park, J.H. Time-lag effects of R&D on startup investment. Technol. Manag. Rev. 2020, 12, 37–52. [Google Scholar]
- Park, J.W. Industrial heterogeneity in the commercialization of technological capabilities: A comparative analysis of conversion efficiency. J. Innov. Policy 2020, 14, 77–95. [Google Scholar]
- Ministry of Science and ICT (MSIT). Survey of R&D Activities of Korean Companies; MSIT: Sejong, Republic of Korea, Various Years.
- Statistics Korea. Survey on Business Activities; Statistics Korea: Daejeon, Republic of Korea, Various Years.
- Statistics Korea. Economic Census and Input–Output Tables; Statistics Korea: Daejeon, Republic of Korea, Various Years.
- World Intellectual Property Organization (WIPO). WIPO IP Statistics Data Center. Available online: https://www3.wipo.int/ipstats/ (accessed on 10 August 2025).
- Bank of Korea. Economic Statistics System (ECOS); Financial Statistics Information System (FISIS); Korea Exchange (KRX). Various Datasets. Available online: https://ecos.bok.or.kr, https://www.fisis.or.kr, https://www.krx.co.kr (accessed on 10 August 2025).
Figure 1.
Analytical procedure and methods.
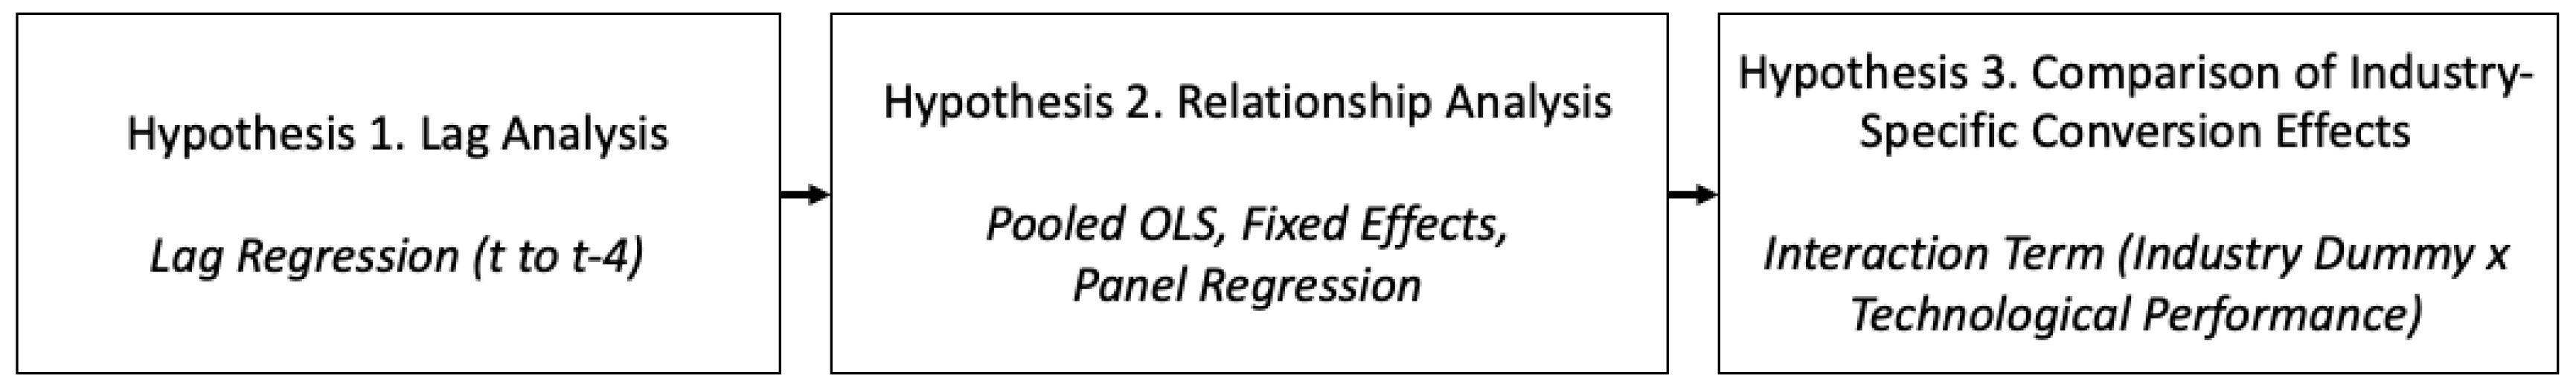
Table 1.
Operational definitions of variables.
| Variable Type | Variable name | Definition | Unit |
|---|---|---|---|
| Dependent | VC inflow | Total annual VC investment per industry | Million USD |
| Independent | R&D Investment | Annual R&D expenditures by private firms within each industry |
Million USD |
| Patent Applications | Total number of patent applications per industry per year |
Count | |
| Control | Industry Size (GVA) | Gross value added by industry | Million USD |
| Macroeconomic Factors | Base interest rate, M2 liquidity, KOSDAQ index by year |
- |
Table 2.
Technical statistics for key variables (n = 126).
| Variable | Mean | SD | Min | Max | Unit |
|---|---|---|---|---|---|
| VC inflow | 241.19 | 302.80 | 19.49 | 2,012.46 | Million USD |
| Patent Applications | 31,307 | 25,869 | 3,865 | 103,263 | Count |
| R&D Investment | 19,965.25 | 41,658.39 | 0.42 | 192,169.23 | Million USD |
| Gross Value Added (Industry Size, GVA) | 33,969.75 | 20,886.36 | 2,542.37 | 84,745.76 | Million USD |
Table 3.
Comparison of technology development and venture investment by industry (average).
| Industrial Group | VC Investment (million USD) |
Patent Applications (count) | R&D Investment (million USD) |
|---|---|---|---|
| ICT Services | 528.14 | 47,396 | 675.68 |
| ICT Manufacturing | 172.63 | 18,450 | 21,183.64 |
| Games | 115.59 | 5,992 | 1.95 |
| Bio/Medical | 418.39 | 19,590 | 1,064.58 |
| Media/Performance/Music | 222.20 | 10,610 | 845.34 |
| Electronics/Machinery/Equipment | 305.17 | 90,089 | 10,349.63 |
| Chemicals/Materials | 128.22 | 32,086 | 3,591.44 |
Table 4.
Correlation of variables (n = 126).
| Variable | 1 | 2 | 3 |
|---|---|---|---|
| VC Investment | 1 | ||
| Patent Applications | 0.247** | 1 | |
| R&D Investment | 0.291*** | 0.661*** | 1 |
*p<.05, **p<.01, ***p<.001.
Table 5.
Correlation analysis by industry.
| Industrial Group | Correlation with VC Inflow | Patent Applications & R&D Investment | ||
|---|---|---|---|---|
| Patent Applications | R&D Investment | GVA | ||
| ICT Services | 0.227 | 0.726*** | 0.898*** | 0.268 |
| ICT Manufacturing | -0.516* | 0.350 | 0.380 | -0.375 |
| Games | 0.491* | 0.647*** | 0.789*** | 0.214 |
| Bio/Medical | 0.762*** | 0.900*** | 0.926*** | 0.731*** |
| Media/Performance/Music | -0.679*** | 0.723*** | 0.804*** | -0.863*** |
| Electronics/Machinery/Equipment | -0.171 | 0.754*** | 0.730*** | -0.126 |
| Chemicals/Materials | -0.455* | 0.572** | 0.679*** | 0.186 |
*p<.05, **p<.01, ***p<.001.
Table 6.
Results of regression analysis of patent application time-lag effect.
| Independent Variable | B | S.E. | β | R2 | t |
|---|---|---|---|---|---|
| Patent_t | -1.036 | 0.951 | -1.090 | 0.090 | -1.09 |
| Patent_t-1 | 3.316 | 2.223 | 1.492 | 0.156 | 1.49 |
| Patent_t-2 | 7.702 | 1.285 | 5.995 | 0.750 | 6.00*** |
| Patent_t-3 | 6.748 | 0.828 | 8.151 | 0.847 | 8.15*** |
| Patent_t-4 | 5.773 | 0.843 | 6.849 | 0.796 | 6.85*** |
*p<.05, **p<.01, ***p<.001.
Table 7.
Regression results of the lagged effects of patent applications by industry.
| Industrial Group | lag | B | S.E. | R2 | t |
|---|---|---|---|---|---|
| ICT Services | t-1 | 13.135 | 3.809 | 0.267 | 3.449*** |
| ICT Manufacturing | t-2 | 4.313 | 0.323 | 0.918 | 13.373*** |
| Games | t-2 | 2.555 | 0.566 | 0.560 | 4.516*** |
| Bio/Medical | t | -1.796 | 0.744 | 0.267 | -2.415* |
| Media/Performance/Music | t-4 | -1.825 | 0.407 | 0.557 | -4.483*** |
| Electronics/Machinery/Equipment | None | ||||
| Chemicals/Materials | None | ||||
*p<.05, **p<.01, ***p<.001.
Table 9.
Regression results of the lagged effects of R&D investment by industry.
| Industrial Group | lag | B | S.E. | R2 | t |
|---|---|---|---|---|---|
| Media/Performance/Music | t-0 | 0.740 | 0.130 | 0.731 | 5.71*** |
| ICT Manufacturing | t-0 | 0.360 | 0.418 | 0.058 | 0.86 |
| ICT Services | t-1 | 4.726 | 0.716 | 0.784 | 6.60*** |
| Games | t-2 | 0.088 | 0.047 | 0.225 | 1.86 |
| Bio/Medical | t-4 | 2.509 | 7.500 | 0.824 | 7.50*** |
| Chemicals/Materials | t-4 | 0.995 | 3.501 | 0.505 | 3.50** |
| Electronics/Machinery/Equipment | t-4 | 0.972 | 3.119 | 0.448 | 3.12** |
*p<.05, **p<.01, ***p<.001.
Table 10.
Results of regression analysis of patent–venture investment by industry.
| Industrial Group | lag | B | S.E. | R2 | t |
|---|---|---|---|---|---|
| All industries | t-3 | 6.491 | 0.683 | 0.874 | 9.507*** |
| ICT Services | t-1 | 13.135 | 3.809 | 0.442 | 3.449** |
| Bio/Medical | t-2 | 4.313 | 0.323 | 0.927 | 13.373*** |
| Games | t-2 | 2.555 | 0.566 | 0.593 | 4.516*** |
| ICT Manufacturing | t-3 | 0.318 | 1.944 | 0.002 | 0.164 |
| Media/Performance/Music | t-3 | -1.906 | 0.564 | 0.467 | -3.378** |
| Electronics/Machinery/Equipment | t-3 | 0.684 | 1.048 | 0.032 | 0.653 |
| Chemicals/Materials | t-3 | 1.341 | 0.878 | 0.152 | 1.526 |
*p<.05, **p<.01, ***p<.001.
Table 11.
Results of R&D-venture investment regression analysis by industry.
| Industrial Group | lag | B | S.E. | R2 | t |
|---|---|---|---|---|---|
| All industries | t-0 | 1.208 | .123 | 0.858 | 9.818*** |
| Media/Performance/Music | t-0 | 1.437 | 0.343 | 0.523 | 4.192*** |
| ICT Manufacturing | t-0 | 0.325 | 0.218 | 0.122 | 1.494 |
| ICT Services | t-1 | 3.756 | 1.119 | 0.429 | 3.357** |
| Games | t-2 | 0.170 | 0.057 | 0.387 | 2.973* |
| Bio/Medical | t-4 | 2.509 | 0.335 | 0.824 | 7.500*** |
| Chemicals/Materials | t-4 | 0.995 | 0.284 | 0.505 | 3.501** |
| Electronics/Machinery/Equipment | t-4 | 0.972 | 0.312 | 0.448 | 3.119** |
*p<.05, **p<.01, ***p<.001.
Table 12.
Technology-to-venture investment conversion efficiency by industry.
| Industrial Group | Avg. Patent Applications (cases) | Avg. R&D Investment (million USD) |
Avg. Venture Investment (million USD) | Investment per Patent (ratio) | Investment per R&D (ratio) |
|---|---|---|---|---|---|
| ICT Services | 48,411 | 690.8 | 628.7 | 0.153 | 0.911 |
| ICT Manufacturing | 18,871 | 20,196.3 | 182.5 | 0.114 | 0.009 |
| Games | 5,837 | 1.6 | 100.4 | 0.202 | 60.967 |
| Bio/Medical | 20,496 | 1,039.1 | 401.7 | 0.231 | 0.387 |
| Media/Performance/Music | 10,318 | 818.7 | 250.3 | 0.287 | 0.307 |
| Electronics/Machinery/Equipment | 91,435 | 9,964.2 | 246.3 | 0.032 | 0.025 |
| Chemicals/Materials | 32,367 | 3,666.8 | 145.0 | 0.053 | 0.040 |
Table 13.
Regression results of interaction effects between patent applications and industry dummies. .
Table 13.
Regression results of interaction effects between patent applications and industry dummies. .
| Independent Variable | B | S.E. | t |
|---|---|---|---|
| Patent Applications (Ref: Bio/Medical) | 3.544 | 1.395 | 1.72 |
| Patent × ICT Services | -0.419 | 3.354 | -0.13 |
| Patent × ICT Manufacturing | -5.336 | 0.743 | -7.18*** |
| Patent × Games | -2.080 | 0.649 | -3.20*** |
| Patent × Media/Performance/Music | -5.862 | 0.627 | -9.35*** |
| Patent × Electronics/Machinery/Equipment | -4.124 | 0.836 | -4.94*** |
| Patent × Chemicals/Materials | -4.557 | 0.496 | -9.18*** |
| Base Interest Rate | -3.653 | 1.449 | -2.52* |
| M2 | 0.142 | 0.055 | 2.59* |
| KOSDAQ Index | 0.008 | 0.003 | 2.56* |
| Statistics | R2 = 0.764, adj.R2 = 0.734 F = 25.540 (p<.001) |
||
*p<.05, **p<.01, ***p<.001.
Table 14.
Regression results of interaction effects between R&D investment and industry dummies.
| Independent Variable | B | S.E. | t |
|---|---|---|---|
| R&D Investment (Ref: Bio/Medical) | 2.319 | 0.123 | 9.82* |
| R&D × ICT Services | 1.755 | 0.963 | 1.82* |
| R&D × ICT MANUFACTURING | -1.993 | 0.218 | -9.16*** |
| R&D × Games | -2.113 | 0.061 | -34.88*** |
| R&D × Media/Performance/Music | -0.881 | 0.343 | -2.57** |
| R&D × Electronics/Machinery/Equipment | -1.378 | 0.205 | -6.74*** |
| R&D × Chemicals/Materials | -1.557 | 0.273 | -5.70*** |
| Base Interest Rate | -2.852 | 1.245 | -2.29* |
| M2 | 0.158 | 0.062 | 2.55* |
| KOSDAQ Index | 0.009 | 0.004 | 2.25* |
| Statistics | R2 = 0.785, adj.R2 = 0.758 F = 28.450 (p<.001) |
||
*p<.05, **p<.01, ***p<.001.
Disclaimer/Publisher’s Note: The statements, opinions and data contained in all publications are solely those of the individual author(s) and contributor(s) and not of MDPI and/or the editor(s). MDPI and/or the editor(s) disclaim responsibility for any injury to people or property resulting from any ideas, methods, instructions or products referred to in the content. |
© 2025 by the authors. Licensee MDPI, Basel, Switzerland. This article is an open access article distributed under the terms and conditions of the Creative Commons Attribution (CC BY) license (http://creativecommons.org/licenses/by/4.0/).
Copyright: This open access article is published under a Creative Commons CC BY 4.0 license, which permit the free download, distribution, and reuse, provided that the author and preprint are cited in any reuse.


