Submitted:
29 September 2025
Posted:
30 September 2025
You are already at the latest version
Abstract
Engaging in physical activity is known to prevent falls in older adults, however the relative influence of the intensity, duration and frequency of physical activity is unclear. This study investigated the relationship between fall history and the frequency, duration, and caloric expenditure of both low and moderate/high intensity physical activity. Using the Community Healthy Activities Model Program for Seniors questionnaire, weekly frequency, duration, and estimated caloric expenditure were calculated for both low and moderate/high-intensity physical activity for community-dwelling older adult (fallers (n=18); non-fallers (n=15)). Moderate/high-intensity physical activity regression models were significant for identifying fallers while low-intensity physical activity models were not. Further, the non-faller cohort engaged in significantly greater weekly frequency relative to duration of moderate/high-intensity physical activity than non-fallers. This primary research demonstrates the importance of frequency in addition to the duration of moderate/high-intensity physical activity in decreasing the likelihood of community-dwelling older adults being identified as a faller.
Keywords:
older adults
; fall risk
; fall prevention
; physical activity
; exercise intensity & frequency
1. Introduction
Over 30% of community dwelling adults aged 65 years and older experience a fall each year, often due to slipping, tripping, or stumbling which often result in fatal or non-fatal injuries [1,2]. These injuries are frequently associated with a decline in functional status, often leading to a substantially reduced quality of life [2]. Fall-related injuries are the leading cause of hospitalization in older adults, creating significant demands on healthcare systems, including significant economic burden [1,3].
With aging, age-associated physiological changes cause a decrease in functional capacity, contributing to the risk of falls [4,5,6]. For example, the normal age-related decline in cardiovascular, respiratory, nervous, and musculoskeletal systems reduces functional capacity, limiting the ability to engage in physical activity (PA) [4,7], which in turn contributes to an increased risk of falls [5]. Additionally, as we age, the likelihood of age-associated diseases increases with a subsequent decline in functional capacity, further increasing the risk of falls [8]. This age-related decline in function can be compounded by a physically inactive lifestyle which can also escalate one’s risk of falls [9,10].
Many of the age-related physiological changes and risk factors for age-related diseases can be mitigated through PA [6,11,12]. In this way, regular PA can contribute to reducing the number of falls in older adults by preventing, slowing and even reversing these changes and, in turn, maintaining independence, functional capacity, and well-being [13,14]. In fact, engaging in regular PA has been shown to reduce the risk of falling by up to 40% [5,15,16]. However, it is not clear which parameters of PA or exercise programs best prevent fall risk [13,17]. Physical activity/exercise programs and interventions designed to prevent falls need to consider various domains, including the frequency, intensity, type, and time of exercises. The systematic review by Sherrington et al. (2020) demonstrated strong evidence of reduced fall incidents through prevention programs incorporating a combination of balance, functional and resistance exercises [17,18]. However, the effectiveness of programs involving only one exercise type remains uncertain [17]. This suggests that it is unclear which domains of PA or exercise programs are critical to provide efficacy in fall risk prevention.
Though many primary studies have evaluated the impact of prescribed exercise programs on fall risk, it is primarily within the context of meta-analyses that the relative impact of duration, intensity, and frequency of the prescribed exercise on fall risk has been evaluated. One meta-analysis found that programs which challenged balance and involved at least three hours of exercise each week had a significantly greater effect on fall reduction [10]. A more recent meta-analysis found that fall prevention exercise interventions with a frequency of five times a week were more effective in reducing falls than those with less than five [19]. Further, exercise interventions that lasted 32 weeks or more were more effective in reducing fall risk in older adults than interventions of shorter duration [19]. Notably, no study to date, has examined the relative impact of the duration, intensity, and frequency of an individual’s total physical activity (PA) comprising routine physical activity, exercise programs, and activities of daily living (ADL) on fall risk. Thus, despite the wealth of research on the benefits of PA and exercise in preventing falls, there remains uncertainty about which components (i.e. frequency, intensity, or duration) of an individual’s physical activity are most critical and effective for reducing the risk of falling in older.
The present study aimed to determine how exercise intensity, duration and frequency of total PA, including all aspects of ADL and targeted PA, is associated with a history of falls. Specifically, do intensity, duration and frequency of an individual’s total PA influence the likelihood of having a history of falls in older adults? Additionally, we sought to determine the association between frequency and duration of total PA in faller and non-faller cohorts of community-dwelling older adults.
2. Materials and Methods
2.1. Participants
Thirty-three community-dwelling older adults aged 70 and older volunteered to participate in this cross-sectional study conducted in accordance with the University of Victoria Human Research Ethics Board. Participants were recruited from the community through flyers posted at local community centres. Based on a self-report of falling in the past 12 months, participants were classified into two groups: fallers (n = 18) and non-fallers (n = 15). Inclusion criteria required a score of 24 or above on the Mini-Mental Status Examination (MMSE), fluency in English speaking, and ability to walk independently 300m. Participants were excluded if they had a diagnosis of dementia, recent major illnesses, or a history of metabolic, cardiovascular, musculoskeletal, or neurological impairment. All participants provided written informed consent.
2.2. Protocol
Participants completed the MMSE test to determine their global cognitive status. Afterwards, each participant completed the Community Healthy Activities Model Program for Seniors (CHAMPS) questionnaire, a self-reporting PA questionnaire for older adults. Based on the previous four weeks, this questionnaire quantifies the average weekly duration, frequency, and estimated caloric expenditure in physical activity-related activities. Participants reported the average weekly frequency and duration spent on each item in the CHAMPS questionnaire. Additionally, participants reported the frequency and duration per week of activities they engaged in that were not included in the CHAMPS questionnaire. For all these physical activities, metabolic equivalent (MET) values were obtained from Ainsworth et al. (2000) [20]. Participant’s body weight and height were measured.
2.3. CHAMPS Measures
The CHAMPS questionnaire provides a means to record and categorize all the different physical activities as either 1) low-intensity (<3 METs) or 2) moderate/high-intensity (>3 METs) [21]. Each activity in the CHAMPS has an age-adjusted MET value [20]. The PA for each of the two intensity levels (i.e. low and moderate/high physical activity) are individually summed to provide weekly totals across the domains of duration, frequency and estimated caloric expenditure. The estimated caloric expenditure was calculated using the American College of Sports Medicines (ACSM) Guidelines for Exercise Testing and Prescription formula (see Equation 1 below) [22]. Thus, a total of six PA variables were derived for each participant, comprising three separate variables for both low and moderate/high-intensity PA: frequency (Freq), duration (Dur), and estimated caloric expenditure (Kcal). The following abbreviations for the variables to follow will be used: Frequency low (Freq Low), frequency moderate/high (Freq Mod), duration low (Dur Low), duration moderate/high (Dur Mod), estimated caloric expenditure of low (Kcal Low), estimated caloric expenditure of moderate/high (Kcal Mod).
(METS = metabolic equivalents, BW = body weight in kilograms, and Dur = the duration in minutes spent engaging in the activity.
2.4. Statistical Procedures
All statistical analyses were completed using SPSS version 29 (IBM SPSS Statistics). The normality of the participants' descriptive statistics was assessed using the Shapiro-Wilk Test (p<0.05). Faller and non-faller cohort descriptive statistics of group mean and standard deviation for cognition, age, height, weight and the six outcome variables were calculated and compared between cohorts, using independent samples t-test (Kcal Low, Freq Low) or Mann-Whitney U test (Dur Low, Kcal Mod, Freq Mod, Dur Mod) as appropriate. Multivariate logistic regressions were run to identify the fallers from the non-fallers within the sample (1 = faller; 0 = non-faller). Due to the high collinearity (r = .81-.96) between the Dur, Kcal and Freq variables, logistic regression models were run separately for each of the 3 domains, with each multivariate model including both low and moderate/high-intensity PA. Bonferroni correction was applied to correct for the multiple regressions such that variables with a p < 0.02 were significant [23]. The Nagelkerke R-squared was used to estimate global regression model fit for models with significant PA variables. Subsequent univariate regressions were run to determine the PA variables’ individual predictive utility. Pearson’s correlations were applied to investigate the association between duration and frequency of moderate/high-intensity physical activity within each cohort.
3. Results
The participants' characteristics for the faller and non-faller groups are presented in Table 1. No significant differences in participant characteristics were found between the two groups. The mean and standard deviations for each of the six CHAMPS outcome variables are summarized in Table 2. The duration, frequency and estimated caloric expenditure of moderate/high-intensity PA levels are significantly higher for the non-faller than the faller group (Dur Mod (U = 33, p < 0.001), Freq Mod (U = 50, p = 0.002), Kcal (U = 34, p < 0.001)). In contrast, there are no significant differences in the duration, frequency, and estimated caloric expenditure of low-intensity PA between groups (Table 2), (Dur Low (U = 126, p = 0.762), Freq Low (U = 104, p = 0.274), Kcal Low (U = 135, p = 1.0).
3.1. Multivariate & Univariate Logistic Regressions
The results of the multivariate and univariate logistic regressions are summarized in Table 3 and Table 4, respectively. Nagelkerke R-squared supported global model fit for both the multivariate (Multivariate: Dur 0.469; Freq 0.429; Kcal 0.503) and univariate (Univariate Dur Mod .466; Freq Mod 0.384; Kcal Mod 0.497) models. Within each of the three multivariate models, the moderate/high-intensity PA intensity variables were significant (Dur Mod (OR = 0.693, 95% CI = 0.537-0.894, p = 0.005); Freq Mod (OR = 0.794, CI = 0.676-0.933, p = 0.005); Kcal Mod (OR = 0.999, 95% CI = 0.998-1.000, p = 0.003)). In contrast, low-intensity PA variables within the multivariate models were not significant (see Table 3). Similar to the multivariate models, all three univariate models for moderate/high-intensity PA were statistically significant (Dur Mod (OR = 0.693, 95% CI = 0.537-0.894, p = .005), Freq Mod (OR = 0.794, 95% CI = 0.676-0.933, p= .005), Kcal Mod (OR = 0.999, 95% CI = 0.999-1.000, p = 0.003)). Again, akin to the multivariate models, the univariate models with low-intensity PA were not significant (Table 4).
3.2. Correlations Between Frequency and Duration of Moderate and Greater Physical Activity
For the non-faller cohort, the frequency and duration of moderate/high-intensity PA were not significantly correlated, r = 0.427 (df = 13), p = 0.113, while for fallers, the frequency and duration of moderate/high-intensity PA had a strong positive correlation, r = 0.783 (df = 16), p = 0.001. Figure 1 displays the duration of moderate/high-intensity (Dur Mod) plotted against the frequency of moderate/high-intensity (Freq Mod) for both faller and non-faller cohorts with linear trend lines for each cohort.
4. Discussion
This research demonstrated that intensity, duration and frequency levels of total PA (i.e. routine physical activity (PA), activities of daily living (ADL), and exercise programs) was associated with fall history in this sample of community-dwelling older adults. In addition to providing further supporting evidence of the significant benefits of engaging in moderate/high-intensity PA in reducing fall risk for community-dwelling older adults, this primary research demonstrated that increased weekly frequency and duration of engagement in moderate/high-intensity PA increased the likelihood of having a history of a fall. Further, this work demonstrated that the frequency of moderate/high-intensity PA per week was comparatively greater relative to the duration in the non-faller cohort while the frequency and duration levels per week were similar within the faller cohort. This further highlights the potential relative importance of the frequency of engagement in PA in reducing the likelihood of a history of a fall. Lastly, this work corroborates to existing literature [17,24] , by demonstrating that while engagement in moderate/high-intensity PA showed a reduced likelihood of a history of a fall, engagement in low-intensity PA did not.
The current study's findings corroborate and extend the recommendations made in the World Health Organization 2020 Guidelines on Physical Activity and Sedentary Behaviour as wells as national guidelines such as the Canadian 24-Hour Movement Guidelines, and The Physical Activity Guidelines for Americans [22,25,26,28]. Similar to these physical activity guidelines, which are mainly based on meta-analyses [10,19], this study demonstrated that engagement in total PA (including routine physical activity (PA), activities of daily living (ADL), and exercise programs) of moderate- high intensity was significantly associated with fall history. The multivariate regression models run independently for Dur, Kcal and Freq variables each demonstrated the relative importance of moderate/high-intensity PA over low-intensity by showing significant associations for moderate/high-intensity PA and fall history, while not for low-intensity PA (Table 3). The follow-up univariate modelling (i.e. Dur and Kcal) further supported this premise by showing that moderate/high-intensity PA models were significantly associated with lower incidence of history of a fall while low-intensity PA models were not (Table 4). This is further supported by the significantly greater volume of moderate/high-intensity PA (i.e. frequency, duration and Kcal expenditure) seen in the non-faller group compared to the faller group. In fact, the volume of this engagement was twice as much for the non-faller group over the faller group for frequency, duration and Kcal expenditure; by way of comparison, both groups engaged in roughly the same amount of low-intensity physical activity (Table 2). Thus, this work provides primary findings that support global and national guidelines that obtaining sufficient volume of moderate/high-intensity PA per week is associated with reduced incidence of falls.
In addition to corroborating existing evidence that sufficient duration of moderate/high-intensity PA reduces fall risk [25,26,27,28,29,30], this primary research demonstrates that the frequency of engagement in moderate/high-intensity PA was significantly associated fall history, while the low-intensity Freq PA variable was not. The WHO Guidelines acknowledge the limited primary research examining the dose-response relationship between physical activity and prevention of falls and that the current guidelines are based on indirect evidence (i.e. “the majority of studies providing supportive evidence [test exercise programs] consistent with 3 days per week” [25,28] (p. 45,29). Based on this evidence [25,28], the WHO Guidelines recommend that older adults do varied multicomponent PA 3 or more days a week as part of their weekly PA to prevent falls [25,29]. In the current research, the Freq multivariate model increasing the moderate/high-intensity Freq PA variable reduced likelihood of a having a history of a fall. Further, the univariate Freq model found moderate/high-intensity PA was significant with an odds ratio of a one-unit increase in frequency of moderate/high-intensity physical activity resulting in a 21% reduction in the likelihood of a participant being in the faller category (see Table 4). A key finding which supports the importance of frequency of PA is seen in the greater frequency of moderate/high-intensity PA relative to the duration for the non-faller cohort compared to the faller cohort as demonstrated with the non-significant frequency-duration association for the non-faller cohort in contrast to the significant frequency-duration association for the faller cohort (see Figure 1). An association between frequency and duration is expected in both cohorts given the interrelated nature of these variables; however, it is notable that the relationship between these variables presents differently within each cohort. The importance of the frequency of PA seen in the current results aligns with the meta-analysis conducted by Sun et al, (2021), who found that intervention programs targeted at fall prevention with a frequency of 3 - 5 times per week had a greater reduction in fall risk compared to programs with fewer sessions per week [19].
Recommendations for frequency of moderate/high-intensity PA to reduce fall risk is not explicitly denoted in the current Canadian or U.S physical activity guideline making it unclear if it is more beneficial to complete the recommended duration of 150 – 300 minutes of moderate/high-intensity PA all in one or two sessions over the span of a week or if it is more beneficial to spread the exercise over six or seven sessions [26,30]. The guidelines do state, however, that exercise allotments in less than 10 minutes are beneficial, as any additional physical activity to meet the 150 – 300 minutes of moderate/high-intensity is beneficial, regardless of the duration [26,27,28,30]. Thus, the current research extends these physical activity guidelines by providing primary findings that increased frequency of moderate/high-intensity PA is associated with a reduced likelihood of a history of a fall.
Although the frequency at which one engages in PA is interrelated to the overall duration, the current findings demonstrate that the frequency component of PA plays a larger role in fall prevention than previously considered. As noted, support for the relative importance of the frequency of engagement in moderate/high-intensity PA in fall prevention is reflected in the difference in the frequency-duration associations between the non-faller cohort and faller cohort. The importance of frequency of PA does not detract from the importance of adequate duration, but rather suggests that spreading the overall duration of moderate/high-intensity PA over several bouts of activity over the week may enhance their contribution to fall prevention.
This work demonstrated that older adults in this who engaged in frequent and sufficient volume of moderate/high intensity PA had a reduced likelihood of a history of a fall and thus avoiding the adverse health sequelae associated with a fall. Tracking an individual’s frequency or duration of engagement in moderate/high-intensity PA is considerably easier than calculating the total calorie expenditure for each bout of moderate/high-intensity PA, making frequency or duration more likely to be monitored by an individual or their healthcare provider. If measuring METs is unrealistic, or an individual is not able to become familiar with the sensation associated with low (1.6 – 2.9 METs), moderate (3.0 – 5.9 METs) and vigorous intensity (> 6.0 METs) physical activity intensities, then other tools could be used to self-monitor exercise intensity, such as using the talk test or BORG scale of perceived exertion. Using the talk test, an individual doing moderate-intensity aerobic activity can talk but not sing, and when doing vigorous-intensity activity, they cannot say more than a few words without pausing for a breath [22]. Alternatively, older adults can recognize moderate-intensity to vigorous-intensity using the BORG scale, which allows them to rank their exercise intensity, which should fall between 13 to 15 on a scale of 20 [31].
The low-intensity PA variables were not significant in neither the multivariate nor the univariate models for duration, frequency, and total kilocalories, suggesting this variable is not able to distinguish fallers from non-fallers in this study. Additionally, the Nagelkerke R-squared was only marginally higher in the multivariate models (i.e. low and moderate/high PA variables) compared to the moderate/high-intensity univariate models for each domain (i.e., Dur, Freq, and Kcal). This indicates that the low-intensity variables do not account for a substantial proportion of the variance in distinguishing fallers from non-fallers in the multivariate models. However, the current study cannot rule out the potential contributions of low-intensity PA to reducing the likelihood of having a history of falls, given that the engagement level in low-intensity PA was not significantly different between faller and non-faller groups (Table 2). In a similar way, past research indicates that walking, a low-intensity exercise, is health-enhancing, but it was inconclusive as to whether it provides benefits to reducing fall risk [24]. Another limitation of the current study is the self-reporting nature of the exercise-monitoring tool. Previous research has suggested that with self-reporting questions, such as the CHAMPS, individuals (particularly older adults) often over report their engagement in PA [32,33]. Such over reporting can be due to memory error [21,34], or valuing being active and wanting to present themselves as active [21,35]. Although the participants in the current study may have overestimated their amount of engagement in PA, this overestimation should occur equally for both faller and non-faller cohorts and therefore, the data accurately reflect relative differences between the faller and non-faller cohorts, though the specific values may be inflated.
5. Conclusions
In sum, the current results inform exercise education and prescription in two main ways. First, these results suggest a decreased likelihood of a having a history of a fall if individuals divide the recommended weekly amount of moderate/high-intensity PA into multiple exercise sessions over a week because a higher frequency was associated with a reduced likelihood of being classified as a faller. Second, the results confirm that engagement in PA of moderate/high-intensity are less likely to have a fall history. Thus, individuals must be able to identify moderate or high-intensity PA and engage in this intensity of exercise with sufficient duration and frequency. Future work should more specifically examine the impact of different frequency levels (i.e. once a week versus multiple sessions) across a consistent duration of weekly moderate/high-intensity PA.
Author Contributions
MvH was responsible for data analysis and interpretation, as well as writing the manuscript. SH was responsible for the development of the project concept and design, assisted with the analysis and interpretation, and reviewed and edited the manuscript. MK and SM made substantial contributions to the design of the project, as well as to the interpretation of the data and reviewed the manuscript. DC & JG were involved in data acquisition.
Funding
The authors received no financial support for the research, authorship, and publication of this article.
Institutional Review Board Statement
This study was conducted in accordance with the Declaration of Helsinki, and the protocol was approved by the Ethics Committee at the University of Victoria Human Ethics Board (H13-431) on [December 18, 2013].
Informed Consent Statement
All participants in the study provided written consent.
Data Availability Statement
The dataset analysed during the current study are not publicly available due to our ethics agreement, we are unable to share our data in a repository but are available from the corresponding author upon reasonable request.
Acknowledgments
Not applicable
Conflicts of Interest
The authors declared no potential conflicts of interest with respect to the research, authorship, and publication of this article
Abbreviations
The following abbreviations are used in this manuscript:
| ACSM | American College of Sports Medicine |
| ADL | Activities of Daily Living |
| BW | Body Weight |
| CHAMP | Community Healthy Activities Model Program for Seniors |
| Dur | Duration |
| Dur Low | Duration Low |
| Dur Mod | Duration Moderate/High |
| Freq | Frequency |
| Freq Low | Frequency Low |
| Freq Mod | Frequency Moderate/High |
| Kcal | Estimated Caloric Expenditure |
| Kcal Low | Estimated Caloric Expenditure of Low |
| Kcal Mod | Estimated Caloric Expenditure of Moderate/High |
| MET | Metabolic Equivalent |
| MMSE | Mini-Mental Status Examination |
| PA | Physical Activity |
| U.S. | United States |
| WHO | World Health Organisation |
References
- Roudsari BS, Ebel BE, Corso PS, Molinari NAM, Koepsell TD. The acute medical care costs of fall-related injuries among the U.S. older adults. Injury. 2005, 36, 1316–22. [CrossRef] [PubMed]
- Stel VS, Smit JH, Pluijm SMF, Lips P. Consequences of falling in older men and women and risk factors for health service use and functional decline. Age Ageing. 2004, 33, 58–65. [CrossRef]
- Public Health Agency of Canada. Seniors’ Falls in Canada. Ottawa, ON: CA 2014.
- Elam C, Aagaard P, Slinde F, Svantesson U, Hulthén L, Magnusson PS, et al. The effects of ageing on functional capacity and stretch-shortening cycle muscle power. J Phys Ther Sci. 2021, 33, 250–60. [CrossRef] [PubMed]
- Oliveira A, Nossa P, Mota-Pinto A. Assessing functional capacity and factors determining functional decline in the elderly: A cross-sectional study. Revista Científica da Ordem dos Médicos [revista en Internet] 2019 [acceso 2 de febrero de 2021]; 32, 654-660. [Internet]. 2019; Available from: https://www.actamedicaportuguesa.com/revista/index.php/amp/article/view/11974/5773.
- Wickramarachchi B, Torabi MR, Perera B. Effects of Physical Activity on Physical Fitness and Functional Ability in Older Adults. Gerontol Geriatr Med. 2023;9.
- Boss GR, Seegmiller JE. Age-related physiological changes and their clinical significance. West J Med. 1981, 135, 434–40.
- Warburton, D. E.R. Nicol, C W BSS. Health benefits of physical activity: the evidence [Internet]. Can Med Assoc J [Internet]. 2006 Mar 14;174, 801–9. Available from: http://www.cmaj.ca/cgi/doi/10.1503/cmaj.051351.
- Bindawas SM, Vennu V. Longitudinal effects of physical inactivity and obesity on gait speed in older adults with frequent knee pain: Data from the osteoarthritis initiative. Int J Environ Res Public Health. 2015, 12, 1849–63. [CrossRef] [PubMed]
- Sherrington C, Michaleff ZA, Fairhall N, Paul SS, Tiedemann A, Whitney J, et al. Exercise to prevent falls in older adults: An updated systematic review and meta-analysis. Br J Sports Med. 2017, 51, 1749–57.
- Paterson DH, Warburton DER. Physical activity and functional limitations in older adults: A systematic review related to Canada’s Physical Activity Guidelines. Int J Behav Nutr Phys Act. 2010;7.
- Rubenstein, LZ. Falls in older people: Epidemiology, risk factors and strategies for prevention. Age Ageing. 2006, 35(SUPPL.2):37–41.
- Arnold CM, Sran MM, Harrison EL. Exercise for Fall Risk Reduction in Community-Dwelling Older Adults: A Systematic Review. Physiother Canada. 2008, 60, 358–72. [CrossRef] [PubMed]
- Wang DXM, Yao J, Zirek Y, Reijnierse EM, Maier AB. Muscle mass, strength, and physical performance predicting activities of daily living: a meta-analysis. J Cachexia Sarcopenia Muscle. 2020, 11, 3–25. [CrossRef] [PubMed]
- Carande-Kulis V, Stevens JA, Florence CS, Beattie BL, Arias I. A cost-benefit analysis of three older adult fall prevention interventions [Internet]. J Safety Res [Internet]. Elsevier B.V.; 2015;52:65–70. [CrossRef]
- Robertson MC, Campbell AJ, Gardner MM, Devlin N. Preventing injuries in older people by preventing falls: A meta-analysis of individual-level data. J Am Geriatr Soc. 2002, 50, 905–11. [CrossRef] [PubMed]
- Sherrington C, Fairhall N, Kwok W, Wallbank G, Tiedemann A, Michaleff ZA, et al. Evidence on physical activity and falls prevention for people aged 65+ years: systematic review to inform the WHO guidelines on physical activity and sedentary behaviour [Internet]. Int J Behav Nutr Phys Act [Internet]. International Journal of Behavioral Nutrition and Physical Activity; 2020 Dec 26;17, 144. Available from: https://ijbnpa.biomedcentral.com/articles/10.1186/s12966-020-01041-3.
- Gillespie LD, Robertson MC, Gillespie WJ, Sherrington C, Gates S, Clemson L, et al. Interventions for preventing falls in older people living in the community [Internet]. Cochrane Database Syst Rev [Internet]. 2012 Sep 12;2021(6). Available from: http://doi.wiley.com/10.1002/14651858.CD007146.
- Sun M, Min L, Xu N, Huang L, Li X. The effect of exercise intervention on reducing the fall risk in older adults: A meta-analysis of randomized controlled trials. Int J Environ Res Public Health. 2021;18(23).
- Ainsworth BE, Haskell WL, Whitt MC, Irwin ML, Swartz AM, Strath SJ, et al. Compendium of physical activities: An update of activity codes and MET intensities. Med Sci Sports Exerc. 2000;32(9 SUPPL.).
- Stewart AL, Mills KM, King AC, Haskell WL, Gillis D, Ritter PL. CHAMPS physical activity questionnaire for older adults: Outcomes for interventions. Med Sci Sports Exerc. 2001, 33, 1126–41. [CrossRef] [PubMed]
- Bushman BA. Physical Activity Guidelines for Americans [Internet]. ACSMs Health Fit J [Internet]. 2019 May;23, 5–9. Available from: https://journals.lww.com/00135124-201905000-00004.
- Cao J, Zhang S. Multiple comparison procedures. Jama. 2014, 312, 543–4. [CrossRef] [PubMed]
- Stamatakis E, Straker L, Hamer M, Gebel K. The 2018 physical activity guidelines for Americans: What’s new? Implications for clinicians and the public. J Orthop Sports Phys Ther. 2019, 49, 487–90. [CrossRef] [PubMed]
- Bull FC, Al-Ansari SS, Biddle S, Borodulin K, Buman MP, Cardon G, et al. World Health Organization 2020 guidelines on physical activity and sedentary behaviour. Br J Sports Med. 2020, 54, 1451–62. [CrossRef] [PubMed]
- Canadian 24-Hour Movement Guidelines [Internet]. Canadian Society for Exercise Physiology. 2022 [cited 2023 Nov 20] p. 1–2. Available from: https://csepguidelines.ca/guidelines/adults-65/.
- 2018 Physical Activity Guidelines Advisory Committee. 2018 Physical activity guidelines advisory committee scientific report. Department of Health and Human Services. Washington, DC.
- Yang, YJ. An Overview of Current Physical Activity Recommendations in Primary Care. Korean J Fam Med. 2019, 40, 135–42. [Google Scholar] [CrossRef] [PubMed]
- World Health Organization. WHO Guidelines on physical activity and sedentary behaviour [Internet]. Geneva. 2020. Available from: https://www.who.int/publications/i/item/9789240015128.
- Piercy KL, Troiano RP, Ballard RM, Carlson SA, Fulton JE, Galuska DA, et al. The Physical Activity Guidelines for Americans [Internet]. JAMA [Internet]. 2018 Nov 20;320, 2020. Available from: https://www.ncbi.nlm.nih.gov/pubmed/30418471.
- Scherr J, Wolfarth B, Christle JW, Pressler A, Wagenpfeil S, Halle M. Associations between Borg’s rating of perceived exertion and physiological measures of exercise intensity. Eur J Appl Physiol. 2013, 113, 147–55. [CrossRef] [PubMed]
- Westerterp, KR. Assessment of physical activity: A critical appraisal. Eur J Appl Physiol. 2009, 105, 823–8. [Google Scholar] [CrossRef] [PubMed]
- Mahabir S, Baer DJ, Giffen C, Clevidence BA, Campbell WS, Taylor PR, et al. Comparison of energy expenditure estimates from 4 physical activity questionnaires with doubly labeled water estimates in postmenopausal women [Internet]. Am J Clin Nutr [Internet]. American Society for Nutrition.; 2006;84, 230–6. [CrossRef]
- Melanson EL, Freedson PS, Blair S. Physical Activity Assessment: A Review of Methods. Crit Rev Food Sci Nutr. 1996, 36, 385–96. [CrossRef] [PubMed]
- Altschuler A, Picchi T, Nelson M, Rogers JD, Hart J, Sternfeld B. Physical activity questionnaire comprehension: Lessons from cognitive interviews. Med Sci Sports Exerc. 2009, 41, 336–43. [CrossRef] [PubMed]
Figure 1.
Frequency to Duration of Moderate Intensity Physical Activity Association Among Participants. The association (linear regression) between Freq Mod and Dur Mod for both faller and non-faller cohorts. Abbreviations: Freq Mod = frequency per week of moderate/high intensity physical activity; Dur Moderate = Duration per week of moderate/high intensity physical activity.
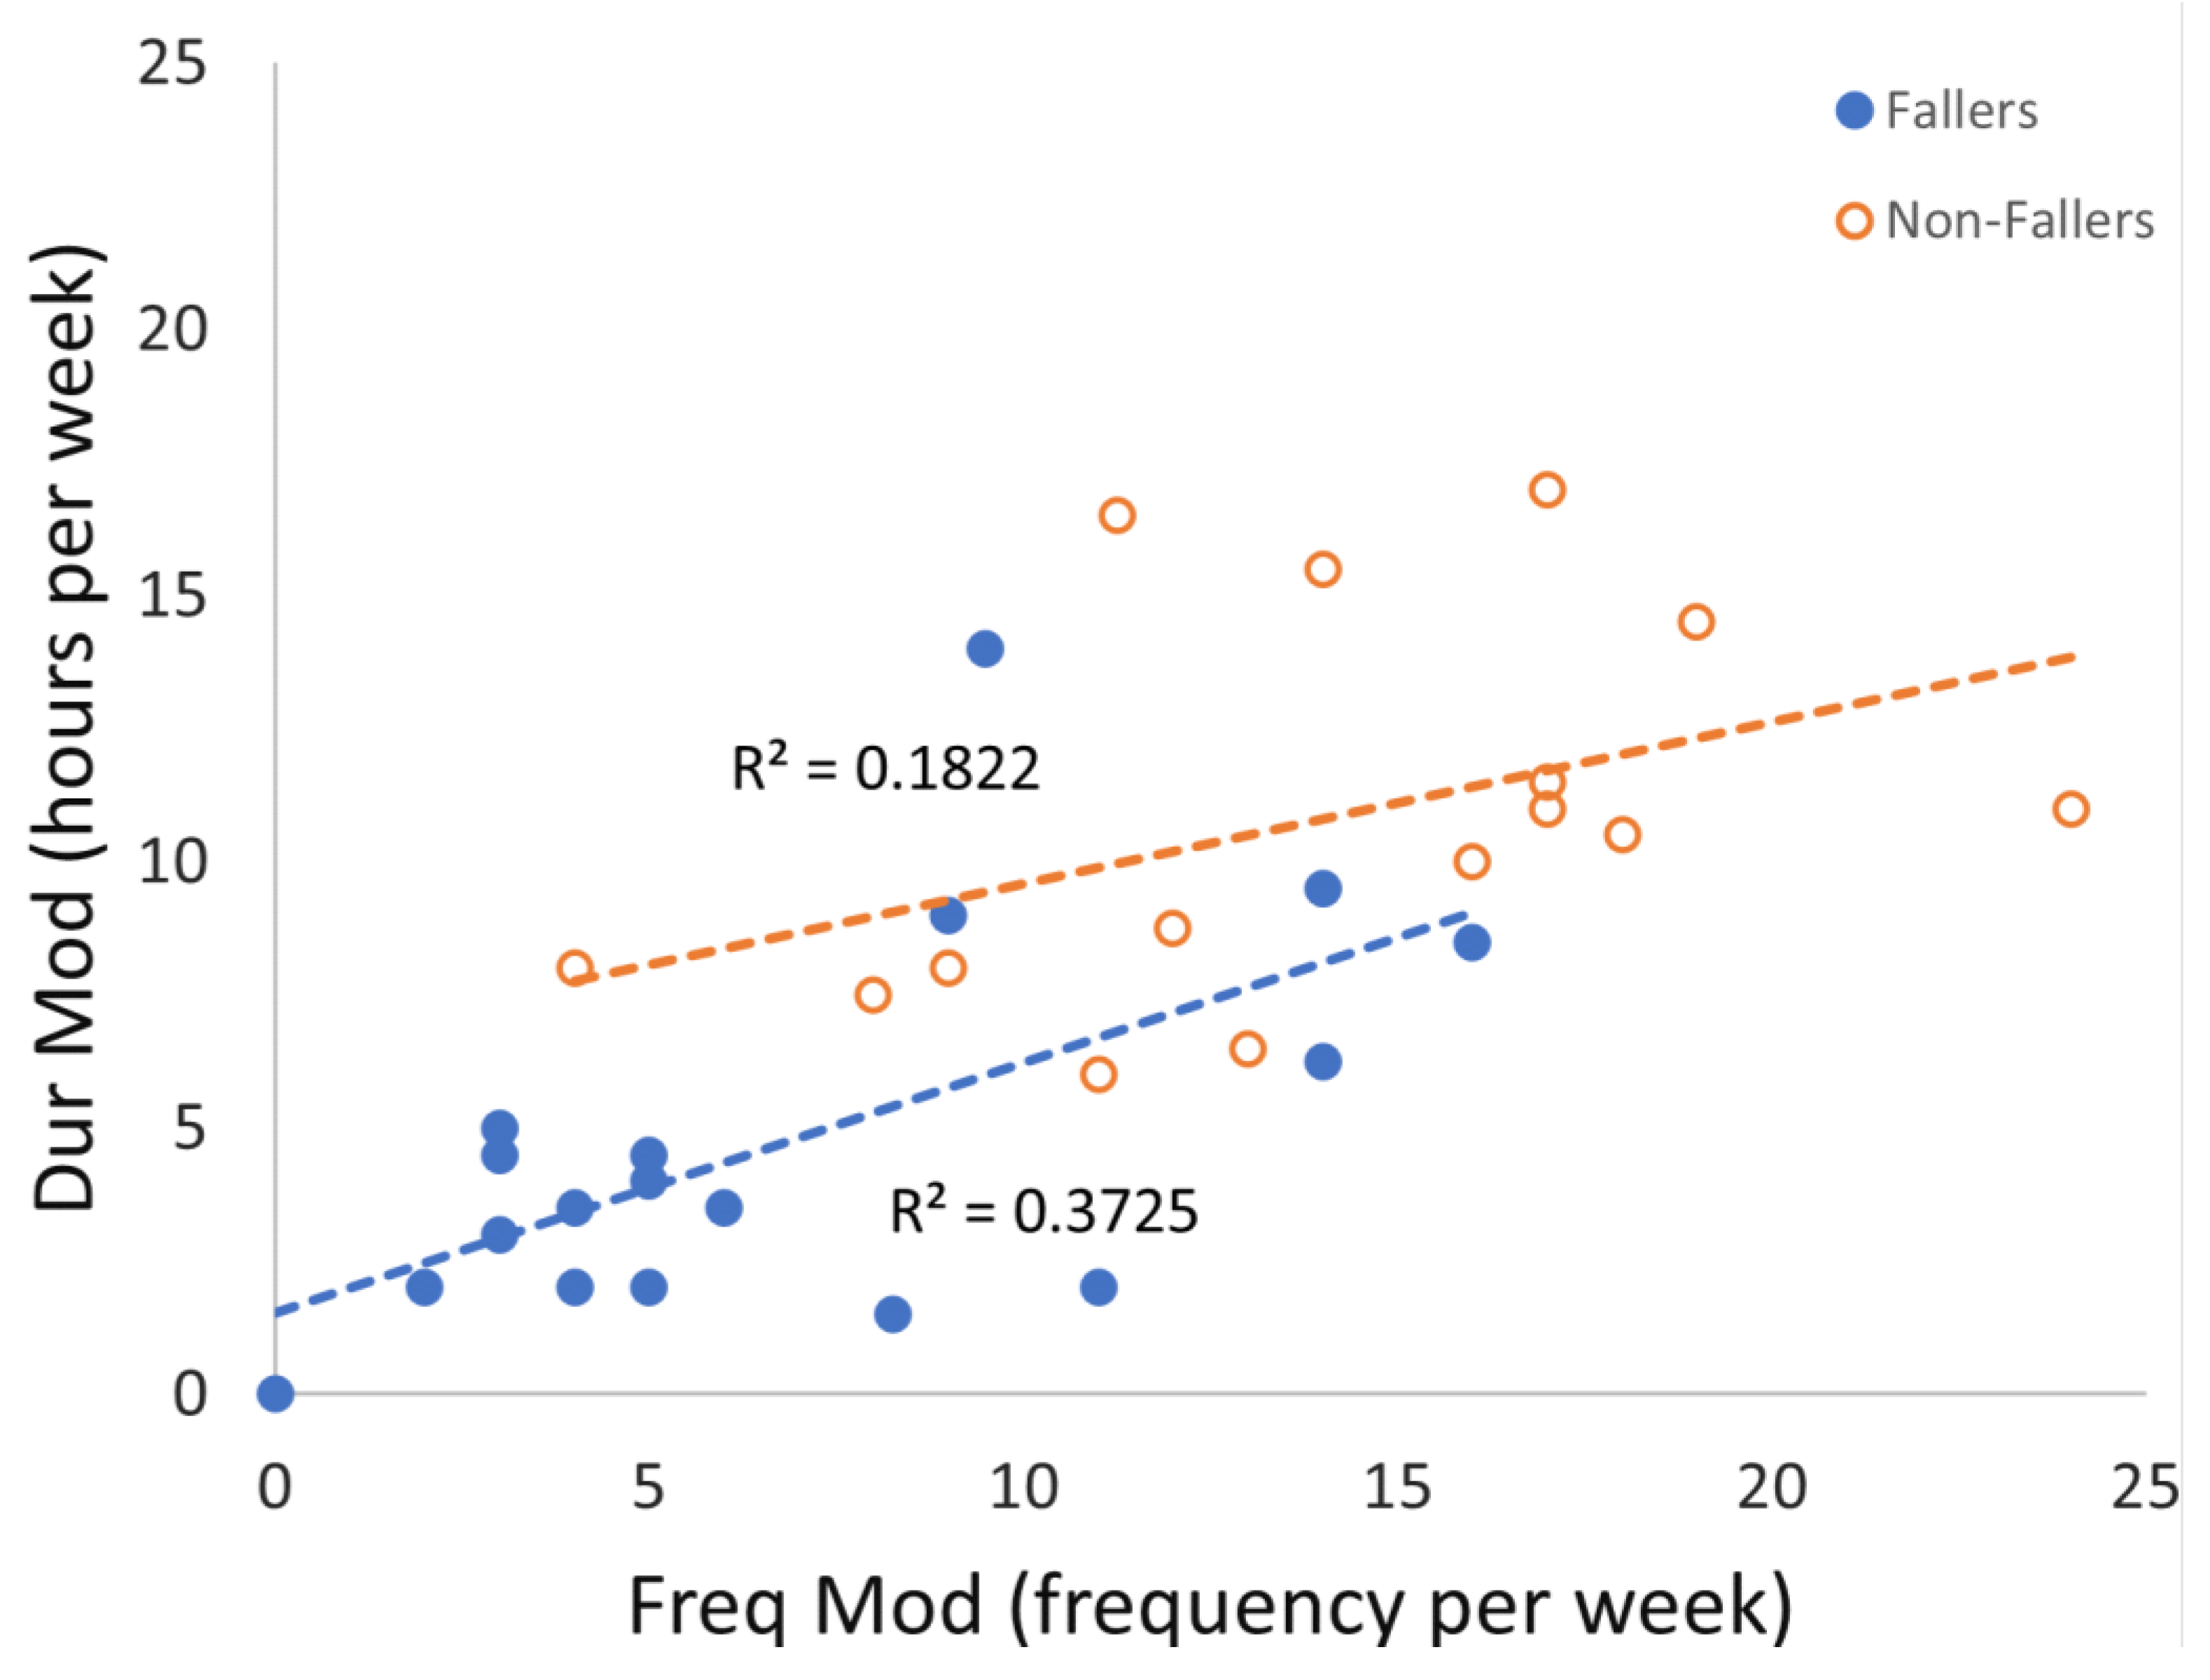

Table 1.
Participant characteristics for fallers and non-fallers.
| Characteristic | Fallers | Non-fallers | Sig |
| (n = 18) | (n = 15) | (p) | |
| Age (years) | 75.9 (3.3) | 75.1 (3.5) | 0.632 |
| Height (cm) | 166.6 (8.8) | 169.5 (8.5) | 0.840 |
| Weight (kg) | 77.4 (18.0) | 77.5 (11.7) | 0.101 |
| MMSE | 28.8 (1.1) | 28.5 (1.3) | 0.244 |
Data is presented as mean (standard deviation); Abbreviations: n = number of samples, cm = centimeters, kg = kilograms, MMSE = the mini mental state examination score.
Table 2.
Mean and standard deviation of Physical Activity variables for fallers and non-fallers.
| Variable | Fallers | Non-fallers | Sig |
| (N = 18) | (N = 15) | (p) | |
| Dur Low | 7.6 (5.0) | 6.7 (3.2) | 0.745 |
| Dur Mod | 5.0 (4.3) | 10.8 (3.6) | <0.001* |
| Freq Low | 11.1 (6.6) | 13.3 (6.9) | 0.269 |
| Freq Mod | 7.3 (5.4) | 14.0 (5.0) | 0.002* |
| Kcal Low | 1266.8 (599) | 1296.4 (722) | 1.000 |
| Kcal Mod | 1463 (1289) | 3624.2 (1470) | <0.001* |
Data are presented as mean (standard deviation); Significant findings are bold with * for p<0.008 (Bonferroni adjustment). Abbreviations: PA = physical activity, Dur = duration, Low = low-intensity physical activity, Mod = moderate/high-intensity physical activity, Freq = Frequency, Kcal = kilocalories.
Table 3.
Multivariate Logistic Regressions Modeling Fall Risk as a Function of Physical Activity.
| Model | Variables | B | SE | Wald | df | Sig | Exp(B) | 95% CI | |
| 95. | Lower | Upper | |||||||
| Dur | Dur Mod | -0.366 | 0.131 | 7.799 | 1 | 0.005* | 0.693 | 0.536 | 0.897 |
| Dur Low | 0.046 | 0.131 | 0.123 | 1 | 0.725 | 1.047 | 0.810 | 1.353 | |
| Constant | 2.620 | 1.389 | 3.555 | 1 | 0.059 | 13.730 | |||
| Freq | Freq Mod | -0.247 | 0.088 | 7.889 | 1 | 0.005* | 0.781 | 0.657 | 0.928 |
| Freq Low | -0.083 | 0.068 | 1.481 | 1 | 0.224 | 0.921 | 0.806 | 1.052 | |
| Constant | 3.790 | 1.470 | 6.650 | 1 | 0.010 | 44.272 | |||
| Kcal | Kcal Mod | -0.001 | 0.000 | 8.614 | 1 | 0.003* | 0.999 | 0.998 | 1.000 |
| Kcal Low | 0.000 | 0.001 | 0.202 | 1 | 0.653 | 1.000 | 0.999 | 1.002 | |
| Constant | 2.420 | 1.208 | 4.011 | 1 | 0.045 | 11.250 | |||
Significant findings are bold with * at p<0.02 (Bonferroni adjustment). Abbreviations: Dur = Duration, Mod = moderate/high-intensity physical activity, Low = low-intensity physical activity, activity, Freq = Frequency, Kcal = kilocalories.
Table 4.
Univariate Logistic Regressions Modeling Fall Risk as a Function of Physical Activity.
| Model | B | SE | Wald | df | Sig | Exp(B) | 95% CI | |
| Lower | Upper | |||||||
| Dur Low | 0.056 | 0.092 | 0.378 | 1 | 0.539 | 1.058 | 0.884 | 1.266 |
| Dur Mod | -0.366 | 0.130 | 7.956 | 1 | 0.005* | 0.693 | 0.537 | 0.894 |
| Freq Low | -0.052 | 0.055 | 0.899 | 1 | 0.343 | 0.950 | 0.853 | 1.057 |
| Freq Mod | -0.231 | 0.082 | 7.882 | 1 | 0.005* | 0.794 | 0.676 | 0.933 |
| Kcal Low | 0.000 | 0.001 | 0.002 | 1 | 0.966 | 1.000 | 0.999 | 1.001 |
| Kcal Mod | -0.001 | 0.000 | 8.977 | 1 | 0.003* | 0.999 | 0.999 | 1.000 |
Significant findings are bold with * at p<0.008 (Bonferroni adjustment). Abbreviations: Dur = Duration, Low = low-intensity physical activity, Mod = moderate/high-intensity physical activity, Freq = Frequency, Kcal = kilocalories.
Disclaimer/Publisher’s Note: The statements, opinions and data contained in all publications are solely those of the individual author(s) and contributor(s) and not of MDPI and/or the editor(s). MDPI and/or the editor(s) disclaim responsibility for any injury to people or property resulting from any ideas, methods, instructions or products referred to in the content. |
© 2025 by the authors. Licensee MDPI, Basel, Switzerland. This article is an open access article distributed under the terms and conditions of the Creative Commons Attribution (CC BY) license (http://creativecommons.org/licenses/by/4.0/).
Copyright: This open access article is published under a Creative Commons CC BY 4.0 license, which permit the free download, distribution, and reuse, provided that the author and preprint are cited in any reuse.


